Module 10THE CIRCULAR FLOW MODEL AND GROSS DOMESTIC PRODUCT

Warm Up Make a list of all the things you spent money on in the past week. Be as specific as possible!


1. Promote Economic Growth2. Limit Unemployment3. Keep Prices Stable (Limit Inflation)
In this unit we will analyze how each of these are measured.
For all countries there are three major economic goals:
4
There are 4 keys to the Unit
1. Circular Flow Diagrams ◦(Module 10)
2. Gross Domestic Production (GDP)◦ Module 10 & 11
3. Unemployment ◦(Module 12 & 13)
4. Inflation ◦(Module 14 & 15)
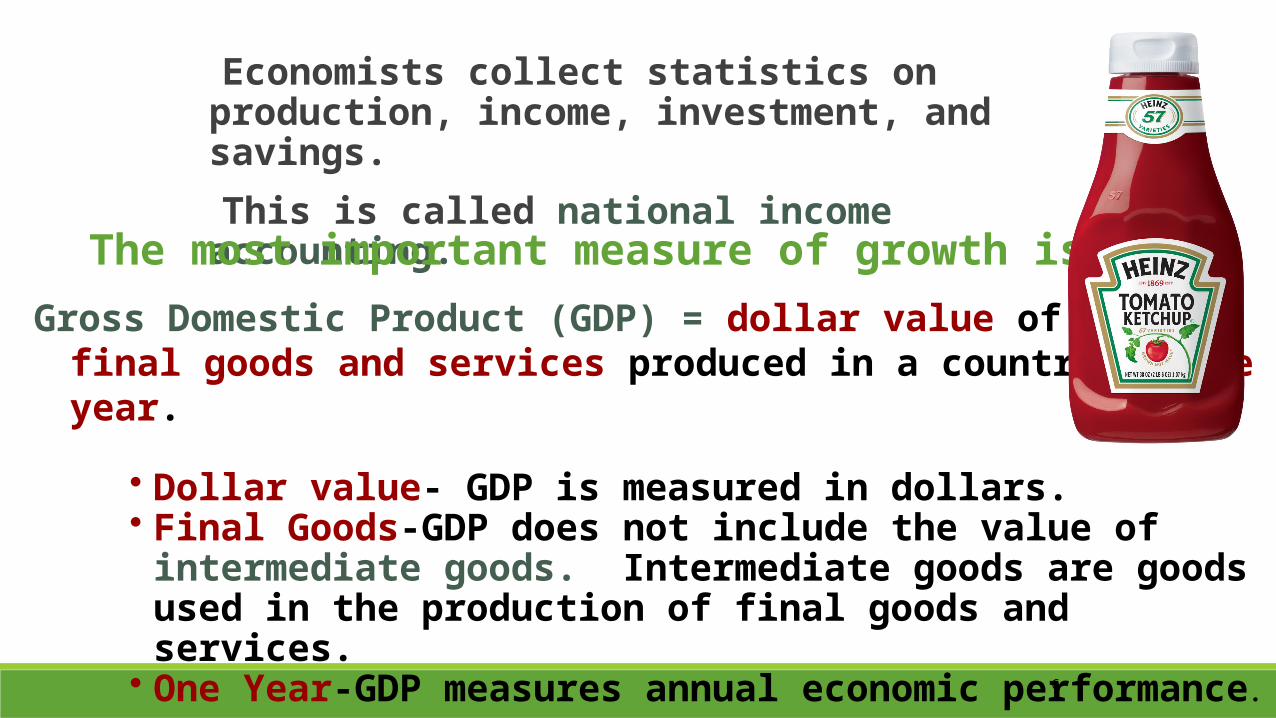
Economists collect statistics on production, income, investment, and savings.
This is called national income accounting.
The most important measure of growth is GDP.
Gross Domestic Product (GDP) = dollar value of all final goods and services produced in a country in one year.
• Dollar value- GDP is measured in dollars.• Final Goods-GDP does not include the value of intermediate goods.
Intermediate goods are goods used in the production of final goods and services.
• One Year-GDP measures annual economic performance.
6


Circular Flow Diagram: Inflow of money into each market or sector must equal the outflow of money coming from that market or sector

Keys to the Circular Flow Chart 1. Chart has 4 sectors:
◦ Households: are the demand side of markets purchasing goods and services◦ Firms: are on the supply side offering products to sale.◦ Government: purchases goods and services and collects taxes to spend in the econonmy◦ Rest of the world: Global trade and investments
All are connected by 3 types of markets
Factor; Market for Goods & Services; Financial Markets


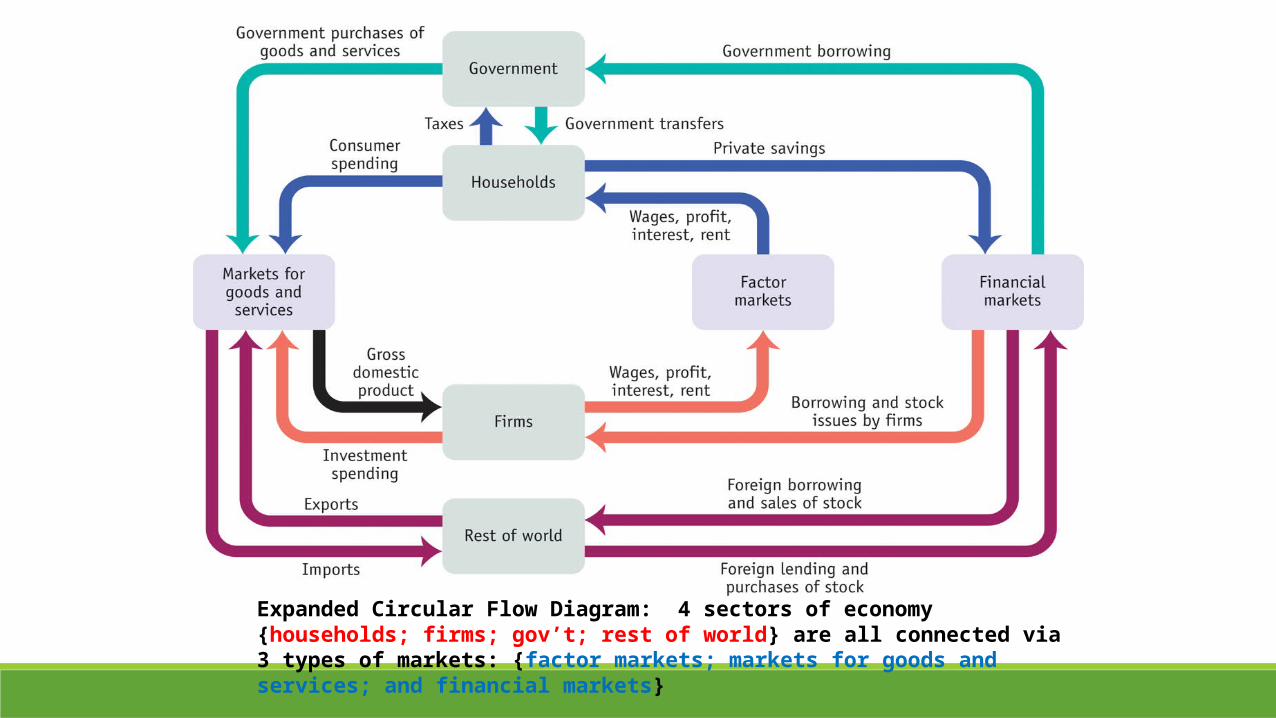
Expanded Circular Flow Diagram: 4 sectors of economy {households; firms; gov’t; rest of world} are all connected via 3 types of markets: {factor markets; markets for goods and services; and financial markets}
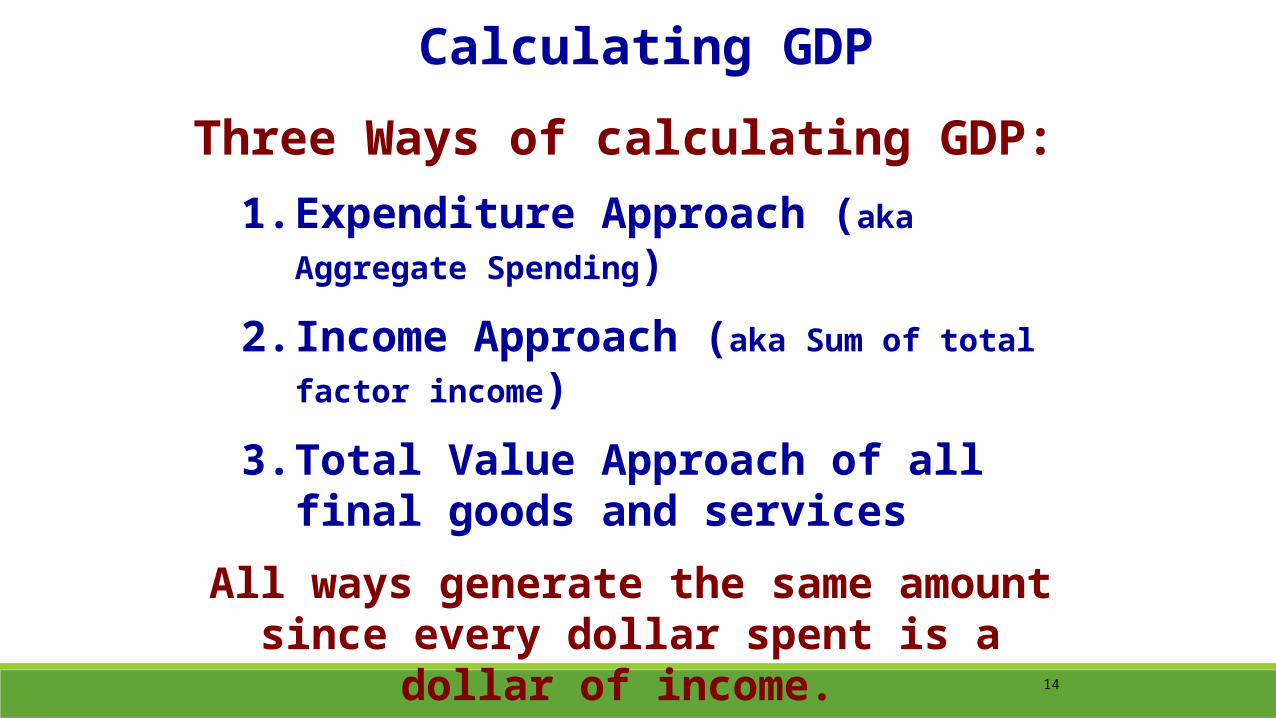
Calculating GDP
Three Ways of calculating GDP:
1. Expenditure Approach (aka Aggregate Spending)
2. Income Approach (aka Sum of total factor income)
3. Total Value Approach of all final goods and services
All ways generate the same amount since every dollar spent is a dollar of income.
14

1. Expenditures Approach-Add up all the spending on final goods and services produced in a given year.
GDP = C + I + G + Xn (exports-imports)
C IS CONSUMER SPENDING
I IS INVESTMENT SPENDING
G IS GOVERNMENT PURCHASES OF GOODS AND SERVICES
X IS EXPORTS - IMPORTS
15

2. Income Approach-Add up all the income that resulted from selling all final goods and services produced in a given year.
In other words, add up all the income earned by producers in the nation and that must equal the value of the products that they sold
16

3. PRODUCT APPROACH (aka net product or value added)
◦This is the sum of all the outputs of every enterprise in the nation◦ 1. Estimate Gross Value of Domestic Output◦ 2. Determine Intermediate Consumption (costs used to produce the final product◦ 3. Deduct Intermediate Consumption from the Gross Value
GV= VALUE OF OUTPUT – VALUE OF INTERMEDIATE GOODS
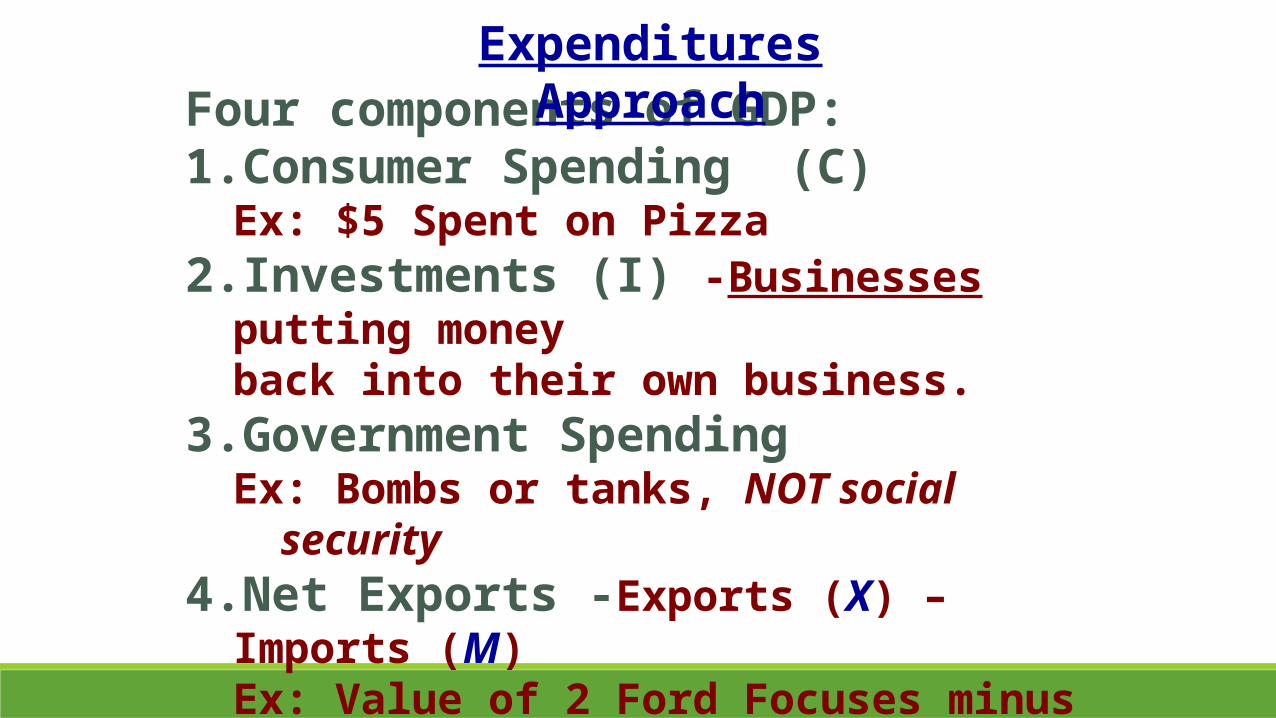
Four components of GDP:1. Consumer Spending (C)
Ex: $5 Spent on Pizza2. Investments (I) -Businesses putting money
back into their own business.
3. Government SpendingEx: Bombs or tanks, NOT social security
4. Net Exports -Exports (X) – Imports (M)Ex: Value of 2 Ford Focuses minus 3 Hondas
Remember: GDP = C + I + G + Xn (exports–imports)
Expenditures Approach
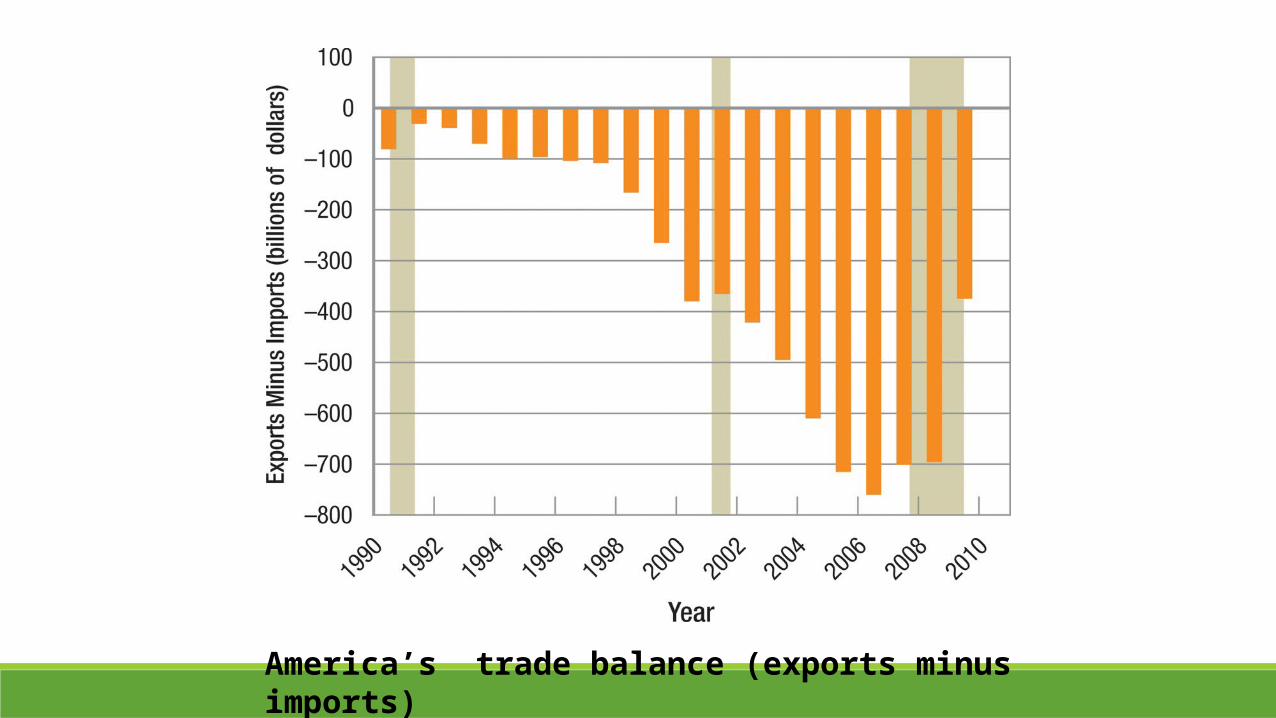
America’s trade balance (exports minus imports)
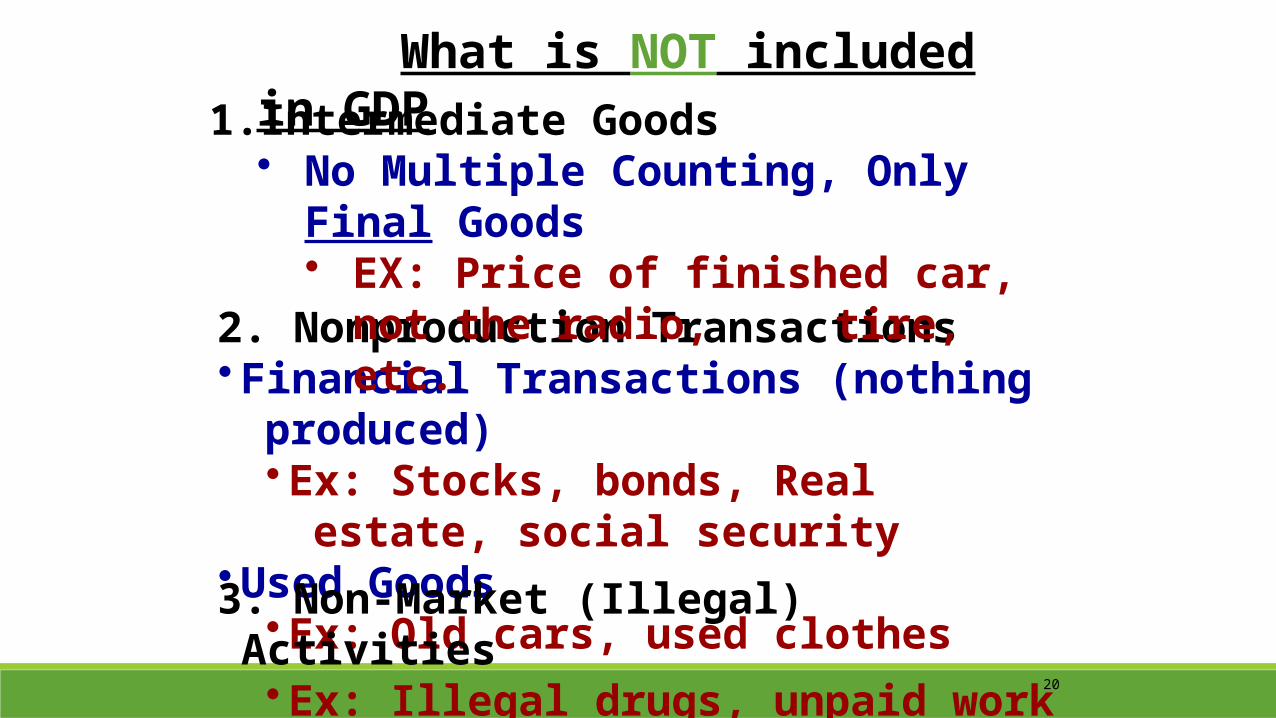
2. Nonproduction Transactions• Financial Transactions (nothing produced)
• Ex: Stocks, bonds, Real estate, social security
• Used Goods• Ex: Old cars, used clothes
What is NOT included in GDP1. Intermediate Goods
• No Multiple Counting, Only Final Goods• EX: Price of finished car, not the radio,
tire, etc.
3. Non-Market (Illegal) Activities • Ex: Illegal drugs, unpaid work
20

Social security, welfare, and other transfer payments are not included in government
expenditures. Recipients of transfer payments do not provide any current goods or services in
exchanges for these payments. Hence, government expenditures on transfer payments do not involve the purchase of any new goods or services and are
therefore excluded from the calculation of government expenditures.

Calculating GDP using all 3 methods brings the same result

Current Events http://www.bbc.co.uk/news/business-24821383
http://www.google.com/search?q=gdp&rls=com.microsoft:en-us&ie=UTF-8&oe=UTF-8&startIndex=&startPage=1&safe=active

What's Included
Domestically produced final goods and services,
including capital goods, new construction of
structures, and changes to inventories
Not Included
Intermediate goods and services
Inputs
Used goods
Stocks & Bonds
Foreign produced goods & services

1. Economists keep track of the flows of money between sectors with the national income and product accounts, or national accounts.
2. Households earn income via the factor markets from wages.
3. Disposable income is allocated to consumer spending (C) and private savings.
4. Via the financial markets, private savings and foreign lending are channeled to investment spending (I), government borrowing, and foreign borrowing.
5. Government purchases of goods and services (G) are paid for by tax revenues and any government borrowing.
25 of 18

6. Exports (X) generate an inflow of funds into the country from the rest of the world, but imports (IM) lead to an outflow of funds to the rest of the world.
7. Gross domestic product, or GDP, measures the value of all final goods and services produced in the economy.
8. GDP can be calculated in three ways: a. add up the value added by all producers; b. add up all spending on domestically produced final goods and services (GDP = C + I + G +
X − IM); or c. add up all the income paid by domestic firms to factors of production. These three
methods are equivalent.
26 of 18
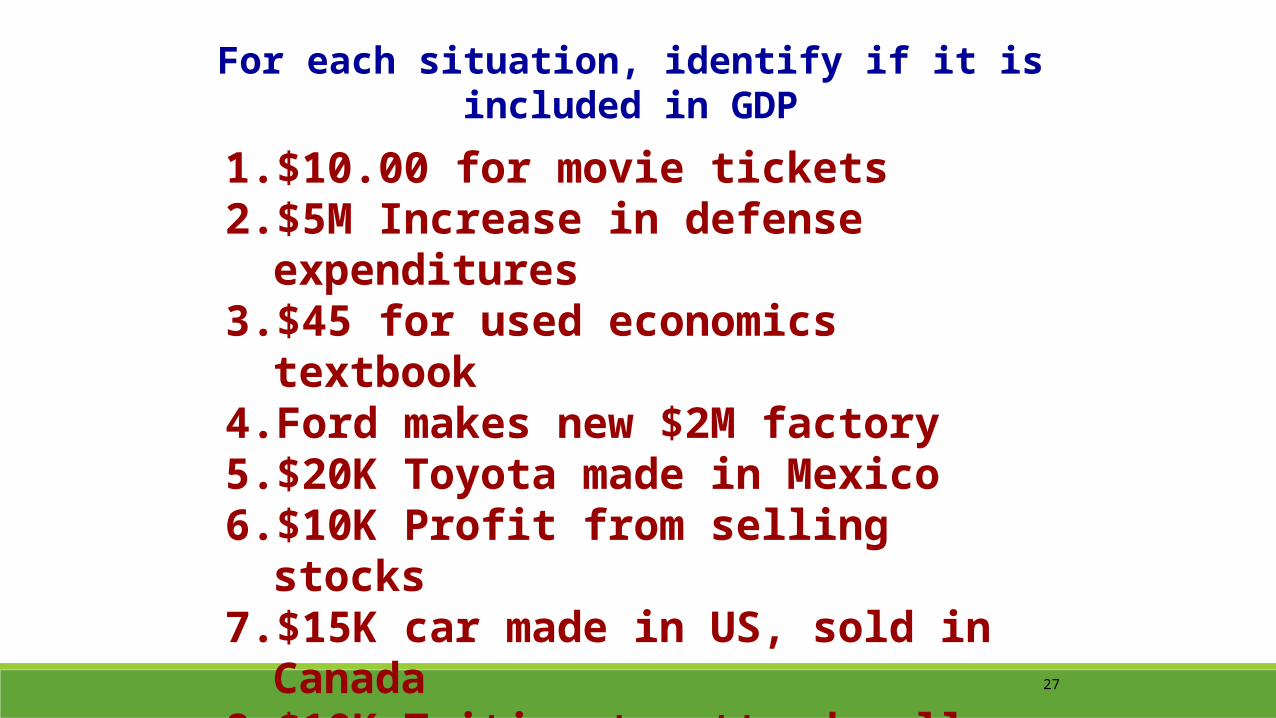
For each situation, identify if it is included in GDP
1. $10.00 for movie tickets2. $5M Increase in defense expenditures3. $45 for used economics textbook4. Ford makes new $2M factory5. $20K Toyota made in Mexico6. $10K Profit from selling stocks7. $15K car made in US, sold in Canada8. $10K Tuition to attend college9. $120 Social Security payment to Bob10.Farmer purchases new $100K tractor
27

1. $10.00 for movie tickets2. $5M Increase in defense expendituresX $45 for used economics textbook4. Ford makes new $2M factoryX $20K Toyota made in MexicoX $10K Profit from selling stocks7. $15K car made in US, sold in Canada8. $10K Tuition to attend collegeX $120 Social Security payment to Bob10.Farmer purchases new $100K tractor
GDP=$7,125,010
28
Partner check
With your partner complete the circular flow handout.
Draw your own circular flow model that illustrates the Factor and Product markets and the flow of goods and services from each component.

http://www.ted.com/talks/tim_jackson_s_economic_reality_check.html
Making our world equitable

Real vs. Nominal GDP (Module 11)
Nominal GDP is GDP measured in current prices. It does not account for inflation from year to year.
Real GDP adjusts for inflation and is the BEST MEASURE OF ECONOMIC GROWTH
Per Capita GDP measures a country’s GDP by the size of its population.
Divide the GDP for a year by the number of people in the nation to obtain the best measurement of a
nations growth and productivity.

How can you measure growth from year to year?
Chain-Linking: Use a base year and a later year
% Change in GDP
=Year 2 – Year 1
Year 1X 100

Real vs. Nominal GDP Example
200810 cars at $15,000 each = $150,00010 trucks at $20,000 each = $200,000Nominal GDP = $350,000
200910 cars at $16,000 each = $160,00010 trucks at $21,000 each= $210,000Nominal GDP = $370,000
The GDP for year 2008 shows the dollar value of all final goods produced.
The nominal GDP in year 2009 is higher which suggests that the economy is improving. But how much is the REAL GDP? How do you get it?
Use 2008 Prices.
The Real GDP for 2009 is the same as 2008 after we adjust for inflation.
-------------------------------------------
Year 2-Year1 x 100
Year 1
200910 cars at $15,000 each = $150,00010 trucks at $20,000 each= $200,000REAL GDP = $350,000

World GDP Distribution2010 Nominal GDP


The top 10 most populated countries 2011
36
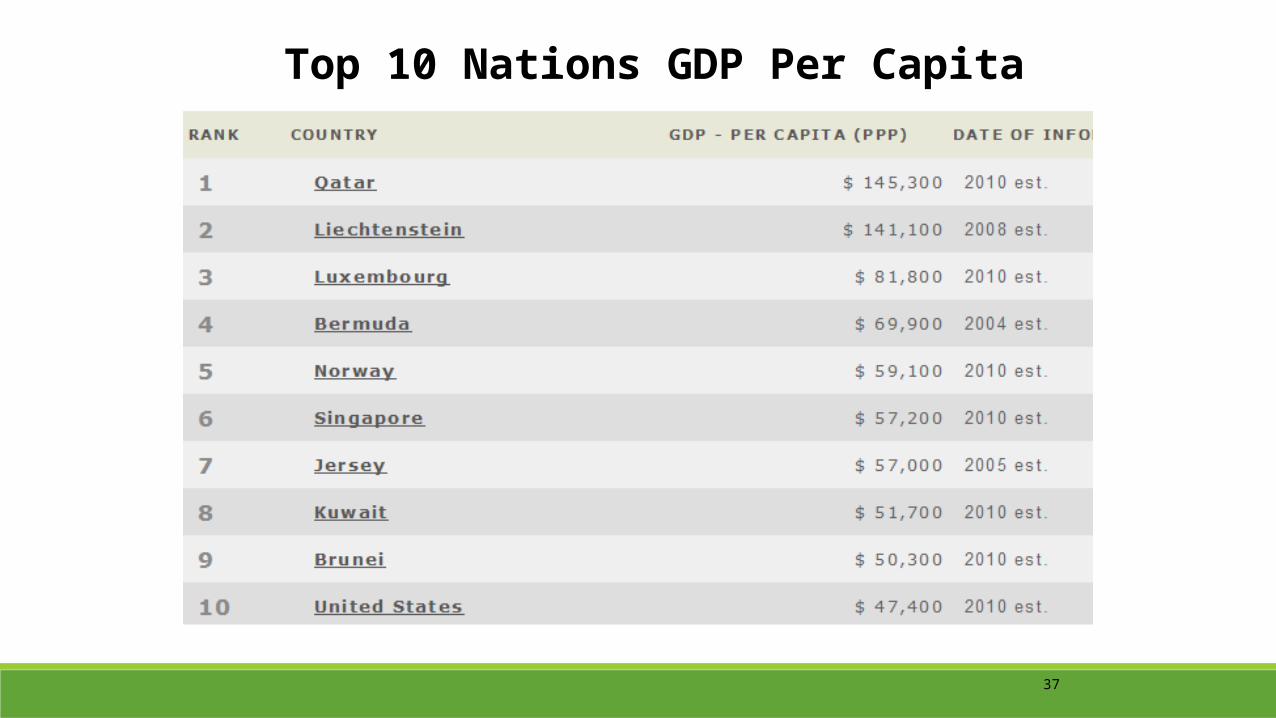
Top 10 Nations GDP Per Capita
37

What is the most popular movie of all time?
What is the problem with this method? Nominal Box Office Receipts
38

Real Box Office Receipts (adjusted for inflation)

Real GDP “deflates” nominal GDP by adjusting for inflation in terms of a base year prices.
40

% change GDP = yr2-yr1 x100 so real GDP yr2 (P1xQ2) – yr1 (P1xQ1) x 100 yr1 year 1(P1xQ1)
Show how full GDP arrived at for both years and then show how arrive at % change.

Nominal versus Real GDP in 2001, 2005, and 2009 demonstrates how our GDP actually went up much less during President Bush’s administration than actually believed as compared to when he began his presidential term.

Does GDP accurately measure standard of living?
Standard of living (or quality of life) can be measured, in part, by how well the economy is doing…but it does not measure a nation’s happiness just output
Recommended