Embed Size (px)
Citation preview
1
WP/16/3
A Descriptive Study
The Concept of Gross Domestic Product
February 2016
By
Ahmed B. Al-Bakr
Economic Research Department
Saudi Arabian Monetary Agency
The views expressed are those of the author(s) and do not necessarily reflect the
position of the Saudi Arabian Monetary Agency (SAMA) and its policies. This
Working Paper should not be reported as representing the views of SAMA.
Mohanned A. Al Salman
Economics Department
King Saud University
2
Contents
Introduction 4
An Overview of GDP 4
The Concept of Gross Domestic Product and Other Related Con-
cepts
7
Approaches of Calculating GDP 9
Output Approach 10
Income Approach 13
Expenditure Approach 14
Saudi Arabia’s GDP 15
Output Approach 16
Income Approach 21
Expenditure Approach 24
Nominal GDP and Real GDP 25
Gross Domestic Product and Gross National Product 28
Gross Domestic Product and Net Domestic Product 29
Regulatory Sectors’ Contribution to GDP in Real and Nominal Terms 31
Determinants of GDP Size 34
GDP Calculations Problems 35
Conclusion 35
References 37
3
The Concept of Gross Domestic Product
Abstract
The paper attempts to give a brief history of gross domestic product
(GDP) and explain the concept of GDP and other related concepts. Next, it
proceeds to explain the significance of this concept and lists approaches of
GDP calculation. It also discusses the Kingdom’s GDP in terms of its
sources and calculation approaches. Afterwards, it explains the difference
between nominal and real GDP. It also discusses the difference between
Gross National Product and GDP. This is followed by an explanation of the
difference between GDP and net domestic product. Subsequently, it elabo-
rates on the contribution of regulatory sectors to GDP in real and nominal
terms. Finally, it reviews some of the production size determinants and some
related problems.
Keywords: Gross Domestic Product (GDP), Gross National Product (GNP),
Net Domestic Product (NDP), National Accounts.
(JEL Classification) : C82, E01, E02, E21, E22
For contact: Refer to Mohanned A. Al Salman and Ahmad B. Al Bakr, Economic Research Department, Saudi Arabian Mon-
etary Agency P.O Box 2992 Riyadh 11169. E-mail: [email protected] [email protected].
4
1- Introduction:
GDP, which measures total value of goods and services produced by a coun-
try, prevails a list of macroeconomic concepts since it is the most compre-
hensive criterion. GDP is considered a part of national accounts, which are
an integral set of statistics that enable policy-makers to determine whether
the economy is in a state of contraction or expansion. Moreover, it may also
be used in evaluating economic activity and its efficiency, as well as in
measuring the size of macro economy. The concept of GDP is often tainted
by ambiguity and is intertwined with other related concepts. Therefore, this
entails reviewing GDP to determine its components. In this context, the
study also provides simplified explanatory examples, intended to directly
explain such notions. The purpose of this study is to clarify the concept of
gross domestic product rather than reviewing and analyzing figures. This is
left to studies concerned with this subject.
2- An Overview of GDP
Daily transactions contain millions of deals/exchanges. For the purpose of counting
and summarizing such transactions under their institutional units in accounts that re-
flect the nature of those economic transactions, we have to rely on national accounts
to perform this task.
The idea of issuing a System of National Accounts (SNA), which has an in-
ternational character, began in the 1940s when the Organization for Europe-
an Economic Co-operation (OEEC) funded the National Accounts Research
Unit at the University of Cambridge that has come out with the notion of
5
what is currently known as "System of National Accounts (SNA)." Follow-
ing that, the Statistical Office at the United Nations issued the UN System of
National Accounts in 1953. 1
Later on, in 1968, the system was developed with several amendments were made to
this system. With the development of financial markets, sophistication of economic
transactions and more attention to environmental considerations began to appear,
where all committees of the United Nations started in the mid-eighties to hold meetings
to develop the system. As a result of those meetings, the system was issued in its de-
veloped form in 1993.
Eventually, the latest version of this SNA manual was issued in 2008. This system is
mainly ratified for two objectives: first, to facilitate handling of national accounts. Sec-
ond, to make comparisons between countries logical and viable. However, we should
take into account that the system cannot be applied uniformly. This is due to the dif-
ference in the structure and nature of the economic system from one country to another.
Regulatory Manuals Included in the System of National Accounts:
Production Account (GDP components).
Main Distribution Account of Income Accounts (income from produc-
tion).
Transfers Account (redistribution).
Household Expenditure Account.
Capital Account.
Domestic Financial Transactions Account (money flow).
1 For more information about the development of GDP, see :Vanoli, A. A History of National Accounting. 2005. IOS Press. Amsterdam.
6
Change in Asset Values Account.
Assets and Liabilities Account (Balance Sheet).
Foreign Transactions Account (Balance of Payments).
The Most Prominent Changes from 1993 SNA Manual to 2008 SNA Manual2:
New registrations to pension systems.
Incorporating capital services.
Incorporating results of research and empirical development as fixed assets.
Incorporating military weapons and their means of transportation as fixed assets.
Developing a method for registering goods whose ownership is being changed.
The System Applied by the General Authority for Statistics:
The General Authority for Statistics implements the System of National Accounts, issued
in 1993, to production account, through which GDP is calculated. This occurred after the
meeting of national accounts managers, on the occasion of the 14th meeting of Arab Gulf
Cooperation Council, to discuss substitution of the new system for 1993 SNA. The report,
issued by the United Nations Economic and Social Commission for Western Asia (UN-
ESCWA) in June 2013, entitled: "Support for Implementation Strategy for 1993 SNA in
the Arab Region", indicated that only 50 percent of the Arab countries have implemented
the first phase of the system. This phase is represented by the compilation and dissemi-
nation of current accounts and capital account. 25% of such countries are considered in
the pilot phase and 25% still adopting the system issued in 1968.
2 For more information about the two systems. See: Sharjabi, Hamid, “Comparing Updates and Changes between 1993 and 2008 System of
National Accounts”, Khwarizmi Conference, Qatar.
7
The Significance of GDP
GDP summarizes economic activities carried out by a community during a
certain period (often a year.)
GDP summarizes returns earned by production factors as a result of their
contribution to domestic production.
GDP is considered an important economic indicator that can be used for
economic analyses, making development plans and policies and identifying
economy’s current trends.
The expenditure approach for calculating GDP helps in identifying con-
sumption trends for key and targeted sectors.
GDP time series are used to prepare important economic forecasts for decision makers.
GDP per capita indicator can be used as an approximate measure of the living standard.
GDP is used as an indicator to compare countries to measure the economic perfor-
mance of a country.
The Concept of Gross Domestic Product and Other Related Concepts
In the Output approach, GDP is defined as:
Total monetary values of finished goods and services produced within a domestic econ-
omy by production factors inside its geographic area during a certain period of time (usu-
ally a year.) Other terms for GDP in output approach are: added value GDP or real value
GDP.
GDP in output approach can be explained in two ways: GDP by activity and GDP by
regulatory sector.
8
GDP in income approach is defined as: gross incomes of the factors of production
(labor, capital and land), existing within a geographical area, that has contributed to the
production process (i.e. to GDP) during a certain period of time, usually a year. There
are other terms for GDP in income approach:
Gross income from factors of production or the structure of GDP cost.
GDP in income approach can be explained in two methods: gross income of the factors
of production by activity and structure of GDP cost.
GDP in expenditure approach is defined as:
The gross value of goods directed to meet aggregate demand in a community (i.e. the
sum of final expenditure). It includes private consumption expenditure, investment ex-
penditure, government spending and net external transactions (exports minus imports)
during a certain period of time (usually a year).
Other Terms of GDP in Expenditure Approach:
Expenditure on GDP or expenditure on GDP in buyers’ values.
GDP in Expenditures Approach can be explained as follows:
In one method; expenditure on GDP.
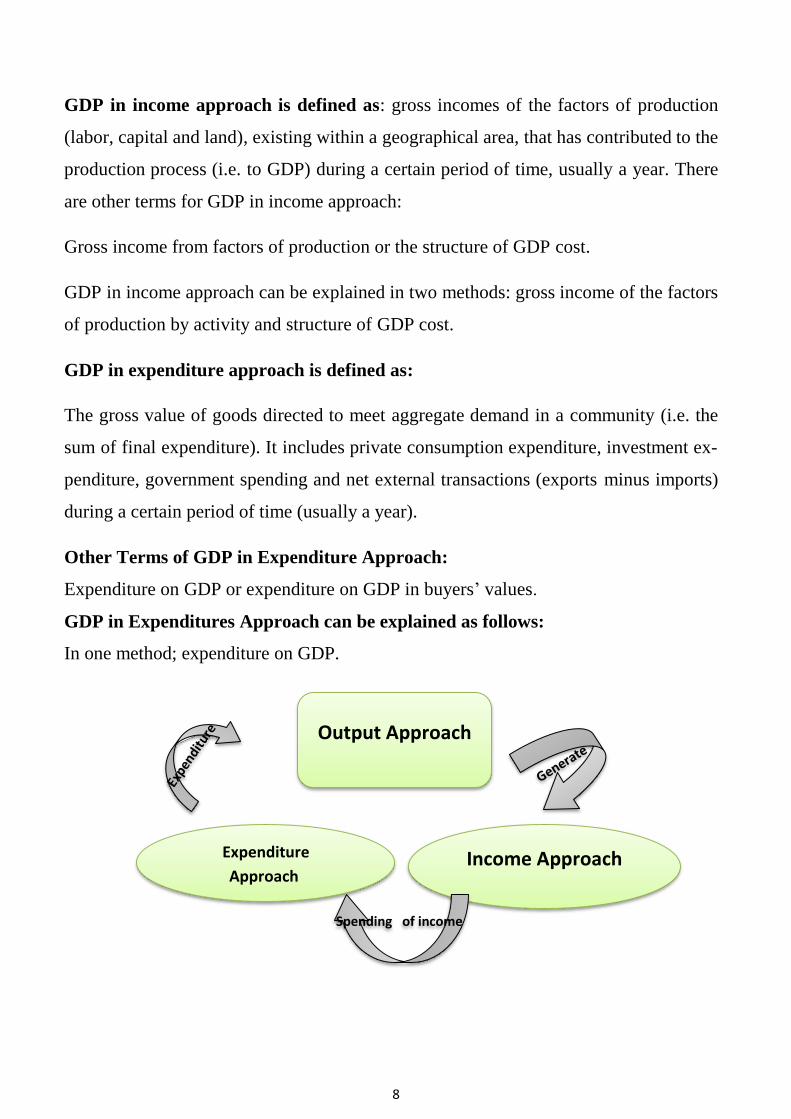
Output Approach
Income Approach Expenditure
Approach
Spending of income
9
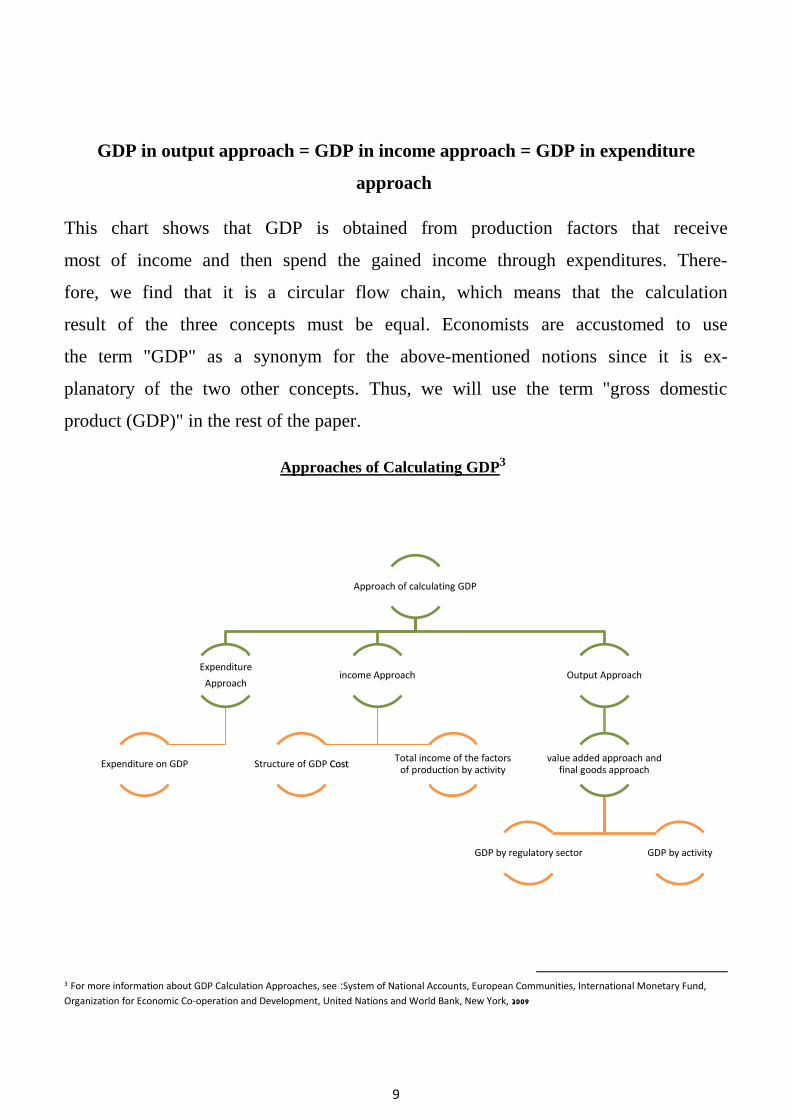
GDP in output approach = GDP in income approach = GDP in expenditure
approach
This chart shows that GDP is obtained from production factors that receive
most of income and then spend the gained income through expenditures. There-
fore, we find that it is a circular flow chain, which means that the calculation
result of the three concepts must be equal. Economists are accustomed to use
the term "GDP" as a synonym for the above-mentioned notions since it is ex-
planatory of the two other concepts. Thus, we will use the term "gross domestic
product (GDP)" in the rest of the paper.
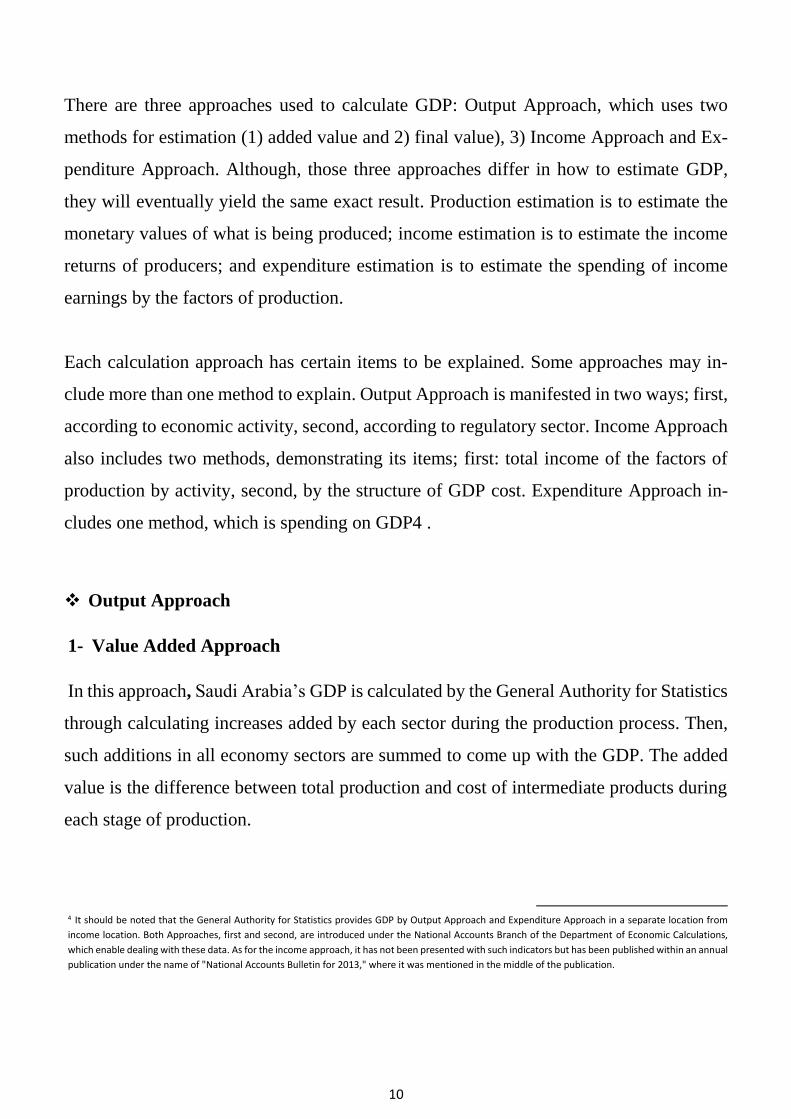
Approaches of Calculating GDP3
3 For more information about GDP Calculation Approaches, see :System of National Accounts, European Communities, International Monetary Fund,
Organization for Economic Co-operation and Development, United Nations and World Bank, New York, 2009
Approach of calculating GDP
Expenditure
Approach
Expenditure on GDP
income Approach
Structure of GDP Cost Total income of the factors
of production by activity
Output Approach
value added approach and final goods approach
GDP by regulatory sector GDP by activity
10
There are three approaches used to calculate GDP: Output Approach, which uses two
methods for estimation (1) added value and 2) final value), 3) Income Approach and Ex-
penditure Approach. Although, those three approaches differ in how to estimate GDP,
they will eventually yield the same exact result. Production estimation is to estimate the
monetary values of what is being produced; income estimation is to estimate the income
returns of producers; and expenditure estimation is to estimate the spending of income
earnings by the factors of production.
Each calculation approach has certain items to be explained. Some approaches may in-
clude more than one method to explain. Output Approach is manifested in two ways; first,
according to economic activity, second, according to regulatory sector. Income Approach
also includes two methods, demonstrating its items; first: total income of the factors of
production by activity, second, by the structure of GDP cost. Expenditure Approach in-
cludes one method, which is spending on GDP 4 .
Output Approach
1- Value Added Approach
In this approach, Saudi Arabia’s GDP is calculated by the General Authority for Statistics
through calculating increases added by each sector during the production process. Then,
such additions in all economy sectors are summed to come up with the GDP. The added
value is the difference between total production and cost of intermediate products during
each stage of production.
4 It should be noted that the General Authority for Statistics provides GDP by Output Approach and Expenditure Approach in a separate location from
income location. Both Approaches, first and second, are introduced under the National Accounts Branch of the Department of Economic Calculations,
which enable dealing with these data. As for the income approach, it has not been presented with such indicators but has been published within an annual
publication under the name of "National Accounts Bulletin for 2013," where it was mentioned in the middle of the publication.
11
Added value = gross production values - intermediate consumption + net taxes
(taxes - subsidies)
Notes
This approach differs from the finished goods approach since this approach may result
in duplicated calculations that occur when calculating some goods whose production
requires some intermediate goods. In finished goods approach, we calculate all in the
final stage, but in this approach, we calculate the parts of that sum, which is accumu-
lated throughout the stages of production. It is an important measure of productive
activities because it measures each activity separately.
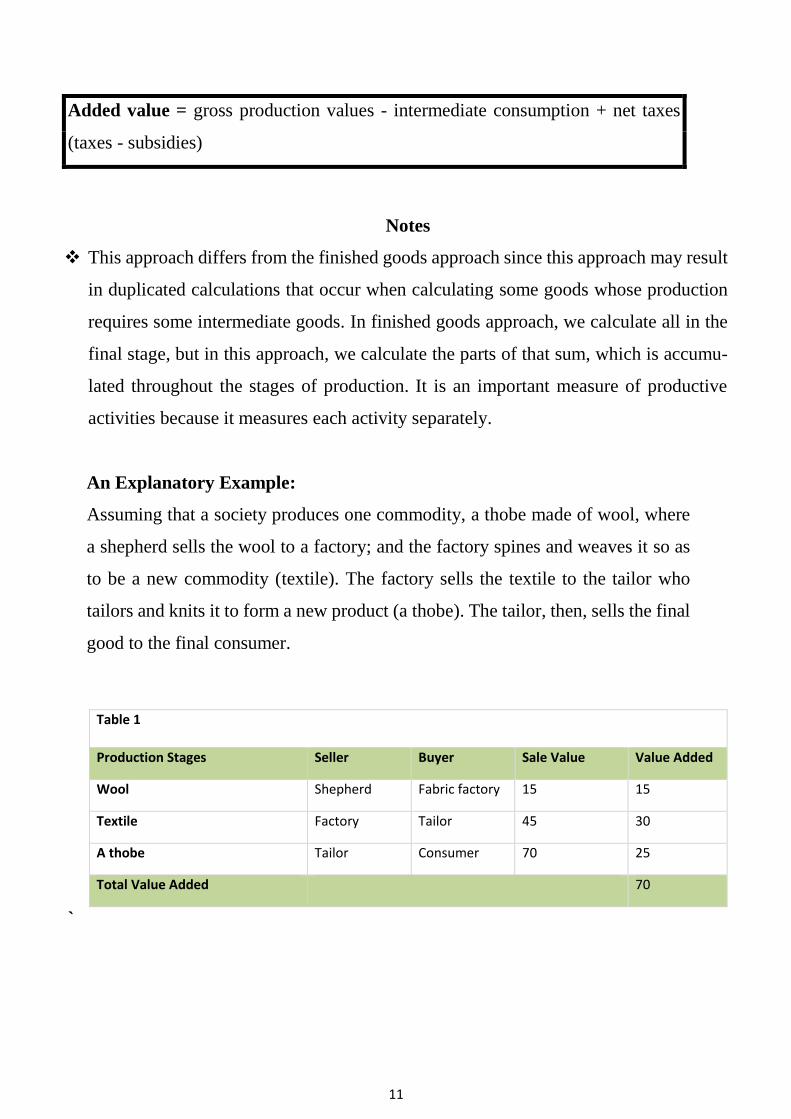
An Explanatory Example:
Assuming that a society produces one commodity, a thobe made of wool, where
a shepherd sells the wool to a factory; and the factory spines and weaves it so as
to be a new commodity (textile). The factory sells the textile to the tailor who
tailors and knits it to form a new product (a thobe). The tailor, then, sells the final
good to the final consumer.
Table 1
Value Added Sale Value Buyer Seller Production Stages
15 15 Fabric factory Shepherd Wool
30 45 Tailor Factory Textile
25 70 Consumer Tailor A thobe
70 Total Value Added
`
12
2-Finished Goods Value Approach5:
In this approach, the GDP is calculated by multiplying the quantity produced of each
finished goods or services during a year by its price, and then summing the processes to
come up with the GDP.
Notes
This approach excludes intermediate goods and services (i.e. produced or purchased
goods or services to be reused in the production process or for sale again) from pro-
duction process and takes into account only finished goods and services. Goods or
services are considered final products only if they were produced or purchased for final
use, and not for reusing it in another production process.
To avoid exaggerating calculation of production in this approach, the inventory of
goods and services must be processed at the beginning and the end of the year because
the inventory at the end of the year needs to be added to the value of final products,
while the inventory of the beginning of the year is subtracted from the final products
value. This is because the inventory constituents had already appeared as part of the
final output of the previous year.
To avoid exaggerating calculation of production in this approach, the value of imports
of goods and services must be deducted from the value of the final products since those
imports are part of the final output of other countries.
An Explanatory Example:
Assuming that a society produces one good, which is a thobe, made of wool, and
the tailor sells the final product to the final consumer.
5 Frequently, the added value of the goods is used in the output approach since it is easier to implement in practice, as well as it limits duplication of
calculations that might occur in the final goods approach.
13
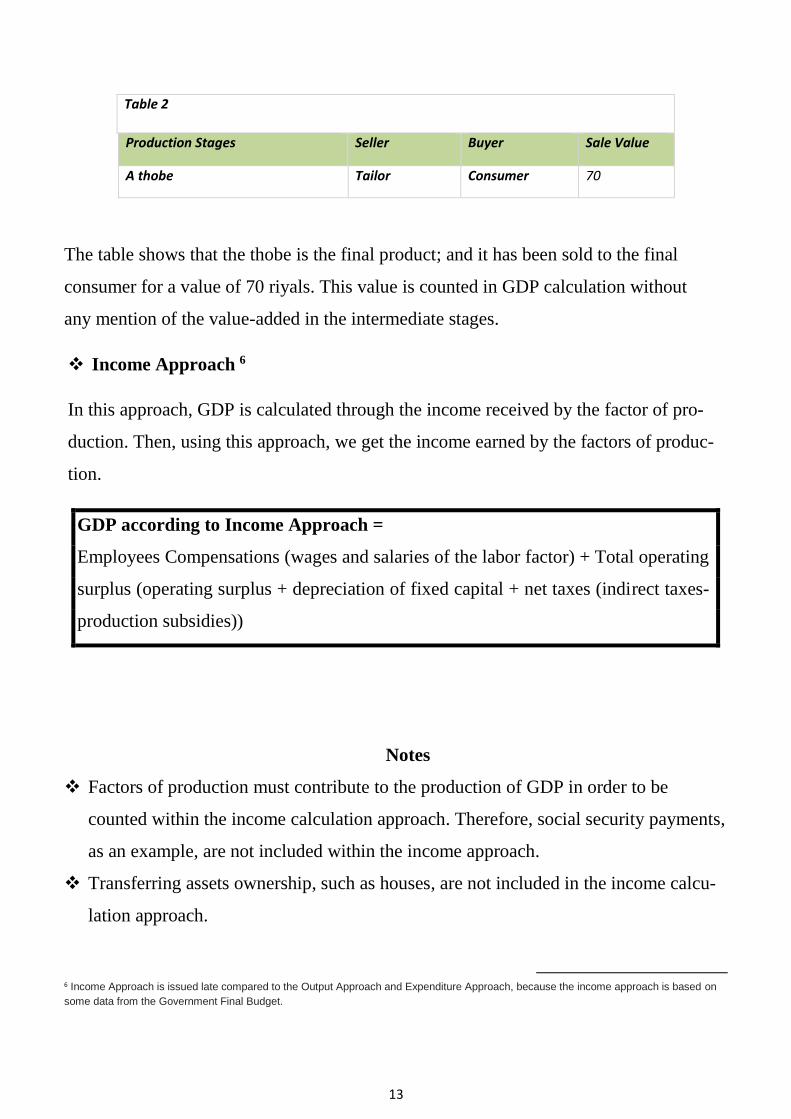
Table 2
Sale Value Buyer Seller Production Stages
70 Consumer Tailor A thobe
The table shows that the thobe is the final product; and it has been sold to the final
consumer for a value of 70 riyals. This value is counted in GDP calculation without
any mention of the value-added in the intermediate stages.
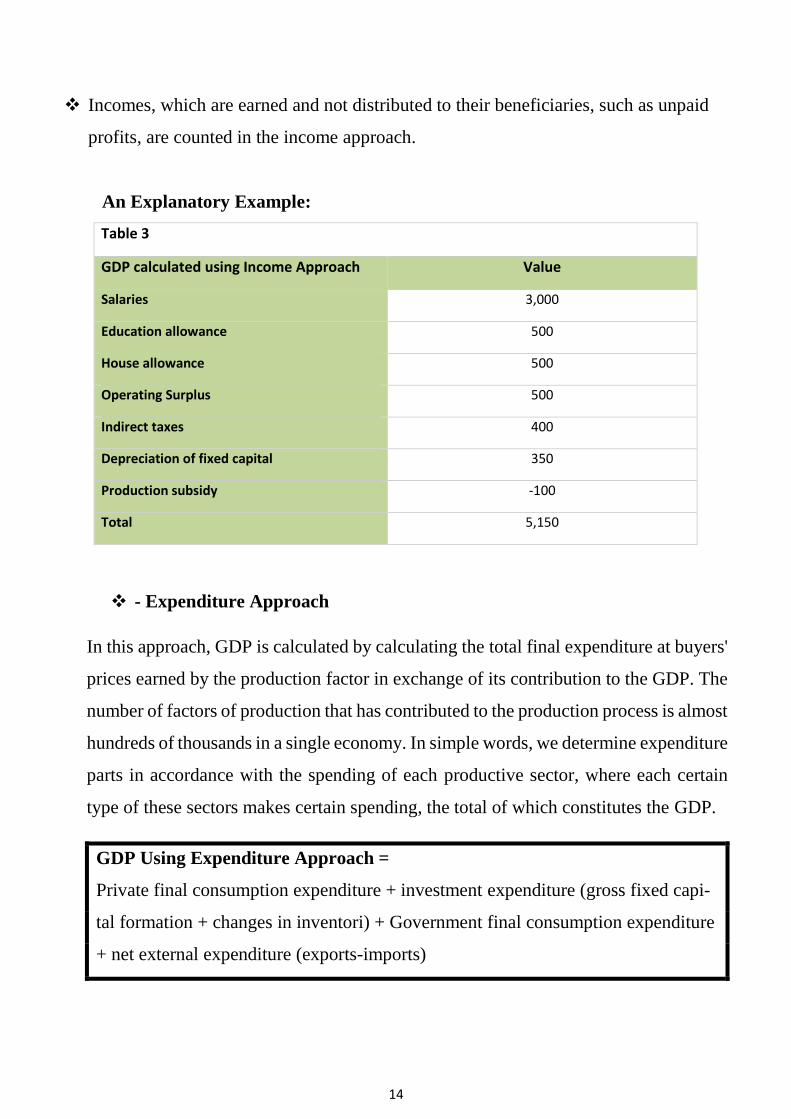
Income Approach 6
In this approach, GDP is calculated through the income received by the factor of pro-
duction. Then, using this approach, we get the income earned by the factors of produc-
tion.
GDP according to Income Approach =
Employees Compensations (wages and salaries of the labor factor) + Total operating
surplus (operating surplus + depreciation of fixed capital + net taxes (indirect taxes-
production subsidies))
Notes
Factors of production must contribute to the production of GDP in order to be
counted within the income calculation approach. Therefore, social security payments,
as an example, are not included within the income approach.
Transferring assets ownership, such as houses, are not included in the income calcu-
lation approach.
6 Income Approach is issued late compared to the Output Approach and Expenditure Approach, because the income approach is based on
some data from the Government Final Budget.
14
Incomes, which are earned and not distributed to their beneficiaries, such as unpaid
profits, are counted in the income approach.
An Explanatory Example:
Table 3
Value GDP calculated using Income Approach
3,000 Salaries
500 Education allowance
500 House allowance
500 Operating Surplus
400 Indirect taxes
350 Depreciation of fixed capital
-100 Production subsidy
5,150 Total
- Expenditure Approach
In this approach, GDP is calculated by calculating the total final expenditure at buyers'
prices earned by the production factor in exchange of its contribution to the GDP. The
number of factors of production that has contributed to the production process is almost
hundreds of thousands in a single economy. In simple words, we determine expenditure
parts in accordance with the spending of each productive sector, where each certain
type of these sectors makes certain spending, the total of which constitutes the GDP.
GDP Using Expenditure Approach =
Private final consumption expenditure + investment expenditure (gross fixed capi-
tal formation + changes in inventori) + Government final consumption expenditure
+ net external expenditure (exports-imports)
15
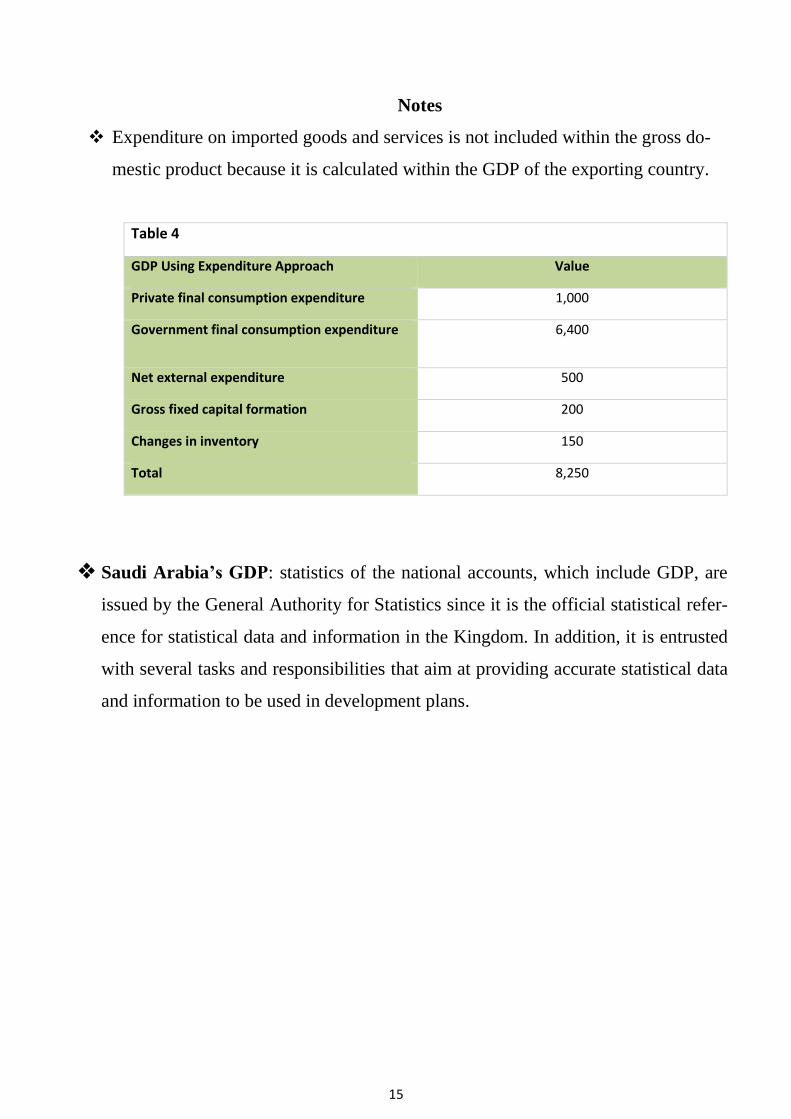
Notes
Expenditure on imported goods and services is not included within the gross do-
mestic product because it is calculated within the GDP of the exporting country.
Table 4
Value GDP Using Expenditure Approach
1,000 Private final consumption expenditure
6,400 Government final consumption expenditure
500 Net external expenditure
200 Gross fixed capital formation
150 Changes in inventory
8,250 Total
Saudi Arabia’s GDP: statistics of the national accounts, which include GDP, are
issued by the General Authority for Statistics since it is the official statistical refer-
ence for statistical data and information in the Kingdom. In addition, it is entrusted
with several tasks and responsibilities that aim at providing accurate statistical data
and information to be used in development plans.
16
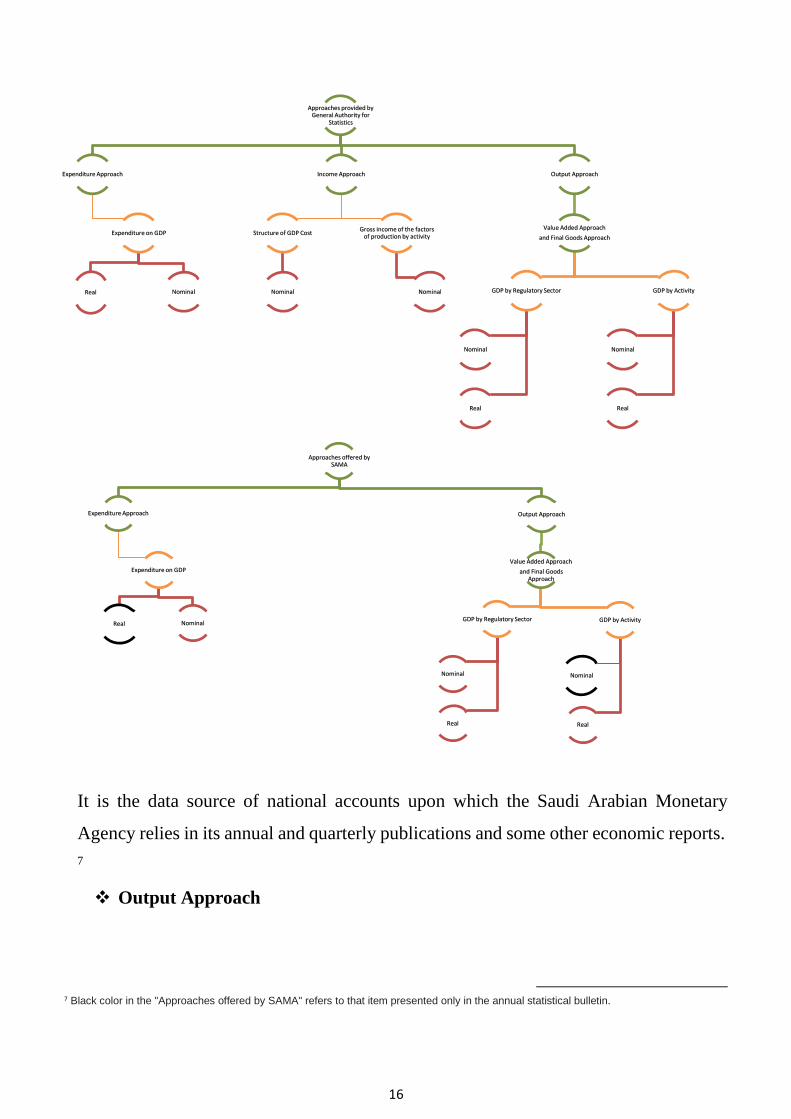
It is the data source of national accounts upon which the Saudi Arabian Monetary
Agency relies in its annual and quarterly publications and some other economic reports.
7
Output Approach
7 Black color in the "Approaches offered by SAMA" refers to that item presented only in the annual statistical bulletin.
Approaches provided by General Authority for
Statistics
Expenditure Approach
Expenditure on GDP
Real Nominal
Income Approach
Structure of GDP Cost
Nominal
Gross income of the factors of production by activity
Nominal
Output Approach
Value Added Approach
and Final Goods Approach
GDP by Regulatory Sector
Nominal
Real
GDP by Activity
Nominal
Real
Approaches offered by SAMA
Expenditure Approach
Expenditure on GDP
Nominal Real
Output Approach
Value Added Approach
and Final Goods Approach
GDP by Regulatory Sector
Nominal
Real
GDP by Activity
Real
Nominal
17
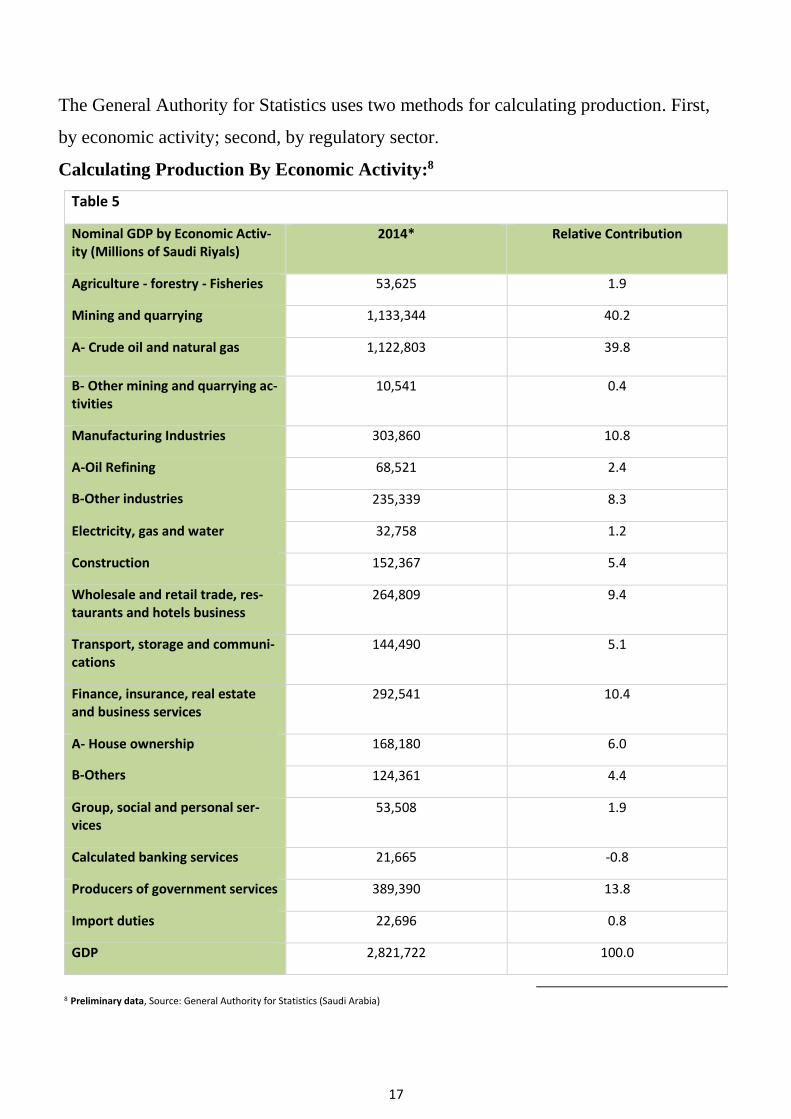
The General Authority for Statistics uses two methods for calculating production. First,
by economic activity; second, by regulatory sector.
Calculating Production By Economic Activity:8
Table 5
Nominal GDP by Economic Activ-ity (Millions of Saudi Riyals)
2014* Relative Contribution
Agriculture - forestry - Fisheries 53,625 1.9
Mining and quarrying 1,133,344 40.2
A- Crude oil and natural gas 1,122,803 39.8
B- Other mining and quarrying ac-tivities
10,541 0.4
Manufacturing Industries 303,860 10.8
A-Oil Refining
B-Other industries
68,521 2.4
235,339 8.3
Electricity, gas and water 32,758 1.2
Construction 152,367 5.4
Wholesale and retail trade, res-taurants and hotels business
264,809 9.4
Transport, storage and communi-cations
144,490 5.1
Finance, insurance, real estate and business services
292,541 10.4
A- House ownership
B-Others
168,180 6.0
124,361 4.4
Group, social and personal ser-vices
53,508 1.9
Calculated banking services 21,665 -0.8
Producers of government services 389,390 13.8
Import duties 22,696 0.8
GDP 2,821,722 100.0
8 Preliminary data, Source: General Authority for Statistics (Saudi Arabia)
18
Table (5) shows that nominal GDP by economic activity during 2014. Items are divided
in accordance with economic activity, goods and services pertaining to each productive
activity are added together, and all monetary values of all productive activities are added
together. (Calculated banking services are, then, subtracted from GDP. GDP stood at
2,821,722 million.
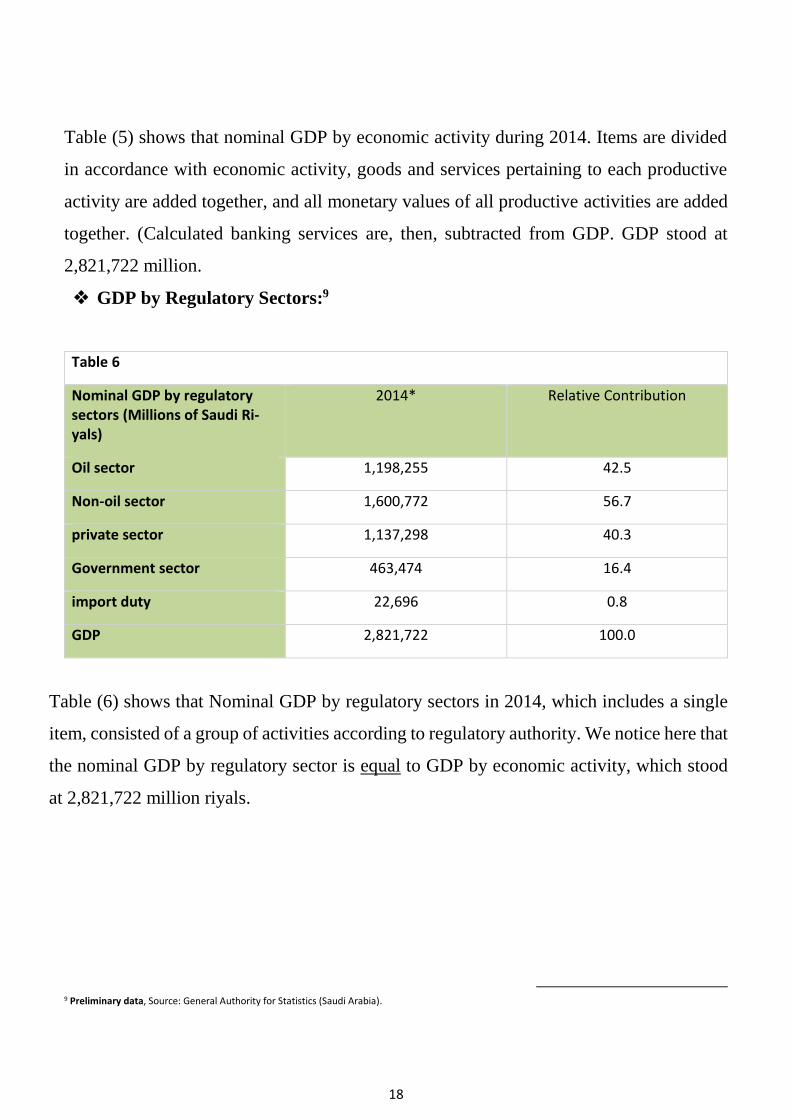
GDP by Regulatory Sectors:9
Table 6
Nominal GDP by regulatory sectors (Millions of Saudi Ri-yals)
2014* Relative Contribution
Oil sector 1,198,255 42.5
Non-oil sector 1,600,772 56.7
private sector 1,137,298 40.3
Government sector 463,474 16.4
import duty 22,696 0.8
GDP 2,821,722 100.0
Table (6) shows that Nominal GDP by regulatory sectors in 2014, which includes a single
item, consisted of a group of activities according to regulatory authority. We notice here that
the nominal GDP by regulatory sector is equal to GDP by economic activity, which stood
at 2,821,722 million riyals.
9 Preliminary data, Source: General Authority for Statistics (Saudi Arabia).
19
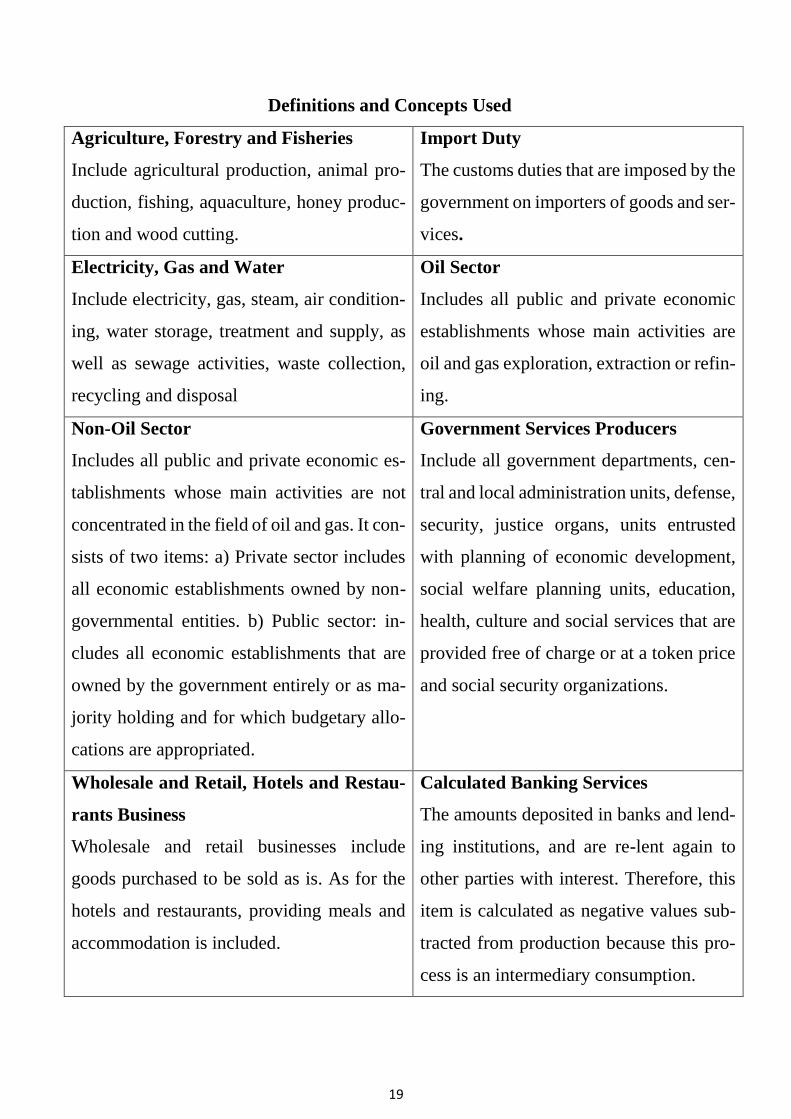
Definitions and Concepts Used
Import Duty
The customs duties that are imposed by the
government on importers of goods and ser-
vices.
Agriculture, Forestry and Fisheries
Include agricultural production, animal pro-
duction, fishing, aquaculture, honey produc-
tion and wood cutting.
Oil Sector
Includes all public and private economic
establishments whose main activities are
oil and gas exploration, extraction or refin-
ing.
Electricity, Gas and Water
Include electricity, gas, steam, air condition-
ing, water storage, treatment and supply, as
well as sewage activities, waste collection,
recycling and disposal
Government Services Producers
Include all government departments, cen-
tral and local administration units, defense,
security, justice organs, units entrusted
with planning of economic development,
social welfare planning units, education,
health, culture and social services that are
provided free of charge or at a token price
and social security organizations.
Non-Oil Sector
Includes all public and private economic es-
tablishments whose main activities are not
concentrated in the field of oil and gas. It con-
sists of two items: a) Private sector includes
all economic establishments owned by non-
governmental entities. b) Public sector: in-
cludes all economic establishments that are
owned by the government entirely or as ma-
jority holding and for which budgetary allo-
cations are appropriated.
Calculated Banking Services
The amounts deposited in banks and lend-
ing institutions, and are re-lent again to
other parties with interest. Therefore, this
item is calculated as negative values sub-
tracted from production because this pro-
cess is an intermediary consumption.
Wholesale and Retail, Hotels and Restau-
rants Business
Wholesale and retail businesses include
goods purchased to be sold as is. As for the
hotels and restaurants, providing meals and
accommodation is included.
20
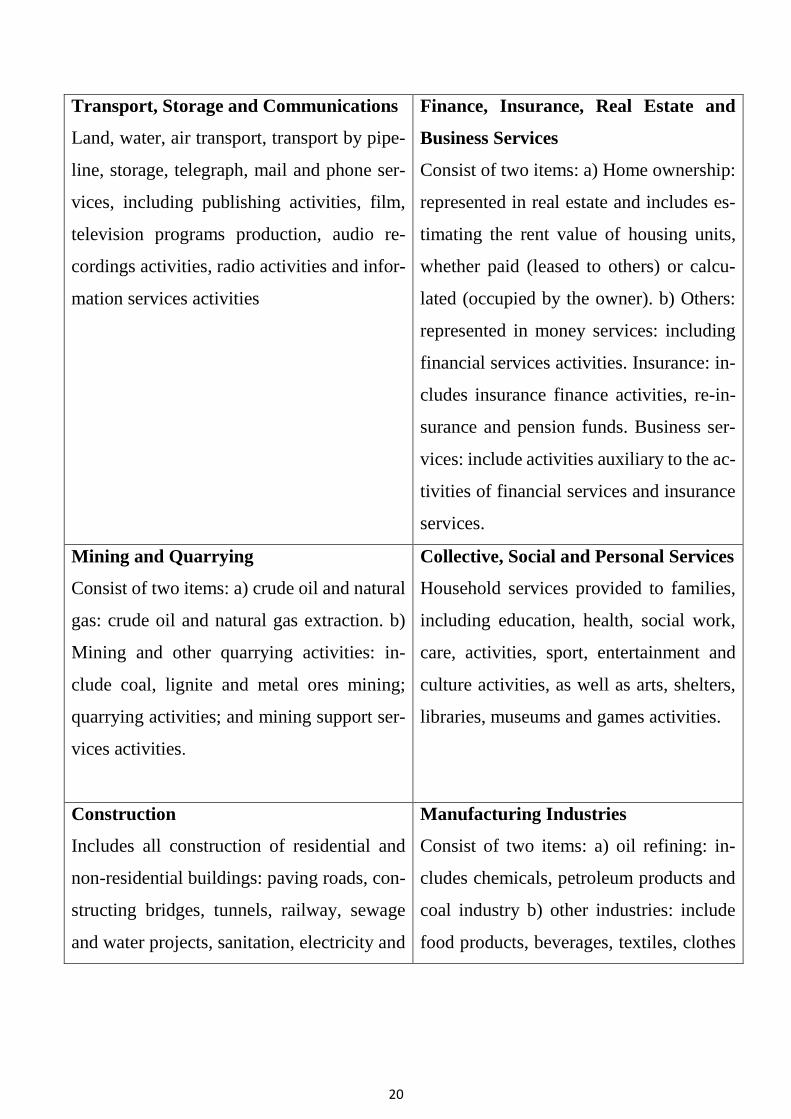
Finance, Insurance, Real Estate and
Business Services
Consist of two items: a) Home ownership:
represented in real estate and includes es-
timating the rent value of housing units,
whether paid (leased to others) or calcu-
lated (occupied by the owner). b) Others:
represented in money services: including
financial services activities. Insurance: in-
cludes insurance finance activities, re-in-
surance and pension funds. Business ser-
vices: include activities auxiliary to the ac-
tivities of financial services and insurance
services.
Transport, Storage and Communications
Land, water, air transport, transport by pipe-
line, storage, telegraph, mail and phone ser-
vices, including publishing activities, film,
television programs production, audio re-
cordings activities, radio activities and infor-
mation services activities
Collective, Social and Personal Services
Household services provided to families,
including education, health, social work,
care, activities, sport, entertainment and
culture activities, as well as arts, shelters,
libraries, museums and games activities.
Mining and Quarrying
Consist of two items: a) crude oil and natural
gas: crude oil and natural gas extraction. b)
Mining and other quarrying activities: in-
clude coal, lignite and metal ores mining;
quarrying activities; and mining support ser-
vices activities.
Manufacturing Industries
Consist of two items: a) oil refining: in-
cludes chemicals, petroleum products and
coal industry b) other industries: include
food products, beverages, textiles, clothes
Construction
Includes all construction of residential and
non-residential buildings: paving roads, con-
structing bridges, tunnels, railway, sewage
and water projects, sanitation, electricity and
21
and leather, wood and cork, paper and pa-
per products, printing and publishing, non-
metallic ore mining products, core metal
industries, machinery, rubber & plastics,
pharmaceutical, basal metals products,
formed metal products, electrical equip-
ment, vehicles, furniture, machinery and
equipment maintenance and installation.
landlines projects, wells drilling, land, culti-
vation, installing air conditioning systems,
linking buildings to sewerage and water net-
work, installing sanitary ware, installing ele-
vators, demolishing buildings and all civil
engineering related activities
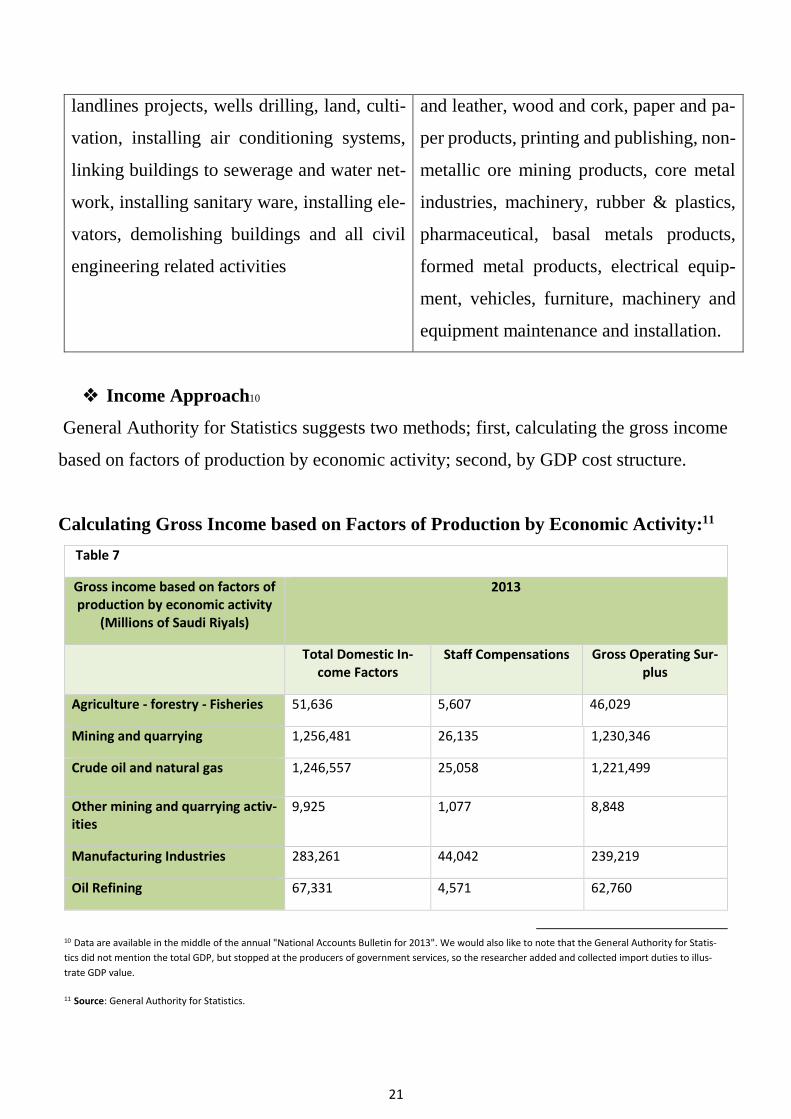
Income Approach10
General Authority for Statistics suggests two methods; first, calculating the gross income
based on factors of production by economic activity; second, by GDP cost structure.
Calculating Gross Income based on Factors of Production by Economic Activity:11
Table 7
Gross income based on factors of production by economic activity
(Millions of Saudi Riyals)
2013
Total Domestic In-come Factors
Staff Compensations Gross Operating Sur-plus
Agriculture - forestry - Fisheries 51,636 5,607 46,029
Mining and quarrying 1,256,481 26,135 1,230,346
Crude oil and natural gas 1,246,557 25,058 1,221,499
Other mining and quarrying activ-ities
9,925 1,077 8,848
Manufacturing Industries 283,261 44,042 239,219
Oil Refining 67,331 4,571 62,760
10 Data are available in the middle of the annual "National Accounts Bulletin for 2013". We would also like to note that the General Authority for Statis-
tics did not mention the total GDP, but stopped at the producers of government services, so the researcher added and collected import duties to illus-
trate GDP value.
11 Source: General Authority for Statistics.
22
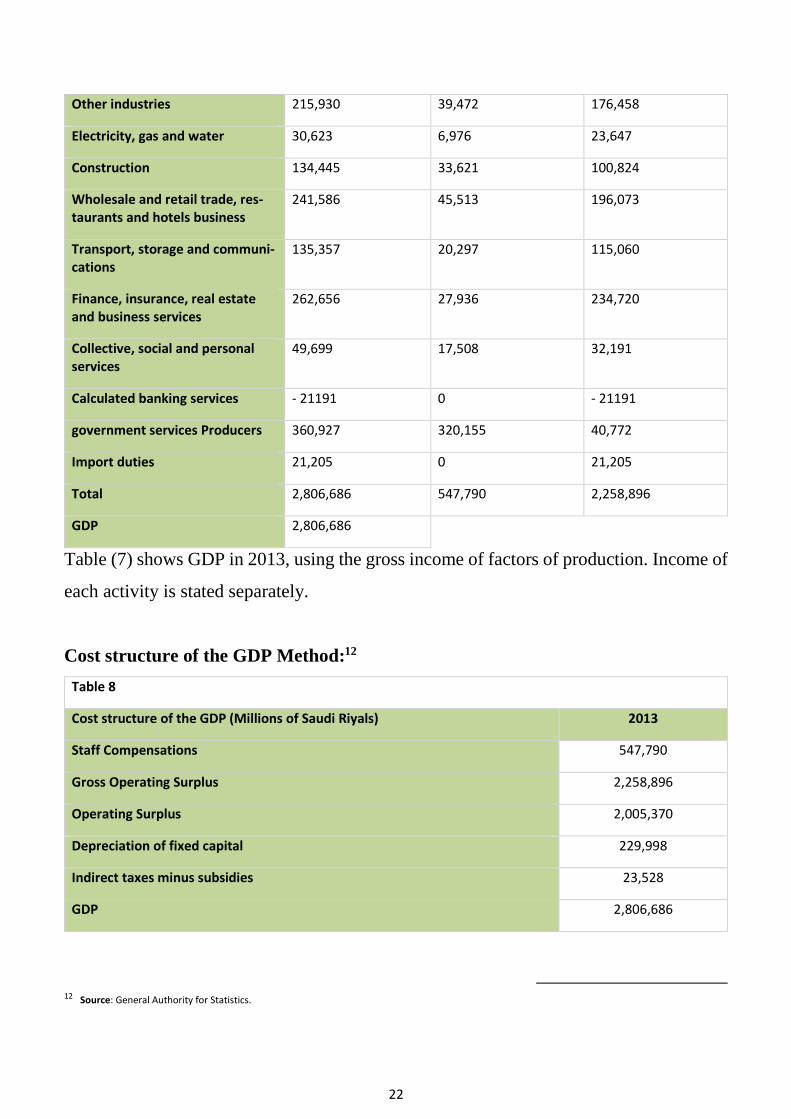
Other industries 215,930 39,472 176,458
Electricity, gas and water 30,623 6,976 23,647
Construction 134,445 33,621 100,824
Wholesale and retail trade, res-taurants and hotels business
241,586 45,513 196,073
Transport, storage and communi-cations
135,357 20,297 115,060
Finance, insurance, real estate and business services
262,656 27,936 234,720
Collective, social and personal services
49,699 17,508 32,191
Calculated banking services - 21191 0 - 21191
government services Producers 360,927 320,155 40,772
Import duties 21,205 0 21,205
Total 2,806,686 547,790 2,258,896
GDP 2,806,686
Table (7) shows GDP in 2013, using the gross income of factors of production. Income of
each activity is stated separately.
Cost structure of the GDP Method:12
Table 8
Cost structure of the GDP (Millions of Saudi Riyals) 2013
Staff Compensations 547,790
Gross Operating Surplus 2,258,896
Operating Surplus 2,005,370
Depreciation of fixed capital 229,998
Indirect taxes minus subsidies 23,528
GDP 2,806,686
12 Source: General Authority for Statistics.
23
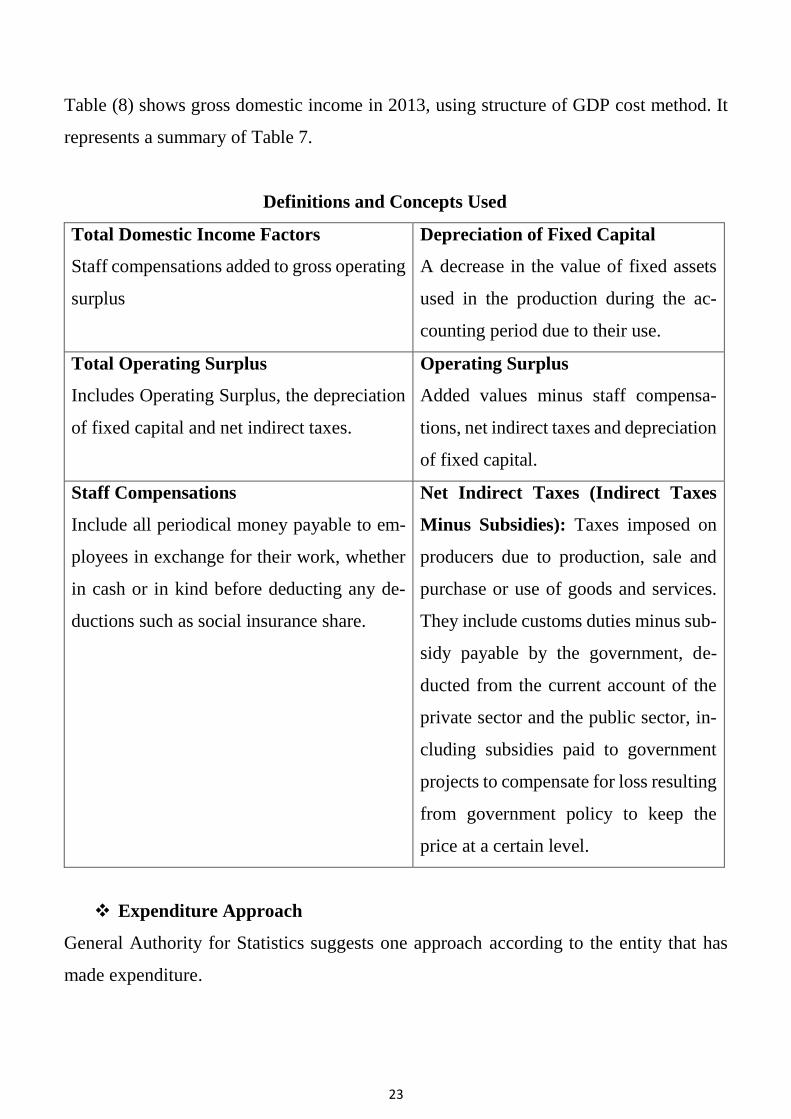
Table (8) shows gross domestic income in 2013, using structure of GDP cost method. It
represents a summary of Table 7.
Definitions and Concepts Used
Depreciation of Fixed Capital
A decrease in the value of fixed assets
used in the production during the ac-
counting period due to their use.
Total Domestic Income Factors
Staff compensations added to gross operating
surplus
Operating Surplus
Added values minus staff compensa-
tions, net indirect taxes and depreciation
of fixed capital.
Total Operating Surplus
Includes Operating Surplus, the depreciation
of fixed capital and net indirect taxes.
Net Indirect Taxes (Indirect Taxes
Minus Subsidies): Taxes imposed on
producers due to production, sale and
purchase or use of goods and services.
They include customs duties minus sub-
sidy payable by the government, de-
ducted from the current account of the
private sector and the public sector, in-
cluding subsidies paid to government
projects to compensate for loss resulting
from government policy to keep the
price at a certain level.
Staff Compensations
Include all periodical money payable to em-
ployees in exchange for their work, whether
in cash or in kind before deducting any de-
ductions such as social insurance share.
Expenditure Approach
General Authority for Statistics suggests one approach according to the entity that has
made expenditure.
24
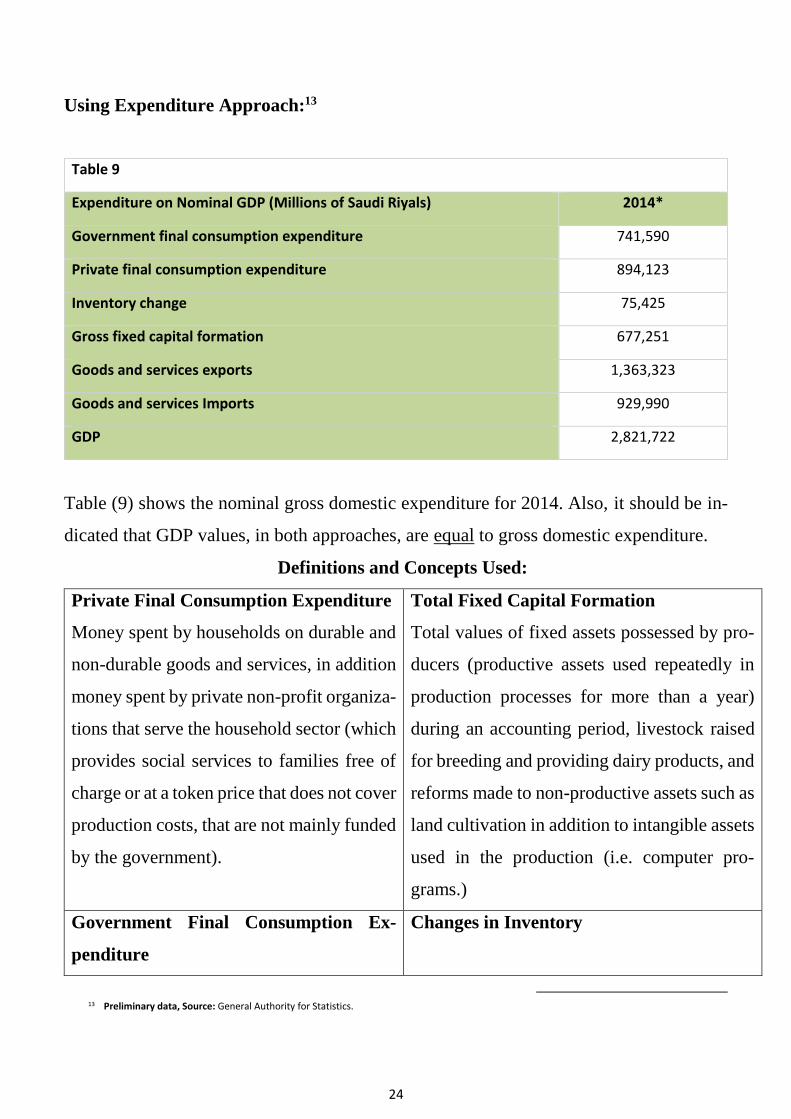
Using Expenditure Approach:13
Table 9
Expenditure on Nominal GDP (Millions of Saudi Riyals) 2014*
Government final consumption expenditure 741,590
Private final consumption expenditure 894,123
Inventory change 75,425
Gross fixed capital formation 677,251
Goods and services exports 1,363,323
Goods and services Imports 929,990
GDP 2,821,722
Table (9) shows the nominal gross domestic expenditure for 2014. Also, it should be in-
dicated that GDP values, in both approaches, are equal to gross domestic expenditure.
Definitions and Concepts Used:
Total Fixed Capital Formation
Total values of fixed assets possessed by pro-
ducers (productive assets used repeatedly in
production processes for more than a year)
during an accounting period, livestock raised
for breeding and providing dairy products, and
reforms made to non-productive assets such as
land cultivation in addition to intangible assets
used in the production (i.e. computer pro-
grams.)
Private Final Consumption Expenditure
Money spent by households on durable and
non-durable goods and services, in addition
money spent by private non-profit organiza-
tions that serve the household sector (which
provides social services to families free of
charge or at a token price that does not cover
production costs, that are not mainly funded
by the government).
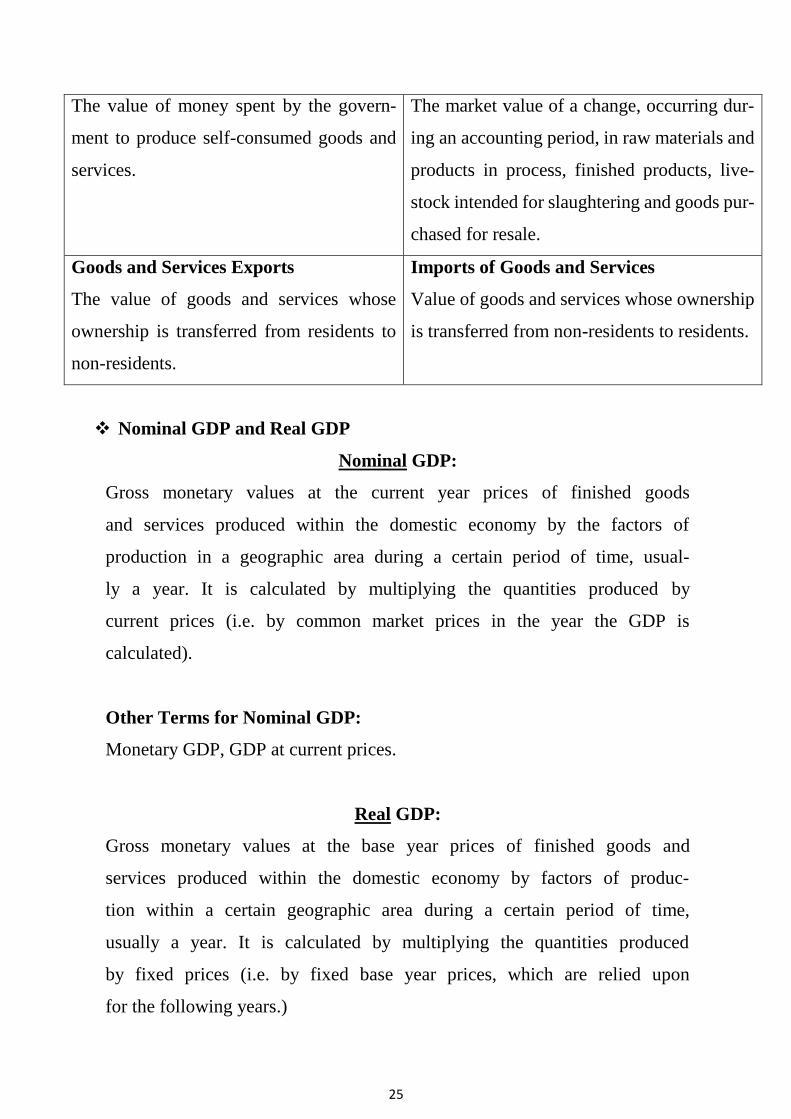
Changes in Inventory Government Final Consumption Ex-
penditure
13 Preliminary data, Source: General Authority for Statistics.
25
The market value of a change, occurring dur-
ing an accounting period, in raw materials and
products in process, finished products, live-
stock intended for slaughtering and goods pur-
chased for resale.
The value of money spent by the govern-
ment to produce self-consumed goods and
services.
Imports of Goods and Services
Value of goods and services whose ownership
is transferred from non-residents to residents.
Goods and Services Exports
The value of goods and services whose
ownership is transferred from residents to
non-residents.
Nominal GDP and Real GDP
Nominal GDP:
Gross monetary values at the current year prices of finished goods
and services produced within the domestic economy by the factors of
production in a geographic area during a certain period of time, usual-
ly a year. It is calculated by multiplying the quantities produced by
current prices (i.e. by common market prices in the year the GDP is
calculated).
Other Terms for Nominal GDP:
Monetary GDP, GDP at current prices.
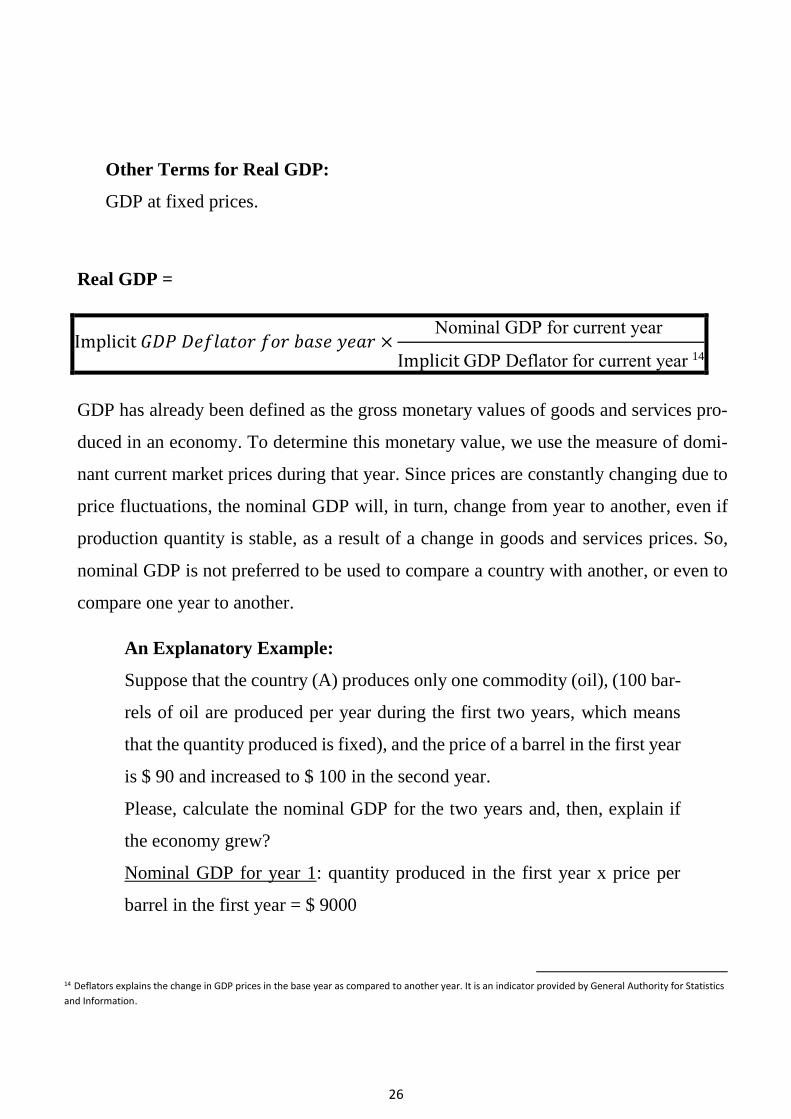
Real GDP:
Gross monetary values at the base year prices of finished goods and
services produced within the domestic economy by factors of produc-
tion within a certain geographic area during a certain period of time,
usually a year. It is calculated by multiplying the quantities produced
by fixed prices (i.e. by fixed base year prices, which are relied upon
for the following years.)
26
Other Terms for Real GDP:
GDP at fixed prices.
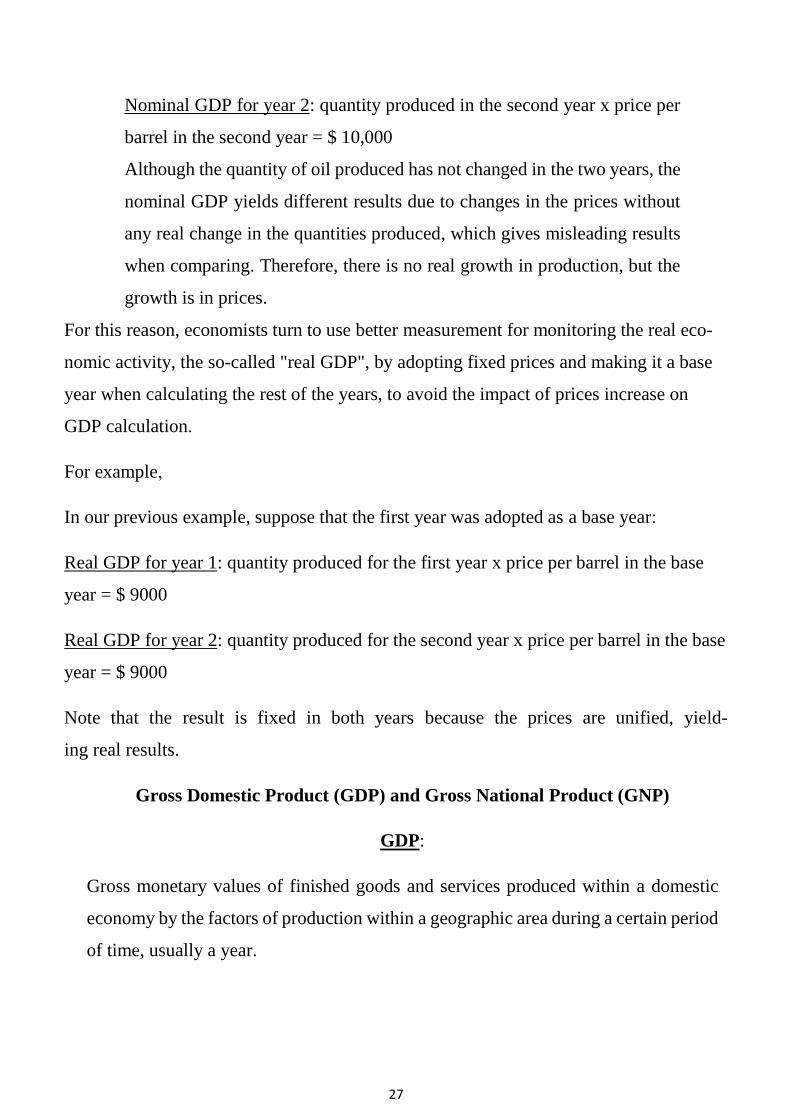
Real GDP =
Implicit 𝐺𝐷𝑃 𝐷𝑒𝑓𝑙𝑎𝑡𝑜𝑟 𝑓𝑜𝑟 𝑏𝑎𝑠𝑒 𝑦𝑒𝑎𝑟 ×Nominal GDP for current year
Implicit GDP Deflator for current year 14
GDP has already been defined as the gross monetary values of goods and services pro-
duced in an economy. To determine this monetary value, we use the measure of domi-
nant current market prices during that year. Since prices are constantly changing due to
price fluctuations, the nominal GDP will, in turn, change from year to another, even if
production quantity is stable, as a result of a change in goods and services prices. So,
nominal GDP is not preferred to be used to compare a country with another, or even to
compare one year to another.
An Explanatory Example:
Suppose that the country (A) produces only one commodity (oil), (100 bar-
rels of oil are produced per year during the first two years, which means
that the quantity produced is fixed), and the price of a barrel in the first year
is $ 90 and increased to $ 100 in the second year.
Please, calculate the nominal GDP for the two years and, then, explain if
the economy grew?
Nominal GDP for year 1: quantity produced in the first year x price per
barrel in the first year = $ 9000
14 Deflators explains the change in GDP prices in the base year as compared to another year. It is an indicator provided by General Authority for Statistics
and Information.
27
Nominal GDP for year 2: quantity produced in the second year x price per
barrel in the second year = $ 10,000
Although the quantity of oil produced has not changed in the two years, the
nominal GDP yields different results due to changes in the prices without
any real change in the quantities produced, which gives misleading results
when comparing. Therefore, there is no real growth in production, but the
growth is in prices.
For this reason, economists turn to use better measurement for monitoring the real eco-
nomic activity, the so-called "real GDP", by adopting fixed prices and making it a base
year when calculating the rest of the years, to avoid the impact of prices increase on
GDP calculation.
For example,
In our previous example, suppose that the first year was adopted as a base year:
Real GDP for year 1: quantity produced for the first year x price per barrel in the base
year = $ 9000
Real GDP for year 2: quantity produced for the second year x price per barrel in the base
year = $ 9000
Note that the result is fixed in both years because the prices are unified, yield-
ing real results.
Gross Domestic Product (GDP) and Gross National Product (GNP)
GDP:
Gross monetary values of finished goods and services produced within a domestic
economy by the factors of production within a geographic area during a certain period
of time, usually a year.
28
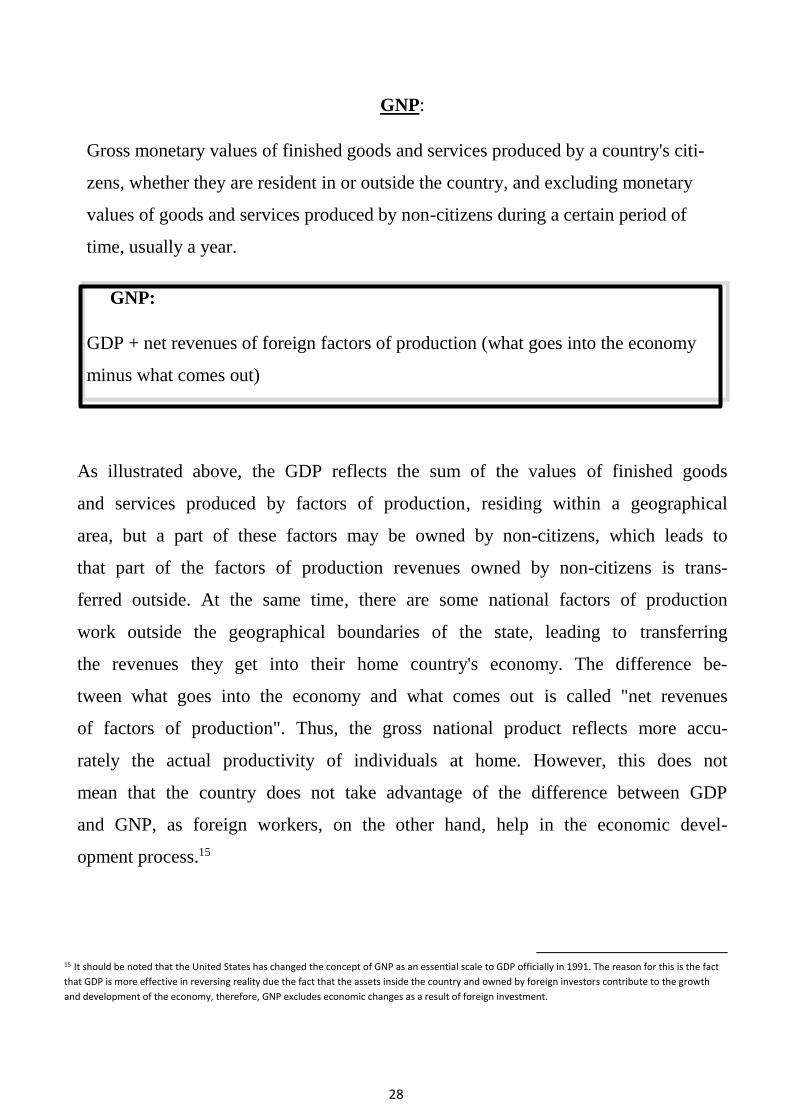
GNP:
Gross monetary values of finished goods and services produced by a country's citi-
zens, whether they are resident in or outside the country, and excluding monetary
values of goods and services produced by non-citizens during a certain period of
time, usually a year.
GNP:
GDP + net revenues of foreign factors of production (what goes into the economy
minus what comes out)
As illustrated above, the GDP reflects the sum of the values of finished goods
and services produced by factors of production, residing within a geographical
area, but a part of these factors may be owned by non-citizens, which leads to
that part of the factors of production revenues owned by non-citizens is trans-
ferred outside. At the same time, there are some national factors of production
work outside the geographical boundaries of the state, leading to transferring
the revenues they get into their home country's economy. The difference be-
tween what goes into the economy and what comes out is called "net revenues
of factors of production". Thus, the gross national product reflects more accu-
rately the actual productivity of individuals at home. However, this does not
mean that the country does not take advantage of the difference between GDP
and GNP, as foreign workers, on the other hand, help in the economic devel-
opment process.15
15 It should be noted that the United States has changed the concept of GNP as an essential scale to GDP officially in 1991. The reason for this is the fact
that GDP is more effective in reversing reality due the fact that the assets inside the country and owned by foreign investors contribute to the growth
and development of the economy, therefore, GNP excludes economic changes as a result of foreign investment.
29
An Explanatory Example:
Presuming that: Gross Domestic Product = 860 SR, the income of citizens working
abroad = 200 SR and that of foreign workers residing in the country = 110 SR. Please,
calculate GNP:
GNP = 860+ (200-110) = 950 riyals.
Gross Domestic Product and Net Domestic Product
Domestic Product Gross
The gross monetary value of finished goods and services produced within a domestic
economy by the factors of production within a geographic area during a certain period of
time, usually a year. Gross domestic product is calculated without excluding the depreci-
ation of capital.
Net Domestic Product:
The gross monetary value of finished goods and services produced within a domestic
economy by the factors of production within a geographic area during a certain period of
time, usually a year. Net domestic product is calculated after excluding the depreciation
of capital.
It should be noted that GDP does not take into account the fact that the capital assets of a
state, such as machinery, equipment and buildings are being consumed over time. These
equipment are wearing out and become obsolete over time. So, we must take into account
Net domestic product = Gross domestic product - depreciation of capital
30
their depreciated value as a result of usage, or even its life span when calculating GDP.
Therefore, another economic measure can be used, which is the GDP after excluding cap-
ital consumption, resulting in a new concept that is more accurate and more credible: "Net
domestic product" to reflect the real value of the economy and the value of the current real
results not their previous values.16
An Explanatory Example:
Presuming that: GDP = 1000 SR and after using machines for a year, these
machines were assessed and its depreciation of capital became = 90 SR. Please,
calculate GDP and net domestic product for the current year:
Gross Domestic Product GDP = 1000 SR
Net Domestic Product = 1000-90 = 910 SR
Regulatory Sectors Contribution to GDP in Real and Nominal Terms
GDP is very important for the development of an economy that is based on policies adopt-
ing the GDP value as a gross value. However, it is also important to know the contribution
of each individual sector constituting the economy as a whole, as it is useful to know the
nature of the economy and its future based on knowing the nature of the most important
sector in GDP.
A Comparison of GDP in 1999 and 2013
16 Usually, the concept of GDP is dealt with because it is difficult to estimate the depreciation of fixed capital.
31
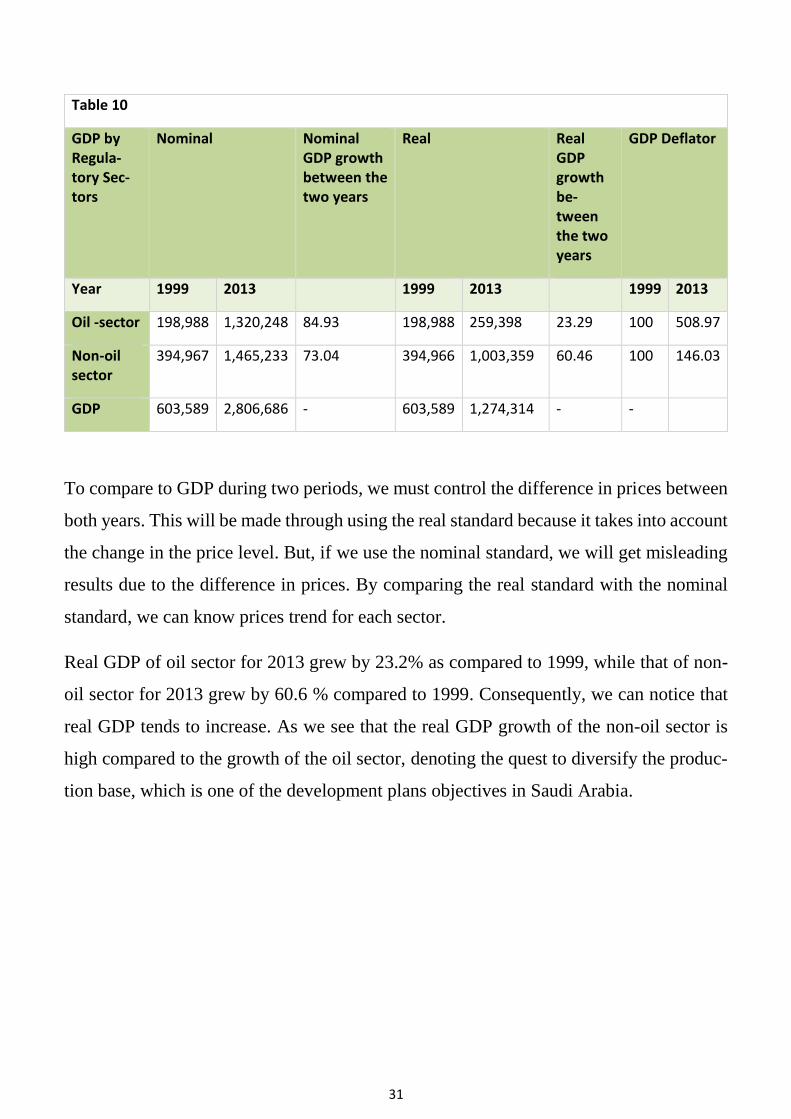
Table 10
GDP by Regula-tory Sec-tors
Nominal Nominal GDP growth between the two years
Real Real GDP growth be-tween the two years
GDP Deflator
Year 1999 2013 1999 2013 1999 2013
Oil -sector 198,988 1,320,248 84.93 198,988 259,398 23.29 100 508.97
Non-oil sector
394,967 1,465,233 73.04 394,966 1,003,359 60.46 100 146.03
GDP 603,589 2,806,686 - 603,589 1,274,314 - -
To compare to GDP during two periods, we must control the difference in prices between
both years. This will be made through using the real standard because it takes into account
the change in the price level. But, if we use the nominal standard, we will get misleading
results due to the difference in prices. By comparing the real standard with the nominal
standard, we can know prices trend for each sector.
Real GDP of oil sector for 2013 grew by 23.2% as compared to 1999, while that of non-
oil sector for 2013 grew by 60.6 % compared to 1999. Consequently, we can notice that
real GDP tends to increase. As we see that the real GDP growth of the non-oil sector is
high compared to the growth of the oil sector, denoting the quest to diversify the produc-
tion base, which is one of the development plans objectives in Saudi Arabia.
32
As for nominal GDP of the oil sector for 2013, it grew by 84.9 % as compared to 1999,
while that of the non-oil sector rose by 73% compared to 1999. Nominal GDP tends to
increase as well.
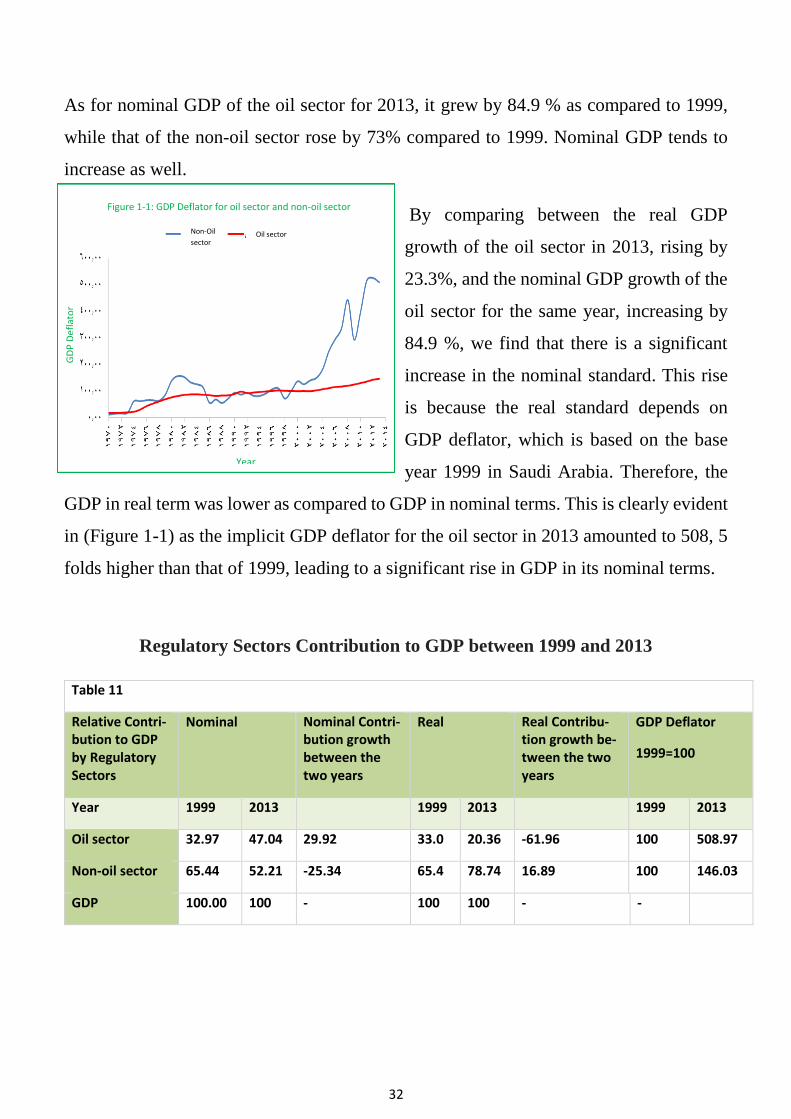
By comparing between the real GDP
growth of the oil sector in 2013, rising by
23.3%, and the nominal GDP growth of the
oil sector for the same year, increasing by
84.9 %, we find that there is a significant
increase in the nominal standard. This rise
is because the real standard depends on
GDP deflator, which is based on the base
year 1999 in Saudi Arabia. Therefore, the
GDP in real term was lower as compared to GDP in nominal terms. This is clearly evident
in (Figure 1-1) as the implicit GDP deflator for the oil sector in 2013 amounted to 508, 5
folds higher than that of 1999, leading to a significant rise in GDP in its nominal terms.
Regulatory Sectors Contribution to GDP between 1999 and 2013
Table 11
Relative Contri-bution to GDP by Regulatory Sectors
Nominal Nominal Contri-bution growth between the two years
Real Real Contribu-tion growth be-tween the two years
GDP Deflator
1999=100
Year 1999 2013 1999 2013 1999 2013
Oil sector 32.97 47.04 29.92 33.0 20.36 -61.96 100 508.97
Non-oil sector 65.44 52.21 -25.34 65.4 78.74 16.89 100 146.03
GDP 100.00 100 - 100 100 - -
Year
Figure 1-1: GDP Deflator for oil sector and non-oil sector
Oil sector Non-Oil
sector
GD
P D
efla
tor
Year
33
The nominal contribution of the oil sector to GDP in 2013 went up by 29.9 %, while the
nominal contribution of non-oil sector to GDP declined in the same year by 25.3 %. What
is the reason behind the low contribution of non-oil sector to nominal GDP in 2013, alt-
hough the non-oil sector grew, in nominal terms, by 73% in 2013, as shown in (Table 10).
This can be explained as: the production growth ratio of the oil sector amounted to 84.9
% in 2013, indicating that it grew rapidly in nominal terms as compared to the non-oil
sector because of rapid increase in prices of the oil sector. Thus, the oil sector contribution
to GDP increased, while that of non-oil sector decreased.
In real terms, we find that the oil sector real contribution to GDP dropped by 61.9 % in
2013, while that of non-oil sector increased by 16.8 % in the same year. So, what is the
reason behind oil sector low contribution to real GDP in 2013, though, oil production
sector increased by 23.2 % ,in real terms, in 2013, as shown in (Table 10). This can be
elaborated as: non-oil sector amounted to 60.6 % in 2013, which means that the non-oil
sector grew rapidly in real terms as compared to the oil sector because of vast quantities
produced by the non-oil sector as compared to the oil sector. Unlike the oil sector contri-
bution to GDP that has decreased, non-oil sector contribution to GDP increased.
The one-year comparison between nominal and real GDP may be beneficial in estimating
price inflation and deflation. As oil sector contribution to nominal GDP amounted to 47.4
% in 2013, and that of the oil sector amounted to 20.3 % in 2013. So, what is the reason
behind the oil sector low contribution to real GDP? This is because to the General Au-
thority for Statistics still depends on the base year 1999 as a GDP Deflator, used in real
GDP calculation. The average price of an oil barrel in 1999 was $ 17.4, but, it was $ 105.8
in 2013. This is reflected on the GDP deflator value in (Table 11). The GDP deflator of
the sector amounted to 508.9 in 2013 while it amounted to 100 in 1999, denoting that a
difference is almost five time-folds. Therefore, this is the reason behind the oil sector low
contribution to real GDP. Officials, in General Authority for Statistics, say that the base
year 2010 will be adopted to measure the GDP deflator soon. This will help in reducing
the large decline rate when comparing the nominal and the real standards.
34
Determinants of GDP Size
Natural circumstances that man cannot control or predict, such as earthquakes, vari-
ous weather and climate conditions.
A country’s political stability that affects the quantity and value of produced goods
and services. For instance, wars have a devastating impact on GNP through destroy-
ing plants.
Quantity and quality of economic resources that determine the quantity and quality
of what is being produced and, hence, affecting the value of the GDP.
Relationship of factors of production and the surrounding environment, and the extent
of implementing the labor decomposition principle in production by the state and uti-
lizing technological advances.
GDP Calculations Problems
It’s difficult to calculate values for each income resulting from an economic activity,
such as unannounced properties inhabited by owners, particularly in countries charac-
terized by weak tax accounting departments.
It’s difficult to calculate monetary values of GDP for some goods and services, such
as products that are not traded in the market (i.e. products consumed by their produc-
ers), services of a housewife at home, physician, electrician, plumber and carpenter
services for the his\her family. Consequently, GDP value appears to be less than the
real value.
It’s difficult to estimate the commodity inventory size and the depreciation of capital
for each factor of production as well.
The problem of constant change in the general price structures and standard prices,
significantly affect, GDP both in its nominal and real terms.
35
The problem of different currency values among countries and the existence of more
than one (formal and real) rate for each national currency that may make the compar-
ison between national income of counties inaccurate.
Illegal activities (economically known as shadow economy) are not counted in GDP
because these activities are carried out using cash or exchanging to evade state con-
trol, making them impossible to be calculated.
GDP does not reflect negative effects on the environment (i.e. the factories negative
effects) as it is very difficult to estimate and subtract from GDP.
Conclusion
The study reviewed the Gross Domestic Product (GDP) concept and other related con-
cepts. Then, it explained (GDP) notion using output approach, expenditure approach and
income approach and indicated that those approaches are only different calculation meth-
ods that yield the same results. GDP is produced by factors of production, and, hence, they
earn income in return for their work and spend that income, money, to consume produced
goods and services, which represents the expenditure process. GDP indicator is significant
since it summarizes the economic activities carried out by the community during a certain
period of time, usually a year. Also, it can be used in economic analyses and the develop-
ment of plans and policies. Moreover, identifying the incomes of the factors of production
may facilitate developing a policy that mange the distribution of income; and by identify-
ing GDP, using expenditure approach, will enable us to pinpoint the main consuming sec-
tors in the economy. Also, GDP indicator may be used as an indicator to compare coun-
tries when measuring the economic performance of a country. The study also explained
SNA source and the system applied by General Authority for Statistics. In addition, it
reviewed approaches for GDP calculation.
Afterwards, the study touched upon the difference between nominal GDP and real GDP.
The real GDP is calculated, taking into account the change in prices since the base year,
36
while the nominal GDP is calculated at current prices for the same year. Therefore, the
nominal GDP becomes an inaccurate indicator for comparison between countries or even
between different two periods of time for a single country. So, it would be preferable to
depend on the real GDP. Also, the difference between GDP and GNP was clarified, as the
GNP takes into account adding returns of national factors of production who are outside
the country and subtract the returns of foreign factors of production inside the country.
Hence, it is better to use GNP to express the real productivity of citizens.
It is known that the value of capital assets, such as machinery, depreciate over time. Thus,
the value of such equipment is decreasing and it may become unusable over time. So, a
decrease in its value as a result of usage when calculating GDP should be taken into ac-
count. Therefore, another economic measure may be used (GDP after excluding capital
depreciation), resulting into a new concept that is more accurate and more credible,
namely: "net domestic product". This study recommends that the base year for the GDP
Deflator should be updated. The base year for GDP deflator, adopted during the study
duration is 1999, so that real GDP can reflect an appropriate value for the current price
structures. The study also recommends diversifying the production base of the Kingdom
to ensure a continued development process that is not affected by fluctuations in oil prices.
37
References:
Arabic
Sharjabi, Hamid, “Comparing Updates and Changes between 1993 and 2008 Sys-
tem of National Accounts”, Khwarizmi Conference, Qatar.
Comprehensive Economic Census, General Authority for Statistics, Saudi Arabia,
2010.
National Accounts, General Authority for Statistics, National Income Statistics,
Saudi Arabia, 2013.
Al Habib, Fayez, “Principles of Macroeconomics”, Al-Farazdaq Printing Press,
Riyadh sixth edition, 2011.
National Accounts: A Practical Introduction, Methods Guide, the Department of
Economic and Social Affairs, Series F, No. 85, United Nations, 2005.
National Accounts Statistics, United Nations System of National Accounts for
1993, Central Administration of Statistics, Kuwait, 2012.
Salem, Kotb, "Support for Implementation Strategy for 1993 SNA in the Arab Re-
gion", Western Asia (UN-ESCWA) Jordan, 2013.
The Use of National Accounts in Policy Analysis, Approaches Guide, the Depart-
ment of Economic and Social Affairs, Series F, No. 81, United Nations, 2005.
English
Vanoli, A. A History of National Accounting. IOS Press. Amsterdam. 2005.
38
System of National Accounts, European Communities, International Monetary
Fund, Organization for Economic Co-operation and Development, United Nations
and World Bank, New York, 2009
System of National Accounts, European Communities, International Monetary
Fund, Organization for Economic Co-operation and Development, United Nations
and World Bank, New York, 1993
Michael R. Macroeconomics: Theory and Policy. Prentice-Hall. Third Revised
edition. 1987.