Fact Sheet FS-061-00
Mercury contamination from his-toric gold mines represents a potential risk to human health and the environ-ment. This fact sheet provides back-ground information on the use of mercury in historic gold mining and processing operations in California, and describes a new USGS project that addresses the potential risks associated with mercury from these sources, with emphasis on historic hydraulic mining areas.
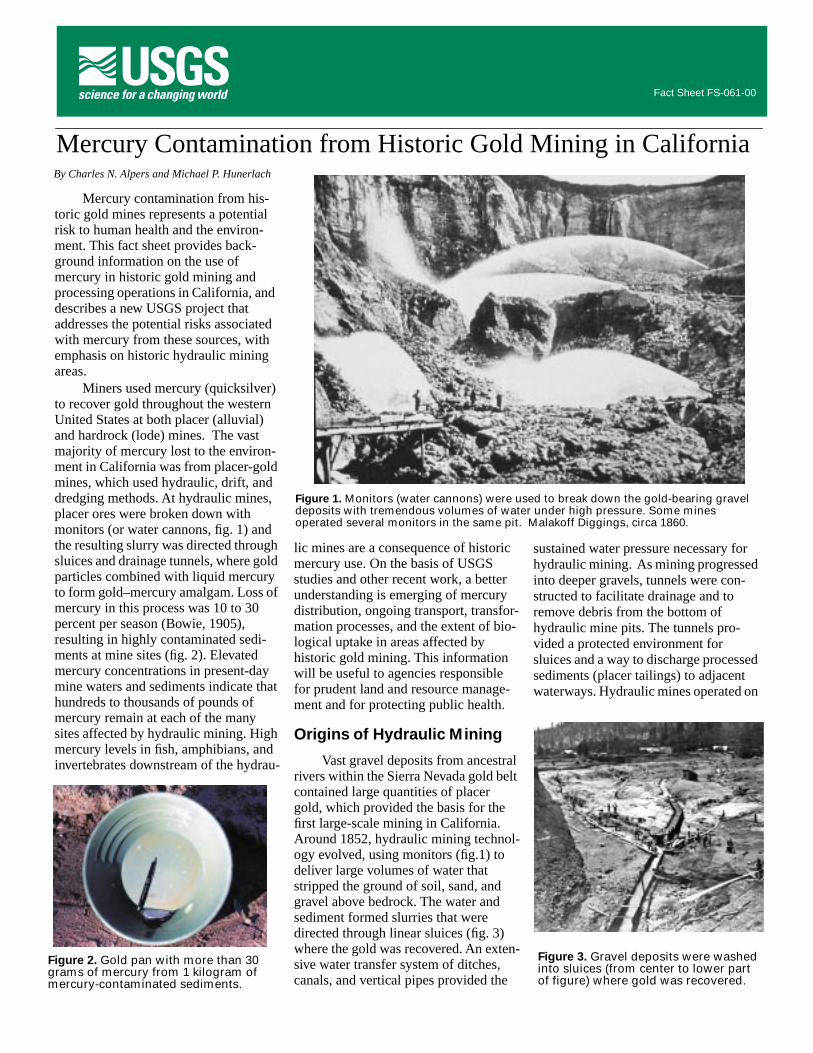
Miners used mercury (quicksilver) to recover gold throughout the western United States at both placer (alluvial) and hardrock (lode) mines. The vast majority of mercury lost to the environ-ment in California was from placer-gold mines, which used hydraulic, drift, and dredging methods. At hydraulic mines, placer ores were broken down with monitors (or water cannons, fig. 1) and the resulting slurry was directed through sluices and drainage tunnels, where gold particles combined with liquid mercury to form gold–mercury amalgam. Loss of mercury in this process was 10 to 30 percent per season (Bowie, 1905), resulting in highly contaminated sedi-ments at mine sites (fig. 2). Elevated mercury concentrations in present-day mine waters and sediments indicate that hundreds to thousands of pounds of mercury remain at each of the many sites affected by hydraulic mining. High mercury levels in fish, amphibians, and invertebrates downstream of the hydrau-
lic mines are a consequence of historic mercury use. On the basis of USGS studies and other recent work, a better understanding is emerging of mercury distribution, ongoing transport, transfor-mation processes, and the extent of bio-logical uptake in areas affected by historic gold mining. This information will be useful to agencies responsible for prudent land and resource manage-ment and for protecting public health.
Origins of Hydraulic Mining
Vast gravel deposits from ancestral rivers within the Sierra Nevada gold belt contained large quantities of placer gold, which provided the basis for the first large-scale mining in California. Around 1852, hydraulic mining technol-ogy evolved, using monitors (fig.1) to deliver large volumes of water that stripped the ground of soil, sand, and gravel above bedrock. The water and sediment formed slurries that were directed through linear sluices (fig. 3) where the gold was recovered. An exten-sive water transfer system of ditches, canals, and vertical pipes provided the
sustained water pressure necessary for hydraulic mining. As mining progressed into deeper gravels, tunnels were con-structed to facilitate drainage and to remove debris from the bottom of hydraulic mine pits. The tunnels pro-vided a protected environment for sluices and a way to discharge processed sediments (placer tailings) to adjacent waterways. Hydraulic mines operated on
Figure 2.
Gold pan with more than 30 grams of mercury from 1 kilogram of mercury-contaminated sediments.
Figure 1.
Monitors (water cannons) were used to break down the gold-bearing gravel deposits with tremendous volumes of water under high pressure. Some mines operated several monitors in the same pit. Malakoff Diggings, circa 1860.
Figure 3.
Gravel deposits were washed into sluices (from center to lower part of figure) where gold was recovered.
Mercury Contamination from Historic Gold Mining in California
By Charles N. Alpers and Michael P. Hunerlach
undercurrent
sluice
Los Angeles
SanDiego
San Francisco
Gold minesMercury mines
EXPLANATION
Area of figure 7
Klamath-Trinity Mountains
Sierra Nevada
Year
80
60
40
20
01850 1870 1890 1910
6,120,000 pounds per year,1877
1884 Sawyer Decision
Mer
cury
pro
duct
ion,
in th
ousa
nds
of fl
asks
per
yea
r
1 flask = 76 pounds
a large scale from the 1850s to the 1880s in California’s northern Sierra Nevada region, where more than 1.5 bil-lion cubic yards of gold-bearing placer gravels were worked. In 1884, the Sawyer Decision prohibited dis-charge of mining debris in the Sierra Nevada region, but not in the Klamath–Trinity Mountains (fig. 4), where hydraulic mining continued until the 1950s. Underground mining of placer deposits (drift mining) and of hardrock gold–quartz vein deposits produced most of California’s gold from the mid-1880s to the early 1900s. Dredging of gold-bearing sediments in the Sierra Nevada foothills has been an important source of gold since the early 1900s. Mercury also was used extensively until the early 1960s in the dredging of flood plain deposits, were over 3.6 bil-lion cubic yards were mined. Mercury is recovered today as a by-product from large- and small-scale dredging operations.
Mercury Mining
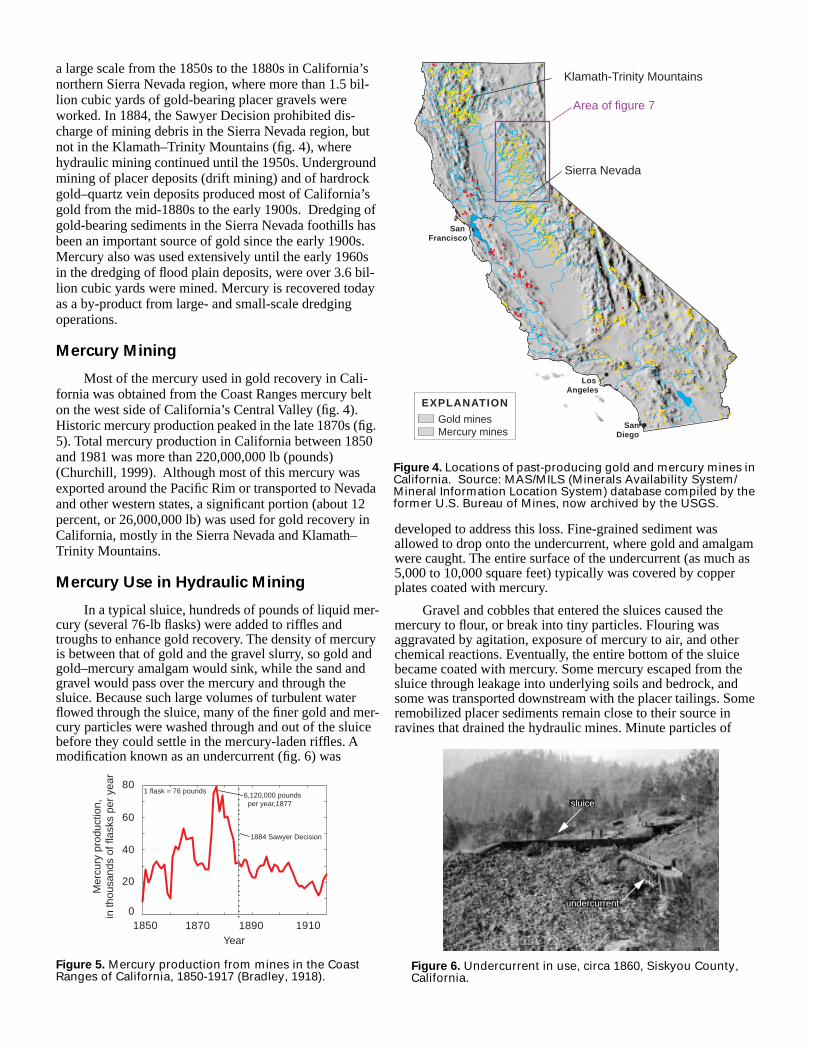
Most of the mercury used in gold recovery in Cali-fornia was obtained from the Coast Ranges mercury belt on the west side of California’s Central Valley (fig. 4). Historic mercury production peaked in the late 1870s (fig. 5). Total mercury production in California between 1850 and 1981 was more than 220,000,000 lb (pounds) (Churchill, 1999). Although most of this mercury was exported around the Pacific Rim or transported to Nevada and other western states, a significant portion (about 12 percent, or 26,000,000 lb) was used for gold recovery in California, mostly in the Sierra Nevada and Klamath–Trinity Mountains.
Mercury Use in Hydraulic Mining
In a typical sluice, hundreds of pounds of liquid mer-cury (several 76-lb flasks) were added to riffles and troughs to enhance gold recovery. The density of mercury is between that of gold and the gravel slurry, so gold and gold–mercury amalgam would sink, while the sand and gravel would pass over the mercury and through the sluice. Because such large volumes of turbulent water flowed through the sluice, many of the finer gold and mer-cury particles were washed through and out of the sluice before they could settle in the mercury-laden riffles. A modification known as an undercurrent (fig. 6) was
developed to address this loss. Fine-grained sediment was allowed to drop onto the undercurrent, where gold and amalgam were caught. The entire surface of the undercurrent (as much as 5,000 to 10,000 square feet) typically was covered by copper plates coated with mercury.
Gravel and cobbles that entered the sluices caused the mercury to flour, or break into tiny particles. Flouring was aggravated by agitation, exposure of mercury to air, and other chemical reactions. Eventually, the entire bottom of the sluice became coated with mercury. Some mercury escaped from the sluice through leakage into underlying soils and bedrock, and some was transported downstream with the placer tailings. Some remobilized placer sediments remain close to their source in ravines that drained the hydraulic mines. Minute particles of
Figure 5.
Mercury production from mines in the Coast Ranges of California, 1850-1917 (Bradley, 1918).
Figure 4.
Locations of past-producing gold and mercury mines in California. Source: MAS/MILS (Minerals Availability System/Mineral Information Location System) database compiled by the former U.S. Bureau of Mines, now archived by the USGS.
Figure 6.
Undercurrent in use, circa 1860, Siskyou County, California.
Major Drainage Basins
Feather RiverNorth / Middle Yuba RiverSouth Yuba / Bear RiverAmerican River
EXPLANATION
Gold mines
0 10 20 Miles
0 10 20 Kilometers
Major placer Major hardrockAll gold mines
408
398
1218 1208
Sacramento
Middle Fork
North Fork
North Fork
00 2,000 4,000 6,000 8,000 10,000 12,000
0.35
0.30
0.25
0.20
0.15
0.10
0.05
Bear River
North / Middle Yuba River
South Yuba / Bear River
American River
Feather River
North Fork
South Fork
South Fork
Middle Fork
South Fork
Deer Creek
Middle Fork
Ave
rage
mer
cury
in ti
ssue
,in
mic
rogr
ams
per
gram
Gravel mined, in cubic yards per square mile
quicksilver were found floating on surface water as far as 20 miles downstream of mining operations (Bowie, 1905).
Averill (1946) estimated that, under the best operating conditions, 10 percent of the mercury used was lost and, under average conditions, the annual loss of mercury was up to 30 percent. Mercury use varied from 0.1 to 0.36 pounds per square foot of sluice. We estimate that a typical sluice had an area of 2,400 square feet and used up to 800 lb of mercury during initial start-up, after which several additional 76-lb flasks were added weekly to monthly throughout its operating season (generally 6 to 8 months, depending on water avail-ability). Assuming a 10–30 percent loss, the annual loss of mercury from a typical sluice was likely several hundred
pounds during the operating season. From the 1860s through the early 1900s, hundreds of hydraulic placer-gold mines operated in the Sierra Nevada. The total amount of mercury lost to the environment from these operations may have been 3–8 million lb or more, from estimates by Churchill (1999) that about 26,000,000 lb of mercury were used in California. Historic records indicate that about 3 million lb of mercury were used at hardrock mines in stamp mills, where ores were crushed. Mercury was also used extensively at drift mines and in dredging operations. The present distribution and fate of the mercury used in historic gold mining operations remains largely unknown, and is the focus of ongoing studies.
The Bear–Yuba Project
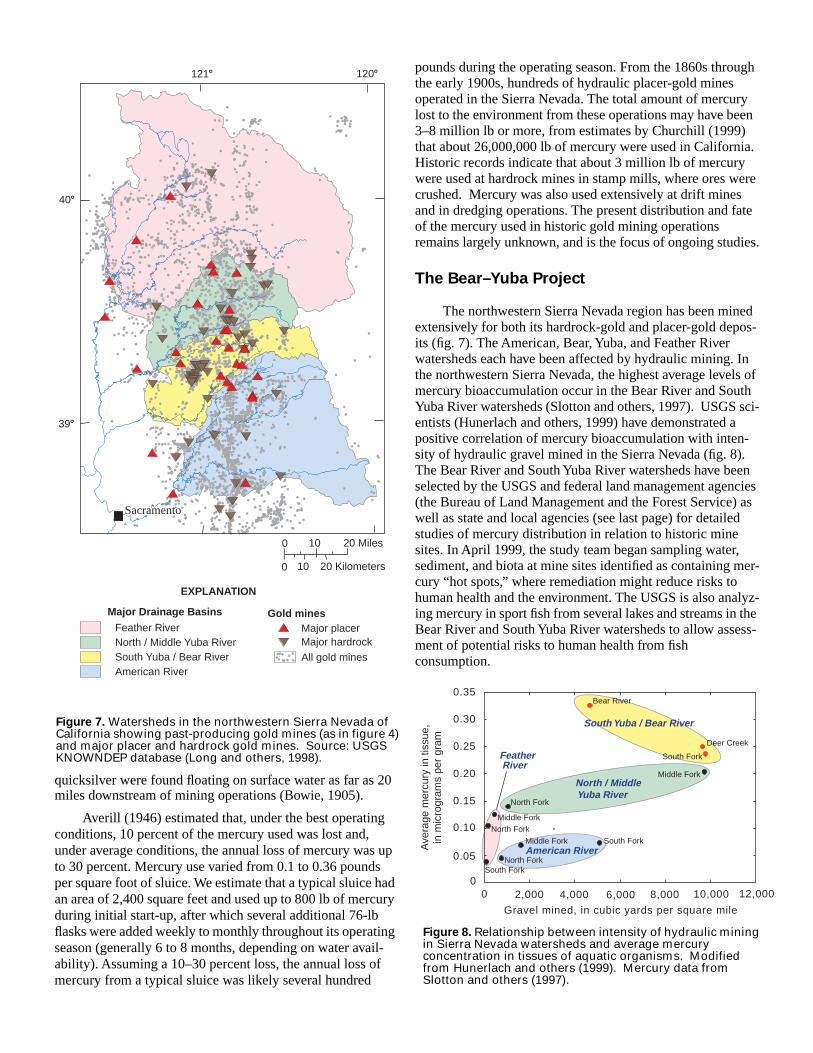
The northwestern Sierra Nevada region has been mined extensively for both its hardrock-gold and placer-gold depos-its (fig. 7). The American, Bear, Yuba, and Feather River watersheds each have been affected by hydraulic mining. In the northwestern Sierra Nevada, the highest average levels of mercury bioaccumulation occur in the Bear River and South Yuba River watersheds (Slotton and others, 1997). USGS sci-entists (Hunerlach and others, 1999) have demonstrated a positive correlation of mercury bioaccumulation with inten-sity of hydraulic gravel mined in the Sierra Nevada (fig. 8). The Bear River and South Yuba River watersheds have been selected by the USGS and federal land management agencies (the Bureau of Land Management and the Forest Service) as well as state and local agencies (see last page) for detailed studies of mercury distribution in relation to historic mine sites. In April 1999, the study team began sampling water, sediment, and biota at mine sites identified as containing mer-cury “hot spots,” where remediation might reduce risks to human health and the environment. The USGS is also analyz-ing mercury in sport fish from several lakes and streams in the Bear River and South Yuba River watersheds to allow assess-ment of potential risks to human health from fish consumption.
Figure 7.
Watersheds in the northwestern Sierra Nevada of California showing past-producing gold mines (as in figure 4) and major placer and hardrock gold mines. Source: USGS KNOWNDEP database (Long and others, 1998).
Figure 8.
Relationship between intensity of hydraulic mining in Sierra Nevada watersheds and average mercury concentration in tissues of aquatic organisms. Modified from Hunerlach and others (1999). Mercury data from Slotton and others (1997).
c
estuarysediments
ALGAE
INVERTEBRATES
E s t u a r y
transport of Hg(0), Hg (II), and CH3Hg+
mountain headwaters
debris dam
urban & industrialsources
reservoir sediments
creeks and rivers
placer tailings
mercury mines
metamorphic bedrock
highwall go ld-bear ingTer t iary gravels
dra inage tunnel (s lu ice)
driftmine
ground sluice
partially blocked mine workings
hydraul ic mine p i t
typical foothills reservoir
PRECIPITATION
REDUCTIONDEMETHYLATION
METHYLATIONBIOMAGNIFICATION
ADVECTION / DIFFUSIONSEDIMENT RESUSPENSION
Hg(II)
Hg(II)
Hg(0)
DOC
CH3Hg+
CH3Hg+
flood plain deposits
dragline dredge
dredge tailings
overbankflood deposits
lake
Hg(0) CH3Hg+
Potential for Mercury Contaminationin Sediments
Unknown
Low (unaffected by mining)
High
Moderate
Hg(0)
OXID
ATION
Transport and Fate of Mercuryin the Environment
EXPLANATION
Figure 9.
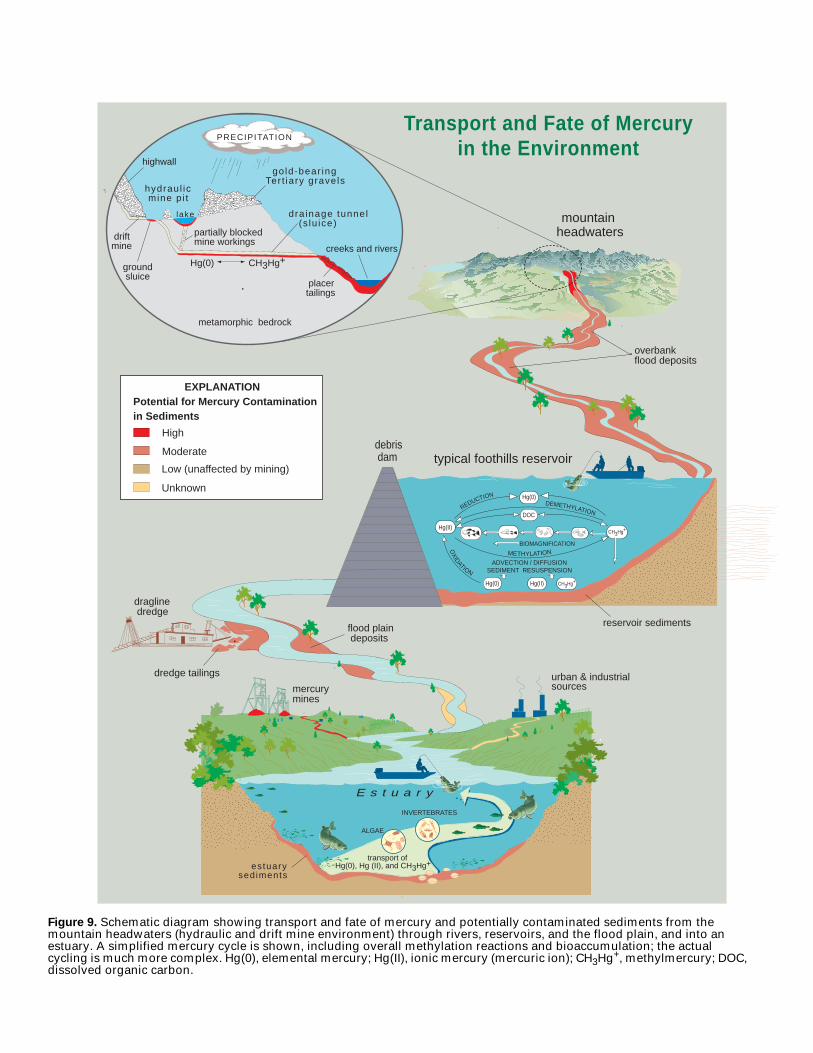
Schematic diagram showing transport and fate of mercury and potentially contaminated sediments from the mountain headwaters (hydraulic and drift mine environment) through rivers, reservoirs, and the flood plain, and into an estuary. A simplified mercury cycle is shown, including overall methylation reactions and bioaccumulation; the actual cycling is much more complex. Hg(0), elemental mercury; Hg(II), ionic mercury (mercuric ion); CH
3
Hg
+
, methylmercury; DOC, dissolved organic carbon.
GuadalupeReservoir
GuadalupeCreek and River Calero
Reservoir
LosAngeles
SanDiego
SanFrancisco
Sacramento
Clear Lake
LakePillsbury
LakeBerryessa
LakeNacimiento
LakeHerman
AlmadenReservoir
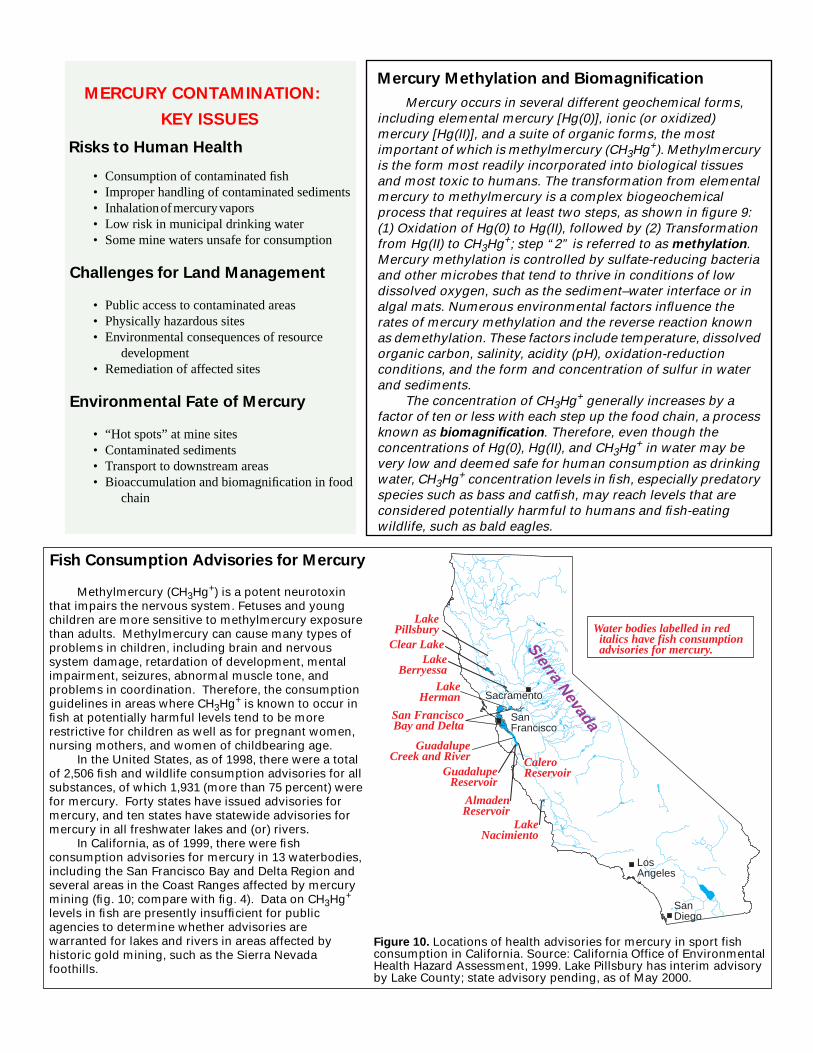
Water bodies labelled in red italics have fish consumption advisories for mercury.
San FranciscoBay and Delta
Sierra Nevada
Figure 10.
Locations of health advisories for mercury in sport fish consumption in California. Source: California Office of Environmental Health Hazard Assessment, 1999. Lake Pillsbury has interim advisory by Lake County; state advisory pending, as of May 2000.
MERCURY CONTAMINATION:
KEY ISSUES
Risks to Human Health
• Consumption of contaminated fish• Improper handling of contaminated sediments• Inhalation of mercury vapors • Low risk in municipal drinking water • Some mine waters unsafe for consumption
Challenges for Land Management
• Public access to contaminated areas• Physically hazardous sites• Environmental consequences of resource
development• Remediation of affected sites
Environmental Fate of Mercury
• “Hot spots” at mine sites• Contaminated sediments• Transport to downstream areas• Bioaccumulation and biomagnification in food
chain
Mercury Methylation and Biomagnification
Mercury occurs in several different geochemical forms, including elemental mercury [Hg(0)], ionic (or oxidized) mercury [Hg(II)], and a suite of organic forms, the most important of which is methylmercury (CH
3
Hg
+
). Methylmercury is the form most readily incorporated into biological tissues and most toxic to humans. The transformation from elemental mercury to methylmercury is a complex biogeochemical process that requires at least two steps, as shown in figure 9: (1) Oxidation of Hg(0) to Hg(II), followed by (2) Transformation from Hg(II) to CH
3
Hg
+
; step “2” is referred to as
methylation
. Mercury methylation is controlled by sulfate-reducing bacteria and other microbes that tend to thrive in conditions of low dissolved oxygen, such as the sediment–water interface or in algal mats. Numerous environmental factors influence the rates of mercury methylation and the reverse reaction known as demethylation. These factors include temperature, dissolved organic carbon, salinity, acidity (pH), oxidation-reduction conditions, and the form and concentration of sulfur in water and sediments.
The concentration of CH
3
Hg
+
generally increases by a factor of ten or less with each step up the food chain, a process known as
biomagnification
. Therefore, even though the concentrations of Hg(0), Hg(II), and CH
3
Hg
+
in water may be very low and deemed safe for human consumption as drinking water, CH
3
Hg
+
concentration levels in fish, especially predatory species such as bass and catfish, may reach levels that are considered potentially harmful to humans and fish-eating wildlife, such as bald eagles.
Fish Consumption Advisories for Mercury
Methylmercury (CH
3
Hg
+
) is a potent neurotoxin that impairs the nervous system. Fetuses and young children are more sensitive to methylmercury exposure than adults. Methylmercury can cause many types of problems in children, including brain and nervous system damage, retardation of development, mental impairment, seizures, abnormal muscle tone, and problems in coordination. Therefore, the consumption guidelines in areas where CH
3
Hg
+
is known to occur in fish at potentially harmful levels tend to be more restrictive for children as well as for pregnant women, nursing mothers, and women of childbearing age.
In the United States, as of 1998, there were a total of 2,506 fish and wildlife consumption advisories for all substances, of which 1,931 (more than 75 percent) were for mercury. Forty states have issued advisories for mercury, and ten states have statewide advisories for mercury in all freshwater lakes and (or) rivers.
In California, as of 1999, there were fish consumption advisories for mercury in 13 waterbodies, including the San Francisco Bay and Delta Region and several areas in the Coast Ranges affected by mercury mining (fig. 10; compare with fig. 4). Data on CH
3
Hg
+
levels in fish are presently insufficient for public agencies to determine whether advisories are warranted for lakes and rivers in areas affected by historic gold mining, such as the Sierra Nevada foothills.
USGS Fact Sheet FS-061-00May 2000
U.S. Department of the InteriorU.S. Geological Survey
U. S. DEPARTMENT OF THE INTERIORBUREAU OF LAND MANAGEMENT
Cooperating Agencies
Nevada CountyResource Conservation
District
Bureau of LandManagement
U.S. Forest Service
U.S. Environmental Protection Agency
CaliforniaState Water Resources
Control Board
CaliforniaDepartment of Conservation
California Department of Parks
and Recreation
References Cited
Averill, C.V., 1946, Placer mining for gold in California: California State Division of Mines and Geology Bulletin 135, 336 p.
Bowie, A.J., 1905, A practical treatise on hydraulic mining in California: New York, Van Nostrand, 313 p.
Bradley, E.M., 1918, Quicksilver resources of the state of California: California State Mining Bureau Bulletin 78, 389 p.
California Office of Environmental Health Hazard Assessment, 1999, California Sport Fish Consumption Advisories, 1999: Sacramento, Calif., 9 p.
Churchill, R., 1999, Insights into California mercury production and mercury availability for the gold mining industry from the historical record: Geological Society of America Abstracts with Programs, v. 31, no. 6, p. 45.
Hunerlach, M.P., Rytuba, J.J., and Alpers, C.N., 1999, Mercury contamination from hydraulic placer-gold mining in the Dutch Flat mining district, California: U.S. Geological Survey Water-Resources Investigations Report 99-4018B, p. 179-189.
Long, K.R., DeYoung, J.H., Jr., and Ludington, S.D., 1998, Database of significant deposits of gold, silver, copper, lead, and zinc in the United States: U.S. Geological Survey Open-File Report 98-206A, 33 p.
Slotton, D.G., Ayers, S.M., Reuter, J.E., and Goldman, C.R., 1997, Gold mining impacts on food chain mercury in northwestern Sierra Nevada streams (1997 revision), Appendix B
in
Larry Walker Associates, 1997, Sacramento River watershed mercury control planning project—report for the Sacramento Regional County Sanitation District, 74 p.
.
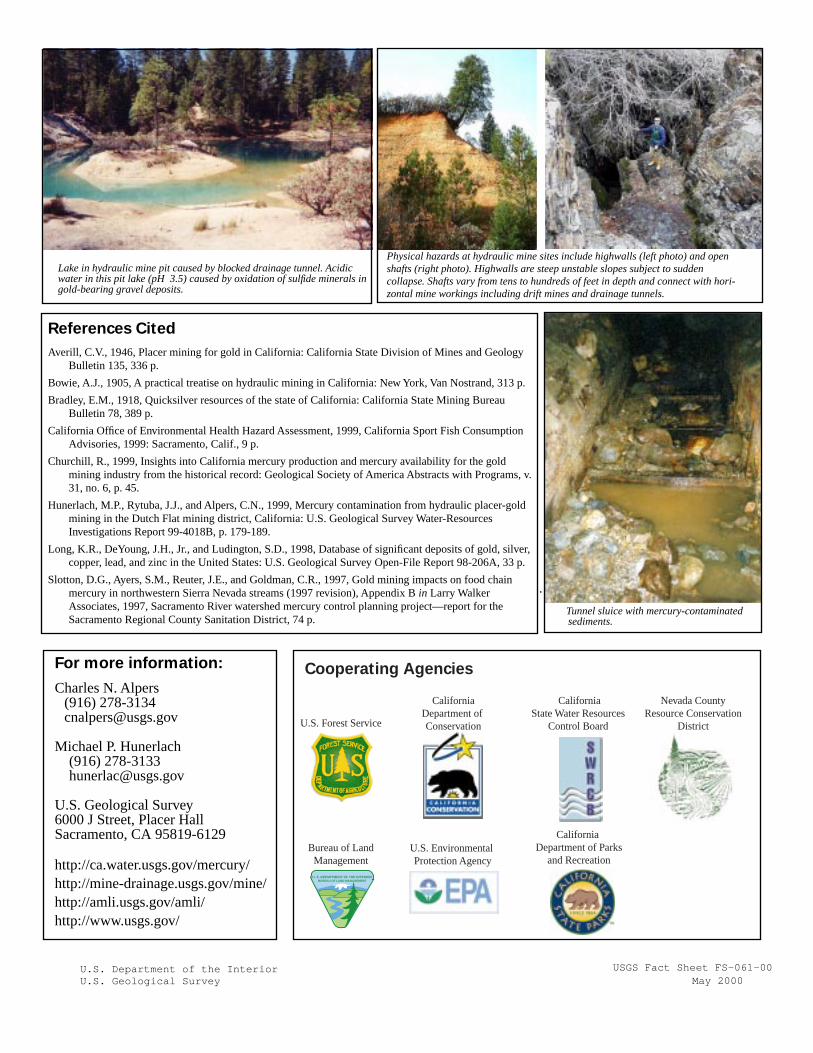
Physical hazards at hydraulic mine sites include highwalls (left photo) and open shafts (right photo). Highwalls are steep unstable slopes subject to sudden collapse. Shafts vary from tens to hundreds of feet in depth and connect with hori-zontal mine workings including drift mines and drainage tunnels.
For more information:
Charles N. Alpers(916) 278-3134 [email protected]
Michael P. Hunerlach(916) [email protected]
U.S. Geological Survey6000 J Street, Placer HallSacramento, CA 95819-6129
http://ca.water.usgs.gov/mercury/http://mine-drainage.usgs.gov/mine/http://amli.usgs.gov/amli/http://www.usgs.gov/
Lake in hydraulic mine pit caused by blocked drainage tunnel. Acidic water in this pit lake (pH 3.5) caused by oxidation of sulfide minerals in gold-bearing gravel deposits.
Tunnel sluice with mercury-contaminated sediments.
Recommended