ESTIMATED SOFT X-RAY SPECTRUM AND IONIZATION OF
MOLECULAR HYDROGEN IN THE CENTRAL
MOLECULAR ZONE OF THE GALACTIC CENTER
Masahiro Notani and Takeshi Oka
Department of Astronomy and Astrophysics, and Department of Chemistry, the Enrico Fermi InstituteUniversity of Chicago
Research Background
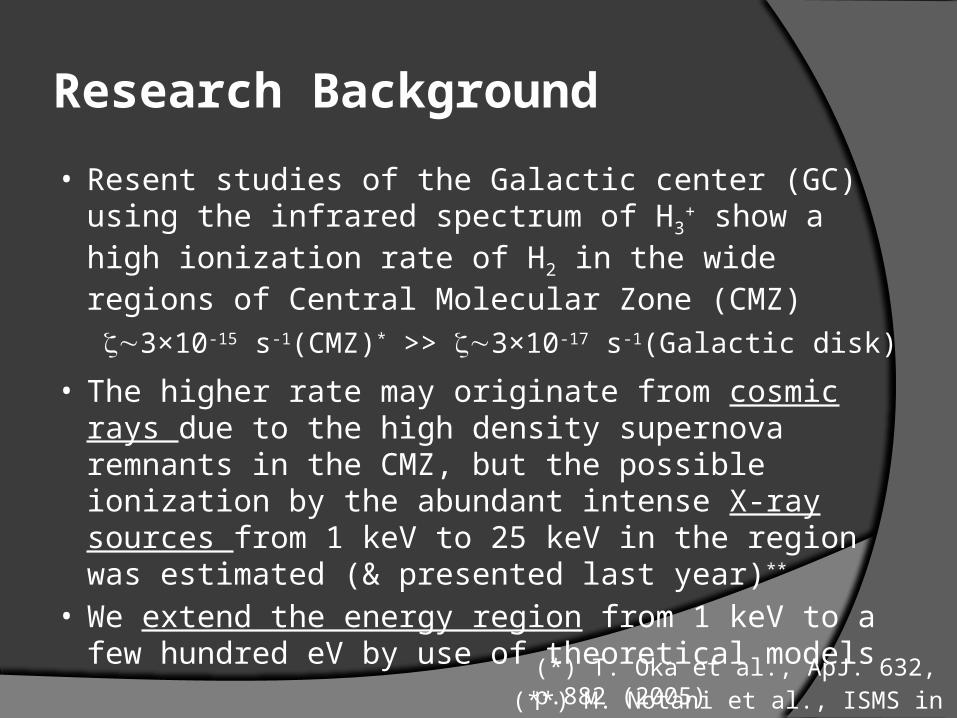
• Resent studies of the Galactic center (GC) using the infrared spectrum of H3
+ show a high ionization rate of H2 in the wide regions of Central Molecular Zone (CMZ)
3×10-15 s-1(CMZ)* >> 3×10-17 s-1(Galactic disk)
• The higher rate may originate from cosmic rays due to the high density supernova remnants in the CMZ, but the possible ionization by the abundant intense X-ray sources from 1 keV to 25 keV in the region was estimated (& presented last year)**
• We extend the energy region from 1 keV to a few hundred eV by use of theoretical models(*) T. Oka et al., ApJ. 632, p.882 (2005)
(**) M. Notani et al., ISMS in OHIO (2013)
Purpose of this research
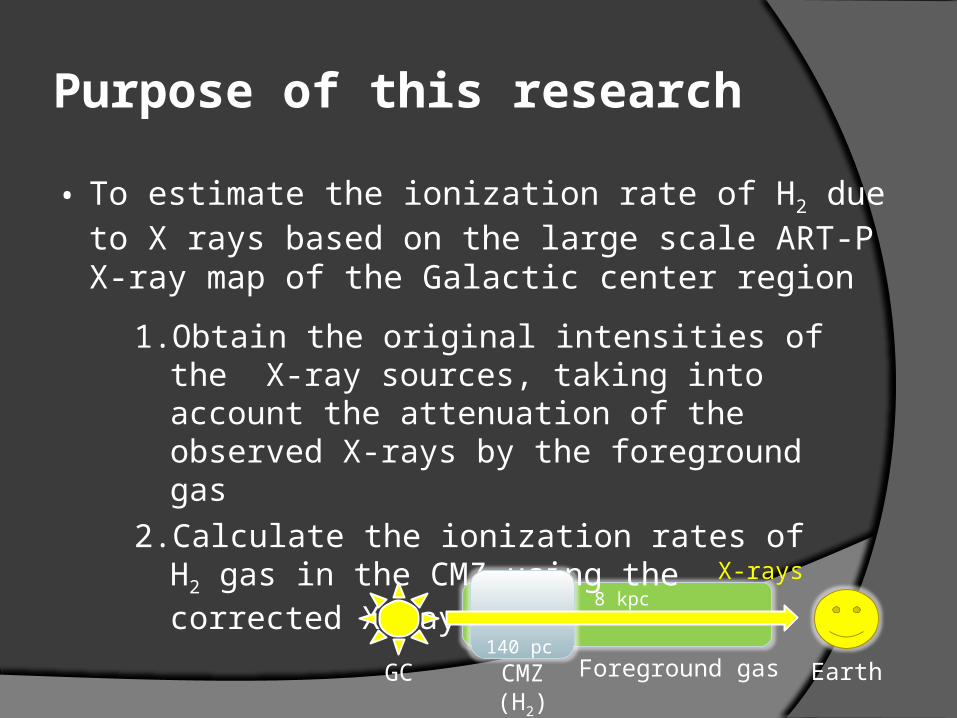
• To estimate the ionization rate of H2 due to X rays based on the large scale ART-P X-ray map of the Galactic center region
1. Obtain the original intensities of the X-ray sources, taking into account the attenuation of the observed X-rays by the foreground gas
2. Calculate the ionization rates of H2 gas in the CMZ using the corrected X-ray flux
X-rays
EarthGC CMZ(H2)
Foreground gas
8 kpc
140 pc
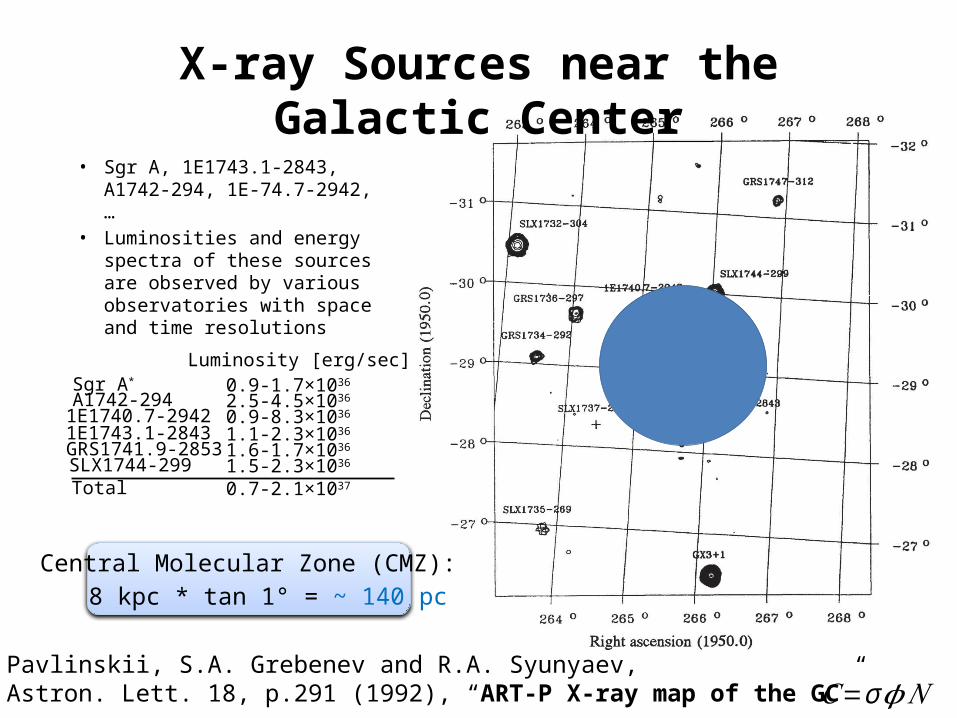
X-ray Sources near the Galactic Center• Sgr A, 1E1743.1-2843, A1742-
294, 1E-74.7-2942, …• Luminosities and energy
spectra of these sources are observed by various observatories with space and time resolutions
M.N. Pavlinskii, S.A. Grebenev and R.A. Syunyaev,Sov. Astron. Lett. 18, p.291 (1992), “ART-P X-ray map of the GC”
8 kpc * tan 1° = ~ 140 pcCentral Molecular Zone (CMZ):
Sgr A* 0.9-1.7×1036
A1742-294 2.5-4.5×1036
1E1740.7-2942 0.9-8.3×1036
1E1743.1-2843 1.1-2.3×1036
Luminosity [erg/sec]
Total 0.7-2.1×1037
GRS1741.9-2853 1.6-1.7×1036
SLX1744-299 1.5-2.3×1036
𝐶=σ𝝓𝑁
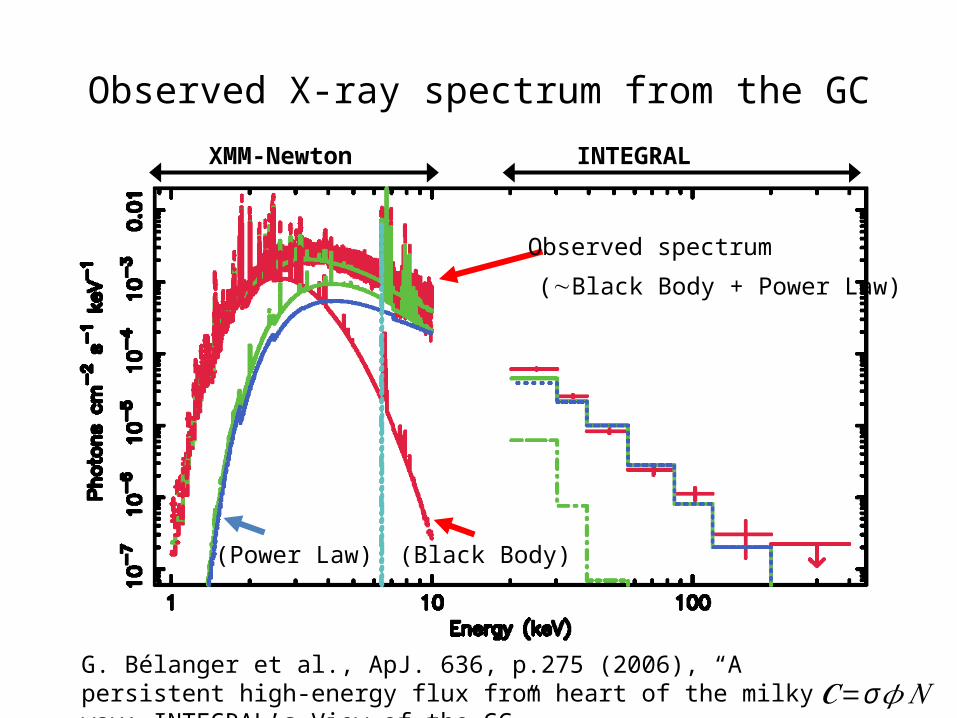
Observed X-ray spectrum from the GC
G. Bélanger et al., ApJ. 636, p.275 (2006), “A persistent high-energy flux from heart of the milky way: INTEGRAL’s View of the GC”
Observed spectrum
(Power Law) (Black Body)
INTEGRALXMM-Newton
(Black Body + Power Law)
𝑪=σ 𝜙𝑁
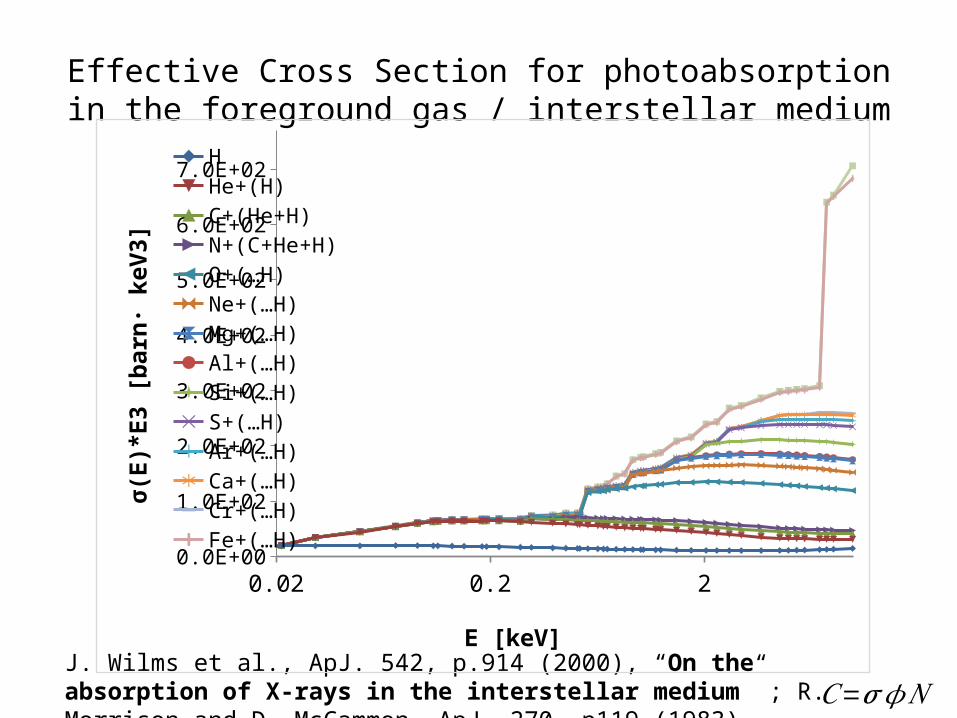
Effective Cross Section for photoabsorption in the foreground gas / interstellar medium
J. Wilms et al., ApJ. 542, p.914 (2000), “On the absorption of X-rays in the interstellar medium” ; R. Morrison and D. McCammon, ApJ. 270, p119 (1983)
0.02 0.2 20.0E+00
1.0E+02
2.0E+02
3.0E+02
4.0E+02
5.0E+02
6.0E+02
7.0E+02HHe+(H)C+(He+H)N+(C+He+H)O+(…H)Ne+(…H)Mg+(…H)Al+(…H)Si+(…H)S+(…H)Ar+(…H)Ca+(…H)Cr+(…H)Fe+(…H)Ni+(…H)
E [keV]
σ(E)
*E3
[bar
n· k
eV3]
𝐶=𝝈𝜙 𝑁
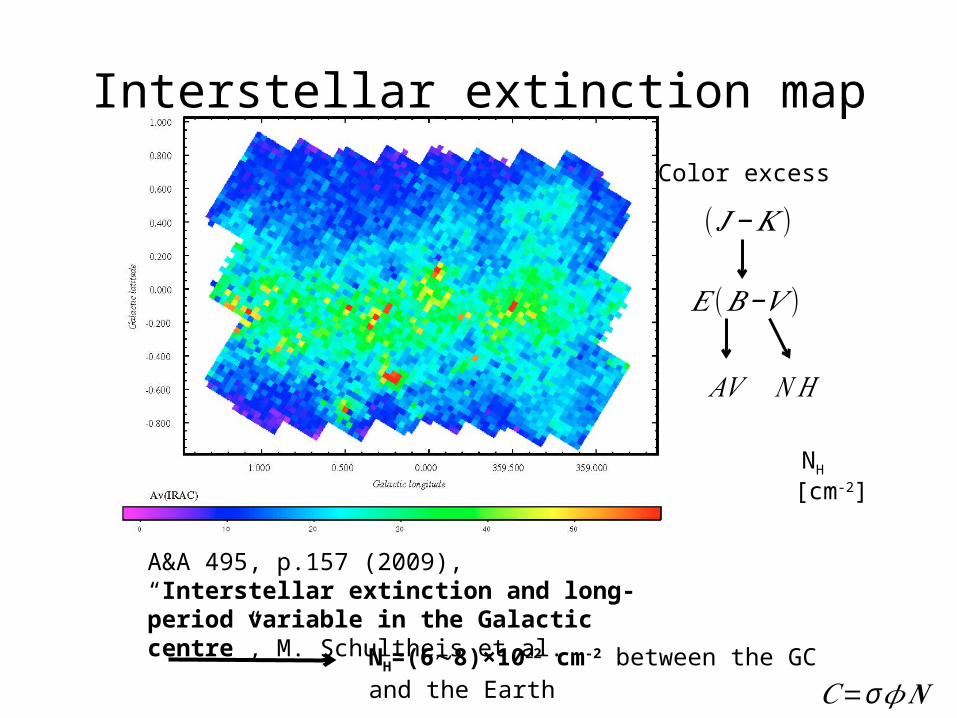
Interstellar extinction map
NH=(68)×1022 cm-2 between the GC and the Earth
A&A 495, p.157 (2009), “Interstellar extinction and long-period variable in the Galactic centre”, M. Schultheis et al.
NH
Color excess
𝐸 (𝐵−𝑉 )
( 𝐽−𝐾 )
𝐴𝑉 𝑁𝐻
[cm-2]
𝐶=σ 𝜙𝑵
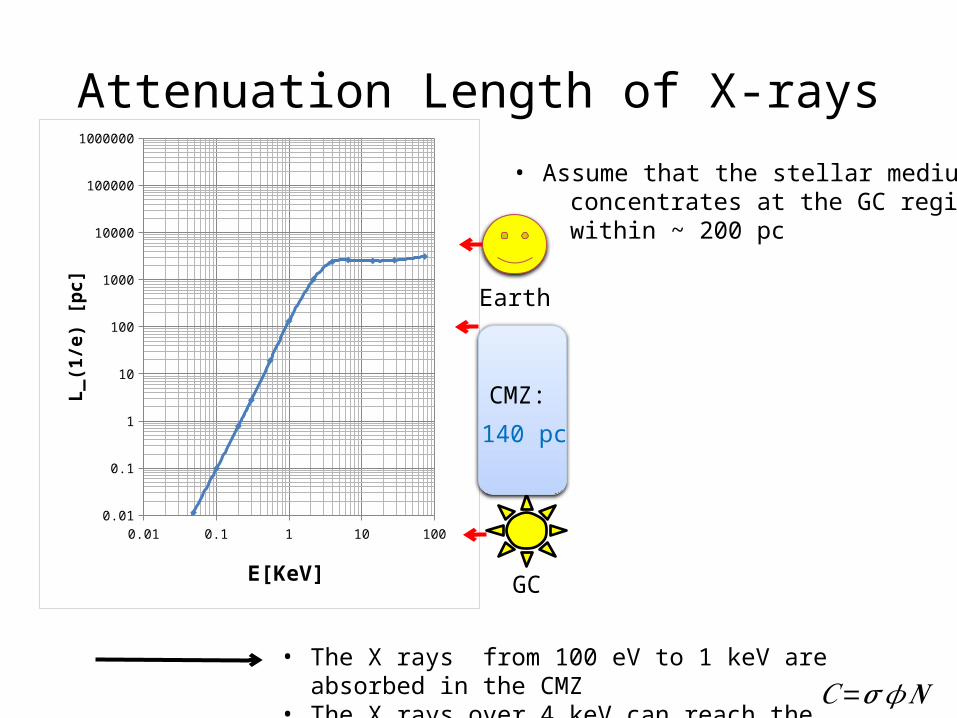
Attenuation Length of X-rays
• The X rays from 100 eV to 1 keV are absorbed in the CMZ• The X rays over 4 keV can reach the Earth
• Assume that the stellar medium concentrates at the GC region within ~ 200 pc
0.01 0.1 1 10 1000.01
0.1
1
10
100
1000
10000
100000
1000000
E[KeV]
L_(1
/e) [
pc] Earth
GC
140 pc
CMZ:
𝐶=𝝈𝜙𝑵
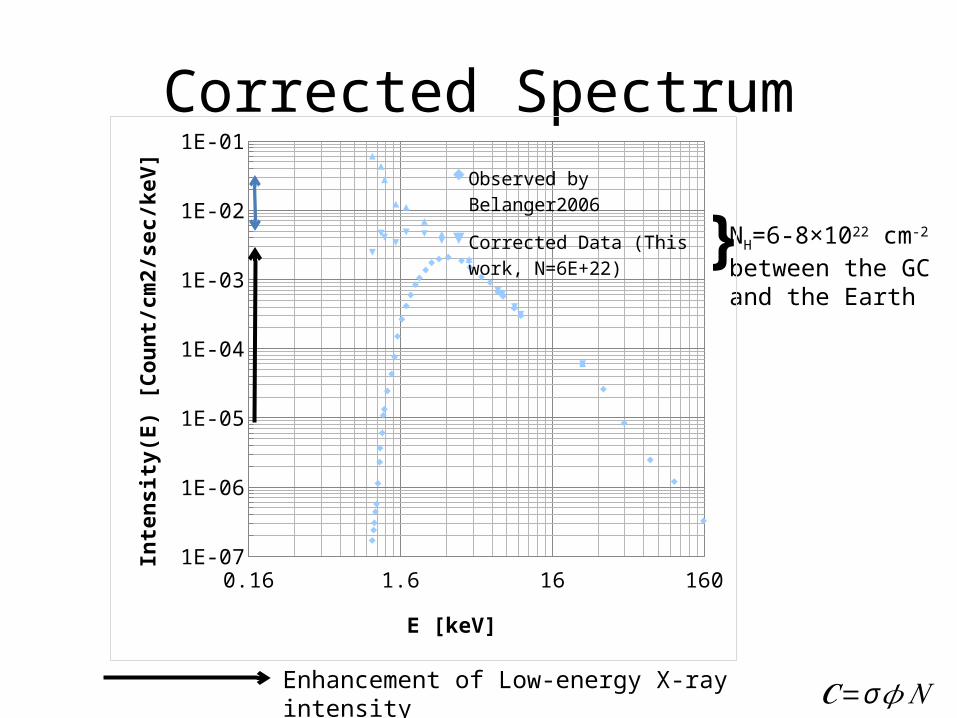
Corrected Spectrum
NH=6-8×1022 cm-2
between the GCand the Earth
𝑪=σ 𝜙𝑁
0.16 1.6 16 1601E-07
1E-06
1E-05
1E-04
1E-03
1E-02
1E-01
Observed by Belanger2006
Corrected Data (This work, N=6E+22)
Corrected Data (This work, N=8E+22)
E [keV]
Inte
nsity
(E) [
Coun
t/cm
2/se
c/ke
V]
Enhancement of Low-energy X-ray intensity
}
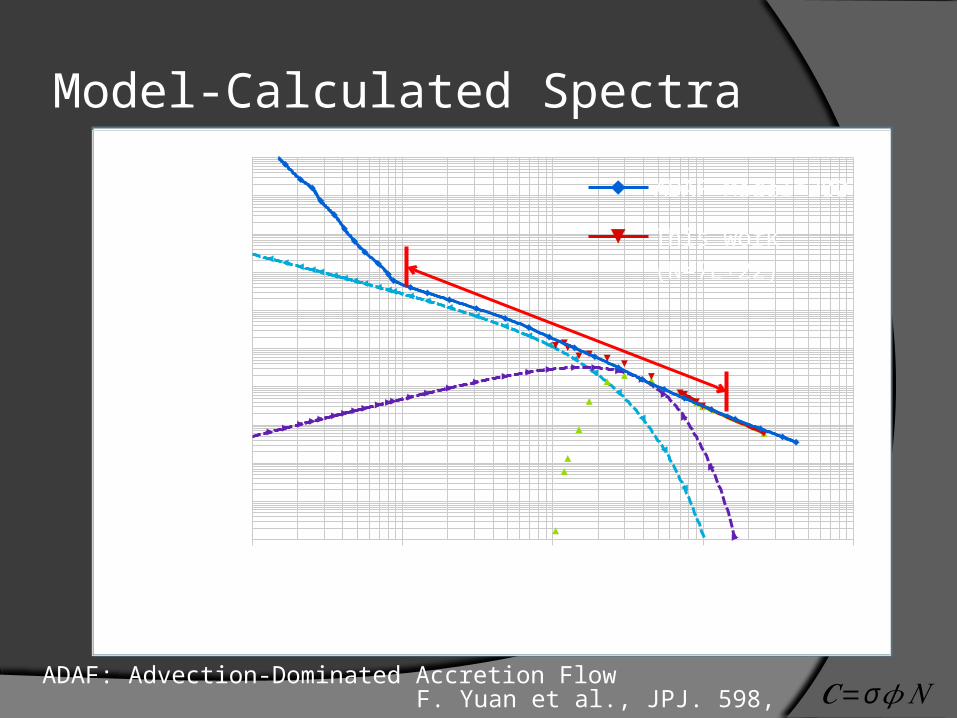
ADAF: Advection-Dominated Accretion Flow
Model-Calculated Spectra
𝑪=σ 𝜙𝑁F. Yuan et al., JPJ. 598, p301(2003)
0.01 0.1 1 10 1001E-07
1E-06
1E-05
1E-04
1E-03
1E-02
1E-01
1E+00
1E+01
1E+02
1E+03ADAF Model*200This work (N=7E+22)Observation (ART-P)Blackbody(1keV)
hν [keV]
fE [p
hoto
ns/s
/cm
2/ke
V]
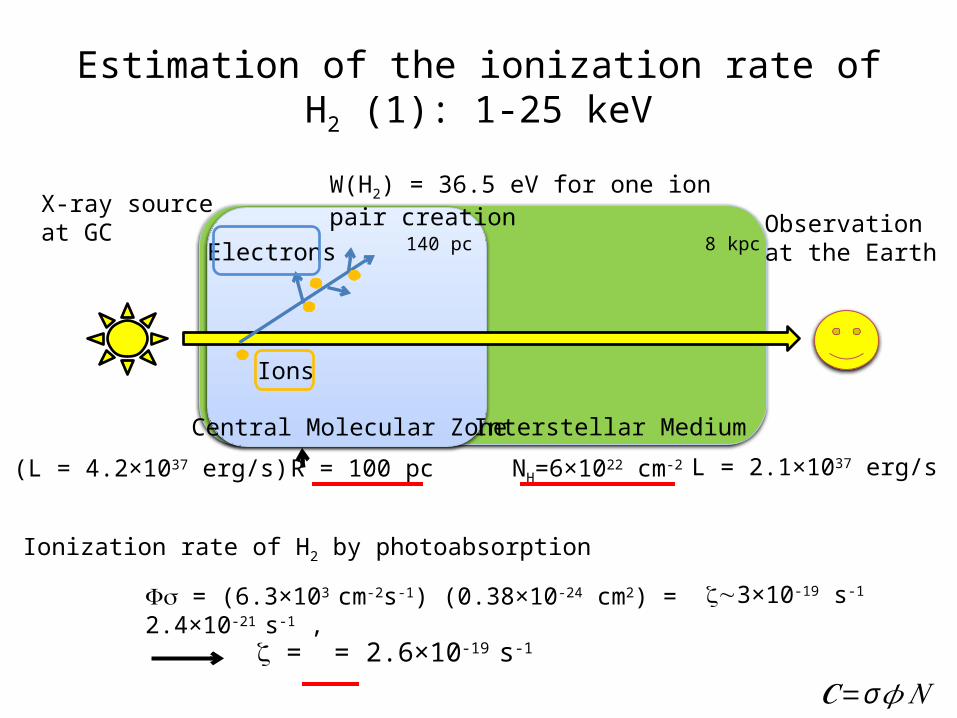
(L = 4.2×1037 erg/s)
X-ray sourceat GC
L = 2.1×1037 erg/s
Central Molecular Zone
Electrons
Ions
Estimation of the ionization rate of H2 (1): 1-25 keV
R = 100 pc
Interstellar Medium
NH=6×1022 cm-2
Observationat the Earth
Ionization rate of H2 by photoabsorption
Fs = (6.3×103 cm-2s-1) (0.38×10⁻²⁴ cm2) = 2.4×10⁻²¹ s-1 , 3×10-19 s-1
= = 2.6×10⁻¹⁹ s-1
W(H2) = 36.5 eV for one ion pair creation
8 kpc140 pc
𝑪=σ 𝜙𝑁
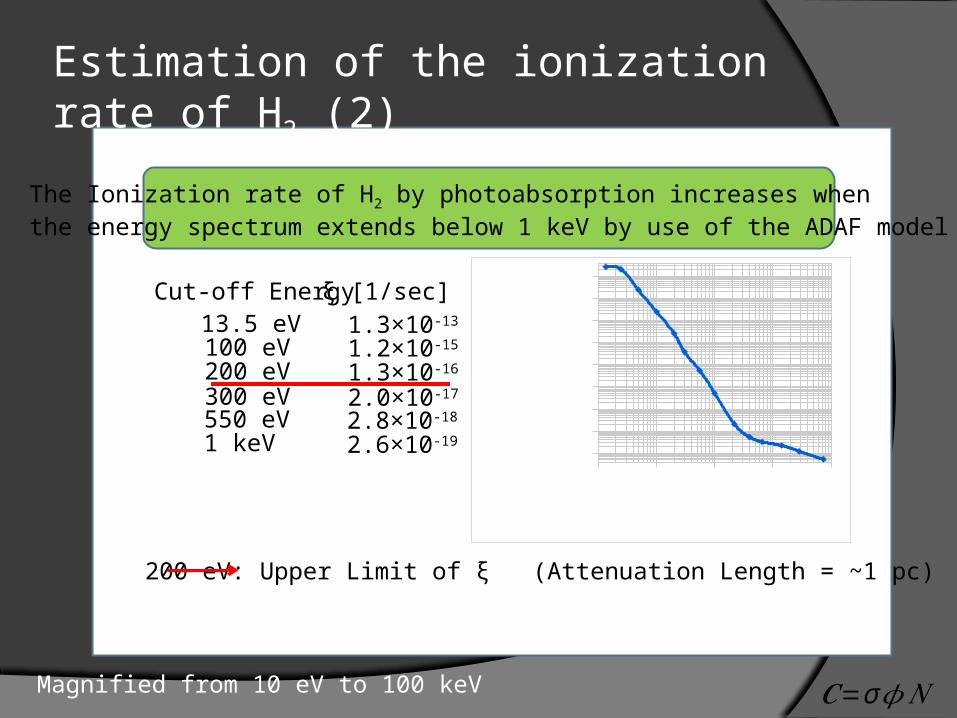
Magnified from 10 eV to 100 keV
Estimation of the ionization rate of H2 (2)
𝑪=σ 𝜙𝑁
13.5 eV 1.3×10⁻¹³
100 eV 1.2×10⁻¹⁵
200 eV 1.3×10⁻¹⁶
300 eV 2.0×10⁻¹⁷
ξ [1/sec]
550 eV1 keV
Cut-off Energy
2.8×10⁻¹⁸
2.6×10⁻¹⁹
The Ionization rate of H2 by photoabsorption increases whenthe energy spectrum extends below 1 keV by use of the ADAF model
0.01 0.1 1 10 100
5E-22
5E-21
5E-20
5E-19
5E-18
5E-17
5E-16
5E-15
5E-14
E [keV]Re
actio
n Ra
te, ξ
[1/
sec]
200 eV: Upper Limit of ξ (Attenuation Length = ~1 pc)
Result of this work
Obtained the oritinal luminosity of X-rays with the energy spectrum from the observation above 1keV as well as the model calculation below 1 keV
Considered multiple ionization process by an electron emitted from H due to X-ray photoabsorbtion. The energy value of one ion pair production (W-value): 36.5 eV
We obtained 3×10-19 s-1 from our previous work above 1 keV, and a new value of 1.3×10-
16 s-1 for 0.2 keV (cut-off) from the ADAF model<< Infrared spectrum of H3+ : 3×10-15 s-1(CMZ)*
Conclusion
The X-ray ionization rate of 1.3×10⁻¹⁶ s-1 from our calculation is still lower than the recent observation of ionization rate of 3×10-15 s-1 that is obtained from the infrared spectrum of H3
+ . Ionization process of H2 in the CMZ by
Cosmic-ray excitation
Recommended