Embed Size (px)
DESCRIPTION
Dijagram oka
Citation preview

This document is owned by Agilent Technologies, but is no longer kept current and may contain obsolete or
inaccurate references. We regret any inconvenience this may cause. For the latest information on Agilent’s
line of EEsof electronic design automation (EDA) products and services, please go to:
www.agilent.com/fi nd/eesof
Agilent EEsof EDA
Group/Presentation TitleAgilent Restricted
Month ##, 200XPage 1
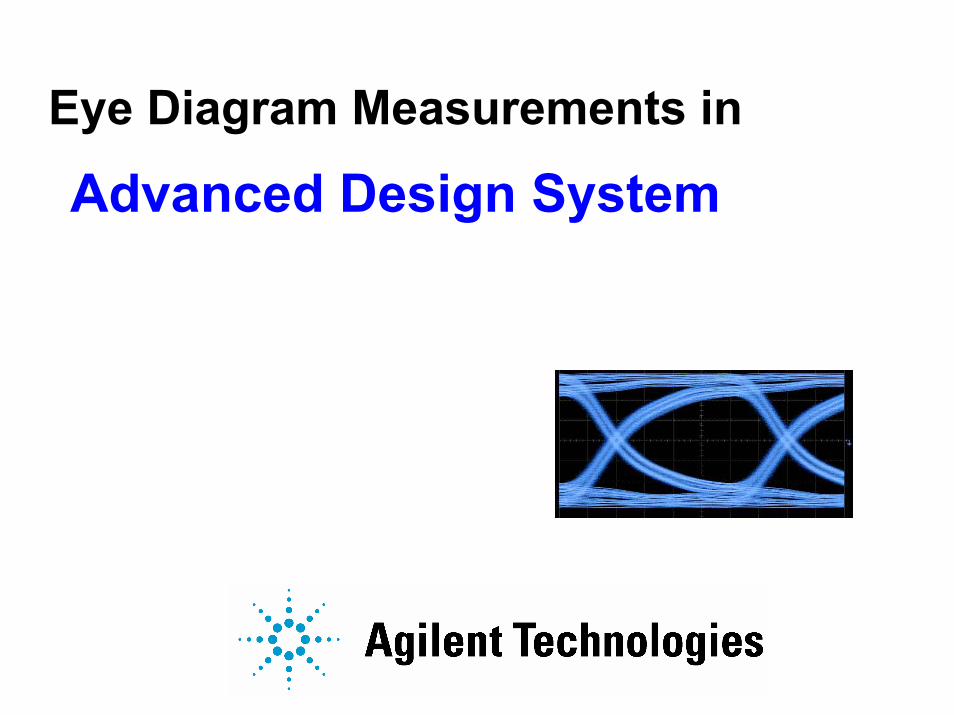
Eye Diagram Measurements in
Advanced Design System
Page 2
Eye Diagram Measurements in ADS
Page 2
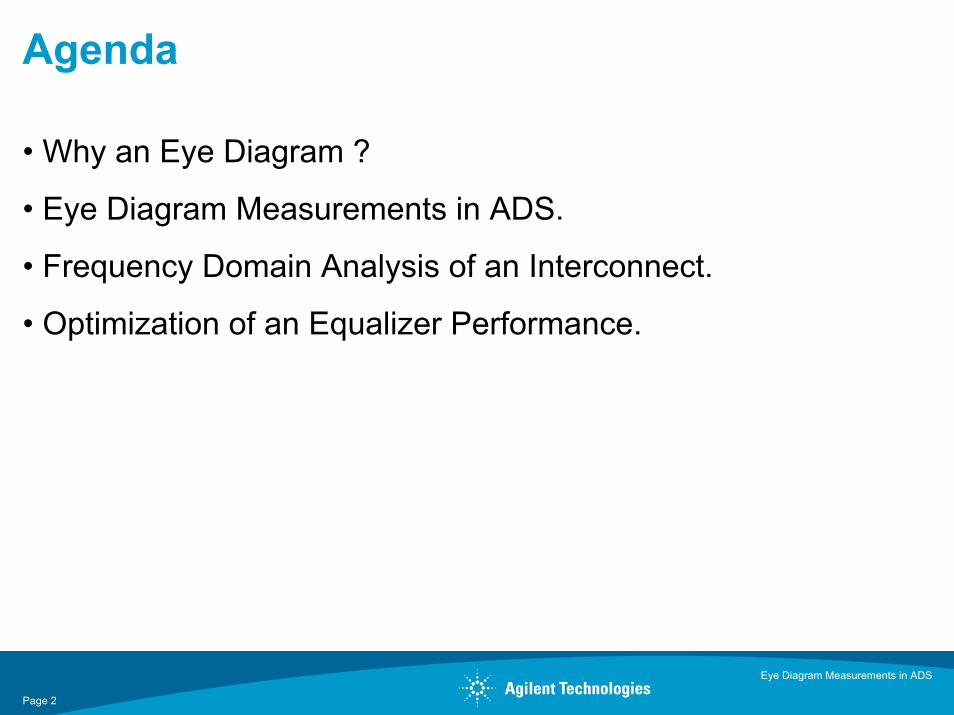
Agenda
• Why an Eye Diagram ?
• Eye Diagram Measurements in ADS.
• Frequency Domain Analysis of an Interconnect.
• Optimization of an Equalizer Performance.
Page 3
Eye Diagram Measurements in ADS
Page 3
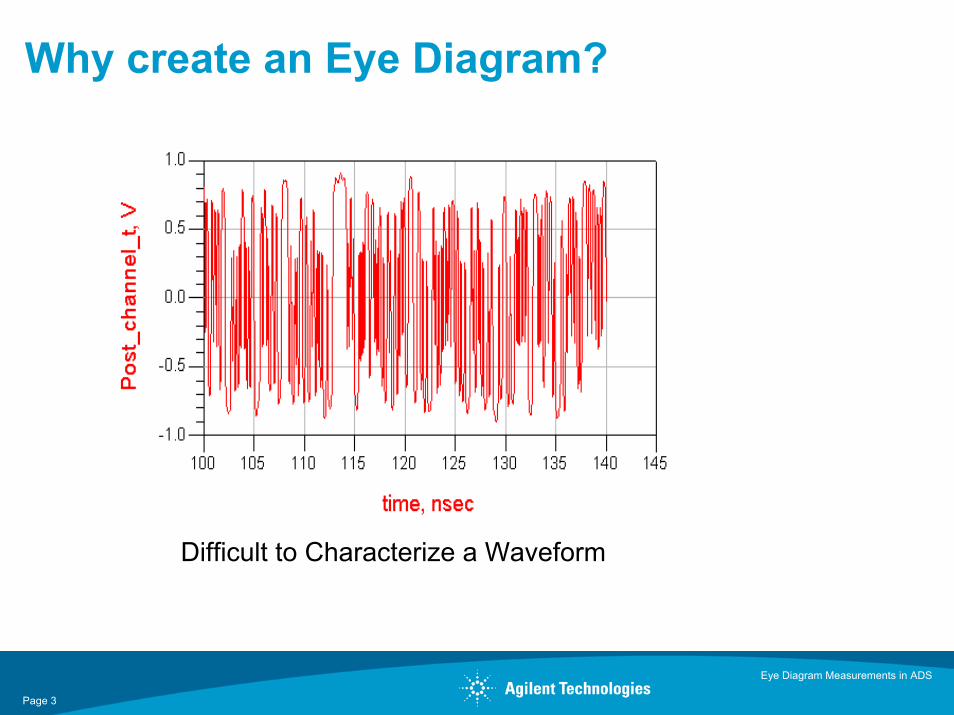
Why create an Eye Diagram?
Difficult to Characterize a Waveform
Page 4
Eye Diagram Measurements in ADS
Page 4
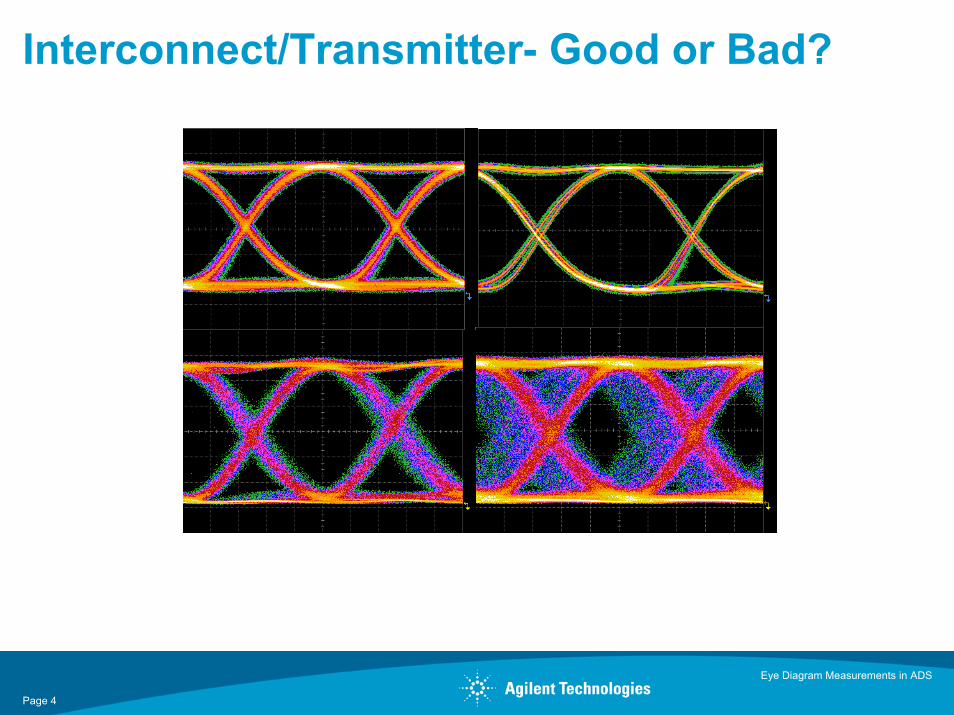
Interconnect/Transmitter- Good or Bad?
Page 5
Eye Diagram Measurements in ADS
Page 5
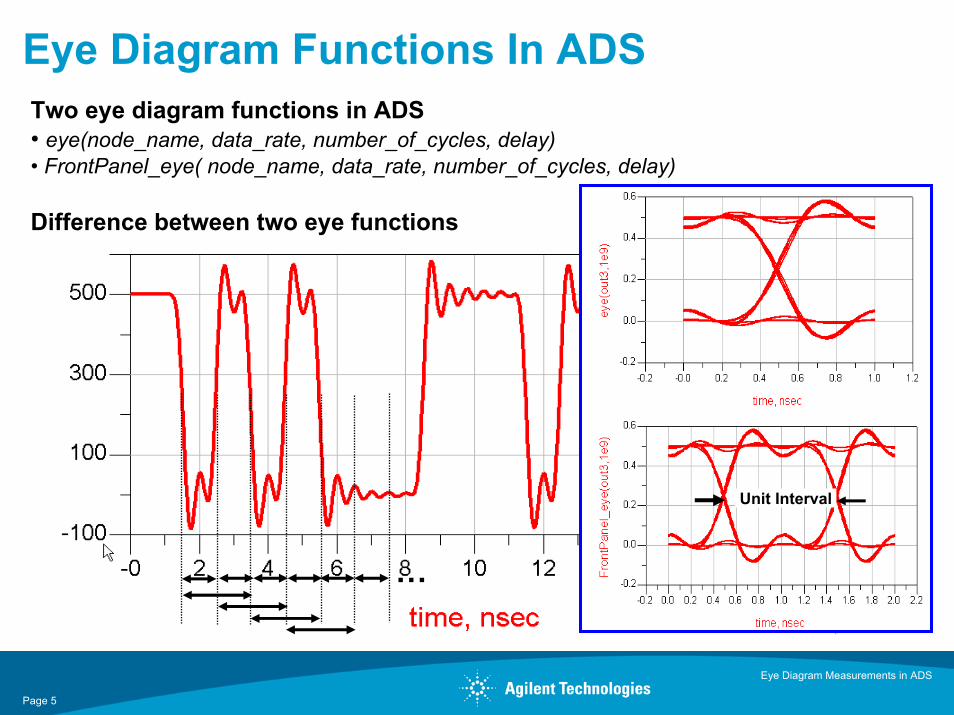
Eye Diagram Functions In ADSTwo eye diagram functions in ADS• eye(node_name, data_rate, number_of_cycles, delay)• FrontPanel_eye( node_name, data_rate, number_of_cycles, delay)
Difference between two eye functions
Unit Interval
…
Page 6
Eye Diagram Measurements in ADS
Page 6
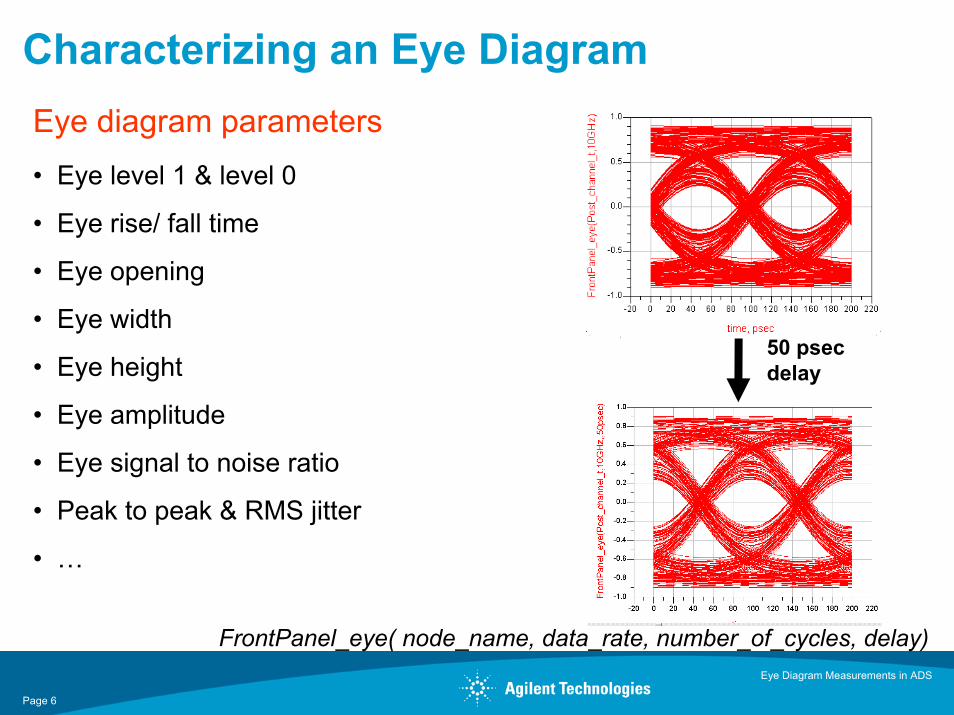
Characterizing an Eye DiagramEye diagram parameters• Eye level 1 & level 0
• Eye rise/ fall time
• Eye opening
• Eye width
• Eye height
• Eye amplitude
• Eye signal to noise ratio
• Peak to peak & RMS jitter
• …
50 psec delay
FrontPanel_eye( node_name, data_rate, number_of_cycles, delay)
Page 7
Eye Diagram Measurements in ADS
Page 7
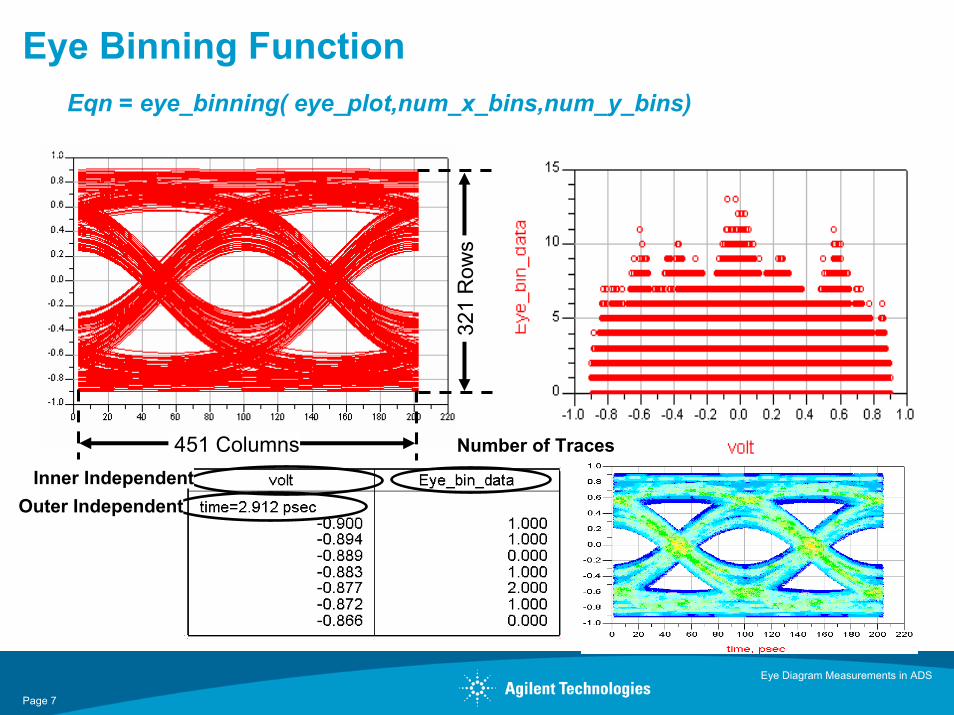
Eye Binning Function
451 Columns32
1 R
ows
Eqn = eye_binning( eye_plot,num_x_bins,num_y_bins)
Outer IndependentInner Independent
Number of Traces

Page 8
Eye Diagram Measurements in ADS
Page 8
Histogram PlotsMajority of Eye calculations are based on histogram plotsTwo types of histograms
• Horizontal histogram - For every time point, sum up the number of traces across vertical binsFrontPanel_eye_horizontal_histogram()
• Vertical histogram – For every amplitude point, sum up the number of points across time axisFrontPanel_eye_vertical_histogram_index()
Statistical calculation• Mean value, Standard Deviation ( 1 σ ), and
Three Standard Deviation ( 3 σ )Frontpanel_get_histogram_mean_stddev ()

Page 9
Eye Diagram Measurements in ADS
Page 9
Calculate Eye DelayEqn=FrontPanel_eye_delay(Waveform_Data,Default_DataRate,Data_Type)Function calculates the time delay required to position eye crossing at the center of the UI (Only applicable to NRZ type data)
Creates Eye DiagramConvert Eye data to bin dataDetermine Max and Min amplitudeCreate horizontal histogram in a narrow stripFind Mean value of horizontal histogramCompare Mean position as compared with UI/2
Calculated Delay
Delay calculation is required for automated eye parameter measurements.Binning the eye diagram makes this calculation easy.
Page 10
Eye Diagram Measurements in ADS
Page 10
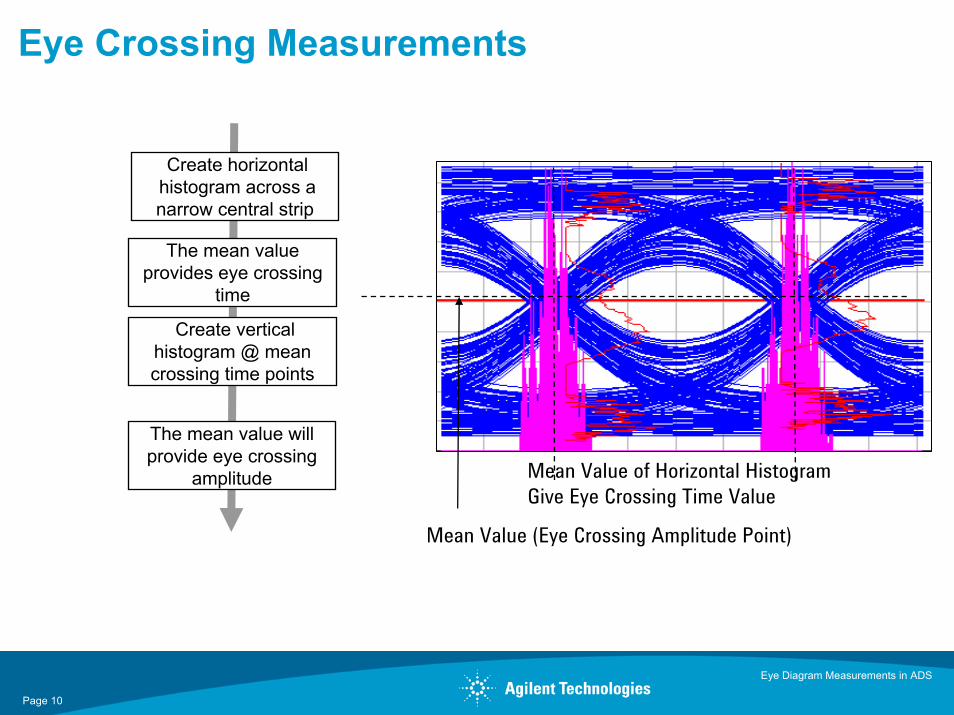
Eye Crossing Measurements
Create horizontal histogram across a narrow central strip
The mean value provides eye crossing
time
Create vertical histogram @ mean crossing time points
The mean value will provide eye crossing
amplitude Mean Value of Horizontal Histogram Give Eye Crossing Time Value
Mean Value (Eye Crossing Amplitude Point)
Page 11
Eye Diagram Measurements in ADS
Page 11
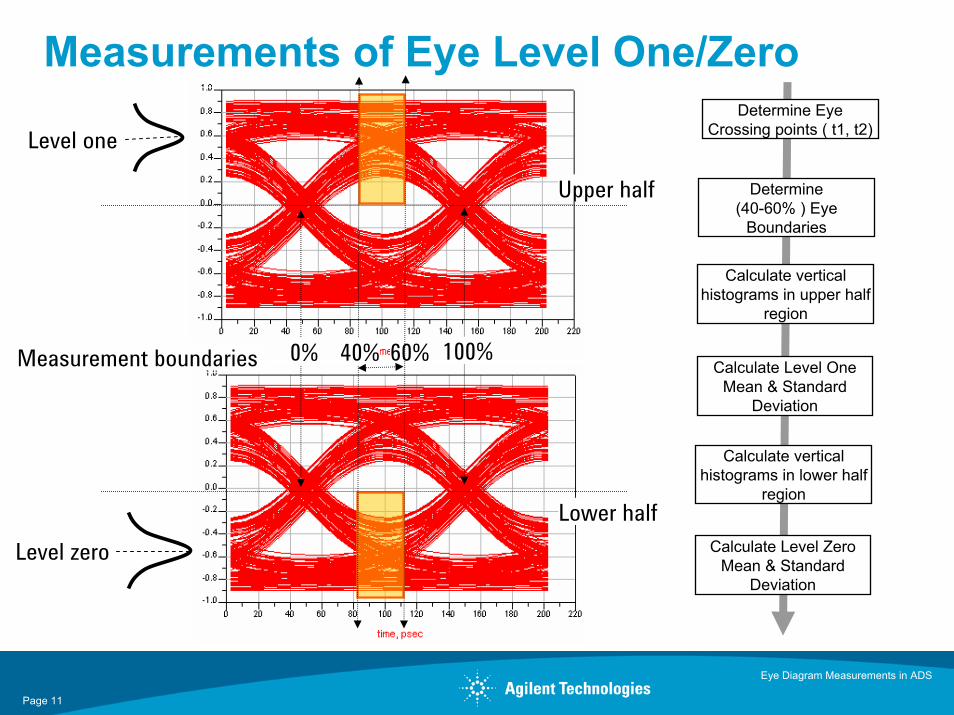
Measurements of Eye Level One/Zero
Level zero
Upper half
Lower half
0% 40% 60%Measurement boundaries
Level one
100%
Determine Eye Crossing points ( t1, t2)
Determine (40-60% ) Eye
Boundaries
Calculate vertical histograms in upper half
region
Calculate Level One Mean & Standard
Deviation
Calculate vertical histograms in lower half
region
Calculate Level Zero Mean & Standard
Deviation
Page 12
Eye Diagram Measurements in ADS
Page 12
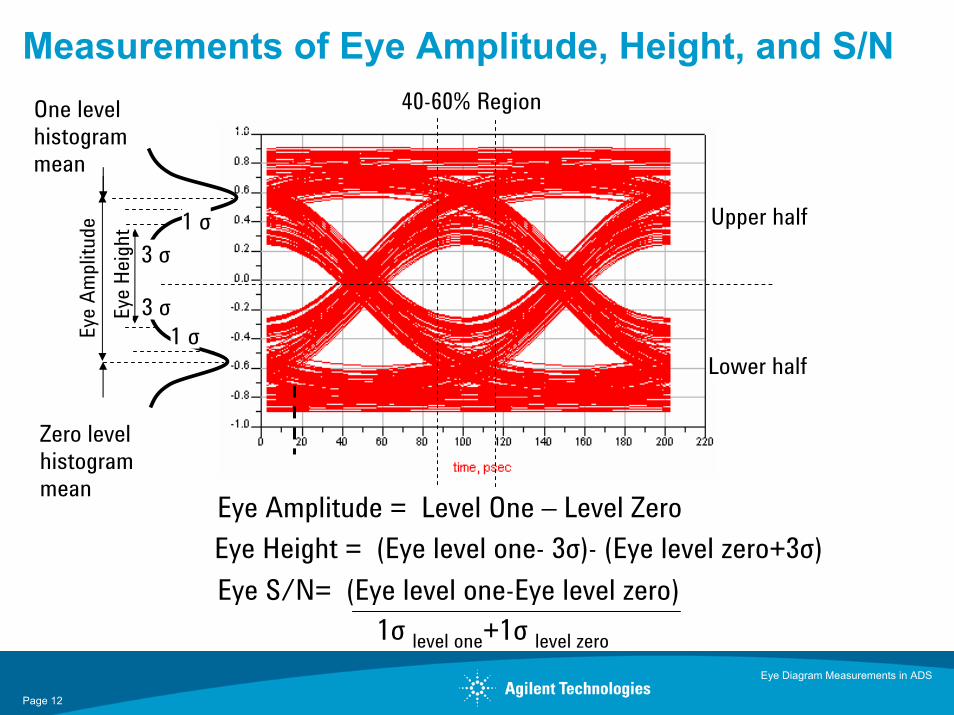
40-60% Region
Zero level histogram mean
Upper half
Lower half
One level histogram mean
Eye Amplitude = Level One – Level Zero
Measurements of Eye Amplitude, Height, and S/NEy
e Am
plitu
de
3 σ
3 σ
Eye Height = (Eye level one- 3σ)- (Eye level zero+3σ)
Eye
Heigh
t
1 σ
1 σ
Eye S/N= (Eye level one-Eye level zero)1σ level one+1σ level zero
Page 13
Eye Diagram Measurements in ADS
Page 13
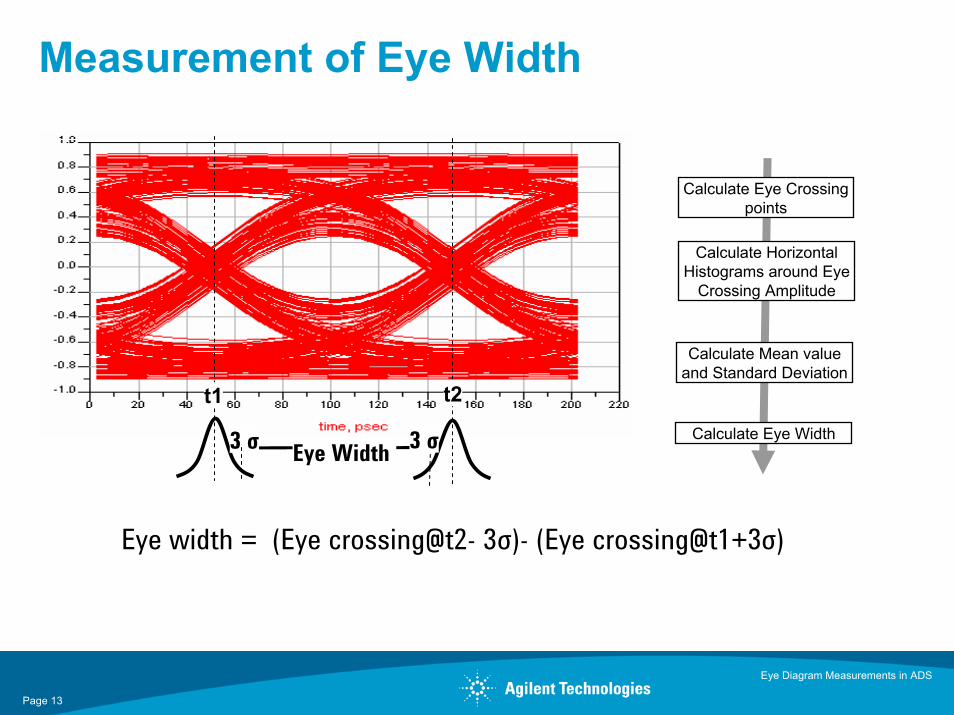
Measurement of Eye Width
Eye width = (Eye crossing@t2- 3σ)- (Eye crossing@t1+3σ)
Eye Width3 σ
t1 t2
3 σ
Calculate Eye Crossing points
Calculate Horizontal Histograms around Eye
Crossing Amplitude
Calculate Mean value and Standard Deviation
Calculate Eye Width
Page 14
Eye Diagram Measurements in ADS
Page 14
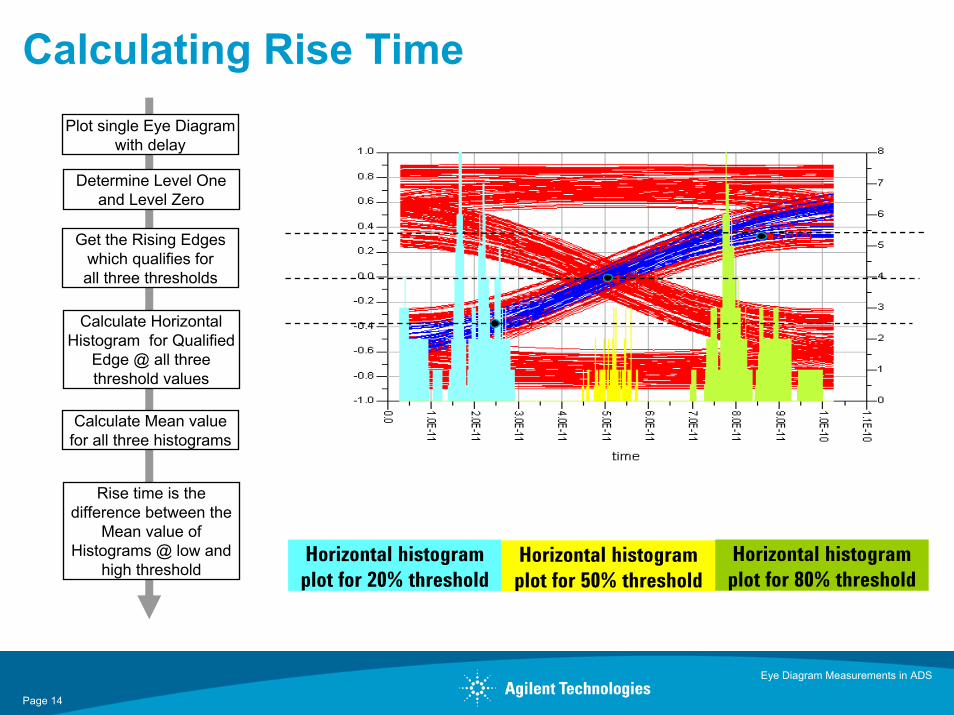
Calculating Rise Time
Horizontal histogram plot for 20% threshold
Horizontal histogram plot for 50% threshold
Horizontal histogram plot for 80% threshold
Plot single Eye Diagram with delay
Determine Level One and Level Zero
Get the Rising Edgeswhich qualifies forall three thresholds
Calculate Horizontal Histogram for Qualified
Edge @ all three threshold values
Calculate Mean value for all three histograms
Rise time is the difference between the
Mean value of Histograms @ low and
high threshold
Page 15
Eye Diagram Measurements in ADS
Page 15
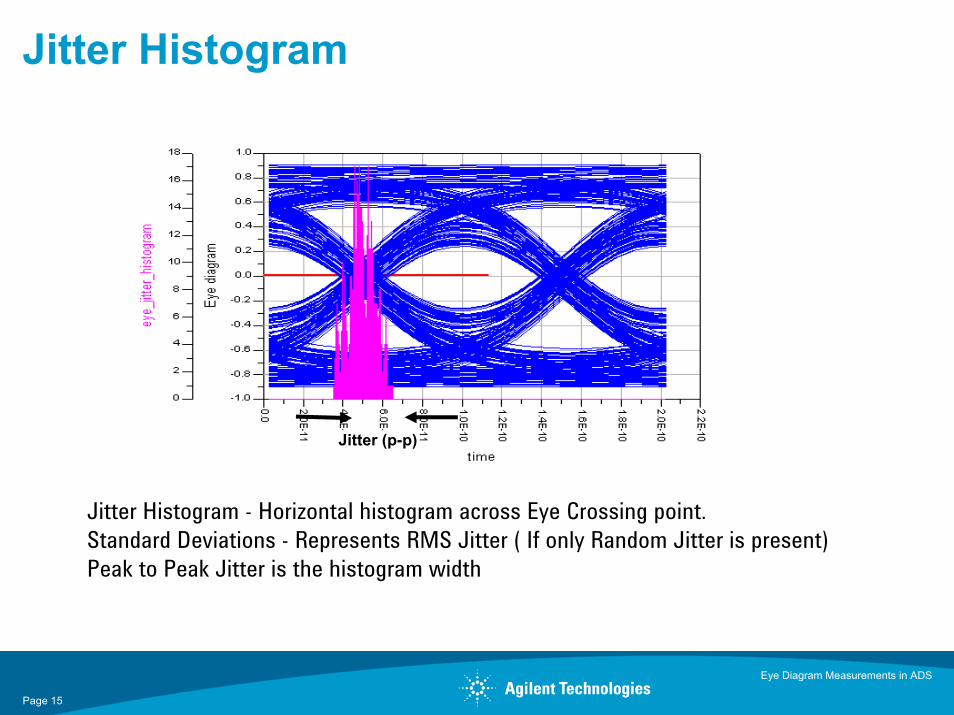
Jitter Histogram
Jitter Histogram - Horizontal histogram across Eye Crossing point.Standard Deviations - Represents RMS Jitter ( If only Random Jitter is present)Peak to Peak Jitter is the histogram width
Jitter (p-p)
Page 16
Eye Diagram Measurements in ADS
Page 16
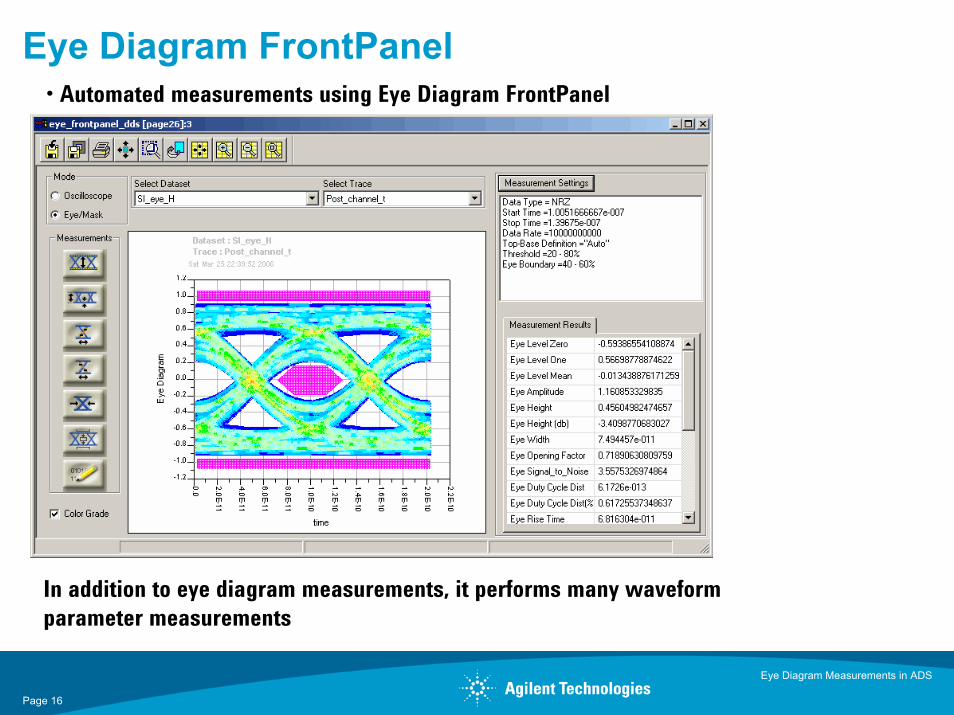
Eye Diagram FrontPanel • Automated measurements using Eye Diagram FrontPanel
In addition to eye diagram measurements, it performs many waveform parameter measurements
Page 17
Eye Diagram Measurements in ADS
Page 17
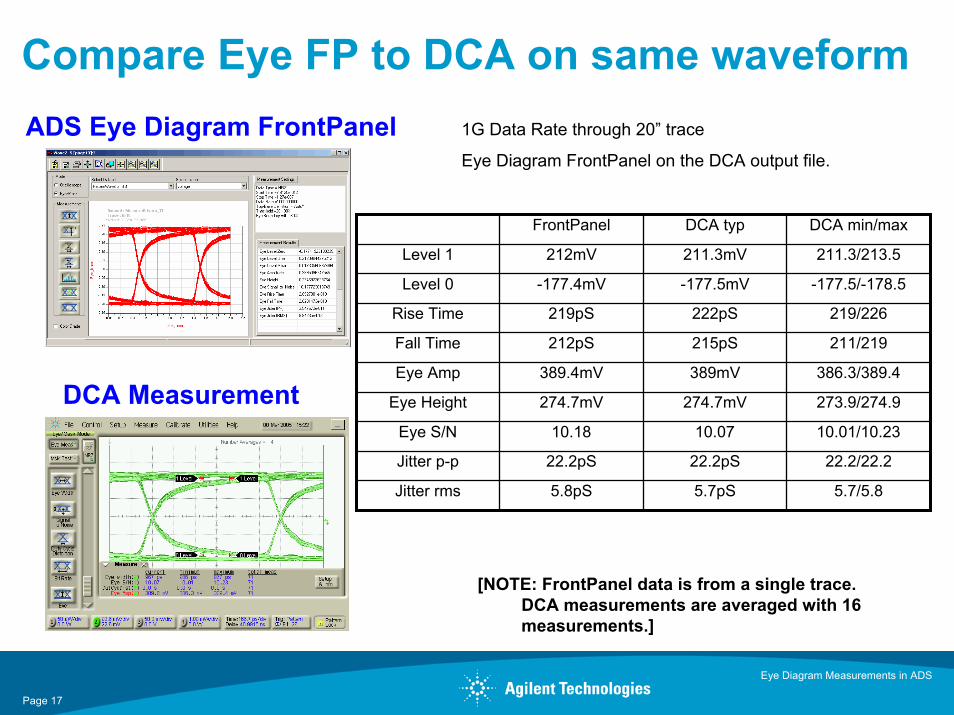
Compare Eye FP to DCA on same waveform
DCA Measurement
1G Data Rate through 20” trace
Eye Diagram FrontPanel on the DCA output file.
[NOTE: FrontPanel data is from a single trace. DCA measurements are averaged with 16 measurements.]
FrontPanel DCA typ DCA min/max
Level 1 212mV 211.3mV 211.3/213.5
Level 0 -177.4mV -177.5mV -177.5/-178.5
Rise Time 219pS 222pS 219/226
Fall Time 212pS 215pS 211/219
Eye Amp 389.4mV 389mV 386.3/389.4
Eye Height 274.7mV 274.7mV 273.9/274.9
Eye S/N 10.18 10.07 10.01/10.23
Jitter p-p 22.2pS 22.2pS 22.2/22.2
Jitter rms 5.8pS 5.7pS 5.7/5.8
ADS Eye Diagram FrontPanel
Page 18
Eye Diagram Measurements in ADS
Page 18
Case Study
Design an equalizer to improve eye diagram performance
– Frequency domain simulator to predict channel performance– Simulation of a channel with equalizer– Optimization of an equalizer for eye performance
Page 19
Eye Diagram Measurements in ADS
Page 19
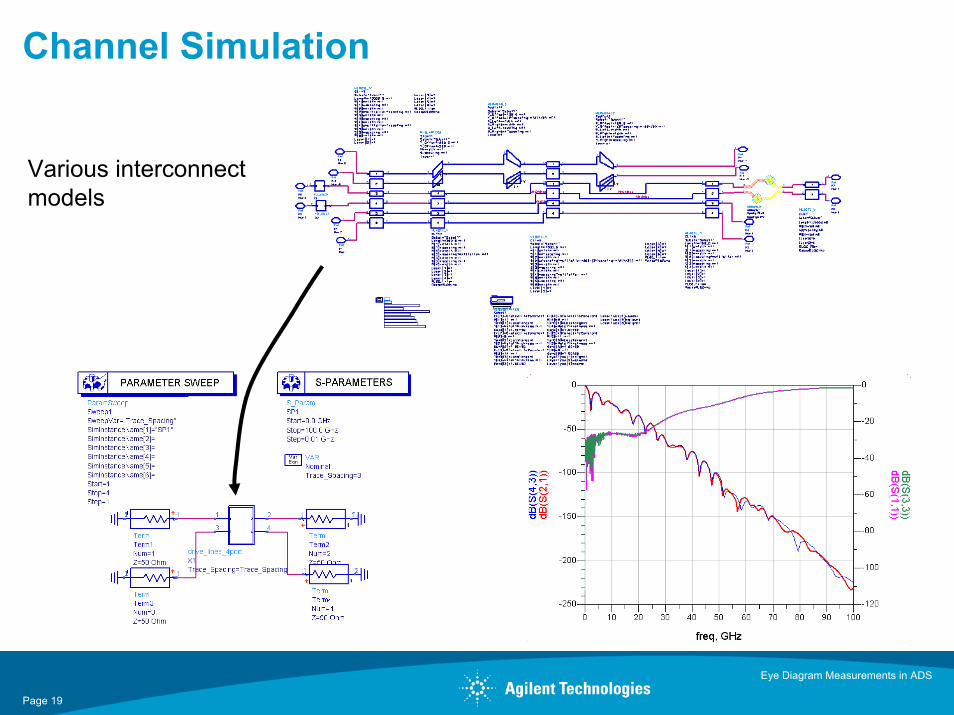
Channel Simulation
Various interconnect models
Page 20
Eye Diagram Measurements in ADS
Page 20
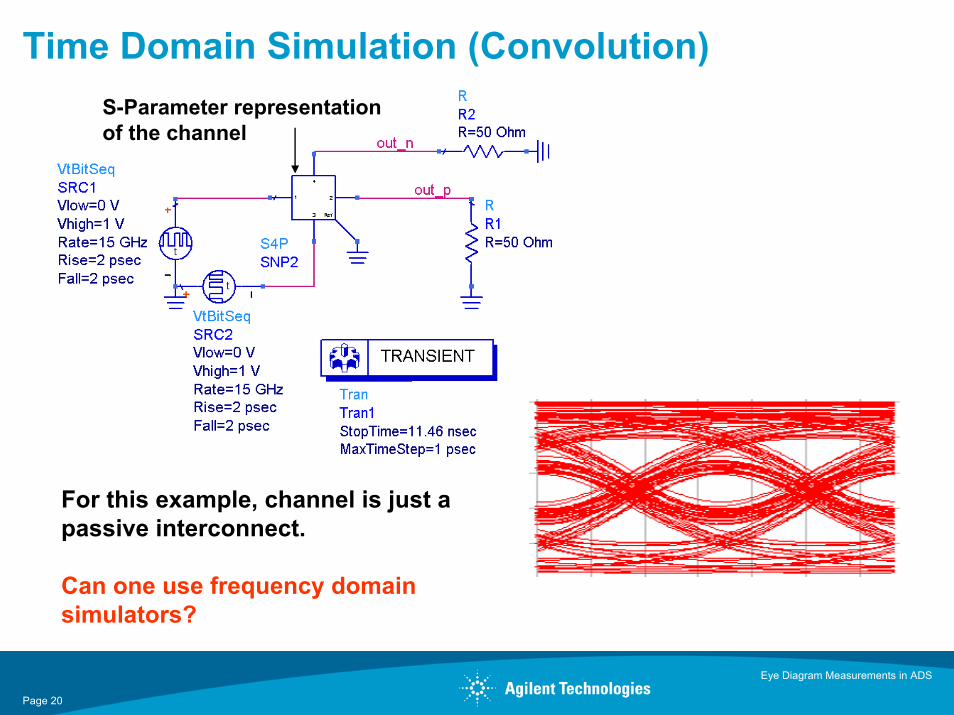
Time Domain Simulation (Convolution)S-Parameter representationof the channel
For this example, channel is just a passive interconnect.
Can one use frequency domain simulators?
Page 21
Eye Diagram Measurements in ADS
Page 21
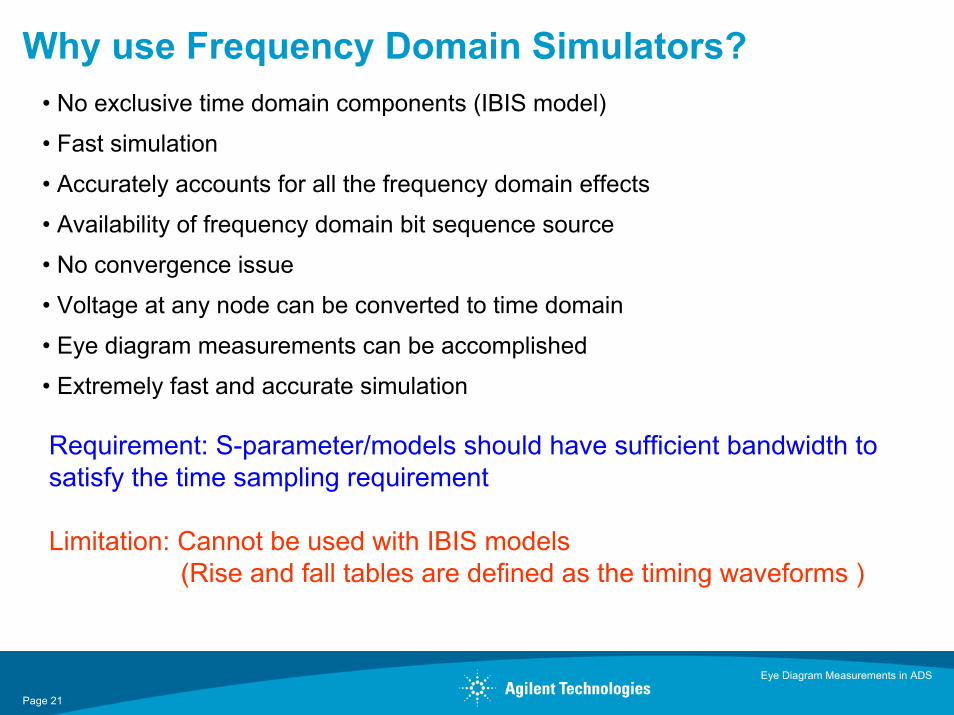
Why use Frequency Domain Simulators?• No exclusive time domain components (IBIS model)
• Fast simulation
• Accurately accounts for all the frequency domain effects
• Availability of frequency domain bit sequence source
• No convergence issue
• Voltage at any node can be converted to time domain
• Eye diagram measurements can be accomplished
• Extremely fast and accurate simulation
Requirement: S-parameter/models should have sufficient bandwidth to satisfy the time sampling requirement
Limitation: Cannot be used with IBIS models (Rise and fall tables are defined as the timing waveforms )
Page 22
Eye Diagram Measurements in ADS
Page 22
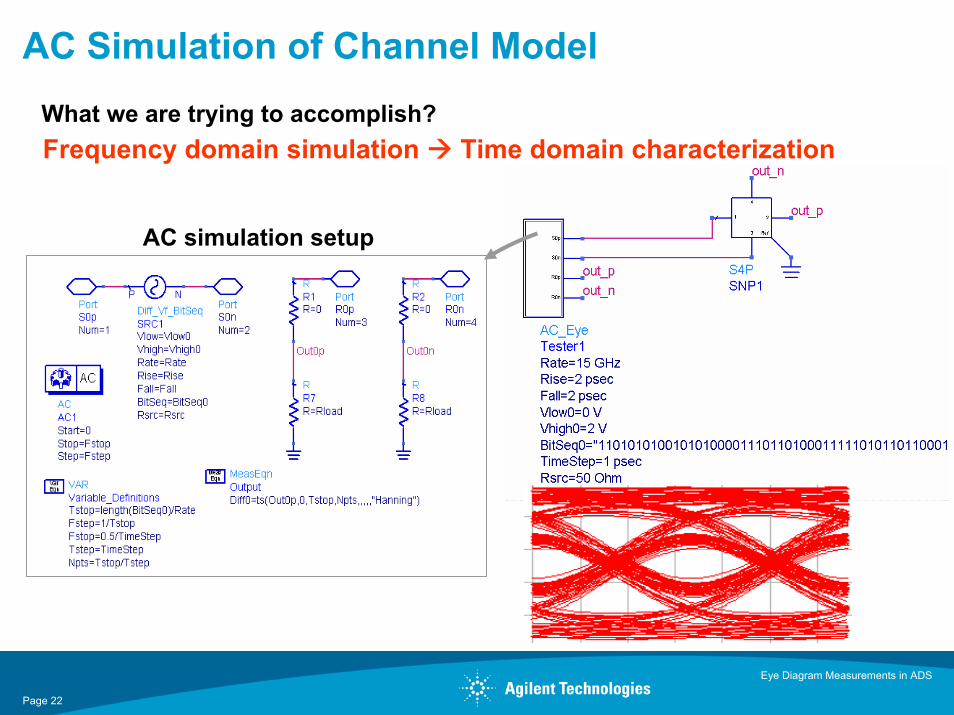
AC Simulation of Channel Model
AC simulation setup
Frequency domain simulation Time domain characterizationWhat we are trying to accomplish?

Page 23
Eye Diagram Measurements in ADS
Page 23
Comparison shows good correlation.
Comparing Time and Frequency Domain Simulation Results
Time Domain SimulationFrequency Domain Simulation
Calculate eye parameters?
Page 24
Eye Diagram Measurements in ADS
Page 24
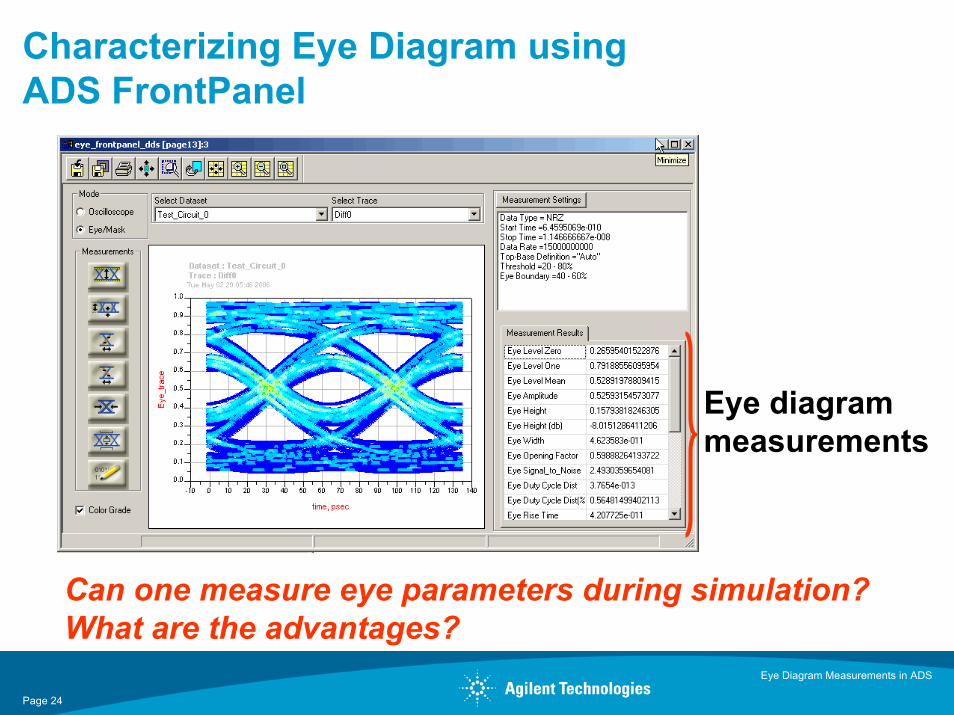
Characterizing Eye Diagram using ADS FrontPanel
Eye diagram measurements
Can one measure eye parameters during simulation?What are the advantages?
Page 25
Eye Diagram Measurements in ADS
Page 25
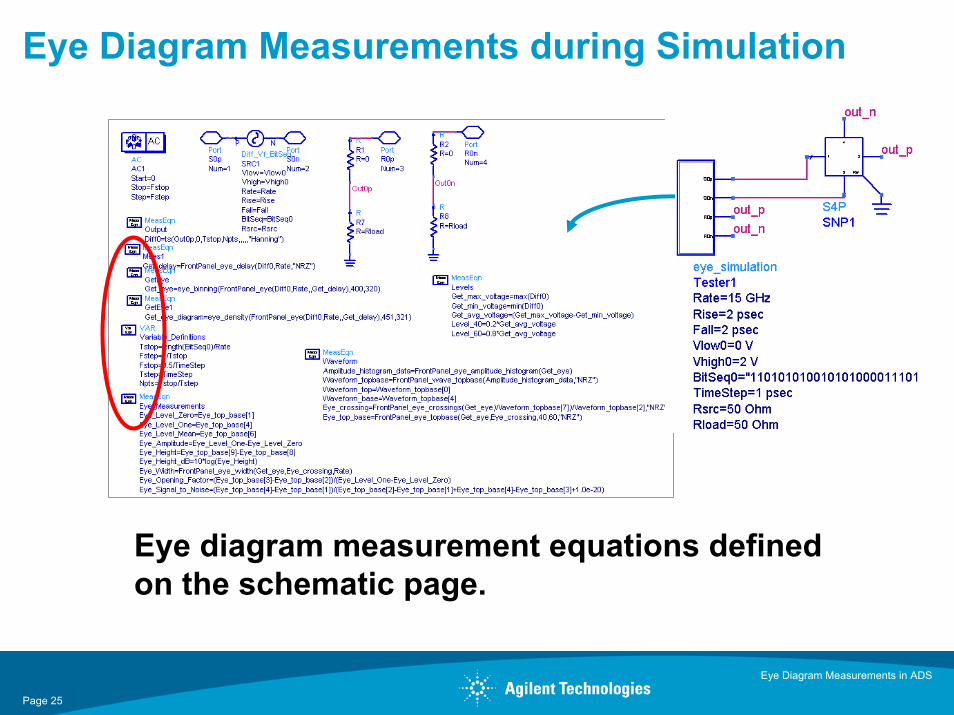
Eye Diagram Measurements during Simulation
Eye diagram measurement equations defined on the schematic page.
Page 26
Eye Diagram Measurements in ADS
Page 26
What we are achieving?
• Running AC simulation
• Plotting time domain waveform
• Plotting eye diagram measurements
Advantage• Fast and accurate channel simulation
• No convergence issues
• Measure eye diagram performance
Download example project from ADS knowledge website.
Provides simulation setup and measurement equations.
Frequency domain simulation Time Domain Characterization
Page 27
Eye Diagram Measurements in ADS
Page 27
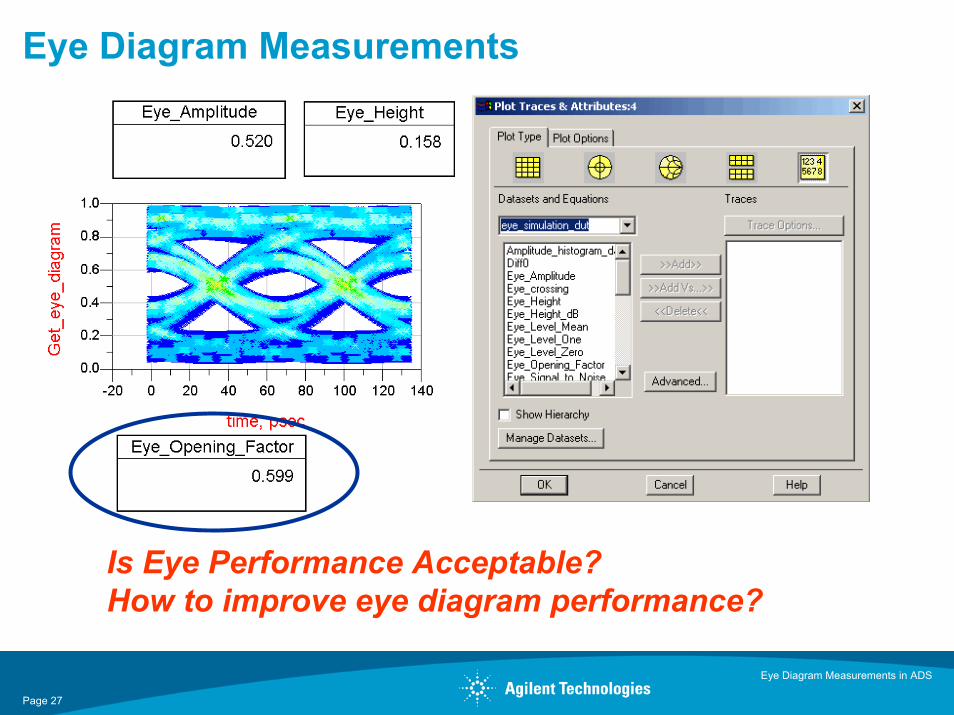
Eye Diagram Measurements
Is Eye Performance Acceptable?How to improve eye diagram performance?
Page 28
Eye Diagram Measurements in ADS
Page 28
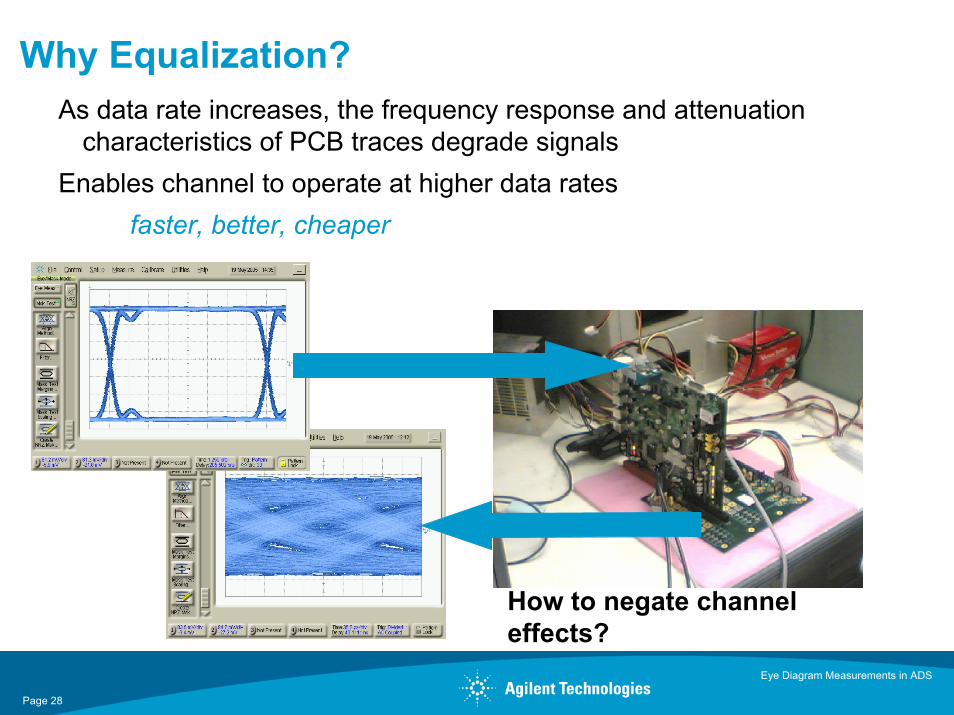
Why Equalization?As data rate increases, the frequency response and attenuation
characteristics of PCB traces degrade signalsEnables channel to operate at higher data rates
faster, better, cheaper
How to negate channel effects?
Page 29
Eye Diagram Measurements in ADS
Page 29
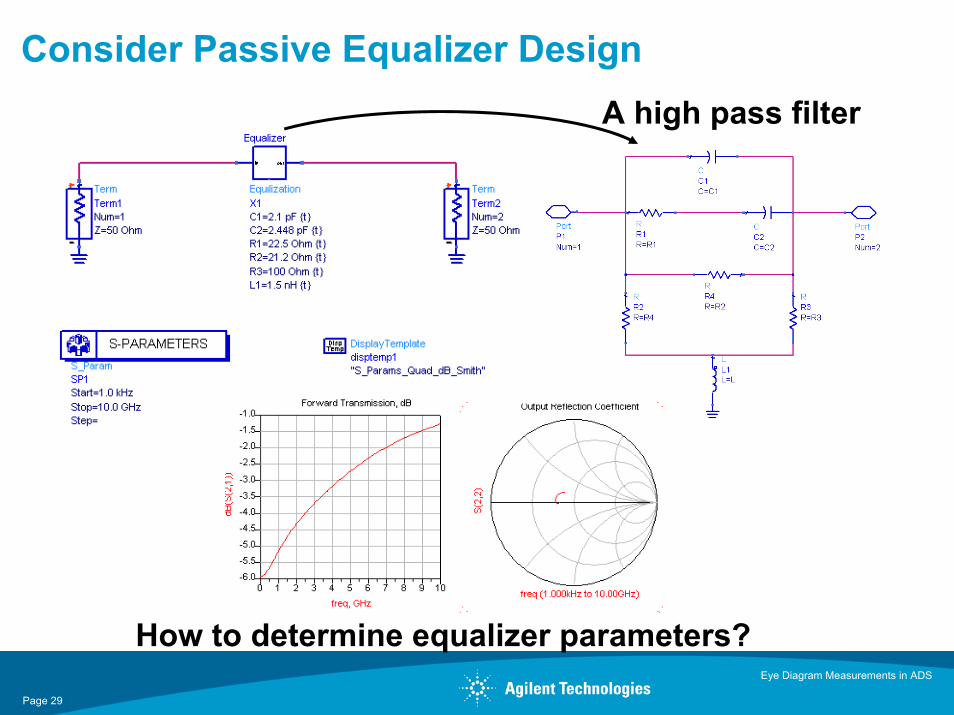
Consider Passive Equalizer Design A high pass filter
How to determine equalizer parameters?
Page 30
Eye Diagram Measurements in ADS
Page 30
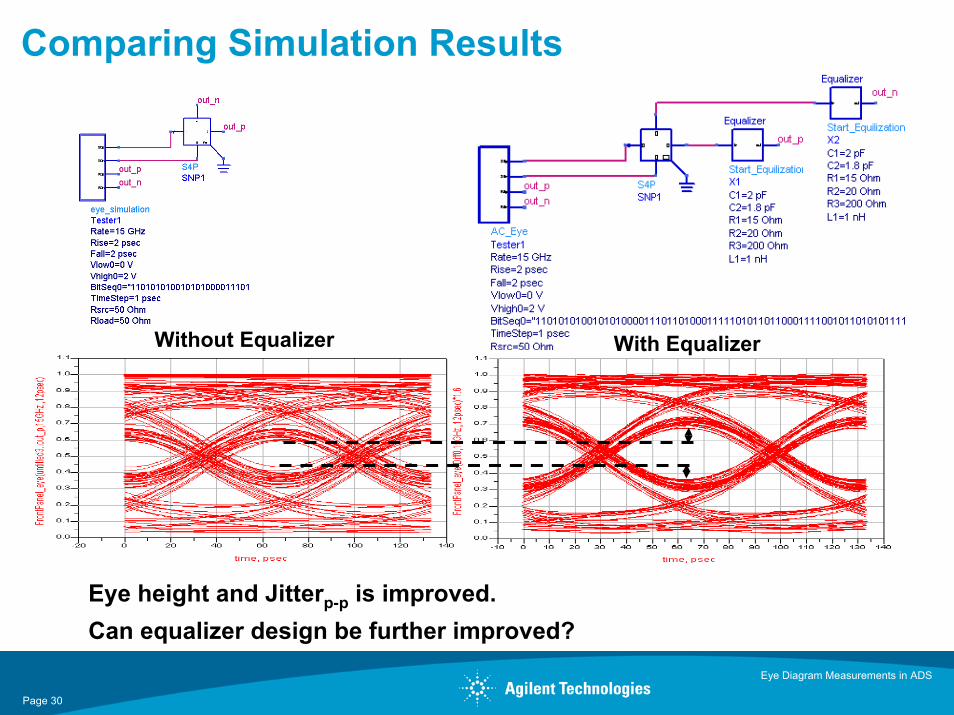
Comparing Simulation Results
Without Equalizer With Equalizer
Eye height and Jitterp-p is improved.Can equalizer design be further improved?
Page 31
Eye Diagram Measurements in ADS
Page 31
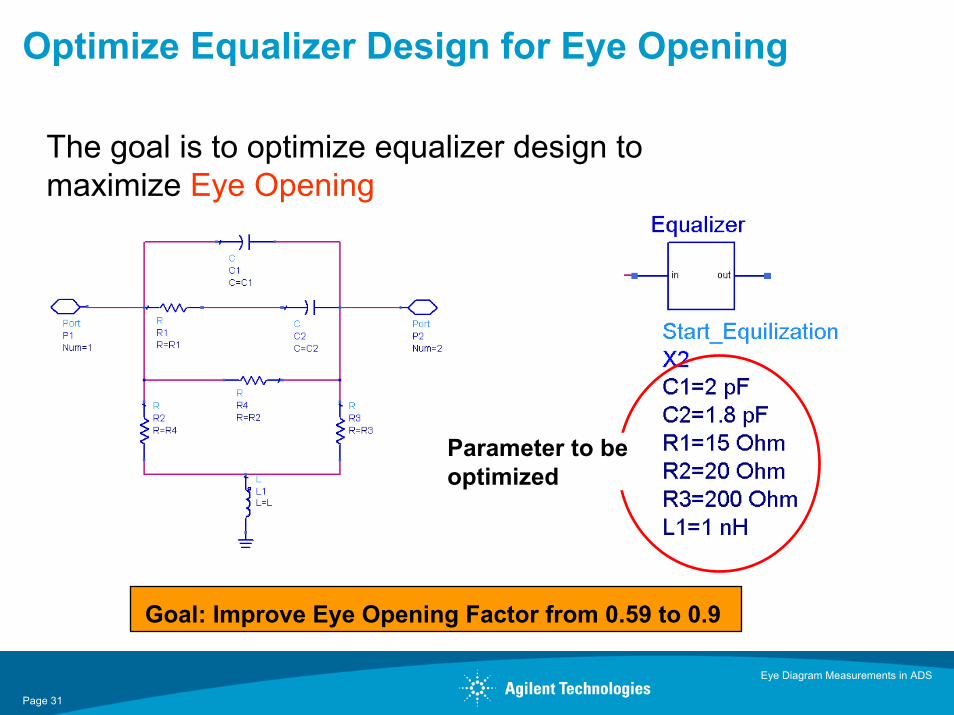
Optimize Equalizer Design for Eye Opening
The goal is to optimize equalizer design to maximize Eye Opening
Goal: Improve Eye Opening Factor from 0.59 to 0.9
Parameter to be optimized
Page 32
Eye Diagram Measurements in ADS
Page 32
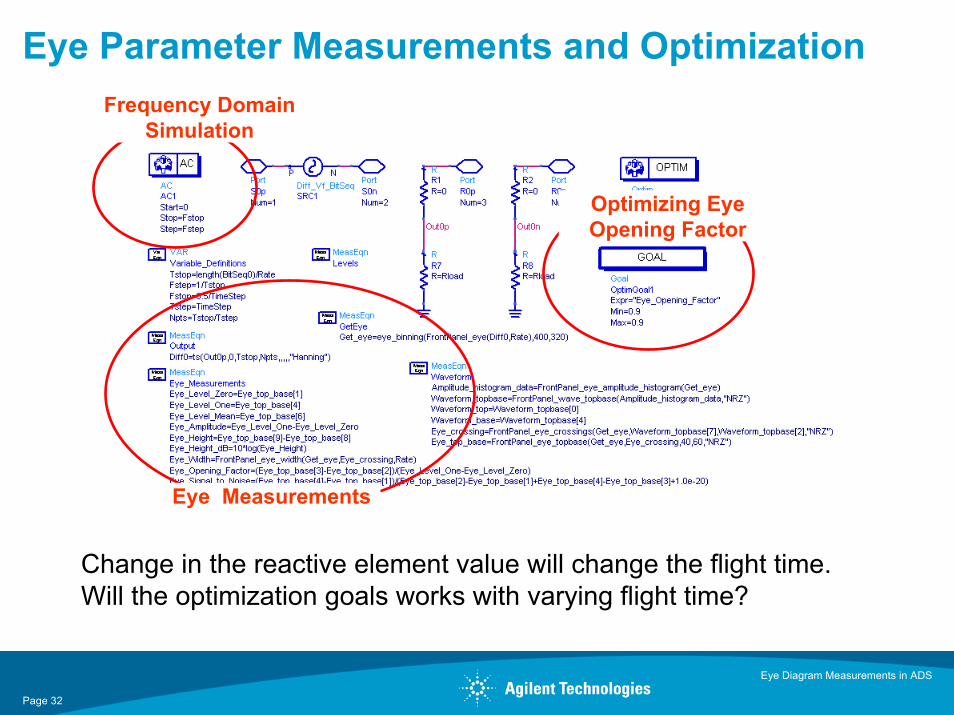
Eye Parameter Measurements and Optimization
Optimizing Eye Opening Factor
Eye Measurements
Frequency Domain Simulation
Change in the reactive element value will change the flight time. Will the optimization goals works with varying flight time?
Page 33
Eye Diagram Measurements in ADS
Page 33
Advantages
• Works well even if the flight time delay is changed due to changein the reactive element value.
• Automatically calculates delay required for eye positioning
• Automatically detects eye crossing point and 40-60% region
• Optimize eye diagram performance
Any eye diagram parameter such as eye opening factor, eye height, peak to peak jitter, rise time … can be used as an optimization goal.
• Unique and extremely powerful• Essential for state of the art serial link design
Frequency domain simulation Time domain characterizationTime domain optimization
Page 34
Eye Diagram Measurements in ADS
Page 34
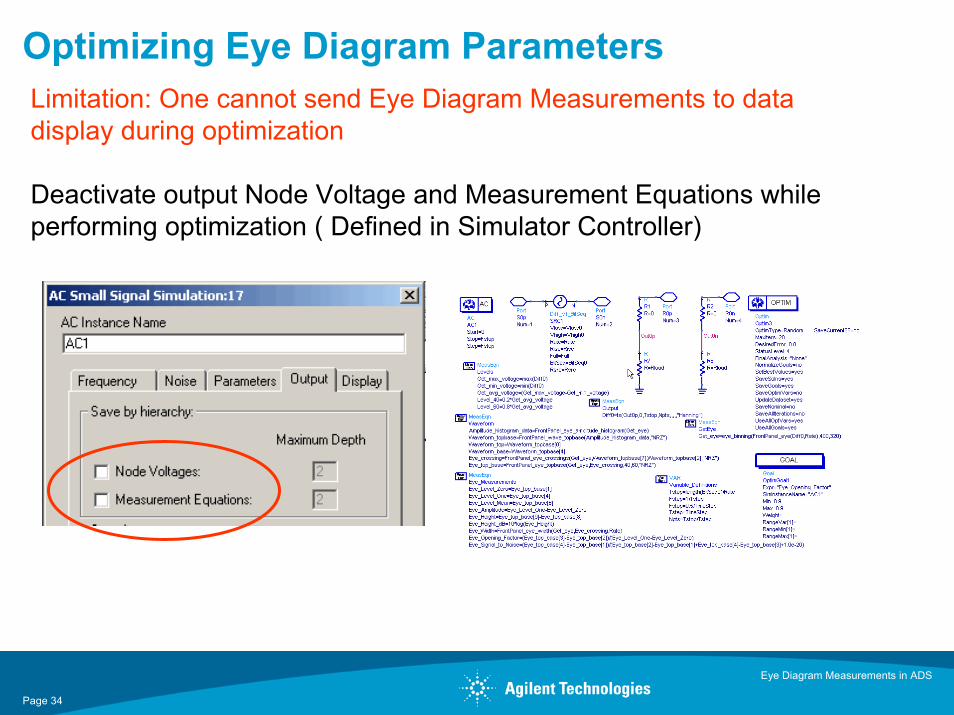
Optimizing Eye Diagram ParametersLimitation: One cannot send Eye Diagram Measurements to data display during optimization
Deactivate output Node Voltage and Measurement Equations while performing optimization ( Defined in Simulator Controller)
Page 35
Eye Diagram Measurements in ADS
Page 35
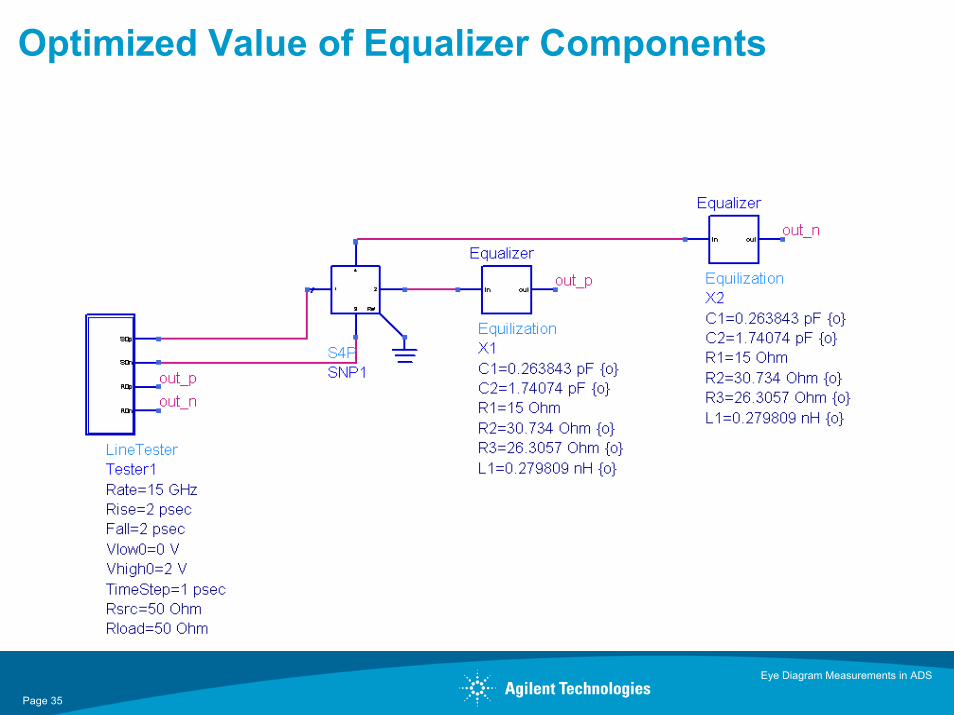
Optimized Value of Equalizer Components
Page 36
Eye Diagram Measurements in ADS
Page 36
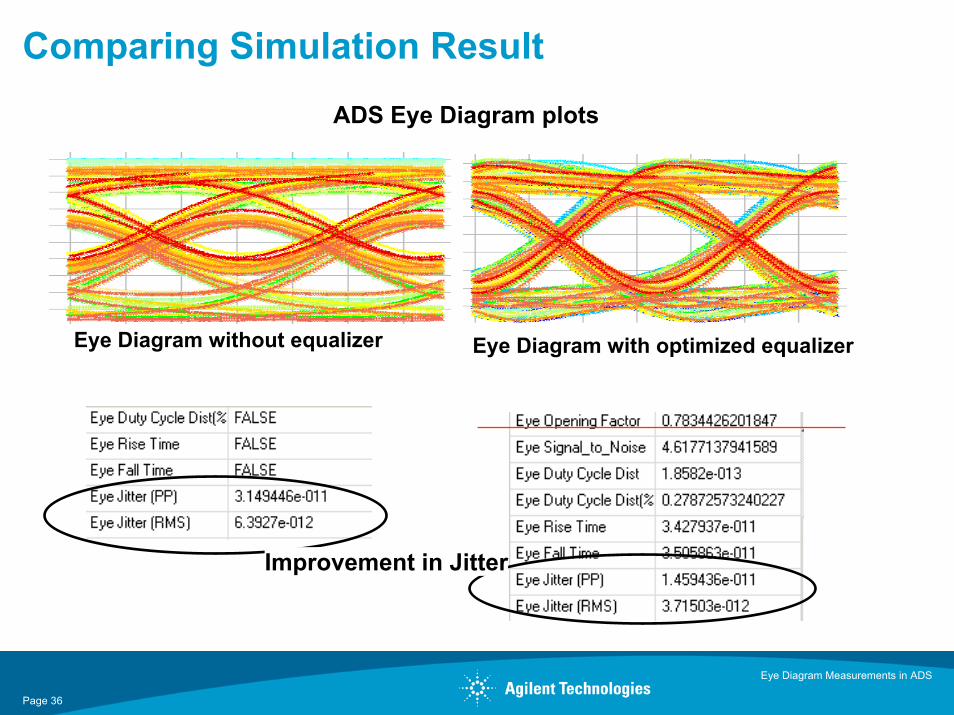
Comparing Simulation Result
Eye Diagram without equalizer Eye Diagram with optimized equalizer
Improvement in Jitter
ADS Eye Diagram plots
Page 37
Eye Diagram Measurements in ADS
Page 37
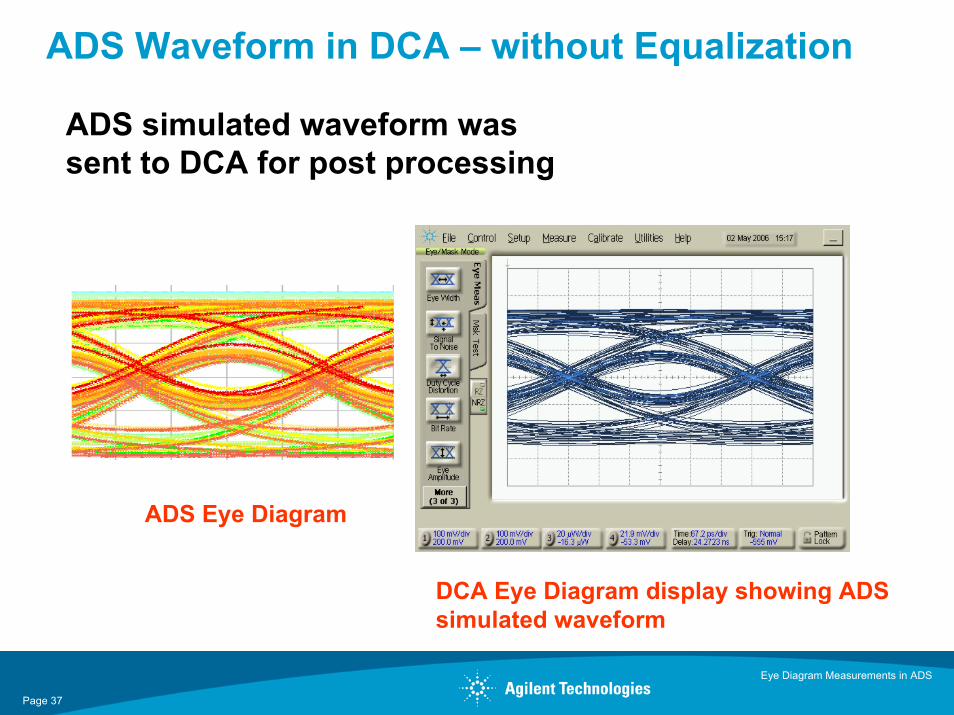
ADS Waveform in DCA – without Equalization
ADS simulated waveform was sent to DCA for post processing
DCA Eye Diagram display showing ADS simulated waveform
ADS Eye Diagram
Page 38
Eye Diagram Measurements in ADS
Page 38
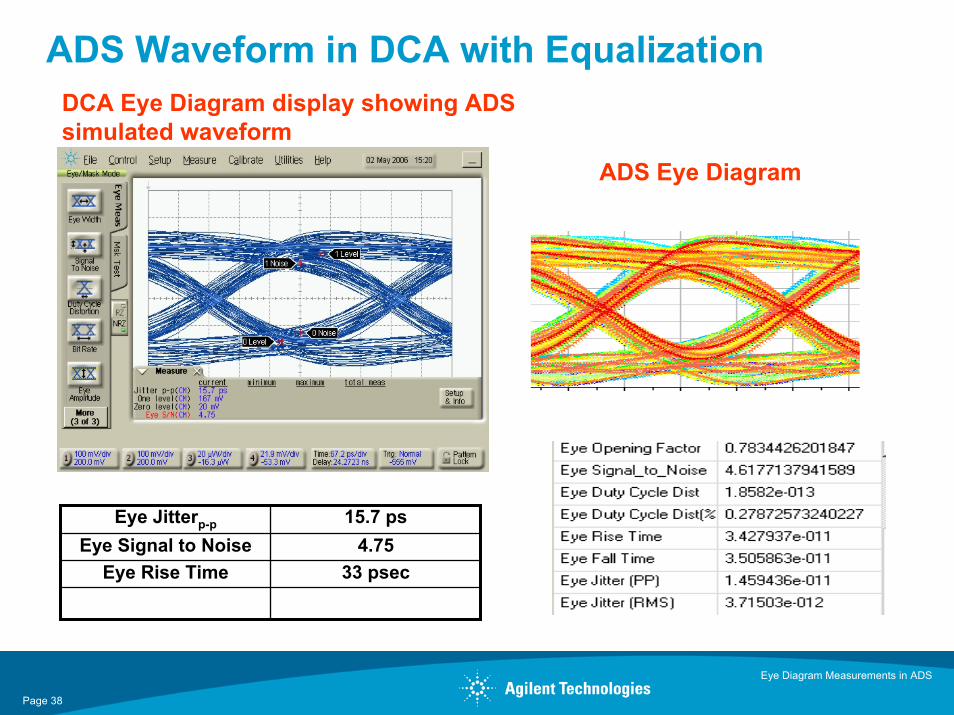
Eye Jitterp-p 15.7 psEye Signal to Noise 4.75
Eye Rise Time 33 psec
ADS Waveform in DCA with EqualizationDCA Eye Diagram display showing ADS simulated waveform
ADS Eye Diagram
Page 39
Eye Diagram Measurements in ADS
Page 39
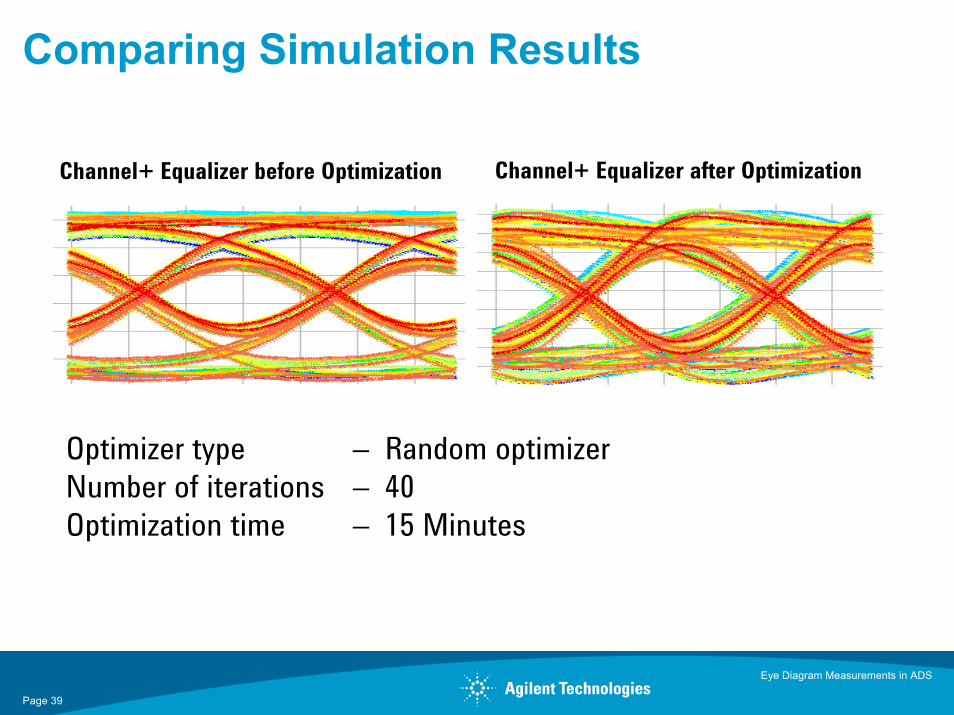
Comparing Simulation Results
Channel+ Equalizer before Optimization Channel+ Equalizer after Optimization
Optimizer type – Random optimizerNumber of iterations – 40Optimization time – 15 Minutes
Page 40
Eye Diagram Measurements in ADS
Page 40
Conclusion• ADS has been used for SI design for over 20 years
• ADS has a multitude of accurate built in models
• ADS allows you to build accurate physical models
• ADS brings IP, simulation and measurement together
• Reviewed Eye Diagram measurement algorithms in ADS• ADS allows you to predict time domain performance using frequency domain simulators
• Allows you to characterize and optimize Eye Diagram Performance
You can optimize eye diagram performance not only using the AC simulator, but ADS also allows you to optimize interconnects for eye diagram performance using numeric, time and other frequency domain simulators.

www.agilent.com/fi nd/emailupdatesGet the latest information on the products and applications you select.
www.agilent.com/fi nd/agilentdirectQuickly choose and use your test equipment solutions with confi dence.
Agilent Email Updates
Agilent Direct
www.agilent.comFor more information on Agilent Technologies’ products, applications or services, please contact your local Agilent office. The complete list is available at:www.agilent.com/fi nd/contactus
AmericasCanada (877) 894-4414 Latin America 305 269 7500United States (800) 829-4444
Asia Pacifi cAustralia 1 800 629 485China 800 810 0189Hong Kong 800 938 693India 1 800 112 929Japan 0120 (421) 345Korea 080 769 0800Malaysia 1 800 888 848Singapore 1 800 375 8100Taiwan 0800 047 866Thailand 1 800 226 008
Europe & Middle EastAustria 0820 87 44 11Belgium 32 (0) 2 404 93 40 Denmark 45 70 13 15 15Finland 358 (0) 10 855 2100France 0825 010 700* *0.125 €/minuteGermany 01805 24 6333** **0.14 €/minuteIreland 1890 924 204Israel 972-3-9288-504/544Italy 39 02 92 60 8484Netherlands 31 (0) 20 547 2111Spain 34 (91) 631 3300Sweden 0200-88 22 55Switzerland 0800 80 53 53United Kingdom 44 (0) 118 9276201Other European Countries: www.agilent.com/fi nd/contactusRevised: March 27, 2008
Product specifi cations and descriptions in this document subject to change without notice.
© Agilent Technologies, Inc. 2008
For more information about Agilent EEsof EDA, visit:
www.agilent.com/fi nd/eesof