From:
Innovation Framework and
Strategies: An APO Perspective
©APO 2009, ISBN: 92-833-7082-1
Published by the Asian Productivity Organization
1-2-10 Hirakawacho, Chiyoda-ku, Tokyo 102-0093, Japan
Tel: (81-3) 5226 3920 • Fax: (81-3) 5226 3950
E-mail: [email protected] • URL: www.apo-tokyo.org
Disclaimer and Permission to Use
This document is a part of the above-titled publication, and is provided in PDF
format for educational use. It may be copied and reproduced for personal use only.
For all other purposes, the APO's permission must first be obtained.
The responsibility for opinions and factual matter as expressed in this document
rests solely with its author(s), and its publication does not constitute an
endorsement by the APO of any such expressed opinion, nor is it affirmation of the
accuracy of information herein provided.
Bound editions of the entire publication may be available for limited purchase. Order
forms may be downloaded from the APO's web site.
An outcome report of the Expert Group on Innovation & Competitiveness (07-RP-24-GE-RES-C)
Prof. Sang Chan Park and Dr. Lee Loke Chong served as the co-volume editors.
The opinions expressed in this publication do not necessarily reflect the official view of the APO. For reproduction of the contents in part or in full, the APO’s prior permission is required.
©Asian Productivity Organization, 2009
ISBN: 92-833-7082-1
CONTENTS Foreword Part I Importance of Innovation and Global Trends ....................................................................3 Framework on Innovation .................................................................................................11 Conclusions & Recommendations ....................................................................................22 Part II: National Competitiveness Analysis: Growth Patterns and Role Models Quantitative Analysis on Selected APO Member Countries ............................................27 Overview...........................................................................................................................27 Group 1 Countries
Japan...........................................................................................................................29 Republic of Korea ......................................................................................................30 Republic of China.......................................................................................................31 Singapore....................................................................................................................32 Malaysia .....................................................................................................................33
Group 2 Country: Thailand ...............................................................................................34 Group 3 Country: the Philippines......................................................................................35 Qualitative Analysis: Comparative and Longitudinal Views ............................................36 Overview...........................................................................................................................36 Group 1 Countries
Japan...........................................................................................................................36 Republic of Korea ......................................................................................................45 Republic of China.......................................................................................................53 Singapore....................................................................................................................67 Malaysia .....................................................................................................................74
Group 2 Country: Thailand ...............................................................................................89 Group 3 Country: the Philippines....................................................................................100 Common threads and issues of APO member countries .................................................108 Part III List of Contributors .........................................................................................................113
FOREWORD The drivers of productivity and competitiveness are increasingly shifting from efficiency and quality to innovation and entrepreneurship. It is important to note, however, that rather than replacing the former, the latter are being added, similar to the addition of another layer of excellence. With the proliferation of products in the marketplace and rapidly shortening life cycles, it is vital to have efficient production as well as new products and services. Even as the more economically advanced countries progressively increase their innovative capabilities, it is necessary for them to continue to improve their infrastructure and processes. Conversely, developing countries should commit resources to innovation while striving to strengthen their basic infrastructure and efficiency. The EU, USA, Australia, and others have been making strenuous efforts to devise and implement innovation strategies and programs. Similarly, some APO members have developed innovation blueprints and initiatives. Realizing the importance of innovation, the APO organized a fact-finding mission in May 2007 to gain an in-depth understanding of the subject. The five-member mission visited France to attend the OECD Forum 2007 on Innovation, Growth, and Equity and met representatives of the Global Competitiveness Network of the World Economic Forum and Institute of Management Development in Switzerland. As a follow-up to the fact-finding mission, the APO formed an Expert Group on Innovation and Competitiveness comprising selected national experts from Japan, the Republic of Korea, Republic of China, Singapore, Malaysia, Thailand, and the Philippines. The experts were responsible for formulating a common framework and strategy to harmonize the innovation efforts of member countries. Three meetings were held in Langkawi, Singapore, and Kuala Lumpur. The Malaysian Productivity Corporation and SPRING Singapore were the implementing agencies for the respective venues. The kick-off meeting held in Langkawi deliberated on issues involved in the formulation of a regional innovation framework and strategy for the APO. The follow-up meeting in Singapore refined the framework and innovation strategies by country clusters and identified role model countries to provide guidance on innovation and competitiveness. The findings of the expert group were shared at a forum of more than 100 stakeholders in the productivity movement in APO member countries. There was a call for open innovation and effective utilization of potential resources through global coevolution. The principle of formulating an appropriate innovation framework based on country clusters and stage of development of APO members was affirmed. The APO wishes to thank all contributors to this report, especially the seven-member Expert Group on Innovation and Competitiveness. In particular, we are grateful to Professor Park Sang Chan, the chief expert, for leading the group and overall research effort, and to Dr. Lee Loke Chong, expert group member, for his help in reviewing and editing this volume. Shigeo Takenaka Secretary-General Tokyo March 2009

Part I
– 0 –
PART I
Part I
– 3 –
PART I
IMPORTANCE OF INNOVATION AND GLOBAL TRENDS
Today innovation can be seen from the perspective of economics, business,
technology, sociology, and engineering. Innovation can relate to business models,
markets, organizations, processes, products, services, supply chains, and virtually
every other aspect of modern commerce. Innovation can be incremental or it can be
breakthrough, disruptive, and radical in nature. There are myriad definitions of
innovation. One is that of the European Union that defines innovation as consisting of
“successful production, assimilation, and exploitation of novelty in the economic and
social spheres.” Innovation is widely recognized by nations to be an important
cornerstone to achieve economic and social progress. For fruitful outcomes,
innovation should be approached in a systemic, holistic, and timely manner. The
World Economic Forum 2007/8 report recommends that the extent of commitment to
innovation should be commensurate with the stage of national economic development,
with the proposed figures of 5%, 10%, and 30% for countries in the primary,
secondary, and tertiary stages of development, respectively. This suggests that even
for economies that have attained an advanced stage of development (“the affluents”),
innovation initiatives should be driven concurrently with continued strengthening of
the basic and efficiency enhancing factors. At the other end of the scale, economies
that are in the early stage of development should still attempt to allocate modest
efforts and resources to lay the foundation for innovation.
The U.S. Council on Competitiveness introduced the national initiative “Innovate
America” in 2003 with the statement that “innovation will be the single most
important factor in determining America’s success through the 21st century.”
Underpinning the U.S. national innovation agenda are the three crucial bases of talent,
investment, and infrastructure:
• talent – the building of a national education strategy for a diverse, innovative,
and technically trained workforce, catalyzing the next generation of
American innovators, and empowering workers to succeed in the global
economy;
• investment – revitalizing frontier and multidisciplinary research, energizing
the entrepreneurial economy, and reinforcing risk taking and long-term
investment; and,
• infrastructure – creating a national consensus for innovation growth
strategies, creating a 21st century intellectual property regime, strengthening
America’s manufacturing capacity, and building 21st century innovation
infrastructures, i.e., the health care test bed.
The European Union launched the Lisbon Strategy in 2000 with the goal to “make the
European Union the world’s most competitive and dynamic economy by 2010.” In a
subsequent review in 2003, the concept of a multidimensional nature of the innovation
phenomenon was introduced. It was postulated that while research is a major
contributor to innovation, there is no value creation if there is no entrepreneurial
action. Yet another observation was that further classifications in addition to
Innovation Framework and Strategies: An APO Perspective
– 4 –
technological innovations need to be identified. These include organizational
innovation, business model innovation, and presentational innovation (covering design
and marketing). The Entrepreneurship and Innovation Program (EIP) under the
Competitiveness and Innovation Framework Program (CIP) was implemented for the
period 2007 – 2013 and advocated the following:
• access to finance for SMEs through EU financial instruments;
• a network of business and innovation service centers;
• support for initiatives to foster entrepreneurship and innovation;
• eco-innovation – making sustainable development become a business reality;
and
• support for policy-making.
In May 2007, the Organization for Economic Cooperation and Development (OECD)
embarked on an initiative to develop a broad-ranging innovation strategy. This
strategy would incorporate:
• a cross-disciplinary, mutually reinforcing package of policy elements and
recommendations to boost innovation performance, covering non-
technological innovation, both generally applicable and country-specific
(good policy practices, and where appropriate, policy guidelines would be
identified);
• a framework that could be used to monitor and review the innovation
environment and performance of the innovation system;
• enhancement of the existing mechanisms and forums for international
discussion and cooperation, including strengthened dialogue, especially with
emerging economies and other important stakeholders;
• analysis to clarify the links between the policy domains of a comprehensive
strategy, such as those between innovation and entrepreneurship and how
innovation contributes to economic, social, and environmental goals; and,
• better metrics to identify and benchmark innovation performance and the
factors and policies influencing it.
It was proposed that ICT, notably through the Internet, become a fundamental
component of the global economic infrastructure. It was also observed that a
coordinated, coherent, “whole-of-government” approach would be required.
Japan launched its “Innovation 25” strategy in 2006 to create a richly innovative
society by 2025. This national strategy is aimed at integrating three key areas of
innovation: innovation in science and technology, innovation in social systems, and
innovation in human resources. The immediate measures identified for action included
global environmental issues as a driver for economic growth and international
contribution, doubling investment for the next generation, university reform,
investment increase for science and technology to ensure the delivery of real value,
and a comprehensive innovation review (of regulations, social systems, norms, and
rules).
Singapore laid down the National Innovation Framework for Action (NIFA) in
1998 as a starting point to nurture innovation and develop an innovation roadmap.
Eight key factors were identified as critical to the success of the innovation movement:
1) education and training, 2) government policies, 3) government support, 4)
information, 5) infrastructure, 6) technology, 7) markets, and 8) human resources.
Recommendations made to address the gaps were: enhance innovation education,
Part I
– 5 –
strengthen innovation training, strengthen the linkages between market and
technology, review government support, strengthen infrastructural support, improve
the innovation environment, improve awareness, and review government policies and
regulations.
In the Republic of Korea, innovation is focused more on government than on the
private sector. In 2004, the Republic of Korea launched innovation audit programs
across all 48 governmental agencies including the ministries. In fact, the World
Economic Forum (WEF) reported that the Innovation and Sophistication Factor value
of the Republic of Korea jumped from 4.75 in 2004 to 5.08 in 2005. In 2005, the
Republic of Korea started building a “Knowledge-Based Service Industry Roadmap
for 2015” for promulgating the learned concepts from the government sector to the
private industry. All public companies have begun to follow this innovation roadmap.
As a result, a new government division to specifically address the “Knowledge-based
Service Industry” was formed under the Ministry of Industry and Energy in 2006. In
2007, innovation had further spread into the technology innovation level.
Subsequently, “Integrated Industry Technology Roadmap 2020” was promulgated for
all 15 industries categories in 2007. The convergence of industries has now started and
the innovation has been widely understood as one of the national megatrends. In 2008,
after the presidential election, the Ministry of Industry and Energy even adopted the
new name of “Ministry of Knowledge and Economy” to reflect the importance of the
innovation results.
In 2007, the Philippines announced the National Innovation Strategy to strengthen
the country’s competitiveness in the global knowledge-based economy and to
transform the country into a technology hub for Asia. The strategy was to focus on
four key areas: strengthen human capital, support business incubation and acceleration
efforts, regenerate the policy environment for innovation, and upgrade the public
mindset toward a culture of innovation.
So far, most of the other Asian countries, including technology leader Republic of
China, have yet to promulgate specific national innovation strategies. In the case of
Thailand, the National Innovation Agency was set up in 2003 as the core organization
to coordinate, foster, and partner academia, research organizations, private enterprises,
investors, and financiers. Malaysia has factored in an innovation-led strategy in its
ninth Malaysia Plan. In it, emphasis is given to service innovation, and a
multidisciplinary approach is taken that encompasses technology innovation, business
innovation, demand innovation, and socio-organizational innovation.
While some Asian countries have drawn up their own respective national agendas
to instill innovation in their societies and industries, so far there has been little
collective effort to synergize and share plans and programs. Useful lessons can be
learned from the initiatives and experiences of the European Union, which, like APO
member countries, comprises countries at various stages of economic development.
Table 1 shows the distribution of EU countries as well as APO members based on
categorizations suggested by the World Economic Forum. It is clear that the spread is
much wider for APO members than for the EU countries.
The Global Innovation Scoreboard (GIS) and Global Competitiveness Index
(GCI) are two notable efforts to measure and compare competitiveness and innovation
across nations. The GIS, adapted from the European Innovation Scoreboard (EIS),
rates innovation on five key dimensions: innovative drivers, knowledge creation,
innovation and entrepreneurship, application, and intellectual property. The GCI
comprises 12 pillars under the headings of Basic Requirements, Efficiency Enhancers,
Innovation Framework and Strategies: An APO Perspective
– 6 –
and Innovative and Sophistication factors. The pillars under Basic Requirements are
institutions, infrastructure, macroeconomic stability, health, and primary education.
The pillars under Efficiency Enhancers are higher education and training, goods
market efficiency, labor market efficiency, financial market sophistication,
technological readiness, and market size. The pillars under Innovation and
Sophistication Factors are business sophistication and innovation. The GIS covers the
European countries, the U.S., and the five Asian economies of the Republic of China,
the Republic of Korea, Hong Kong, India, and Singapore, and is innovation-centric.
The GCI includes data on 131 global economies – including all APO members except
Lao PDR, Fiji, and Iran, and provides a more broad-based assessment of a country’s
competitiveness and innovation. Since APO economies lie across a wide spectrum of
economic development, the GCI would be a more appropriate platform to adopt for
the proposed APO Innovation framework. For a more detailed study of innovation per
se the GIS can be used.
Table 1: Countries/Economies at Each Stage of Development
Stage 1
Transition
from
Stage 1 to 2
Stage 2
Transition
from
Stage 2 to 3
Stage 3
APO Members
Bangladesh (BD)
Cambodia (KH)
India (IN)
Indonesia (ID)
Mongolia (MN)
Nepal (NP)
Pakistan (PK)
Philippines (PH)
Sri Lanka (LK)
Vietnam (VN)
Malaysia (MY)
Thailand (TH)
Republic of China
(TW)
Hong Kong (HK)
Japan (JP)
Republic of Korea
(KR)
Singapore (SG)
European Union
Bulgaria (BG)
Latria (LV)
Lithuania (LT)
Poland (PL)
Romania (RO)
Czech Republic
(CZ)
Estonia (EE)
Hungary (HU)
Malta (MT)
Slovakia (SK)
Austria (AT)
Belgium (BE)
Cyprus (CY)
Denmark (DK)
Finland (FI)
France (FR)
Germany (DE)
Greece (GR)
Ireland (IE)
Italy (IT)
Luxembourg (LU)
Netherlands (NL)
Portugal (PT)
Slovenia (SI)
Spain (ES)
Sweden (SE)
United Kingdom
(UK)
Part I
– 7 –
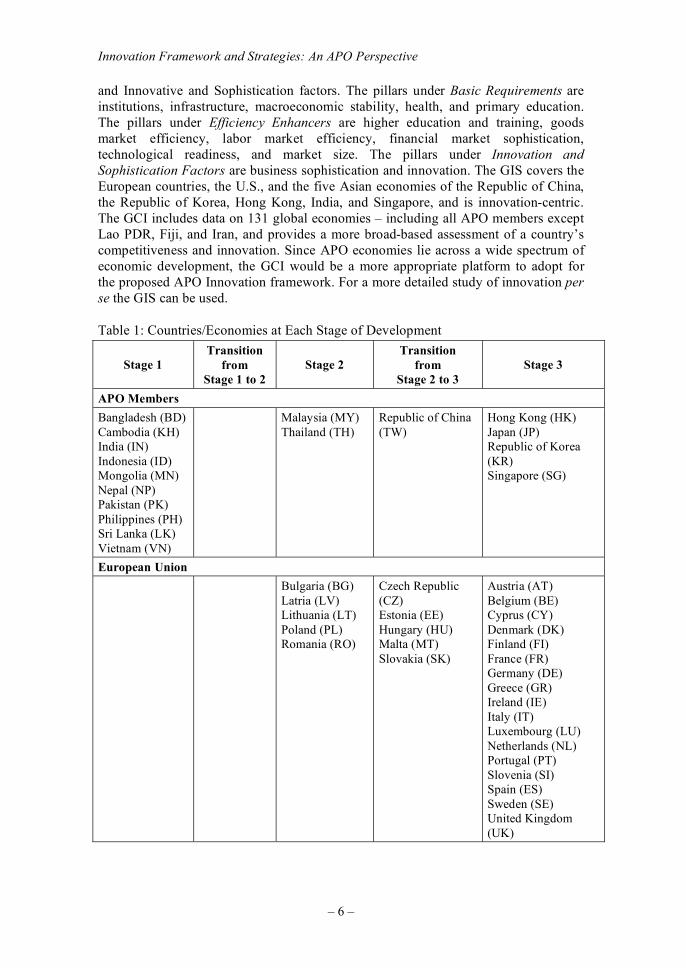
Figure 1 shows the scores of the top four EU countries for the basic requirements
(BR), efficiency enhancers (EE), and innovation and sophistication factors (ISF). It is
observed that all four countries have a high BR score of around 6. Denmark has the
highest BR and EE scores, and the lowest ISF score. Germany, on the other hand, has
the lowest BR score but the highest ISF score.
Figure 2 shows the BR, EE, and ISF scores for Hong Kong, Japan, the Republic
of Korea, Malaysia, the Republic of China, Thailand, and Singapore. Japan has a
relatively low BR score of 5.41 but matches the ISF score of 5.70 for Germany.
Among APO members, the Republic of Korea has the second highest ISF score of
5.42, followed by the Republic of China (5.31), and Singapore (5.14).
DK
DKSE
SEDE DE
FI
FI
5
6
BR EE ISF
Figure 1: European Union (Top Four)
JP
KRTW
SG
TH
JP
KR
TW
MY
MY
SG
THHK
HK
4
5
6
BR EE ISF
Figure 2: APO members (Top Seven)
Innovation Framework and Strategies: An APO Perspective
– 8 –
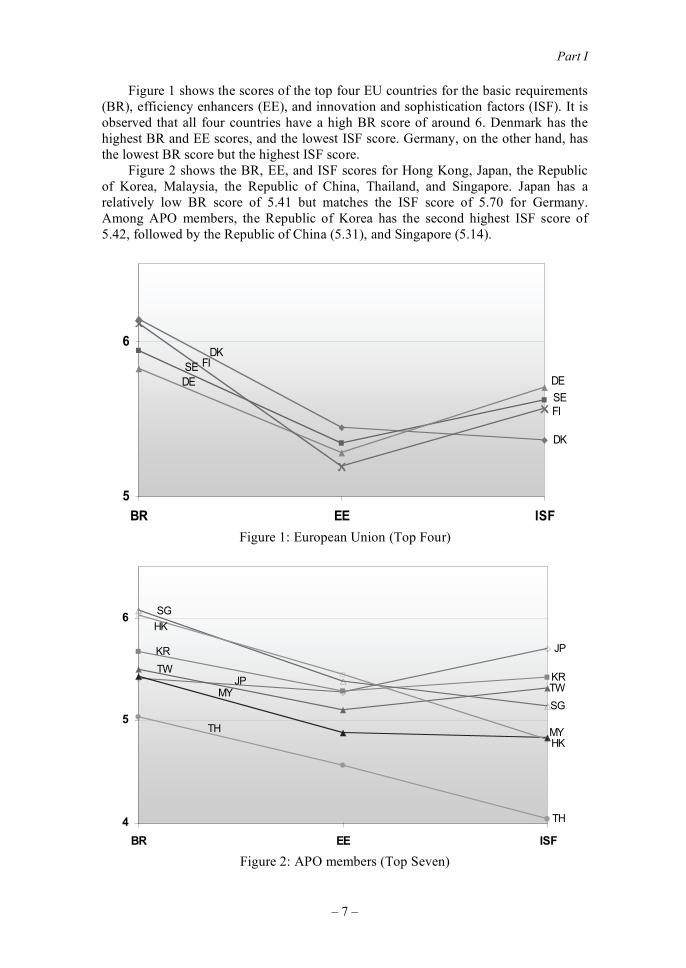
Figure 3 provides a comparison of the top four EU countries and the top four
APO members. Excluding Singapore, the BR scores for APO members are lower than
for their European counterparts. The spread for the EE scores is narrower. For the ISF
scores, Japan ranks well while other APO members have some catching up to do.
DK
SE
SE
DEDEKR
TW
SG
DK
FI
FI
JP
JP
KR
TW
SG
5
6
7
BR EE ISF
European Union APO
Figure 3: Comparison of APO and EU (Top Four)
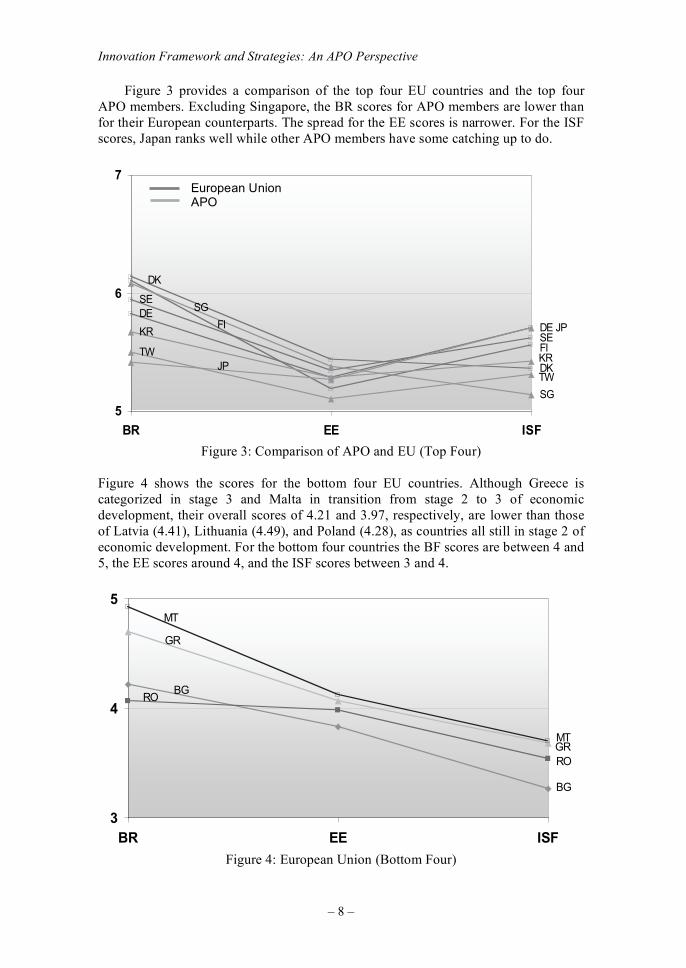
Figure 4 shows the scores for the bottom four EU countries. Although Greece is
categorized in stage 3 and Malta in transition from stage 2 to 3 of economic
development, their overall scores of 4.21 and 3.97, respectively, are lower than those
of Latvia (4.41), Lithuania (4.49), and Poland (4.28), as countries all still in stage 2 of
economic development. For the bottom four countries the BF scores are between 4 and
5, the EE scores around 4, and the ISF scores between 3 and 4.
BG
BG
RO
RO
GR
GR
MT
MT
3
4
5
BR EE ISF
Figure 4: European Union (Bottom Four)
Part I
– 9 –
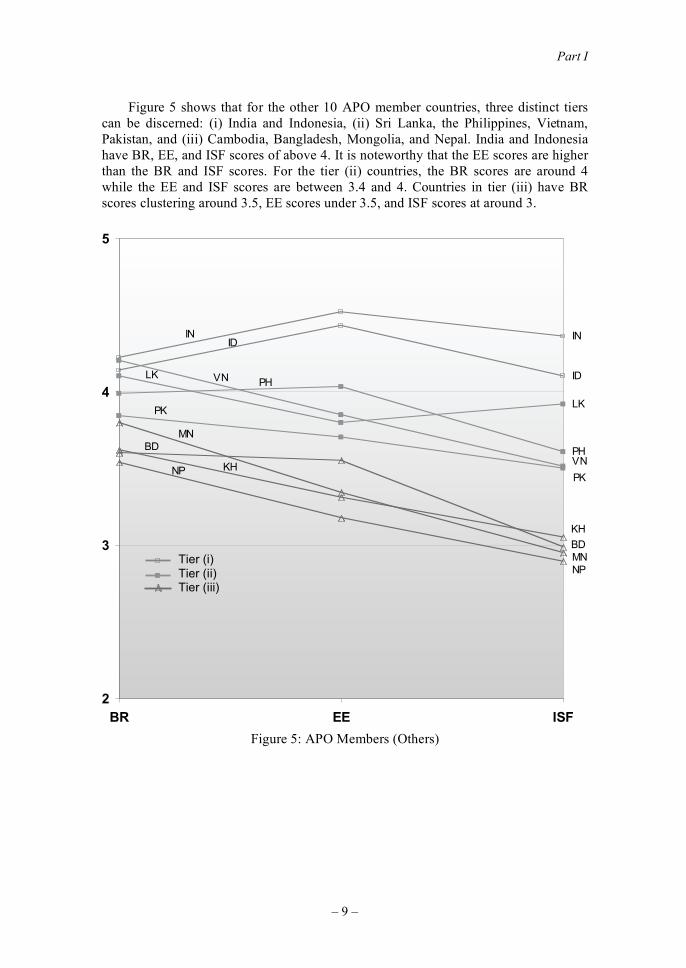
Figure 5 shows that for the other 10 APO member countries, three distinct tiers
can be discerned: (i) India and Indonesia, (ii) Sri Lanka, the Philippines, Vietnam,
Pakistan, and (iii) Cambodia, Bangladesh, Mongolia, and Nepal. India and Indonesia
have BR, EE, and ISF scores of above 4. It is noteworthy that the EE scores are higher
than the BR and ISF scores. For the tier (ii) countries, the BR scores are around 4
while the EE and ISF scores are between 3.4 and 4. Countries in tier (iii) have BR
scores clustering around 3.5, EE scores under 3.5, and ISF scores at around 3.
IN
ID
LK
PH
INID
VN
VN
LKPH
PK
PK
MN
MN
BD
BD
KH
KH
NP
NP
2
3
4
5
BR EE ISF
Tier (i) Tier (ii) Tier (iii)
Figure 5: APO Members (Others)
Innovation Framework and Strategies: An APO Perspective
– 10 –
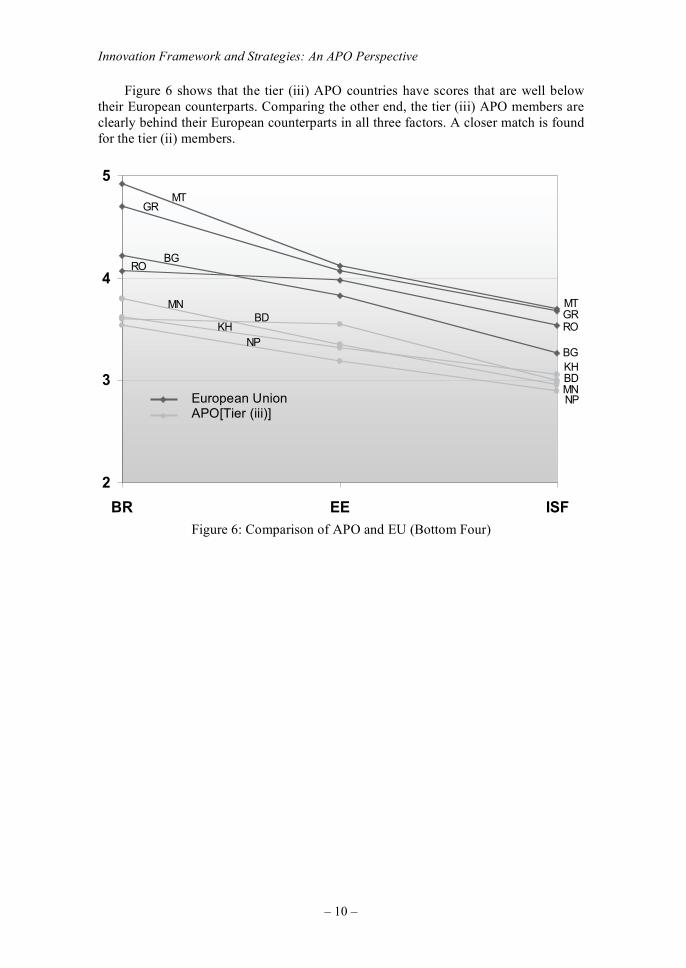
Figure 6 shows that the tier (iii) APO countries have scores that are well below
their European counterparts. Comparing the other end, the tier (iii) APO members are
clearly behind their European counterparts in all three factors. A closer match is found
for the tier (ii) members.
BG
BG
RO
RO
GR
GR
MT
MT
KH
KH
BD
BD
MN
MN
NP
NP
2
3
4
5
BR EE ISF
European Union APO[Tier (iii)]
Figure 6: Comparison of APO and EU (Bottom Four)
Part I
– 11 –
FRAMEWORK ON INNOVATION
While Asia has emerged as a protagonist in the global economic scene, the techno-
economic growth among Asian countries has been very uneven, resulting in a
deepening of the divide between the front-runners and those lagging behind. The
former cohort of APO members, namely Japan, the Republic of Korea, the Republic of
China, and Singapore, has built up strong key institutions and they are striving to
increase their innovation capabilities. These economies measure up well in the Basic,
Efficiency, and Innovation factors compared to their European counterparts. The
newly industrializing APO members, on the other hand, need to continue to strengthen
their basic infrastructure and processes and make more headway along the innovation
value chain. These economies are found to fare relatively less well against their
European counterparts. In drawing up the APO Innovation Framework and Strategy it
is necessary to take into account the Asian socio-cultural background as well as the
varying needs and constraints across the APO membership. The framework will
facilitate the charting of national and collective policies and programs and serve as a
platform for exchanges and sharing of best practices.
After extensive deliberations in the Expert Roundtable meetings in Langkawi,
Malaysia in August 2007 and Singapore in November 2007, the participants came up
with the following terms of reference for the APO Innovation Strategy and
Framework:
• innovation shall be viewed from a broad perspective, not merely as
technological improvements;
• innovation shall be viewed across all economic sectors and industries;
• the nature and level of commitment to innovation would vary according to
the stage of national economic development;
• clustering is a useful means to form groups with common interests and goals;
and,
• the use of role models is a good approach to level up on innovation.
Based on the rationale as outlined in the background and the findings from the APO
fact-finding mission to France and Switzerland (proceedings of the 2007 OECD
Forum on Innovation, Growth and Equity and visits to the WEF and IMD), the
participants of the Expert Roundtable on Innovation formulated two versions of the
APO Innovation Framework: a static interpretation and a dynamic view on innovation
and competitiveness.
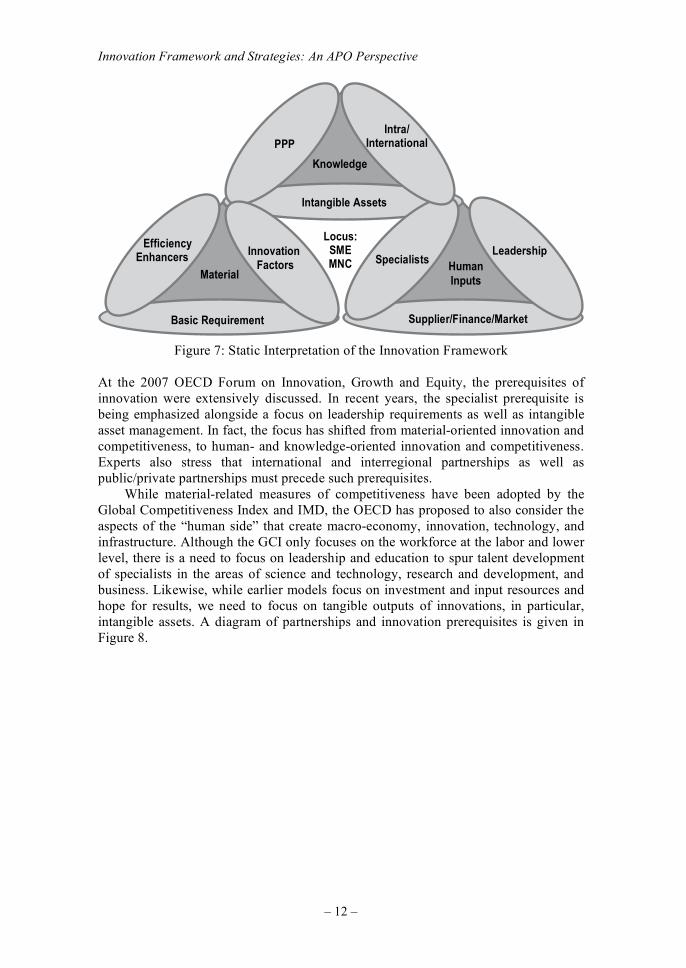
For the static framework, three major triangles of material, human beings, and
knowledge form a cycle of knowledge creation by utilizing both material and human
resources, as shown in Figure 7. The derived knowledge is fed into the resource side
for further enrichment.
Innovation Framework and Strategies: An APO Perspective
– 12 –
HumanInputs
Intangible Assets
PPP Intra/
International
Knowledge
Efficiency Enhancers
Basic Requirement
Material Specialists
Leadership
Supplier/Finance/Market
Innovation Factors
Locus: SME MNC
Figure 7: Static Interpretation of the Innovation Framework
At the 2007 OECD Forum on Innovation, Growth and Equity, the prerequisites of
innovation were extensively discussed. In recent years, the specialist prerequisite is
being emphasized alongside a focus on leadership requirements as well as intangible
asset management. In fact, the focus has shifted from material-oriented innovation and
competitiveness, to human- and knowledge-oriented innovation and competitiveness.
Experts also stress that international and interregional partnerships as well as
public/private partnerships must precede such prerequisites.
While material-related measures of competitiveness have been adopted by the
Global Competitiveness Index and IMD, the OECD has proposed to also consider the
aspects of the “human side” that create macro-economy, innovation, technology, and
infrastructure. Although the GCI only focuses on the workforce at the labor and lower
level, there is a need to focus on leadership and education to spur talent development
of specialists in the areas of science and technology, research and development, and
business. Likewise, while earlier models focus on investment and input resources and
hope for results, we need to focus on tangible outputs of innovations, in particular,
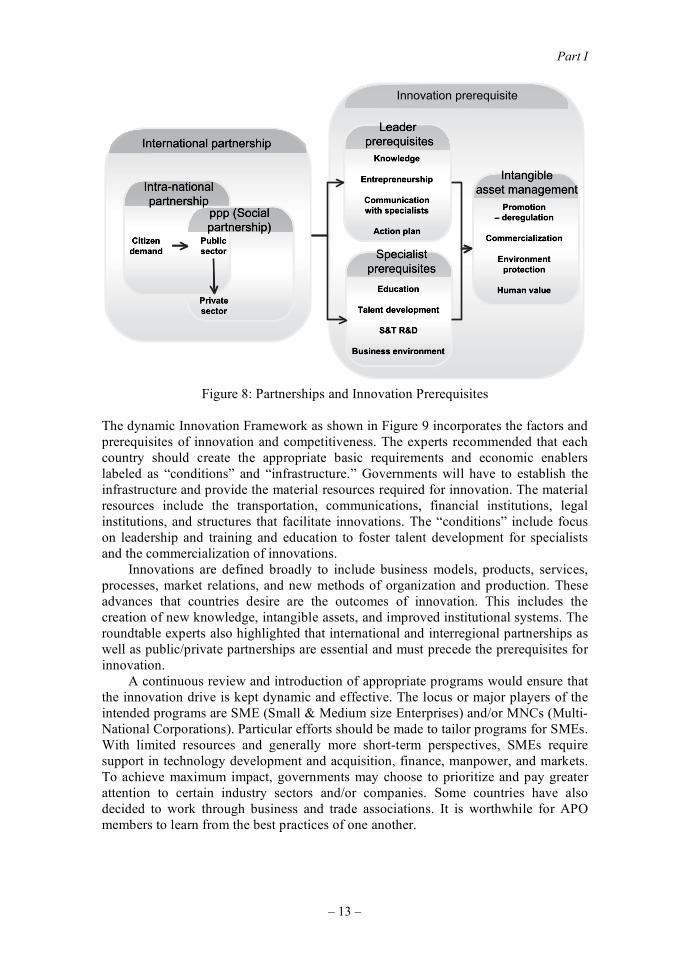
intangible assets. A diagram of partnerships and innovation prerequisites is given in
Figure 8.
Part I
– 13 –
lanoitan-artnIpihsrentrap
cilbuProtces
nezitiCdnamed
laicoS( ppp)pihsrentrap
etavirProtces
pihsrentrap lanoitanretnIredaeL
setisiuqererpegdelwonK
pihsruenerpertnE
noitacinummoCstsilaiceps htiw
nalp noitcA
tsilaicepSsetisiuqererp
noitacudE
tnempoleved tnelaT
D&R T&S
tnemnorivne ssenisuB
elbignatnItnemeganam tessa
noitomorPnoitalugered –
noitazilaicremmoC
tnemnorivnEnoitcetorp
eulav namuH
etisiuqererp noitavonnI
Figure 8: Partnerships and Innovation Prerequisites
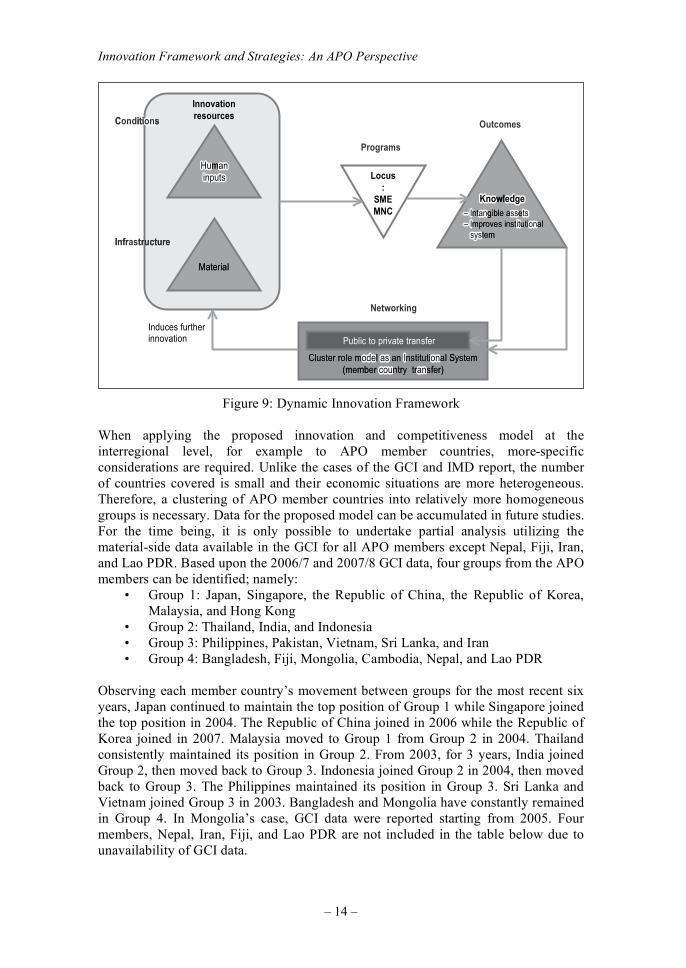
The dynamic Innovation Framework as shown in Figure 9 incorporates the factors and
prerequisites of innovation and competitiveness. The experts recommended that each
country should create the appropriate basic requirements and economic enablers
labeled as “conditions” and “infrastructure.” Governments will have to establish the
infrastructure and provide the material resources required for innovation. The material
resources include the transportation, communications, financial institutions, legal
institutions, and structures that facilitate innovations. The “conditions” include focus
on leadership and training and education to foster talent development for specialists
and the commercialization of innovations.
Innovations are defined broadly to include business models, products, services,
processes, market relations, and new methods of organization and production. These
advances that countries desire are the outcomes of innovation. This includes the
creation of new knowledge, intangible assets, and improved institutional systems. The
roundtable experts also highlighted that international and interregional partnerships as
well as public/private partnerships are essential and must precede the prerequisites for
innovation.
A continuous review and introduction of appropriate programs would ensure that
the innovation drive is kept dynamic and effective. The locus or major players of the
intended programs are SME (Small & Medium size Enterprises) and/or MNCs (Multi-
National Corporations). Particular efforts should be made to tailor programs for SMEs.
With limited resources and generally more short-term perspectives, SMEs require
support in technology development and acquisition, finance, manpower, and markets.
To achieve maximum impact, governments may choose to prioritize and pay greater
attention to certain industry sectors and/or companies. Some countries have also
decided to work through business and trade associations. It is worthwhile for APO
members to learn from the best practices of one another.
Innovation Framework and Strategies: An APO Perspective
– 14 –
KnoKnowledgeedge
Material
HuHumananinputsinputs
– I– Intanangible assssetsts– I– Improves instititutiononal sys system
Knowledge
Material
Humaninputs Locus
:SMEMNC
Cluster role modeodel asas an I Institutiononal System(member coucountry tranansfer)
Cluster role model as an Institutional System(member country transfer)
Public to private transfer
– Intangible assets– Improves institutional system
Induces further innovation
Networking
Programs
Condonditionons
Infrasastructure
Conditions
Infrastructure
Outcomes
Innovationresources
Figure 9: Dynamic Innovation Framework
When applying the proposed innovation and competitiveness model at the
interregional level, for example to APO member countries, more-specific
considerations are required. Unlike the cases of the GCI and IMD report, the number
of countries covered is small and their economic situations are more heterogeneous.
Therefore, a clustering of APO member countries into relatively more homogeneous
groups is necessary. Data for the proposed model can be accumulated in future studies.
For the time being, it is only possible to undertake partial analysis utilizing the
material-side data available in the GCI for all APO members except Nepal, Fiji, Iran,
and Lao PDR. Based upon the 2006/7 and 2007/8 GCI data, four groups from the APO
members can be identified; namely:
• Group 1: Japan, Singapore, the Republic of China, the Republic of Korea,
Malaysia, and Hong Kong
• Group 2: Thailand, India, and Indonesia
• Group 3: Philippines, Pakistan, Vietnam, Sri Lanka, and Iran
• Group 4: Bangladesh, Fiji, Mongolia, Cambodia, Nepal, and Lao PDR
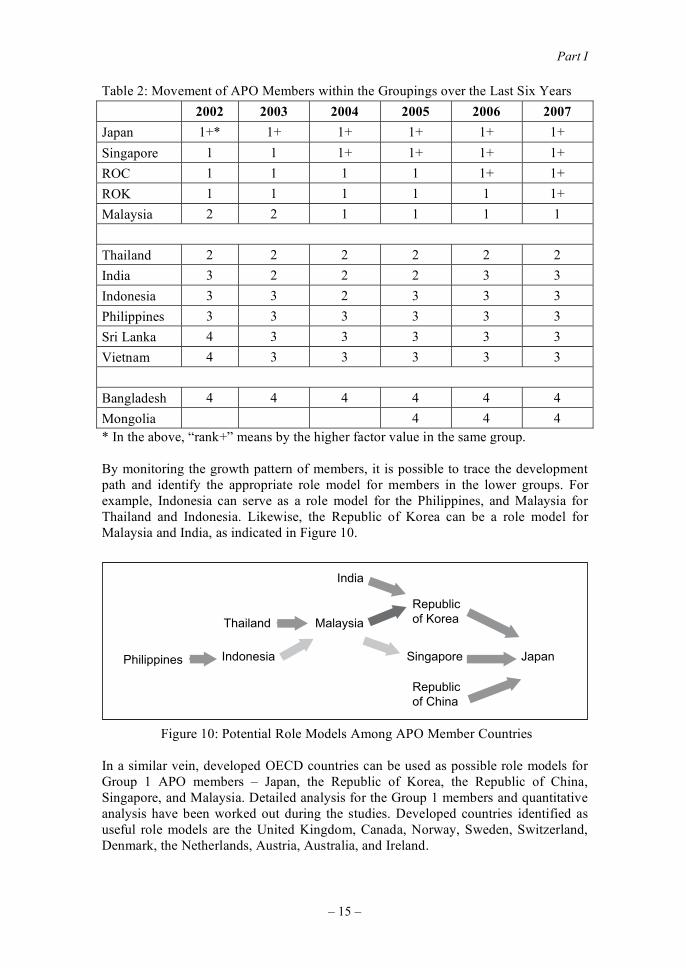
Observing each member country’s movement between groups for the most recent six
years, Japan continued to maintain the top position of Group 1 while Singapore joined
the top position in 2004. The Republic of China joined in 2006 while the Republic of
Korea joined in 2007. Malaysia moved to Group 1 from Group 2 in 2004. Thailand
consistently maintained its position in Group 2. From 2003, for 3 years, India joined
Group 2, then moved back to Group 3. Indonesia joined Group 2 in 2004, then moved
back to Group 3. The Philippines maintained its position in Group 3. Sri Lanka and
Vietnam joined Group 3 in 2003. Bangladesh and Mongolia have constantly remained
in Group 4. In Mongolia’s case, GCI data were reported starting from 2005. Four
members, Nepal, Iran, Fiji, and Lao PDR are not included in the table below due to
unavailability of GCI data.
Part I
– 15 –
Table 2: Movement of APO Members within the Groupings over the Last Six Years
2002 2003 2004 2005 2006 2007
Japan 1+* 1+ 1+ 1+ 1+ 1+
Singapore 1 1 1+ 1+ 1+ 1+
ROC 1 1 1 1 1+ 1+
ROK 1 1 1 1 1 1+
Malaysia 2 2 1 1 1 1
Thailand 2 2 2 2 2 2
India 3 2 2 2 3 3
Indonesia 3 3 2 3 3 3
Philippines 3 3 3 3 3 3
Sri Lanka 4 3 3 3 3 3
Vietnam 4 3 3 3 3 3
Bangladesh 4 4 4 4 4 4
Mongolia 4 4 4
* In the above, “rank+” means by the higher factor value in the same group.
By monitoring the growth pattern of members, it is possible to trace the development
path and identify the appropriate role model for members in the lower groups. For
example, Indonesia can serve as a role model for the Philippines, and Malaysia for
Thailand and Indonesia. Likewise, the Republic of Korea can be a role model for
Malaysia and India, as indicated in Figure 10.
Indonesia Singapore Japan
Republicof Korea
Republicof China
Thailand Malaysia
India
Philippines
Figure 10: Potential Role Models Among APO Member Countries
In a similar vein, developed OECD countries can be used as possible role models for
Group 1 APO members – Japan, the Republic of Korea, the Republic of China,
Singapore, and Malaysia. Detailed analysis for the Group 1 members and quantitative
analysis have been worked out during the studies. Developed countries identified as
useful role models are the United Kingdom, Canada, Norway, Sweden, Switzerland,
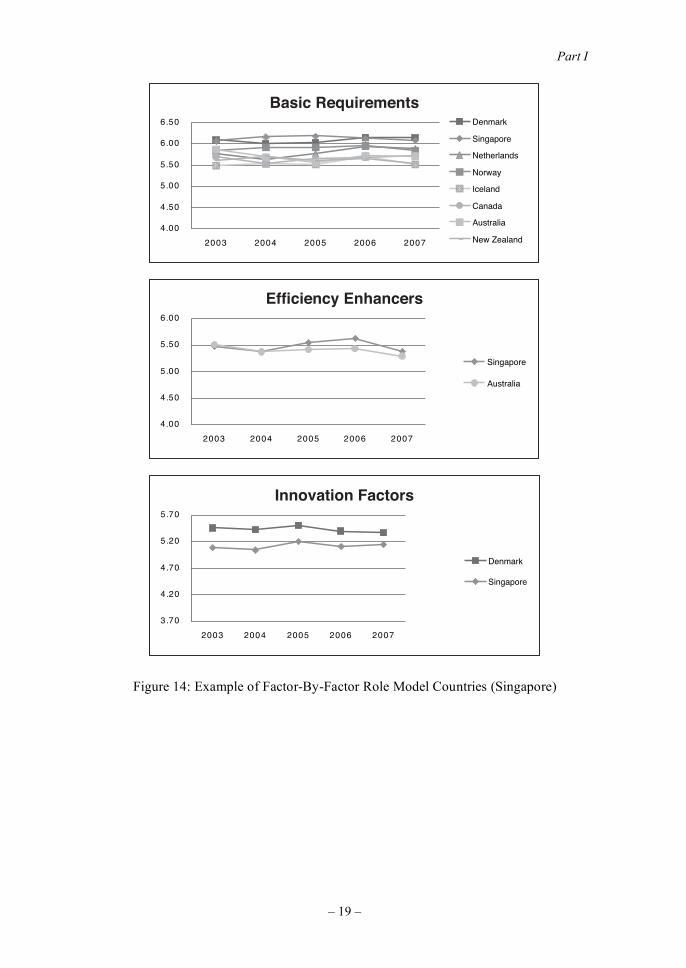
Denmark, the Netherlands, Austria, Australia, and Ireland.
Innovation Framework and Strategies: An APO Perspective
– 16 –
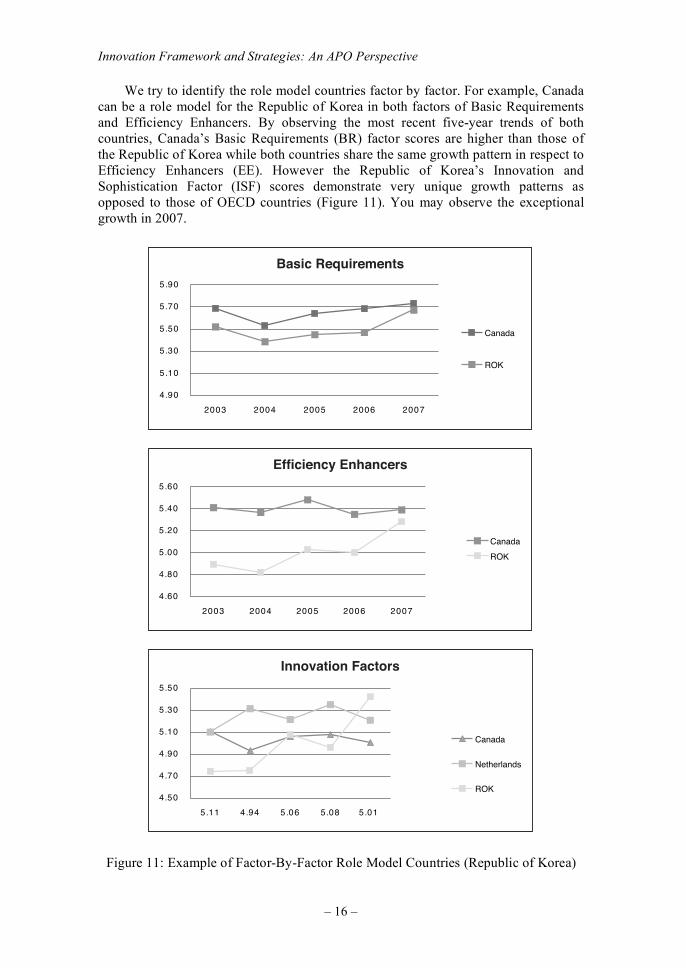
We try to identify the role model countries factor by factor. For example, Canada
can be a role model for the Republic of Korea in both factors of Basic Requirements
and Efficiency Enhancers. By observing the most recent five-year trends of both
countries, Canada’s Basic Requirements (BR) factor scores are higher than those of
the Republic of Korea while both countries share the same growth pattern in respect to
Efficiency Enhancers (EE). However the Republic of Korea’s Innovation and
Sophistication Factor (ISF) scores demonstrate very unique growth patterns as
opposed to those of OECD countries (Figure 11). You may observe the exceptional
growth in 2007.
09.4
01.5
03.5
05.5
07.5
09.5
70026002500240023002
Canada
ROK
06.4
08.4
00.5
02.5
04.5
06.5
70026002500240023002
Canada
ROK
05.4
07.4
09.4
01.5
03.5
05.5
10.580.560.549.411.5
Canada
Netherlands
ROK
Innovation Factors
Efficiency Enhancers
Basic Requirements
Figure 11: Example of Factor-By-Factor Role Model Countries (Republic of Korea)
Part I
– 17 –
09.4
01.5
03.5
05.5
07.5
09.5
01.6
03.6
70026002500240023002
Switzerland
Sweden
United States
Japan
Germany
06.4
08.4
00.5
02.5
04.5
06.5
08.5
70026002500240023002
Japan
Sweden
02.5
04.5
06.5
08.5
00.6
02.6
70026002500240023002
Switzerland
Sweden
Japan
Innovation Factors
Efficiency Enhancers
Basic Requirements
Figure 12: Example of Factor-By-Factor Role Model Countries (Japan)
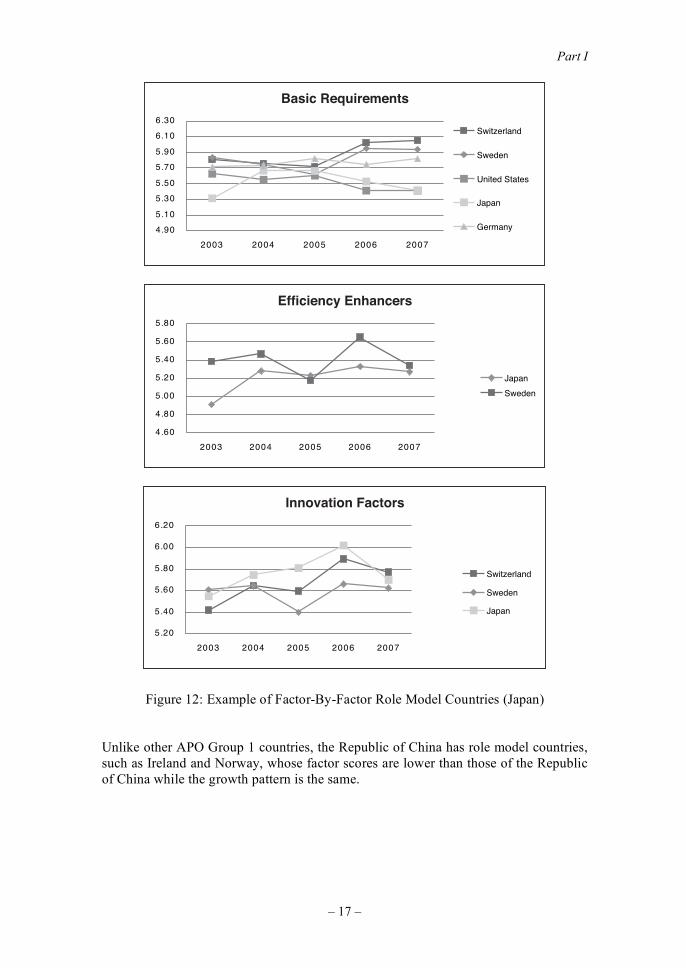
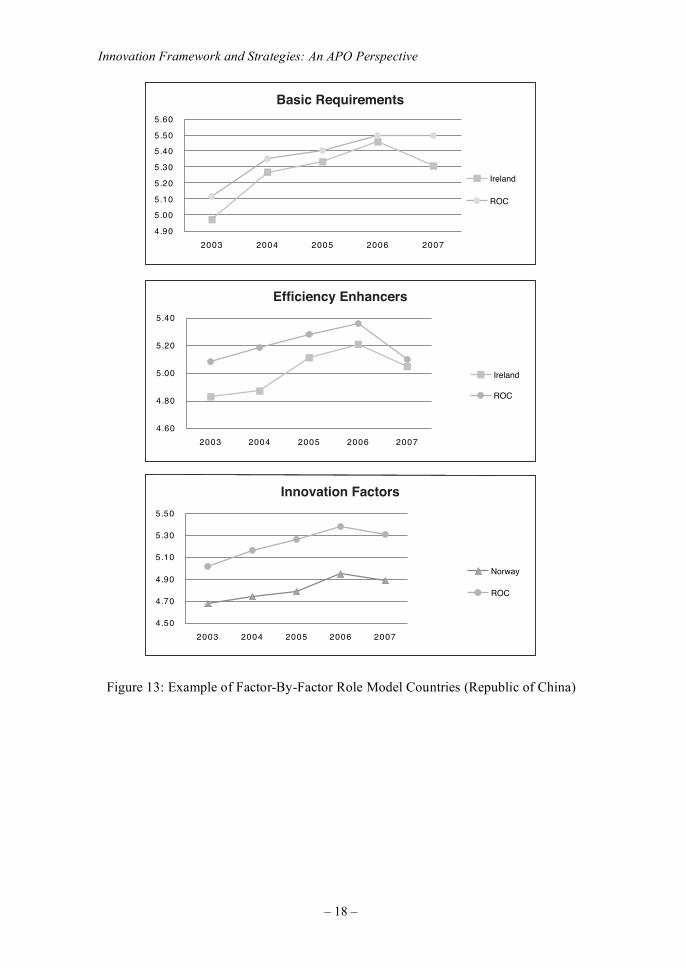
Unlike other APO Group 1 countries, the Republic of China has role model countries,
such as Ireland and Norway, whose factor scores are lower than those of the Republic
of China while the growth pattern is the same.
Innovation Framework and Strategies: An APO Perspective
– 18 –
09.4
00.5
01.5
02.5
03.5
04.5
05.5
06.5
70026002500240023002
Ireland
ROC
06.4
08.4
00.5
02.5
04.5
70026002500240023002
Ireland
ROC
05.4
07.4
09.4
01.5
03.5
05.5
70026002500240023002
Norway
ROC
Innovation Factors
Efficiency Enhancers
Basic Requirements
Figure 13: Example of Factor-By-Factor Role Model Countries (Republic of China)
Part I
– 19 –
00.4
05.4
00.5
05.5
00.6
05.6
70026002500240023002
Denmark
Singapore
Netherlands
Norway
Iceland
Canada
Australia
New Zealand
00.4
05.4
00.5
05.5
00.6
70026002500240023002
Singapore
Australia
07.3
02.4
07.4
02.5
07.5
70026002500240023002
Denmark
Singapore
Innovation Factors
Efficiency Enhancers
Basic Requirements
Figure 14: Example of Factor-By-Factor Role Model Countries (Singapore)
Innovation Framework and Strategies: An APO Perspective
– 20 –
09.400.501.502.503.504.505.506.507.508.509.500.6
70026002500240023002
Norway
Iceland
Ireland
Malaysia
05.406.407.408.409.400.501.502.503.504.505.5
70026002500240023002
Austria
Malaysia
00.4
02.4
04.4
06.4
08.4
00.5
02.5
04.5
6002 7002500240023002
Malaysia
Austria
Norway
Innovation Factors
Efficiency Enhancers
Basic Requirements
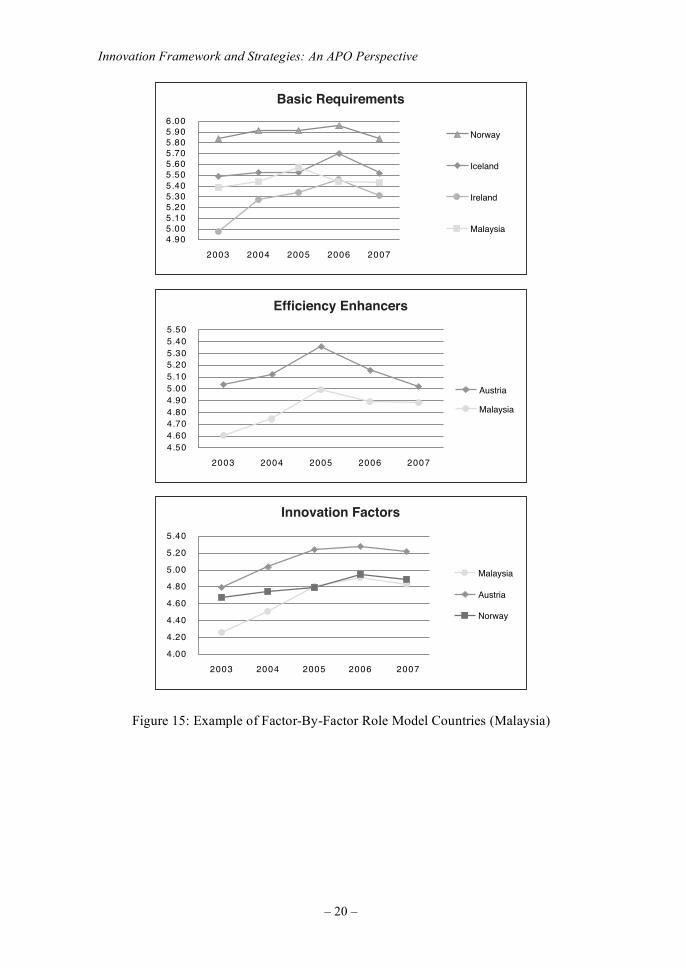
Figure 15: Example of Factor-By-Factor Role Model Countries (Malaysia)
Part I
– 21 –
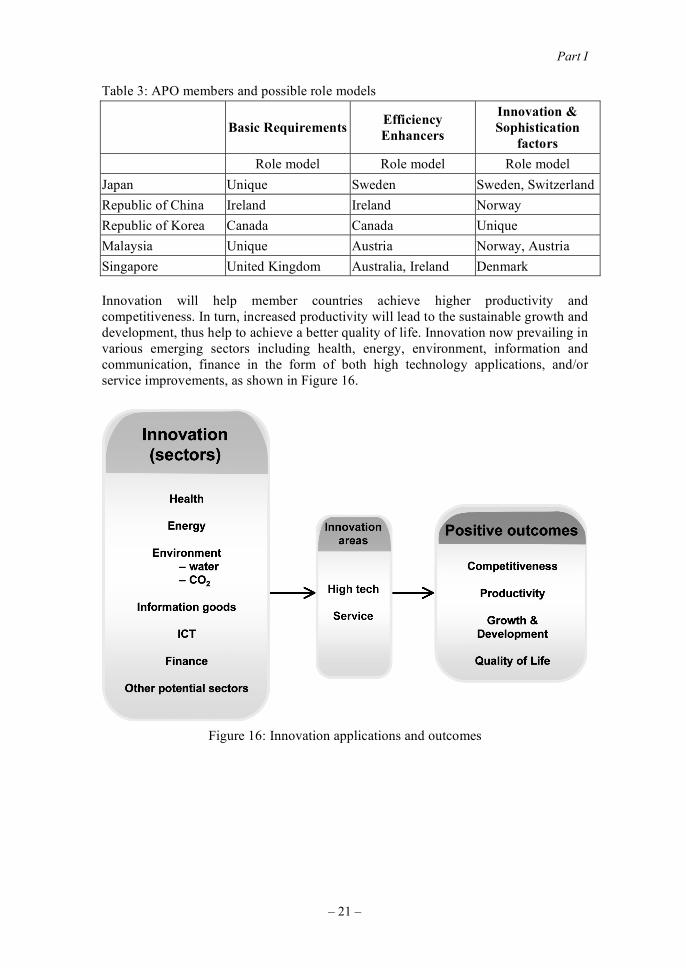
Table 3: APO members and possible role models
Basic Requirements Efficiency
Enhancers
Innovation &
Sophistication
factors
Role model Role model Role model
Japan Unique Sweden Sweden, Switzerland
Republic of China Ireland Ireland Norway
Republic of Korea Canada Canada Unique
Malaysia Unique Austria Norway, Austria
Singapore United Kingdom Australia, Ireland Denmark
Innovation will help member countries achieve higher productivity and
competitiveness. In turn, increased productivity will lead to the sustainable growth and
development, thus help to achieve a better quality of life. Innovation now prevailing in
various emerging sectors including health, energy, environment, information and
communication, finance in the form of both high technology applications, and/or
service improvements, as shown in Figure 16.
Figure 16: Innovation applications and outcomes
Innovation Framework and Strategies: An APO Perspective
– 22 –
CONCLUSIONS
After extensive deliberations by the expert group over three meetings in Langkawi
(Malaysia), Singapore and Kuala Lumpur, the following salient observations were
derived:
1) The level of commitment to innovation among APO members should be tailored
to the stage of economic development of individual members;
2) The outcomes sought and areas of focus may vary among the APO members;
3) The grouping of members will facilitate the sharing of best practices among
cohorts;
4) The adoption of role models from higher groups would accelerate the learning
process;
5) The European Union can serve as a good reference to benchmark the progress and
achievements of APO members; and,
6) The data available in the GCI can serve as a good mechanism to measure and
compare the competitiveness and innovation capacity of APO members and their
international counterparts.
The expert group also formulated static and dynamic versions of the Innovation
Framework that could be adopted as a reference framework by APO members.
RECOMMENDATIONS
The Expert Group on Innovation focused largely on the seven participating APO
members. More APO members were involved in a follow-up forum in Kuala Lumpur.
As suggested by the WEF, even countries that are at an earlier stage of economic
development should attempt to allocate some resources to build up their innovation
capabilities. More innovation programs should be organized by APO for members to
gain greater awareness and share best practices. While the GCR provides a good
assessment of competitiveness and innovation, later studies may wish to consider the
use of other measures such as the Oslo Manual.
Innovation is recognized internationally to be an important driver for economic
and social progress and well-being. The United States and European Union have
drawn up the comprehensive blueprints and programs to forge ahead. It is imperative
for APO members to keep up. Observational study missions to these countries would
be beneficial for APO members to appraise their comparative positions and understand
the challenges and best practices.
Part I
– 23 –
REFERENCES
Innovation and the Lisbon Strategy, Summary of Legislation, Europe; May 2003.
Michael E. Porter, editor. The Global Competitiveness Report 2007 – 2008. Palgrave
Macmillan; 2007.
F. Duane Ackerman, et al. Innovate America. National Innovation Initiative Summit
and Report, Council on Competitiveness; 2004.
Competitiveness and Innovation Framework Program (CIP). CORDIS: European
Innovation Portal.
Innovation and Growth – Rational for an Innovative Strategy. OECD; 2007.
Sanae Takaichi, et al. Innovation 25 – Creating the Future, Challenge Unlimited
Possibilities. Interim Report, Innovation 25 Strategy Council; 2007.
National Innovation Framework for Action. Spring, 1998.
Fortunato T. De La Pena, et al. Filipinnovation – The Philippine National Innovation
Strategy. National Innovation Summit; 2007.
NIA Perspective. National Innovation Agency, Ministry of Science and Technology.
Soren Eriksson. Innovation Policies in South Korea & Taiwan. Jonkoping
International Business School, VINNOVA analysis; July 2005.

Quantitative Analysis for Selected APO Member Countries
– 23 –
PART II
NATIONAL COMPETITIVENESS ANALYSIS:
GROWTH PATTERNS AND ROLE MODEL
COUNTRIES
Quantitative Analysis for Selected APO Member Countries
– 27 –
QUANTITATIVE ANALYSIS FOR SELECTED
APO MEMBER COUNTRIES
OVERVIEW
The first focus of this quantitative analysis is to observe the longitudinal pattern
changes of the relative BR, EE, and ISF scores of the countries discussed in the
background section (Figure 2). We have observed the BR, EE, and ISF score relative
growth patterns for the countries of Japan (JP), the Republic of Korea (KR), Malaysia
(MY), the Republic of China (TW), Thailand (TH), the Philippines (PH), and
Singapore (SG).
As observed in Figure 3, the top four EU countries and the top APO member
countries share the same BR, EE, and ISF score pattern – a “V-shaped curve” (i.e., the
BR score is highest, followed by the ISF, then the EE). While the score pattern of
developed countries is V-shaped, as in Figure 17, the score pattern of under-developed
countries is “reverse V-shaped” as in Figure 19 (i.e., the EE score is highest, followed
by the BR, then the ISF). The transitory score pattern is rather linear as in Figure 18
(the BR score is highest, followed by the EE score, then the ISF score). From this fact,
we can easily draw the conjecture that an under-developed country should focus on
upgrading EE initially, then shift its focus to BR, after which ISF enhancement would
be the final action to become a developed country, not to mention upgrading all the
BR, EE, and ISF scores generally.
5.42
5.67
5.28
05.4
00.5
05.5
00.6
FSIEERB
2007
Figure 17: Score Pattern of a Developed Country
Innovation Framework and Strategies: An APO Perspective
– 28 –
4.04
4.56
5.03
05.3
00.4
05.4
00.5
05.5
00.6
FSIEERB
2007
Figure 18: Score Pattern of a Developing Country
3.61
3.09
4.03
00.3
05.3
00.4
05.4
00.5
FSIEERB
2007
Figure 19: Score Pattern of an Under-Developed Country
Quantitative Analysis for Selected APO Member Countries
– 29 –
GROUP 1 COUNTRIES
The longitudinal score pattern changes of seven APO member countries are observed
as follows. Thailand and the Philippines are presented as representative examples of
Group 2 and Group 3 countries.
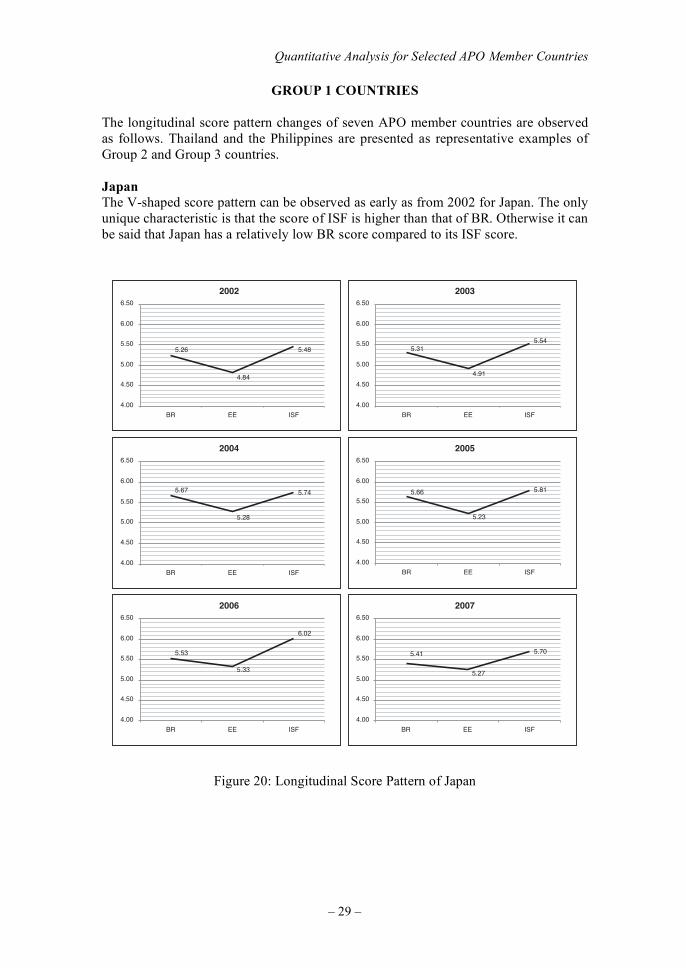
Japan
The V-shaped score pattern can be observed as early as from 2002 for Japan. The only
unique characteristic is that the score of ISF is higher than that of BR. Otherwise it can
be said that Japan has a relatively low BR score compared to its ISF score.
2002
5.26
4.84
5.48
00.4
05.4
00.5
05.5
00.6
05.6
FSIEERB
3002
5.31
4.91
5.54
00.4
05.4
00.5
05.5
00.6
05.6
FSIEERB
4002
5.67
5.28
5.74
00.4
05.4
00.5
05.5
00.6
05.6
FSIEERB
5002
5.66
5.23
5.81
00.4
05.4
00.5
05.5
00.6
05.6
FSIEERB
6002
5.53
5.33
6.02
00.4
05.4
00.5
05.5
00.6
05.6
FSIEERB
7002
5.705.41
5.27
00.4
05.4
00.5
05.5
00.6
05.6
FSIEERB
Figure 20: Longitudinal Score Pattern of Japan
Innovation Framework and Strategies: An APO Perspective
– 30 –
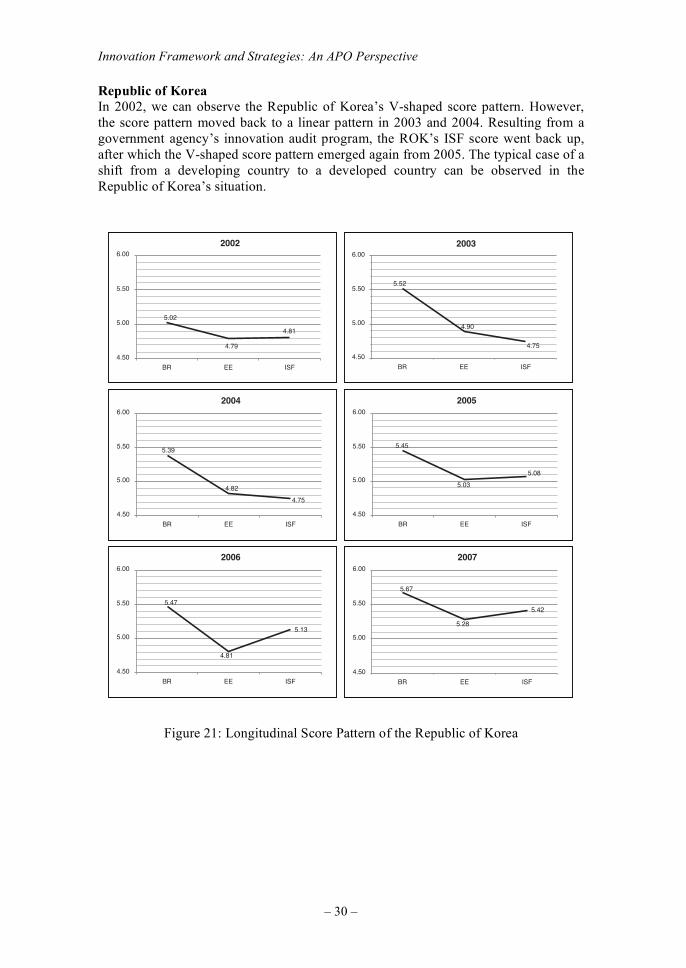
Republic of Korea
In 2002, we can observe the Republic of Korea’s V-shaped score pattern. However,
the score pattern moved back to a linear pattern in 2003 and 2004. Resulting from a
government agency’s innovation audit program, the ROK’s ISF score went back up,
after which the V-shaped score pattern emerged again from 2005. The typical case of a
shift from a developing country to a developed country can be observed in the
Republic of Korea’s situation.
6002
31.5
74.5
18.4
05.4
00.5
05.5
00.6
FSIEERB
2002
20.5
97.4
18.4
05.4
00.5
05.5
00.6
FSIEERB
3002
25.5
09.4
57.4
05.4
00.5
05.5
00.6
FSIEERB
4002
93.5
28.4
57.4
05.4
00.5
05.5
00.6
FSIEERB
5002
54.5
30.5
80.5
05.4
00.5
05.5
00.6
FSIEERB
7002
24.5
76.5
82.5
05.4
00.5
05.5
00.6
FSIEERB
Figure 21: Longitudinal Score Pattern of the Republic of Korea
Quantitative Analysis for Selected APO Member Countries
– 31 –
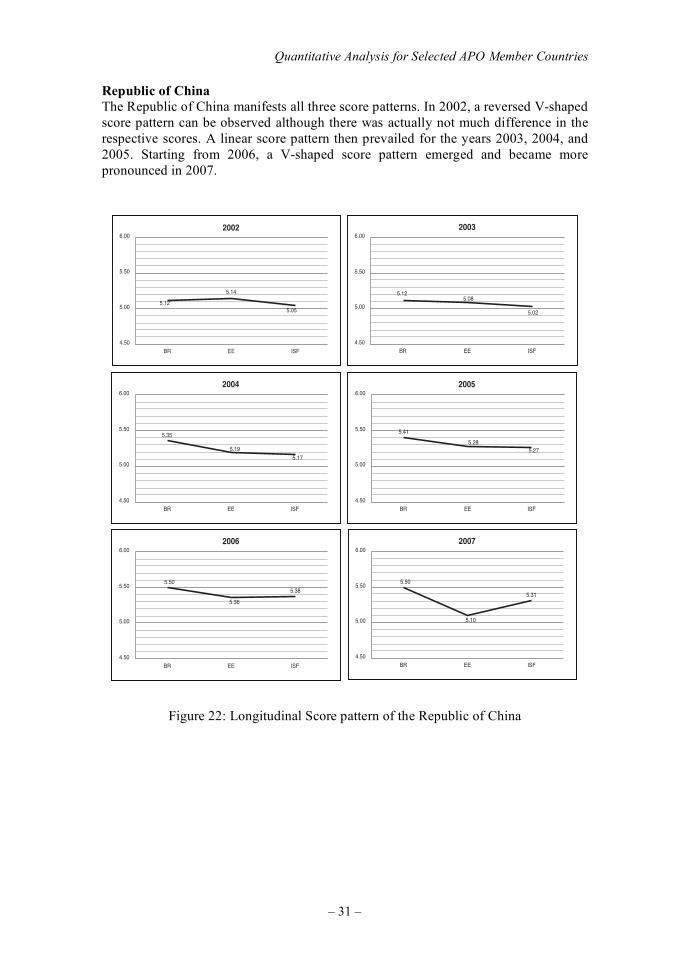
Republic of China
The Republic of China manifests all three score patterns. In 2002, a reversed V-shaped
score pattern can be observed although there was actually not much difference in the
respective scores. A linear score pattern then prevailed for the years 2003, 2004, and
2005. Starting from 2006, a V-shaped score pattern emerged and became more
pronounced in 2007.
2002
21.5
41.5
50.5
05.4
00.5
05.5
00.6
FSIEERB
3002
21.580.5
20.5
05.4
00.5
05.5
00.6
FSIEERB
4002
53.5
91.571.5
05.4
00.5
05.5
00.6
FSIEERB
5002
14.5
82.572.5
05.4
00.5
05.5
00.6
FSIEERB
6002
05.5
63.5
83.5
05.4
00.5
05.5
00.6
FSIEERB
7002
05.5
01.5
13.5
05.4
00.5
05.5
00.6
FSIEERB
Figure 22: Longitudinal Score pattern of the Republic of China
Innovation Framework and Strategies: An APO Perspective
– 32 –
Singapore
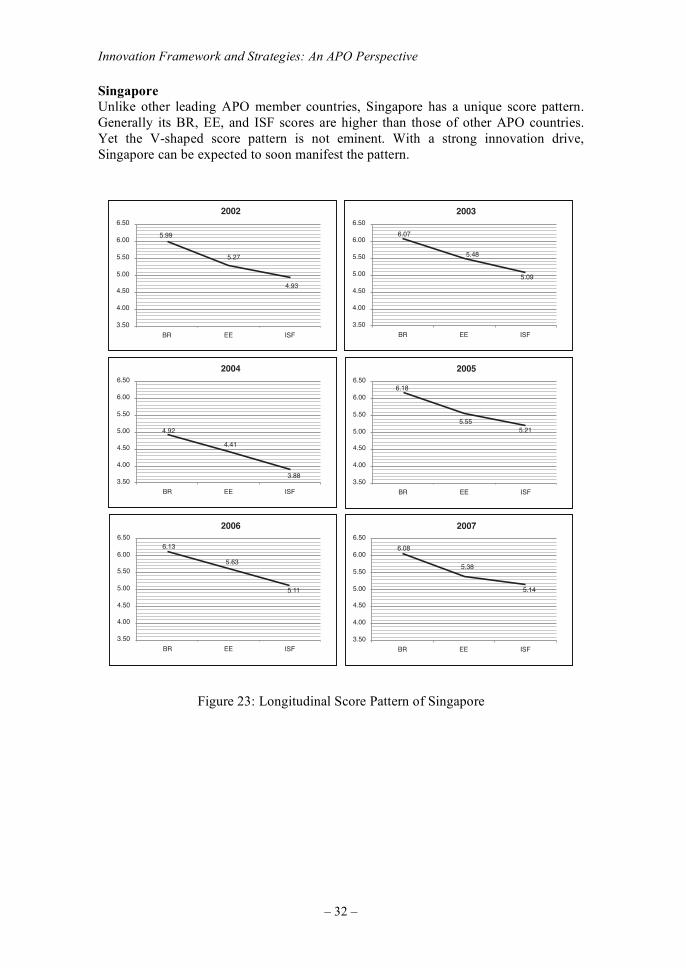
Unlike other leading APO member countries, Singapore has a unique score pattern.
Generally its BR, EE, and ISF scores are higher than those of other APO countries.
Yet the V-shaped score pattern is not eminent. With a strong innovation drive,
Singapore can be expected to soon manifest the pattern.
2002
99.5
72.5
39.4
05.3
00.4
05.4
00.5
05.5
00.6
05.6
FSIEERB
3002
70.6
84.5
90.5
05.3
00.4
05.4
00.5
05.5
00.6
05.6
FSIEERB
4002
29.4
14.4
88.305.3
00.4
05.4
00.5
05.5
00.6
05.6
FSIEERB
5002
81.6
55.512.5
05.3
00.4
05.4
00.5
05.5
00.6
05.6
FSIEERB
6002
31.6
36.5
11.5
05.3
00.4
05.4
00.5
05.5
00.6
05.6
FSIEERB
7002
80.6
83.5
41.5
05.3
00.4
05.4
00.5
05.5
00.6
05.6
FSIEERB
Figure 23: Longitudinal Score Pattern of Singapore
Quantitative Analysis for Selected APO Member Countries
– 33 –
Malaysia
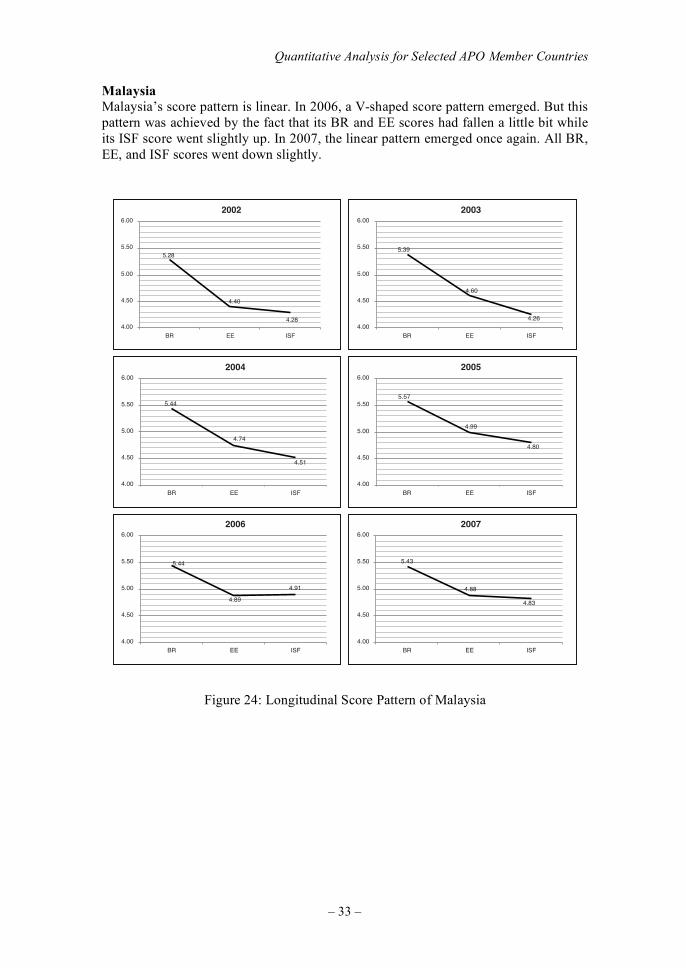
Malaysia’s score pattern is linear. In 2006, a V-shaped score pattern emerged. But this
pattern was achieved by the fact that its BR and EE scores had fallen a little bit while
its ISF score went slightly up. In 2007, the linear pattern emerged once again. All BR,
EE, and ISF scores went down slightly.
2002
82.5
04.4
82.400.4
05.4
00.5
05.5
00.6
FSIEERB
3002
93.5
06.4
62.400.4
05.4
00.5
05.5
00.6
FSIEERB
4002
44.5
47.4
15.4
00.4
05.4
00.5
05.5
00.6
FSIEERB
5002
75.5
99.4
08.4
00.4
05.4
00.5
05.5
00.6
FSIEERB
6002
44.5
98.4
19.4
00.4
05.4
00.5
05.5
00.6
FSIEERB
7002
34.5
88.4
38.4
00.4
05.4
00.5
05.5
00.6
FSIEERB
Figure 24: Longitudinal Score Pattern of Malaysia
Innovation Framework and Strategies: An APO Perspective
– 34 –
GROUP 2 COUNTRY: THAILAND
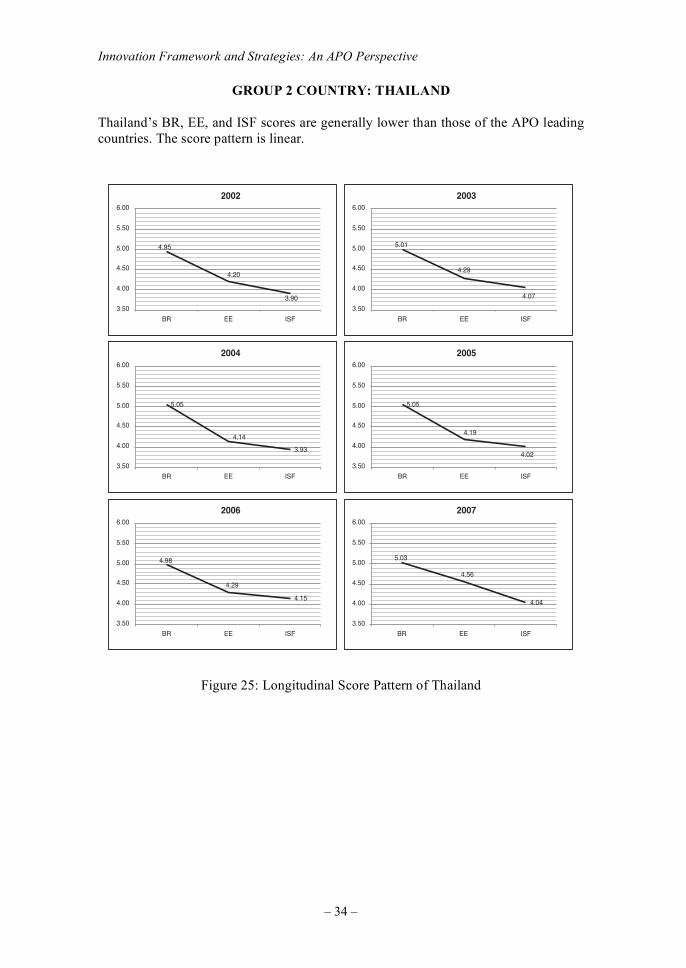
Thailand’s BR, EE, and ISF scores are generally lower than those of the APO leading
countries. The score pattern is linear.
2002
59.4
02.4
09.3
05.3
00.4
05.4
00.5
05.5
00.6
FSIEERB
3002
10.5
92.4
70.4
05.3
00.4
05.4
00.5
05.5
00.6
FSIEERB
4002
50.5
41.4
39.3
05.3
00.4
05.4
00.5
05.5
00.6
FSIEERB
5002
50.5
91.4
20.4
05.3
00.4
05.4
00.5
05.5
00.6
FSIEERB
6002
51.4
89.4
92.4
05.3
00.4
05.4
00.5
05.5
00.6
FSIEERB
7002
40.4
30.5
65.4
05.3
00.4
05.4
00.5
05.5
00.6
FSIEERB
Figure 25: Longitudinal Score Pattern of Thailand
Quantitative Analysis for Selected APO Member Countries
– 35 –
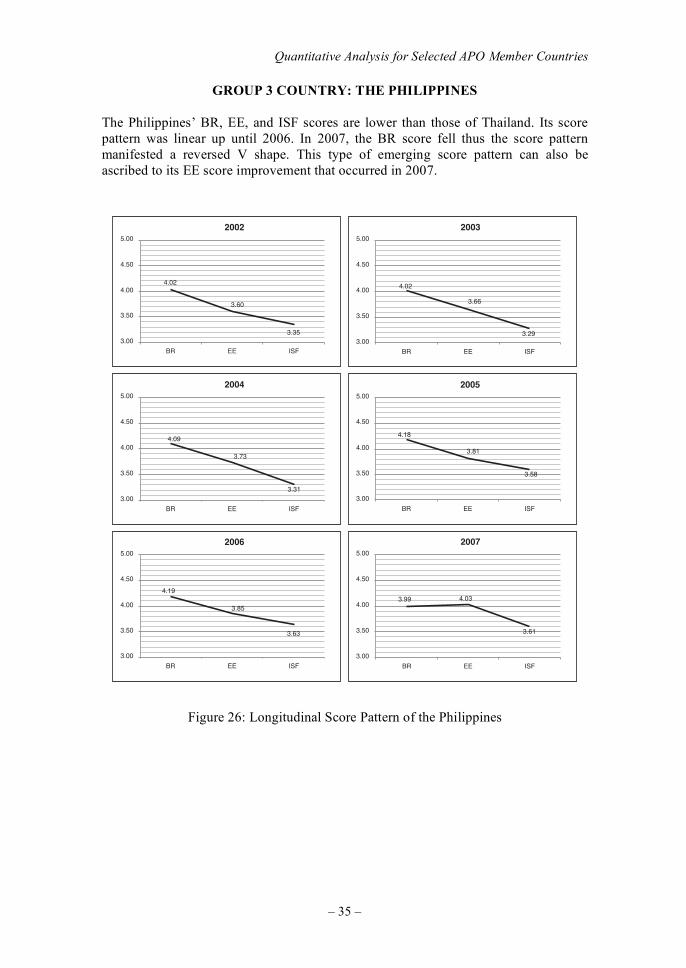
GROUP 3 COUNTRY: THE PHILIPPINES
The Philippines’ BR, EE, and ISF scores are lower than those of Thailand. Its score
pattern was linear up until 2006. In 2007, the BR score fell thus the score pattern
manifested a reversed V shape. This type of emerging score pattern can also be
ascribed to its EE score improvement that occurred in 2007.
2002
20.4
06.3
53.300.3
05.3
00.4
05.4
00.5
FSIEERB
3002
20.4
66.3
92.300.3
05.3
00.4
05.4
00.5
FSIEERB
4002
90.4
37.3
13.300.3
05.3
00.4
05.4
00.5
FSIEERB
5002
81.4
18.3
85.3
00.3
05.3
00.4
05.4
00.5
FSIEERB
6002
91.4
58.3
36.3
00.3
05.3
00.4
05.4
00.5
FSIEERB
7002
99.3 30.4
16.3
00.3
05.3
00.4
05.4
00.5
FSIEERB
Figure 26: Longitudinal Score Pattern of the Philippines
– 36 –
QUALITATIVE ANALYSIS —
COMPARATIVE AND LONGITUDINAL VIEWS
OVERVIEW
For this study, qualitative analyses on the five leading APO member countries along with Thailand and the Philippines* were conducted. Each analysis consisted of five areas of attention: 1) static analysis (current rankings); 2) areas of concern; 3) growth pattern, or the V-shaped curve; 4) comparison with another country as a role model; and 5) initiatives, programs, and best practices. * Thailand and the Philippines were selected as representative of APO Group 2 and Group 3 countries,
respectively.
“Static analysis” starts with country ranking information worldwide and among APO member countries. Each country’s relative strengths in Basic Requirements (BR), Efficiency Enhancers (EE), and Innovation & Sophistication Factors (ISF) are then compared. Among all factors, the weakest sub-factors are identified. The intent of “areas of concern” is to provide more specific identification of noteworthy Level 2 and Level 3 factors of BR, EE, and ISF. After looking at these areas, an effort is made to observe how the areas of concern might be addressed to propel the country onto the next higher stage of development without necessarily reinventing the wheel. Using the “V-shaped curve” approach, we could then assess the growth patterns or appearance of V-shaped score patterns for the country under study. A qualitative explanation on the emergence of the pattern is given. “Comparison with another country as role model” presents a vis-à-vis comparison of the most recent five-year BR, EE, and ISF scores. An appropriate role model is indicated for each country, and their relative strengths and weaknesses are compared. More specific comparisons of sub-factors are also carried out. Finally, the qualitative analysis for each country concludes with possible initiatives, programs, and best practices to be considered.
GROUP 1 COUNTRIES
Japan
Static Analysis – Japan’s Development Trajectory
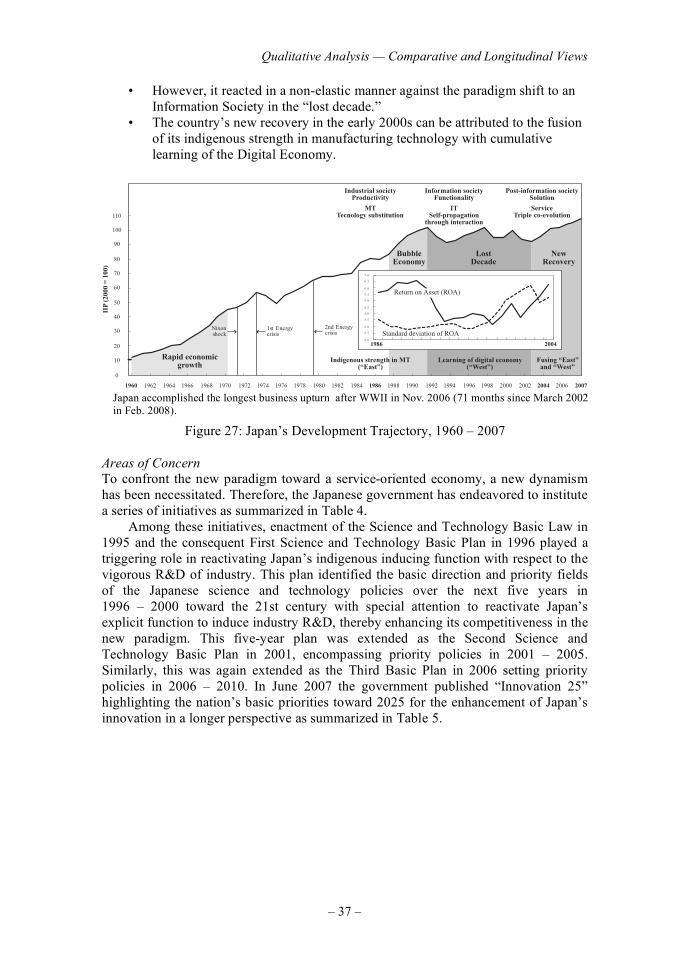
Figure 27 shows Japan’s development trajectory over the 1960 – 2007 period. Looking at the figure we can see the following noteworthy developments:
• Japan incorporates an explicit function in technology substitution for scarce resources that enabled rapid economic growth in the 1960s.
• This was followed by technology substitution for energy in the 1970s leading to the world’s highest energy efficiency and the high technology “miracle” in the 1980s.
Qualitative Analysis — Comparative and Longitudinal Views
– 37 –
• However, it reacted in a non-elastic manner against the paradigm shift to an Information Society in the “lost decade.”
• The country’s new recovery in the early 2000s can be attributed to the fusion of its indigenous strength in manufacturing technology with cumulative learning of the Digital Economy.
0
10
20
30
40
50
60
70
80
90
100
110
1960 1962 1976197419701968 197219661964 20061980 20071998199619941992 2004200220001990198619841982 19881978
1st Energycrisis
2nd Energycrisis
BubbleEconomy
Rapid economicgrowth
LostDecade
NewRecovery
Fusing “East”and “West”
Learning of digital economy(“West”)
Indigenous strength in MT(“East”)
IIP
(200
0 =
100
)
Industrial societyProductivity
MTTecnology substitution
Information societyFunctionality
ITSelf-propagation
through interaction
Post-information societySolution
ServiceTriple co-evolution
Nixonshock
2 .0
2 .5
3 .0
3 .5
4 .0
4 .5
5 .0
5 .5
6 .0
6 .5
7 .0
Standard deviation of ROA
1986 2004
Return on Asset (ROA)
Japan accomplished the longest business upturn after WWII in Nov. 2006 (71 months since March 2002
in Feb. 2008).
Figure 27: Japan’s Development Trajectory, 1960 – 2007
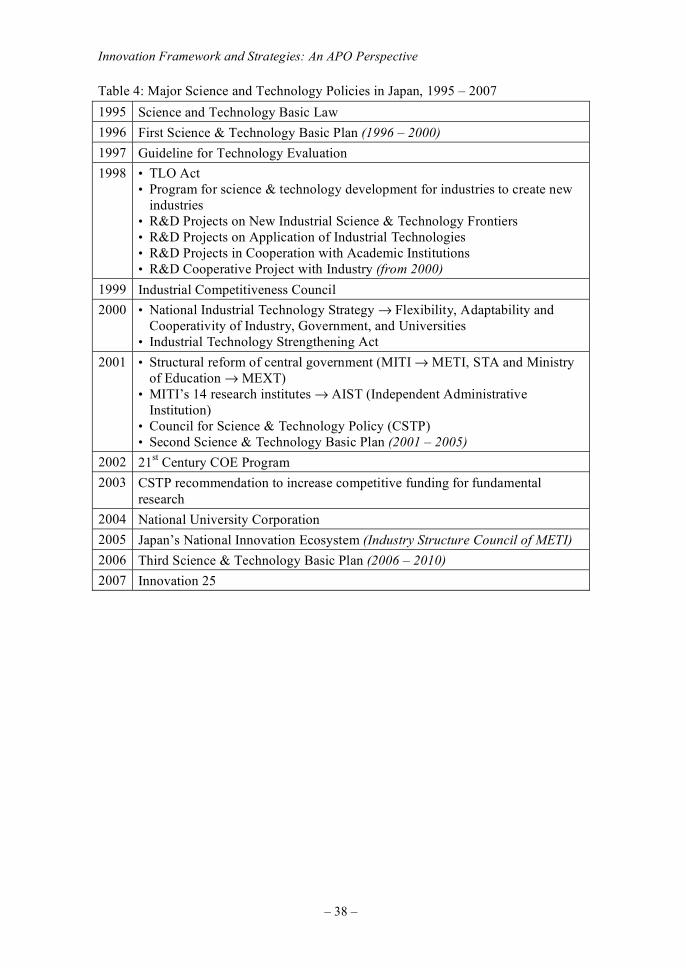
Areas of Concern
To confront the new paradigm toward a service-oriented economy, a new dynamism has been necessitated. Therefore, the Japanese government has endeavored to institute a series of initiatives as summarized in Table 4. Among these initiatives, enactment of the Science and Technology Basic Law in 1995 and the consequent First Science and Technology Basic Plan in 1996 played a triggering role in reactivating Japan’s indigenous inducing function with respect to the vigorous R&D of industry. This plan identified the basic direction and priority fields of the Japanese science and technology policies over the next five years in 1996 – 2000 toward the 21st century with special attention to reactivate Japan’s explicit function to induce industry R&D, thereby enhancing its competitiveness in the new paradigm. This five-year plan was extended as the Second Science and Technology Basic Plan in 2001, encompassing priority policies in 2001 – 2005. Similarly, this was again extended as the Third Basic Plan in 2006 setting priority policies in 2006 – 2010. In June 2007 the government published “Innovation 25” highlighting the nation’s basic priorities toward 2025 for the enhancement of Japan’s innovation in a longer perspective as summarized in Table 5.
Innovation Framework and Strategies: An APO Perspective
– 38 –
Table 4: Major Science and Technology Policies in Japan, 1995 – 2007
1995 Science and Technology Basic Law
1996 First Science & Technology Basic Plan (1996 – 2000)
1997 Guideline for Technology Evaluation
1998 • TLO Act • Program for science & technology development for industries to create new
industries • R&D Projects on New Industrial Science & Technology Frontiers • R&D Projects on Application of Industrial Technologies • R&D Projects in Cooperation with Academic Institutions • R&D Cooperative Project with Industry (from 2000)
1999 Industrial Competitiveness Council
2000 • National Industrial Technology Strategy → Flexibility, Adaptability and Cooperativity of Industry, Government, and Universities
• Industrial Technology Strengthening Act
2001 • Structural reform of central government (MITI → METI, STA and Ministry of Education → MEXT)
• MITI’s 14 research institutes → AIST (Independent Administrative Institution)
• Council for Science & Technology Policy (CSTP) • Second Science & Technology Basic Plan (2001 – 2005)
2002 21st Century COE Program
2003 CSTP recommendation to increase competitive funding for fundamental
research
2004 National University Corporation
2005 Japan’s National Innovation Ecosystem (Industry Structure Council of METI)
2006 Third Science & Technology Basic Plan (2006 – 2010)
2007 Innovation 25
Qualitative Analysis — Comparative and Longitudinal Views
– 39 –
Table 5: Innovation 25 (June 2007)
Objectives • Long-term strategy guidelines toward 2025 • Aims at accomplishing sustainable growth with an affluent
society • By overcoming population decline through productivity in-
crease by means of innovation
Basic principles • 20-year, long-term perspective • Integrated strategy between science & technology and institu-
tional systems • Responsibility as one of the global leaders
Japan in 2025 • Society’s members guaranteed a lifetime of good health • Community secured by safety and ease • Country enabling broad options • Nations contributing to overcoming global constraints • Borderless society open to the global community
Major impediments • Insufficient multiplier effects of M&A • Reluctance toward innovative investment • Local optimization in IT utilization
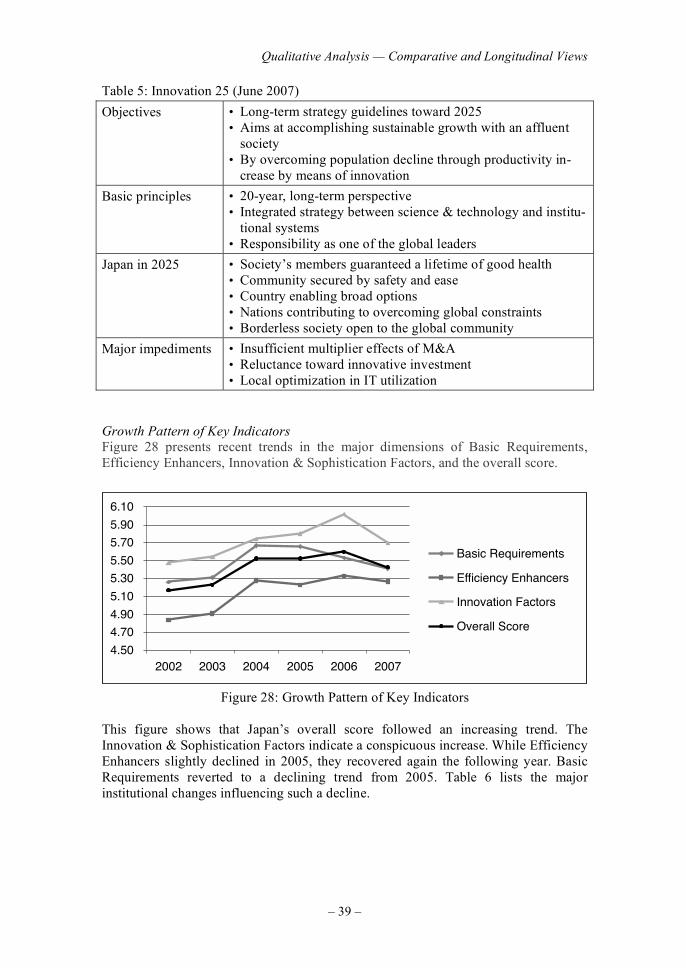
Growth Pattern of Key Indicators
Figure 28 presents recent trends in the major dimensions of Basic Requirements, Efficiency Enhancers, Innovation & Sophistication Factors, and the overall score.
05.4
07.4
09.4
01.5
03.5
05.5
07.5
09.5
01.6
700260025002400230022002
stnemeriuqeR cisaB
srecnahnE ycneiciffE
srotcaF noitavonnI
erocS llarevO
Figure 28: Growth Pattern of Key Indicators This figure shows that Japan’s overall score followed an increasing trend. The Innovation & Sophistication Factors indicate a conspicuous increase. While Efficiency Enhancers slightly declined in 2005, they recovered again the following year. Basic Requirements reverted to a declining trend from 2005. Table 6 lists the major institutional changes influencing such a decline.
Innovation Framework and Strategies: An APO Perspective
– 40 –
Table 6: Economic, Social, and Political Changes Affecting Growth Pattern
2002 • Yen recorded its lowest level in February (134.7 yen = $1) • World Cup
2003 • Second Koizumi Administration (accelerating administrative re-form)
2004 • Appreciation of the yen
2005 • Leading party (LDP) recorded an overwhelming victory in the na-tional Diet election
• Privatization of postal administration
2006 • Third Science & Technology Basic Plan (2006 – 2010) • Relaxation of fixed interest rate (to zero interest) • Record-longest economic expansion since WWII
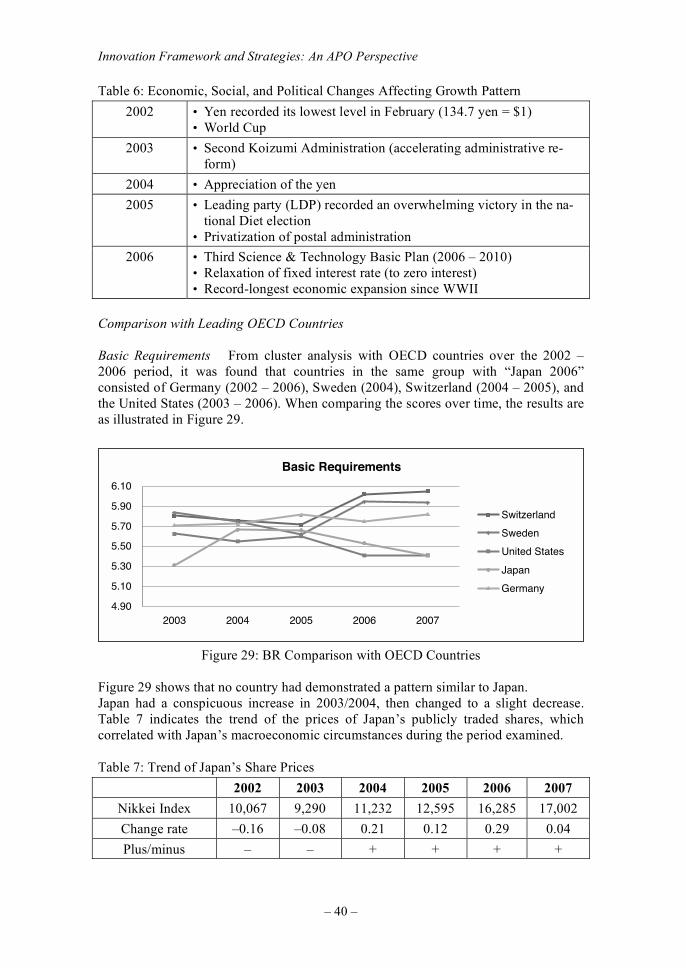
Comparison with Leading OECD Countries
Basic Requirements From cluster analysis with OECD countries over the 2002 – 2006 period, it was found that countries in the same group with “Japan 2006” consisted of Germany (2002 – 2006), Sweden (2004), Switzerland (2004 – 2005), and the United States (2003 – 2006). When comparing the scores over time, the results are as illustrated in Figure 29.
stnemeriuqeR cisaB
09.4
01.5
03.5
05.5
07.5
09.5
01.6
70026002500240023002
dnalreztiwS
nedewS
setatS detinU
napaJ
ynamreG
Figure 29: BR Comparison with OECD Countries Figure 29 shows that no country had demonstrated a pattern similar to Japan. Japan had a conspicuous increase in 2003/2004, then changed to a slight decrease. Table 7 indicates the trend of the prices of Japan’s publicly traded shares, which correlated with Japan’s macroeconomic circumstances during the period examined.
Table 7: Trend of Japan’s Share Prices
2002 2003 2004 2005 2006 2007
Nikkei Index 10,067 9,290 11,232 12,595 16,285 17,002
Change rate –0.16 –0.08 0.21 0.12 0.29 0.04
Plus/minus – – + + + +
Qualitative Analysis — Comparative and Longitudinal Views
– 41 –
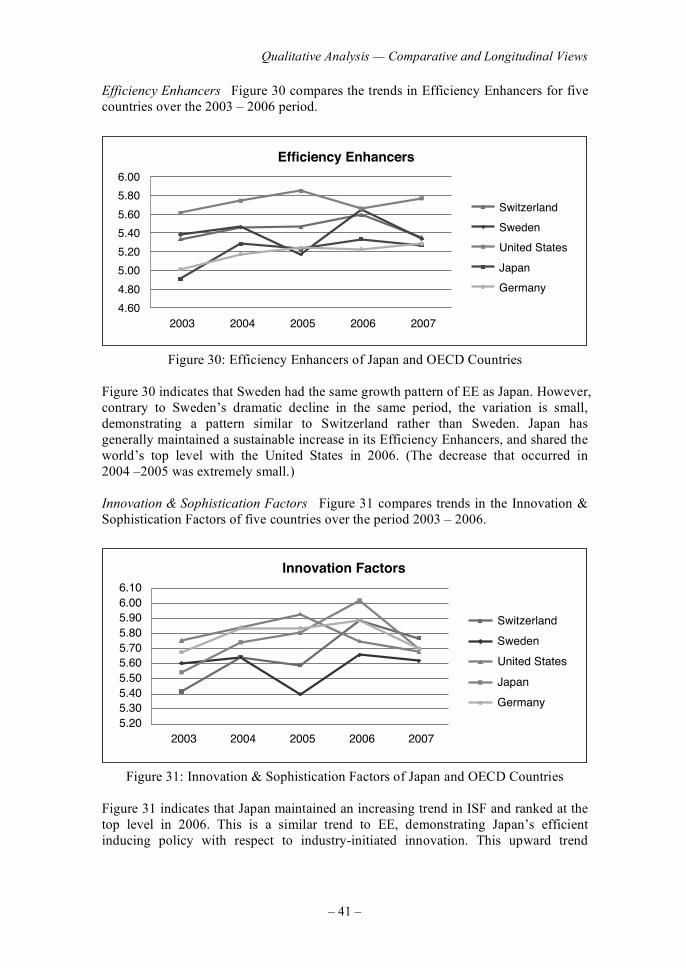
Efficiency Enhancers Figure 30 compares the trends in Efficiency Enhancers for five countries over the 2003 – 2006 period.
srecnahnE ycneiciffE
06.4
08.4
00.5
02.5
04.5
06.5
08.5
00.6
70026002500240023002
dnalreztiwS
nedewS
setatS detinU
napaJ
ynamreG
Figure 30: Efficiency Enhancers of Japan and OECD Countries Figure 30 indicates that Sweden had the same growth pattern of EE as Japan. However, contrary to Sweden’s dramatic decline in the same period, the variation is small, demonstrating a pattern similar to Switzerland rather than Sweden. Japan has generally maintained a sustainable increase in its Efficiency Enhancers, and shared the world’s top level with the United States in 2006. (The decrease that occurred in 2004 –2005 was extremely small.) Innovation & Sophistication Factors Figure 31 compares trends in the Innovation & Sophistication Factors of five countries over the period 2003 – 2006.
srotcaF noitavonnI
02.503.504.505.506.507.508.509.500.601.6
70026002500240023002
dnalreztiwS
nedewS
setatS detinU
napaJ
ynamreG
Figure 31: Innovation & Sophistication Factors of Japan and OECD Countries Figure 31 indicates that Japan maintained an increasing trend in ISF and ranked at the top level in 2006. This is a similar trend to EE, demonstrating Japan’s efficient inducing policy with respect to industry-initiated innovation. This upward trend
Innovation Framework and Strategies: An APO Perspective
– 42 –
corresponds to an increasing trend in R&D intensity in both government and industryas indicated in Table 8.
Table 8: Japan’s R&D Expenditure as a Percentage of GDP
2001 2002 2003 2004 2005 2006
3.35 3.40 3.40 3.40 3.55 3.62
+ + + + + +
Initiatives, Programs, and Best Practices
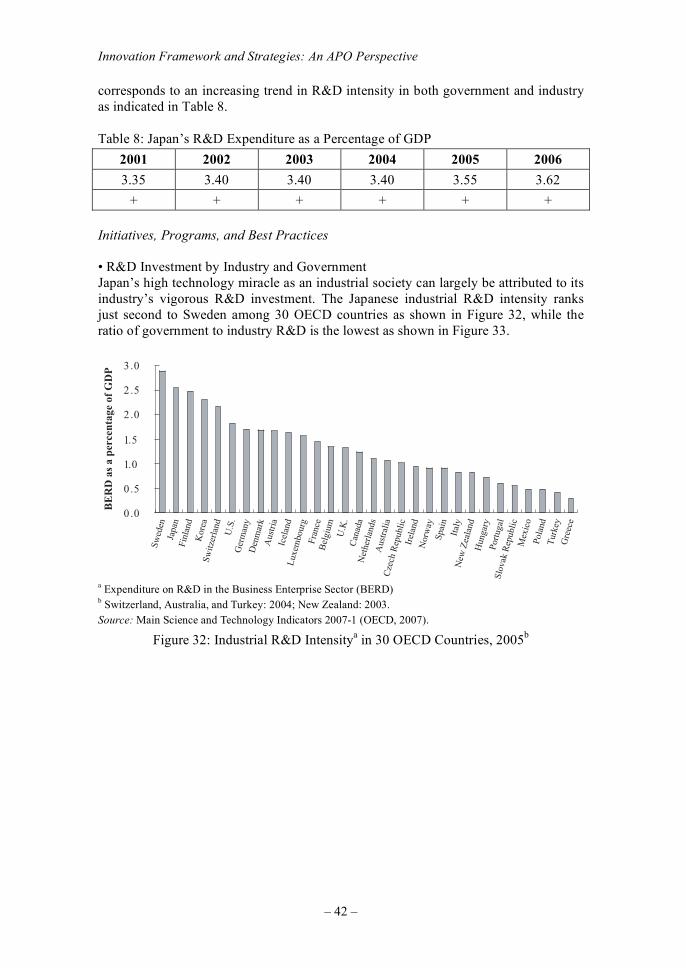
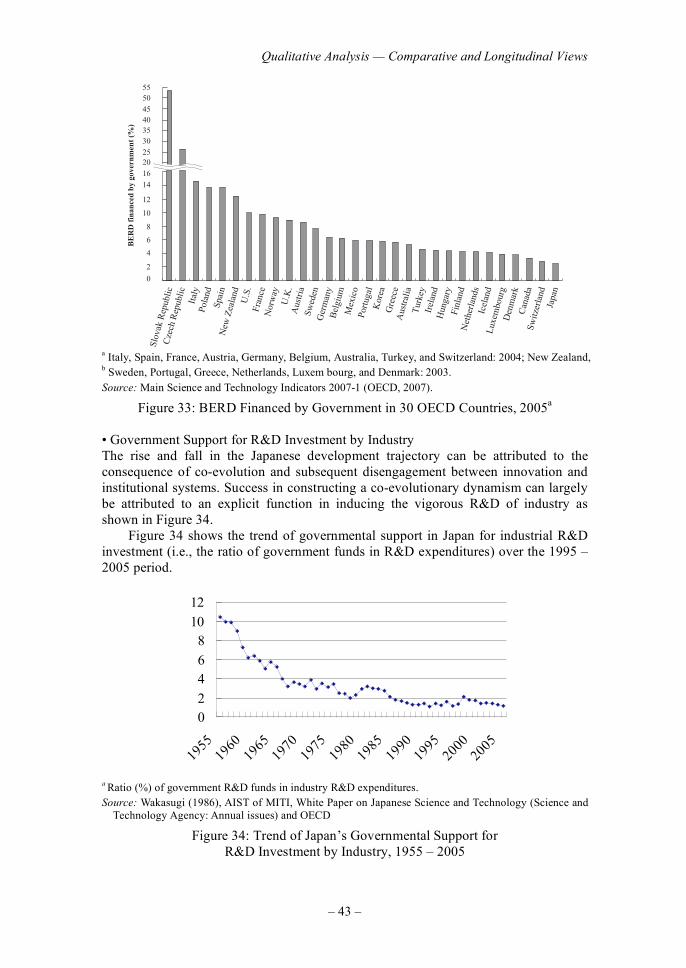
• R&D Investment by Industry and Government Japan’s high technology miracle as an industrial society can largely be attributed to its industry’s vigorous R&D investment. The Japanese industrial R&D intensity ranks just second to Sweden among 30 OECD countries as shown in Figure 32, while the ratio of government to industry R&D is the lowest as shown in Figure 33.
0 .0
0 .5
1..0
1..5
2 .0
2 .5
3 .0
Gre
ece
Ger
man
yD
enm
ark
Aus
tria
Icel
and
Lux
embo
urg
Swed
enJa
pan
Finl
and
Kor
eaSw
itzer
land
U.S
.
Fran
ceB
elgi
umU
.K.
Can
ada
Net
herl
ands
Aus
tral
iaC
zech
Rep
ublic
Irel
and
Nor
way
Spai
nIt
aly
New
Zea
land
Hun
gary
Port
ugal
Slov
ak R
epub
lic
Tur
key
Pola
nd
Mex
ico
BE
RD
as
a pe
rcen
tage
of
GD
P
a Expenditure on R&D in the Business Enterprise Sector (BERD)
b Switzerland, Australia, and Turkey: 2004; New Zealand: 2003.
Source: Main Science and Technology Indicators 2007-1 (OECD, 2007).
Figure 32: Industrial R&D Intensitya in 30 OECD Countries, 2005
b
Qualitative Analysis — Comparative and Longitudinal Views
– 43 –
555045403530252016
6
8
10
BE
RD
fin
ance
d by
gov
ernm
ent
(%)
12
14
4
2
0
Japa
n
Can
ada
Tur
key
Den
mar
k
Irel
and
Lux
embo
urg
Hun
gary
Icel
and
Finl
and
Aus
tral
ia
Net
herl
ands
Gre
ece
Port
ugal
Bel
gium
Swed
en
U.K
.
Nor
way
Slov
ak R
epub
lic
Spai
n
Aus
tria
Ger
man
y
Mex
ico
Kor
ea
Fran
ce
Cze
ch R
epub
lic
U.S
.
Ital
y
New
Zea
land
Pola
nd
Switz
erla
nd
a Italy, Spain, France, Austria, Germany, Belgium, Australia, Turkey, and Switzerland: 2004; New Zealand,
b Sweden, Portugal, Greece, Netherlands, Luxem bourg, and Denmark: 2003.
Source: Main Science and Technology Indicators 2007-1 (OECD, 2007).
Figure 33: BERD Financed by Government in 30 OECD Countries, 2005a
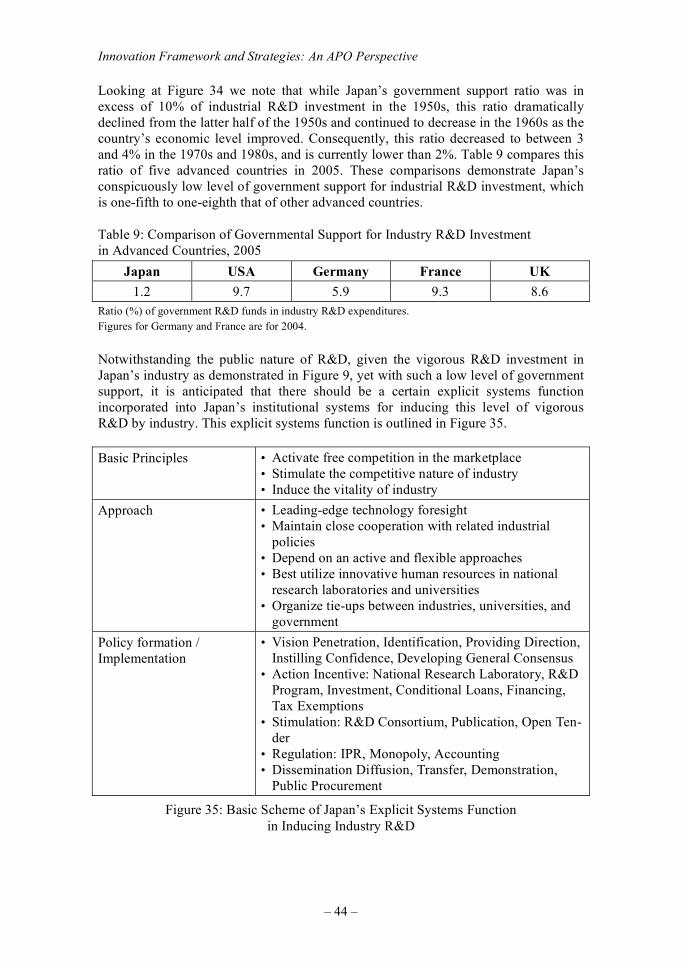
• Government Support for R&D Investment by Industry The rise and fall in the Japanese development trajectory can be attributed to the consequence of co-evolution and subsequent disengagement between innovation and institutional systems. Success in constructing a co-evolutionary dynamism can largely be attributed to an explicit function in inducing the vigorous R&D of industry as shown in Figure 34. Figure 34 shows the trend of governmental support in Japan for industrial R&D investment (i.e., the ratio of government funds in R&D expenditures) over the 1995 – 2005 period.
0
2
4
6
8
10
12
1955
1960
1965
1970
1975
1980
1985
1990
1995
2000
2005
a Ratio (%) of government R&D funds in industry R&D expenditures.
Source: Wakasugi (1986), AIST of MITI, White Paper on Japanese Science and Technology (Science and Technology Agency: Annual issues) and OECD
Figure 34: Trend of Japan’s Governmental Support for R&D Investment by Industry, 1955 – 2005
Innovation Framework and Strategies: An APO Perspective
– 44 –
Looking at Figure 34 we note that while Japan’s government support ratio was in excess of 10% of industrial R&D investment in the 1950s, this ratio dramatically declined from the latter half of the 1950s and continued to decrease in the 1960s as the country’s economic level improved. Consequently, this ratio decreased to between 3 and 4% in the 1970s and 1980s, and is currently lower than 2%. Table 9 compares this ratio of five advanced countries in 2005. These comparisons demonstrate Japan’s conspicuously low level of government support for industrial R&D investment, which is one-fifth to one-eighth that of other advanced countries.
Table 9: Comparison of Governmental Support for Industry R&D Investment in Advanced Countries, 2005
Japan USA Germany France UK
1.2 9.7 5.9 9.3 8.6
Ratio (%) of government R&D funds in industry R&D expenditures.
Figures for Germany and France are for 2004.
Notwithstanding the public nature of R&D, given the vigorous R&D investment in Japan’s industry as demonstrated in Figure 9, yet with such a low level of government support, it is anticipated that there should be a certain explicit systems function incorporated into Japan’s institutional systems for inducing this level of vigorous R&D by industry. This explicit systems function is outlined in Figure 35.
Basic Principles • Activate free competition in the marketplace • Stimulate the competitive nature of industry • Induce the vitality of industry
Approach
• Leading-edge technology foresight • Maintain close cooperation with related industrial
policies • Depend on an active and flexible approaches • Best utilize innovative human resources in national
research laboratories and universities • Organize tie-ups between industries, universities, and
government
Policy formation / Implementation
• Vision Penetration, Identification, Providing Direction, Instilling Confidence, Developing General Consensus
• Action Incentive: National Research Laboratory, R&D Program, Investment, Conditional Loans, Financing, Tax Exemptions
• Stimulation: R&D Consortium, Publication, Open Ten-der
• Regulation: IPR, Monopoly, Accounting • Dissemination Diffusion, Transfer, Demonstration,
Public Procurement
Figure 35: Basic Scheme of Japan’s Explicit Systems Function
in Inducing Industry R&D
Qualitative Analysis — Comparative and Longitudinal Views
– 45 –
Republic of Korea
Static Analysis – Current Ranking
In the 2006 Global Competitive Index (GCI) survey, the Republic of Korea was in the 24
th position, five ranks lower than the previous year. It was fifth among Asian
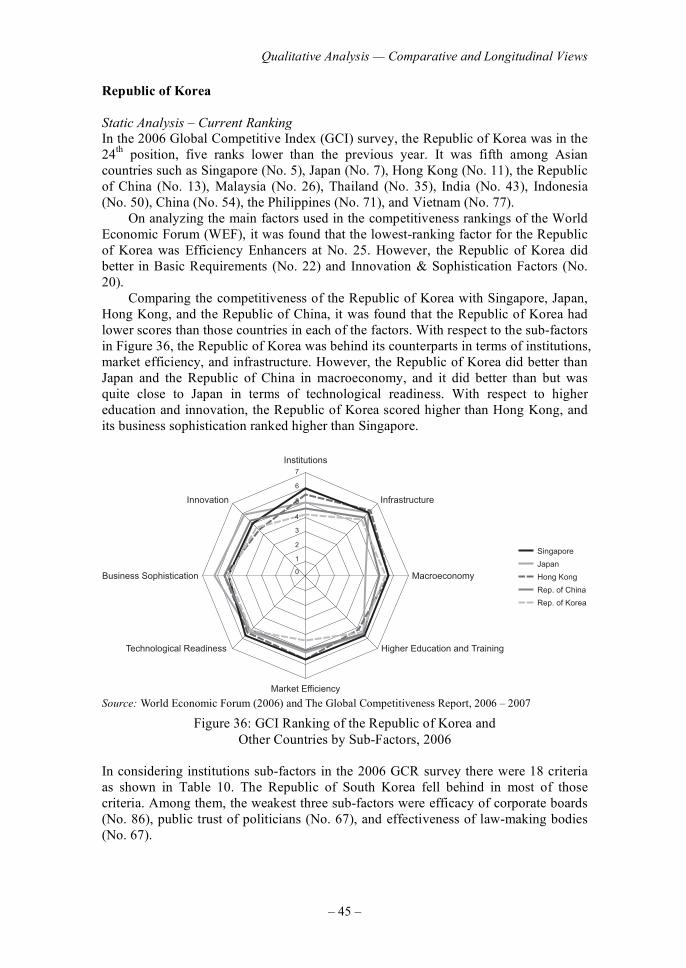
countries such as Singapore (No. 5), Japan (No. 7), Hong Kong (No. 11), the Republic of China (No. 13), Malaysia (No. 26), Thailand (No. 35), India (No. 43), Indonesia (No. 50), China (No. 54), the Philippines (No. 71), and Vietnam (No. 77). On analyzing the main factors used in the competitiveness rankings of the World Economic Forum (WEF), it was found that the lowest-ranking factor for the Republic of Korea was Efficiency Enhancers at No. 25. However, the Republic of Korea did better in Basic Requirements (No. 22) and Innovation & Sophistication Factors (No. 20). Comparing the competitiveness of the Republic of Korea with Singapore, Japan, Hong Kong, and the Republic of China, it was found that the Republic of Korea had lower scores than those countries in each of the factors. With respect to the sub-factors in Figure 36, the Republic of Korea was behind its counterparts in terms of institutions, market efficiency, and infrastructure. However, the Republic of Korea did better than Japan and the Republic of China in macroeconomy, and it did better than but was quite close to Japan in terms of technological readiness. With respect to higher education and innovation, the Republic of Korea scored higher than Hong Kong, and its business sophistication ranked higher than Singapore.
Infrastructure
Singapore
Macroeconomy
Higher Education and Training
Innovation
7
6
5
4
3
2
1
0Business Sophistication
Technological Readiness
Market Efficiency
Institutions
Japan
Hong Kong
Rep. of China
Rep. of Korea
Source: World Economic Forum (2006) and The Global Competitiveness Report, 2006 – 2007
Figure 36: GCI Ranking of the Republic of Korea and
Other Countries by Sub-Factors, 2006 In considering institutions sub-factors in the 2006 GCR survey there were 18 criteria as shown in Table 10. The Republic of South Korea fell behind in most of those criteria. Among them, the weakest three sub-factors were efficacy of corporate boards (No. 86), public trust of politicians (No. 67), and effectiveness of law-making bodies (No. 67).
Innovation Framework and Strategies: An APO Perspective
– 46 –
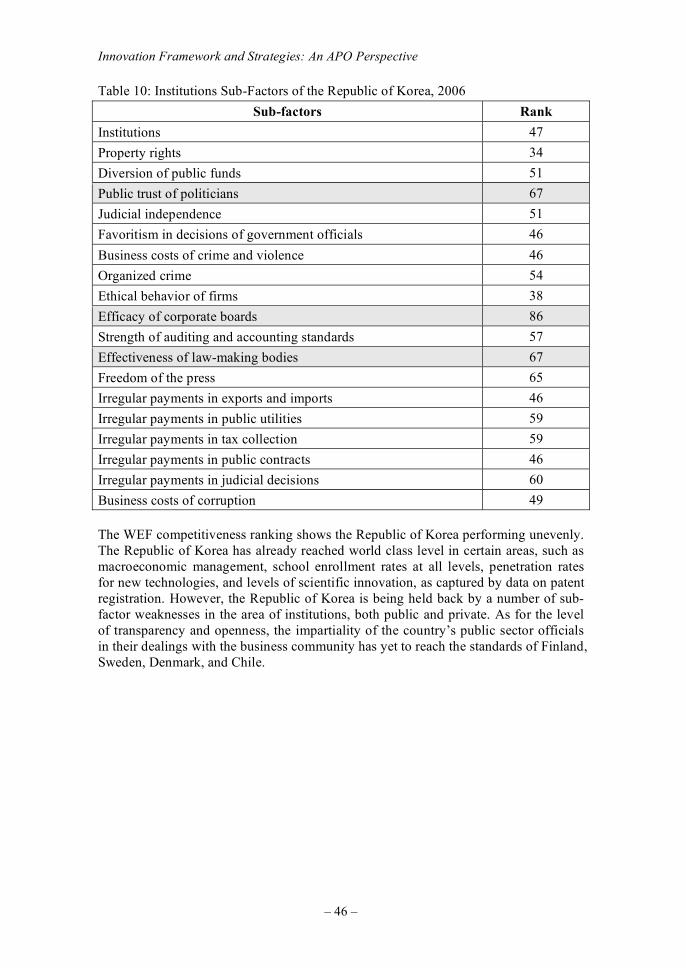
Table 10: Institutions Sub-Factors of the Republic of Korea, 2006
Sub-factors Rank
Institutions 47
Property rights 34
Diversion of public funds 51
Public trust of politicians 67
Judicial independence 51
Favoritism in decisions of government officials 46
Business costs of crime and violence 46
Organized crime 54
Ethical behavior of firms 38
Efficacy of corporate boards 86
Strength of auditing and accounting standards 57
Effectiveness of law-making bodies 67
Freedom of the press 65
Irregular payments in exports and imports 46
Irregular payments in public utilities 59
Irregular payments in tax collection 59
Irregular payments in public contracts 46
Irregular payments in judicial decisions 60
Business costs of corruption 49
The WEF competitiveness ranking shows the Republic of Korea performing unevenly. The Republic of Korea has already reached world class level in certain areas, such as macroeconomic management, school enrollment rates at all levels, penetration rates for new technologies, and levels of scientific innovation, as captured by data on patent registration. However, the Republic of Korea is being held back by a number of sub-factor weaknesses in the area of institutions, both public and private. As for the level of transparency and openness, the impartiality of the country’s public sector officials in their dealings with the business community has yet to reach the standards of Finland, Sweden, Denmark, and Chile.
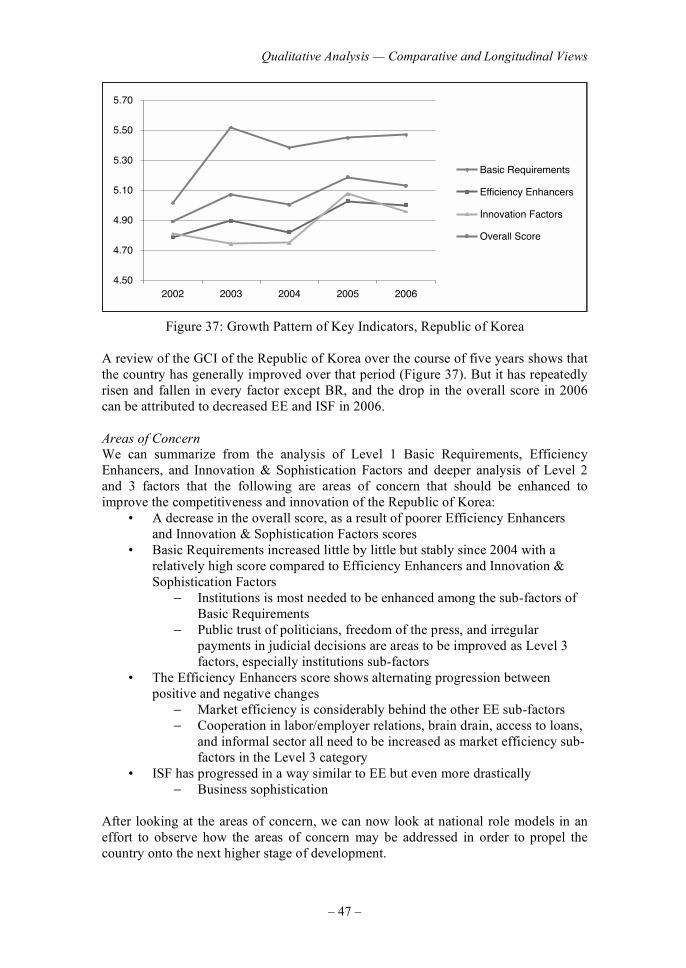
Qualitative Analysis — Comparative and Longitudinal Views
– 47 –
05.4
07.4
09.4
01.5
03.5
05.5
07.5
60025002400230022002
stnemeriuqeR cisaB
srecnahnE ycneiciffE
srotcaF noitavonnI
erocS llarevO
Figure 37: Growth Pattern of Key Indicators, Republic of Korea A review of the GCI of the Republic of Korea over the course of five years shows that the country has generally improved over that period (Figure 37). But it has repeatedly risen and fallen in every factor except BR, and the drop in the overall score in 2006 can be attributed to decreased EE and ISF in 2006.
Areas of Concern
We can summarize from the analysis of Level 1 Basic Requirements, Efficiency Enhancers, and Innovation & Sophistication Factors and deeper analysis of Level 2 and 3 factors that the following are areas of concern that should be enhanced to improve the competitiveness and innovation of the Republic of Korea:
• A decrease in the overall score, as a result of poorer Efficiency Enhancers and Innovation & Sophistication Factors scores
• Basic Requirements increased little by little but stably since 2004 with a relatively high score compared to Efficiency Enhancers and Innovation & Sophistication Factors
− Institutions is most needed to be enhanced among the sub-factors of Basic Requirements
− Public trust of politicians, freedom of the press, and irregular payments in judicial decisions are areas to be improved as Level 3 factors, especially institutions sub-factors
• The Efficiency Enhancers score shows alternating progression between positive and negative changes
− Market efficiency is considerably behind the other EE sub-factors − Cooperation in labor/employer relations, brain drain, access to loans,
and informal sector all need to be increased as market efficiency sub-factors in the Level 3 category
• ISF has progressed in a way similar to EE but even more drastically − Business sophistication
After looking at the areas of concern, we can now look at national role models in an effort to observe how the areas of concern may be addressed in order to propel the country onto the next higher stage of development.
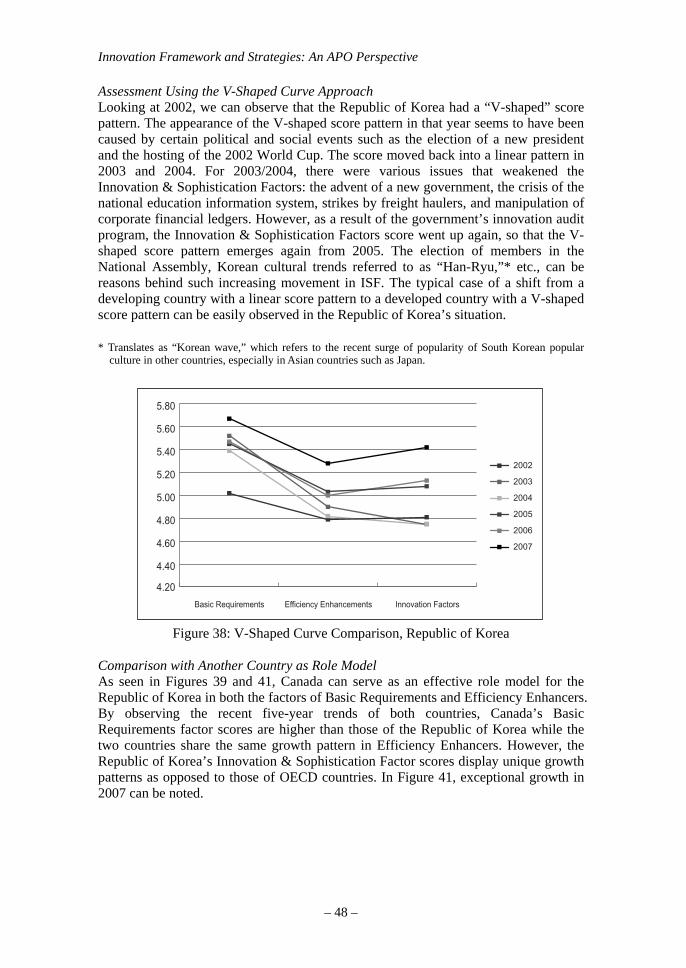
Innovation Framework and Strategies: An APO Perspective
Assessment Using the V-Shaped Curve Approach Looking at 2002, we can observe that the Republic of Korea had a “V-shaped” score pattern. The appearance of the V-shaped score pattern in that year seems to have been caused by certain political and social events such as the election of a new president and the hosting of the 2002 World Cup. The score moved back into a linear pattern in 2003 and 2004. For 2003/2004, there were various issues that weakened the Innovation & Sophistication Factors: the advent of a new government, the crisis of the national education information system, strikes by freight haulers, and manipulation of corporate financial ledgers. However, as a result of the government’s innovation audit program, the Innovation & Sophistication Factors score went up again, so that the V-shaped score pattern emerges again from 2005. The election of members in the National Assembly, Korean cultural trends referred to as “Han-Ryu,”* etc., can be reasons behind such increasing movement in ISF. The typical case of a shift from a developing country with a linear score pattern to a developed country with a V-shaped score pattern can be easily observed in the Republic of Korea’s situation. * Translates as “Korean wave,” which refers to the recent surge of popularity of South Korean popular
culture in other countries, especially in Asian countries such as Japan.
4.20
4.40
4.60
4.80
5.00
5.20
5.40
5.60
5.80
Basic Requirements Efficiency Enhancements Innovation Factors
2002
2003
2004
2005
2006
2007
Figure 38: V-Shaped Curve Comparison, Republic of Korea
Comparison with Another Country as Role Model As seen in Figures 39 and 41, Canada can serve as an effective role model for the Republic of Korea in both the factors of Basic Requirements and Efficiency Enhancers. By observing the recent five-year trends of both countries, Canada’s Basic Requirements factor scores are higher than those of the Republic of Korea while the two countries share the same growth pattern in Efficiency Enhancers. However, the Republic of Korea’s Innovation & Sophistication Factor scores display unique growth patterns as opposed to those of OECD countries. In Figure 41, exceptional growth in 2007 can be noted.
– 48 –
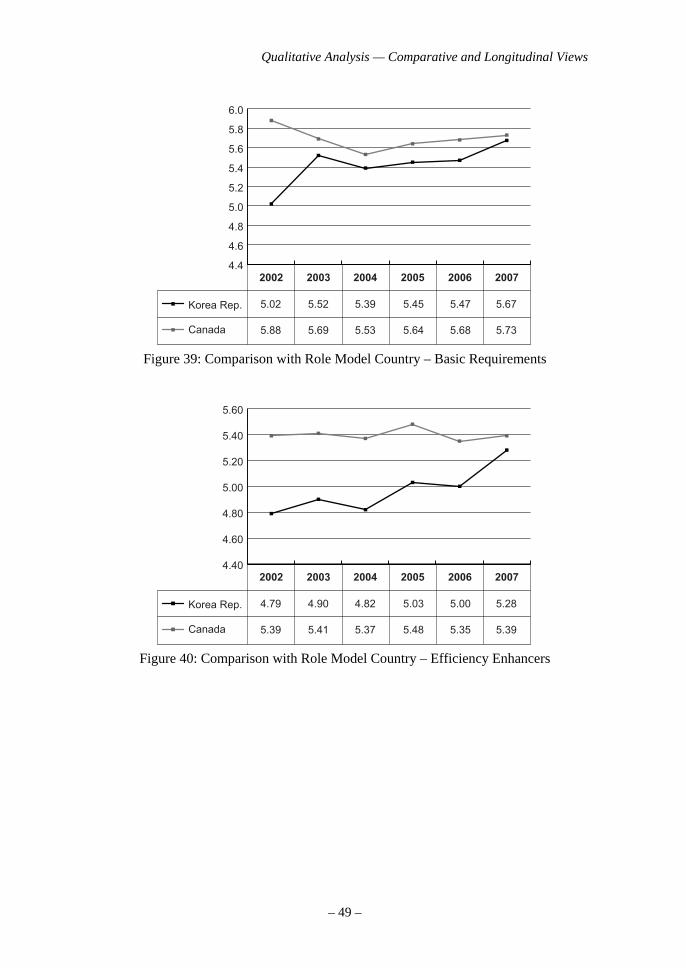
Qualitative Analysis — Comparative and Longitudinal Views
2002
5.02 5.52 5.39 5.45 5.47 5.67
5.88 5.69 5.53 5.64 5.68 5.73
2003 2004 2005 2006 20074.4
4.6
4.8
5.0
5.2
5.4
5.6
5.8
6.0
Canada
Korea Rep.
Figure 39: Comparison with Role Model Country – Basic Requirements
2002
4.79 4.90 4.82 5.03 5.00 5.28
5.39 5.41 5.37 5.48 5.35 5.39
2003 2004 2005 2006 20074.40
4.60
4.80
5.00
5.20
5.40
5.60
Canada
Korea Rep.
Figure 40: Comparison with Role Model Country – Efficiency Enhancers
– 49 –
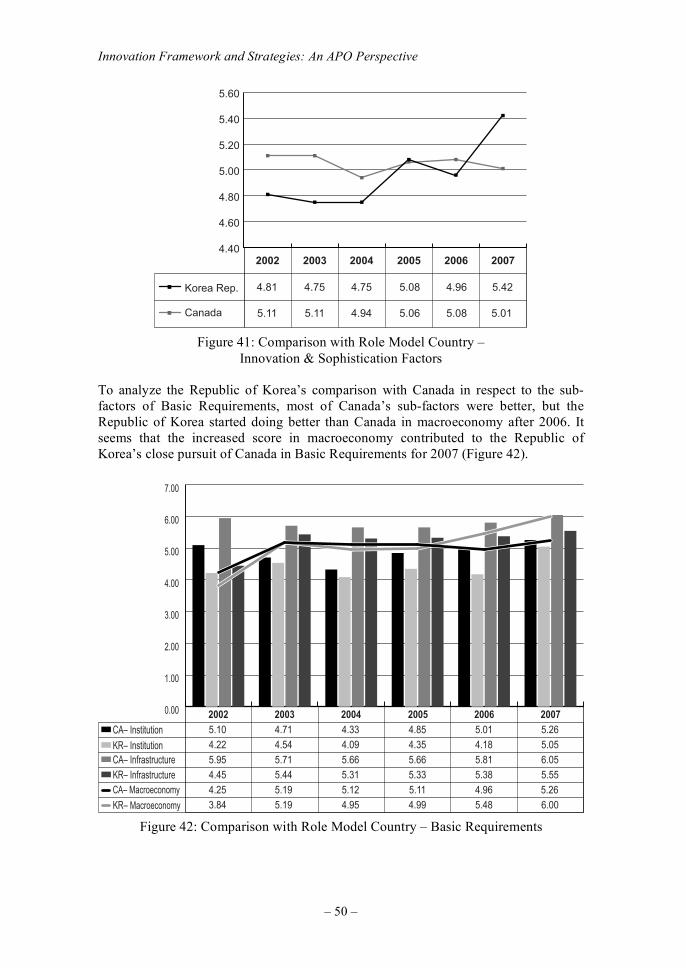
Innovation Framework and Strategies: An APO Perspective
– 50 –
2002
4.81 4.75 4.75 5.08 4.96 5.42
5.11 5.11 4.94 5.06 5.08 5.01
2003 2004 2005 2006 20074.40
4.60
4.80
5.00
5.20
5.40
5.60
Canada
Korea Rep.
Figure 41: Comparison with Role Model Country –
Innovation & Sophistication Factors To analyze the Republic of Korea’s comparison with Canada in respect to the sub-factors of Basic Requirements, most of Canada’s sub-factors were better, but the Republic of Korea started doing better than Canada in macroeconomy after 2006. It seems that the increased score in macroeconomy contributed to the Republic of Korea’s close pursuit of Canada in Basic Requirements for 2007 (Figure 42).
2002
5.10 4.71 4.33 4.85 5.01 5.26
4.22 4.54 4.09 4.35 4.18 5.05
5.95 5.71 5.66 5.66 5.81 6.05
4.45 5.44 5.31 5.33 5.38 5.55
4.25 5.19 5.12 5.11 4.96 5.26
3.84 5.19 4.95 4.99 5.48 6.00
2003 2004 2005 2006 20070.00
1.00
2.00
3.00
4.00
5.00
6.00
7.00
KR– Infrastructure
KR– Macroeconomy
CA– Infrastructure
CA– Macroeconomy
KR– Institution
CA– Institution
Figure 42: Comparison with Role Model Country – Basic Requirements
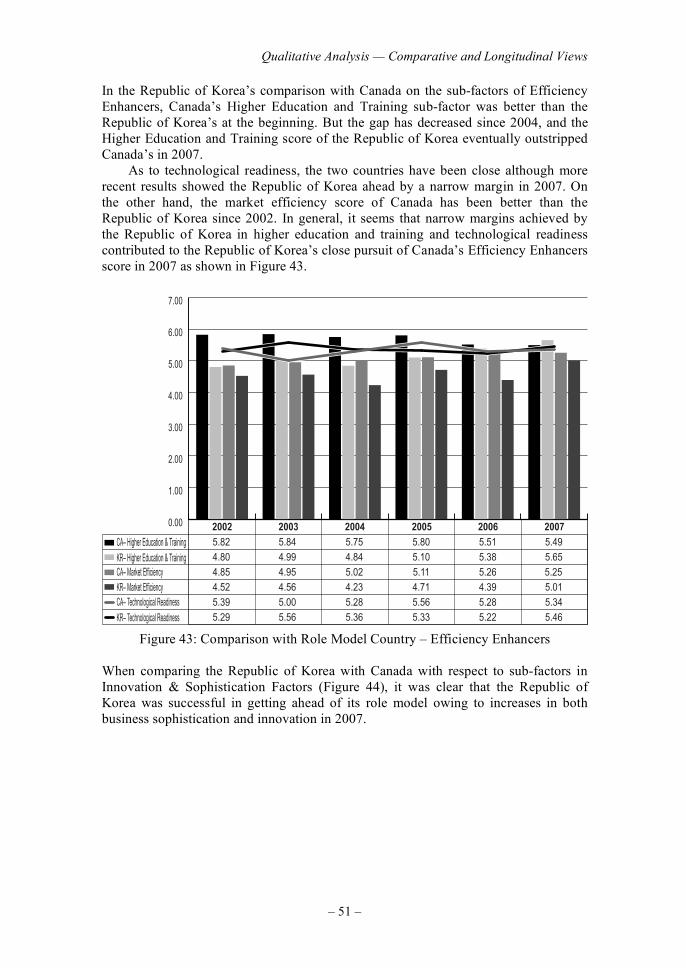
Qualitative Analysis — Comparative and Longitudinal Views
– 51 –
In the Republic of Korea’s comparison with Canada on the sub-factors of Efficiency Enhancers, Canada’s Higher Education and Training sub-factor was better than the Republic of Korea’s at the beginning. But the gap has decreased since 2004, and the Higher Education and Training score of the Republic of Korea eventually outstripped Canada’s in 2007. As to technological readiness, the two countries have been close although more recent results showed the Republic of Korea ahead by a narrow margin in 2007. On the other hand, the market efficiency score of Canada has been better than the Republic of Korea since 2002. In general, it seems that narrow margins achieved by the Republic of Korea in higher education and training and technological readiness contributed to the Republic of Korea’s close pursuit of Canada’s Efficiency Enhancers score in 2007 as shown in Figure 43.
2002
5.82 5.84 5.75 5.80 5.51 5.49
4.80 4.99 4.84 5.10 5.38 5.65
4.85 4.95 5.02 5.11 5.26 5.25
4.52 4.56 4.23 4.71 4.39 5.01
5.39 5.00 5.28 5.56 5.28 5.34
5.29 5.56 5.36 5.33 5.22 5.46
2003 2004 2005 2006 20070.00
1.00
2.00
3.00
4.00
5.00
6.00
7.00
KR– Market Efficiency
KR– Technological Readiness
CA– Market Efficiency
CA– Technological Readiness
KR– Higher Education & Training
CA– Higher Education & Training
Figure 43: Comparison with Role Model Country – Efficiency Enhancers When comparing the Republic of Korea with Canada with respect to sub-factors in Innovation & Sophistication Factors (Figure 44), it was clear that the Republic of Korea was successful in getting ahead of its role model owing to increases in both business sophistication and innovation in 2007.
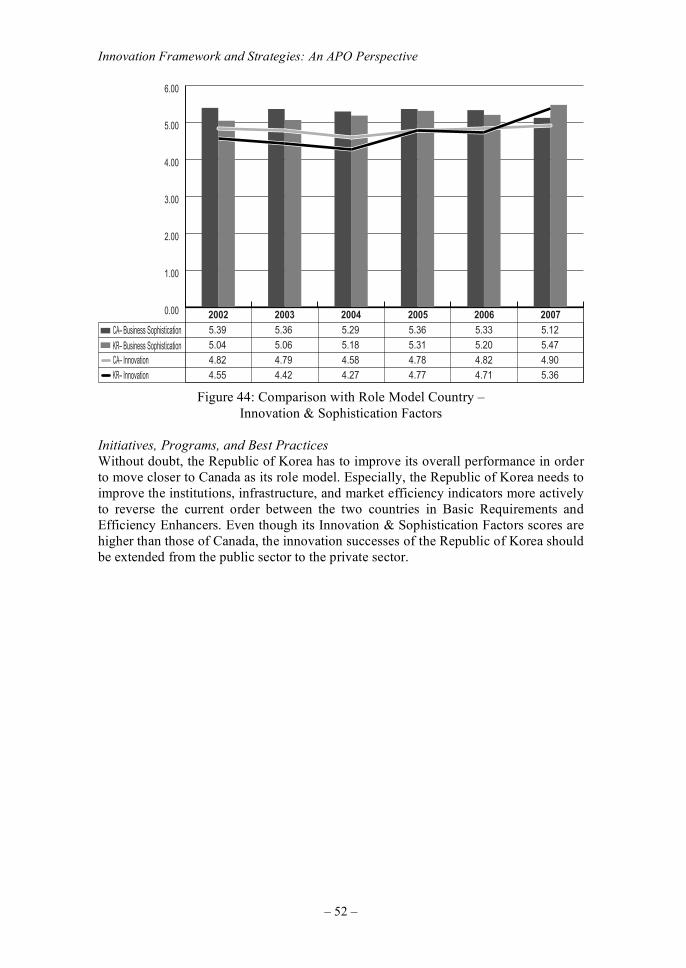
Innovation Framework and Strategies: An APO Perspective
– 52 –
2002
5.39 5.36 5.29 5.36 5.33 5.12
5.04 5.06 5.18 5.31 5.20 5.47
4.82 4.79 4.58 4.78 4.82 4.90
4.55 4.42 4.27 4.77 4.71 5.36
2003 2004 2005 2006 20070.00
1.00
2.00
3.00
4.00
5.00
6.00
KR– InnovationCA– InnovationKR– Business Sophistication
CA– Business Sophistication
Figure 44: Comparison with Role Model Country –
Innovation & Sophistication Factors
Initiatives, Programs, and Best Practices
Without doubt, the Republic of Korea has to improve its overall performance in order to move closer to Canada as its role model. Especially, the Republic of Korea needs to improve the institutions, infrastructure, and market efficiency indicators more actively to reverse the current order between the two countries in Basic Requirements and Efficiency Enhancers. Even though its Innovation & Sophistication Factors scores are higher than those of Canada, the innovation successes of the Republic of Korea should be extended from the public sector to the private sector.
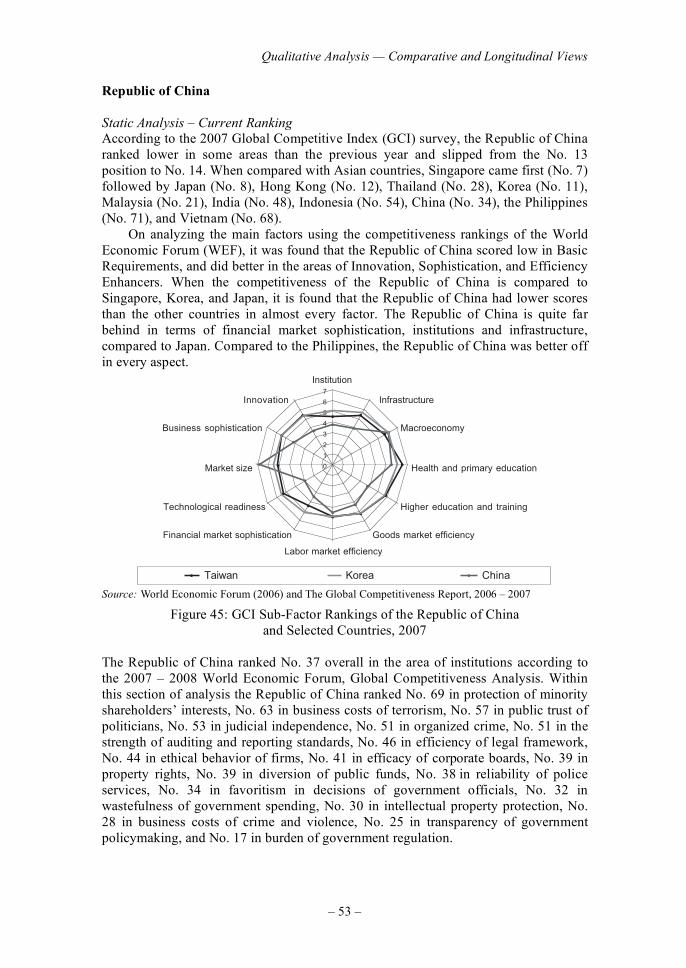
Qualitative Analysis — Comparative and Longitudinal Views
– 53 –
Republic of China
Static Analysis – Current Ranking
According to the 2007 Global Competitive Index (GCI) survey, the Republic of China ranked lower in some areas than the previous year and slipped from the No. 13 position to No. 14. When compared with Asian countries, Singapore came first (No. 7) followed by Japan (No. 8), Hong Kong (No. 12), Thailand (No. 28), Korea (No. 11), Malaysia (No. 21), India (No. 48), Indonesia (No. 54), China (No. 34), the Philippines (No. 71), and Vietnam (No. 68).
On analyzing the main factors using the competitiveness rankings of the World Economic Forum (WEF), it was found that the Republic of China scored low in Basic Requirements, and did better in the areas of Innovation, Sophistication, and Efficiency Enhancers. When the competitiveness of the Republic of China is compared to Singapore, Korea, and Japan, it is found that the Republic of China had lower scores than the other countries in almost every factor. The Republic of China is quite far behind in terms of financial market sophistication, institutions and infrastructure, compared to Japan. Compared to the Philippines, the Republic of China was better off in every aspect.
0
1
2
3
4
5
6
7
Institution
Infrastructure
Macroeconomy
Health and primary education
Higher education and training
Goods market efficiency
Labor market efficiency
Financial market sophistication
Technological readiness
Market size
Business sophistication
Innovation
Taiwan Korea China Source: World Economic Forum (2006) and The Global Competitiveness Report, 2006 – 2007
Figure 45: GCI Sub-Factor Rankings of the Republic of China and Selected Countries, 2007
The Republic of China ranked No. 37 overall in the area of institutions according to the 2007 – 2008 World Economic Forum, Global Competitiveness Analysis. Within this section of analysis the Republic of China ranked No. 69 in protection of minority shareholders’ interests, No. 63 in business costs of terrorism, No. 57 in public trust of politicians, No. 53 in judicial independence, No. 51 in organized crime, No. 51 in the strength of auditing and reporting standards, No. 46 in efficiency of legal framework, No. 44 in ethical behavior of firms, No. 41 in efficacy of corporate boards, No. 39 in property rights, No. 39 in diversion of public funds, No. 38
in reliability of police
services, No. 34 in favoritism in decisions of government officials, No. 32 in wastefulness of government spending, No. 30 in intellectual property protection, No. 28 in business costs of crime and violence, No. 25 in transparency of government policymaking, and No. 17 in burden of government regulation.
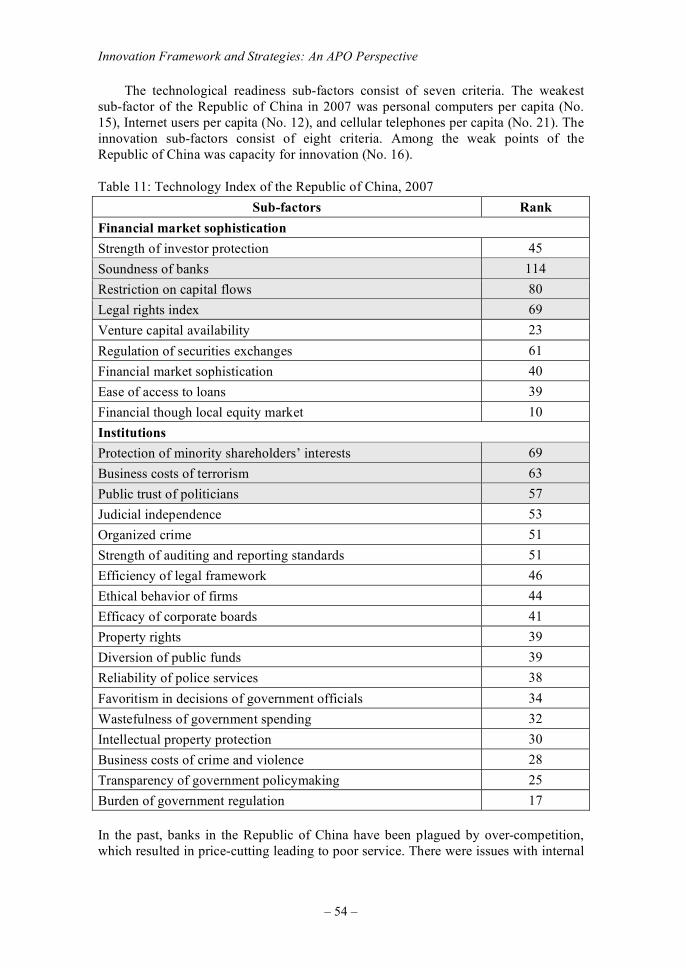
Innovation Framework and Strategies: An APO Perspective
– 54 –
The technological readiness sub-factors consist of seven criteria. The weakest sub-factor of the Republic of China in 2007 was personal computers per capita (No. 15), Internet users per capita (No. 12), and cellular telephones per capita (No. 21). The innovation sub-factors consist of eight criteria. Among the weak points of the Republic of China was capacity for innovation (No. 16).
Table 11: Technology Index of the Republic of China, 2007
Sub-factors Rank
Financial market sophistication
Strength of investor protection 45
Soundness of banks 114
Restriction on capital flows 80
Legal rights index 69
Venture capital availability 23
Regulation of securities exchanges 61
Financial market sophistication 40
Ease of access to loans 39
Financial though local equity market 10
Institutions
Protection of minority shareholders’ interests 69
Business costs of terrorism 63
Public trust of politicians 57
Judicial independence 53
Organized crime 51
Strength of auditing and reporting standards 51
Efficiency of legal framework 46
Ethical behavior of firms 44
Efficacy of corporate boards 41
Property rights 39
Diversion of public funds 39
Reliability of police services 38
Favoritism in decisions of government officials 34
Wastefulness of government spending 32
Intellectual property protection 30
Business costs of crime and violence 28
Transparency of government policymaking 25
Burden of government regulation 17
In the past, banks in the Republic of China have been plagued by over-competition, which resulted in price-cutting leading to poor service. There were issues with internal
Qualitative Analysis — Comparative and Longitudinal Views
– 55 –
controls and risk-taking as well as unsound credit practices. These problems, among others, started to be tackled with the formation of the Financial Supervisory Commission (FSC). The FSC carried out positive developments with changes in attitude and regulatory changes at a time when foreign investment, private equity investors, and mergers and acquisitions were at a high. Its reform program aimed to reduce non-performing loans and improve the services and health of local commercial banks by encouraging consolidation. In 2004, the Republic of China introduced a second series of financial reforms, which revolved around a reduction in the total number of financial holding companies and banks in the country. Initially the areas tackled by the 2004 reform were (i) the encouragement of dialogue between market participants and regulators with growing experience in deal-making; (ii) gradual relaxation of investment and financing restrictions to allow more sophisticated financing structures; and, (iii) more emphasis on enforcement and monitoring of corporate governance and insider trading. As a result, great inroads were made to reform the financial institutions, change attitudes, and facilitate deal-making for furthering consolidation of the banking sector. The U.S. economic slowdown has affected the Republic of China as well as other parts of the world. The key for the Republic of China is that it bolster growth through trade investment and financial linkages, and maintain confidence in the region’s money markets. It is up to the government to pursue sound macroeconomic management, strengthen the supervision of financial institutions, and improve structural resilience through future reform efforts. Unfortunately, the slower trend is continuing while some other Asian countries have begun to accelerate their development and outpace the Republic of China. This clearly reflects the fact that the Republic of China needs to take action faster or it will soon be left behind. These are not only signs for policy development but also a warning that the Republic of China must narrow its gaps, address its weaknesses, and solve its fundamental problems. Otherwise, the country will risk losing its competitive edge. The government must put the development of advanced science and technology at the core on its policy-making agenda in order to be competitive in the long run.
05.4
07.4
09.4
01.5
03.5
05.5
07.5
700260025002400230022002
stnemeriuqeR cisaB
srecnahnE ycneiciffE
srotcaF noitavonnI
erocS llarevO
Figure 46: Growth Pattern of Key Indicators, Republic of China
The Republic of China’s overall growth score has decreased slightly from 2006 levels. Its BR was the same as in 2006, but the overall score was reduced due to decreases in EE and ISF.
Innovation Framework and Strategies: An APO Perspective
– 56 –
Due to a fall in domestic investment and consumption, government and enterprises could not put enough resources into the public arena in 2002 – 2003. Enterprises were focused on short-term income therefore the EE index had a sharper slope than the other two indexes. Exports to mainland China drove economic growth, and manufacturing also showed benefits due to low labor cost in 2003 – 2004. The government uses “public service extension” policy to improve domestic demand and solve employment problems. The government promotes several plans to construct a ripe digital environment; these plans popularized the Internet and wireless communication networks in 2004 – 2005. Enterprises also invested in new developing markets such as Vietnam and India. In 2005 – 2006, promotion of non-governmental investments and projects were used to encourage traditional industry to be more innovative and raise the levels of R&D input. One new policy being used at the moment is to focus more on the semiconductor and display panel industries.
Areas of Concern
We can summarize from the analysis of Level 1 Basic Requirements, Efficiency Enhancers, and Innovation & Sophistication Factors and deeper analysis of Level 2 and Level 3 factors that the following are the special areas of concern that need to be addressed to improve the competitiveness and innovation of the Republic of China:
• Finance capital: Small- and medium-size companies are normally short on capital, and often don’t quite understand financial management. The shortage of capital is being addressed through the SME Credit Insurance Fund. Only the firm itself can increase the willingness of the investor to invest and reduce risk by controlling expenditures for R&D, by understanding the economic scale and expected results.
• Human capital: It is very difficult to train the large number of people required for effective R&D. It is not easy to inform people about the needs of the job market as well. At the other end, due to an incomplete HR regulation system and weak job security, SMEs can lose employees easily. So, through the channels of industry/university collaboration and providing systematic HR regulations, SMEs can attract and keep good R&D people.
• Structured capital: Normally, SMEs have the structural difficulties of insufficient e-commerce capabilities, inefficient management systems, high replacement risk, and difficulty in maintaining competitiveness. They can save much time and human capital if they use the Internet to expand channels, improve information flow, and set up effective storage management, databases, and dispatching systems. The technical issues include encouraging SMEs to work with universities and other companies to improve R&D and create leading technology with better market value. SMEs should understand the general product and market needs so they can provide more products of higher quality that are competitively priced, and at the same time apply for patents or sell proprietary technology.
• Relation capital: Due to their small scale, SMEs rarely negotiate or directly cooperate with industries, government, and universities. Relations depend, however, on personal relationships in the industry’s value chain systems and whether knowledge transfer is weak or strong, and whether negotiation capability is high or not. Important issues include how to get the necessary
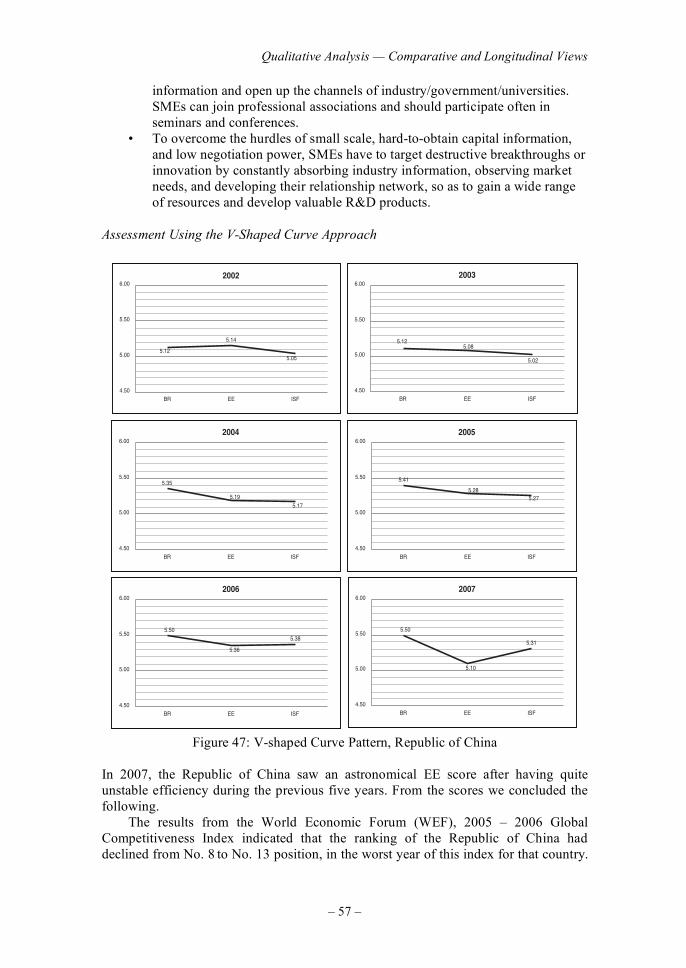
Qualitative Analysis — Comparative and Longitudinal Views
– 57 –
information and open up the channels of industry/government/universities. SMEs can join professional associations and should participate often in seminars and conferences.
• To overcome the hurdles of small scale, hard-to-obtain capital information, and low negotiation power, SMEs have to target destructive breakthroughs or innovation by constantly absorbing industry information, observing market needs, and developing their relationship network, so as to gain a wide range of resources and develop valuable R&D products.
Assessment Using the V-Shaped Curve Approach
2002
21.5
41.5
50.5
05.4
00.5
05.5
00.6
FSIEERB
3002
21.580.5
20.5
05.4
00.5
05.5
00.6
FSIEERB
4002
53.5
91.571.5
05.4
00.5
05.5
00.6
FSIEERB
5002
14.5
82.572.5
05.4
00.5
05.5
00.6
FSIEERB
6002
05.5
63.5
83.5
05.4
00.5
05.5
00.6
FSIEERB
7002
05.5
01.5
13.5
05.4
00.5
05.5
00.6
FSIEERB
Figure 47: V-shaped Curve Pattern, Republic of China In 2007, the Republic of China saw an astronomical EE score after having quite unstable efficiency during the previous five years. From the scores we concluded the following. The results from the World Economic Forum (WEF), 2005 – 2006 Global Competitiveness Index indicated that the ranking of the Republic of China had declined from No. 8
to No. 13 position, in the worst year of this index for that country.
Innovation Framework and Strategies: An APO Perspective
– 58 –
In Innovation & Sophistication Factors, the Republic of China had among the best performance, ranking No. 9 in the world; in Efficiency Enhancers, it ranked No. 14; and in Basic Requirements it ranked No. 21. In respect to this data, we can explain the changed situation from two angles. First, the approach and how the standards are calculated for the WEF investigation have been changed. Second, the weight of Efficiency Enhancers and Innovation & Sophistication Factors sub-factors had a substitution effect on each other. The weight of the Efficiency Enhancers sub-factors, of the three main indicators of GCI, increased from 36% to 40%, which is an increase of 4%. The weight of Basic Requirements sub-factors decreased from 34% to 29%, a 4% decrease. Both of these showed a trade-off effect. Morever, for BR there was also a high effect on government efficiency while EE involves enterprise energy and interactive relationships with the government, so when the government has been less effective, the enterprises need to find a way to become more efficient on their own. There were also some incidents that dampened the investment climate resulting in a slowing of foreign investment interest. Relative industrial policy tends to be conservative; therefore enterprises find it hard to get subsidies in new foreign markets. Enterprises need to improve themselves in order to fight the critical economical environment. This is why EE rose and BR declined during this period. ISF saw the best performance in the Republic of China rankings. The Republic of China government actively promotes many IT plans such as “e-Republic of China,” and “m(mobile)-Republic of China,” and provides various innovation programs such as a service innovation subsidy, “neo-tech” development subsidy, traditional industry innovation subsidy, etc. Mid- and large-size companies tend to particularly benefit as the government encourages and nurtures innovation, while smaller, less savvy companies still struggle to survive. The weighting criteria of the WEF investigation were changed during 2005 – 2006. Before 2005, the statistical data weights were gathered 70% from official data and 30% from enterprise questionnaires. In 2006, the questionnaire percentage was increased to 75%. The attitude of enterprises thus became a major factor affecting the results of the investigation. According to the government’s performance in this period, most enterprises had a negative regard for government. That is why the BR and EE indexes showed such big differences in 2005 – 06. When comparing the V-curve with Belgium, France, and Ireland in GCR 2007, it is found that the Republic of China did relatively well. It had a far better BR score than Ireland and Belgium, which are also in Group 3. However, Belgium delivered much better ISF than the other two, whereas the EE scores are quite similar among all three countries. Clearly, in Group 3, the Republic of China is best at ISF and France is best at BR. Therefore there is some common ground on which the members of this cluster can learn from each other. That is how this group can lift up its innovation capability in order to change the pattern of the V-curve into a more desirable one. Since the Republic of China is close to Ireland both geographically and economically, the Republic of China could choose Ireland as its role model in order to move a step forward. It is also worth looking closer at the Level 3 rankings particularly in the areas of special concern.
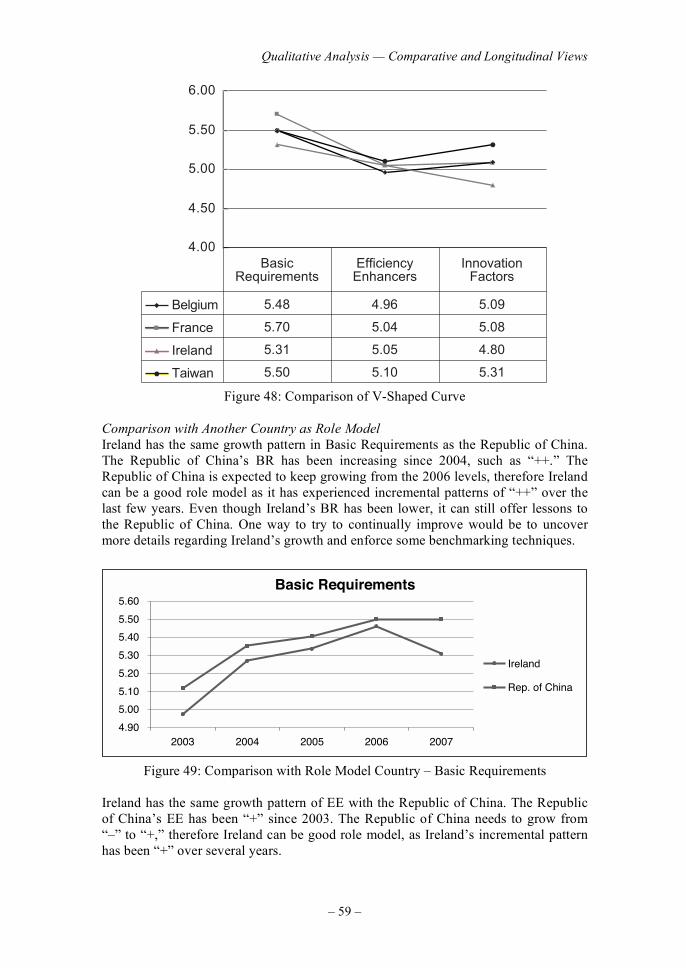
Qualitative Analysis — Comparative and Longitudinal Views
– 59 –
4.00
4.50
5.00
5.50
6.00
Belgium
France
Ireland
Taiwan
BasicRequirements
EfficiencyEnhancers
InnovationFactors
5.48 4.96 5.09
5.70 5.04 5.08
5.31 5.05 4.80
5.50 5.10 5.31
Figure 48: Comparison of V-Shaped Curve
Comparison with Another Country as Role Model
Ireland has the same growth pattern in Basic Requirements as the Republic of China. The Republic of China’s BR has been increasing since 2004, such as “++.” The Republic of China is expected to keep growing from the 2006 levels, therefore Ireland can be a good role model as it has experienced incremental patterns of “++” over the last few years. Even though Ireland’s BR has been lower, it can still offer lessons to the Republic of China. One way to try to continually improve would be to uncover more details regarding Ireland’s growth and enforce some benchmarking techniques.
stnemeriuqeR cisaB
09.4
00.5
01.5
02.5
03.5
04.5
05.5
06.5
70026002500240023002
dnalerI
anihC fo .peR
Figure 49: Comparison with Role Model Country – Basic Requirements
Ireland has the same growth pattern of EE with the Republic of China. The Republic of China’s EE has been “+” since 2003. The Republic of China needs to grow from “–” to “+,” therefore Ireland can be good role model, as Ireland’s incremental pattern has been “+” over several years.
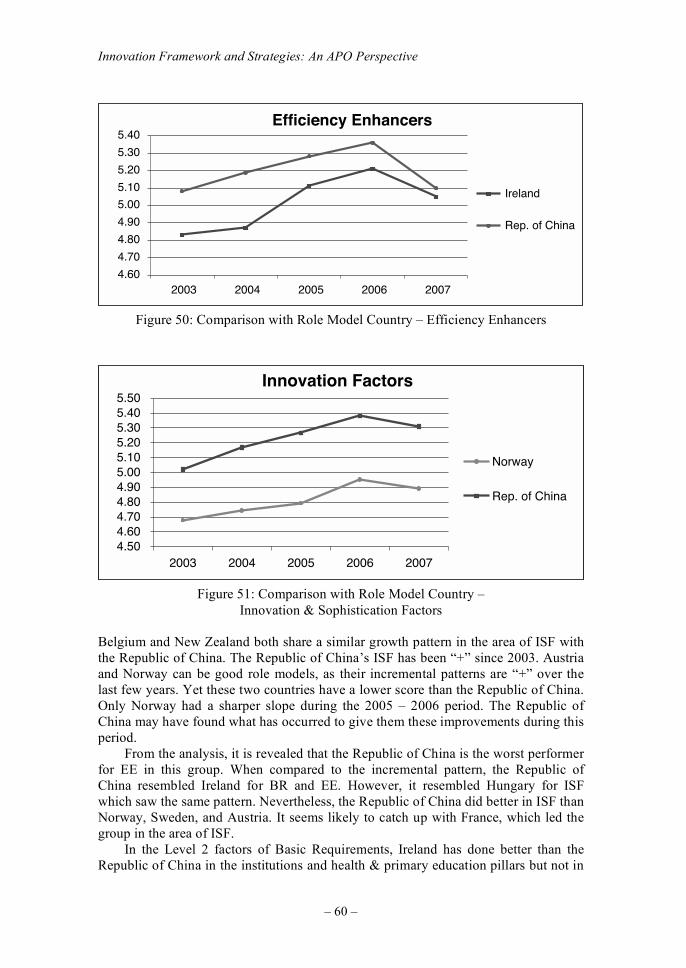
Innovation Framework and Strategies: An APO Perspective
– 60 –
srecnahnE ycneiciffE
06.4
07.4
08.4
09.4
00.5
01.5
02.5
03.5
04.5
70026002500240023002
dnalerI
anihC fo .peR
Figure 50: Comparison with Role Model Country – Efficiency Enhancers
srotcaF noitavonnI
05.406.407.408.409.400.501.502.503.504.505.5
70026002500240023002
yawroN
anihC fo .peR
Figure 51: Comparison with Role Model Country –
Innovation & Sophistication Factors Belgium and New Zealand both share a similar growth pattern in the area of ISF with the Republic of China. The Republic of China’s ISF has been “+” since 2003. Austria and Norway can be good role models, as their incremental patterns are “+” over the last few years. Yet these two countries have a lower score than the Republic of China. Only Norway had a sharper slope during the 2005 – 2006 period. The Republic of China may have found what has occurred to give them these improvements during this period. From the analysis, it is revealed that the Republic of China is the worst performer for EE in this group. When compared to the incremental pattern, the Republic of China resembled Ireland for BR and EE. However, it resembled Hungary for ISF which saw the same pattern. Nevertheless, the Republic of China did better in ISF than Norway, Sweden, and Austria. It seems likely to catch up with France, which led the group in the area of ISF. In the Level 2 factors of Basic Requirements, Ireland has done better than the Republic of China in the institutions and health & primary education pillars but not in
Qualitative Analysis — Comparative and Longitudinal Views
– 61 –
macroeconomy and infrastructure. Since 2006 the Republic of China has surpassed Ireland in macroeconomy. Since 2007 the Republic of China has surpassed Ireland in infrastructure. Therefore the Republic of China should look at the strengths of Ireland in institutions and health & primary education. In institutions, Ireland ranked No. 18 overall, while the Republic of China came in at No. 37. This could be due to the sophistication Ireland has gained over the last several of years through the development of the economy and input from the European Union.
0.00
1.00
2.00
3.00
4.00
5.00
6.00
7.00
8.00
IR- basic requirements 5.46 5.31
TW- basic requirements 5.50 5.50
IR- institution 5.15 5.25
TW- institution 4.56 4.55
IR- infrastructure 4.61 4.03
TW- infrastructure 5.58 5.38
IR-macroeconomy 5.27 5.69
TW-macroeconomy 5.1 5.62
IR- health and primary education 6.78 6.28
TW- health and primary education 6.78 6.28
2006 2007
Figure 52: Comparison with Role Model Country – Basic Requirements The structure of both countries’ entrepreneurial finance is quite different. The Republic of China chose to structure its entrepreneurial finance more in favor of corporations rather than venture capitalists. Ireland choose to have state-funded venture capital. This results in innovation but if either relied more on outside entrepreneurial finance, innovation would have been higher. With regard to research, the Republic of China chose an approach that was very state-centered, and it took on very difficult research. Ireland tried to evolve its research away from a direct state approach. Ireland can rely on the backup and support of the EU, which gives its institutions the added stability needed to achieve success. The Irish government is also more of a welfare state with a range of support programs while the Republic of China does not enjoy this advantage. The current slowdown in the U.S. market will no doubt affect almost all of the world economies; Ireland and the Republic of China both have strong ties to the U.S. through investment and trade, etc. They both need to make moves to try to counter this
Innovation Framework and Strategies: An APO Perspective
– 62 –
and make themselves more attractive to investors, something the Republic of China has sought to do through recently announced tax reforms. Among other attractions, the Republic of China announced it would cut income taxes from 25% to 17.5%, the second-lowest in the world behind Ireland at 12.5%. It is thought that the move will attract foreign investment as the lowest such rate in Asia. This move may be short-lived depending on the political situation. The next factor is Efficiency Enhancers. We shall look at the comparison between the two countries as follows.
0.00
1.00
2.00
3.00
4.00
7.00
5.00
6.00
IR - Efficiency enhancers 5.21 5.05
TW - Efficiency enhancers 5.36 5.10
IR - Higher education and training 5.52 5.26
TW - Higher education and training 5.67 5.73
IR - Market efficiency 4.89
TW - Market efficiency 5.07
IR - Goods market efficiency 5.41
TW - Goods market efficiency 5.23
IR - Labor market efficiency 4.87
TW - Labor market efficiency 4.83
IR - Financial market sophistication 5.91
TW - Financial market sophistication 4.45
IR -Technological readiness 4.89 4.65
TW - Technological readiness 5.32 5.27
IR - Market size 4.17
TW - Market size 5.08
2006 2007
Figure 53: Comparison with Role Model Country – Efficiency Enhancers In this second factor for competitiveness, Ireland has done better than the Republic of China in the financial market sophistication, labor market efficiency, and goods market efficiency pillars but not in market size, technological readiness, higher education, and training. Goods market efficiency and labor market efficiency in the Republic of China lagged behind Ireland, but were not in isolation. The Republic of China has steadily caught up in these two pillars. In other words, the gaps are relatively narrow. However, it is in financial market sophistication that Ireland seems to be healthiest. This led to a difference of nearly 0.18 between Ireland and the
Qualitative Analysis — Comparative and Longitudinal Views
– 63 –
Republic of China in 2007. Clearly, there is a serious need to analyze the details of such a divergence. The Republic of China can indeed be a model for all aspects of its Innovation & Sophistication Factors. The Republic of China has proven its competence in the area of innovation over the last few years. There is an abundance of government-run innovative initiatives and strong education industry links that further strengthen the nation’s capability in this area.
0.00
1.00
2.00
3.00
6.00
4.00
5.00
IR - Innovation and sophistication factors 4.96
5.38
5.39
5.45
4.54
5.31
4.80
5.31
5.07
5.37
4.54
5.24
TW - Innovation and sophistication factors
IR - Business sophistication
TW - Business sophistication
IR - Innovation
TW - Innovation
2006 2007
Figure 54: Comparison with Role Model Country –
Innovation and Sophistication Factors
Initiatives, Programs, and Best Practices
• Economic Retrospective of the Republic of China, 2002 – 2003
In 2002, after the Republic of China joined the World Trade Organization, no great influence was felt on its economy. The impact intensified gradually, and has now become an important driving force for the nation’s economic growth. With the worsening investment climate, foreign and non-governmental investment dropped. The rate of unemployment also rose as the price of goods fell. These factors made a “deflationary” condition appear. The key influencing factors in this year were as follows:
• Deflation has generally been a phenomenon in the Asia and the Pacific in recent years: crude oil prices and the price of raw materials drop continuously, the economy is depressed, the rate of unemployment rises, the interest rate is reduced continuously, and price competition heightens.
• Foreign capital inputs have reduced, and investments abroad are also polarized. This situation is caused by deterioration of the investment environment.
• The financial situation is not good. One of the more significant problems is the number of doubtful bank accounts. The banks are forced to eliminate these doubtful accounts by all means and this may cause side effects in the long run for economic development.
Innovation Framework and Strategies: An APO Perspective
– 64 –
• Economic Retrospective of the Republic of China, 2003 – 2004
In 2003, the economy of the Republic of China was better than 2002. The first half of the year was affected by the war in Iraq and SARS. In the second half of the year, the international economy took a favorable turn, and the economy of the Republic of China began to rise. The economic growth rate exceeded 4% in the fourth quarter and 3.15% for the entire year. The key influencing factors in this year were as follows:
• Orders from abroad increased rapidly. Mainland China became the most important market for the Republic of China’s export market.
• Government undertook “public service extension” policy to improve domestic demand, promote domestic consumption, and take effective steps to solve the employment problem.
• The effect of SARS lessened, and the economy again took a favorable turn gradually. The demand for the currency supply was kept low, which helped heat up the real estate market and drive the stock market into a bull market.
• Economic Retrospective of the Republic of China, 2004 – 2005
A drop in oil prices became the force needed to drive the global economy. The industries of the Republic of China improved. This impelled exports and domestic production. Investments also simultaneously improved. The GDP was expected to see a 6% increase for the entire year. The 6.17% actually recorded marked the best year for the Republic of China’s economy since the Asian financial crisis in 1998. The key influencing factors in this year were as follows:
• The political situation became unstable after the presidential election in March 2004.
• The government promoted several plans to construct a mature digital environment. These plans included the popularization of the Internet and the spread of wireless communication networks.
• Enterprises actively invested in new developing markets besides mainland China, such as Eastern Europe, India, Vietnam, and other countries mainly in Asia.
• Economic Retrospective of the Republic of China, 2005 – 2006
The whole situation was similar to 2004, but limited by imbalanced development among industries and an unstable political situation. Particularly worrisome was that the service industry accounted for 70% of GDP, while service industry employment accounted for only 58% of all jobs. The government thus made great efforts to promote the development of new manufacturing industry to balance the economic structure. The key influencing factors in this year were as follows:
• The government provided special projects to help traditional industry, service industry, and manufacturing industry to transform. It promoted non-governmental investment and encouraged enterprises to devote themselves to innovation.
• A national development project was set up to construct competitive advantage. One of the sub-projects, Industry Innovation Policy, set a goal to develop the Republic of China into the innovative center of the Asian-Pacific area before 2008. The Republic of China was to especially focus on technical
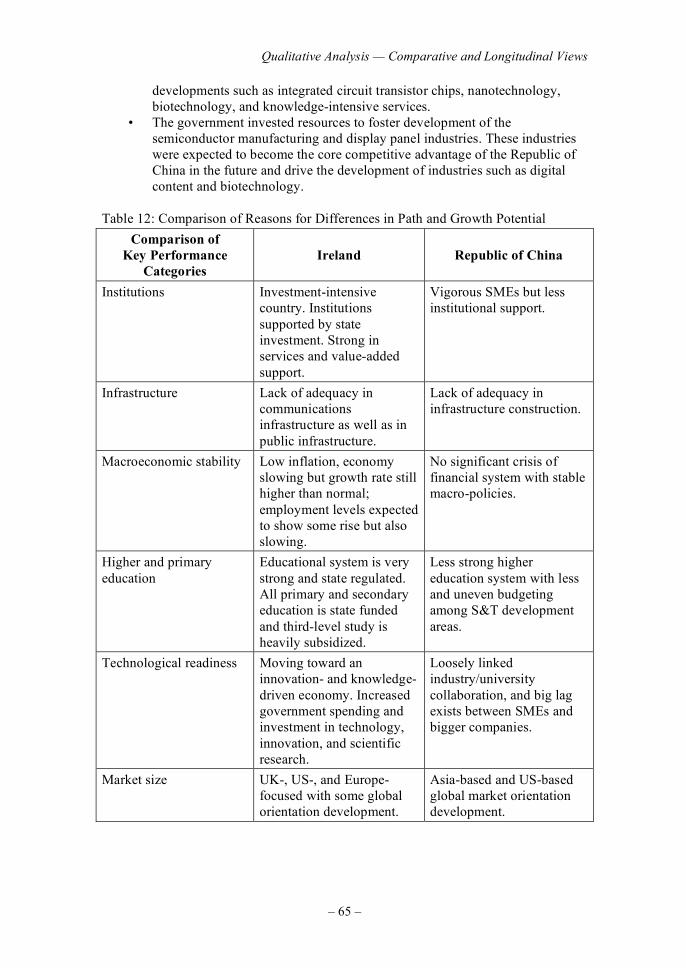
Qualitative Analysis — Comparative and Longitudinal Views
– 65 –
developments such as integrated circuit transistor chips, nanotechnology, biotechnology, and knowledge-intensive services.
• The government invested resources to foster development of the semiconductor manufacturing and display panel industries. These industries were expected to become the core competitive advantage of the Republic of China in the future and drive the development of industries such as digital content and biotechnology.
Table 12: Comparison of Reasons for Differences in Path and Growth Potential
Comparison of
Key Performance
Categories
Ireland Republic of China
Institutions Investment-intensive country. Institutions
supported by state investment. Strong in services and value-added
support.
Vigorous SMEs but less institutional support.
Infrastructure Lack of adequacy in communications infrastructure as well as in
public infrastructure.
Lack of adequacy in infrastructure construction.
Macroeconomic stability Low inflation, economy slowing but growth rate still higher than normal;
employment levels expected to show some rise but also slowing.
No significant crisis of financial system with stable macro-policies.
Higher and primary
education
Educational system is very
strong and state regulated. All primary and secondary education is state funded
and third-level study is heavily subsidized.
Less strong higher
education system with less and uneven budgeting among S&T development
areas.
Technological readiness Moving toward an innovation- and knowledge-
driven economy. Increased government spending and investment in technology,
innovation, and scientific research.
Loosely linked industry/university
collaboration, and big lag exists between SMEs and bigger companies.
Market size UK-, US-, and Europe-focused with some global orientation development.
Asia-based and US-based global market orientation development.
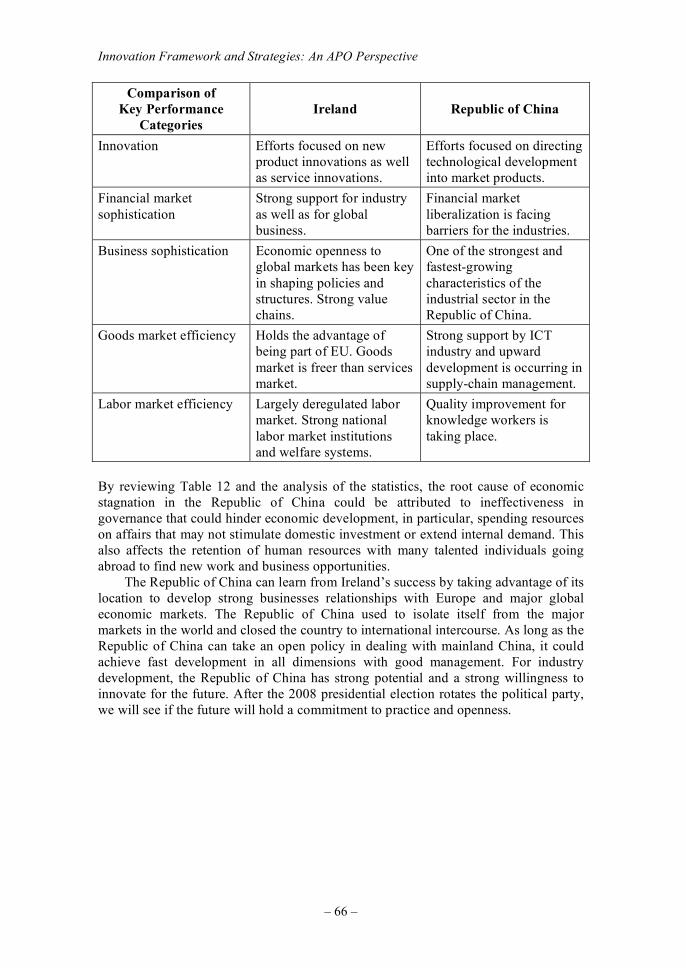
Innovation Framework and Strategies: An APO Perspective
– 66 –
Comparison of
Key Performance
Categories
Ireland Republic of China
Innovation Efforts focused on new product innovations as well as service innovations.
Efforts focused on directing technological development into market products.
Financial market
sophistication
Strong support for industry
as well as for global business.
Financial market
liberalization is facing barriers for the industries.
Business sophistication Economic openness to global markets has been key
in shaping policies and structures. Strong value chains.
One of the strongest and fastest-growing
characteristics of the industrial sector in the Republic of China.
Goods market efficiency Holds the advantage of being part of EU. Goods
market is freer than services market.
Strong support by ICT industry and upward
development is occurring in supply-chain management.
Labor market efficiency Largely deregulated labor market. Strong national
labor market institutions and welfare systems.
Quality improvement for knowledge workers is
taking place.
By reviewing Table 12 and the analysis of the statistics, the root cause of economic stagnation in the Republic of China could be attributed to ineffectiveness in governance that could hinder economic development, in particular, spending resources on affairs that may not stimulate domestic investment or extend internal demand. This also affects the retention of human resources with many talented individuals going abroad to find new work and business opportunities. The Republic of China can learn from Ireland’s success by taking advantage of its location to develop strong businesses relationships with Europe and major global economic markets. The Republic of China used to isolate itself from the major markets in the world and closed the country to international intercourse. As long as the Republic of China can take an open policy in dealing with mainland China, it could achieve fast development in all dimensions with good management. For industry development, the Republic of China has strong potential and a strong willingness to innovate for the future. After the 2008 presidential election rotates the political party, we will see if the future will hold a commitment to practice and openness.
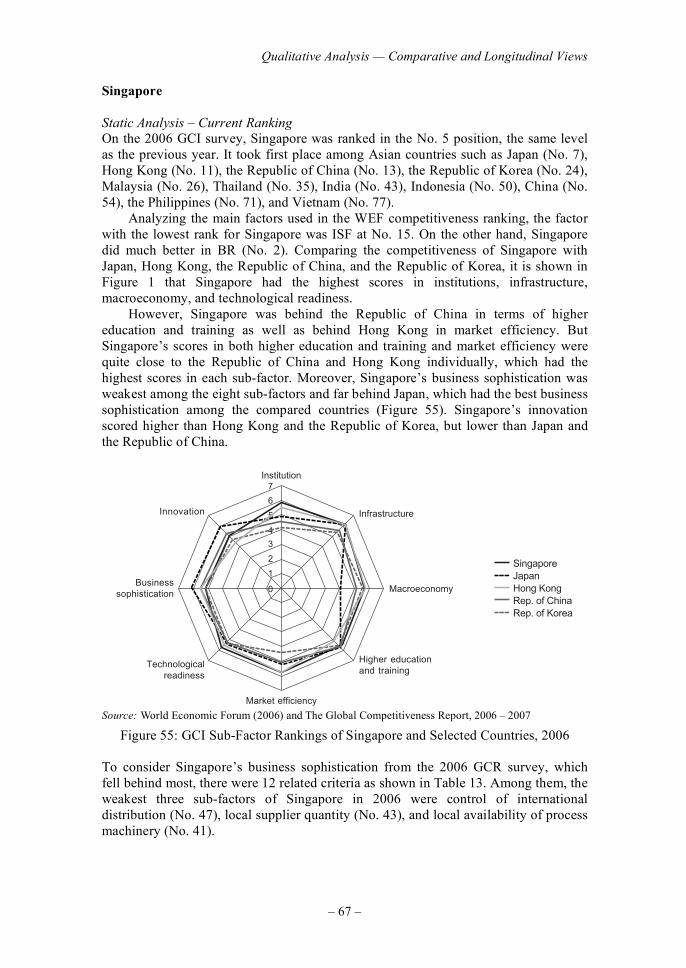
Qualitative Analysis — Comparative and Longitudinal Views
– 67 –
Singapore
Static Analysis – Current Ranking
On the 2006 GCI survey, Singapore was ranked in the No. 5 position, the same level as the previous year. It took first place among Asian countries such as Japan (No. 7), Hong Kong (No. 11), the Republic of China (No. 13), the Republic of Korea (No. 24), Malaysia (No. 26), Thailand (No. 35), India (No. 43), Indonesia (No. 50), China (No. 54), the Philippines (No. 71), and Vietnam (No. 77). Analyzing the main factors used in the WEF competitiveness ranking, the factor with the lowest rank for Singapore was ISF at No. 15. On the other hand, Singapore did much better in BR (No. 2). Comparing the competitiveness of Singapore with Japan, Hong Kong, the Republic of China, and the Republic of Korea, it is shown in Figure 1 that Singapore had the highest scores in institutions, infrastructure, macroeconomy, and technological readiness. However, Singapore was behind the Republic of China in terms of higher education and training as well as behind Hong Kong in market efficiency. But Singapore’s scores in both higher education and training and market efficiency were quite close to the Republic of China and Hong Kong individually, which had the highest scores in each sub-factor. Moreover, Singapore’s business sophistication was weakest among the eight sub-factors and far behind Japan, which had the best business sophistication among the compared countries (Figure 55). Singapore’s innovation scored higher than Hong Kong and the Republic of Korea, but lower than Japan and the Republic of China.
0
1
2
3
4
5
6
7Institution
Infrastructure
Macroeconomy
Higher educationand training
Market efficiency
Technologicalreadiness
Businesssophistication
Innovation
SingaporeJapanHong KongRep. of ChinaRep. of Korea
Source: World Economic Forum (2006) and The Global Competitiveness Report, 2006 – 2007
Figure 55: GCI Sub-Factor Rankings of Singapore and Selected Countries, 2006 To consider Singapore’s business sophistication from the 2006 GCR survey, which fell behind most, there were 12 related criteria as shown in Table 13. Among them, the weakest three sub-factors of Singapore in 2006 were control of international distribution (No. 47), local supplier quantity (No. 43), and local availability of process machinery (No. 41).
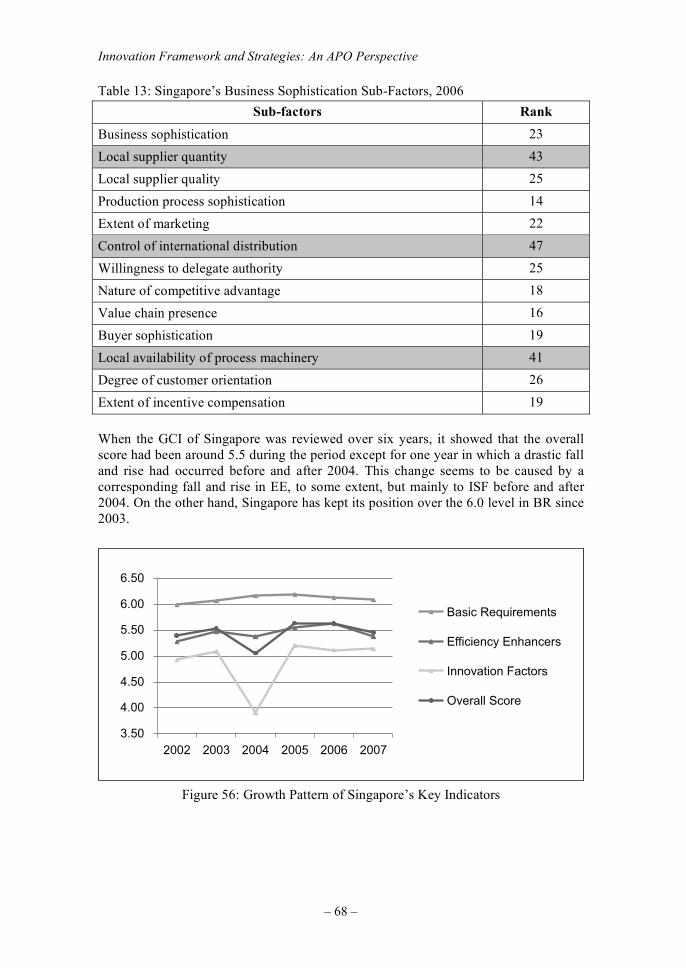
Innovation Framework and Strategies: An APO Perspective
– 68 –
Table 13: Singapore’s Business Sophistication Sub-Factors, 2006
Sub-factors Rank
Business sophistication 23
Local supplier quantity 43
Local supplier quality 25
Production process sophistication 14
Extent of marketing 22
Control of international distribution 47
Willingness to delegate authority 25
Nature of competitive advantage 18
Value chain presence 16
Buyer sophistication 19
Local availability of process machinery 41
Degree of customer orientation 26
Extent of incentive compensation 19
When the GCI of Singapore was reviewed over six years, it showed that the overall score had been around 5.5 during the period except for one year in which a drastic fall and rise had occurred before and after 2004. This change seems to be caused by a corresponding fall and rise in EE, to some extent, but mainly to ISF before and after 2004. On the other hand, Singapore has kept its position over the 6.0 level in BR since 2003.
05.3
00.4
05.4
00.5
05.5
00.6
05.6
700260025002400230022002
stnemeriuqeR cisaB
srecnahnE ycneiciffE
srotcaF noitavonnI
erocS llarevO
Figure 56: Growth Pattern of Singapore’s Key Indicators
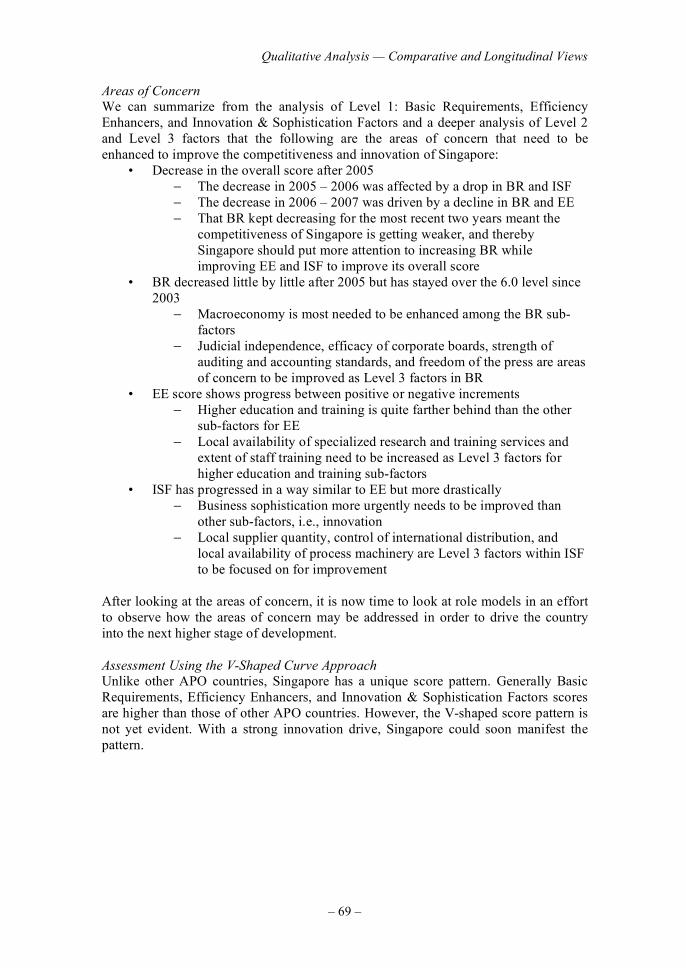
Qualitative Analysis — Comparative and Longitudinal Views
– 69 –
Areas of Concern
We can summarize from the analysis of Level 1: Basic Requirements, Efficiency Enhancers, and Innovation & Sophistication Factors and a deeper analysis of Level 2 and Level 3 factors that the following are the areas of concern that need to be enhanced to improve the competitiveness and innovation of Singapore:
• Decrease in the overall score after 2005 − The decrease in 2005 – 2006 was affected by a drop in BR and ISF − The decrease in 2006 – 2007 was driven by a decline in BR and EE − That BR kept decreasing for the most recent two years meant the
competitiveness of Singapore is getting weaker, and thereby Singapore should put more attention to increasing BR while improving EE and ISF to improve its overall score
• BR decreased little by little after 2005 but has stayed over the 6.0 level since 2003
− Macroeconomy is most needed to be enhanced among the BR sub-factors
− Judicial independence, efficacy of corporate boards, strength of auditing and accounting standards, and freedom of the press are areas of concern to be improved as Level 3 factors in BR
• EE score shows progress between positive or negative increments − Higher education and training is quite farther behind than the other
sub-factors for EE − Local availability of specialized research and training services and
extent of staff training need to be increased as Level 3 factors for higher education and training sub-factors
• ISF has progressed in a way similar to EE but more drastically − Business sophistication more urgently needs to be improved than
other sub-factors, i.e., innovation − Local supplier quantity, control of international distribution, and
local availability of process machinery are Level 3 factors within ISF to be focused on for improvement
After looking at the areas of concern, it is now time to look at role models in an effort to observe how the areas of concern may be addressed in order to drive the country into the next higher stage of development.
Assessment Using the V-Shaped Curve Approach
Unlike other APO countries, Singapore has a unique score pattern. Generally Basic Requirements, Efficiency Enhancers, and Innovation & Sophistication Factors scores are higher than those of other APO countries. However, the V-shaped score pattern is not yet evident. With a strong innovation drive, Singapore could soon manifest the pattern.
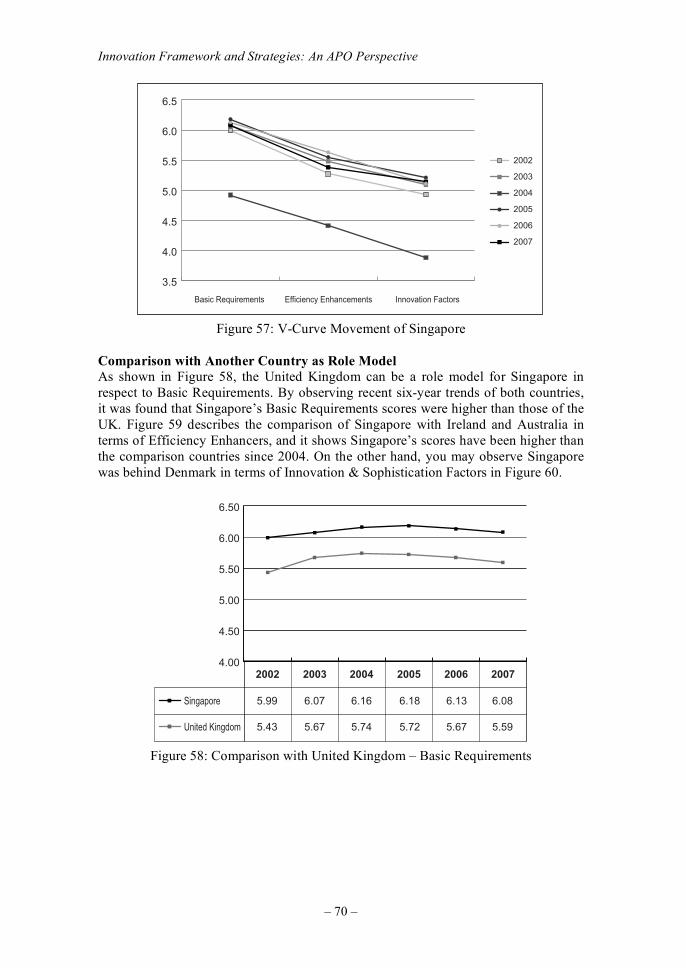
Innovation Framework and Strategies: An APO Perspective
– 70 –
Basic Requirements Efficiency Enhancements Innovation Factors
2002
2003
2004
2005
2006
2007
3.5
4.0
4.5
5.0
5.5
6.0
6.5
Figure 57: V-Curve Movement of Singapore
Comparison with Another Country as Role Model
As shown in Figure 58, the United Kingdom can be a role model for Singapore in respect to Basic Requirements. By observing recent six-year trends of both countries, it was found that Singapore’s Basic Requirements scores were higher than those of the UK. Figure 59 describes the comparison of Singapore with Ireland and Australia in terms of Efficiency Enhancers, and it shows Singapore’s scores have been higher than the comparison countries since 2004. On the other hand, you may observe Singapore was behind Denmark in terms of Innovation & Sophistication Factors in Figure 60.
2002
Singapore 5.99 6.07 6.16 6.18 6.13 6.08
United Kingdom 5.43 5.67 5.74 5.72 5.67 5.59
2003 2004 2005 2006 20074.00
4.50
5.00
5.50
6.00
6.50
Figure 58: Comparison with United Kingdom – Basic Requirements
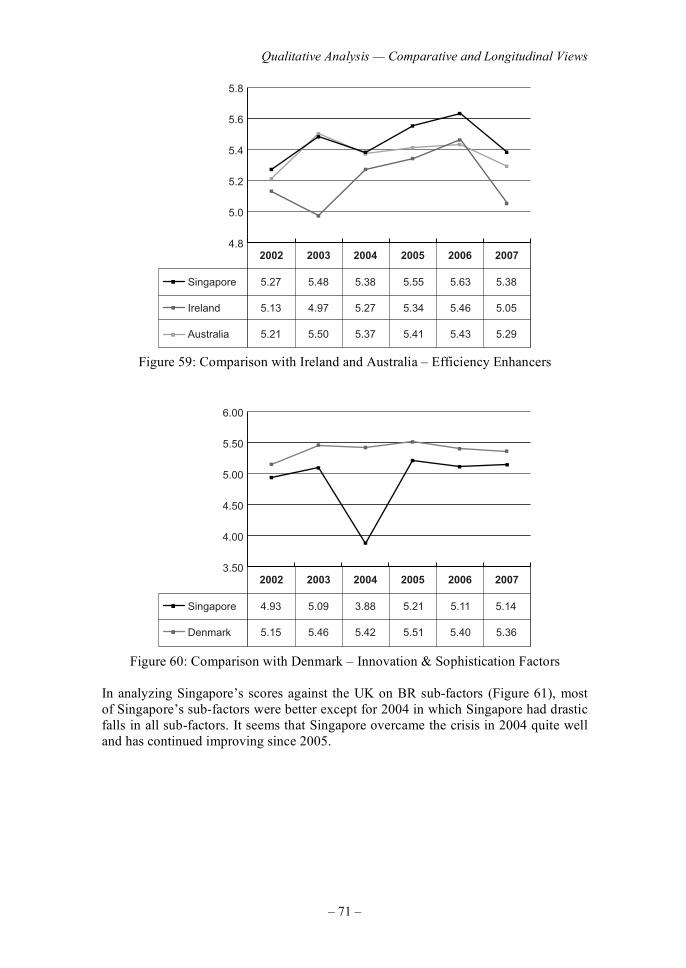
Qualitative Analysis — Comparative and Longitudinal Views
– 71 –
2002
Singapore 5.27 5.48 5.38 5.55 5.63 5.38
Ireland 5.13 4.97 5.27 5.34 5.46 5.05
Australia 5.21 5.50 5.37 5.41 5.43 5.29
2003 2004 2005 2006 20074.8
5.0
5.2
5.4
5.6
5.8
Figure 59: Comparison with Ireland and Australia – Efficiency Enhancers
2002
Singapore 4.93 5.09 3.88 5.21 5.11 5.14
Denmark 5.15 5.46 5.42 5.51 5.40 5.36
2003 2004 2005 2006 20073.50
4.00
4.50
5.00
5.50
6.00
Figure 60: Comparison with Denmark – Innovation & Sophistication Factors In analyzing Singapore’s scores against the UK on BR sub-factors (Figure 61), most of Singapore’s sub-factors were better except for 2004 in which Singapore had drastic falls in all sub-factors. It seems that Singapore overcame the crisis in 2004 quite well and has continued improving since 2005.
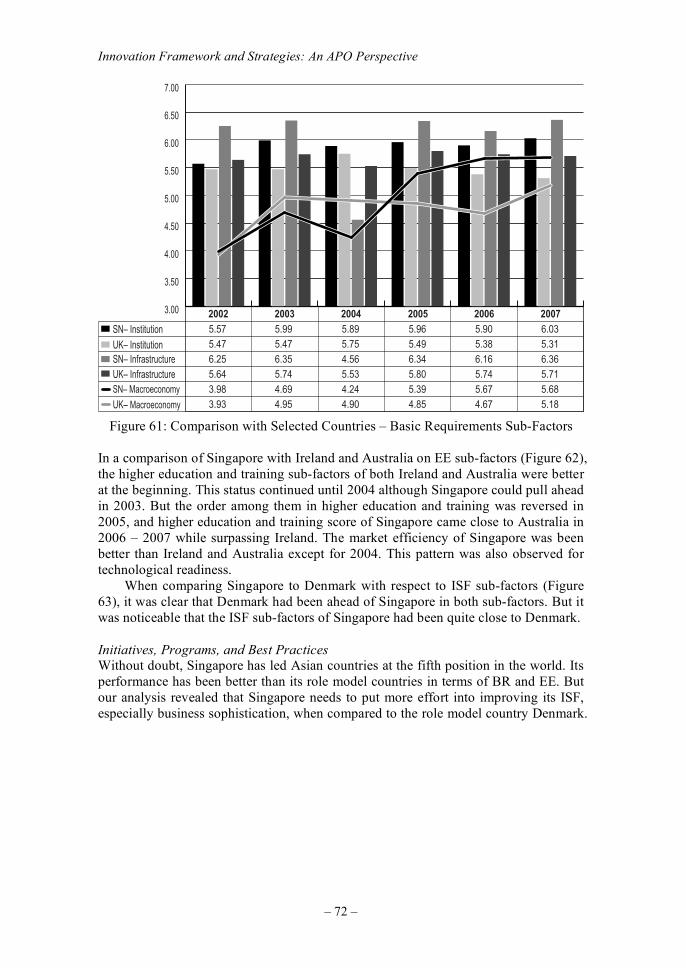
Innovation Framework and Strategies: An APO Perspective
– 72 –
2002
5.57 5.99 5.89 5.96 5.90 6.03
5.47 5.47 5.75 5.49 5.38 5.31
6.25 6.35 4.56 6.34 6.16 6.36
5.64 5.74 5.53 5.80 5.74 5.71
3.98 4.69 4.24 5.39 5.67 5.68
3.93 4.95 4.90 4.85 4.67 5.18
2003 2004 2005 2006 20073.00
3.50
4.00
4.50
5.00
5.50
6.00
6.50
7.00
UK– Infrastructure
UK– Macroeconomy
SN– Infrastructure
SN– Macroeconomy
UK– Institution
SN– Institution
Figure 61: Comparison with Selected Countries – Basic Requirements Sub-Factors In a comparison of Singapore with Ireland and Australia on EE sub-factors (Figure 62), the higher education and training sub-factors of both Ireland and Australia were better at the beginning. This status continued until 2004 although Singapore could pull ahead in 2003. But the order among them in higher education and training was reversed in 2005, and higher education and training score of Singapore came close to Australia in 2006 – 2007 while surpassing Ireland. The market efficiency of Singapore was been better than Ireland and Australia except for 2004. This pattern was also observed for technological readiness. When comparing Singapore to Denmark with respect to ISF sub-factors (Figure 63), it was clear that Denmark had been ahead of Singapore in both sub-factors. But it was noticeable that the ISF sub-factors of Singapore had been quite close to Denmark.
Initiatives, Programs, and Best Practices
Without doubt, Singapore has led Asian countries at the fifth position in the world. Its performance has been better than its role model countries in terms of BR and EE. But our analysis revealed that Singapore needs to put more effort into improving its ISF, especially business sophistication, when compared to the role model country Denmark.
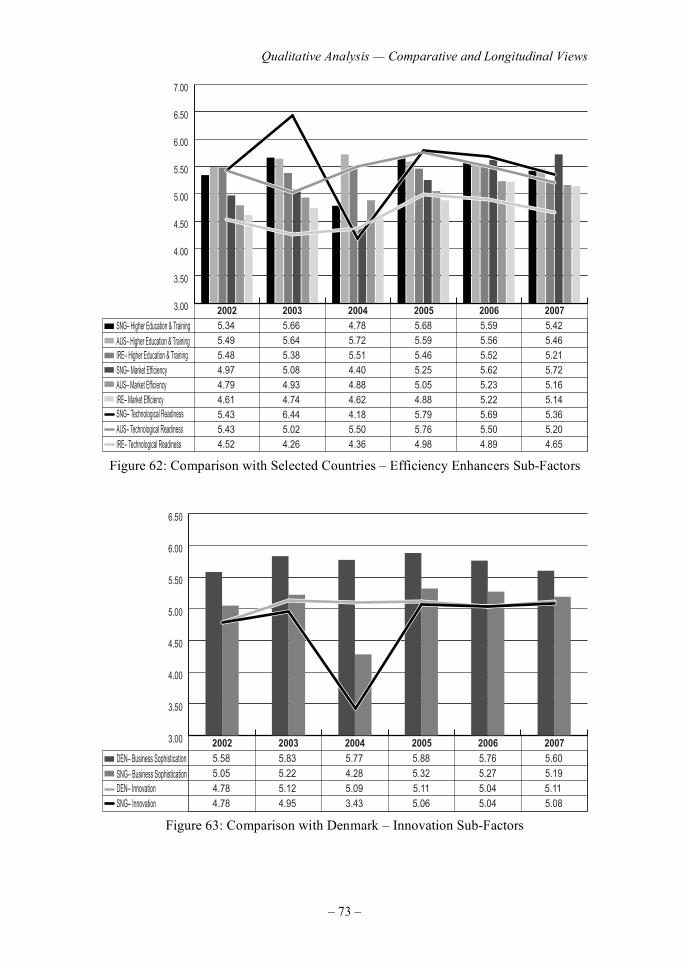
Qualitative Analysis — Comparative and Longitudinal Views
– 73 –
2002
5.34 5.66 4.78 5.68 5.59 5.42
5.49 5.64 5.72 5.59 5.56 5.46
5.48 5.38 5.51 5.46 5.52 5.21
4.97 5.08 4.40 5.25 5.62 5.72
4.79 4.93 4.88 5.05 5.23 5.16
4.61 4.74 4.62 4.88 5.22 5.14
5.43 6.44 4.18 5.79 5.69 5.36
5.43 5.02 5.50 5.76 5.50 5.20
4.52 4.26 4.36 4.98 4.89 4.65
2003 2004 2005 2006 20073.00
3.50
4.00
4.50
5.00
5.50
6.00
6.50
7.00
SNG– Market EfficiencyAUS– Market Efficiency
AUS– Technological ReadinessIRE– Technological Readiness
IRE– Higher Education & Training
SNG– Technological Readiness
AUS– Higher Education & Training
SNG– Higher Education & Training
IRE– Market Efficiency
Figure 62: Comparison with Selected Countries – Efficiency Enhancers Sub-Factors
2002
5.58 5.83 5.77 5.88 5.76 5.60
5.05 5.22 4.28 5.32 5.27 5.19
4.78 5.12 5.09 5.11 5.04 5.11
4.78 4.95 3.43 5.06 5.04 5.08
2003 2004 2005 2006 20073.00
3.50
4.00
4.50
5.00
5.50
6.00
6.50
SNG– InnovationDEN– InnovationSNG– Business Sophistication
DEN– Business Sophistication
Figure 63: Comparison with Denmark – Innovation Sub-Factors
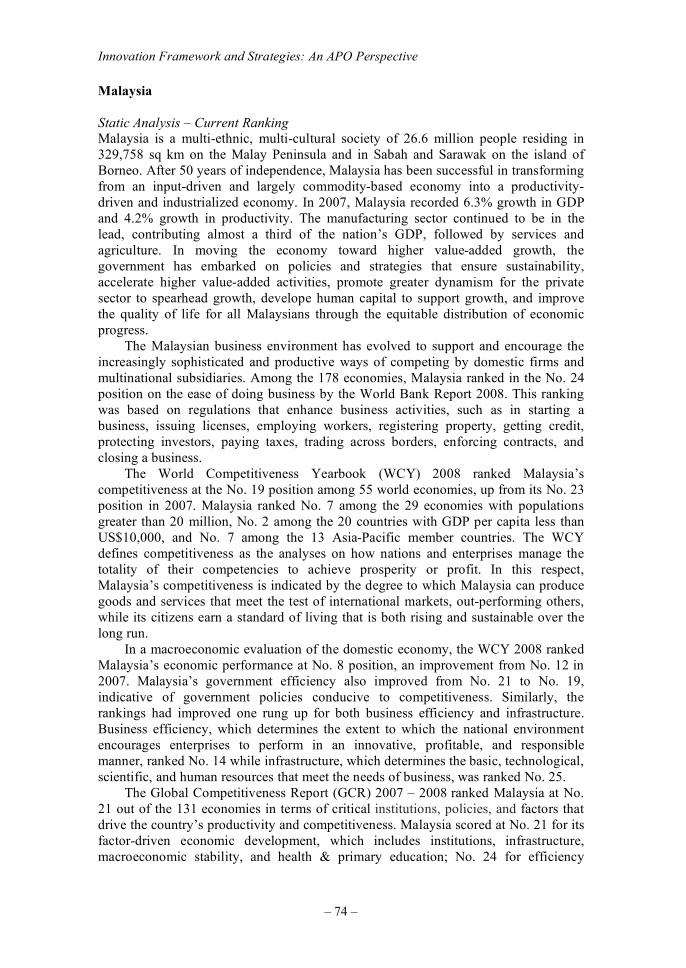
Innovation Framework and Strategies: An APO Perspective
– 74 –
Malaysia
Static Analysis – Current Ranking
Malaysia is a multi-ethnic, multi-cultural society of 26.6 million people residing in 329,758 sq km on the Malay Peninsula and in Sabah and Sarawak on the island of Borneo. After 50 years of independence, Malaysia has been successful in transforming from an input-driven and largely commodity-based economy into a productivity-driven and industrialized economy. In 2007, Malaysia recorded 6.3% growth in GDP and 4.2% growth in productivity. The manufacturing sector continued to be in the lead, contributing almost a third of the nation’s GDP, followed by services and agriculture. In moving the economy toward higher value-added growth, the government has embarked on policies and strategies that ensure sustainability, accelerate higher value-added activities, promote greater dynamism for the private sector to spearhead growth, develope human capital to support growth, and improve the quality of life for all Malaysians through the equitable distribution of economic progress. The Malaysian business environment has evolved to support and encourage the increasingly sophisticated and productive ways of competing by domestic firms and multinational subsidiaries. Among the 178 economies, Malaysia ranked in the No. 24 position on the ease of doing business by the World Bank Report 2008. This ranking was based on regulations that enhance business activities, such as in starting a business, issuing licenses, employing workers, registering property, getting credit, protecting investors, paying taxes, trading across borders, enforcing contracts, and closing a business. The World Competitiveness Yearbook (WCY) 2008 ranked Malaysia’s competitiveness at the No. 19 position among 55 world economies, up from its No. 23 position in 2007. Malaysia ranked No. 7 among the 29 economies with populations greater than 20 million, No. 2 among the 20 countries with GDP per capita less than US$10,000, and No. 7 among the 13 Asia-Pacific member countries. The WCY defines competitiveness as the analyses on how nations and enterprises manage the totality of their competencies to achieve prosperity or profit. In this respect, Malaysia’s competitiveness is indicated by the degree to which Malaysia can produce goods and services that meet the test of international markets, out-performing others, while its citizens earn a standard of living that is both rising and sustainable over the long run. In a macroeconomic evaluation of the domestic economy, the WCY 2008 ranked Malaysia’s economic performance at No. 8 position, an improvement from No. 12 in 2007. Malaysia’s government efficiency also improved from No. 21 to No. 19, indicative of government policies conducive to competitiveness. Similarly, the rankings had improved one rung up for both business efficiency and infrastructure. Business efficiency, which determines the extent to which the national environment encourages enterprises to perform in an innovative, profitable, and responsible manner, ranked No. 14 while infrastructure, which determines the basic, technological, scientific, and human resources that meet the needs of business, was ranked No. 25. The Global Competitiveness Report (GCR) 2007 – 2008 ranked Malaysia at No. 21 out of the 131 economies in terms of critical institutions, policies, and factors that drive the country’s productivity and competitiveness. Malaysia scored at No. 21 for its factor-driven economic development, which includes institutions, infrastructure, macroeconomic stability, and health & primary education; No. 24 for efficiency
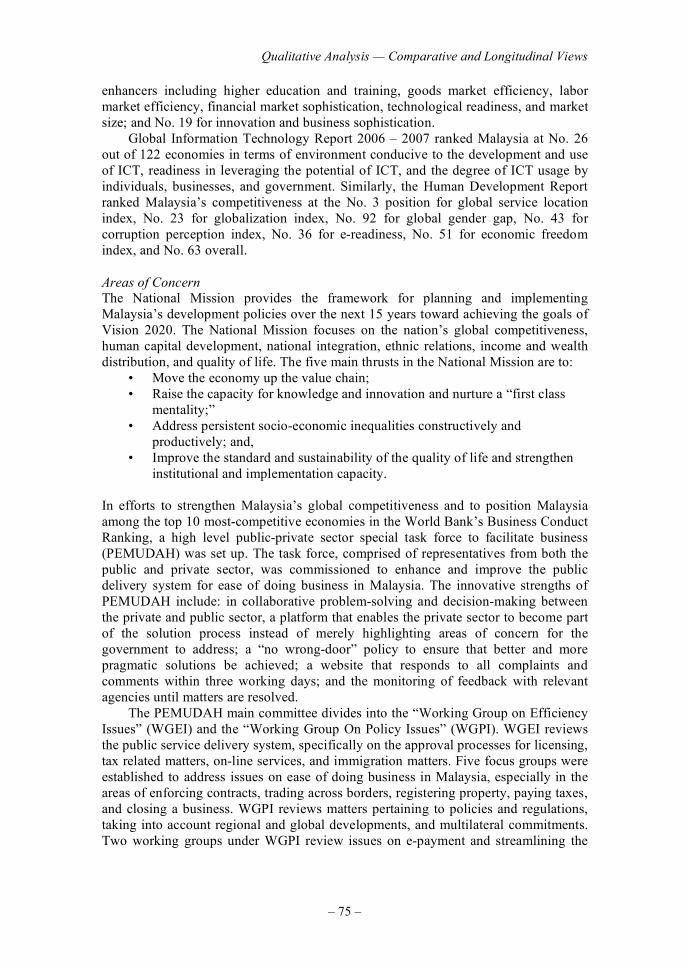
Qualitative Analysis — Comparative and Longitudinal Views
– 75 –
enhancers including higher education and training, goods market efficiency, labor market efficiency, financial market sophistication, technological readiness, and market size; and No. 19 for innovation and business sophistication. Global Information Technology Report 2006 – 2007 ranked Malaysia at No. 26 out of 122 economies in terms of environment conducive to the development and use of ICT, readiness in leveraging the potential of ICT, and the degree of ICT usage by individuals, businesses, and government. Similarly, the Human Development Report ranked Malaysia’s competitiveness at the No. 3 position for global service location index, No. 23 for globalization index, No. 92 for global gender gap, No. 43 for corruption perception index, No. 36 for e-readiness, No. 51 for economic freedom index, and No. 63 overall.
Areas of Concern
The National Mission provides the framework for planning and implementing Malaysia’s development policies over the next 15 years toward achieving the goals of Vision 2020. The National Mission focuses on the nation’s global competitiveness, human capital development, national integration, ethnic relations, income and wealth distribution, and quality of life. The five main thrusts in the National Mission are to:
• Move the economy up the value chain; • Raise the capacity for knowledge and innovation and nurture a “first class
mentality;” • Address persistent socio-economic inequalities constructively and
productively; and, • Improve the standard and sustainability of the quality of life and strengthen
institutional and implementation capacity. In efforts to strengthen Malaysia’s global competitiveness and to position Malaysia among the top 10 most-competitive economies in the World Bank’s Business Conduct Ranking, a high level public-private sector special task force to facilitate business (PEMUDAH) was set up. The task force, comprised of representatives from both the public and private sector, was commissioned to enhance and improve the public delivery system for ease of doing business in Malaysia. The innovative strengths of PEMUDAH include: in collaborative problem-solving and decision-making between the private and public sector, a platform that enables the private sector to become part of the solution process instead of merely highlighting areas of concern for the government to address; a “no wrong-door” policy to ensure that better and more pragmatic solutions be achieved; a website that responds to all complaints and comments within three working days; and the monitoring of feedback with relevant agencies until matters are resolved. The PEMUDAH main committee divides into the “Working Group on Efficiency Issues” (WGEI) and the “Working Group On Policy Issues” (WGPI). WGEI reviews the public service delivery system, specifically on the approval processes for licensing, tax related matters, on-line services, and immigration matters. Five focus groups were established to address issues on ease of doing business in Malaysia, especially in the areas of enforcing contracts, trading across borders, registering property, paying taxes, and closing a business. WGPI reviews matters pertaining to policies and regulations, taking into account regional and global developments, and multilateral commitments. Two working groups under WGPI review issues on e-payment and streamlining the
Innovation Framework and Strategies: An APO Perspective
– 76 –
processes and procedures for obtaining licenses to start and operate a hotel in Malaysia. To deliver a first-class public service and achieve “Vision 2020,” the Malaysian government has emphasized maintaining a culture of performance, accountability, and transparency, empowering the workforce with the right attitudes, skills, and work stamina, improving frontline delivery, leveraging technology for quality services, eradicating poverty, and fostering effective partnership with stakeholders. Government innovations include the following:
• “One service, one delivery, and no wrong door” policy • Payment for all invoices to the government within 14 working days • Tax refunds within 30 days • New and renewal of passports within 2 to 24 hours • One-Stop Centers in all Local Authorities for greater efficiency • E-KL* to provide end-to-end online services, electronic payment,
submission, and communications * A web and computer network initiative to reach into every area that involves public contact
with the government.
• Registration of a new business within 1 hour • Emphasis on audits and integrity • Engagement with stakeholders without a lot of red tape and bureacracy • Responding to the media through websites, newspapers, and e-mail • Business Licensing Electronic Support System, a one-stop portal for business
license applications that eliminates the need to go through various agencies • E-payments to be expanded to cover a wide array of government transactions
through Internet banking and credit card payment • E-Perolehan to ease the procurement and payment to contractors • E-Khidmat to facilitate online payment of summonses, driver’s license
applications, bill and assessment charge payments, queries on the status of insolvencies, and the closing of businesses
• Government’s SMS Gateway to offer services including payments and enquiries as well as information on approvals and reminders
• E-Lodgement to further facilitate the registration of companies and businesses
• E-Kadaster to expedite the issuance of land and strata titles • The 999 “One Country, One Number” phone system to be further
strengthened to ensure that citizens have efficient and speedy access to emergency services
• National Broadband initiative to provide the necessary infrastructure to support services to citizens and businesses
• National Single Window initiative to enable seamless submission of documentation for exports and imports
• E-Kaseh actions to eradicate poverty
Assessment Using the V-Shaped Curve Approach
In the last five years, Malaysia registered an increasing trend in competitiveness following a rise in the scorings recorded for the factors of Basic Requirement (BR), Efficiency Enhancers (EE) and Innovation & Sophistication Factors (ISF) (Figure 64). The trend of growth between BR, EE, and ISF for each year had also started to form the “V” pattern, just like the “V” patterns registered by the top most-competitive
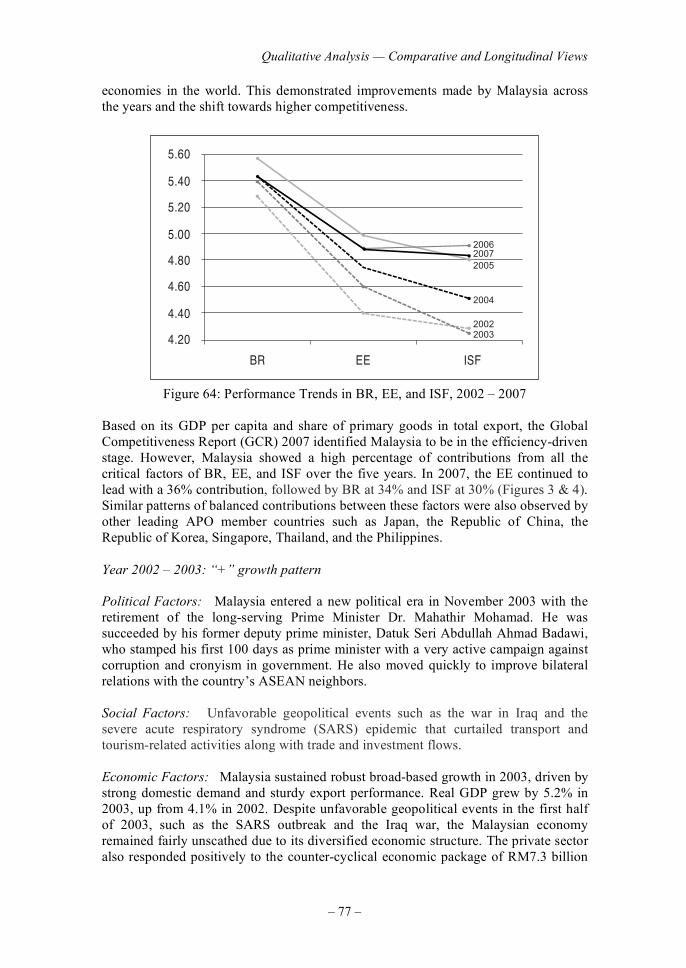
Qualitative Analysis — Comparative and Longitudinal Views
– 77 –
economies in the world. This demonstrated improvements made by Malaysia across the years and the shift towards higher competitiveness.
4.20
4.40
4.60
4.80
5.00
5.20
5.40
5.60
BR EE ISF
20022003
2004
200520072006
Figure 64: Performance Trends in BR, EE, and ISF, 2002 – 2007 Based on its GDP per capita and share of primary goods in total export, the Global Competitiveness Report (GCR) 2007 identified Malaysia to be in the efficiency-driven stage. However, Malaysia showed a high percentage of contributions from all the critical factors of BR, EE, and ISF over the five years. In 2007, the EE continued to lead with a 36% contribution, followed by BR at 34% and ISF at 30% (Figures 3 & 4). Similar patterns of balanced contributions between these factors were also observed by other leading APO member countries such as Japan, the Republic of China, the Republic of Korea, Singapore, Thailand, and the Philippines.
Year 2002 – 2003: “+” growth pattern
Political Factors: Malaysia entered a new political era in November 2003 with the retirement of the long-serving Prime Minister Dr. Mahathir Mohamad. He was succeeded by his former deputy prime minister, Datuk Seri Abdullah Ahmad Badawi, who stamped his first 100 days as prime minister with a very active campaign against corruption and cronyism in government. He also moved quickly to improve bilateral relations with the country’s ASEAN neighbors. Social Factors: Unfavorable geopolitical events such as the war in Iraq and the severe acute respiratory syndrome (SARS) epidemic that curtailed transport and tourism-related activities along with trade and investment flows. Economic Factors: Malaysia sustained robust broad-based growth in 2003, driven by strong domestic demand and sturdy export performance. Real GDP grew by 5.2% in 2003, up from 4.1% in 2002. Despite unfavorable geopolitical events in the first half of 2003, such as the SARS outbreak and the Iraq war, the Malaysian economy remained fairly unscathed due to its diversified economic structure. The private sector also responded positively to the counter-cyclical economic package of RM7.3 billion
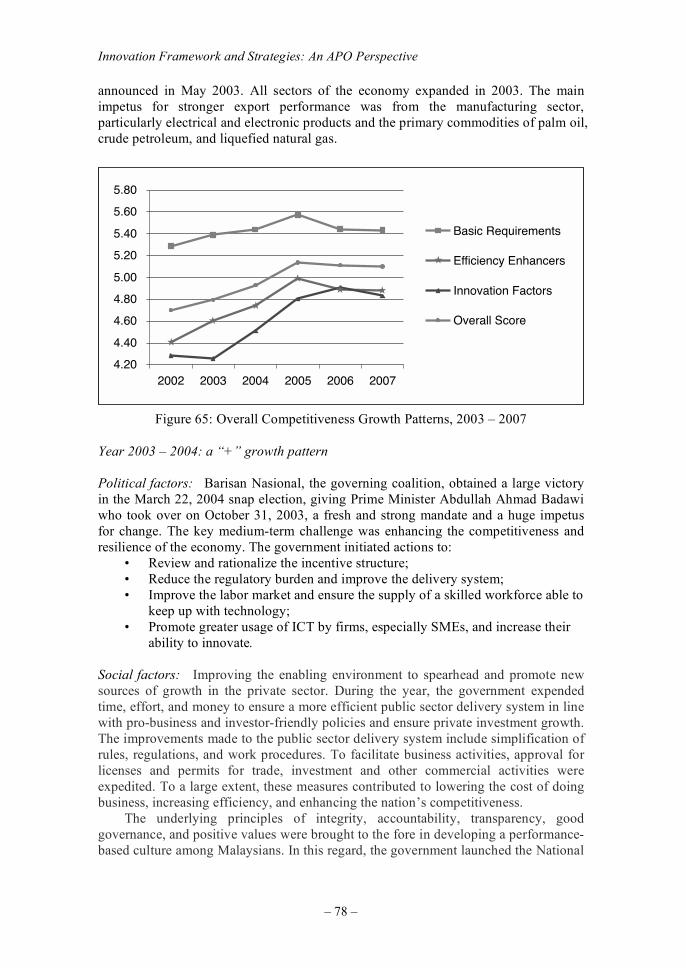
Innovation Framework and Strategies: An APO Perspective
– 78 –
announced in May 2003. All sectors of the economy expanded in 2003. The main impetus for stronger export performance was from the manufacturing sector, particularly electrical and electronic products and the primary commodities of palm oil, crude petroleum, and liquefied natural gas.
02.4
04.4
06.4
08.4
00.5
02.5
04.5
06.5
08.5
700260025002400230022002
stnemeriuqeR cisaB
srecnahnE ycneiciffE
srotcaF noitavonnI
erocS llarevO
Figure 65: Overall Competitiveness Growth Patterns, 2003 – 2007
Year 2003 – 2004: a “+” growth pattern
Political factors: Barisan Nasional, the governing coalition, obtained a large victory in the March 22, 2004 snap election, giving Prime Minister Abdullah Ahmad Badawi who took over on October 31, 2003, a fresh and strong mandate and a huge impetus for change. The key medium-term challenge was enhancing the competitiveness and resilience of the economy. The government initiated actions to:
• Review and rationalize the incentive structure; • Reduce the regulatory burden and improve the delivery system; • Improve the labor market and ensure the supply of a skilled workforce able to
keep up with technology; • Promote greater usage of ICT by firms, especially SMEs, and increase their
ability to innovate.
Social factors: Improving the enabling environment to spearhead and promote new sources of growth in the private sector. During the year, the government expended time, effort, and money to ensure a more efficient public sector delivery system in line with pro-business and investor-friendly policies and ensure private investment growth. The improvements made to the public sector delivery system include simplification of rules, regulations, and work procedures. To facilitate business activities, approval for licenses and permits for trade, investment and other commercial activities were expedited. To a large extent, these measures contributed to lowering the cost of doing business, increasing efficiency, and enhancing the nation’s competitiveness. The underlying principles of integrity, accountability, transparency, good governance, and positive values were brought to the fore in developing a performance-based culture among Malaysians. In this regard, the government launched the National
Qualitative Analysis — Comparative and Longitudinal Views
– 79 –
Integrity Plan (NIP) to inculcate noble values and create a strong society with high morals and ethics in accordance with the fourth challenge embodied in Vision 2020. The all-encompassing NIP seeks to effectively reduce corruption, abuse of power, and bureaucratic red tape as well as improve the public sector delivery system. Concurrently, the Malaysian Integrity Institute was established to oversee and monitor the implementation of NIP apart from conducting research, education, and training as well as provide advice to the government on matters pertaining to integrity and ethics. Along the lines adopted to check and deter corruption among civil servants, political appointees in the government were also required to declare their assets at the onset of their tenure.
Economic factors: Economic policies in 2004 continued to focus on achieving sustainable growth with long-term resilience and competitiveness. Broad-based growth was evidence of effective measures implemented by the government to develop new sources of growth to reduce the nation’s vulnerability to the external environment. The manufacturing sector, which became more diversified with higher-end, value-added, and new emerging industries and products, had remained a major contributor to growth. New growth areas in information and communications technology (ICT), strong expansion in financial services, and revival in tourism activities had supported growth in the services sector with the share of GDP at 57%. The government’s commitment to revitalize the agriculture sector as the third engine of economic growth, particularly in food production, has resulted in an expansion in output of fruit, aquaculture, and livestock. The increased awareness and compliance with corporate governance and industry best practices have improved the business entities, particularly public-listed companies. Management review and revamp exercise among government-linked companies (GLCs) was undertaken that included the appointment of high-caliber personnel to head the GLCs. Additional requirements to comply with key performance indicators aimed at enhancing corporate efficiency and effectiveness were introduced. These measures boosted public confidence, which further enhanced the environment for business in the country.
Year 2004 – 2005: “+” growth pattern
Political factors: The government continued to improve its delivery system to ensure greater efficiency and better quality services conducive to the expansion of private sector investment initiatives. This included the setting up of Customer Service Offices and one-stop centers, establishing a comprehensive public service portal, leveraging ICT for greater outreach, and improving response time. Social factors: Greater external challenges arose, such as the moderation of global growth, revival of inflationary pressure, and growing trends toward tightening the monetary policy. Oil prices rose sharply to almost USD70 per barrel on 30 August 2005. Economic factors: The Malaysia economy remained resilient, growing by 5%, reflecting a more broad-based expansion of the economy originating from stronger domestic demand, primarily private-sector activities. To promote endogenous growth and enhance competitiveness, focus was directed toward developing new sources of
Innovation Framework and Strategies: An APO Perspective
– 80 –
growth and venture in high value-added areas. This included leveraging Malaysia’s comparative advantage and rich biodiversity of agro-biotechnology by launching the National Biotechnology Policy and setting up the Malaysian Biotechnology Corporation. The government continued to develop the Multimedia Super Corridor with the rolling-out of two cybercities in the north. Improvement in tourism infrastructure and development of tourism attractions were carried out including integrated tourism projects, theme parks, marinas, and the Kuala Lumpur Convention Centre. To promote more domestic tourism, the government announced a five-day work-week for civil service staff.
Year 2005 – 2006: “−” growth pattern
Political factors: Prudent financial management was evident, focusing on greater accountability and effective spending of government allocations. Major long-term policies implemented included the Ninth Malaysia Plan (9MP), 2006 – 2010 and the Third Industrial Master Plan (IMP3), 2006 – 2020. The 9MP aimed to achieve a stronger and richer economy and a higher quality of life. The IMP3 provided the strategic direction in spearheading the growth and competitiveness of the manufacturing sector and manufacturing-related services industry. Social factors: High crude oil prices, rising global interest rates, and increasing competition from China, India and other emerging regional economies. Malaysia launched the “Visit Malaysia Year 2007” in conjunction with the 50
th anniversary of
Malaysia’s independence to draw more tourists into the country. Economic factors: A stronger Malaysian ringgit against the U.S. dollar was supported by solid trade performance. Strong domestic demand and expanding trade-related activities resulted in a GDP growth of 5.9%. The Iskandar Development Region (IDR) was launched on 4 November 2006 to generate economic activities in the southern region to include projects intended to transform the region into a logistics and tourism hub.
Year 2006 – 2007: “−” growth pattern
Political factors: Malaysia continues to enjoy political stability with a diverse yet united population. Per capita income has increased 26 times to RM20,841 and the incidence of poverty has also been reduced to less than 6% of the population. The government’s far-sighted and pro-business policies were instrumental in the transformation of the economy, enabling Malaysia to achieve a higher growth trajectory. The government has articulated the National Mission, which commits to continuing the structural transformation toward becoming a developed nation by 2020. Three key policy documents were launched to strengthen human capital development and create an innovative and skilful workforce. These were the Education Blueprint 2006 – 2010, the Strategic Plan for Higher Education, and the Higher Education Action Plan 2007 – 2010. To strengthen the public delivery system, a special task force comprising high-level government officials, the captains of industry (PEMUDAH), and the Public Delivery Monitoring Panel, were established to review and improve government processes and procedures.
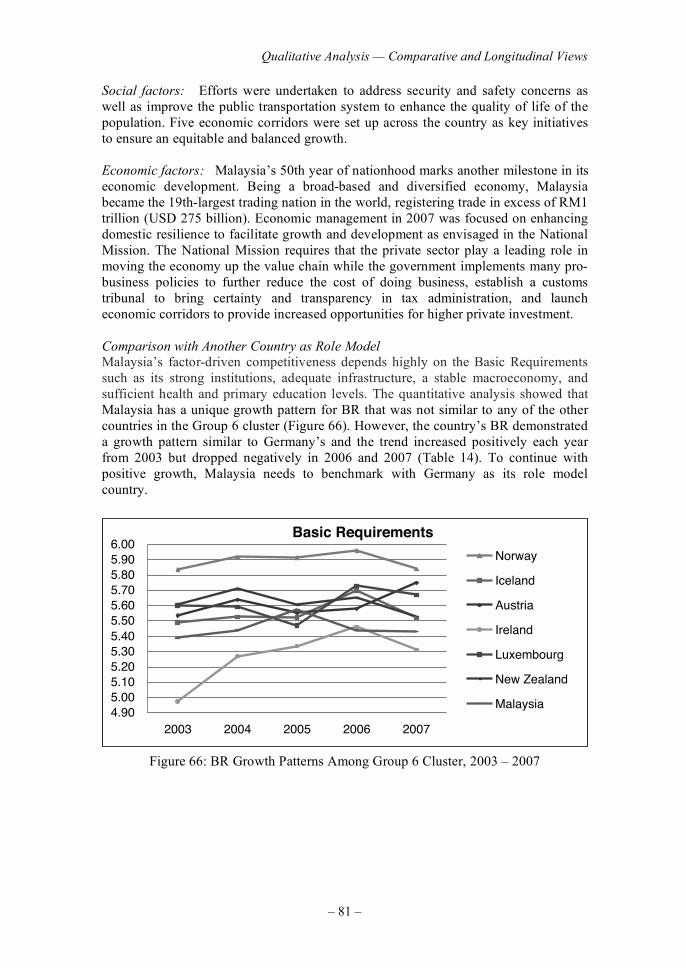
Qualitative Analysis — Comparative and Longitudinal Views
– 81 –
Social factors: Efforts were undertaken to address security and safety concerns as well as improve the public transportation system to enhance the quality of life of the population. Five economic corridors were set up across the country as key initiatives to ensure an equitable and balanced growth. Economic factors: Malaysia’s 50th year of nationhood marks another milestone in its economic development. Being a broad-based and diversified economy, Malaysia became the 19th-largest trading nation in the world, registering trade in excess of RM1 trillion (USD 275 billion). Economic management in 2007 was focused on enhancing domestic resilience to facilitate growth and development as envisaged in the National Mission. The National Mission requires that the private sector play a leading role in moving the economy up the value chain while the government implements many pro-business policies to further reduce the cost of doing business, establish a customs tribunal to bring certainty and transparency in tax administration, and launch economic corridors to provide increased opportunities for higher private investment.
Comparison with Another Country as Role Model
Malaysia’s factor-driven competitiveness depends highly on the Basic Requirements such as its strong institutions, adequate infrastructure, a stable macroeconomy, and sufficient health and primary education levels. The quantitative analysis showed that Malaysia has a unique growth pattern for BR that was not similar to any of the other countries in the Group 6 cluster (Figure 66). However, the country’s BR demonstrated a growth pattern similar to Germany’s and the trend increased positively each year from 2003 but dropped negatively in 2006 and 2007 (Table 14). To continue with positive growth, Malaysia needs to benchmark with Germany as its role model country.
stnemeriuqeR cisaB
09.400.501.502.503.504.505.506.507.508.509.500.6
70026002500240023002
yawroN
dnalecI
airtsuA
dnalerI
gruobmexuL
dnalaeZ weN
aisyalaM
Figure 66: BR Growth Patterns Among Group 6 Cluster, 2003 – 2007
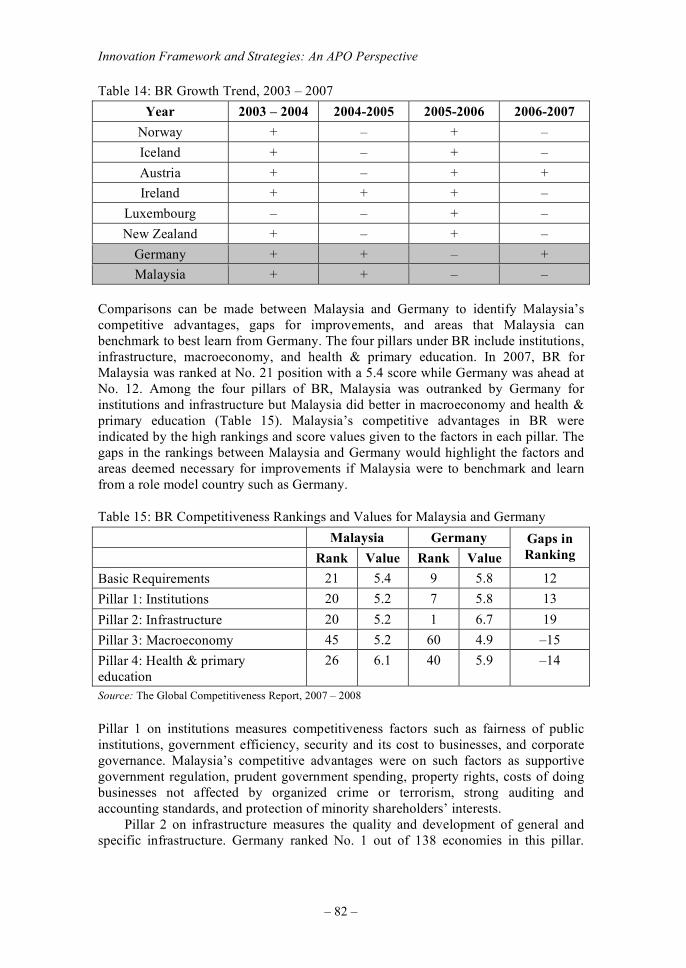
Innovation Framework and Strategies: An APO Perspective
– 82 –
Table 14: BR Growth Trend, 2003 – 2007
Year 2003 – 2004 2004-2005 2005-2006 2006-2007
Norway + – + –
Iceland + – + –
Austria + – + +
Ireland + + + –
Luxembourg – – + –
New Zealand + – + –
Germany + + – +
Malaysia + + – –
Comparisons can be made between Malaysia and Germany to identify Malaysia’s competitive advantages, gaps for improvements, and areas that Malaysia can benchmark to best learn from Germany. The four pillars under BR include institutions, infrastructure, macroeconomy, and health & primary education. In 2007, BR for Malaysia was ranked at No. 21 position with a 5.4 score while Germany was ahead at No. 12. Among the four pillars of BR, Malaysia was outranked by Germany for institutions and infrastructure but Malaysia did better in macroeconomy and health & primary education (Table 15). Malaysia’s competitive advantages in BR were indicated by the high rankings and score values given to the factors in each pillar. The gaps in the rankings between Malaysia and Germany would highlight the factors and areas deemed necessary for improvements if Malaysia were to benchmark and learn from a role model country such as Germany.
Table 15: BR Competitiveness Rankings and Values for Malaysia and Germany
Malaysia Germany
Rank Value Rank Value
Gaps in
Ranking
Basic Requirements 21 5.4 9 5.8 12
Pillar 1: Institutions 20 5.2 7 5.8 13
Pillar 2: Infrastructure 20 5.2 1 6.7 19
Pillar 3: Macroeconomy 45 5.2 60 4.9 –15
Pillar 4: Health & primary education
26 6.1 40 5.9 –14
Source: The Global Competitiveness Report, 2007 – 2008
Pillar 1 on institutions measures competitiveness factors such as fairness of public institutions, government efficiency, security and its cost to businesses, and corporate governance. Malaysia’s competitive advantages were on such factors as supportive government regulation, prudent government spending, property rights, costs of doing businesses not affected by organized crime or terrorism, strong auditing and accounting standards, and protection of minority shareholders’ interests. Pillar 2 on infrastructure measures the quality and development of general and specific infrastructure. Germany ranked No. 1 out of 138 economies in this pillar.
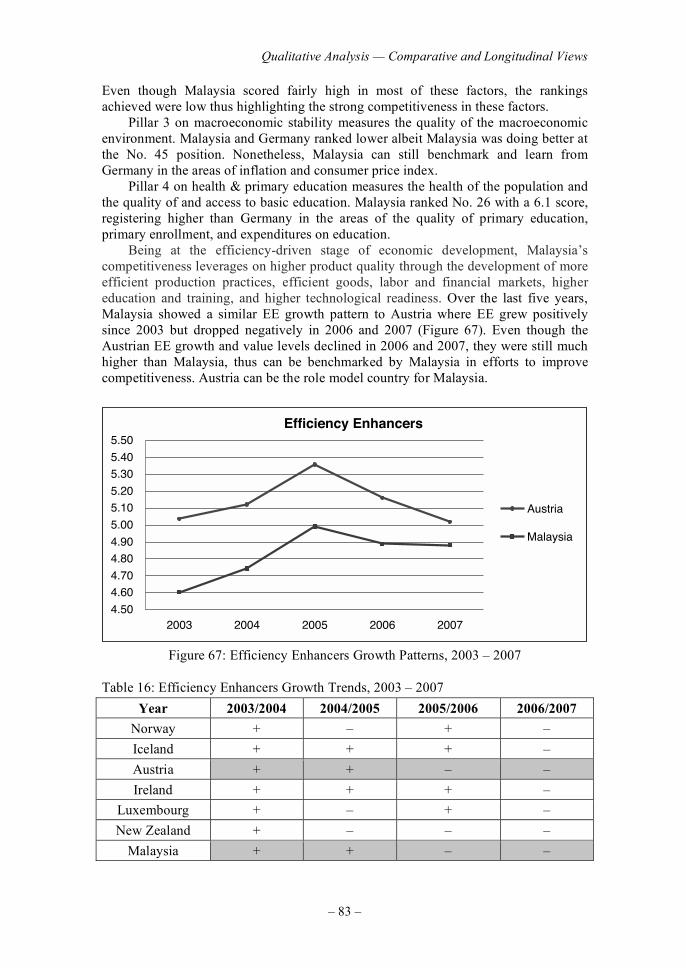
Qualitative Analysis — Comparative and Longitudinal Views
– 83 –
Even though Malaysia scored fairly high in most of these factors, the rankings achieved were low thus highlighting the strong competitiveness in these factors. Pillar 3 on macroeconomic stability measures the quality of the macroeconomic environment. Malaysia and Germany ranked lower albeit Malaysia was doing better at the No. 45 position. Nonetheless, Malaysia can still benchmark and learn from Germany in the areas of inflation and consumer price index. Pillar 4 on health & primary education measures the health of the population and the quality of and access to basic education. Malaysia ranked No. 26 with a 6.1 score, registering higher than Germany in the areas of the quality of primary education, primary enrollment, and expenditures on education. Being at the efficiency-driven stage of economic development, Malaysia’s competitiveness leverages on higher product quality through the development of more efficient production practices, efficient goods, labor and financial markets, higher education and training, and higher technological readiness. Over the last five years, Malaysia showed a similar EE growth pattern to Austria where EE grew positively since 2003 but dropped negatively in 2006 and 2007 (Figure 67). Even though the Austrian EE growth and value levels declined in 2006 and 2007, they were still much higher than Malaysia, thus can be benchmarked by Malaysia in efforts to improve competitiveness. Austria can be the role model country for Malaysia.
srecnahnE ycneiciffE
05.4
06.4
07.4
08.4
09.4
00.5
01.5
02.5
03.5
04.5
05.5
70026002500240023002
airtsuA
aisyalaM
Figure 67: Efficiency Enhancers Growth Patterns, 2003 – 2007
Table 16: Efficiency Enhancers Growth Trends, 2003 – 2007
Year 2003/2004 2004/2005 2005/2006 2006/2007
Norway + – + –
Iceland + + + –
Austria + + – –
Ireland + + + –
Luxembourg + – + –
New Zealand + – – –
Malaysia + + – –
Innovation Framework and Strategies: An APO Perspective
– 84 –
Comparisons showed that Malaysia was just three rungs behind Austria on EE competitive factors (Table 4). Among the six pillars under EE, Austria was leading in higher education and training, goods market efficiency, and technological readiness, while Malaysia was better than Austria in the areas of labor market efficiency, financial market sophistication, and market size. Pillar 5 on higher education and training measured the quality of and access to secondary and higher education and the effectiveness of job training. Malaysia recorded higher than Austria on quality of math and science education and quality of management schools (Appendix 2, Table 2a). Through benchmarking with Austria, Malaysia shows a need to improve in the areas of secondary and tertiary enrollments, Internet access in schools, and the extent of company investment in attracting, training, and retraining employees. Pillar 6 on goods market efficiency measured the extent of domestic and foreign competition in a given market and the quality of demand conditions. Malaysia ranked No. 2 on agricultural policy costs and scored higher than 5.5 on the intensity of local competition, extent and effect of taxation, total tax rate, business impact of rules on FDI, degree of customer orientation, and extent of regional sales.
Table 17: EE Competitiveness Rankings and Values for Malaysia and Germany
Malaysia Austria
Rank Value Rank Value
Gaps in
Ranking
Efficiency Enhancers 24 4.9 21 5.0 3
Pillar 5: Higher education and training
27 4.9 17 5.4 10
Pillar 6: Goods market efficiency 20 5.2 5 5.4 15
Pillar 7: Labor market efficiency 16 4.9 42 4.5 -26
Pillar 8: Financial market
sophistication
19 5.5 28 5.2 -9
Pillar 9: Technological readiness 30 4.3 18 5.2 12
Pillar 10: Market size 29 4.5 35 4.5 -6
Source: The Global Competitiveness Report, 2007 – 2008
Pillar 7 on labor market efficiency measured the flexibility of the labor market and whether it ensures the efficient use of talent. Malaysia ranked No. 3 on pay and productivity, No. 8 on cooperation in labor/employer relations, and No. 12 on rigidity of employment. Pillar 8 on financial market sophistication measured the sophistication, efficiency, soundness, and trustworthiness of financial markets. Malaysia ranked No. 4 on the strength of investor protection, No. 8 on legal rights index, and had high scores above 5.5 for financing through local equity, soundness of banks, and regulation of securities exchanges. Pillar 9 on technological readiness measures the penetration of information and communication technologies and the extent to which countries leverage technology and knowledge from abroad (notably through FDI), by adopting and adapting it in their production systems. Malaysia ranked No. 5 for FDI and technology transfer and scores of higher than 5.5 for availability of latest technology, firm-level technology absorption, and prevalence of foreign technology licensing. Pillar 10 on market size
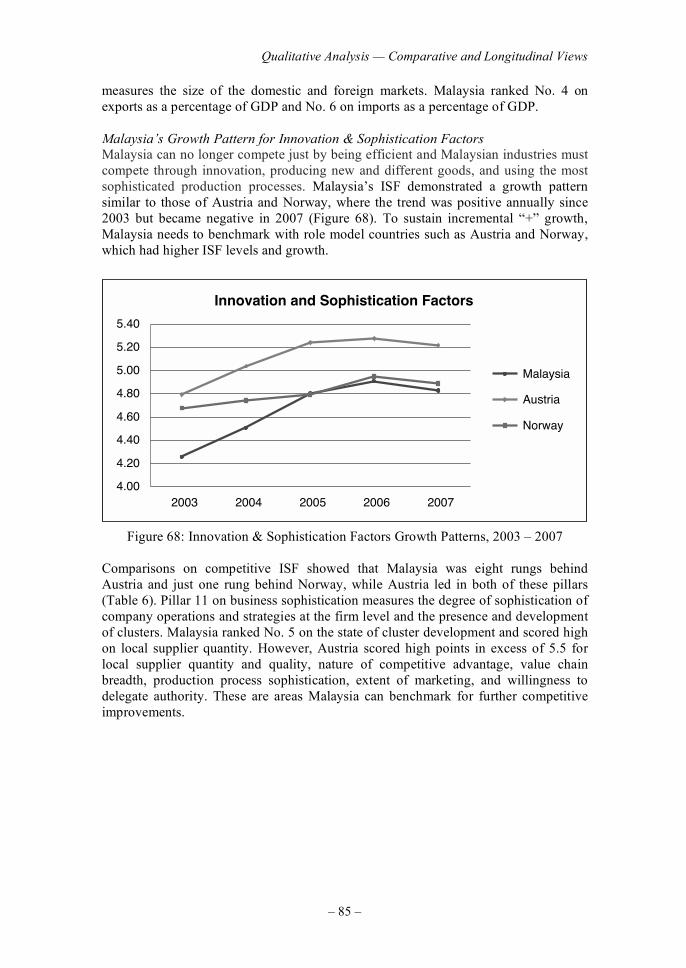
Qualitative Analysis — Comparative and Longitudinal Views
– 85 –
measures the size of the domestic and foreign markets. Malaysia ranked No. 4 on exports as a percentage of GDP and No. 6 on imports as a percentage of GDP.
Malaysia’s Growth Pattern for Innovation & Sophistication Factors
Malaysia can no longer compete just by being efficient and Malaysian industries must compete through innovation, producing new and different goods, and using the most sophisticated production processes. Malaysia’s ISF demonstrated a growth pattern similar to those of Austria and Norway, where the trend was positive annually since 2003 but became negative in 2007 (Figure 68). To sustain incremental “+” growth, Malaysia needs to benchmark with role model countries such as Austria and Norway, which had higher ISF levels and growth.
00.4
02.4
04.4
06.4
08.4
00.5
02.5
04.5
70026002500240023002
aisyalaM
airtsuA
yawroN
Innovation and Sophistication Factors
Figure 68: Innovation & Sophistication Factors Growth Patterns, 2003 – 2007 Comparisons on competitive ISF showed that Malaysia was eight rungs behind Austria and just one rung behind Norway, while Austria led in both of these pillars (Table 6). Pillar 11 on business sophistication measures the degree of sophistication of company operations and strategies at the firm level and the presence and development of clusters. Malaysia ranked No. 5 on the state of cluster development and scored high on local supplier quantity. However, Austria scored high points in excess of 5.5 for local supplier quantity and quality, nature of competitive advantage, value chain breadth, production process sophistication, extent of marketing, and willingness to delegate authority. These are areas Malaysia can benchmark for further competitive improvements.
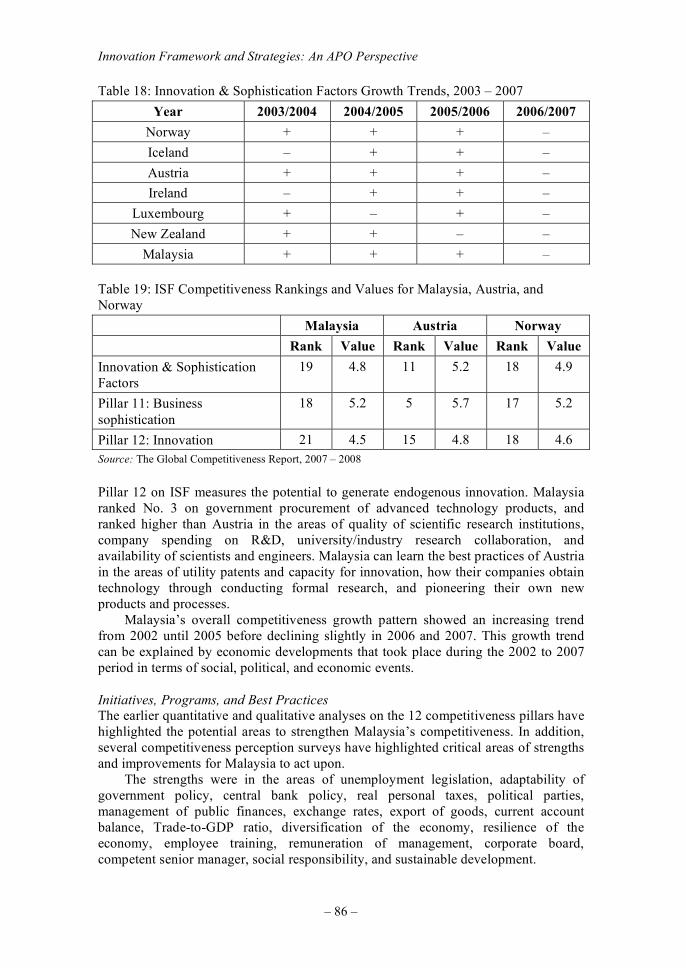
Innovation Framework and Strategies: An APO Perspective
– 86 –
Table 18: Innovation & Sophistication Factors Growth Trends, 2003 – 2007
Year 2003/2004 2004/2005 2005/2006 2006/2007
Norway + + + –
Iceland – + + –
Austria + + + –
Ireland – + + –
Luxembourg + – + –
New Zealand + + – –
Malaysia + + + –
Table 19: ISF Competitiveness Rankings and Values for Malaysia, Austria, and Norway
Malaysia Austria Norway
Rank Value Rank Value Rank Value
Innovation & Sophistication Factors
19 4.8 11 5.2 18 4.9
Pillar 11: Business
sophistication
18 5.2 5 5.7 17 5.2
Pillar 12: Innovation 21 4.5 15 4.8 18 4.6
Source: The Global Competitiveness Report, 2007 – 2008
Pillar 12 on ISF measures the potential to generate endogenous innovation. Malaysia ranked No. 3 on government procurement of advanced technology products, and ranked higher than Austria in the areas of quality of scientific research institutions, company spending on R&D, university/industry research collaboration, and availability of scientists and engineers. Malaysia can learn the best practices of Austria in the areas of utility patents and capacity for innovation, how their companies obtain technology through conducting formal research, and pioneering their own new products and processes. Malaysia’s overall competitiveness growth pattern showed an increasing trend from 2002 until 2005 before declining slightly in 2006 and 2007. This growth trend can be explained by economic developments that took place during the 2002 to 2007 period in terms of social, political, and economic events.
Initiatives, Programs, and Best Practices
The earlier quantitative and qualitative analyses on the 12 competitiveness pillars have highlighted the potential areas to strengthen Malaysia’s competitiveness. In addition, several competitiveness perception surveys have highlighted critical areas of strengths and improvements for Malaysia to act upon. The strengths were in the areas of unemployment legislation, adaptability of government policy, central bank policy, real personal taxes, political parties, management of public finances, exchange rates, export of goods, current account balance, Trade-to-GDP ratio, diversification of the economy, resilience of the economy, employee training, remuneration of management, corporate board, competent senior manager, social responsibility, and sustainable development.
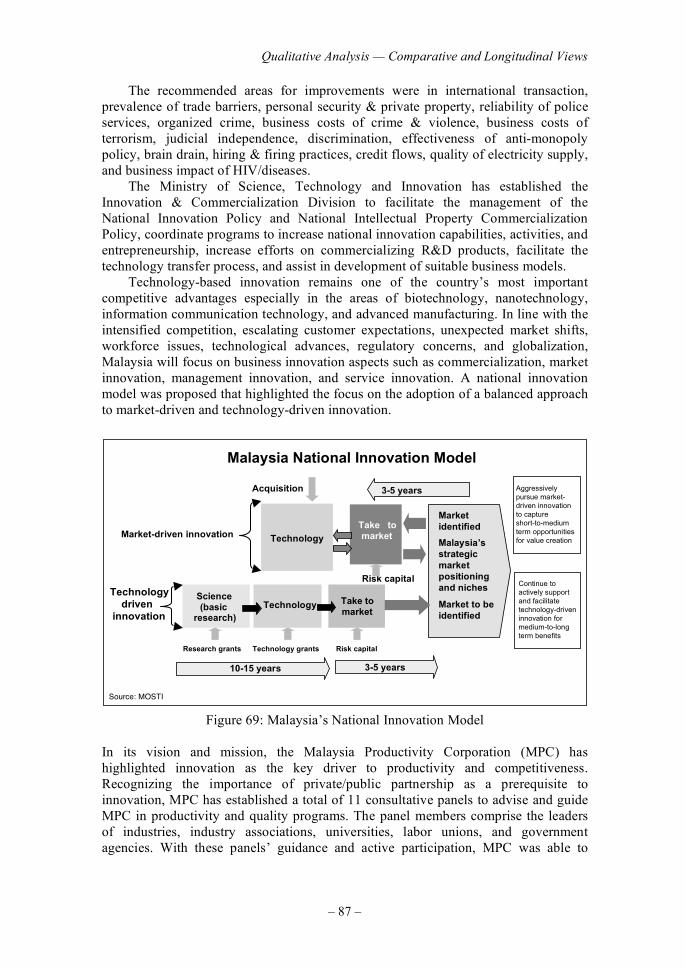
Qualitative Analysis — Comparative and Longitudinal Views
– 87 –
The recommended areas for improvements were in international transaction, prevalence of trade barriers, personal security & private property, reliability of police services, organized crime, business costs of crime & violence, business costs of terrorism, judicial independence, discrimination, effectiveness of anti-monopoly policy, brain drain, hiring & firing practices, credit flows, quality of electricity supply, and business impact of HIV/diseases. The Ministry of Science, Technology and Innovation has established the Innovation & Commercialization Division to facilitate the management of the National Innovation Policy and National Intellectual Property Commercialization Policy, coordinate programs to increase national innovation capabilities, activities, and entrepreneurship, increase efforts on commercializing R&D products, facilitate the technology transfer process, and assist in development of suitable business models. Technology-based innovation remains one of the country’s most important competitive advantages especially in the areas of biotechnology, nanotechnology, information communication technology, and advanced manufacturing. In line with the intensified competition, escalating customer expectations, unexpected market shifts, workforce issues, technological advances, regulatory concerns, and globalization, Malaysia will focus on business innovation aspects such as commercialization, market innovation, management innovation, and service innovation. A national innovation model was proposed that highlighted the focus on the adoption of a balanced approach to market-driven and technology-driven innovation.
Malaysia National Innovation Model
Take to market
Take to market
Science (basic
research)
Source: MOSTI
3-5 years 10-15 years
3-5 years
Technology
Acquisition
TechnologyMarket-driven innovation
Technology driven
innovation
Risk capital
Risk capital Research grants Technology grants
Aggressively pursue market-driven innovation to capture short-to-medium term opportunities for value creation
Continue to actively support and facilitate technology-driven innovation for medium-to-long term benefits
Malaysia’s strategic market positioning and niches
Market to be identified
Marketidentified
Figure 69: Malaysia’s National Innovation Model In its vision and mission, the Malaysia Productivity Corporation (MPC) has highlighted innovation as the key driver to productivity and competitiveness. Recognizing the importance of private/public partnership as a prerequisite to innovation, MPC has established a total of 11 consultative panels to advise and guide MPC in productivity and quality programs. The panel members comprise the leaders of industries, industry associations, universities, labor unions, and government agencies. With these panels’ guidance and active participation, MPC was able to
Innovation Framework and Strategies: An APO Perspective
– 88 –
provide relevant programs that meet the needs and assistance required by the industries in nurturing innovation with consultative panels in the following areas:
• Productivity measurement • Human resource management • Agriculture • Construction • Manufacturing • Logistics • Utilities • Finance • Hospitality • Health • Information & communication technology
In a similar approach, MPC has formed several taskforces and focus groups to review the country’s competitiveness rankings on factors such as government efficiency, business efficiency, economic performance, and infrastructure. MPC also acts as the secretariats to the five WGEI focus groups that report to PEMUDAH. In this respect MPC becomes the critical linking pin in connecting the private and the public sectors for addressing the issues of competitiveness, enhancing awareness and perception, and improving performance. MPC also assists both government and industry by providing training, system development, research, and promotion of productivity and quality. To facilitate improvements in perception surveys on competitiveness, MPC has formulated the following nine strategic initiatives:
• Sharing of best practices especially on improving and sustainability of ranking criteria through on-going nationwide seminars, highlighting issues on competitiveness;
• MPC continuing to monitor improvement initiatives through the four taskforces on economic performance, government efficiency, business efficiency, and infrastructure;
• Continuing engagement with international ranking agencies and other partner institutes;
• Undertaking selective competitiveness studies such as regional competitiveness studies;
• Creating performance excellence through improvement of existing systems and procedures in selected organizations;
• Nurturing human capital to be more creative and innovative towards higher value creation /contribution;
• Partnering business communities through more liaison and communication platforms;
• Consolidating outreach programs and activities on awareness, education and knowledge for productivity and efficiency enhancement; and,
• Enriching the repository of benchmarks and best practices on competitiveness through the existing Malaysian Benchmarking Index.
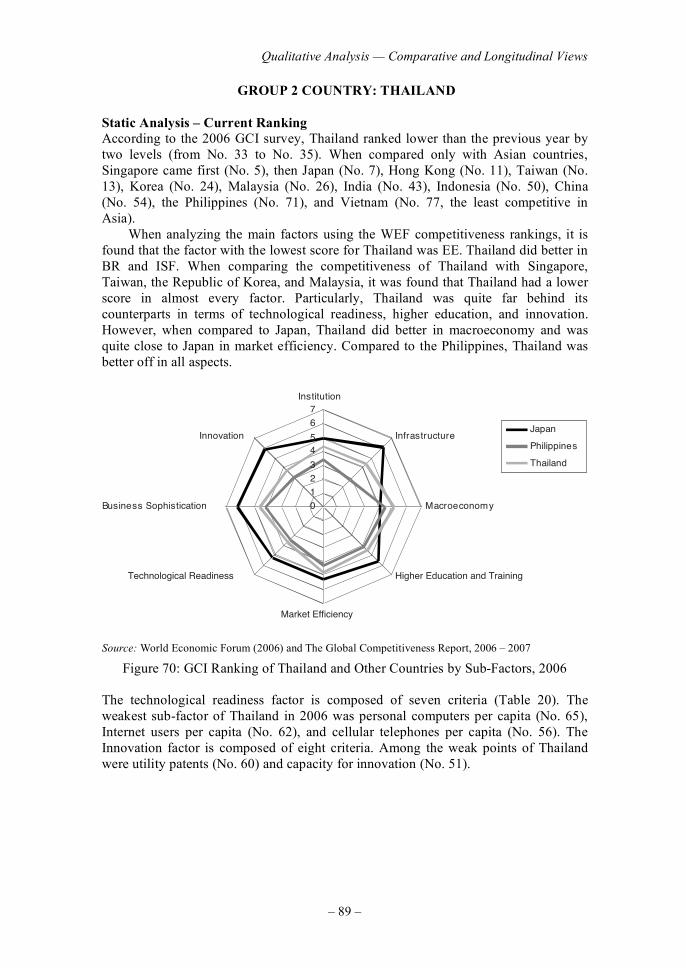
Qualitative Analysis — Comparative and Longitudinal Views
– 89 –
GROUP 2 COUNTRY: THAILAND
Static Analysis – Current Ranking
According to the 2006 GCI survey, Thailand ranked lower than the previous year by two levels (from No. 33 to No. 35). When compared only with Asian countries, Singapore came first (No. 5), then Japan (No. 7), Hong Kong (No. 11), Taiwan (No. 13), Korea (No. 24), Malaysia (No. 26), India (No. 43), Indonesia (No. 50), China (No. 54), the Philippines (No. 71), and Vietnam (No. 77, the least competitive in Asia). When analyzing the main factors using the WEF competitiveness rankings, it is found that the factor with the lowest score for Thailand was EE. Thailand did better in BR and ISF. When comparing the competitiveness of Thailand with Singapore, Taiwan, the Republic of Korea, and Malaysia, it was found that Thailand had a lower score in almost every factor. Particularly, Thailand was quite far behind its counterparts in terms of technological readiness, higher education, and innovation. However, when compared to Japan, Thailand did better in macroeconomy and was quite close to Japan in market efficiency. Compared to the Philippines, Thailand was better off in all aspects.
0
1
2
3
45
6
7Institution
Infrastructure
Macroeconomy
Higher Education and Training
Market Efficiency
Technological Readiness
Business Sophistication
InnovationJapan
Philippines
Thailand
Source: World Economic Forum (2006) and The Global Competitiveness Report, 2006 – 2007
Figure 70: GCI Ranking of Thailand and Other Countries by Sub-Factors, 2006 The technological readiness factor is composed of seven criteria (Table 20). The weakest sub-factor of Thailand in 2006 was personal computers per capita (No. 65), Internet users per capita (No. 62), and cellular telephones per capita (No. 56). The Innovation factor is composed of eight criteria. Among the weak points of Thailand were utility patents (No. 60) and capacity for innovation (No. 51).
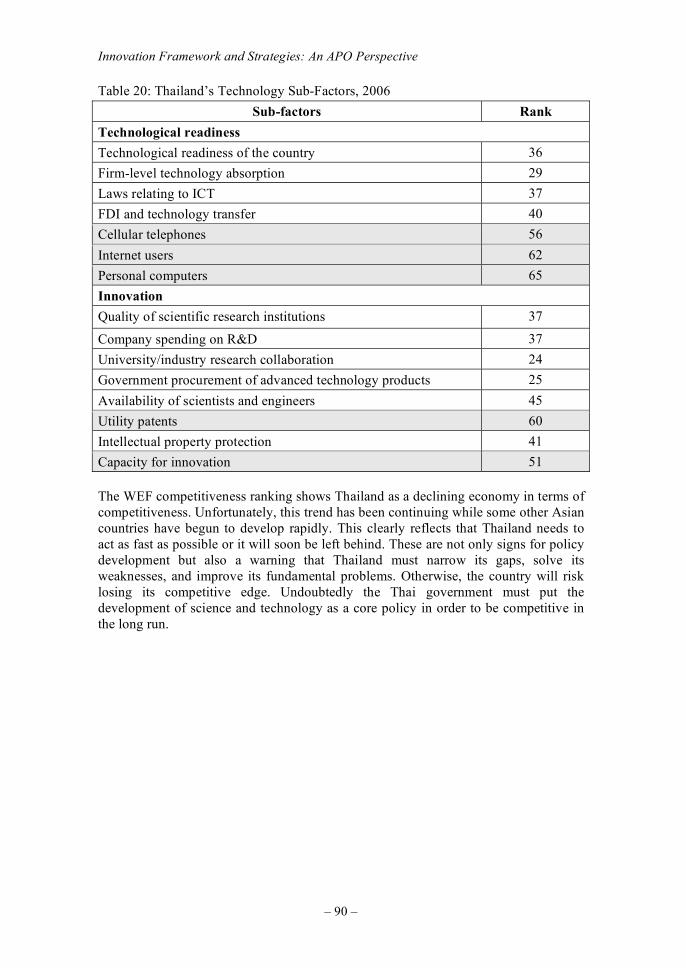
Innovation Framework and Strategies: An APO Perspective
– 90 –
Table 20: Thailand’s Technology Sub-Factors, 2006
Sub-factors Rank
Technological readiness
Technological readiness of the country 36
Firm-level technology absorption 29
Laws relating to ICT 37
FDI and technology transfer 40
Cellular telephones 56
Internet users 62
Personal computers 65
Innovation
Quality of scientific research institutions 37
Company spending on R&D 37
University/industry research collaboration 24
Government procurement of advanced technology products 25
Availability of scientists and engineers 45
Utility patents 60
Intellectual property protection 41
Capacity for innovation 51
The WEF competitiveness ranking shows Thailand as a declining economy in terms of competitiveness. Unfortunately, this trend has been continuing while some other Asian countries have begun to develop rapidly. This clearly reflects that Thailand needs to act as fast as possible or it will soon be left behind. These are not only signs for policy development but also a warning that Thailand must narrow its gaps, solve its weaknesses, and improve its fundamental problems. Otherwise, the country will risk losing its competitive edge. Undoubtedly the Thai government must put the development of science and technology as a core policy in order to be competitive in the long run.
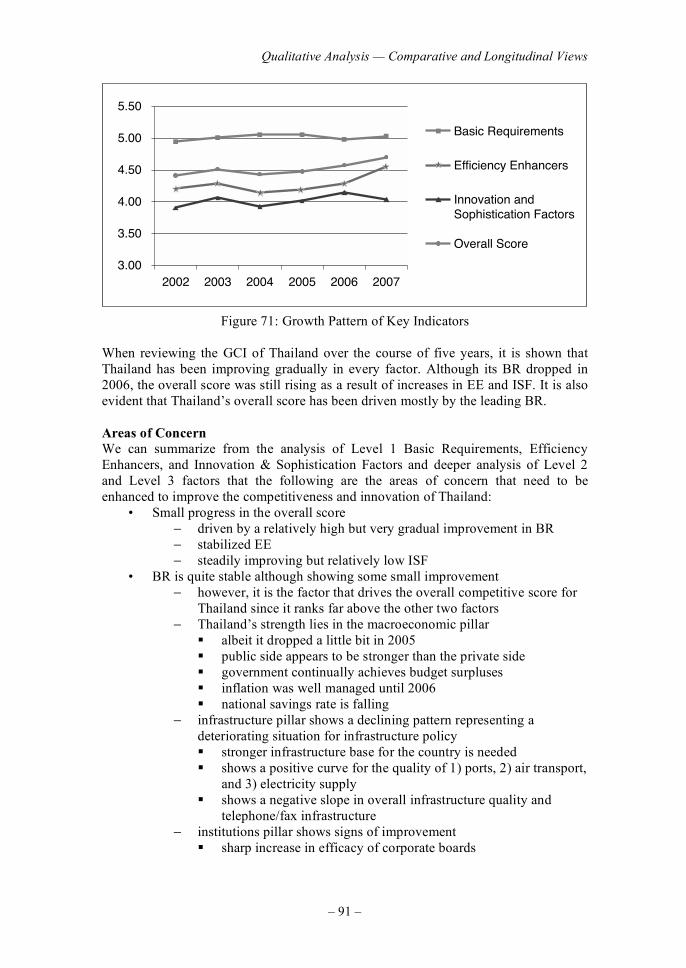
Qualitative Analysis — Comparative and Longitudinal Views
– 91 –
00.3
05.3
00.4
05.4
00.5
05.5
700260025002400230022002
stnemeriuqeR cisaB
srecnahnE ycneiciffE
Innovation andSophistication Factors
erocS llarevO
Figure 71: Growth Pattern of Key Indicators When reviewing the GCI of Thailand over the course of five years, it is shown that Thailand has been improving gradually in every factor. Although its BR dropped in 2006, the overall score was still rising as a result of increases in EE and ISF. It is also evident that Thailand’s overall score has been driven mostly by the leading BR.
Areas of Concern
We can summarize from the analysis of Level 1 Basic Requirements, Efficiency Enhancers, and Innovation & Sophistication Factors and deeper analysis of Level 2 and Level 3 factors that the following are the areas of concern that need to be enhanced to improve the competitiveness and innovation of Thailand:
• Small progress in the overall score − driven by a relatively high but very gradual improvement in BR − stabilized EE − steadily improving but relatively low ISF
• BR is quite stable although showing some small improvement − however, it is the factor that drives the overall competitive score for
Thailand since it ranks far above the other two factors − Thailand’s strength lies in the macroeconomic pillar
albeit it dropped a little bit in 2005 public side appears to be stronger than the private side government continually achieves budget surpluses inflation was well managed until 2006 national savings rate is falling
− infrastructure pillar shows a declining pattern representing a deteriorating situation for infrastructure policy stronger infrastructure base for the country is needed shows a positive curve for the quality of 1) ports, 2) air transport,
and 3) electricity supply shows a negative slope in overall infrastructure quality and
telephone/fax infrastructure − institutions pillar shows signs of improvement
sharp increase in efficacy of corporate boards
Innovation Framework and Strategies: An APO Perspective
– 92 –
declining score in organized crime, favoritism in decisions of government officials, and unethical behavior of firms
greatest setbacks in 2006 were irregular payments in public contracts, judicial decisions, tax collection, and public utilities
military coup in September 2006 could be a reason behind the decrease in institutions score
• EE score shows positive improvement − exception: technological readiness − weakest link is related to ICT − rest of compositions could be classified into two groups:
technology development, i.e.: 1) firm-level technology absorption; 2) FDI and technology transfer; and 3) prevalence of foreign technology licensing • clearly a pulling-up group; policy making therefore might strengthen and enhance it
ICT: government prioritization of ICT, success in ICT promotion, and quality of competition in the ISP sector • can be considered a setback for the technological readiness pillar
• Innovation & Sophistication Factors − business sophistication is pulling up the overall score − top performance belongs to degree of customer orientation − meaningful progress can be found in 1) extent of marketing, 2)
control of international distribution, 3) willingness to delegate authority, 4) value chain presence, and 5) extent of incentive compensation represents a driving force for business sophistication
− rest of compositions are somewhat stagnant − greatest hindrances are 1) production process sophistication, 2)
nature of competitive advantage, and 3) local availability of process machinery representing some problems in business production Thai companies may be better in “software” than in “hardware” policy should then focus on development of production
technology, especially process machinery − innovation itself is being hampered
faces sluggish improvement best performer is availability of scientists and engineers “supply side” has risen while the “creation side” has been
relatively weak decision-makers may look at how to push or create more
collaboration as well as how to better use government procurement schemes to induce more innovation
After looking at the areas of concern, we will now look at national role models to suggest how these weaknesses may be addressed to drive the country into the next higher stage of development.
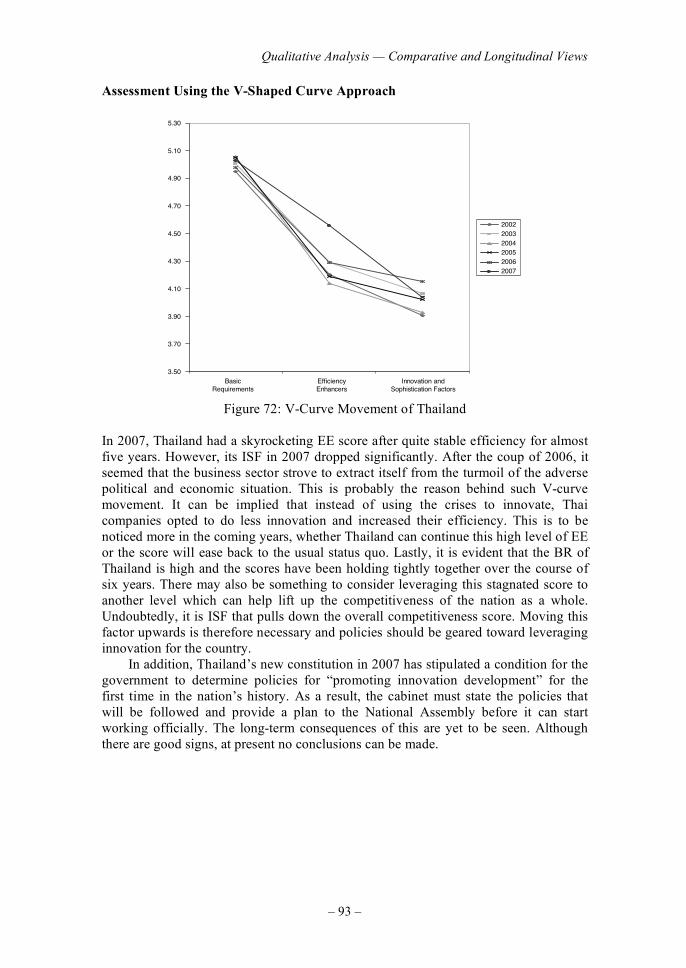
Qualitative Analysis — Comparative and Longitudinal Views
– 93 –
Assessment Using the V-Shaped Curve Approach
3.50
3.70
3.90
4.10
4.30
4.50
4.70
4.90
5.10
5.30
BasicRequirements
EfficiencyEnhancers
Innovation andSophistication Factors
200220032004200520062007
Figure 72: V-Curve Movement of Thailand In 2007, Thailand had a skyrocketing EE score after quite stable efficiency for almost five years. However, its ISF in 2007 dropped significantly. After the coup of 2006, it seemed that the business sector strove to extract itself from the turmoil of the adverse political and economic situation. This is probably the reason behind such V-curve movement. It can be implied that instead of using the crises to innovate, Thai companies opted to do less innovation and increased their efficiency. This is to be noticed more in the coming years, whether Thailand can continue this high level of EE or the score will ease back to the usual status quo. Lastly, it is evident that the BR of Thailand is high and the scores have been holding tightly together over the course of six years. There may also be something to consider leveraging this stagnated score to another level which can help lift up the competitiveness of the nation as a whole. Undoubtedly, it is ISF that pulls down the overall competitiveness score. Moving this factor upwards is therefore necessary and policies should be geared toward leveraging innovation for the country. In addition, Thailand’s new constitution in 2007 has stipulated a condition for the government to determine policies for “promoting innovation development” for the first time in the nation’s history. As a result, the cabinet must state the policies that will be followed and provide a plan to the National Assembly before it can start working officially. The long-term consequences of this are yet to be seen. Although there are good signs, at present no conclusions can be made.
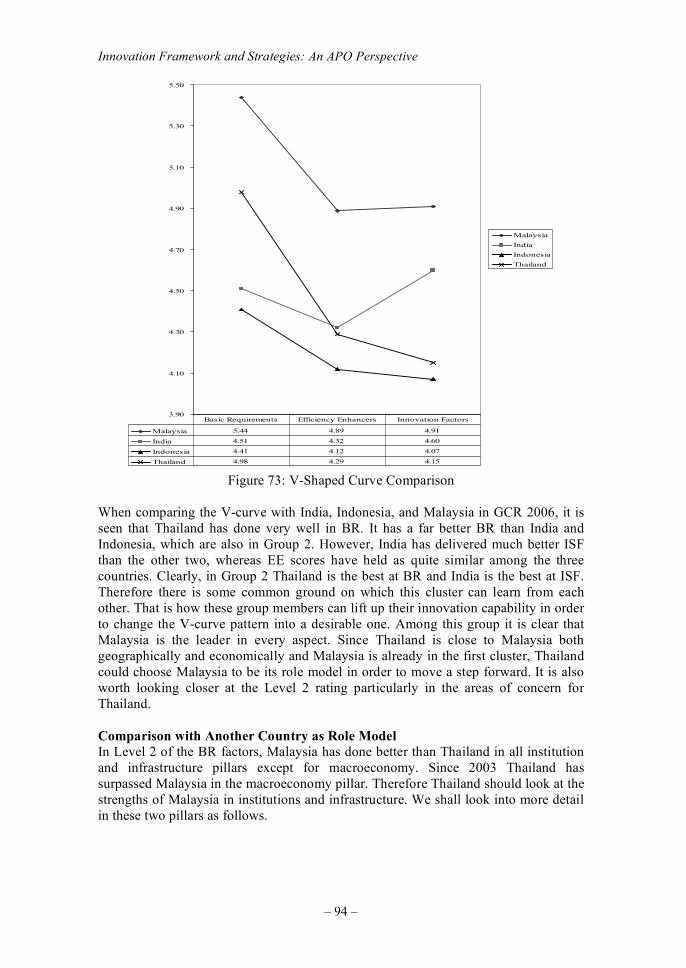
Innovation Framework and Strategies: An APO Perspective
– 94 –
3.90
4.10
4.30
4.50
4.70
4.90
5.10
5.30
5.50
Malaysia
India
Indonesia
Thailand
Malaysia 5.44 4.89 4.91
India 4.51 4.32 4.60
Indonesia 4.41 4.12 4.07
Thailand 4.98 4.29 4.15
Basic Requirements Efficiency Enhancers Innovation Factors
Figure 73: V-Shaped Curve Comparison When comparing the V-curve with India, Indonesia, and Malaysia in GCR 2006, it is seen that Thailand has done very well in BR. It has a far better BR than India and Indonesia, which are also in Group 2. However, India has delivered much better ISF than the other two, whereas EE scores have held as quite similar among the three countries. Clearly, in Group 2 Thailand is the best at BR and India is the best at ISF. Therefore there is some common ground on which this cluster can learn from each other. That is how these group members can lift up their innovation capability in order to change the V-curve pattern into a desirable one. Among this group it is clear that Malaysia is the leader in every aspect. Since Thailand is close to Malaysia both geographically and economically and Malaysia is already in the first cluster, Thailand could choose Malaysia to be its role model in order to move a step forward. It is also worth looking closer at the Level 2 rating particularly in the areas of concern for Thailand.
Comparison with Another Country as Role Model
In Level 2 of the BR factors, Malaysia has done better than Thailand in all institution and infrastructure pillars except for macroeconomy. Since 2003 Thailand has surpassed Malaysia in the macroeconomy pillar. Therefore Thailand should look at the strengths of Malaysia in institutions and infrastructure. We shall look into more detail in these two pillars as follows.
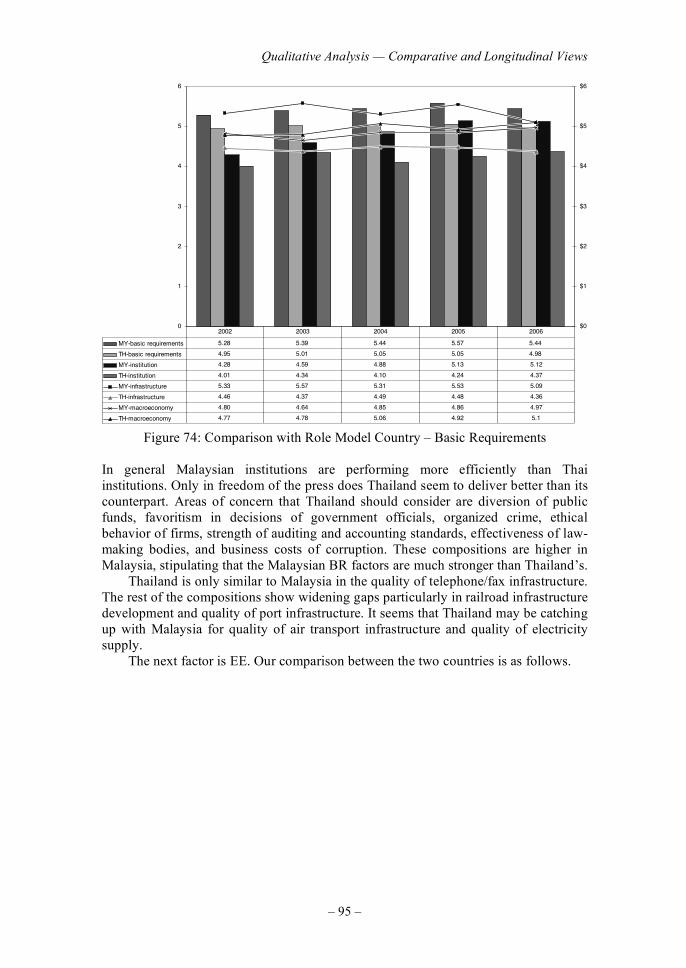
Qualitative Analysis — Comparative and Longitudinal Views
– 95 –
0
1
2
3
4
5
6
$0
$1
$2
$3
$4
$5
$6
MY-basic requirements 5.28 5.39 5.44 5.57 5.44
TH-basic requirements 4.95 5.01 5.05 5.05 4.98
MY-institution 4.28 4.59 4.88 5.13 5.12
TH-institution 4.01 4.34 4.10 4.24 4.37
MY-infrastructure 5.33 5.57 5.31 5.53 5.09
TH-infrastructure 4.46 4.37 4.49 4.48 4.36
MY-macroeconomy 4.80 4.64 4.85 4.86 4.97
TH-macroeconomy 4.77 4.78 5.06 4.92 5.1
2002 2003 2004 2005 2006
Figure 74: Comparison with Role Model Country – Basic Requirements In general Malaysian institutions are performing more efficiently than Thai institutions. Only in freedom of the press does Thailand seem to deliver better than its counterpart. Areas of concern that Thailand should consider are diversion of public funds, favoritism in decisions of government officials, organized crime, ethical behavior of firms, strength of auditing and accounting standards, effectiveness of law-making bodies, and business costs of corruption. These compositions are higher in Malaysia, stipulating that the Malaysian BR factors are much stronger than Thailand’s. Thailand is only similar to Malaysia in the quality of telephone/fax infrastructure. The rest of the compositions show widening gaps particularly in railroad infrastructure development and quality of port infrastructure. It seems that Thailand may be catching up with Malaysia for quality of air transport infrastructure and quality of electricity supply. The next factor is EE. Our comparison between the two countries is as follows.
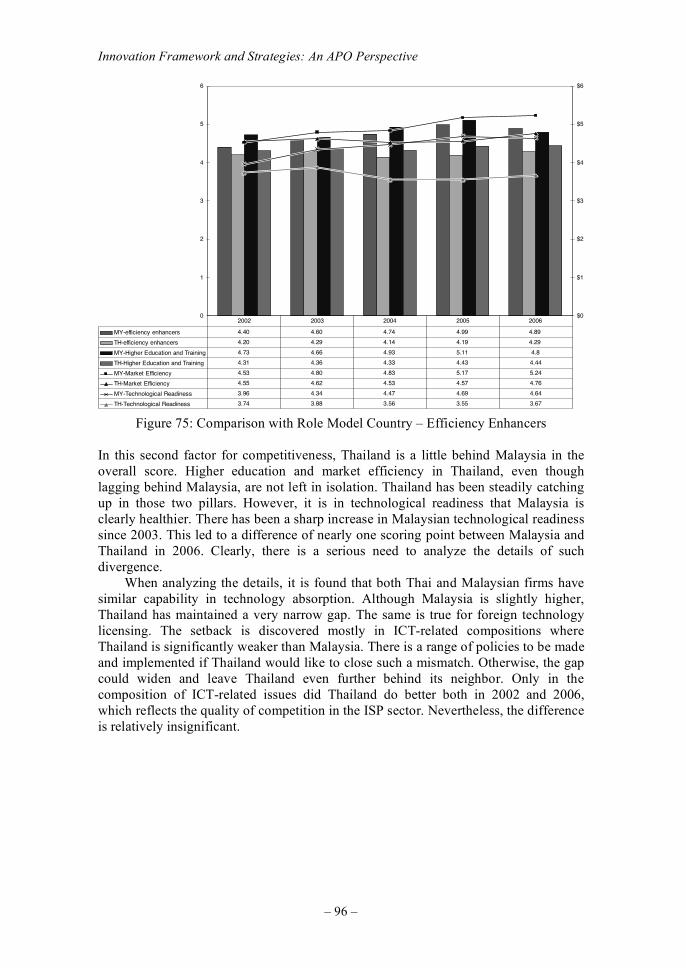
Innovation Framework and Strategies: An APO Perspective
– 96 –
0
1
2
3
4
5
6
$0
$1
$2
$3
$4
$5
$6
MY-efficiency enhancers 4.40 4.60 4.74 4.99 4.89
TH-efficiency enhancers 4.20 4.29 4.14 4.19 4.29
MY-Higher Education and Training 4.73 4.66 4.93 5.11 4.8
TH-Higher Education and Training 4.31 4.36 4.33 4.43 4.44
MY-Market Efficiency 4.53 4.80 4.83 5.17 5.24
TH-Market Efficiency 4.55 4.62 4.53 4.57 4.76
MY-Technological Readiness 3.96 4.34 4.47 4.69 4.64
TH-Technological Readiness 3.74 3.88 3.56 3.55 3.67
2002 2003 2004 2005 2006
Figure 75: Comparison with Role Model Country – Efficiency Enhancers In this second factor for competitiveness, Thailand is a little behind Malaysia in the overall score. Higher education and market efficiency in Thailand, even though lagging behind Malaysia, are not left in isolation. Thailand has been steadily catching up in those two pillars. However, it is in technological readiness that Malaysia is clearly healthier. There has been a sharp increase in Malaysian technological readiness since 2003. This led to a difference of nearly one scoring point between Malaysia and Thailand in 2006. Clearly, there is a serious need to analyze the details of such divergence. When analyzing the details, it is found that both Thai and Malaysian firms have similar capability in technology absorption. Although Malaysia is slightly higher, Thailand has maintained a very narrow gap. The same is true for foreign technology licensing. The setback is discovered mostly in ICT-related compositions where Thailand is significantly weaker than Malaysia. There is a range of policies to be made and implemented if Thailand would like to close such a mismatch. Otherwise, the gap could widen and leave Thailand even further behind its neighbor. Only in the composition of ICT-related issues did Thailand do better both in 2002 and 2006, which reflects the quality of competition in the ISP sector. Nevertheless, the difference is relatively insignificant.
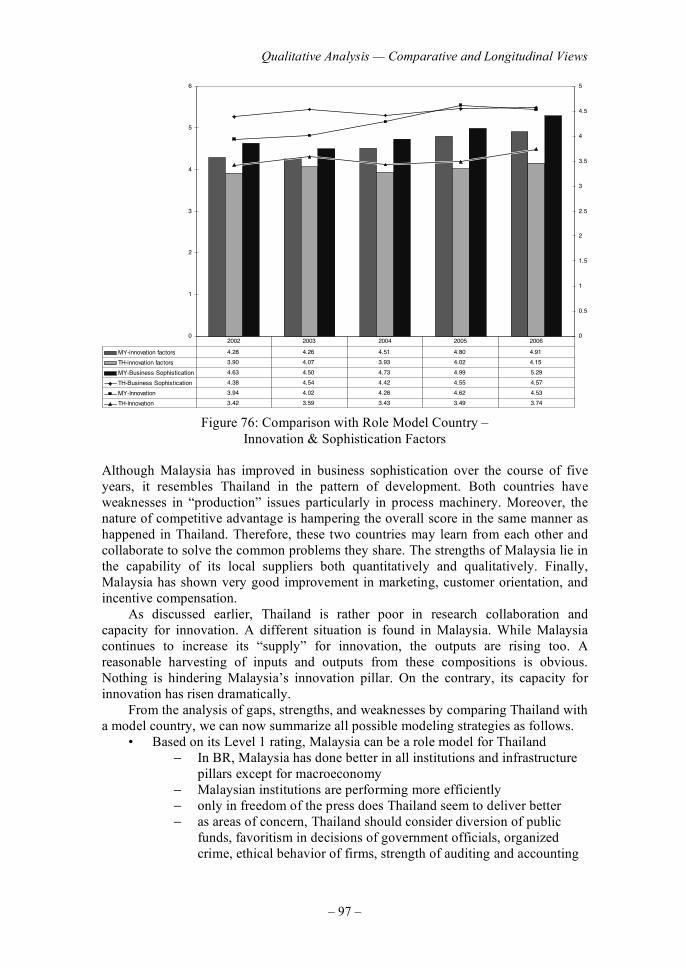
Qualitative Analysis — Comparative and Longitudinal Views
– 97 –
0
1
2
3
4
5
6
0
0.5
1
1.5
2
2.5
3
3.5
4
4.5
5
MY-innovation factors 4.28 4.26 4.51 4.80 4.91
TH-innovation factors 3.90 4.07 3.93 4.02 4.15
MY-Business Sophistication 4.63 4.50 4.73 4.99 5.29
TH-Business Sophistication 4.38 4.54 4.42 4.55 4.57
MY-Innovation 3.94 4.02 4.28 4.62 4.53
TH-Innovation 3.42 3.59 3.43 3.49 3.74
2002 2003 2004 2005 2006
Figure 76: Comparison with Role Model Country –
Innovation & Sophistication Factors Although Malaysia has improved in business sophistication over the course of five years, it resembles Thailand in the pattern of development. Both countries have weaknesses in “production” issues particularly in process machinery. Moreover, the nature of competitive advantage is hampering the overall score in the same manner as happened in Thailand. Therefore, these two countries may learn from each other and collaborate to solve the common problems they share. The strengths of Malaysia lie in the capability of its local suppliers both quantitatively and qualitatively. Finally, Malaysia has shown very good improvement in marketing, customer orientation, and incentive compensation. As discussed earlier, Thailand is rather poor in research collaboration and capacity for innovation. A different situation is found in Malaysia. While Malaysia continues to increase its “supply” for innovation, the outputs are rising too. A reasonable harvesting of inputs and outputs from these compositions is obvious. Nothing is hindering Malaysia’s innovation pillar. On the contrary, its capacity for innovation has risen dramatically. From the analysis of gaps, strengths, and weaknesses by comparing Thailand with a model country, we can now summarize all possible modeling strategies as follows.
• Based on its Level 1 rating, Malaysia can be a role model for Thailand − In BR, Malaysia has done better in all institutions and infrastructure
pillars except for macroeconomy − Malaysian institutions are performing more efficiently − only in freedom of the press does Thailand seem to deliver better − as areas of concern, Thailand should consider diversion of public
funds, favoritism in decisions of government officials, organized crime, ethical behavior of firms, strength of auditing and accounting
Innovation Framework and Strategies: An APO Perspective
– 98 –
standards, effectiveness of law-making bodies, and business costs of corruption
− there are widening gaps particularly in railroad infrastructure development and quality of port infrastructure
• In EE, Thailand is a little behind Malaysia in the overall score − Thailand has been gradually catching up in higher education and
market efficiency − there’s been a sharp increase in Malaysian technological readiness
since 2003 leading to a difference of nearly 1 point by 2006 Thai and Malaysian firms have similar capability in technology
absorption, although Malaysia is slightly higher a setback is shown mostly in ICT-related compositions a range of policies must be made and implemented to close such
a mismatch • In ISF, Malaysia is clearly a good model for Thailand
− both countries have weaknesses in production issues, particularly in process machinery
− the nature of competitive advantage is hampering the overall score in the same manner
− the two countries could learn from each other and collaborate to solve common problems
− the strengths of Malaysia lie in the capability of local suppliers, both quantitatively and qualitatively
− Malaysia has seen a very good improvement in marketing, customer orientation, and incentive compensation
− a reasonable harvesting of inputs and outputs in Malaysia is obvious, and its capacity for innovation has risen dramatically
Initiatives, Programs, and Best Practices
Clearly, Thailand needs to improve its performance in order to move closer to Malaysia. From the ISF viewpoint, Thailand could use the cluster-based approach to create linkages between public and private sectors assisted by a common innovation infrastructure. Two broad categories should be considered. The first is a common pool of institutions, resource commitment, and support for innovation. The other is the particular capacities of groups of interconnected industries which are the results of the interplay between the common innovation infrastructure that benefits many fields and specific circumstances in particular fields. Policy making should designate the size of the labor force dedicated to R&D and other technically oriented work as well as the amount of investment directed at R&D. Government unavoidably needs to devote resources to higher education while the private sector could help in encouraging investment in innovation and commercialization. However, innovation involves far more than just science and technology. For instance, sophisticated and demanding local customers as well as the presence of capable local suppliers and related companies can play a vital role in innovation development of a country. In an increasingly fast-changing global economic environment, intellectual property ownership with its sometimes controversial role in stimulating innovation is expected to bring far-reaching implications for innovation management and culture. Thailand is developing a series of initiatives intended in the medium term to enhance
Qualitative Analysis — Comparative and Longitudinal Views
– 99 –
its own core competencies in these areas, with the aim to provide services in several areas, for example, innovation acquisition services, technology licensing offices, and intellectual property evaluation programs. Thailand urgently needs technically trained and business-oriented experts who can work closely with industry, venture capital sources, and entrepreneurs to find the best way to commercialize new technologies. Thailand’s local resources, networks, and collaboration with existing innovation clusters should thus be effectively used to facilitate establishment of innovation projects, and also to further enhance innovative capability at institutional level.
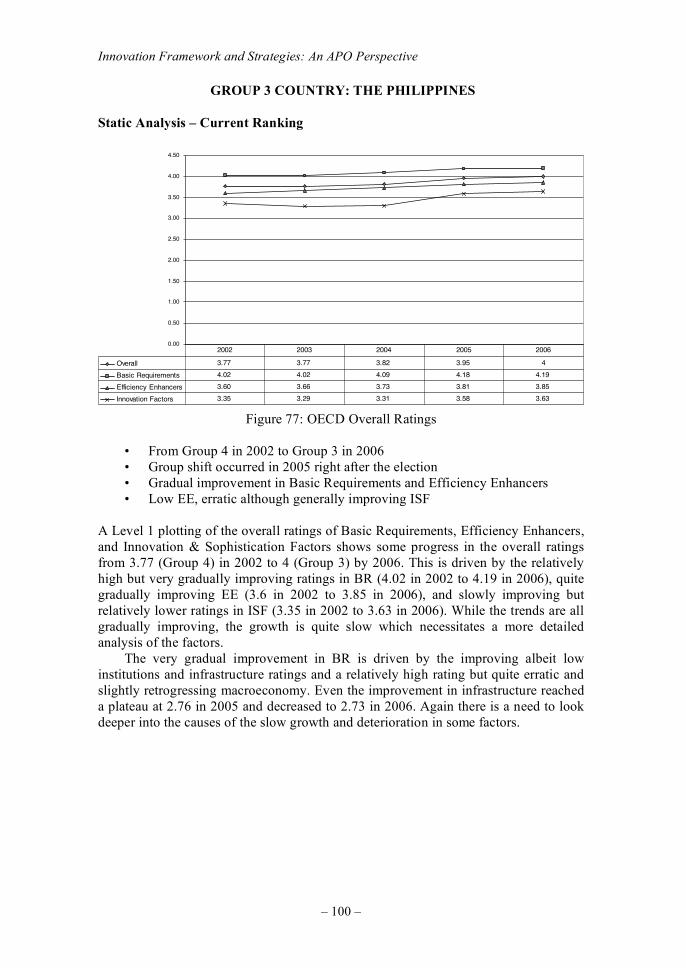
Innovation Framework and Strategies: An APO Perspective
– 100 –
GROUP 3 COUNTRY: THE PHILIPPINES
Static Analysis – Current Ranking
0.00
0.50
1.00
1.50
2.00
2.50
3.00
3.50
4.00
4.50
Overall 3.77 3.77 3.82 3.95 4
Basic Requirements 4.02 4.02 4.09 4.18 4.19
Efficiency Enhancers 3.60 3.66 3.73 3.81 3.85
Innovation Factors 3.35 3.29 3.31 3.58 3.63
2002 2003 2004 2005 2006
Figure 77: OECD Overall Ratings
• From Group 4 in 2002 to Group 3 in 2006 • Group shift occurred in 2005 right after the election • Gradual improvement in Basic Requirements and Efficiency Enhancers • Low EE, erratic although generally improving ISF
A Level 1 plotting of the overall ratings of Basic Requirements, Efficiency Enhancers, and Innovation & Sophistication Factors shows some progress in the overall ratings from 3.77 (Group 4) in 2002 to 4 (Group 3) by 2006. This is driven by the relatively high but very gradually improving ratings in BR (4.02 in 2002 to 4.19 in 2006), quite gradually improving EE (3.6 in 2002 to 3.85 in 2006), and slowly improving but relatively lower ratings in ISF (3.35 in 2002 to 3.63 in 2006). While the trends are all gradually improving, the growth is quite slow which necessitates a more detailed analysis of the factors. The very gradual improvement in BR is driven by the improving albeit low institutions and infrastructure ratings and a relatively high rating but quite erratic and slightly retrogressing macroeconomy. Even the improvement in infrastructure reached a plateau at 2.76 in 2005 and decreased to 2.73 in 2006. Again there is a need to look deeper into the causes of the slow growth and deterioration in some factors.
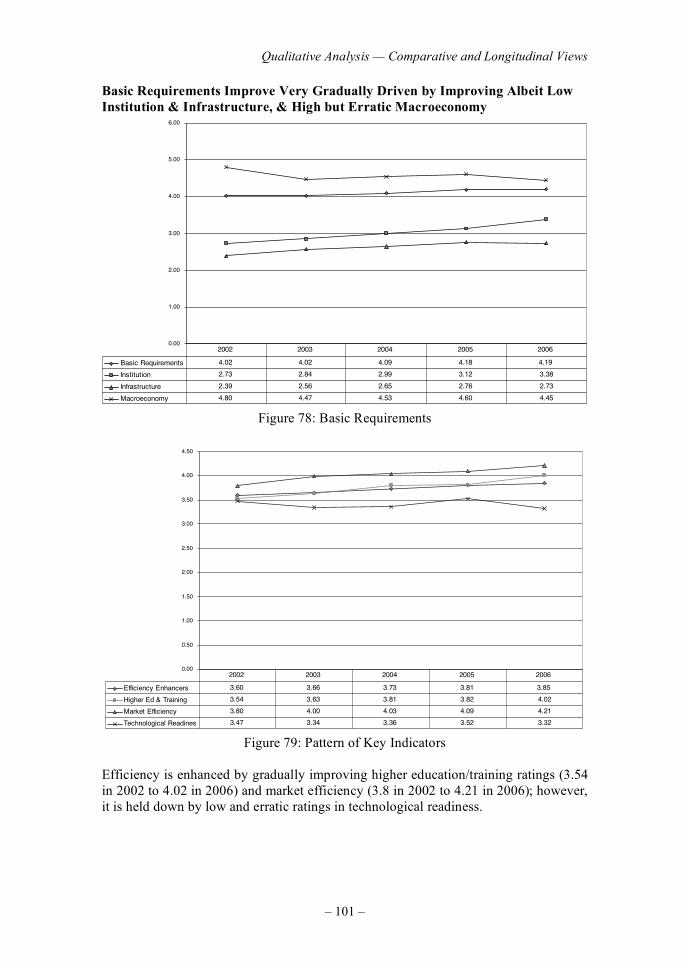
Qualitative Analysis — Comparative and Longitudinal Views
– 101 –
Basic Requirements Improve Very Gradually Driven by Improving Albeit Low
Institution & Infrastructure, & High but Erratic Macroeconomy
0.00
1.00
2.00
3.00
4.00
5.00
6.00
Basic Requirements 4.02 4.02 4.09 4.18 4.19
Institution 2.73 2.84 2.99 3.12 3.38
Infrastructure 2.39 2.56 2.65 2.76 2.73
Macroeconomy 4.80 4.47 4.53 4.60 4.45
2002 2003 2004 2005 2006
Figure 78: Basic Requirements
0.00
0.50
1.00
1.50
2.00
2.50
3.00
3.50
4.00
4.50
Efficiency Enhancers 3.60 3.66 3.73 3.81 3.85
Higher Ed & Training 3.54 3.63 3.81 3.82 4.02
Market Efficiency 3.80 4.00 4.03 4.09 4.21
Technological Readines 3.47 3.34 3.36 3.52 3.32
2002 2003 2004 2005 2006
Figure 79: Pattern of Key Indicators Efficiency is enhanced by gradually improving higher education/training ratings (3.54 in 2002 to 4.02 in 2006) and market efficiency (3.8 in 2002 to 4.21 in 2006); however, it is held down by low and erratic ratings in technological readiness.
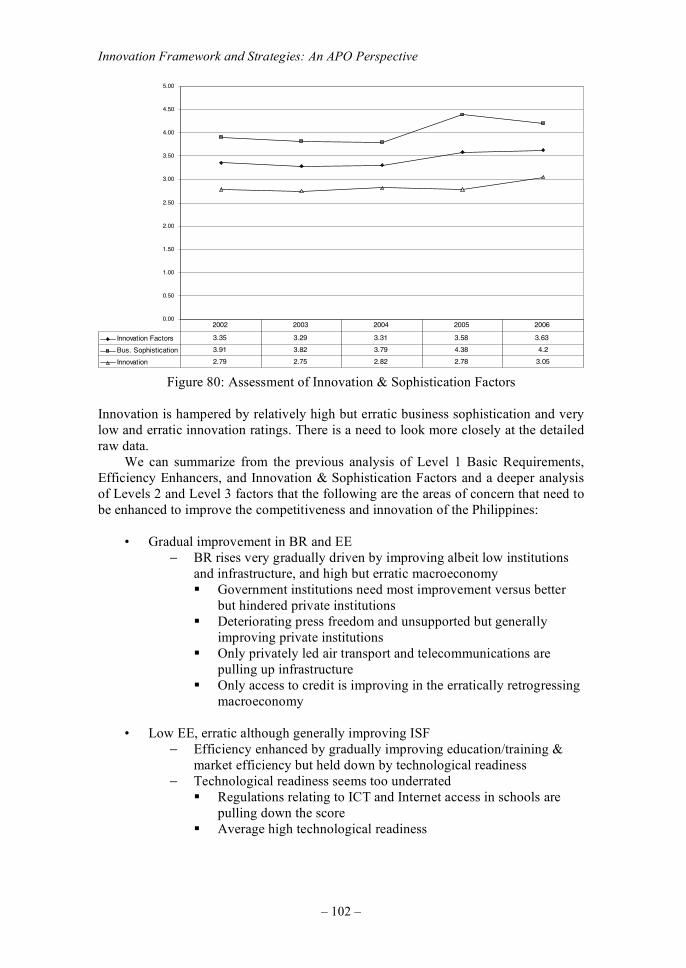
Innovation Framework and Strategies: An APO Perspective
– 102 –
0.00
0.50
1.00
1.50
2.00
2.50
3.00
3.50
4.00
4.50
5.00
Innovation Factors 3.35 3.29 3.31 3.58 3.63
Bus. Sophistication 3.91 3.82 3.79 4.38 4.2
Innovation 2.79 2.75 2.82 2.78 3.05
2002 2003 2004 2005 2006
Figure 80: Assessment of Innovation & Sophistication Factors Innovation is hampered by relatively high but erratic business sophistication and very low and erratic innovation ratings. There is a need to look more closely at the detailed raw data. We can summarize from the previous analysis of Level 1 Basic Requirements, Efficiency Enhancers, and Innovation & Sophistication Factors and a deeper analysis of Levels 2 and Level 3 factors that the following are the areas of concern that need to be enhanced to improve the competitiveness and innovation of the Philippines:
• Gradual improvement in BR and EE − BR rises very gradually driven by improving albeit low institutions
and infrastructure, and high but erratic macroeconomy Government institutions need most improvement versus better
but hindered private institutions Deteriorating press freedom and unsupported but generally
improving private institutions Only privately led air transport and telecommunications are
pulling up infrastructure Only access to credit is improving in the erratically retrogressing
macroeconomy
• Low EE, erratic although generally improving ISF − Efficiency enhanced by gradually improving education/training &
market efficiency but held down by technological readiness − Technological readiness seems too underrated
Regulations relating to ICT and Internet access in schools are pulling down the score
Average high technological readiness
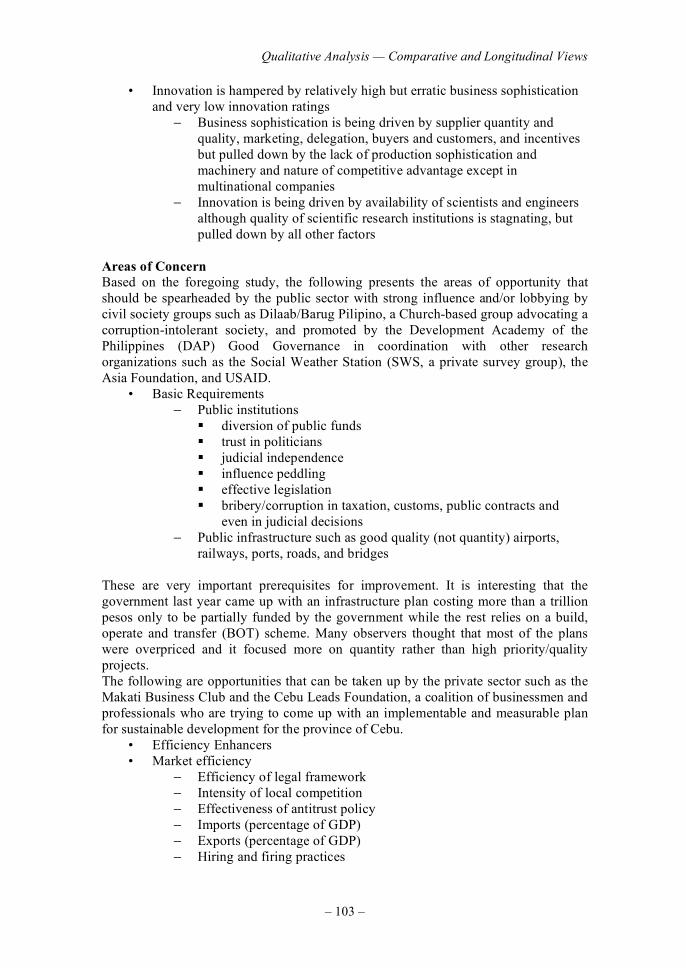
Qualitative Analysis — Comparative and Longitudinal Views
– 103 –
• Innovation is hampered by relatively high but erratic business sophistication and very low innovation ratings
− Business sophistication is being driven by supplier quantity and quality, marketing, delegation, buyers and customers, and incentives but pulled down by the lack of production sophistication and machinery and nature of competitive advantage except in multinational companies
− Innovation is being driven by availability of scientists and engineers although quality of scientific research institutions is stagnating, but pulled down by all other factors
Areas of Concern
Based on the foregoing study, the following presents the areas of opportunity that should be spearheaded by the public sector with strong influence and/or lobbying by civil society groups such as Dilaab/Barug Pilipino, a Church-based group advocating a corruption-intolerant society, and promoted by the Development Academy of the Philippines (DAP) Good Governance in coordination with other research organizations such as the Social Weather Station (SWS, a private survey group), the Asia Foundation, and USAID.
• Basic Requirements − Public institutions
diversion of public funds trust in politicians judicial independence influence peddling effective legislation bribery/corruption in taxation, customs, public contracts and
even in judicial decisions − Public infrastructure such as good quality (not quantity) airports,
railways, ports, roads, and bridges These are very important prerequisites for improvement. It is interesting that the government last year came up with an infrastructure plan costing more than a trillion pesos only to be partially funded by the government while the rest relies on a build, operate and transfer (BOT) scheme. Many observers thought that most of the plans were overpriced and it focused more on quantity rather than high priority/quality projects. The following are opportunities that can be taken up by the private sector such as the Makati Business Club and the Cebu Leads Foundation, a coalition of businessmen and professionals who are trying to come up with an implementable and measurable plan for sustainable development for the province of Cebu.
• Efficiency Enhancers • Market efficiency
− Efficiency of legal framework − Intensity of local competition − Effectiveness of antitrust policy − Imports (percentage of GDP) − Exports (percentage of GDP) − Hiring and firing practices
Innovation Framework and Strategies: An APO Perspective
– 104 –
− Flexibility of wage determination − Cooperation in labor-employer relations − Reliance on professional management − Pay and productivity − Brain drain − Ease of access to loans − Venture capital availability − Extent of bureaucratic red tape − Presence of demanding regulatory standards − Extent of regional sales − Breadth of international markets − Informal sector
The following are opportunities that must be led by the Department of Education and groups such as the Cebu Leads Coalition, business clubs, Personnel Management Association of the Philippines, Philippine Society for Training and Development, Development Academy of the Philippines, and the Technical Education and Skills Development Authority.
• Efficiency Enhancers • Higher education & training
− Quality of math and science education − Availability of specialized research & training services − Extent of staff training − Quality of public schools
Research and development is basically limited now to multinational companies and research institutes of the Department of Science and Technology (DOST). This is an area that DOST can pursue and enhance further. An Innovation Summit has been planned to address the following concerns
• Innovation − Quality of scientific research institutions − Company spending on research and development − University/industry research collaboration − Government procurement of advanced technology products − Utility patents (year 2000: percentage of gross national income of
1997; others: utility patents granted per million population) − Intellectual property protection − Capacity for innovation
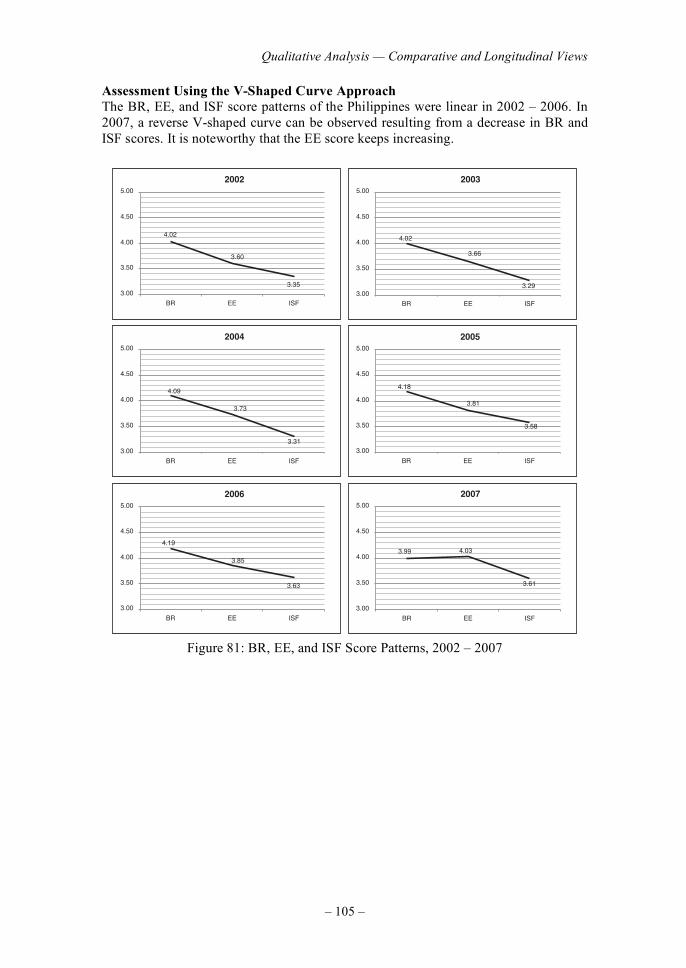
Qualitative Analysis — Comparative and Longitudinal Views
– 105 –
Assessment Using the V-Shaped Curve Approach
The BR, EE, and ISF score patterns of the Philippines were linear in 2002 – 2006. In 2007, a reverse V-shaped curve can be observed resulting from a decrease in BR and ISF scores. It is noteworthy that the EE score keeps increasing.
2002
20.4
06.3
53.300.3
05.3
00.4
05.4
00.5
FSIEERB
3002
20.4
66.3
92.300.3
05.3
00.4
05.4
00.5
FSIEERB
4002
90.4
37.3
13.300.3
05.3
00.4
05.4
00.5
FSIEERB
5002
81.4
18.3
85.3
00.3
05.3
00.4
05.4
00.5
FSIEERB
6002
91.4
58.3
36.3
00.3
05.3
00.4
05.4
00.5
FSIEERB
7002
99.3 30.4
16.3
00.3
05.3
00.4
05.4
00.5
FSIEERB
Figure 81: BR, EE, and ISF Score Patterns, 2002 – 2007
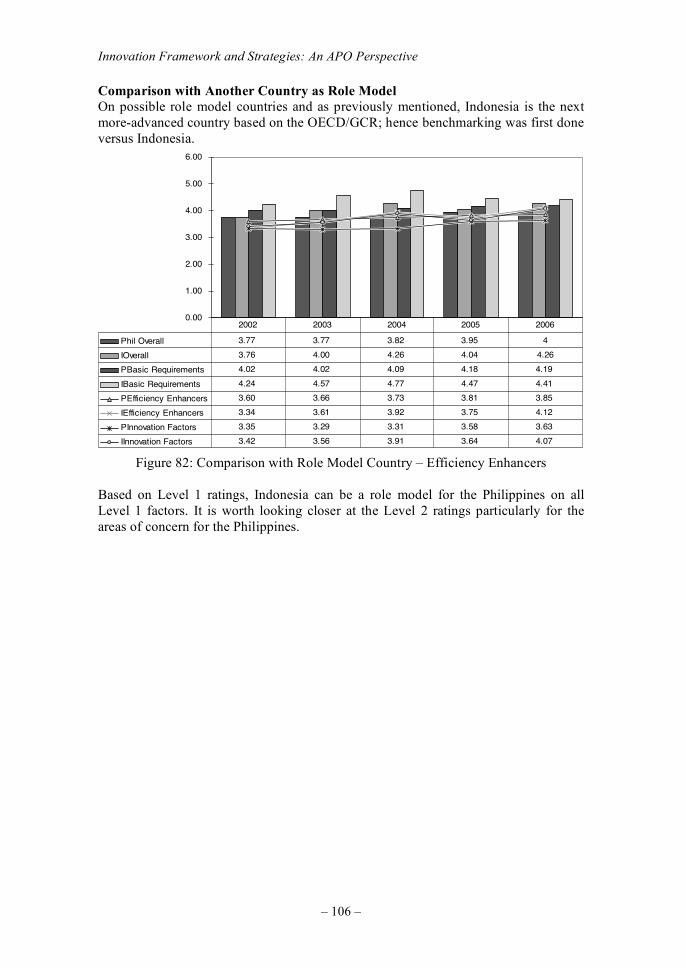
Innovation Framework and Strategies: An APO Perspective
– 106 –
Comparison with Another Country as Role Model
On possible role model countries and as previously mentioned, Indonesia is the next more-advanced country based on the OECD/GCR; hence benchmarking was first done versus Indonesia.
0.00
1.00
2.00
3.00
4.00
5.00
6.00
Phil Overall 3.77 3.77 3.82 3.95 4
IOverall 3.76 4.00 4.26 4.04 4.26
PBasic Requirements 4.02 4.02 4.09 4.18 4.19
IBasic Requirements 4.24 4.57 4.77 4.47 4.41
PEfficiency Enhancers 3.60 3.66 3.73 3.81 3.85
IEfficiency Enhancers 3.34 3.61 3.92 3.75 4.12
PInnovation Factors 3.35 3.29 3.31 3.58 3.63
IInnovation Factors 3.42 3.56 3.91 3.64 4.07
2002 2003 2004 2005 2006
Figure 82: Comparison with Role Model Country – Efficiency Enhancers Based on Level 1 ratings, Indonesia can be a role model for the Philippines on all Level 1 factors. It is worth looking closer at the Level 2 ratings particularly for the areas of concern for the Philippines.
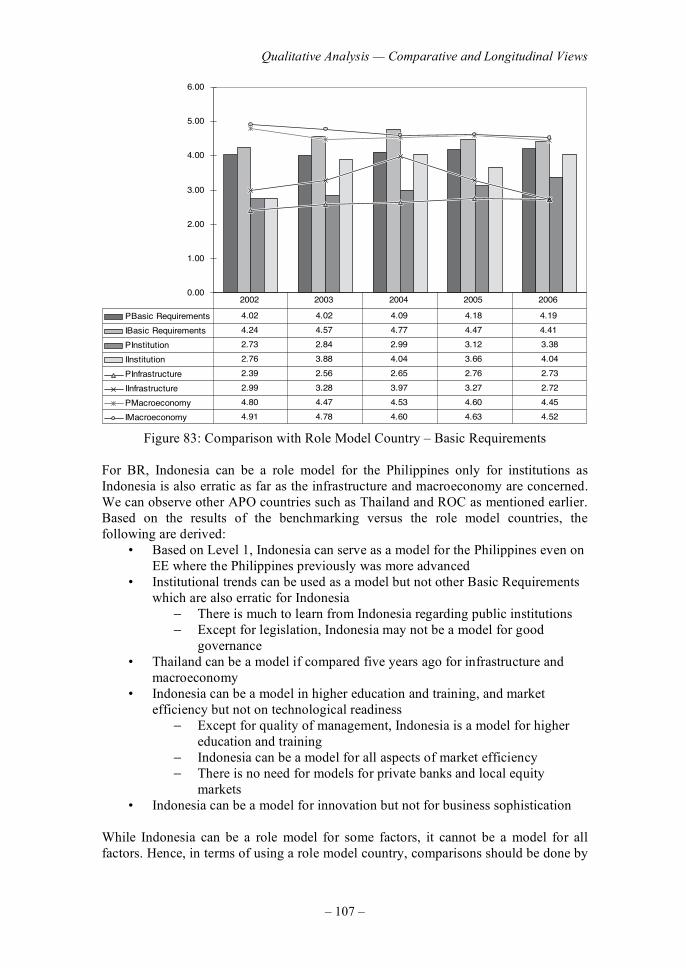
Qualitative Analysis — Comparative and Longitudinal Views
– 107 –
0.00
1.00
2.00
3.00
4.00
5.00
6.00
PBasic Requirements 4.02 4.02 4.09 4.18 4.19
IBasic Requirements 4.24 4.57 4.77 4.47 4.41
PInstitution 2.73 2.84 2.99 3.12 3.38
IInstitution 2.76 3.88 4.04 3.66 4.04
PInfrastructure 2.39 2.56 2.65 2.76 2.73
IInfrastructure 2.99 3.28 3.97 3.27 2.72
PMacroeconomy 4.80 4.47 4.53 4.60 4.45
IMacroeconomy 4.91 4.78 4.60 4.63 4.52
2002 2003 2004 2005 2006
Figure 83: Comparison with Role Model Country – Basic Requirements For BR, Indonesia can be a role model for the Philippines only for institutions as Indonesia is also erratic as far as the infrastructure and macroeconomy are concerned. We can observe other APO countries such as Thailand and ROC as mentioned earlier. Based on the results of the benchmarking versus the role model countries, the following are derived:
• Based on Level 1, Indonesia can serve as a model for the Philippines even on EE where the Philippines previously was more advanced
• Institutional trends can be used as a model but not other Basic Requirements which are also erratic for Indonesia
− There is much to learn from Indonesia regarding public institutions − Except for legislation, Indonesia may not be a model for good
governance • Thailand can be a model if compared five years ago for infrastructure and
macroeconomy • Indonesia can be a model in higher education and training, and market
efficiency but not on technological readiness − Except for quality of management, Indonesia is a model for higher
education and training − Indonesia can be a model for all aspects of market efficiency − There is no need for models for private banks and local equity
markets • Indonesia can be a model for innovation but not for business sophistication
While Indonesia can be a role model for some factors, it cannot be a model for all factors. Hence, in terms of using a role model country, comparisons should be done by
Innovation Framework and Strategies: An APO Perspective
– 108 –
factors only, not using just one country like in benchmarking. A qualitative comparison was also done versus Ireland based on the presentation and discussions led by John Cullen at the forum.
Initiatives, Programs, and Best Practices
Arising from presentations made at the follow-up forum on Innovation and Competitiveness held in Kuala Lumpur and discussions with other Group 3 and 4 member countries represented in the forum, the following common threads were noted:
COMMON THREADS AND ISSUES OF APO MEMBER COUNTRIES
• Need to strengthen public sector service delivery through productivity and
quality improvement with high ethical standards oriented towards enhancing business competitiveness
• Improvement of infrastructure, particularly for Fiji and the Philippines, and education and training
• Focus on ICT, particularly for Sri Lanka, Fiji and the Philippines John Cullen, Executive Director of the Irish Institute of Public Administration, who participated in the forum, noted that Ireland’s turning point was in 1986, about the same time that the Philippines had the first “People Power” revolution. Six main factors that contributed to the turnaround of Ireland were cited as follows:
• Education that started in the 1960s • Foreign direct investment • Fiscal consolidation • Social partnership • EU regional aid • Government think tanks
It seems that Ireland was at least in as worse a condition as the Philippines then and all the six factors were actually also tried in the Philippines except social partnership, with varying degrees of success; yet the Philippines has not sustained any turnaround even after two “People Power” revolutions in more than two decades. The Philippine government has budgeted a significant portion of its annual budget to improve governance as a prerequisite to obtain loans and FDI. Unfortunately, surveys show that certain practices have become ingrained in the culture, even in the private sector, and therefore the Philippines needs more radical, preventive, and sustainable measures rather than just prosecution measures. Note that for these Group 3 and 4 APO member countries, development is factor-driven. Another important observation about the Philippines and other Group 3 countries is the lopsided development of competitiveness. Understandably, development is factor-driven (Stage 1, as mentioned earlier); going toward efficiency-driven development; unlike the Group 1 and 2 countries that are mostly efficiency-driven going toward innovation-driven development. Hence, the GCR ratings on Basic Requirements particularly on economic indicators are higher than the Efficiency Enhancers and Innovation & Sophistication Factors. And the relative importance of

Qualitative Analysis — Comparative and Longitudinal Views
– 109 –
these three main factors shows either a straight downward line (for developing countries) or an inverted V (for underdeveloped countries). Also, unlike in Group 1 and 2 countries where the public sector takes the lead in efficiency enhancing and innovation promotion activities, the private sector takes the lead in Group 3 and 4 countries. Prof. Finn Erling Kydland, the 2004 Nobel Peace Prize winner for economics, pointed out in his lecture at the University of San Carlos in Cebu City, Philippines, that relative peace and stability, not only in terms of political and social peace but even in terms of transparency and good governance and stability of economic policies, is the key to economic development. Therefore, better competitiveness and innovation as not only foreign but local investments could be encouraged and enhanced. Competitiveness and innovation should be driven by private sector initiatives but with government support in terms of political and social peace, transparency and good governance, and consistency of economic and financial policies over time. Hence, the need to enhance business competitiveness and innovation strategies for the Philippines and other Group 3 and 4 APO member countries by strengthening public sector service delivery through productivity and quality improvement with high ethical standards. Good governance needs to be instituted to lay the foundation for innovation and competitiveness. In 2007, the economy of the Philippines grew by more than 7%. While this is laudable, most of the other growing countries in the world have sustained a similar if not better growth for the last decade. This is something that the Philippines and other Group 3 and 4 APO member countries can do on a sustained basis if government services can be improved to enhance business competitiveness and innovation through public sector productivity, quality and good governance. This analysis has presented the steps for a roadmap toward competitiveness and innovation for Group 3 and 4 APO countries using the Philippines as an example. It has shown that there are Basic Requirements that need to be addressed for sustained competitiveness and innovation to happen, i.e., ethical, transparent, and efficient public sector services to enhance business competitiveness and innovation, institutions, particularly education and training at all levels, and infrastructure, before moving to the next stage of development toward an efficiency-driven and eventually an innovation-driven economy. It is quite interesting that the president of the Philippines recently announced an innovation program. While this is a laudable thrust and a product of private and public sector collaboration spearheaded by the Department of Science and Technology, it must be anchored on the prerequisites mentioned above. This is something that has been proven by all the more advanced countries in the APO region and beyond.

– 111 –
PART III APPENDIX
– 113 –
LIST OF CONTRIBUTORS
Chief Expert
Republic of Korea Prof. Sang Chan Park Department of Industrial Engineering Korea Advanced Institute of Science and Technology 373-1 Guseong-dong, Yuseong-gu, Daejeon
Country Experts
Republic of China Dr. Benjamin Yuan, Expert Group Member
Director Institute of Management of Technology National Chiao Tuang University 1001 Ta-Hsueh Road, Hsinchu, Taiwan Dr. James K. C. Chen Assistant Professor Department of Business Administration
Asian University No.500, Lioufeng Road, Wufeng Taichung County 41354 Japan Dr. Chihiro Watanabe, Expert Group Member
Professor Department of Industrial Engineering & Management Tokyo Institute of Technology
2-12-1 W9-49 Ookayama Meguro-ku Tokyo 152-8552 Malaysia Dato’ Nik Zainiah Nik Abd Rahman, Expert Group Member
Director General Malaysia Productivity Corporation P.O. Box 64, Jalan Sultan 46904 Petaling Jaya, Selangor
Ms. Shahuren Ismail Director Malaysia Productivity Corporation P.O. Box 64, Jalan Sultan 46904 Petaling Jaya, Selangor
Innovation Framework and Strategies: An APO Perspective
– 114 –
Philippines Dr. Antonio J. Pineda, Expert Group Member
Associate Director/General Manager Ayala Corporation/Isuzu Cebu, Inc.
Isuzu Mandaue, North Highway Jagobiao, Mandaue City Singapore Dr. Loke Chong Lee, Expert Group Member
Deputy Executive Director (Industry) Singapore Institute of Manufacturing Technology 71 Nanyang Drive, Singapore 638075
Thailand Dr. Wantanee Chongkum, Expert Group Member
Department Director National Innovation Agency 73/1 Rama VI Road, Rajdhevee Bangkok 10400 Mr. Preeda Youngsuksathaporn Department Manager
National Innovation Agency 73/1 Rama VI Road, Rajdhevee Bangkok 10400
Recommended