Highway 104 Operational and Safety Review NS Department of Transportation and Infrastructure Renewal
© Opus International Consultants (Canada) Limited 2015
Hwy 104 Operational and Safety Review
Final Report
NS Transportation and Infrastructure Renewal
Prepared by: Serge Levesque, P.Eng. Opus International Consultants (Canada) Limited
Mark Gunter, P.Eng. (NB) Halifax Office
Karen Robichaud, P.Eng. (NB) 1801 Hollis Street – Suite 500
Halifax NS
Canada
Telephone: +1 902 21o-OPUS
Date: 20 March 2015
Reference: C-23401.20
Status: Final
i
20 March 2015 Opus International Consultants (Canada) Limited
Contents
1 Introduction and Background ............................................................................. 1
2 Approach ........................................................................................................... 2 2.1 Consultations .................................................................................................................... 2 2.2 Collision Analysis .............................................................................................................. 3 2.3 In-service review ............................................................................................................... 3 2.4 Assessing Issues and Developing Countermeasures ........................................................ 4
3 Existing Roadway Profile ................................................................................... 5 3.1 Geometric and Operational Characteristics...................................................................... 5
3.2 Collision History ............................................................................................................... 7
3.3 Enforcement Programs ................................................................................................... 13 3.4 Study Area Maintenance & Rehabilitation ..................................................................... 14
4 Summary of Operational and Safety Issues ....................................................... 15 4.1 Overview ......................................................................................................................... 15
4.2 Positive Safety Practices .................................................................................................. 20
5 Safety Countermeasures ................................................................................... 21
6 Safety Improvement Plan ................................................................................. 24 6.1 Category 1 Improvements ............................................................................................... 25 6.2 Category 2 Improvements ............................................................................................... 28
7 Summary of Key Findings ................................................................................ 30
Appendix A – Study Terms of Reference ................................................................... 31
Appendix B – Level of Service Analysis Input and Output Values ............................. 39
Appendix C – Photos of Safety Deficiency Examples ................................................. 41
Appendix D – Countermeasures by Order of Magnitude Cost ................................... 51
P a g e | 1
20 March 2015 Opus International Consultants (Canada) Limited
1 Introduction and Background
Opus International Consultants (Canada) Ltd. has completed an operational and safety
review of Highway 104 between Sutherland’s River and Antigonish, NS. The purpose of
the review was to identify deficiencies and develop a safety improvement plan for this two-
lane section of roadway until upgrading to a four lane, divided facility becomes a reality.
The Province of Nova Scotia has made substantial investments in its “100-series” arterial
highway network in recent decades, including hundreds of kilometres of twinning and new
bypass alignments, which have had an overall positive impact on road user safety. Despite
this progress, there remain large portions of the network that have yet to be upgraded,
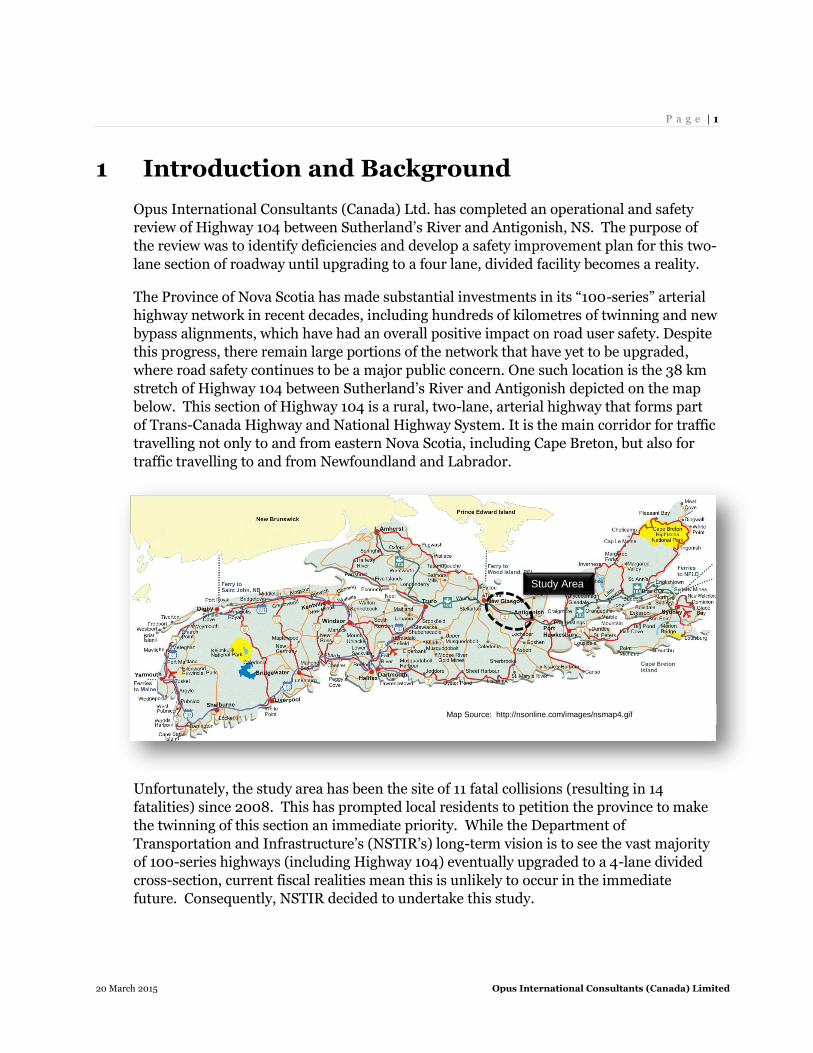
where road safety continues to be a major public concern. One such location is the 38 km
stretch of Highway 104 between Sutherland’s River and Antigonish depicted on the map
below. This section of Highway 104 is a rural, two-lane, arterial highway that forms part
of Trans-Canada Highway and National Highway System. It is the main corridor for traffic
travelling not only to and from eastern Nova Scotia, including Cape Breton, but also for
traffic travelling to and from Newfoundland and Labrador.
Unfortunately, the study area has been the site of 11 fatal collisions (resulting in 14
fatalities) since 2008. This has prompted local residents to petition the province to make
the twinning of this section an immediate priority. While the Department of
Transportation and Infrastructure’s (NSTIR’s) long-term vision is to see the vast majority
of 100-series highways (including Highway 104) eventually upgraded to a 4-lane divided
cross-section, current fiscal realities mean this is unlikely to occur in the immediate
future. Consequently, NSTIR decided to undertake this study.
Study Area
Map Source: http://nsonline.com/images/nsmap4.gif
P a g e | 2
20 March 2015 Opus International Consultants (Canada) Limited
Recognizing that twinning is unlikely to occur in the immediate future, the primary
objective of this study was to undertake a safety review to identify and
prioritize potential countermeasures that are most likely to have a positive
impact on safety until such time that Highway 104 is eventually upgraded to
four lanes. While it is believed that twinning would ultimately address many existing
safety concerns, there are likely to be other incremental improvements which can
implemented in the short term to reduce both the frequency and severity of collisions.
2 Approach
Operational and safety issues associated with the existing corridor were identified from a
combination of three primary sources:
Face-to-face consultations with emergency response personnel, TIR maintenance
staff, and other key stakeholders;
Findings from historical collision data analysis; and
An in-service review of the corridor by two senior transportation engineers.
2.1 Consultations
Local stakeholders were able to provide extremely valuable insight on the major safety
issues along the study area corridor. This helped to focus the collision analysis and in-
service review as well as identify issues that the study team otherwise may not have
considered.
The following table provides a list of individuals who were formally consulted as part of
this study. For the most part, consultations were conducted face-to-face. The study team
was also fortunate to have representatives from three local fire departments and NSTIR
accompany them on drive-throughs of the entire corridor.
Organization Position (s)
Province of Nova Scotia MLA – Pictou East
Barney’s River Fire Department Fire Chief
Thorburn & District Fire Department Fire Chief
Antigonish County Fire Department Firefighter
EHS Area Supervisors (Pictou / Antigonish)
RCMP Eastern Traffic Services Team Leader
NS Transportation & Infrastructure Renewal Area Managers (Pictou / Antigonish)
Operations Supervisors (Pictou / Antigonish)
Highway Maintenance Supervisor
Construction Manager
Traffic Supervisor – Northern District
Chignecto-Central Regional School Board Pupil Transportation Coordinator
Strait Regional School Board Pupil Transportation Coordinator
P a g e | 3
20 March 2015 Opus International Consultants (Canada) Limited
2.2 Collision Analysis
Historical collision data were analyzed to gain a better understanding of the specific types
of collisions occurring in the study area, the factors that contributed to them, and their
location. This information was used to identify issues and to prioritize countermeasures.
Three sets of historical collision data, relevant to the study area, were available from
NSTIR:
Average annual collision rates per one-hundred vehicle kilometres for a range of
highway classes for the period 2001-2005;
Detailed collision statistics on five highway segments located within the study area
for the period 2007 – 2012; and
Detailed information on fatal collisions, including specific locations within the study
area, for the period from 2007 to 2014.
The data on fatal collisions was the most detailed including specific locations identified for
each collision and descriptions of contributing factors. There was less information
available on injury and property-damage-only collisions because NSTIR is currently
upgrading its collision information system. However, the data were still very useful for
providing insights to factors such as weather, road conditions, collision configuration, and
unusual environmental circumstances. While information on specific locations of non-
fatal collisions was not available, locations were provided in terms of five segments within
the study area. More general data on average annual collision rates across Nova Scotia
were also reviewed to compare the study area with other similar arterial highways across
the province.
2.3 In-service review
An in-service review was undertaken over a three day period between November 24th and
November 26th, 2014. During this time, two senior transportation engineers drove the
corridor a total of ten (10) times (five in each direction) to gain a first-hand appreciation of
potential safety issues that may exist. Where necessary, supplemental field measurements
were collected to further assess specific concerns related to sight distance, shoulder
widths, foreslopes, lateral g-force on horizontal curves, etc. Numerous digital photographs
were also captured to more effectively illustrate each of the issues identified.
Drive-throughs occurred under a variety of different conditions including daytime, dusk,
after dark, and during a rain event.
P a g e | 4
20 March 2015 Opus International Consultants (Canada) Limited
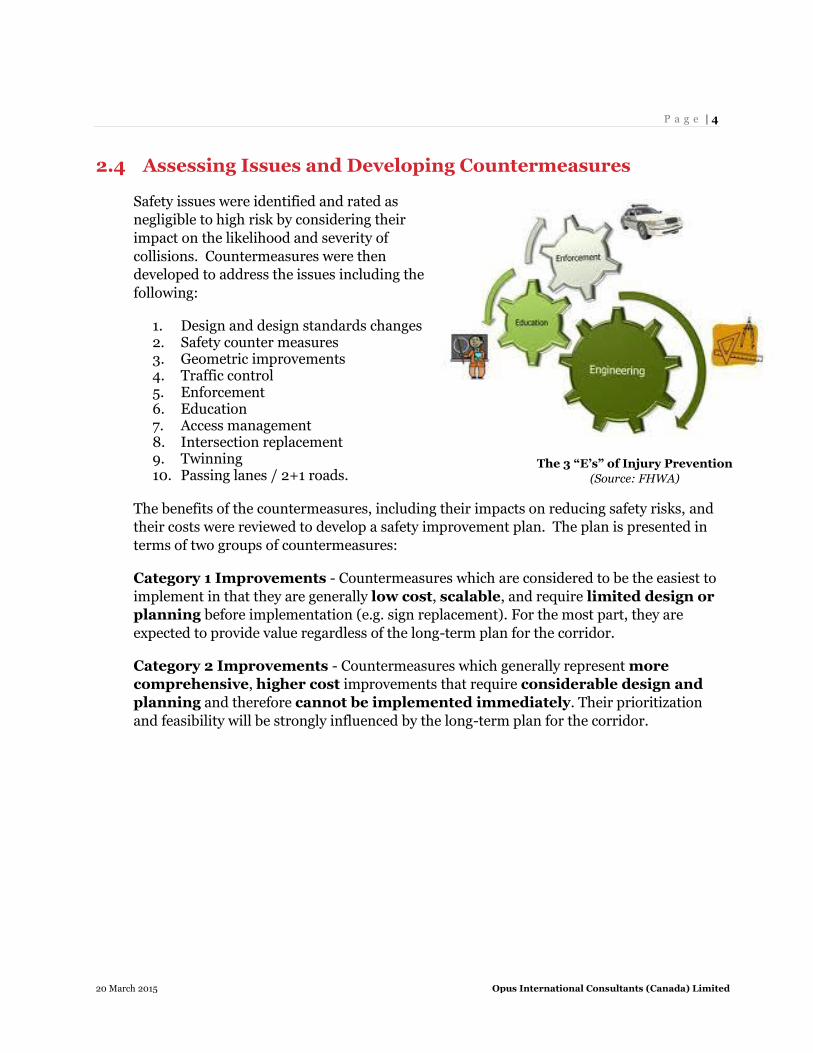
2.4 Assessing Issues and Developing Countermeasures
Safety issues were identified and rated as
negligible to high risk by considering their
impact on the likelihood and severity of
collisions. Countermeasures were then
developed to address the issues including the
following:
1. Design and design standards changes 2. Safety counter measures 3. Geometric improvements 4. Traffic control 5. Enforcement 6. Education 7. Access management 8. Intersection replacement 9. Twinning 10. Passing lanes / 2+1 roads.
The benefits of the countermeasures, including their impacts on reducing safety risks, and
their costs were reviewed to develop a safety improvement plan. The plan is presented in
terms of two groups of countermeasures:
Category 1 Improvements - Countermeasures which are considered to be the easiest to
implement in that they are generally low cost, scalable, and require limited design or
planning before implementation (e.g. sign replacement). For the most part, they are
expected to provide value regardless of the long-term plan for the corridor.
Category 2 Improvements - Countermeasures which generally represent more
comprehensive, higher cost improvements that require considerable design and
planning and therefore cannot be implemented immediately. Their prioritization
and feasibility will be strongly influenced by the long-term plan for the corridor.
The 3 “E’s” of Injury Prevention
(Source: FHWA)
P a g e | 5
20 March 2015 Opus International Consultants (Canada) Limited
3 Existing Roadway Profile
3.1 Geometric and Operational Characteristics
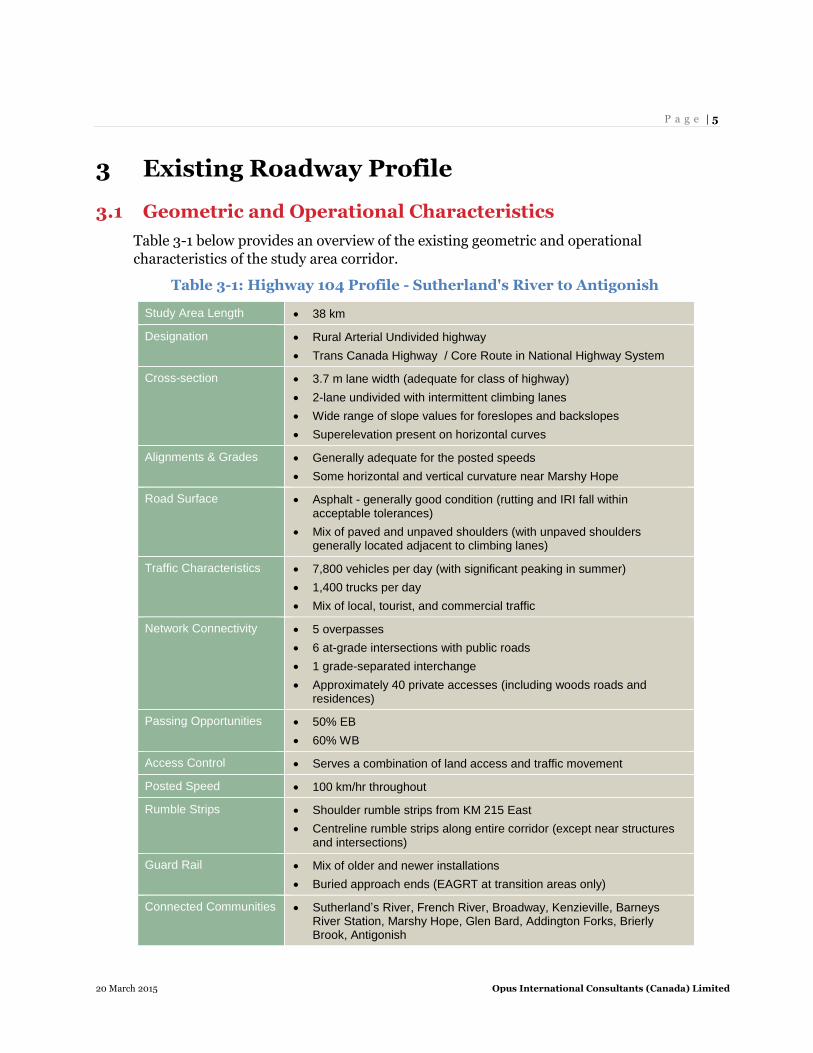
Table 3-1 below provides an overview of the existing geometric and operational
characteristics of the study area corridor.
Table 3-1: Highway 104 Profile - Sutherland's River to Antigonish
Study Area Length 38 km
Designation Rural Arterial Undivided highway
Trans Canada Highway / Core Route in National Highway System
Cross-section 3.7 m lane width (adequate for class of highway)
2-lane undivided with intermittent climbing lanes
Wide range of slope values for foreslopes and backslopes
Superelevation present on horizontal curves
Alignments & Grades Generally adequate for the posted speeds
Some horizontal and vertical curvature near Marshy Hope
Road Surface Asphalt - generally good condition (rutting and IRI fall within acceptable tolerances)
Mix of paved and unpaved shoulders (with unpaved shoulders generally located adjacent to climbing lanes)
Traffic Characteristics 7,800 vehicles per day (with significant peaking in summer)
1,400 trucks per day
Mix of local, tourist, and commercial traffic
Network Connectivity 5 overpasses
6 at-grade intersections with public roads
1 grade-separated interchange
Approximately 40 private accesses (including woods roads and residences)
Passing Opportunities 50% EB
60% WB
Access Control Serves a combination of land access and traffic movement
Posted Speed 100 km/hr throughout
Rumble Strips Shoulder rumble strips from KM 215 East
Centreline rumble strips along entire corridor (except near structures and intersections)
Guard Rail Mix of older and newer installations
Buried approach ends (EAGRT at transition areas only)
Connected Communities Sutherland’s River, French River, Broadway, Kenzieville, Barneys River Station, Marshy Hope, Glen Bard, Addington Forks, Brierly Brook, Antigonish
P a g e | 6
20 March 2015 Opus International Consultants (Canada) Limited
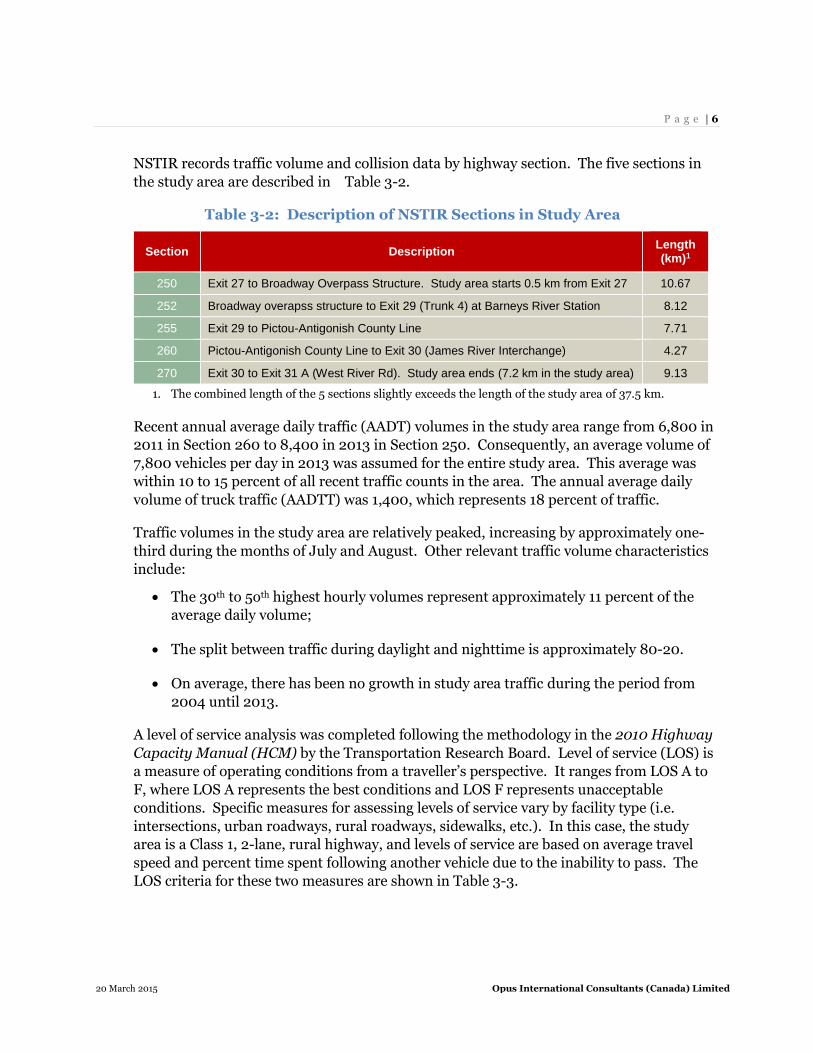
NSTIR records traffic volume and collision data by highway section. The five sections in
the study area are described in Table 3-2.
Table 3-2: Description of NSTIR Sections in Study Area
Section Description Length (km)1
250 Exit 27 to Broadway Overpass Structure. Study area starts 0.5 km from Exit 27 10.67
252 Broadway overapss structure to Exit 29 (Trunk 4) at Barneys River Station 8.12
255 Exit 29 to Pictou-Antigonish County Line 7.71
260 Pictou-Antigonish County Line to Exit 30 (James River Interchange) 4.27
270 Exit 30 to Exit 31 A (West River Rd). Study area ends (7.2 km in the study area) 9.13
1. The combined length of the 5 sections slightly exceeds the length of the study area of 37.5 km.
Recent annual average daily traffic (AADT) volumes in the study area range from 6,800 in
2011 in Section 260 to 8,400 in 2013 in Section 250. Consequently, an average volume of
7,800 vehicles per day in 2013 was assumed for the entire study area. This average was
within 10 to 15 percent of all recent traffic counts in the area. The annual average daily
volume of truck traffic (AADTT) was 1,400, which represents 18 percent of traffic.
Traffic volumes in the study area are relatively peaked, increasing by approximately one-
third during the months of July and August. Other relevant traffic volume characteristics
include:
The 30th to 5oth highest hourly volumes represent approximately 11 percent of the
average daily volume;
The split between traffic during daylight and nighttime is approximately 80-20.
On average, there has been no growth in study area traffic during the period from
2004 until 2013.
A level of service analysis was completed following the methodology in the 2010 Highway
Capacity Manual (HCM) by the Transportation Research Board. Level of service (LOS) is
a measure of operating conditions from a traveller’s perspective. It ranges from LOS A to
F, where LOS A represents the best conditions and LOS F represents unacceptable
conditions. Specific measures for assessing levels of service vary by facility type (i.e.
intersections, urban roadways, rural roadways, sidewalks, etc.). In this case, the study
area is a Class 1, 2-lane, rural highway, and levels of service are based on average travel
speed and percent time spent following another vehicle due to the inability to pass. The
LOS criteria for these two measures are shown in Table 3-3.
P a g e | 7
20 March 2015 Opus International Consultants (Canada) Limited
Table 3-3: Level of Service Criteria for Study Area
LOS Average Travel Speed Percent Time Spent Following
A greater than 89 km/h (55 mph) less than or equal to 35%
B greater than 80 to 89 km/h (50 to 55 mph) greater than 35 to 50
C greater than 72 to 80 km/h (45 to 50 mph) greater than 50 to 65
D greater than 64 to 72 km/h (40 to 45 mph) greater than 65 to 80
E less than 64 km/h (40 mph) greater than 80
F Demand exceeds 1,700 passenger cars per hour (PCPH) in one direction, or 3,200 pcph in two directions.
The level of service during the 3oth to 5oth highest hours of the year was LOS D in the
study area segments without climbing lanes. This was based on a demand of 700
passenger cars per hour in one direction, 1250 pcph in two directions, and a percent time
spent following of 78. This is reaching the limit of acceptable operations, however, it is
also worth mentioning that, with the exception of Marshy Hope, there are frequent
passing opportunities along the corridor.
The inputs and outputs related to the above analysis are summarized in Appendix B.
3.2 Collision History
3.2.1 Fatal Collisions
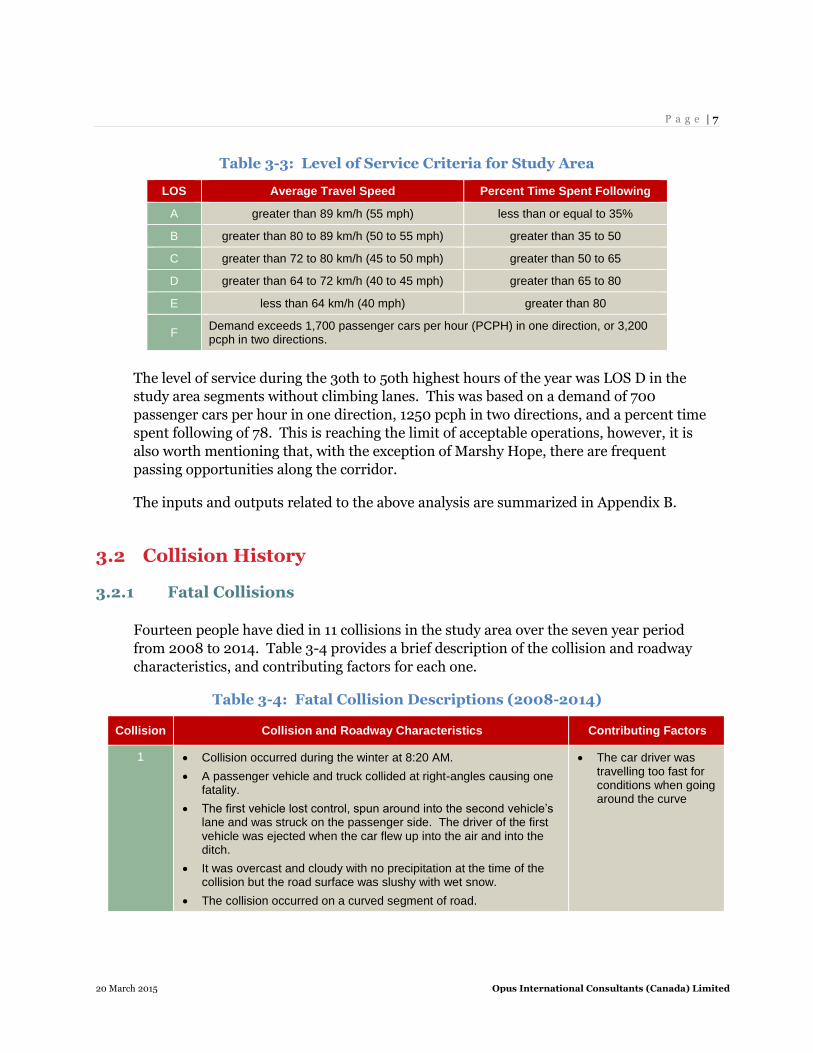
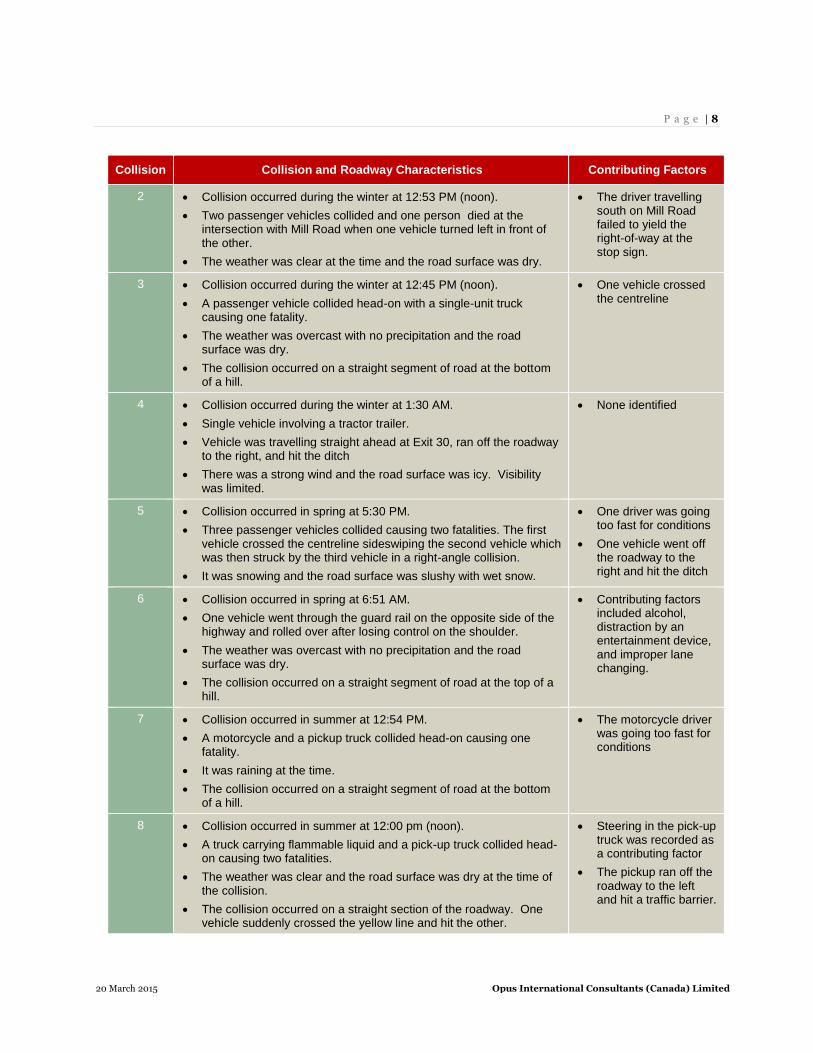
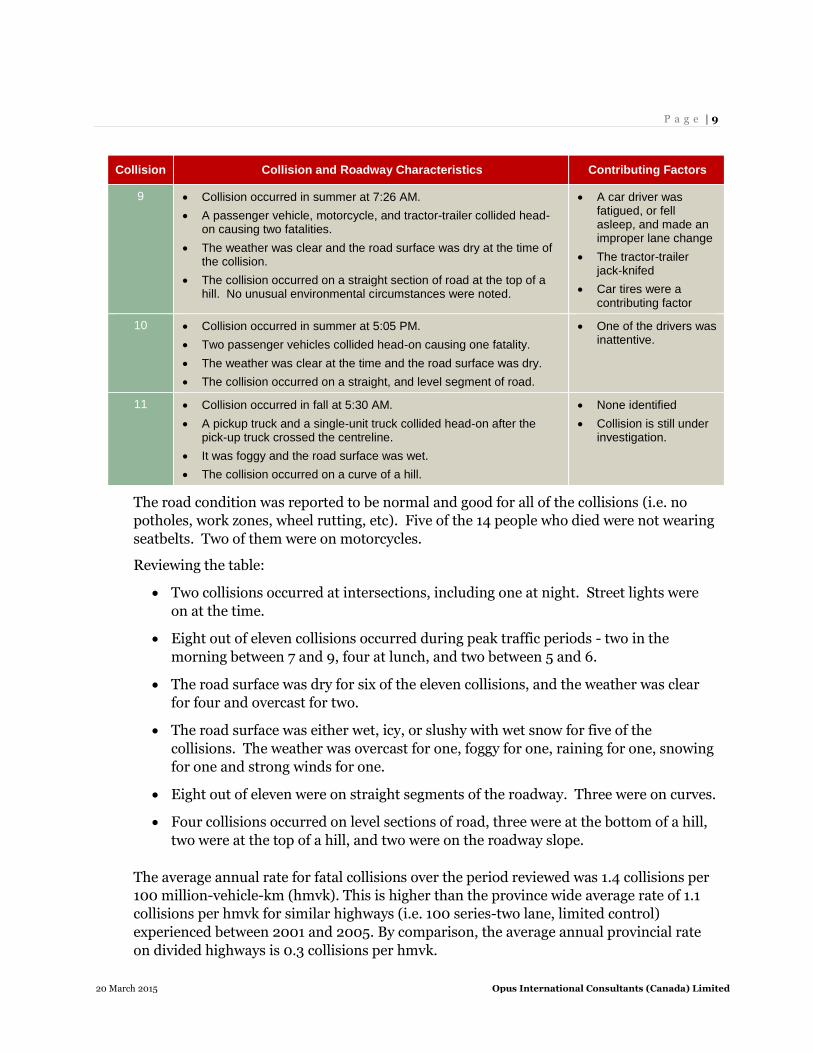
Fourteen people have died in 11 collisions in the study area over the seven year period
from 2008 to 2014. Table 3-4 provides a brief description of the collision and roadway
characteristics, and contributing factors for each one.
Table 3-4: Fatal Collision Descriptions (2008-2014)
Collision Collision and Roadway Characteristics Contributing Factors
1 Collision occurred during the winter at 8:20 AM.
A passenger vehicle and truck collided at right-angles causing one fatality.
The first vehicle lost control, spun around into the second vehicle’s lane and was struck on the passenger side. The driver of the first vehicle was ejected when the car flew up into the air and into the ditch.
It was overcast and cloudy with no precipitation at the time of the collision but the road surface was slushy with wet snow.
The collision occurred on a curved segment of road.
The car driver was travelling too fast for conditions when going around the curve
P a g e | 8
20 March 2015 Opus International Consultants (Canada) Limited
Collision Collision and Roadway Characteristics Contributing Factors
2 Collision occurred during the winter at 12:53 PM (noon).
Two passenger vehicles collided and one person died at the intersection with Mill Road when one vehicle turned left in front of the other.
The weather was clear at the time and the road surface was dry.
The driver travelling south on Mill Road failed to yield the right-of-way at the stop sign.
3 Collision occurred during the winter at 12:45 PM (noon).
A passenger vehicle collided head-on with a single-unit truck causing one fatality.
The weather was overcast with no precipitation and the road surface was dry.
The collision occurred on a straight segment of road at the bottom of a hill.
One vehicle crossed the centreline
4 Collision occurred during the winter at 1:30 AM.
Single vehicle involving a tractor trailer.
Vehicle was travelling straight ahead at Exit 30, ran off the roadway to the right, and hit the ditch
There was a strong wind and the road surface was icy. Visibility was limited.
None identified
5 Collision occurred in spring at 5:30 PM.
Three passenger vehicles collided causing two fatalities. The first vehicle crossed the centreline sideswiping the second vehicle which was then struck by the third vehicle in a right-angle collision.
It was snowing and the road surface was slushy with wet snow.
One driver was going too fast for conditions
One vehicle went off the roadway to the right and hit the ditch
6 Collision occurred in spring at 6:51 AM.
One vehicle went through the guard rail on the opposite side of the highway and rolled over after losing control on the shoulder.
The weather was overcast with no precipitation and the road surface was dry.
The collision occurred on a straight segment of road at the top of a hill.
Contributing factors included alcohol, distraction by an entertainment device, and improper lane changing.
7 Collision occurred in summer at 12:54 PM.
A motorcycle and a pickup truck collided head-on causing one fatality.
It was raining at the time.
The collision occurred on a straight segment of road at the bottom of a hill.
The motorcycle driver was going too fast for conditions
8 Collision occurred in summer at 12:00 pm (noon).
A truck carrying flammable liquid and a pick-up truck collided head-on causing two fatalities.
The weather was clear and the road surface was dry at the time of the collision.
The collision occurred on a straight section of the roadway. One vehicle suddenly crossed the yellow line and hit the other.
Steering in the pick-up truck was recorded as a contributing factor
The pickup ran off the roadway to the left and hit a traffic barrier.
P a g e | 9
20 March 2015 Opus International Consultants (Canada) Limited
Collision Collision and Roadway Characteristics Contributing Factors
9 Collision occurred in summer at 7:26 AM.
A passenger vehicle, motorcycle, and tractor-trailer collided head-on causing two fatalities.
The weather was clear and the road surface was dry at the time of the collision.
The collision occurred on a straight section of road at the top of a hill. No unusual environmental circumstances were noted.
A car driver was fatigued, or fell asleep, and made an improper lane change
The tractor-trailer jack-knifed
Car tires were a contributing factor
10 Collision occurred in summer at 5:05 PM.
Two passenger vehicles collided head-on causing one fatality.
The weather was clear at the time and the road surface was dry.
The collision occurred on a straight, and level segment of road.
One of the drivers was inattentive.
11 Collision occurred in fall at 5:30 AM.
A pickup truck and a single-unit truck collided head-on after the pick-up truck crossed the centreline.
It was foggy and the road surface was wet.
The collision occurred on a curve of a hill.
None identified
Collision is still under investigation.
The road condition was reported to be normal and good for all of the collisions (i.e. no
potholes, work zones, wheel rutting, etc). Five of the 14 people who died were not wearing
seatbelts. Two of them were on motorcycles.
Reviewing the table:
Two collisions occurred at intersections, including one at night. Street lights were
on at the time.
Eight out of eleven collisions occurred during peak traffic periods - two in the
morning between 7 and 9, four at lunch, and two between 5 and 6.
The road surface was dry for six of the eleven collisions, and the weather was clear
for four and overcast for two.
The road surface was either wet, icy, or slushy with wet snow for five of the
collisions. The weather was overcast for one, foggy for one, raining for one, snowing
for one and strong winds for one.
Eight out of eleven were on straight segments of the roadway. Three were on curves.
Four collisions occurred on level sections of road, three were at the bottom of a hill,
two were at the top of a hill, and two were on the roadway slope.
The average annual rate for fatal collisions over the period reviewed was 1.4 collisions per
100 million-vehicle-km (hmvk). This is higher than the province wide average rate of 1.1
collisions per hmvk for similar highways (i.e. 100 series-two lane, limited control)
experienced between 2001 and 2005. By comparison, the average annual provincial rate
on divided highways is 0.3 collisions per hmvk.
P a g e | 10
20 March 2015 Opus International Consultants (Canada) Limited
3.2.2 Non-Fatal Collisions
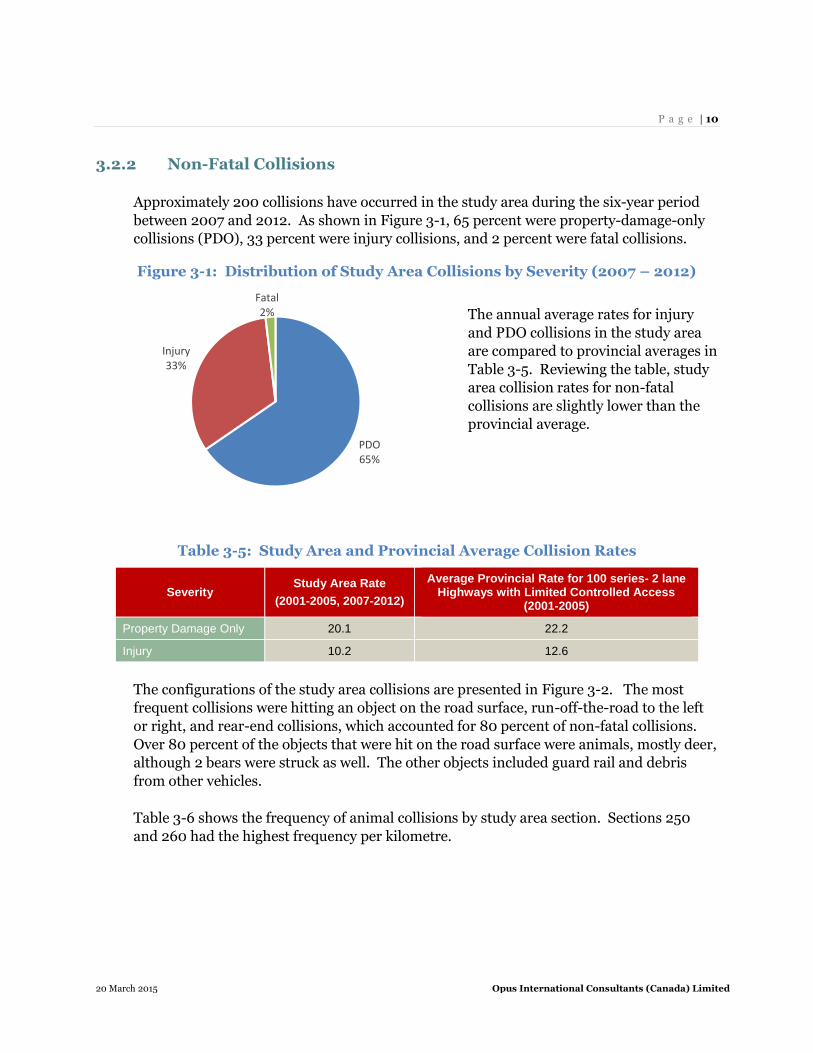
Approximately 200 collisions have occurred in the study area during the six-year period
between 2007 and 2012. As shown in Figure 3-1, 65 percent were property-damage-only
collisions (PDO), 33 percent were injury collisions, and 2 percent were fatal collisions.
Figure 3-1: Distribution of Study Area Collisions by Severity (2007 – 2012)
The annual average rates for injury
and PDO collisions in the study area
are compared to provincial averages in
Table 3-5. Reviewing the table, study
area collision rates for non-fatal
collisions are slightly lower than the
provincial average.
Table 3-5: Study Area and Provincial Average Collision Rates
Severity Study Area Rate
(2001-2005, 2007-2012)
Average Provincial Rate for 100 series- 2 lane Highways with Limited Controlled Access
(2001-2005)
Property Damage Only 20.1 22.2
Injury 10.2 12.6
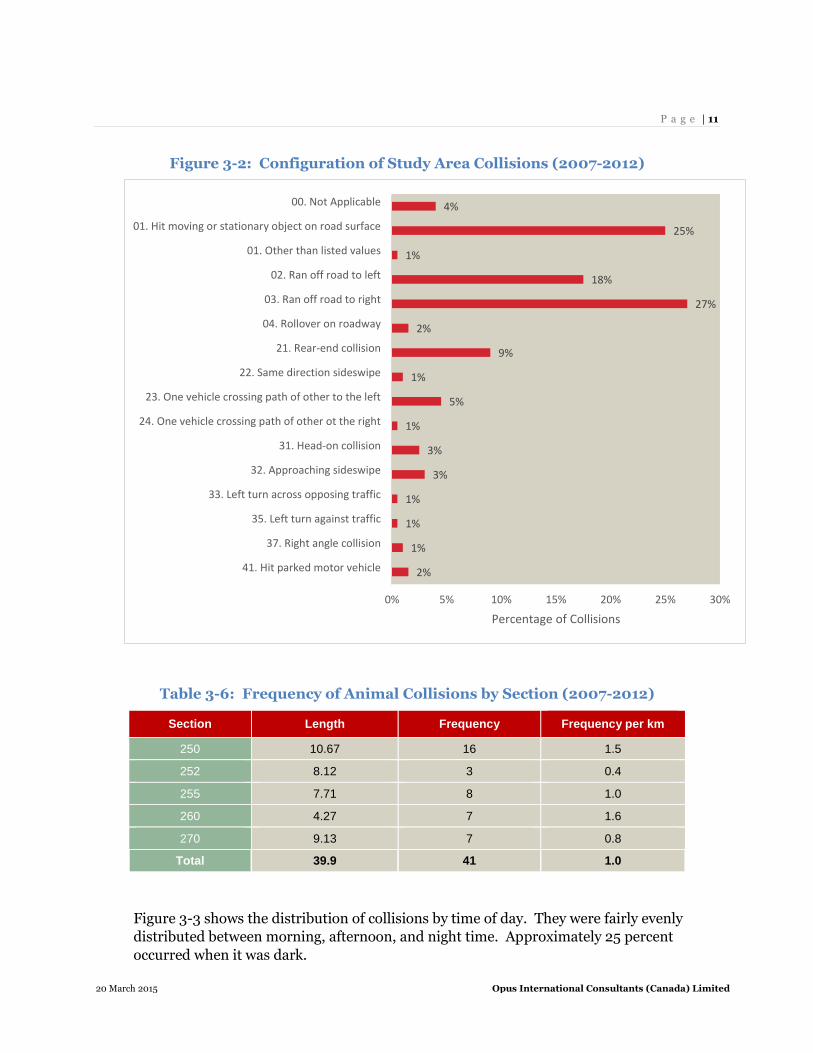
The configurations of the study area collisions are presented in Figure 3-2. The most
frequent collisions were hitting an object on the road surface, run-off-the-road to the left
or right, and rear-end collisions, which accounted for 80 percent of non-fatal collisions.
Over 80 percent of the objects that were hit on the road surface were animals, mostly deer,
although 2 bears were struck as well. The other objects included guard rail and debris
from other vehicles.
Table 3-6 shows the frequency of animal collisions by study area section. Sections 250
and 260 had the highest frequency per kilometre.
PDO65%
Injury33%
Fatal2%
P a g e | 11
20 March 2015 Opus International Consultants (Canada) Limited
Figure 3-2: Configuration of Study Area Collisions (2007-2012)
Table 3-6: Frequency of Animal Collisions by Section (2007-2012)
Section Length Frequency Frequency per km
250 10.67 16 1.5
252 8.12 3 0.4
255 7.71 8 1.0
260 4.27 7 1.6
270 9.13 7 0.8
Total 39.9 41 1.0
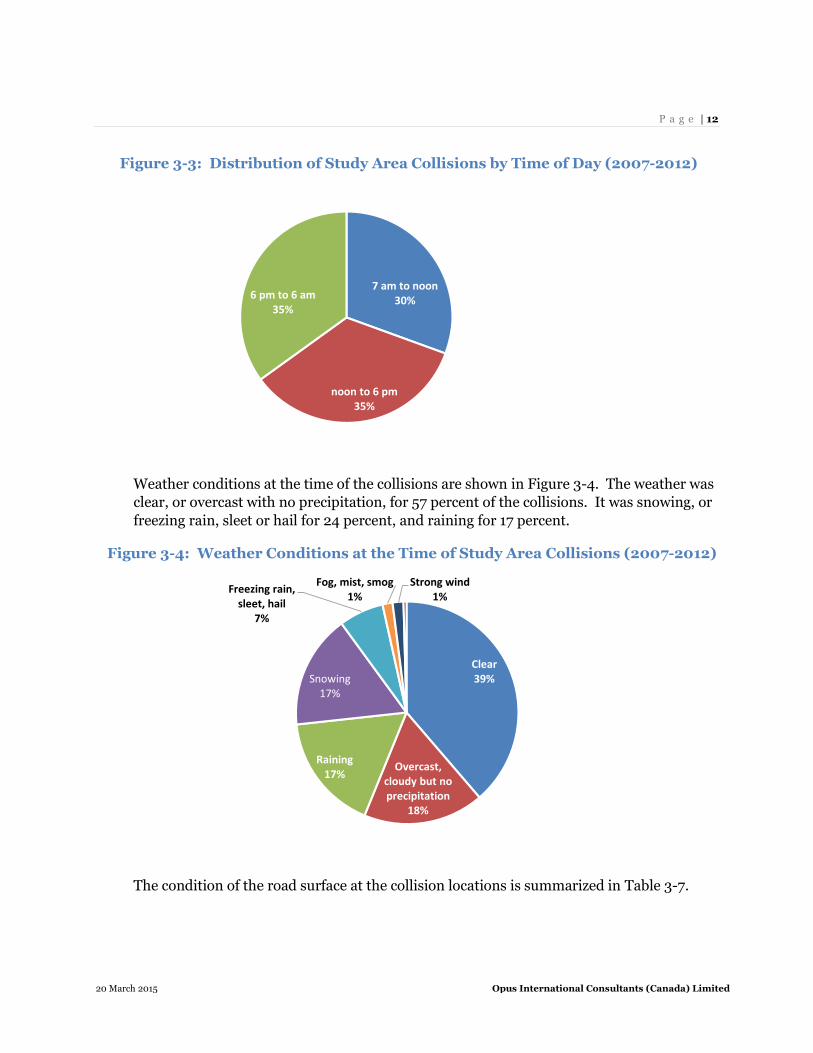
Figure 3-3 shows the distribution of collisions by time of day. They were fairly evenly
distributed between morning, afternoon, and night time. Approximately 25 percent
occurred when it was dark.
2%
1%
1%
1%
3%
3%
1%
5%
1%
9%
2%
27%
18%
1%
25%
4%
0% 5% 10% 15% 20% 25% 30%
41. Hit parked motor vehicle
37. Right angle collision
35. Left turn against traffic
33. Left turn across opposing traffic
32. Approaching sideswipe
31. Head-on collision
24. One vehicle crossing path of other ot the right
23. One vehicle crossing path of other to the left
22. Same direction sideswipe
21. Rear-end collision
04. Rollover on roadway
03. Ran off road to right
02. Ran off road to left
01. Other than listed values
01. Hit moving or stationary object on road surface
00. Not Applicable
Percentage of Collisions
P a g e | 12
20 March 2015 Opus International Consultants (Canada) Limited
Figure 3-3: Distribution of Study Area Collisions by Time of Day (2007-2012)
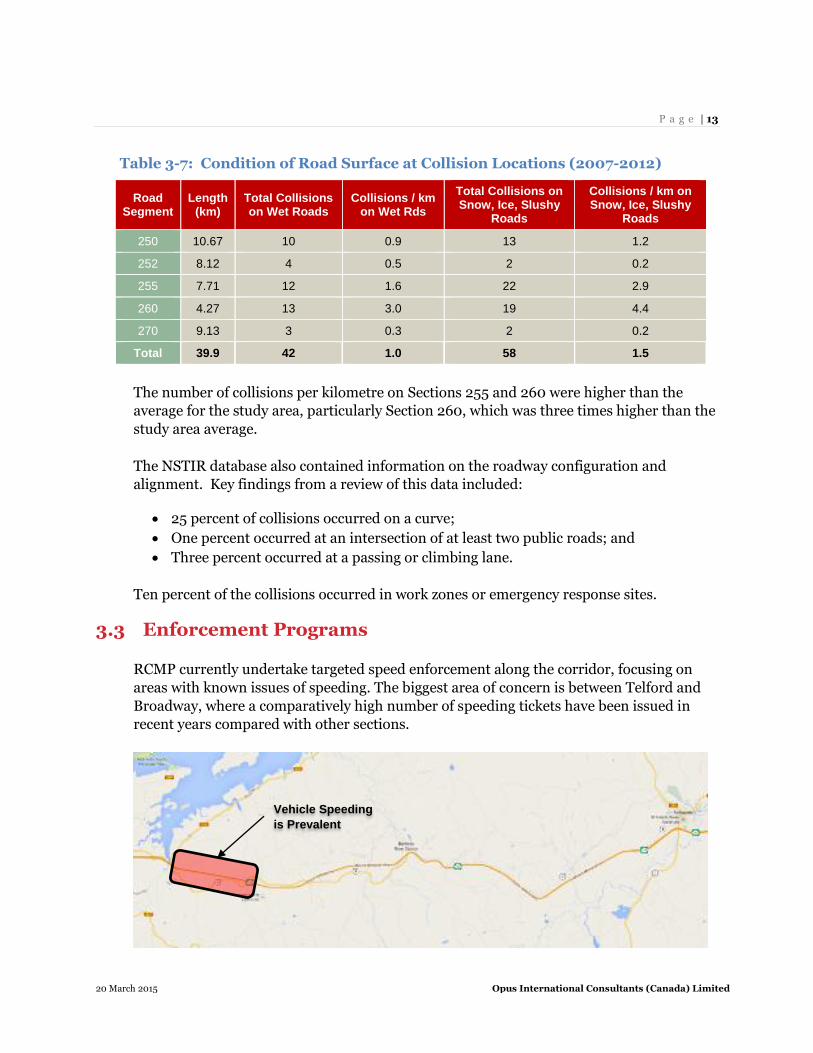
Weather conditions at the time of the collisions are shown in Figure 3-4. The weather was
clear, or overcast with no precipitation, for 57 percent of the collisions. It was snowing, or
freezing rain, sleet or hail for 24 percent, and raining for 17 percent.
Figure 3-4: Weather Conditions at the Time of Study Area Collisions (2007-2012)
The condition of the road surface at the collision locations is summarized in Table 3-7.
7 am to noon30%
noon to 6 pm35%
6 pm to 6 am35%
Clear39%
Overcast, cloudy but no precipitation
18%
Raining17%
Snowing17%
Freezing rain, sleet, hail
7%
Fog, mist, smog1%
Strong wind1%
P a g e | 13
20 March 2015 Opus International Consultants (Canada) Limited
Table 3-7: Condition of Road Surface at Collision Locations (2007-2012)
Road Segment
Length (km)
Total Collisions on Wet Roads
Collisions / km on Wet Rds
Total Collisions on Snow, Ice, Slushy
Roads
Collisions / km on Snow, Ice, Slushy
Roads
250 10.67 10 0.9 13 1.2
252 8.12 4 0.5 2 0.2
255 7.71 12 1.6 22 2.9
260 4.27 13 3.0 19 4.4
270 9.13 3 0.3 2 0.2
Total 39.9 42 1.0 58 1.5
The number of collisions per kilometre on Sections 255 and 260 were higher than the
average for the study area, particularly Section 260, which was three times higher than the
study area average.
The NSTIR database also contained information on the roadway configuration and
alignment. Key findings from a review of this data included:
25 percent of collisions occurred on a curve;
One percent occurred at an intersection of at least two public roads; and
Three percent occurred at a passing or climbing lane.
Ten percent of the collisions occurred in work zones or emergency response sites.
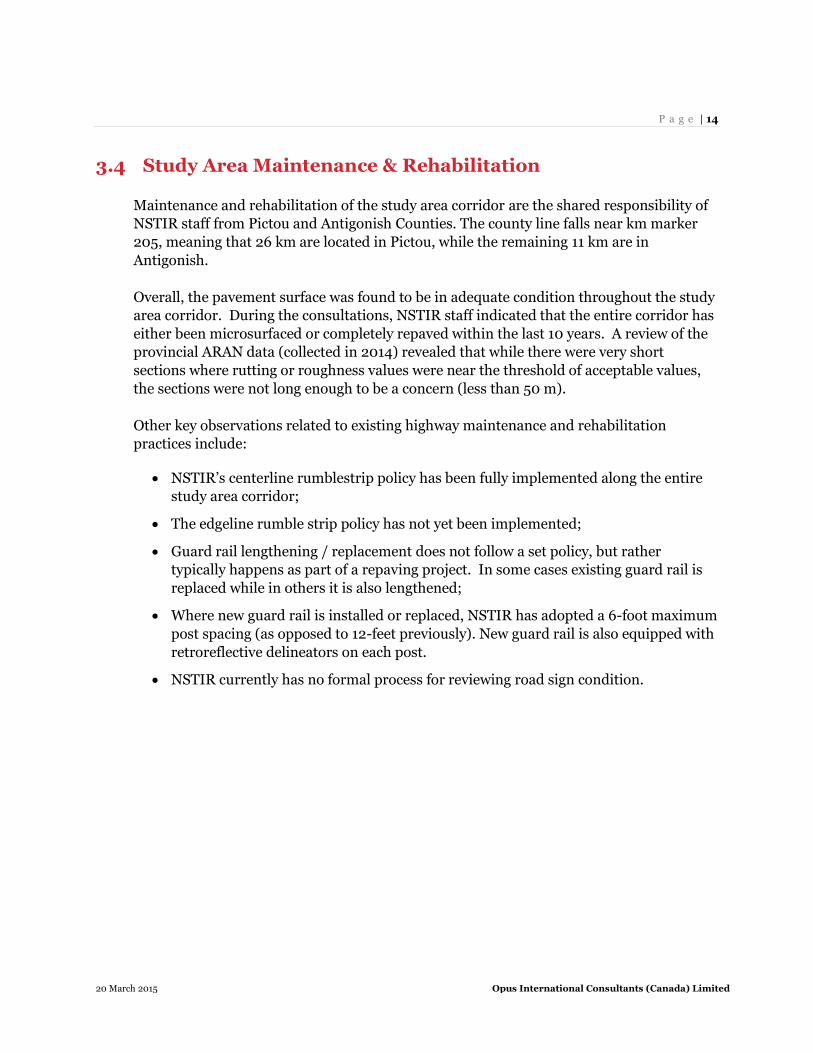
3.3 Enforcement Programs
RCMP currently undertake targeted speed enforcement along the corridor, focusing on
areas with known issues of speeding. The biggest area of concern is between Telford and
Broadway, where a comparatively high number of speeding tickets have been issued in
recent years compared with other sections.
Vehicle Speeding
is Prevalent
P a g e | 14
20 March 2015 Opus International Consultants (Canada) Limited
3.4 Study Area Maintenance & Rehabilitation
Maintenance and rehabilitation of the study area corridor are the shared responsibility of
NSTIR staff from Pictou and Antigonish Counties. The county line falls near km marker
205, meaning that 26 km are located in Pictou, while the remaining 11 km are in
Antigonish.
Overall, the pavement surface was found to be in adequate condition throughout the study
area corridor. During the consultations, NSTIR staff indicated that the entire corridor has
either been microsurfaced or completely repaved within the last 10 years. A review of the
provincial ARAN data (collected in 2014) revealed that while there were very short
sections where rutting or roughness values were near the threshold of acceptable values,
the sections were not long enough to be a concern (less than 50 m).
Other key observations related to existing highway maintenance and rehabilitation
practices include:
NSTIR’s centerline rumblestrip policy has been fully implemented along the entire
study area corridor;
The edgeline rumble strip policy has not yet been implemented;
Guard rail lengthening / replacement does not follow a set policy, but rather
typically happens as part of a repaving project. In some cases existing guard rail is
replaced while in others it is also lengthened;
Where new guard rail is installed or replaced, NSTIR has adopted a 6-foot maximum
post spacing (as opposed to 12-feet previously). New guard rail is also equipped with
retroreflective delineators on each post.
NSTIR currently has no formal process for reviewing road sign condition.
P a g e | 15
20 March 2015 Opus International Consultants (Canada) Limited
4 Summary of Operational and Safety Issues
4.1 Overview
Overall, the study team identified 27 different “issues” along the Highway 104 corridor
that could have an adverse impact on traffic operations and/or road user safety. Each of
these issues is described in Table 4.1 on the following page. Photos of specific examples
from the field review are also attached as Appendix C. It is worth noting that the
term “issue” in this context does not necessarily reflect a deficient or
substandard condition, but rather that the particular situation presents a
heightened risk in terms of the likelihood of a collision and severity. Many
issues are also inter-related and therefore are not considered to be mutually exclusive.
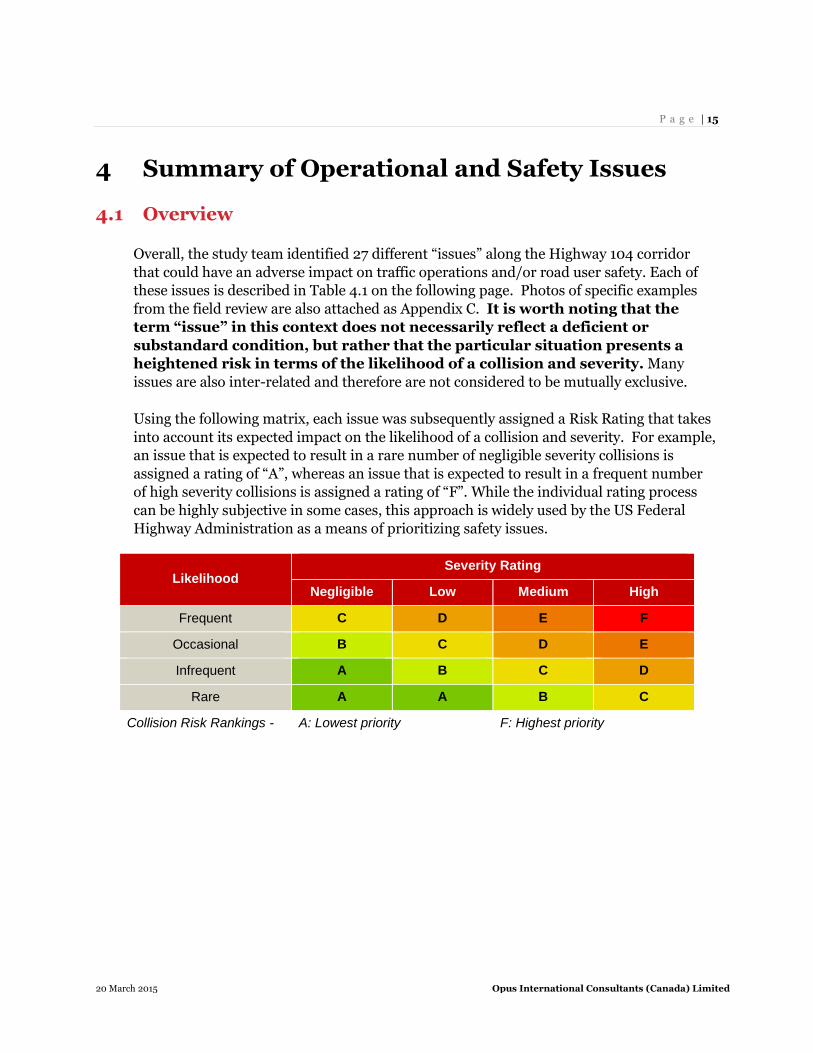
Using the following matrix, each issue was subsequently assigned a Risk Rating that takes
into account its expected impact on the likelihood of a collision and severity. For example,
an issue that is expected to result in a rare number of negligible severity collisions is
assigned a rating of “A”, whereas an issue that is expected to result in a frequent number
of high severity collisions is assigned a rating of “F”. While the individual rating process
can be highly subjective in some cases, this approach is widely used by the US Federal
Highway Administration as a means of prioritizing safety issues.
Likelihood Severity Rating
Negligible Low Medium High
Frequent C D E F
Occasional B C D E
Infrequent A B C D
Rare A A B C
Collision Risk Rankings - A: Lowest priority F: Highest priority
P a g e | 16
20 March 2015 Opus International Consultants (Canada) Limited
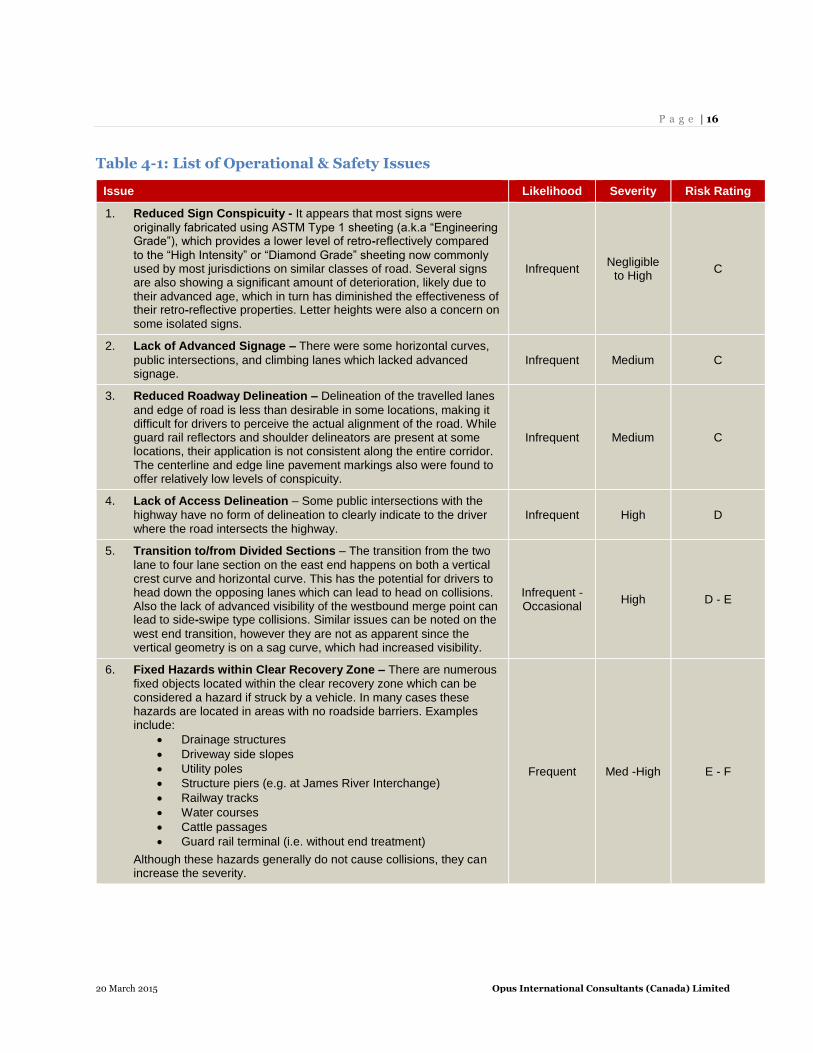
Table 4-1: List of Operational & Safety Issues
Issue Likelihood Severity Risk Rating
1. Reduced Sign Conspicuity - It appears that most signs were
originally fabricated using ASTM Type 1 sheeting (a.k.a “Engineering Grade”), which provides a lower level of retro-reflectively compared
to the “High Intensity” or “Diamond Grade” sheeting now commonly used by most jurisdictions on similar classes of road. Several signs are also showing a significant amount of deterioration, likely due to their advanced age, which in turn has diminished the effectiveness of their retro-reflective properties. Letter heights were also a concern on
some isolated signs.
Infrequent Negligible
to High C
2. Lack of Advanced Signage – There were some horizontal curves,
public intersections, and climbing lanes which lacked advanced signage.
Infrequent Medium C
3. Reduced Roadway Delineation – Delineation of the travelled lanes
and edge of road is less than desirable in some locations, making it difficult for drivers to perceive the actual alignment of the road. While guard rail reflectors and shoulder delineators are present at some locations, their application is not consistent along the entire corridor. The centerline and edge line pavement markings also were found to offer relatively low levels of conspicuity.
Infrequent Medium C
4. Lack of Access Delineation – Some public intersections with the
highway have no form of delineation to clearly indicate to the driver where the road intersects the highway.
Infrequent High D
5. Transition to/from Divided Sections – The transition from the two
lane to four lane section on the east end happens on both a vertical crest curve and horizontal curve. This has the potential for drivers to head down the opposing lanes which can lead to head on collisions. Also the lack of advanced visibility of the westbound merge point can lead to side-swipe type collisions. Similar issues can be noted on the
west end transition, however they are not as apparent since the vertical geometry is on a sag curve, which had increased visibility.
Infrequent - Occasional
High D - E
6. Fixed Hazards within Clear Recovery Zone – There are numerous
fixed objects located within the clear recovery zone which can be considered a hazard if struck by a vehicle. In many cases these hazards are located in areas with no roadside barriers. Examples include:
Drainage structures
Driveway side slopes
Utility poles
Structure piers (e.g. at James River Interchange)
Railway tracks
Water courses
Cattle passages
Guard rail terminal (i.e. without end treatment)
Although these hazards generally do not cause collisions, they can increase the severity.
Frequent Med -High E - F
P a g e | 17
20 March 2015 Opus International Consultants (Canada) Limited
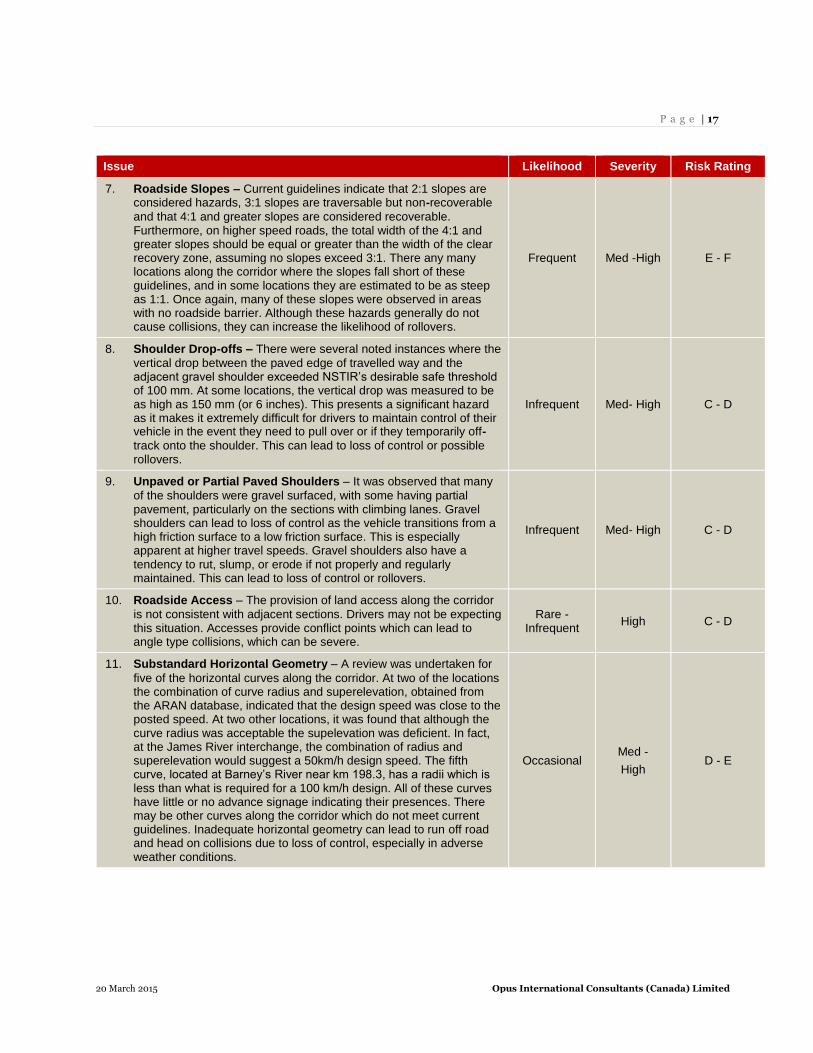
Issue Likelihood Severity Risk Rating
7. Roadside Slopes – Current guidelines indicate that 2:1 slopes are considered hazards, 3:1 slopes are traversable but non-recoverable
and that 4:1 and greater slopes are considered recoverable. Furthermore, on higher speed roads, the total width of the 4:1 and greater slopes should be equal or greater than the width of the clear recovery zone, assuming no slopes exceed 3:1. There any many locations along the corridor where the slopes fall short of these guidelines, and in some locations they are estimated to be as steep as 1:1. Once again, many of these slopes were observed in areas with no roadside barrier. Although these hazards generally do not cause collisions, they can increase the likelihood of rollovers.
Frequent Med -High E - F
8. Shoulder Drop-offs – There were several noted instances where the
vertical drop between the paved edge of travelled way and the adjacent gravel shoulder exceeded NSTIR’s desirable safe threshold of 100 mm. At some locations, the vertical drop was measured to be as high as 150 mm (or 6 inches). This presents a significant hazard as it makes it extremely difficult for drivers to maintain control of their vehicle in the event they need to pull over or if they temporarily off-
track onto the shoulder. This can lead to loss of control or possible rollovers.
Infrequent Med- High C - D
9. Unpaved or Partial Paved Shoulders – It was observed that many
of the shoulders were gravel surfaced, with some having partial pavement, particularly on the sections with climbing lanes. Gravel shoulders can lead to loss of control as the vehicle transitions from a high friction surface to a low friction surface. This is especially apparent at higher travel speeds. Gravel shoulders also have a tendency to rut, slump, or erode if not properly and regularly maintained. This can lead to loss of control or rollovers.
Infrequent Med- High C - D
10. Roadside Access – The provision of land access along the corridor
is not consistent with adjacent sections. Drivers may not be expecting this situation. Accesses provide conflict points which can lead to angle type collisions, which can be severe.
Rare - Infrequent
High C - D
11. Substandard Horizontal Geometry – A review was undertaken for
five of the horizontal curves along the corridor. At two of the locations the combination of curve radius and superelevation, obtained from the ARAN database, indicated that the design speed was close to the posted speed. At two other locations, it was found that although the curve radius was acceptable the supelevation was deficient. In fact, at the James River interchange, the combination of radius and superelevation would suggest a 50km/h design speed. The fifth curve, located at Barney’s River near km 198.3, has a radii which is less than what is required for a 100 km/h design. All of these curves have little or no advance signage indicating their presences. There may be other curves along the corridor which do not meet current guidelines. Inadequate horizontal geometry can lead to run off road and head on collisions due to loss of control, especially in adverse weather conditions.
Occasional Med -
High D - E
P a g e | 18
20 March 2015 Opus International Consultants (Canada) Limited
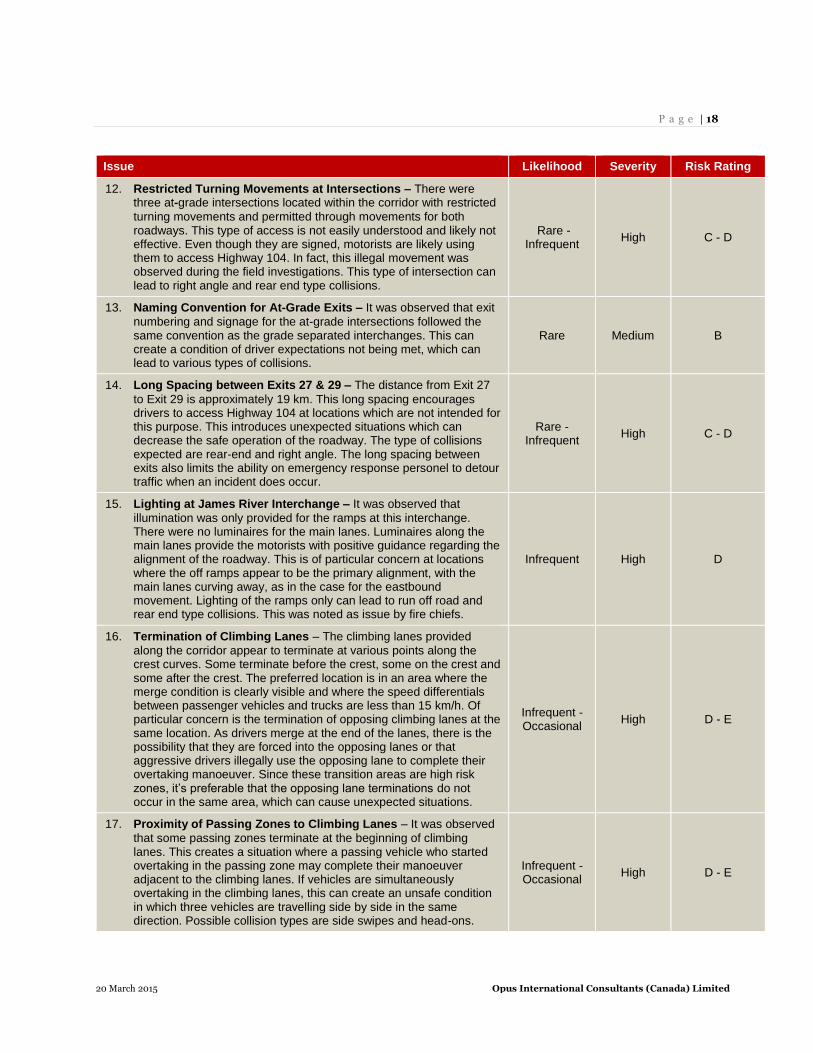
Issue Likelihood Severity Risk Rating
12. Restricted Turning Movements at Intersections – There were three at-grade intersections located within the corridor with restricted
turning movements and permitted through movements for both roadways. This type of access is not easily understood and likely not effective. Even though they are signed, motorists are likely using them to access Highway 104. In fact, this illegal movement was observed during the field investigations. This type of intersection can lead to right angle and rear end type collisions.
Rare - Infrequent
High C - D
13. Naming Convention for At-Grade Exits – It was observed that exit
numbering and signage for the at-grade intersections followed the same convention as the grade separated interchanges. This can create a condition of driver expectations not being met, which can lead to various types of collisions.
Rare Medium B
14. Long Spacing between Exits 27 & 29 – The distance from Exit 27
to Exit 29 is approximately 19 km. This long spacing encourages drivers to access Highway 104 at locations which are not intended for this purpose. This introduces unexpected situations which can decrease the safe operation of the roadway. The type of collisions expected are rear-end and right angle. The long spacing between exits also limits the ability on emergency response personel to detour traffic when an incident does occur.
Rare - Infrequent
High C - D
15. Lighting at James River Interchange – It was observed that
illumination was only provided for the ramps at this interchange. There were no luminaires for the main lanes. Luminaires along the main lanes provide the motorists with positive guidance regarding the alignment of the roadway. This is of particular concern at locations where the off ramps appear to be the primary alignment, with the main lanes curving away, as in the case for the eastbound movement. Lighting of the ramps only can lead to run off road and rear end type collisions. This was noted as issue by fire chiefs.
Infrequent High D
16. Termination of Climbing Lanes – The climbing lanes provided
along the corridor appear to terminate at various points along the crest curves. Some terminate before the crest, some on the crest and some after the crest. The preferred location is in an area where the merge condition is clearly visible and where the speed differentials between passenger vehicles and trucks are less than 15 km/h. Of particular concern is the termination of opposing climbing lanes at the same location. As drivers merge at the end of the lanes, there is the possibility that they are forced into the opposing lanes or that aggressive drivers illegally use the opposing lane to complete their overtaking manoeuver. Since these transition areas are high risk zones, it’s preferable that the opposing lane terminations do not occur in the same area, which can cause unexpected situations.
Infrequent - Occasional
High D - E
17. Proximity of Passing Zones to Climbing Lanes – It was observed
that some passing zones terminate at the beginning of climbing lanes. This creates a situation where a passing vehicle who started overtaking in the passing zone may complete their manoeuver adjacent to the climbing lanes. If vehicles are simultaneously overtaking in the climbing lanes, this can create an unsafe condition in which three vehicles are travelling side by side in the same direction. Possible collision types are side swipes and head-ons.
Infrequent - Occasional
High D - E
P a g e | 19
20 March 2015 Opus International Consultants (Canada) Limited
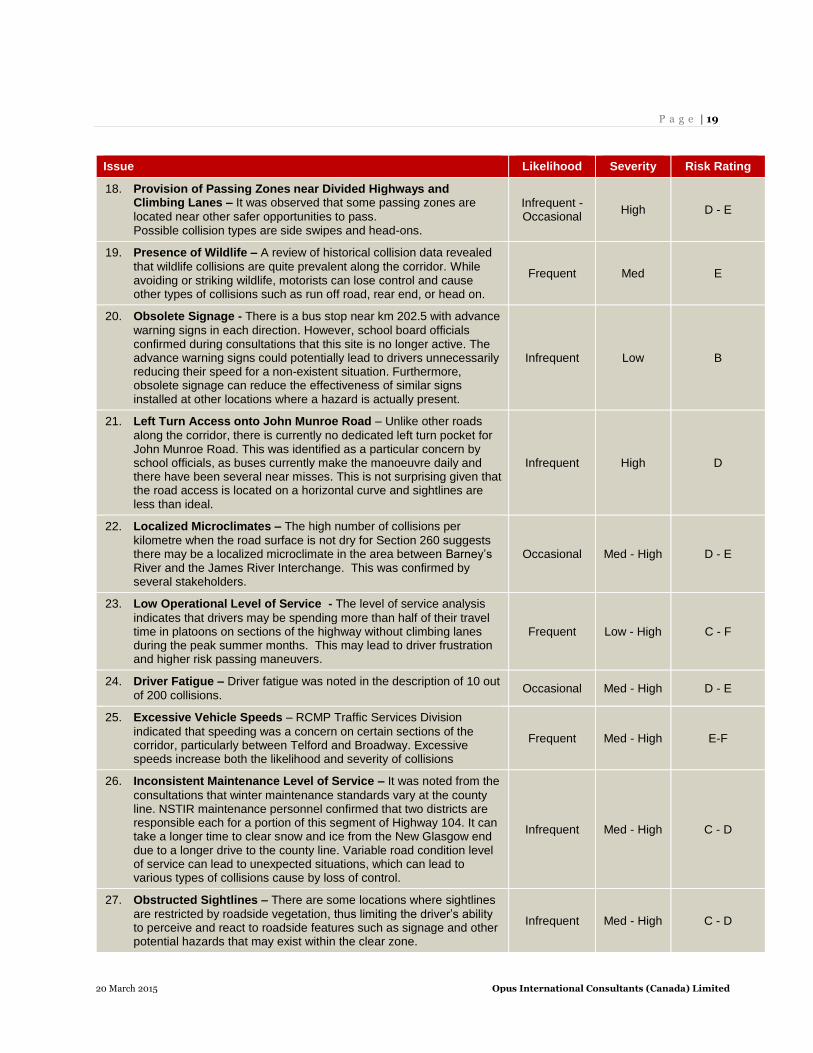
Issue Likelihood Severity Risk Rating
18. Provision of Passing Zones near Divided Highways and Climbing Lanes – It was observed that some passing zones are
located near other safer opportunities to pass. Possible collision types are side swipes and head-ons.
Infrequent - Occasional
High D - E
19. Presence of Wildlife – A review of historical collision data revealed
that wildlife collisions are quite prevalent along the corridor. While avoiding or striking wildlife, motorists can lose control and cause other types of collisions such as run off road, rear end, or head on.
Frequent Med E
20. Obsolete Signage - There is a bus stop near km 202.5 with advance
warning signs in each direction. However, school board officials confirmed during consultations that this site is no longer active. The advance warning signs could potentially lead to drivers unnecessarily reducing their speed for a non-existent situation. Furthermore, obsolete signage can reduce the effectiveness of similar signs installed at other locations where a hazard is actually present.
Infrequent Low B
21. Left Turn Access onto John Munroe Road – Unlike other roads
along the corridor, there is currently no dedicated left turn pocket for John Munroe Road. This was identified as a particular concern by school officials, as buses currently make the manoeuvre daily and there have been several near misses. This is not surprising given that the road access is located on a horizontal curve and sightlines are less than ideal.
Infrequent High D
22. Localized Microclimates – The high number of collisions per
kilometre when the road surface is not dry for Section 260 suggests there may be a localized microclimate in the area between Barney’s River and the James River Interchange. This was confirmed by several stakeholders.
Occasional Med - High D - E
23. Low Operational Level of Service - The level of service analysis
indicates that drivers may be spending more than half of their travel time in platoons on sections of the highway without climbing lanes during the peak summer months. This may lead to driver frustration and higher risk passing maneuvers.
Frequent Low - High C - F
24. Driver Fatigue – Driver fatigue was noted in the description of 10 out
of 200 collisions. Occasional Med - High D - E
25. Excessive Vehicle Speeds – RCMP Traffic Services Division
indicated that speeding was a concern on certain sections of the corridor, particularly between Telford and Broadway. Excessive speeds increase both the likelihood and severity of collisions
Frequent Med - High E-F
26. Inconsistent Maintenance Level of Service – It was noted from the
consultations that winter maintenance standards vary at the county line. NSTIR maintenance personnel confirmed that two districts are responsible each for a portion of this segment of Highway 104. It can take a longer time to clear snow and ice from the New Glasgow end due to a longer drive to the county line. Variable road condition level of service can lead to unexpected situations, which can lead to various types of collisions cause by loss of control.
Infrequent Med - High C - D
27. Obstructed Sightlines – There are some locations where sightlines
are restricted by roadside vegetation, thus limiting the driver’s ability to perceive and react to roadside features such as signage and other potential hazards that may exist within the clear zone.
Infrequent Med - High C - D
P a g e | 20
20 March 2015 Opus International Consultants (Canada) Limited
The list of issues in Table 4-1 were summarized into the following categories:
Corridor Visibility – Overall, the corridor was found to be very dark at night –
particularly in contrast with the adjacent four-lane sections located at either end. The
travelled way and other roadside features (including intersections and other potential
hazards) are not easily identified along some sections.
Roadside Environment – Once a vehicle leaves the travelled lanes, there are a
number of roadside hazards which are likely to increase the frequency and severity of
collisions. In most locations, the chances of a driver regaining control of their vehicle
after leaving the road are low.
Roadway Geometry –While the roadway geometry is generally considered to be
adequate for the posted speed limit, there are certain geometric elements that do not
meet current design guidelines that may present an elevated safety risk. The provision
of adequate sight distance is also considered to be a geometric issue.
Traffic Operations – Traffic operations issues affect the flow of traffic between
origins and destinations. Issues can be related to traffic volumes, lane markings,
climbing lanes, and intersection locations.
Driver Expectation – It is important to provide drivers with clear clues about what
is expected of them on a particular roadway. Unexpected roadway features can
impact safety due to wrong decisions or long reaction times by drivers. This is of
particular concern in the study area because the adjacent sections of Highway 104 are
a different highway class (i.e. 4-lane divided with full access control compared to 2-
lane divided with limited access control).
Driver Behaviour – This category encompasses issues such as driver fatigue,
driving too fast for conditions, speeding, and alcohol.
In some cases, a single issue may fall into multiple categories. For example, lighting at an
intersection would be categorized as both a visibility and driver expectation issue.
4.2 Positive Safety Practices
While the focus of this study was to identify issues that may have a detrimental impact on
road safety, it is worth highlighting that several positive safety practices were also
observed. Examples include:
The installation of centreline rumble strips along the entire corridor;
The presence of artificial lighting at most public intersections;
Six foot post spacing with reflectors on newer guard rail installations;
Provision of climbing / passing lanes;
Good road condition; and
Turning lanes at some at-grade intersections.
In some instances, initiatives have yet to be fully implemented along the entire corridor,
however they serve as a strong starting point.
P a g e | 21
20 March 2015 Opus International Consultants (Canada) Limited
5 Safety Countermeasures
Using the list of identified issues from the previous section as a guide, the study team
developed a list of safety countermeasures with potential suitability for the Highway 104
corridor. During this exercise, consideration was given to current practices utilized in
other jurisdictions, as well as the most recent design guidelines and transportation safety
research. Countermeasures also covered the 3 E’s of Injury Prevention – Education,
Engineering, and Enforcement. It should be noted that while some countermeasures
exceed current minimum NSTIR policy, the Department may still wish to consider
implementation as a means of further enhancing safety at particular problem areas.
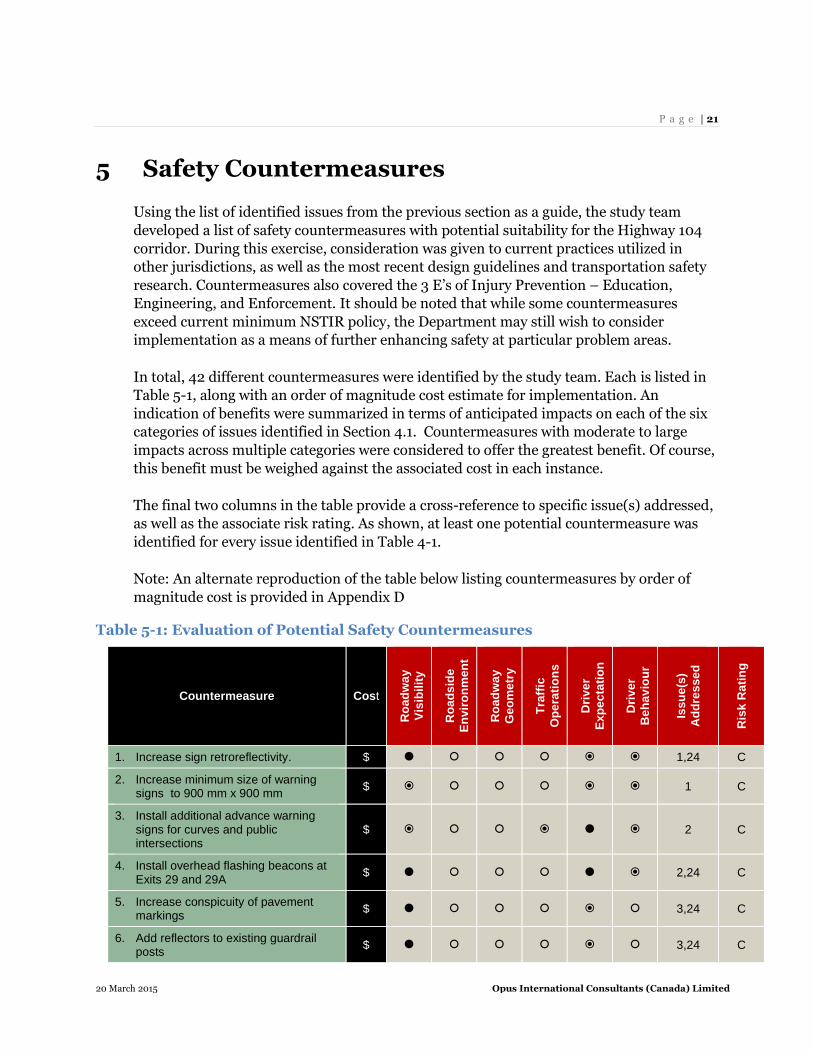
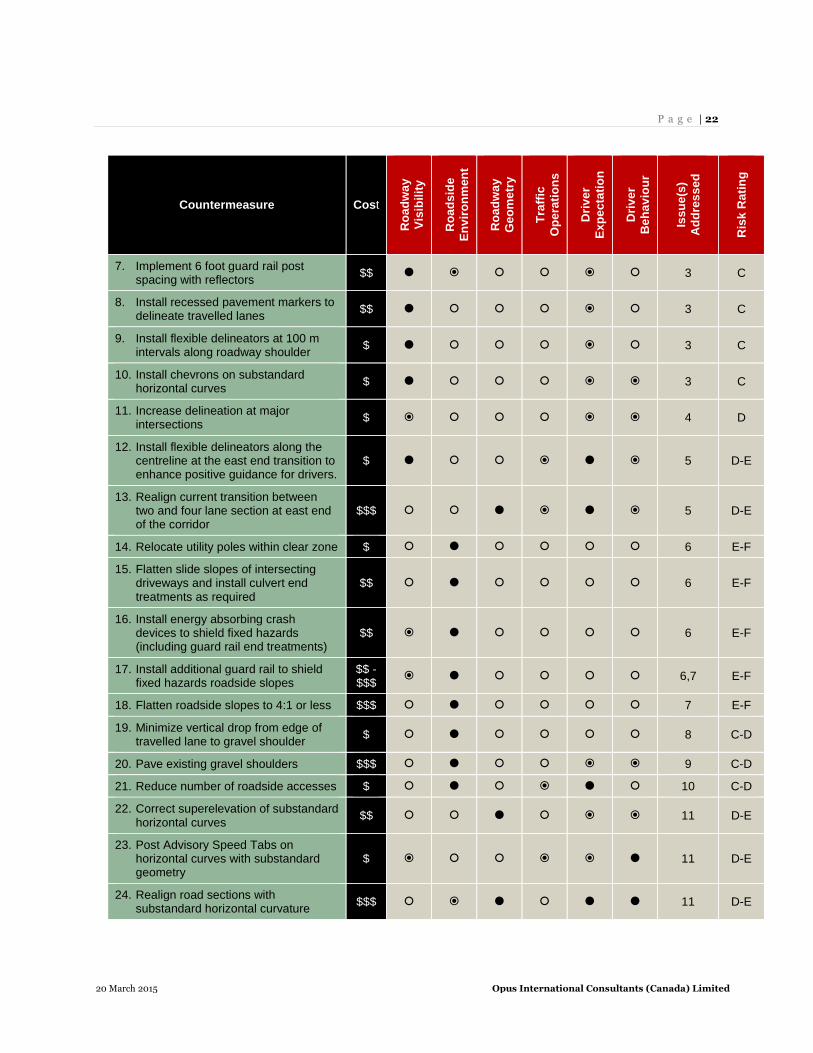
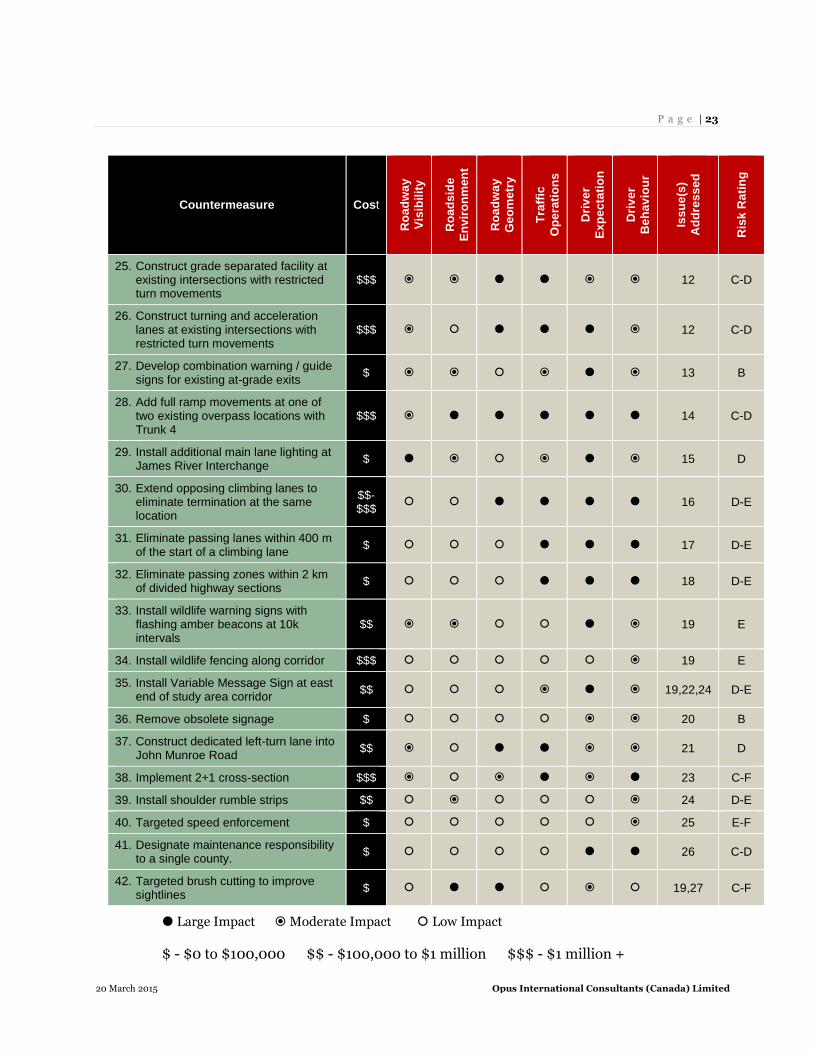
In total, 42 different countermeasures were identified by the study team. Each is listed in
Table 5-1, along with an order of magnitude cost estimate for implementation. An
indication of benefits were summarized in terms of anticipated impacts on each of the six
categories of issues identified in Section 4.1. Countermeasures with moderate to large
impacts across multiple categories were considered to offer the greatest benefit. Of course,
this benefit must be weighed against the associated cost in each instance.
The final two columns in the table provide a cross-reference to specific issue(s) addressed,
as well as the associate risk rating. As shown, at least one potential countermeasure was
identified for every issue identified in Table 4-1.
Note: An alternate reproduction of the table below listing countermeasures by order of
magnitude cost is provided in Appendix D
Table 5-1: Evaluation of Potential Safety Countermeasures
Countermeasure Cost
Ro
ad
way
Vis
ibil
ity
Ro
ad
sid
e
En
vir
on
men
t
Ro
ad
way
Ge
om
etr
y
Tra
ffic
Op
era
tio
ns
Dri
ve
r
Ex
pe
cta
tio
n
Dri
ve
r
Be
ha
vio
ur
Iss
ue
(s)
Ad
dre
ss
ed
Ris
k R
ati
ng
1. Increase sign retroreflectivity. $ 1,24 C
2. Increase minimum size of warning signs to 900 mm x 900 mm
$ 1 C
3. Install additional advance warning signs for curves and public intersections
$ 2 C
4. Install overhead flashing beacons at Exits 29 and 29A
$ 2,24 C
5. Increase conspicuity of pavement markings
$ 3,24 C
6. Add reflectors to existing guardrail posts
$ 3,24 C
P a g e | 22
20 March 2015 Opus International Consultants (Canada) Limited
Countermeasure Cost
Ro
ad
wa
y
Vis
ibil
ity
Ro
ad
sid
e
En
vir
on
men
t
Ro
ad
wa
y
Ge
om
etr
y
Tra
ffic
Op
era
tio
ns
Dri
ve
r
Ex
pe
cta
tio
n
Dri
ve
r
Be
ha
vio
ur
Iss
ue
(s)
Ad
dre
ss
ed
Ris
k R
ati
ng
7. Implement 6 foot guard rail post spacing with reflectors
$$ 3 C
8. Install recessed pavement markers to delineate travelled lanes
$$ 3 C
9. Install flexible delineators at 100 m intervals along roadway shoulder
$ 3 C
10. Install chevrons on substandard horizontal curves
$ 3 C
11. Increase delineation at major intersections
$ 4 D
12. Install flexible delineators along the centreline at the east end transition to enhance positive guidance for drivers.
$ 5 D-E
13. Realign current transition between two and four lane section at east end of the corridor
$$$ 5 D-E
14. Relocate utility poles within clear zone $ 6 E-F
15. Flatten slide slopes of intersecting driveways and install culvert end treatments as required
$$ 6 E-F
16. Install energy absorbing crash devices to shield fixed hazards (including guard rail end treatments)
$$ 6 E-F
17. Install additional guard rail to shield fixed hazards roadside slopes
$$ - $$$
6,7 E-F
18. Flatten roadside slopes to 4:1 or less $$$ 7 E-F
19. Minimize vertical drop from edge of travelled lane to gravel shoulder
$ 8 C-D
20. Pave existing gravel shoulders $$$ 9 C-D
21. Reduce number of roadside accesses $ 10 C-D
22. Correct superelevation of substandard horizontal curves
$$ 11 D-E
23. Post Advisory Speed Tabs on horizontal curves with substandard geometry
$ 11 D-E
24. Realign road sections with substandard horizontal curvature
$$$ 11 D-E
P a g e | 23
20 March 2015 Opus International Consultants (Canada) Limited
Countermeasure Cost
Ro
ad
wa
y
Vis
ibil
ity
Ro
ad
sid
e
En
vir
on
men
t
Ro
ad
wa
y
Ge
om
etr
y
Tra
ffic
Op
era
tio
ns
Dri
ve
r
Ex
pe
cta
tio
n
Dri
ve
r
Be
ha
vio
ur
Iss
ue
(s)
Ad
dre
ss
ed
Ris
k R
ati
ng
25. Construct grade separated facility at existing intersections with restricted turn movements
$$$ 12 C-D
26. Construct turning and acceleration lanes at existing intersections with restricted turn movements
$$$ 12 C-D
27. Develop combination warning / guide signs for existing at-grade exits
$ 13 B
28. Add full ramp movements at one of two existing overpass locations with Trunk 4
$$$ 14 C-D
29. Install additional main lane lighting at James River Interchange
$ 15 D
30. Extend opposing climbing lanes to eliminate termination at the same location
$$-$$$
16 D-E
31. Eliminate passing lanes within 400 m of the start of a climbing lane
$ 17 D-E
32. Eliminate passing zones within 2 km of divided highway sections
$ 18 D-E
33. Install wildlife warning signs with flashing amber beacons at 10k intervals
$$ 19 E
34. Install wildlife fencing along corridor $$$ 19 E
35. Install Variable Message Sign at east end of study area corridor
$$ 19,22,24 D-E
36. Remove obsolete signage $ 20 B
37. Construct dedicated left-turn lane into John Munroe Road
$$ 21 D
38. Implement 2+1 cross-section $$$ 23 C-F
39. Install shoulder rumble strips $$ 24 D-E
40. Targeted speed enforcement $ 25 E-F
41. Designate maintenance responsibility to a single county.
$ 26 C-D
42. Targeted brush cutting to improve sightlines
$ 19,27 C-F
Large Impact Moderate Impact Low Impact
$ - $0 to $100,000 $$ - $100,000 to $1 million $$$ - $1 million +
P a g e | 24
20 March 2015 Opus International Consultants (Canada) Limited
6 Safety Improvement Plan
It is unrealistic to expect that all of the countermeasures listed in previous section can be
fully implemented by the Department. This is primarily due to the following factors:
1. The combined cost of fully implementing all improvements is likely to extend beyond
the Department’s available fiscal means;
2. In many instances, two or more countermeasures represent alternate solutions to the
same safety issue; and
Investment in some countermeasures is unlikely to provide a sufficient level of return
when compared with other provincial roadway priorities. Consequently, a scalable
framework is presented in this section to help NSTIR assess and prioritize which
countermeasures make the most sense to fund. The final implementation plan must also
take into account available budgets and the long-term plan for the Highway 104 (neither
of which could be confirmed at the time of this study). Some of the countermeasures may
no longer be applicable once the long-term plan for the corridor has been determined.
Available budgets will not only dictate the level of improvements implemented, but also
the possible timing. Meanwhile, the long-term plan will have a major influence on
prioritizing some of the more costly investments, as NSTIR must consider to what extent
the investment will be salvageable in the future. For example, the long-term benefits of a
major realignment of the highway, or change in the cross-section, will depend on whether
that particular segment is eventually bypassed, twinned, left as is, or abandoned.
To assist the Department, we have grouped potential countermeasures into two categories:
Category 1 Improvements - These countermeasures are considered to be the easiest
to implement in that they are generally low cost, scalable, and require limited
design or planning before implementation (e.g. sign replacement). For the most
part, they are expected to provide value regardless of the long-term plan for the
corridor.
Category 2 Improvements – These countermeasures generally represent more
comprehensive, higher cost improvements that require considerable design
and planning and therefore cannot be implemented immediately. Their
prioritization and feasibility is strongly influenced by the long-term plan for the
corridor.
The following sections provide a “menu” of Category 1 and Category 2 improvements for
NSTIR’s consideration.
P a g e | 25
20 March 2015 Opus International Consultants (Canada) Limited
6.1 Category 1 Improvements
A total of 25 Category 1 Improvements were identified as part of this study. As mentioned
previously, each of these countermeasures is expected to provide value regardless of the
long term plan for the corridor. When prioritizing amongst these improvements, the
Department should consider the associated risk rating of the issue(s) each one addresses.
For example, a countermeasure that addresses an issue with a risk rating of E or higher
would be considered to offer a greater benefit than one with a risk rating of B.
1. Install more prominent warning signs at regular intervals (e.g. every 10 km) along the
corridor to notify drivers about the potential presence of deer and other wildlife. For
added visibility, these signs may be accompanied by flashing amber beacons.
2. Install flexible delineators along the centreline at the east end transition to the divided
section to enhance positive guidance for drivers. The delineators should ideally
commence at a point where the painted median is well established (i.e. greater than 1 m
wide) and be placed along the WB centerline such that the full painted median remains
on the same side of the delineators as the EB lane. This will reduce the risk on drivers
mistakenly crossing over into the opposing lanes.
3. Install curve ahead signs in advance of all horizontal curves hidden by vertical geometry
(e.g. eastbound approach to the horizontal curve located near km 199). While this may
exceed the common practice of signing based exclusively on safe curve speed, it is
expected to offer an incremental safety benefit in instances where the curve visibility is
obstructed.
4. Implement an enhanced brush cutting program along the corridor targeting areas where
sightlines are potentially reduced or obstructed. This includes areas where trees located
in close proximity to the edge of road may limit a driver’s opportunity to perceive and
react to wildlife, and locations where the driver’s view of signage is partially obstructed.
5. Install advance curve ahead signs on all horizontal curves with measured design speeds
below the existing posted speed limit. These may be accompanied chevrons in
accordance with Transportation of Association of Canada guidelines. Candidate
locations noted during the review include km 198.1-198.5 (Barney’s River), km 208.7-
209.7 (James River Interchange), and km 199.3 – 199.8 (east of Barney’s River). This is
considered to be an interim countermeasure until existing roadway geometry can be
improved.
6. Install Advisory Speed Tabs on all horizontal curves with measured design speeds
greater than 15 km/hr below the existing posted speed limit (e.g. horizontal curve
located at James River Interchange).
7. Install overhead Variable Messaging Sign (VMS) at one, or both ends, of the corridor
that can be dynamically programmed to notify drivers of:
P a g e | 26
20 March 2015 Opus International Consultants (Canada) Limited
o Adverse weather conditions – particularly in the Marshy Hope area which regularly
experiences its own microclimate;
o Motor vehicle accidents;
o Road work; and
o Other roadside hazards which may be present.
When none of the above conditions are present, the VMS can be used to remind drivers
that the roadway characteristics are about to change considerably and that they should
adjust their driving behaviours accordingly. Priority should be given to the western end
of the corridor, which abuts to over 700 km of continuous four lane divided highway.
Note: While the cost of VMS can be relatively substantial, the vast majority of this
investment would be considered salvageable as the sign could easily be relocated in the
future.
8. Increase delineation at “major” intersecting roads. As a minimum, this should include
any road with existing directional destination signage along Highway 104 (e.g. Mill
Road, Pushie Road, John Munroe Road). Priority should then be given to roads with the
highest volume of turning traffic from Highway 104. As an example, Object Markers are
used to delineate intersecting roads in New Brunswick.
9. Undertake a thorough assessment of the various types of fixed roadside hazards located
within the clear zone (see list in Table 4-1) and determine in each case whether it is
more cost-effective to a) remove the hazard completely or b) protect drivers from the
hazard. The range of potential countermeasures will vary by location but in many cases
may involve:
o Relocating utility poles;
o Cutting trees;
o Flattening driveway side slopes;
o Installing culvert end treatments;
o Installing energy absorbing crash devices;
o Installing guard rail; and
o Removing unnecessary structures.
There were numerous examples identified during the review, including km 190 in the
eastbound direction (culvert along right edge of road), and km 196 in the eastbound
direction (river).
10. Develop a prioritized plan for identifying locations where existing roadside slopes
steeper than 4:1 should be protected with guard rail. In many locations, installing guard
rail is likely to be more cost-effective than flattening the slopes. This is especially the
P a g e | 27
20 March 2015 Opus International Consultants (Canada) Limited
case in large fill areas. Areas with the deepest slopes should be considered top priority,
particularly those locations with some other type of fixed hazard located nearby (e.g.
drainage structures). Example locations identified during the safety review include km
199.5 in the eastbound direction and km 204 in the eastbound direction.
11. Undertake regular inspection and maintenance of gravel shoulders to ensure that the
vertical drop from the adjacent paved edge of the travelled way does not exceed NSTIR’s
threshold of 100 mm.
12. Undertake an assessment of existing private roadside accesses to determine which (if
any) may potentially be eliminated. This exercise should be repeated every few years to
capture changing circumstances.
13. Install additional lighting on the main lanes at the James River interchange to enhance
the nighttime visibility of the main through movement.
14. Eliminate passing zones within 400 meters of the start of a climbing lane.
15. Eliminate passing zones within 2 km of divided highway sections.
16. Undertake a review of the maintenance practices along the corridor to ensure
consistency. Specifically, winter maintenance activities should be consistent. One
approach would be to have one county responsible for the entire corridor.
17. Implement a targeted speed enforcement program on corridor segments where
excessive vehicle speeds are known to be most prevalent (e.g. km 180 – 188 between
Telford and Broadway).
18.
19. Establish an inventory and assess the retroreflective properties of all existing signage
along the corridor. Develop a prioritized plan to replace existing signage with ASTM
Type IV “High Intensity” sheeting or higher. Warning signs should be considered top
priority, followed by guide signs and regulatory signs. NSTIR may also wish to consider
increasing the size of warning signs to at least 900 mm x 900 mm to make them more
visible. (Note: current sign sizes do meet minimum recommended guidelines).
20. Adopt 6 foot guardrail post spacing with reflectors for all current and future guard rail
installations.
21. Add reflectors to existing guardrail posts.
22. Install higher reflective pavement markings along the corridor centerline, lane lanes and
edge lines. Markings should be inspected annually to ensure they maintain desired
levels of retro-reflectivity. In addition, recessed pavement markers can be used as a
P a g e | 28
20 March 2015 Opus International Consultants (Canada) Limited
supplement to better delineate the lane boundaries. While these may be perceived to
present maintenance issues, they have be utilized successfully in PEI.
23. Install flexible white delineators at 100 m intervals between guard rail segments to
better delineate the roadway shoulder. This spacing may be increased along horizontal
curves.
24. Install overhead flashing beacons at Exits 29 and 29A to enhance their visibility to
oncoming motorists.
25. Develop combination warning and guide signs for the two at-grade exits, which are
distinct from those used for grade separated interchanges. The guide sign portion
should follow the same convention as those used for grade separated interchanges,
however there should be an added warning sign indicating the configuration of the at
grade intersection, cross or tee.
26. Undertake a review of all the signage along the corridor and remove any which are
obsolete. An example of obsolete signage may be the school bus stop ahead signs near
km 202.5.
6.2 Category 2 Improvements
A total of 12 Category 2 improvements were identified as part of this study. As mentioned,
additional investigation and planning is required before a prioritized ranking can be
developed. In some instances, such investigations may reveal that a particular
countermeasure is not feasible.
During the prioritization process, countermeasures should also be viewed as a system
rather than in isolation of one another. For example, if a section of road is to be realigned,
it would naturally make sense to simultaneously pave the shoulders, flatten foreslopes,
and install guard rail in conjunction with this realignment.
1. Realign the current transition between the two lane and four lane sections at the east
end of the corridor.
2. Flatten roadside slopes to 4:1 or less in areas where it is determined to be more cost-
effective than installing guard rail.
3. Provide a minimum 2.0 m wide paved shoulder along the study area corridor, and
implement NSTIR’s shoulder rumble strip policy.
4. Realign the horizontal curve at km 198.1-198.5 (Barney’s River) to accommodate a 100
km/h design speed.
5. Correct the superelevation of the curves at km 208.7-209.7 (James River Interchange)
and km 199.3 – 199.8 (east of Barney’s River).
P a g e | 29
20 March 2015 Opus International Consultants (Canada) Limited
6. Undertake a review of all other horizontal curves along the corridor in terms of their
radii and corresponding superelevations using data available from the ARAN studies.
Where feasible, correct the superelevation to 10 km/h above the posted speed on curved
sections where the radius is above minimum thresholds. In the cases where
superelevation correction cannot accommodate an increase of the design speed to 10
km/h above the posted speed, realign the roadway curves with substandard horizontal
radius. Prioritize improvements based on the lowest calculated design speed for
existing conditions.
7. Undertake an assessment of existing intersections with restricted turning movements
and determine if any can be eliminated. For those that cannot be eliminated, construct a
grade separated facility, or convert the intersection to full turning movements with
appropriate lane and lighting upgrades depending on which option yields the highest
cost benefit ratio.
8. Add full ramp movements at one of the two overpass locations with Trunk 4 to reduce
the occurrences of vehicles accessing Highway 104 using non-designated roads.
9. Undertake a review of all the climbing lanes and extend those that terminate where the
speed differential between trucks and other vehicles is greater than 15 km/hr.
10. Undertake a review of all the opposing climbing lanes and extend them as appropriate
to ensure that the opposing zones of influence do not overlap.
11. Provide a left-turn lane from Highway 104 to John Munroe Road, taking into
consideration the presence of school buses.
12. Conduct further investigations to determine whether a 2+1 road cross-section is feasible
in the vicinity Marshy Hope. This would require widening of the existing asphalt surface
by a minimum of 2 m for a flush painted median or 4 m for a physical barrier median.
While a painted median is preferred on segments with frequent roadside access, this is
not the case in Marshy Hope which may make a physical barrier more appropriate. It is
worth noting that physical barriers represent hazards themselves.
P a g e | 30
20 March 2015 Opus International Consultants (Canada) Limited
7 Summary of Key Findings
Key findings from the study are summarized below:
The rates of property damage and injury collisions within the study area are in fact
lower when compared to the provincial average for similar two lane arterial
highways across Nova Scotia. However, the rate of fatal collisions is higher.
75% of collisions involved only a single vehicle. These types of collisions are
unlikely to be impacted by a divided highway.
Based on the findings of collision analysis, stakeholder consultations, and in-
service review, the study team identified 27 different “issues” along the
Highway 104 corridor that could negatively impact traffic operations and/or road
user safety. Each issue was subsequently assigned a Risk Rating that takes into
account the likelihood of a collision and severity.
Using the list of identified safety issues as a guide, a “menu” of 42 different
safety countermeasures were identified by the study team that have potential
suitability for Highway 104. Order of magnitude costs were provided for each,
which ranged from very low cost improvements (e.g. sign replacement) to very
high cost improvements (e.g. roadway realignments).
Recommendations were provided surrounding the implementation of each
countermeasure. However, the final implementation plan must also take into
account available budgets and the long term plan for the Highway 104 corridor.
To further assist the Department with the development of the implementation
plan, potential countermeasures were group into two categories:
o Category 1 Improvements - These countermeasures are considered to
be the easiest to implement in that they are generally low cost, scalable,
and require limited design or planning before implementation (e.g.
sign replacement). For the most part, they are expected to provide value
regardless of the long-term plan for the corridor.
o Category 2 Improvements – These countermeasures generally
represent more comprehensive, higher cost improvements that
require considerable design and planning and therefore cannot be
implemented immediately. Their prioritization and feasibility is
strongly influenced by the long-term plan for the corridor.
Overall, there appear to be many opportunities for the Department make
incremental improvements to road safety until such time that the study area is
upgraded to a divided four lane facility.
20 March 2015 Opus International Consultants (Canada) Limited
Appendix A – Study Terms of Reference
1.0 Background
Trans Canada Highway 104 from Sutherland’s River to Antigonish is a two lane controlled
access highway with climbing lanes approximately 38 km in length. Average annual daily
traffic volumes range between 6,800 to 10,700. TCH 104 is considered part of the “core”
of the designated National Highway System.
The increasing traffic demand has been recognized by the Nova Scotia Department of
Transportation and Infrastructure Renewal (NSTIR). This section of TCH 104 has received
some media attention due to concerns over collisions and fatalities that have been raised
by a local fire chief. Expansion of the existing highway to a four lane divided facility from
Sutherland’s River to Antigonish is being planned although it is not yet part of the five year
plan.
The programming for any future upgrading will be phased and dependent upon priorities
and the allocation of available funding from the Federal and Provincial governments, as
well as satisfaction of governing environmental regulations.
2.0 Objective
The primary objective of this study is to complete a safety review of TCH 104, from
Sutherland’s River to Antigonish, including identification of the current and
projected operational and safety deficiencies and recommendations for practical
short and medium term engineering, education, management and law enforcement
strategies to ensure preservation of an acceptable level of service and safety
performance.
This project involves the development of a safety improvement plan that will ensure
satisfactory safety performance levels will be maintained on this two lane section until
roadway upgrading to a 4 lane divided facility becomes a reality.
The study should consider, but not be limited to, strategies in the following areas:
11. Design & design standards changes
12. Safety counter measures
13. Geometric improvements
14. Traffic control
15. Enforcement
16. Education
17. Access management
18. Intersection replacement
19. Twinning
20 March 2015 Opus International Consultants (Canada) Limited
20. Passing lanes / 2+1 roads
3.0 Duties of the Consultant
Meet with the project management team as per the schedule specified in Section 6.0
(Meetings and Reports).
Become familiar with the study area, including: existing highway infrastructure; horizontal
and vertical alignment; and traffic composition.
Review safety concerns received by the Department from the public and recorded in the
media. Consult local NSTIR Area Managers, Construction Manager, Operation
Supervisors, District Traffic Supervisor(s), local fire departments, and RCMP and school
boards.
Establish and project (20 year horizon) the traffic volumes and composition characteristics.
In this type of study normal practice would be to document and analyze the recent 10 year
collision history (for trends, patterns and primary contributory factors) and perform
comparative analyses with highways of similar classification. The consultant is advised
that the availability to query and report on the collision database from 2007 to present is
limited. Highway and section numbers have been attached to all 100 Series Highway
collision records but the data has yet to be edited and / or verified. Pre 2007 provincial
collision data is available.
Document the description of the road geometry including the extent and location of passing
opportunities and climbing lanes; access locations contributing to road safety deficiencies;
condition of roadside hardware (signs, guardrail and overhead lighting); the road surface
condition with respect to surface distress, rutting and drainage. Document and evaluate
current geometric design, traffic control and maintenance standards, practices and
procedures. This may be supplemented by the use of NSTIR’s ARAN data.
Document current law enforcement programs, levels and regulatory framework.
Identify current and projected safety deficiencies and practical short term (1 to 5 years)
and medium term (5 to 10 years) engineering, education, management and enforcement
countermeasure recommendations.
The recommendation summary should include an implementation schedule, expected
benefits and cost estimate.
Prepare a final report that documents study purpose, procedures, assumptions, findings,
conclusions, recommendations and action plan for a 20 year horizon period pertinent to
20 March 2015 Opus International Consultants (Canada) Limited
understanding the methods and results. The final report should include a graphical
representation of findings.
Present the study findings to project management team and Department executive.
4.0 Duties of the Department
Meet with the consultant on an arranged schedule.
Provide the consultant with copies of available plans of the existing TCH 104; design plans
for upgrading or twinning where available; time frame and nature of other future changes;
traffic collision records where available; maintenance standards, practices and procedures;
historical traffic volumes; data from the Automated Road Analayzer (ARAN) program;
and recent public correspondence concerning the safety of the proposed highway.
5.0 Guidance
A project management team will administer the technical and analytical work of the
consultant. The team will consist of representatives from NSTIR. The consultant will report
to the project management team chair, responsible for overall administration of the study.
Acceptance and approval of the work will take place after the project management team
has been satisfied that the requirements, as specified in the contract, have been met.
6.0 Meetings and Reports
The Consultant shall meet with the project management team for the project initiation, an
interim meeting and other meetings as required during the duration of the project. All
meetings will be held at NSTIR’s offices, Johnston Building, Granville St., in Halifax,
Nova Scotia. The Consultant shall also make an oral presentation to the project
management team and TIR executive within 14 days of submission and acceptance of the
final report. The initial meeting with the consultant will be to finalize the study
requirements, data requirements, methodologies to be used and time frame for completion.
The consultant shall provide 10 bound copies and one unbound copy of the final report.
All copies of final report shall be on letter size paper and appropriately titled. The font used
shall be Times New Roman 12 and the text shall have full justification. . The final report
shall include an executive summary and a list of references. The final report shall contain
the Terms of Reference attached as an appendix.
An electronic draft final report in PDF for the study must be submitted along with an oral
presentation for comment and possible amendments before the final version is submitted.
Required copies of the draft final report shall be submitted 5 working days prior to the
final meeting.
20 March 2015 Opus International Consultants (Canada) Limited
7.0 Study Schedule
The study shall be completed and the required copies of the final report presented within
four months of award of contract. The ability of the consultant to commit the necessary
resources to complete the required work in a short time frame will be an important
consideration in the evaluation of proposals. The consultant shall schedule the initial
meeting with the project management team within two weeks of notification of award of
contract.
8.0 Ownership of Information
The consultant agrees that all information collected, materials gathered and reports
produced shall be the property of the Province of Nova Scotia. The consultant shall not be
permitted to publish or in any way use said information without the expression or prior
approval of NSTIR.
All documents, including proposals, submitted to the Province are subject to disclosure
under the Nova Scotia Freedom of Information and Protection of Privacy Act. By
submitting a proposal the proponent thereby agrees to public disclosure of its contents.
Any information the proponent considers 'personal information' because of its proprietary
nature should be marked as "confidential", and will be subject to appropriate consideration
as defined within the Nova Scotia Freedom of Information and Protection of Privacy Act.
Information pertaining to this competition or any Department obtained by the proponent as
a result of participation in this project is confidential and must not be disclosed without
written authorization from the Province.
9.0 Consultant Expertise/Eligibility
The consultant’s project team shall be multi-disciplinary. Members shall have experience
and knowledge in the areas of driver behaviour, public education, road safety
reviews/audits, highway design and operation, traffic management, and road
construction/maintenance. The engineering principal shall be a registered member of the
Association of Professional Engineers of Nova Scotia (APENS).
Prospective proponents are not eligible to submit a proposal if current or past corporate or
other interests may, in the Province's opinion, give rise to a conflict of interest in connection
with this project.
The successful proponent may be required to demonstrate financial stability and may be
required to register to conduct business in Nova Scotia.
20 March 2015 Opus International Consultants (Canada) Limited
10.0 Proposal Requirements
Six copies of your proposal (fax copies are not acceptable) are to be delivered by 10:00 am
local time, October 15, 2014 to:
NS Transportation & Infrastructure Renewal
Johnston Building Reception Desk
1672 Granville Street
Halifax, NS
B3J 3Z8
Proposals and their envelopes should be clearly marked with the name and address of the
proponent, the Request for Proposal number, and the project or program title. Late
proposals will not be accepted and will be returned to the proponent.
Proponents are solely responsible for their own expenses in preparing, delivering or
presenting a proposal and for subsequent negotiations with the Province, if any. Proposals
must be open for acceptance for at least 90 days after the closing date. Upon acceptance,
prices will be firm for the entire contract period unless otherwise specified.
Project proposals shall contain the following information.
A detailed work plan, including intended approach and methodology for the study, with
respective time frames to permit progress monitoring.
A list of all information and data sources available to the consultant and expected to be
used in the study.
A summary of company and project member experience in areas related to these terms of
reference.
The proposed consultant team, including a curriculum vitae for all team members.
Professional engineering staff must be licensed to practice in the Province of Nova Scotia.
Number of person-days for each team member by task assigned to the project. For
consistency, the basis of remuneration will be per 8 hour day for all team members.
A breakdown of the total costs to undertake the project (to be separately sealed in an
envelope and attached to the proposal) including labour costs, related expenses, printing
costs and professional services obtained outside of the firm. In order to assess level of
effort, time commitments for all team members (excluding labour costs) shall be included
in the main body of the proposal. Prices quoted are to be in Canadian dollars and exclusive
of federal and provincial taxes.
20 March 2015 Opus International Consultants (Canada) Limited
A list of client references.
All Metric units where possible.
By submitting a proposal, the proponent warrants that all components required to deliver
the services requested have been identified in the proposal or will be provided by the
Consultant at no additional charge. The proposal must be signed by the person(s)
authorized to sign on behalf of the proponent and to bind the proponent to statements made
in response to this Request for Proposal.
11.0 Extra Work
The consultant may be required to undertake additional work not specified in the contract.
Prior to starting this additional work the consultant shall submit a detailed breakdown of
the costs, including all expenses, to complete the extra work and obtain written approval
from the project management team.
12.0 Request for Proposal Amendments
All proponents will be notified in writing by the Procurement Branch regarding any
changes made to the Request for Proposal or any appendices or any change in the closing
date or time. When these changes occur within five government business days of the close
of the proposal, the proposal closing date may be extended to allow for a suitable number
of bid preparation days between the issuance of the change and the closing date.
13.0 Payment Schedule
The payment for this study will be a lump sum payment upon acceptance of the Final
Report by NSTIR.
The consultant is expected to provide a level of service consistent with a budget of $25,000.
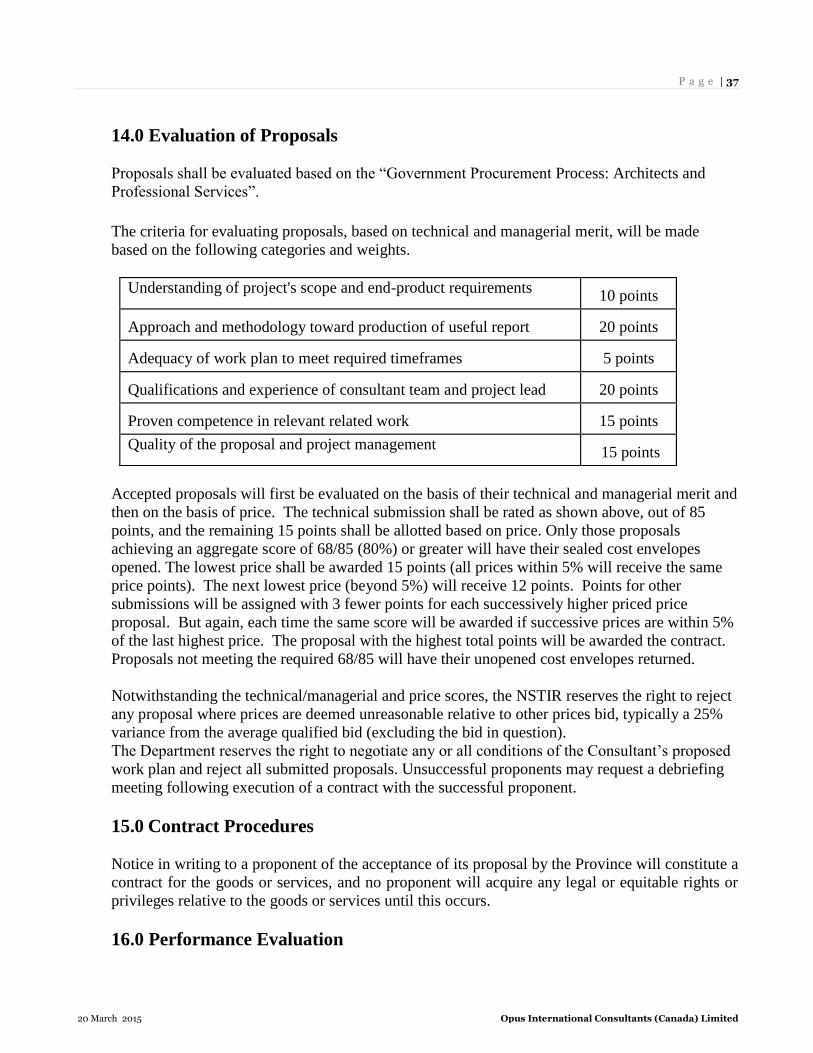
P a g e | 37
20 March 2015 Opus International Consultants (Canada) Limited
14.0 Evaluation of Proposals
Proposals shall be evaluated based on the “Government Procurement Process: Architects and
Professional Services”.
The criteria for evaluating proposals, based on technical and managerial merit, will be made
based on the following categories and weights.
Understanding of project's scope and end-product requirements
10 points Approach and methodology toward production of useful report
20 points
Adequacy of work plan to meet required timeframes
5 points
Qualifications and experience of consultant team and project lead
20 points
Proven competence in relevant related work
15 points
Quality of the proposal and project management
15 points
Accepted proposals will first be evaluated on the basis of their technical and managerial merit and
then on the basis of price. The technical submission shall be rated as shown above, out of 85
points, and the remaining 15 points shall be allotted based on price. Only those proposals
achieving an aggregate score of 68/85 (80%) or greater will have their sealed cost envelopes
opened. The lowest price shall be awarded 15 points (all prices within 5% will receive the same
price points). The next lowest price (beyond 5%) will receive 12 points. Points for other
submissions will be assigned with 3 fewer points for each successively higher priced price
proposal. But again, each time the same score will be awarded if successive prices are within 5%
of the last highest price. The proposal with the highest total points will be awarded the contract.
Proposals not meeting the required 68/85 will have their unopened cost envelopes returned.
Notwithstanding the technical/managerial and price scores, the NSTIR reserves the right to reject
any proposal where prices are deemed unreasonable relative to other prices bid, typically a 25%
variance from the average qualified bid (excluding the bid in question).
The Department reserves the right to negotiate any or all conditions of the Consultant’s proposed
work plan and reject all submitted proposals. Unsuccessful proponents may request a debriefing
meeting following execution of a contract with the successful proponent.
15.0 Contract Procedures
Notice in writing to a proponent of the acceptance of its proposal by the Province will constitute a
contract for the goods or services, and no proponent will acquire any legal or equitable rights or
privileges relative to the goods or services until this occurs.
16.0 Performance Evaluation
P a g e | 38
20 March 2015 Opus International Consultants (Canada) Limited
After the project has been completed the project management team chair will evaluate the
performance of the successful firm. A copy of the performance evaluation will be provided to the
consultant and a debriefing meeting held if requested. The evaluation report will be kept on record
by TIR and used in the assessment of future proposals submitted.
17.0 Inquiries
All enquiries related to this Request for Proposal are to be directed to the following person(s).
Information obtained from any other source is not official and may be inaccurate. Enquiries and
responses may be recorded and may be distributed to all proponents at the Province's option.
Department Contacts: Paul J Smith
Tel: 902-424-3134
E-mail: [email protected]
Michael C Croft
Tel: 902-424-3548
E-mail: [email protected]
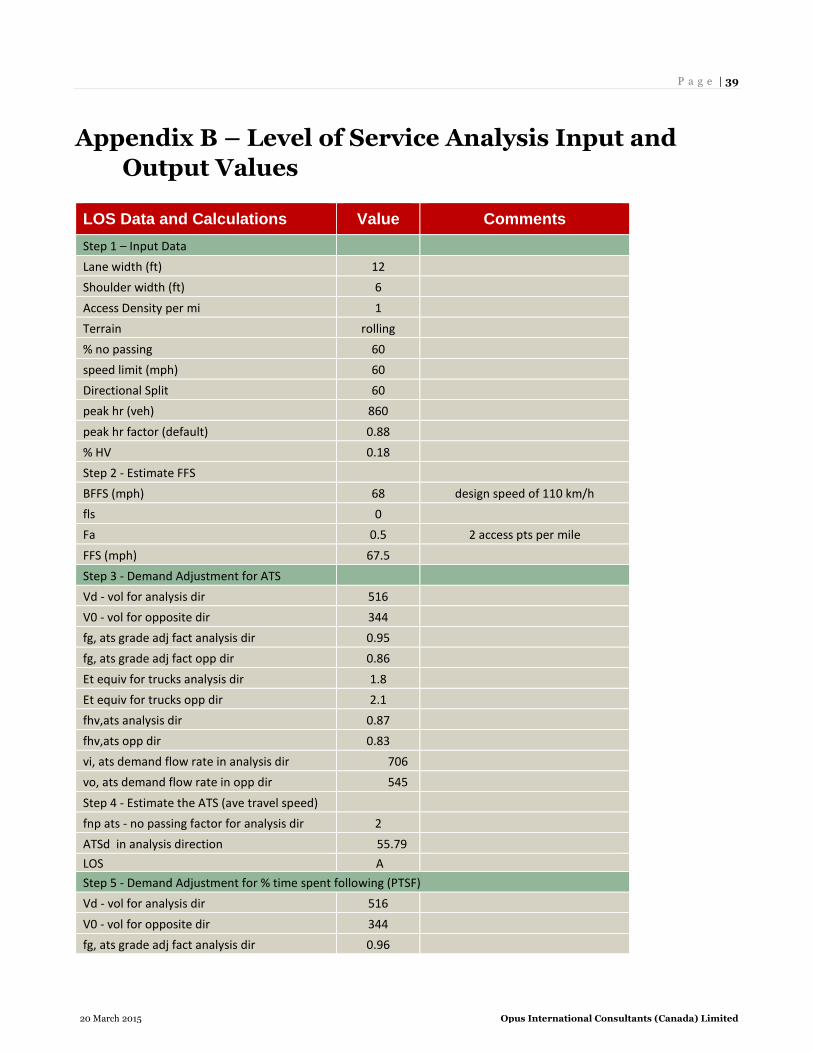
P a g e | 39
20 March 2015 Opus International Consultants (Canada) Limited
Appendix B – Level of Service Analysis Input and
Output Values
LOS Data and Calculations Value Comments
Step 1 – Input Data
Lane width (ft) 12
Shoulder width (ft) 6
Access Density per mi 1
Terrain rolling
% no passing 60
speed limit (mph) 60
Directional Split 60
peak hr (veh) 860
peak hr factor (default) 0.88
% HV 0.18
Step 2 - Estimate FFS
BFFS (mph) 68 design speed of 110 km/h
fls 0
Fa 0.5 2 access pts per mile
FFS (mph) 67.5
Step 3 - Demand Adjustment for ATS
Vd - vol for analysis dir 516
V0 - vol for opposite dir 344
fg, ats grade adj fact analysis dir 0.95
fg, ats grade adj fact opp dir 0.86
Et equiv for trucks analysis dir 1.8
Et equiv for trucks opp dir 2.1
fhv,ats analysis dir 0.87
fhv,ats opp dir 0.83
vi, ats demand flow rate in analysis dir 706
vo, ats demand flow rate in opp dir 545
Step 4 - Estimate the ATS (ave travel speed)
fnp ats - no passing factor for analysis dir 2
ATSd in analysis direction 55.79
LOS A
Step 5 - Demand Adjustment for % time spent following (PTSF)
Vd - vol for analysis dir 516
V0 - vol for opposite dir 344
fg, ats grade adj fact analysis dir 0.96
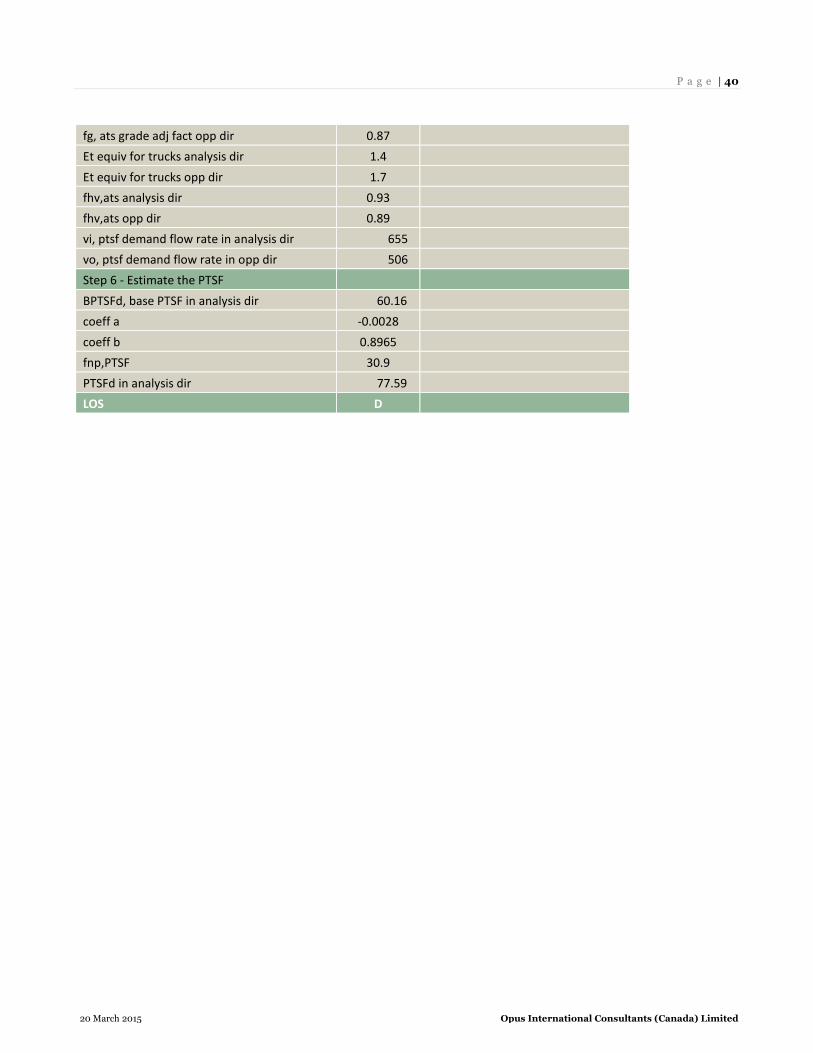
P a g e | 40
20 March 2015 Opus International Consultants (Canada) Limited
fg, ats grade adj fact opp dir 0.87
Et equiv for trucks analysis dir 1.4
Et equiv for trucks opp dir 1.7
fhv,ats analysis dir 0.93
fhv,ats opp dir 0.89
vi, ptsf demand flow rate in analysis dir 655
vo, ptsf demand flow rate in opp dir 506
Step 6 - Estimate the PTSF
BPTSFd, base PTSF in analysis dir 60.16
coeff a -0.0028
coeff b 0.8965
fnp,PTSF 30.9
PTSFd in analysis dir 77.59
LOS D
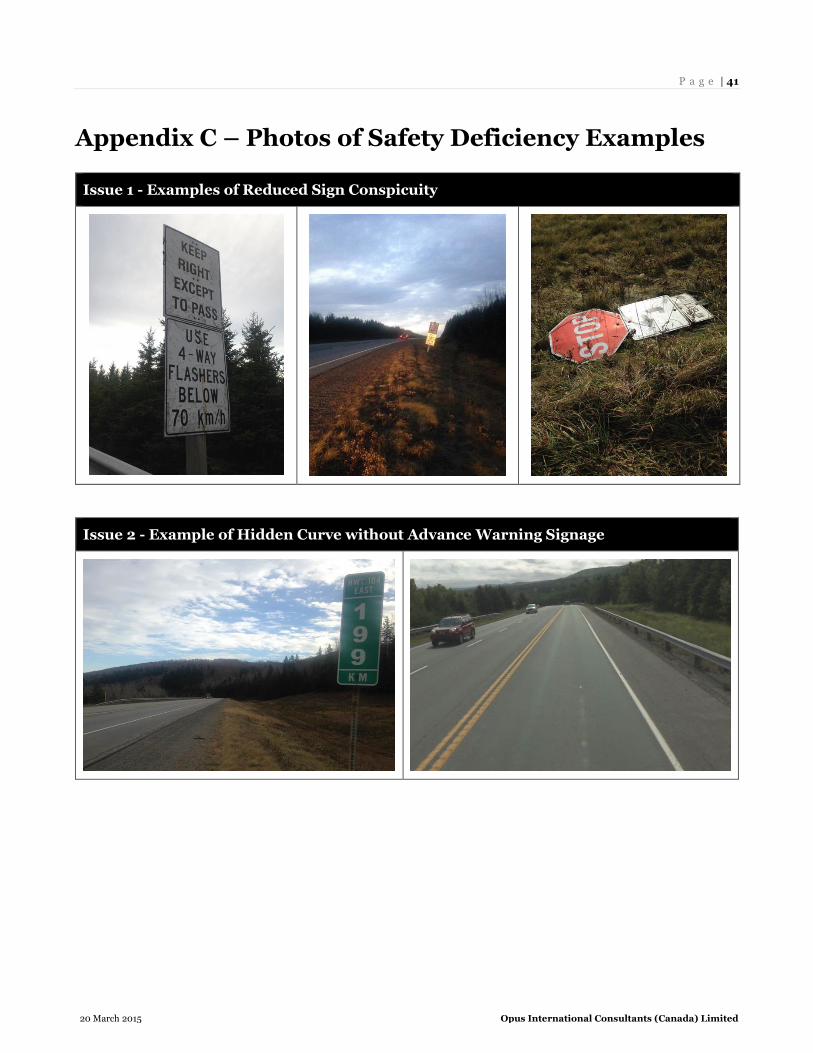
P a g e | 41
20 March 2015 Opus International Consultants (Canada) Limited
Appendix C – Photos of Safety Deficiency Examples
Issue 1 - Examples of Reduced Sign Conspicuity
Issue 2 - Example of Hidden Curve without Advance Warning Signage
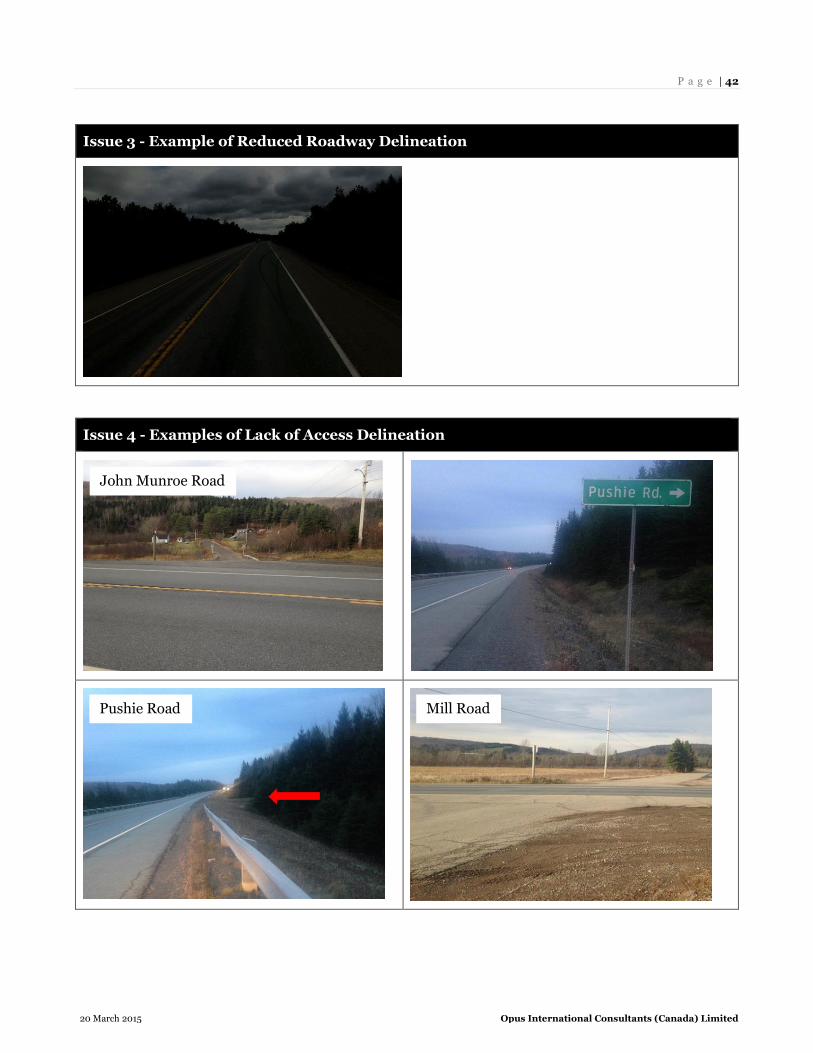
P a g e | 42
20 March 2015 Opus International Consultants (Canada) Limited
Issue 3 - Example of Reduced Roadway Delineation
Issue 4 - Examples of Lack of Access Delineation
Mill Road Pushie Road
John Munroe Road
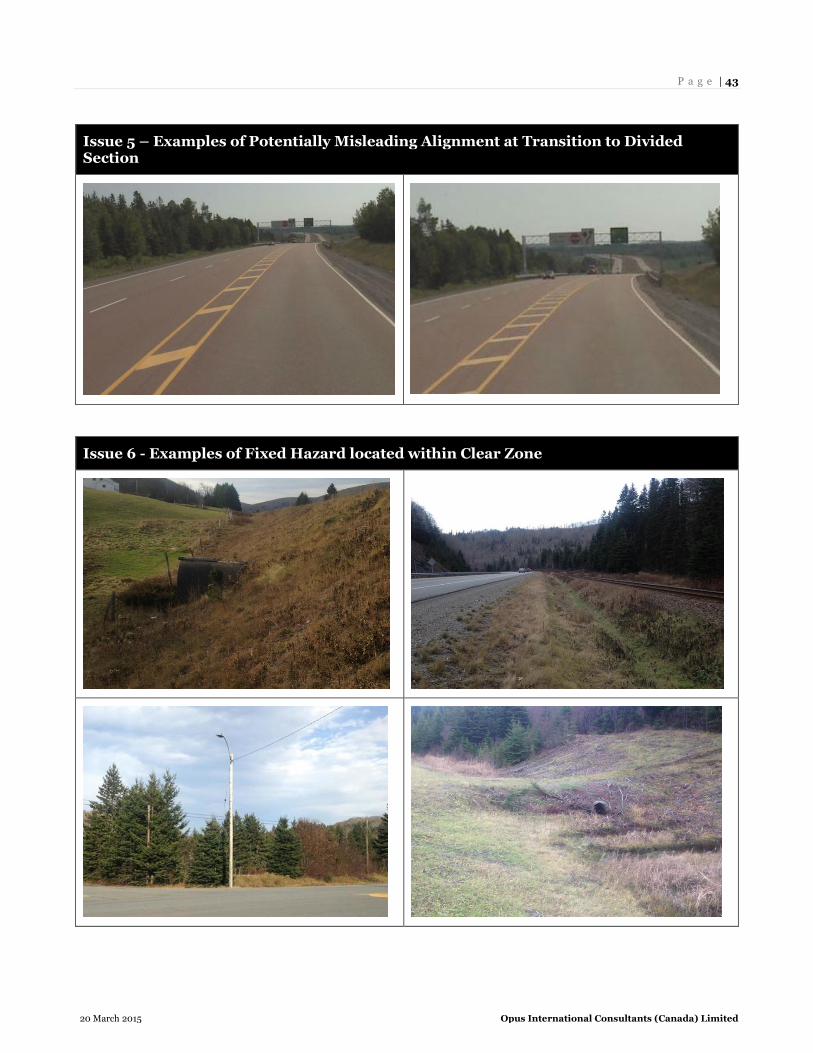
P a g e | 43
20 March 2015 Opus International Consultants (Canada) Limited
Issue 5 – Examples of Potentially Misleading Alignment at Transition to Divided Section
Issue 6 - Examples of Fixed Hazard located within Clear Zone
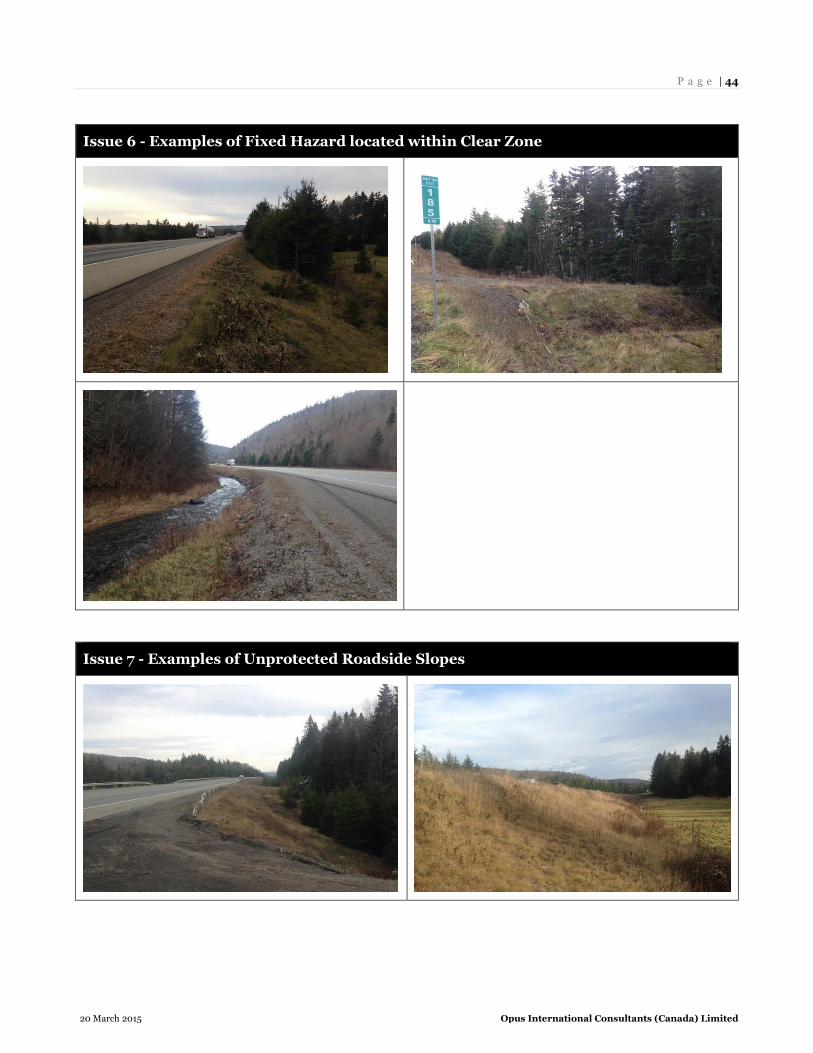
P a g e | 44
20 March 2015 Opus International Consultants (Canada) Limited
Issue 6 - Examples of Fixed Hazard located within Clear Zone
Issue 7 - Examples of Unprotected Roadside Slopes
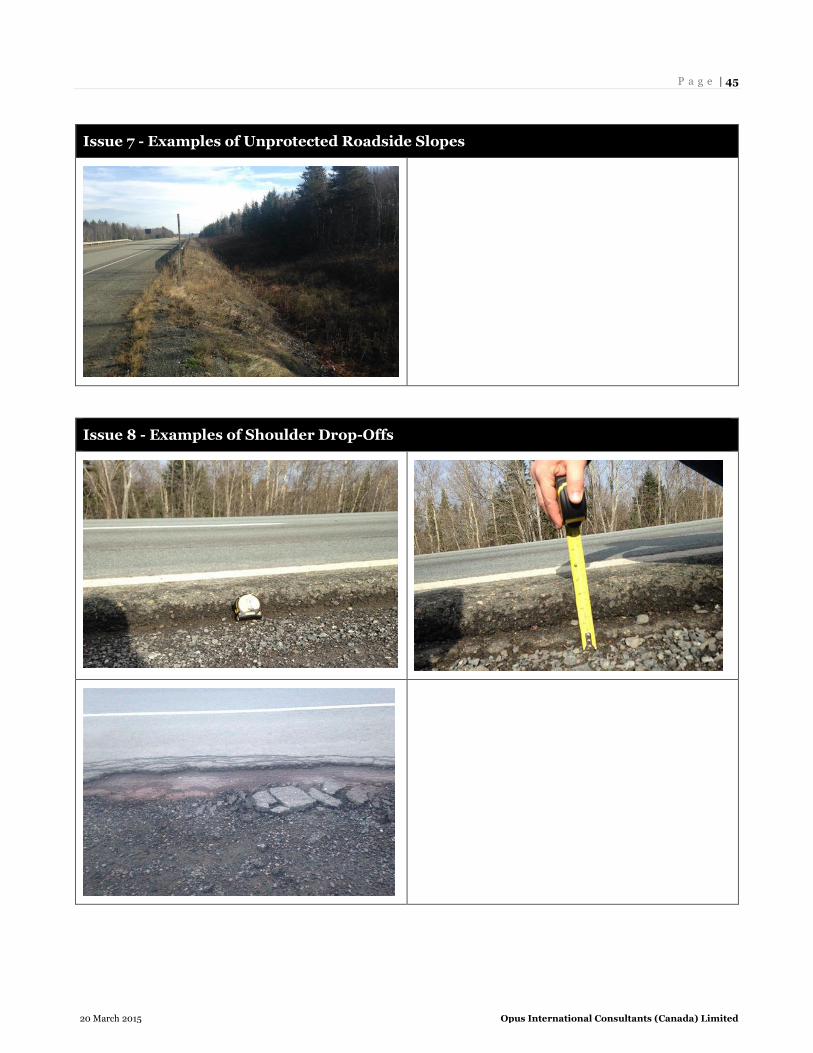
P a g e | 45
20 March 2015 Opus International Consultants (Canada) Limited
Issue 7 - Examples of Unprotected Roadside Slopes
Issue 8 - Examples of Shoulder Drop-Offs
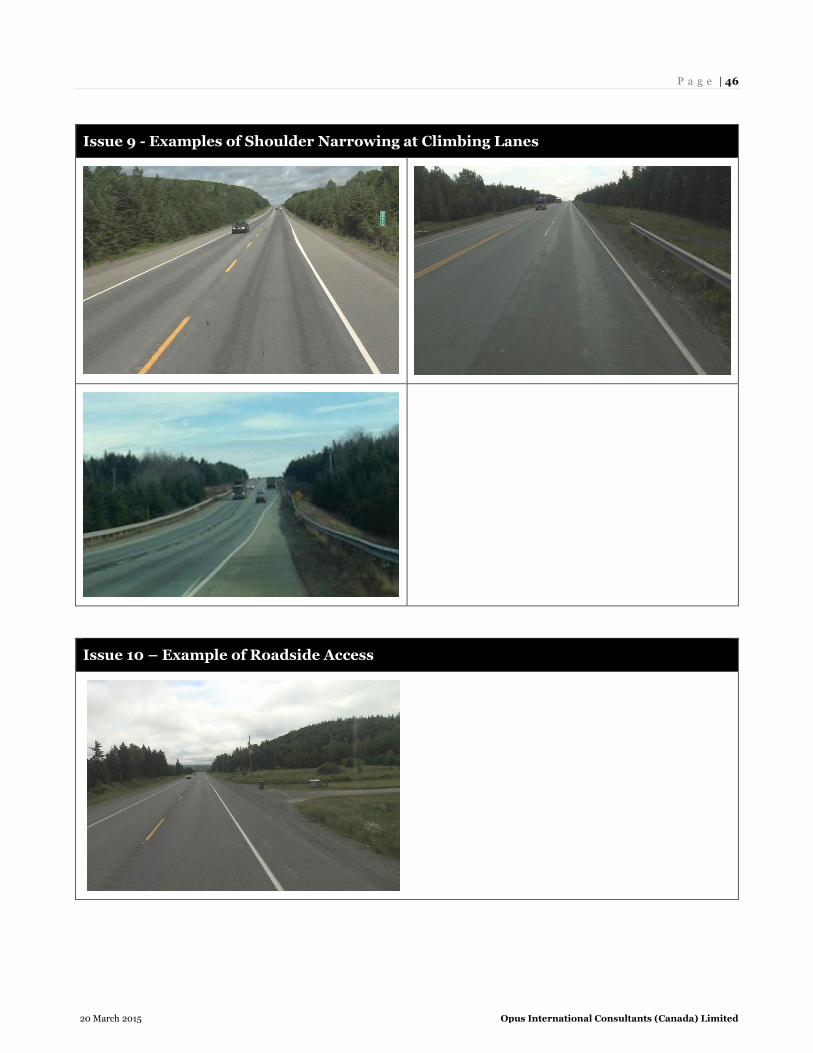
P a g e | 46
20 March 2015 Opus International Consultants (Canada) Limited
Issue 9 - Examples of Shoulder Narrowing at Climbing Lanes
Issue 10 – Example of Roadside Access
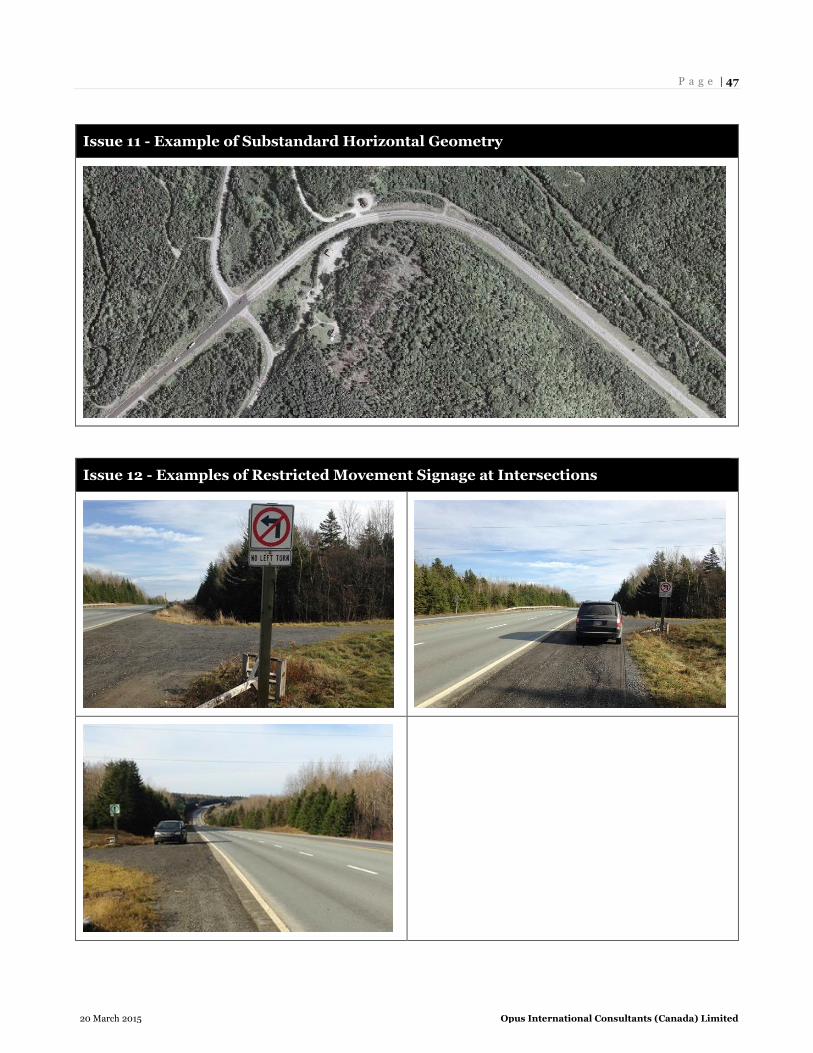
P a g e | 47
20 March 2015 Opus International Consultants (Canada) Limited
Issue 11 - Example of Substandard Horizontal Geometry
Issue 12 - Examples of Restricted Movement Signage at Intersections
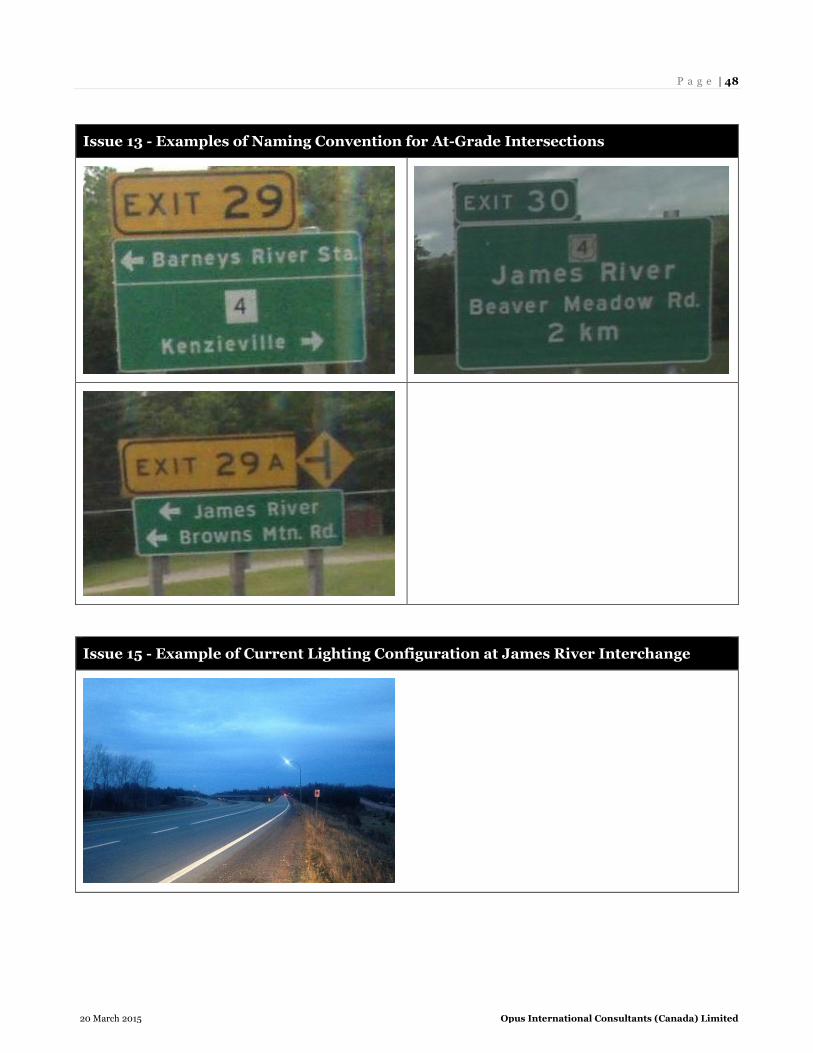
P a g e | 48
20 March 2015 Opus International Consultants (Canada) Limited
Issue 13 - Examples of Naming Convention for At-Grade Intersections
Issue 15 - Example of Current Lighting Configuration at James River Interchange
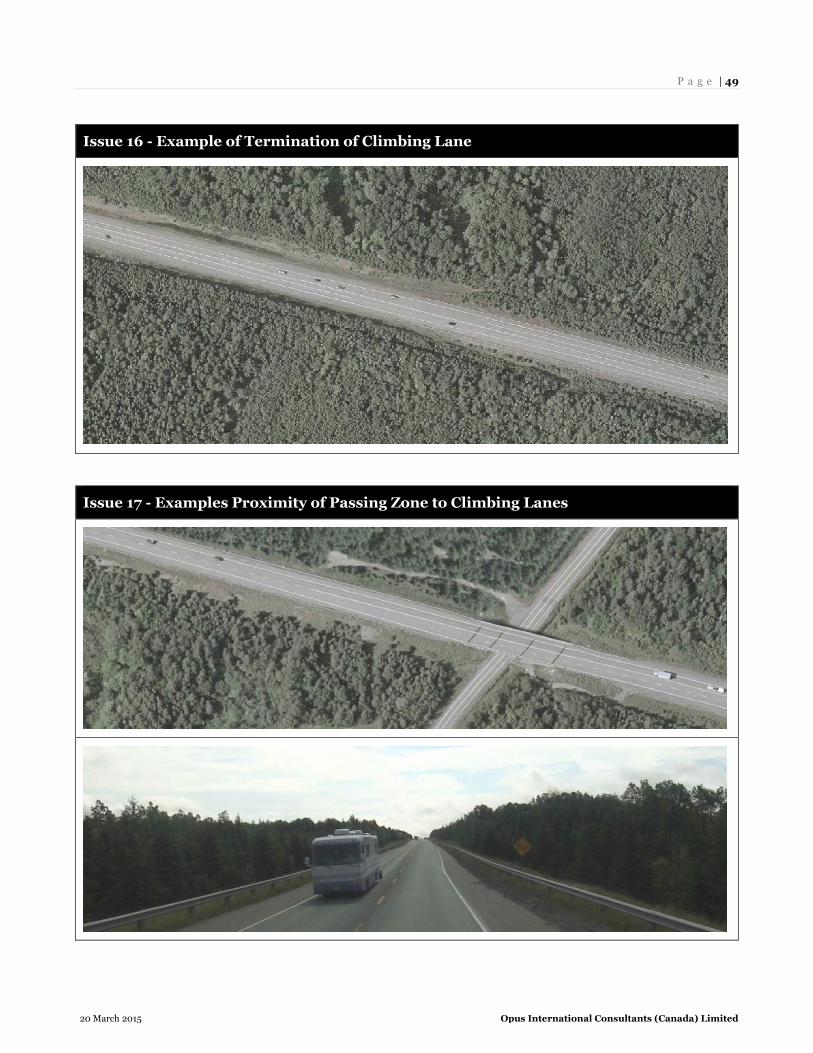
P a g e | 49
20 March 2015 Opus International Consultants (Canada) Limited
Issue 16 - Example of Termination of Climbing Lane
Issue 17 - Examples Proximity of Passing Zone to Climbing Lanes
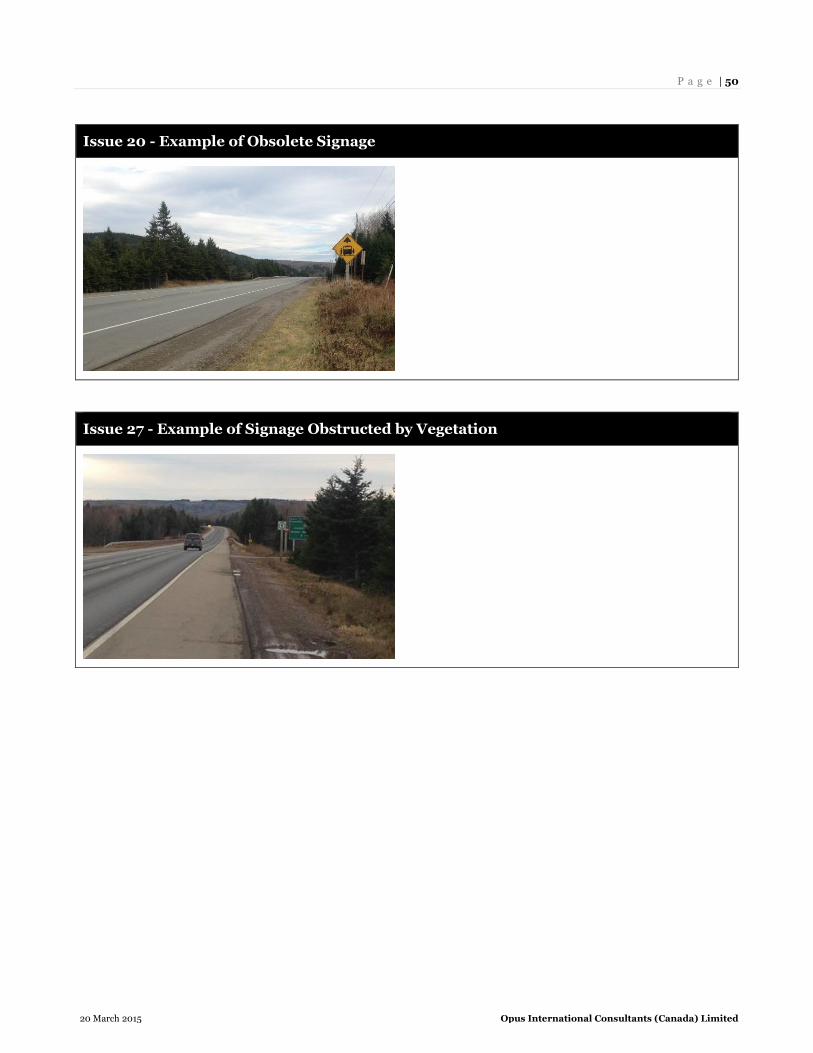
P a g e | 50
20 March 2015 Opus International Consultants (Canada) Limited
Issue 20 - Example of Obsolete Signage
Issue 27 - Example of Signage Obstructed by Vegetation
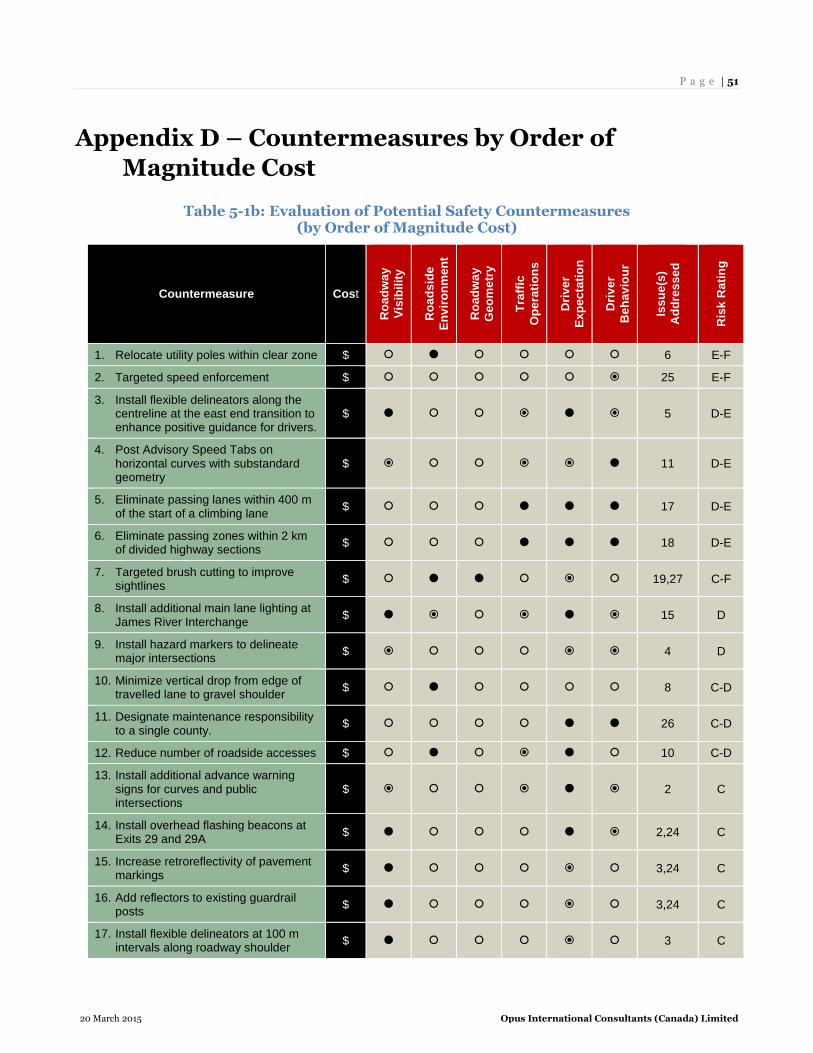
P a g e | 51
20 March 2015 Opus International Consultants (Canada) Limited
Appendix D – Countermeasures by Order of
Magnitude Cost
Table 5-1b: Evaluation of Potential Safety Countermeasures (by Order of Magnitude Cost)
Countermeasure Cost
Ro
ad
wa
y
Vis
ibil
ity
Ro
ad
sid
e
En
vir
on
men
t
Ro
ad
wa
y
Ge
om
etr
y
Tra
ffic
Op
era
tio
ns
Dri
ve
r
Ex
pe
cta
tio
n
Dri
ve
r
Be
ha
vio
ur
Iss
ue
(s)
Ad
dre
ss
ed
Ris
k R
ati
ng
1. Relocate utility poles within clear zone $ 6 E-F
2. Targeted speed enforcement $ 25 E-F
3. Install flexible delineators along the centreline at the east end transition to enhance positive guidance for drivers.
$ 5 D-E
4. Post Advisory Speed Tabs on horizontal curves with substandard geometry
$ 11 D-E
5. Eliminate passing lanes within 400 m of the start of a climbing lane
$ 17 D-E
6. Eliminate passing zones within 2 km of divided highway sections
$ 18 D-E
7. Targeted brush cutting to improve sightlines
$ 19,27 C-F
8. Install additional main lane lighting at James River Interchange
$ 15 D
9. Install hazard markers to delineate major intersections
$ 4 D
10. Minimize vertical drop from edge of travelled lane to gravel shoulder
$ 8 C-D
11. Designate maintenance responsibility to a single county.
$ 26 C-D
12. Reduce number of roadside accesses $ 10 C-D
13. Install additional advance warning signs for curves and public intersections
$ 2 C
14. Install overhead flashing beacons at Exits 29 and 29A
$ 2,24 C
15. Increase retroreflectivity of pavement markings
$ 3,24 C
16. Add reflectors to existing guardrail posts
$ 3,24 C
17. Install flexible delineators at 100 m intervals along roadway shoulder
$ 3 C
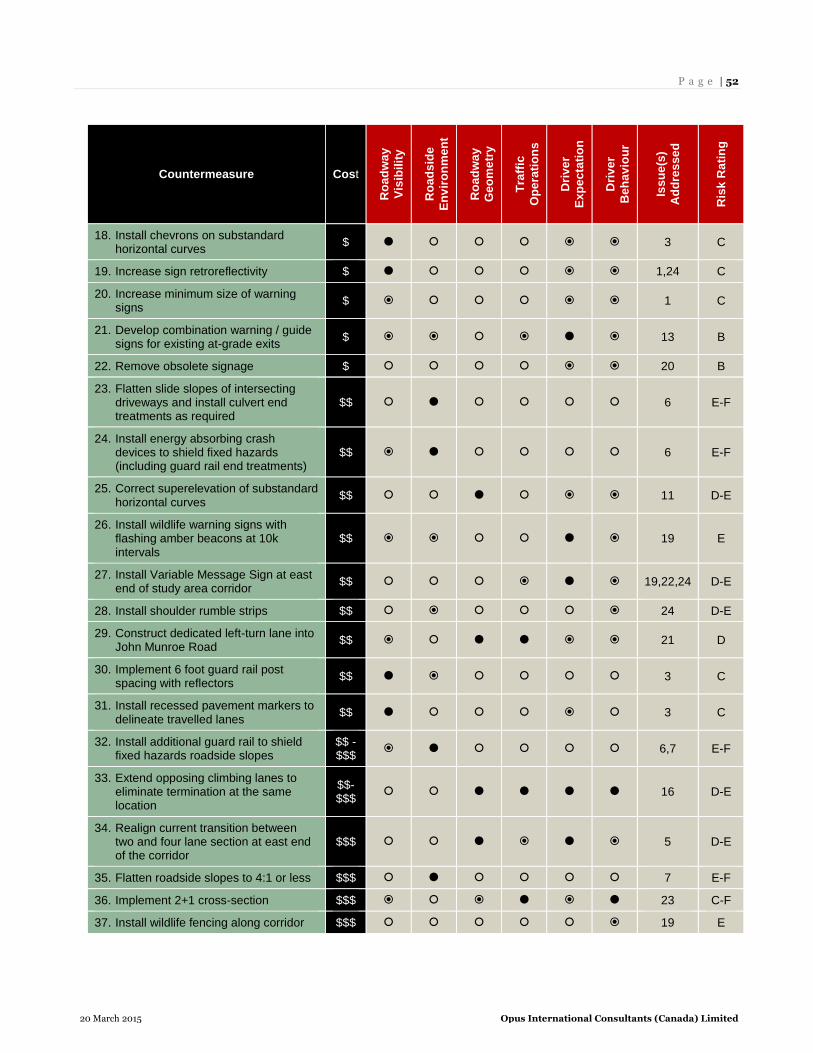
P a g e | 52
20 March 2015 Opus International Consultants (Canada) Limited
Countermeasure Cost
Ro
ad
wa
y
Vis
ibil
ity
Ro
ad
sid
e
En
vir
on
men
t
Ro
ad
wa
y
Ge
om
etr
y
Tra
ffic
Op
era
tio
ns
Dri
ve
r
Ex
pe
cta
tio
n
Dri
ve
r
Be
ha
vio
ur
Iss
ue
(s)
Ad
dre
ss
ed
Ris
k R
ati
ng
18. Install chevrons on substandard horizontal curves
$ 3 C
19. Increase sign retroreflectivity $ 1,24 C
20. Increase minimum size of warning signs
$ 1 C
21. Develop combination warning / guide signs for existing at-grade exits
$ 13 B
22. Remove obsolete signage $ 20 B
23. Flatten slide slopes of intersecting driveways and install culvert end treatments as required
$$ 6 E-F
24. Install energy absorbing crash devices to shield fixed hazards (including guard rail end treatments)
$$ 6 E-F
25. Correct superelevation of substandard horizontal curves
$$ 11 D-E
26. Install wildlife warning signs with flashing amber beacons at 10k intervals
$$ 19 E
27. Install Variable Message Sign at east end of study area corridor
$$ 19,22,24 D-E
28. Install shoulder rumble strips $$ 24 D-E
29. Construct dedicated left-turn lane into John Munroe Road
$$ 21 D
30. Implement 6 foot guard rail post spacing with reflectors
$$ 3 C
31. Install recessed pavement markers to delineate travelled lanes
$$ 3 C
32. Install additional guard rail to shield fixed hazards roadside slopes
$$ - $$$
6,7 E-F
33. Extend opposing climbing lanes to eliminate termination at the same location
$$-$$$
16 D-E
34. Realign current transition between two and four lane section at east end of the corridor
$$$ 5 D-E
35. Flatten roadside slopes to 4:1 or less $$$ 7 E-F
36. Implement 2+1 cross-section $$$ 23 C-F
37. Install wildlife fencing along corridor $$$ 19 E
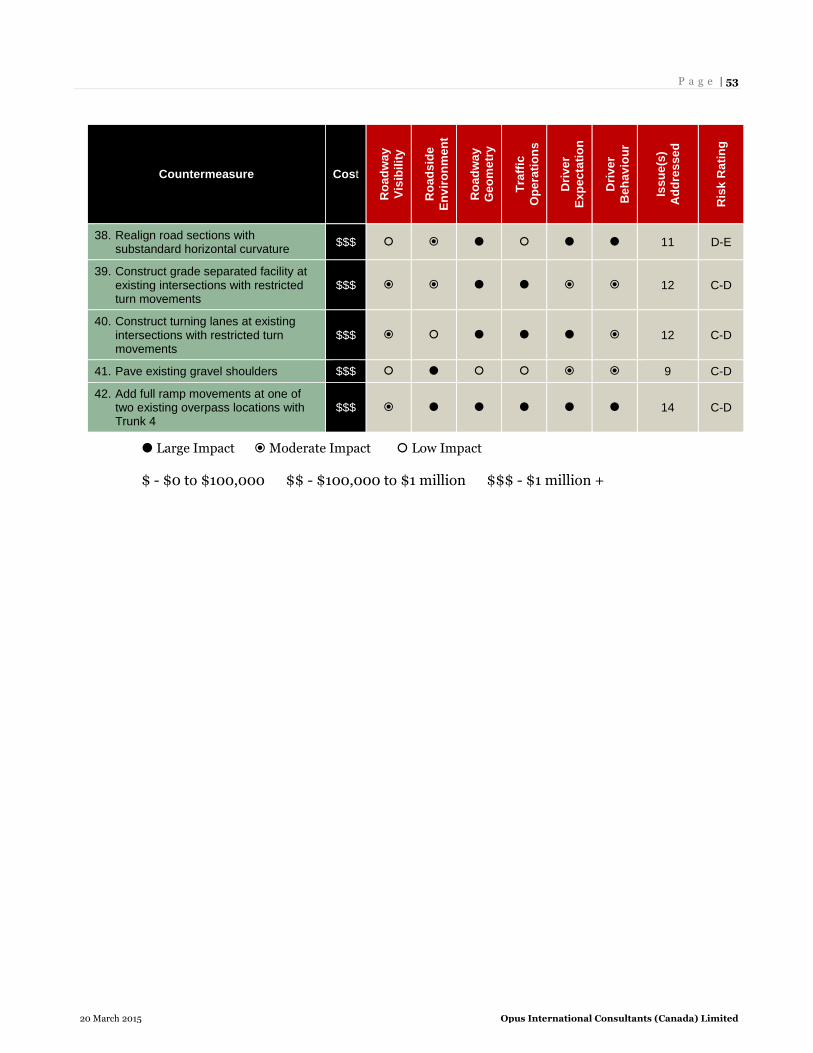
P a g e | 53
20 March 2015 Opus International Consultants (Canada) Limited
Countermeasure Cost
Ro
ad
wa
y
Vis
ibil
ity
Ro
ad
sid
e
En
vir
on
men
t
Ro
ad
wa
y
Ge
om
etr
y
Tra
ffic
Op
era
tio
ns
Dri
ve
r
Ex
pe
cta
tio
n
Dri
ve
r
Be
ha
vio
ur
Iss
ue
(s)
Ad
dre
ss
ed
Ris
k R
ati
ng
38. Realign road sections with substandard horizontal curvature
$$$ 11 D-E
39. Construct grade separated facility at existing intersections with restricted turn movements
$$$ 12 C-D
40. Construct turning lanes at existing intersections with restricted turn movements
$$$ 12 C-D
41. Pave existing gravel shoulders $$$ 9 C-D
42. Add full ramp movements at one of two existing overpass locations with Trunk 4
$$$ 14 C-D
Large Impact Moderate Impact Low Impact
$ - $0 to $100,000 $$ - $100,000 to $1 million $$$ - $1 million +
Recommended