Embed Size (px)
Citation preview
Have you seen thesehighway safety laws?
2016 R
oadmap of State
Highw
ay Safety Laws
SafeRoads.org
2016 R
oadmap of State
Highw
ay Safety Laws
SafeRoads.org
2016 R
oadmap of State
Highw
ay Safety Laws
SafeRoads.org
2016 R
oadmap of State
Highw
ay Safety Laws
SafeRoads.org
2016 R
oadmap of State
Highw
ay Safety Laws
SafeRoads.org
2016 R
oadmap of State
Highw
ay Safety Laws
SafeRoads.org
2016 R
oadmap of State
Highw
ay Safety Laws
SafeRoads.org
2016 R
oadmap of State
Highw
ay Safety Laws
SafeRoads.org
Abandoned or repealed by state legislatures:Seat Belts • Impaired Driving • Distracted Driving • Motorcycle Helmets
Child Passenger Safety • Teen Graduated Driver Licensing
Elected officials are missing in action while deaths are rising. Can you help?
13TH ANNUAL ROADMAP OF STATE HIGHWAY SAFETY LAWS
Opportunities to Save Lives, Prevent Serious Injuries and Reduce Taxpayer Costs are Ignored or Recklessly Squandered in States and the
Public is Paying the Price
Jacqueline S. Gillan, President
With the release of the 2016 Roadmap of State Highway Safety Laws, Advocates for Highway and Auto Safety (Advocates) sounds the alarm on an expected increase in 2015 motor vehicle crash deaths based on preliminary data by the National Highway Traffic Safety Administration (NHTSA) and anemic leadership by Governors and state legislatures to address this senseless death toll. In short, more people are needlessly dying on our streets and roads while state elected leaders are needlessly delaying enactment of lifesaving laws. The legislative status quo is unacceptable, especially because states have proven safety solutions at hand to curb this public health crisis that causes 33,000 deaths and 2.3 million injuries annually. Laws that address seatbelt and motorcycle helmet use, child passenger safety, teen drivers, alcohol-impairment and distraction offer states real opportunities to reduce crashes, prevent deaths and injuries and save money. Each year motor vehicle crashes impose direct economic costs of $242 billion in medical expenses, lost productivity and other financial burdens spread to all 50 states and the District of Columbia and ultimately borne by every taxpayer. Unfortunately, this year’s Roadmap Report finds that more than 300 optimal laws for all 50 states and the District of Columbia are still lacking. In 2015, there were only eight optimal traffic safety laws passed in only six states. Elected officials in Kentucky, Mississippi, Oklahoma, Texas, Utah and West Virginia are to be commended for enacting important laws this past year. Advocates challenges Governors and state legislators to make 2016 the year of highway safety by advancing the unfinished safety agenda.
Despite climbing highway fatalities, there also have been growing attacks in state legislatures on existing laws that are proven lifesavers and money savers. Last year, there were several state legislatures where bills were seriously considered to repeal or weaken laws for seatbelt and motorcycle helmet use, bans on texting while driving, as well as essential protections for novice teen drivers. These efforts confound logic, commonsense and fiscal responsibility.
When enacted and enforced, the safety laws rated in the Roadmap Report reduce the economic toll on state budgets and the emotional toll on families. Data shows that nationwide seatbelts saved almost 13,000 lives in 2014. Appropriate child restraints saved the lives of over 250 children age four and younger. And, motorcycle helmets saved the lives of almost 1,700 riders. As Governors put forth their legislative priorities and lawmakers begin deliberations on legislation, Advocates urges state leaders to heed the increase in highway deaths and injuries and push for passage of commonsense and cost-effective solutions. Allowing laws that close critical safety gaps to languish or be bottled up or proposing to roll back current safety measures can no longer be the expected or the accepted norm in state capitals. The research and data are clear and compelling—when states pass these essential safety laws, lives are saved. Now is a critical and urgent time for legislative action and accountability.
January 2016 Advocates for Highway and Auto Safety 2
TABLE OF CONTENTS
Glossary of Acronyms ................................................................................................................. 4 Urgent Action Needed to Improve Highway Safety ...................................................................... 5 Safety Laws Reduce Crash Costs ................................................................................................. 6 Legislative Activity in 2015 ......................................................................................................... 7 Key Things to Know about this Report ........................................................................................ 8 Definitions of 15 Lifesaving Laws ............................................................................................... 9 Occupant Protection ................................................................................................................ 11 Primary Enforcement Seat Belt Laws (Front and Rear) .............................................................. 12 All-Rider Motorcycle Helmet Laws ........................................................................................... 14 Occupant Protection Laws Rating Chart ..................................................................................... 16 Child Passenger Safety ............................................................................................................ 17 Booster Seat Laws ..................................................................................................................... 18 Booster Seat Laws Rating Chart................................................................................................. 19 Teen Driving: Graduated Driver Licensing (GDL) Program ................................................ 20 Teen Driving Laws .................................................................................................................... 21 Teen Driving Laws Rating Chart................................................................................................ 23 Impaired Driving ..................................................................................................................... 24 Impaired Driving Laws .............................................................................................................. 25 Ignition Interlock Device (IID) Laws ......................................................................................... 26 Child Endangerment Laws ......................................................................................................... 27 Open Container Laws That Meet Federal Requirements ............................................................. 27 Impaired Driving Laws Rating Chart ......................................................................................... 28 Distracted Driving: All-Driver Text Messaging Restrictions ................................................. 29 All-Driver Text Messaging Restrictions ..................................................................................... 30 All-Driver Text Messaging Restrictions Rating Chart………. .................................................... 31 Overall State Ratings Based on Total Number of Laws ......................................................... 32 Overall State Ratings Chart ........................................................................................................ 34 States at a Glance (See Individual State Index on Page 3) ........................................................... 36 Source Information .................................................................................................................. 48 Acknowledgements .................................................................................................................. 53 About Advocates ...................................................................................................................... 53
3 Advocates for Highway and Auto Safety January 2016
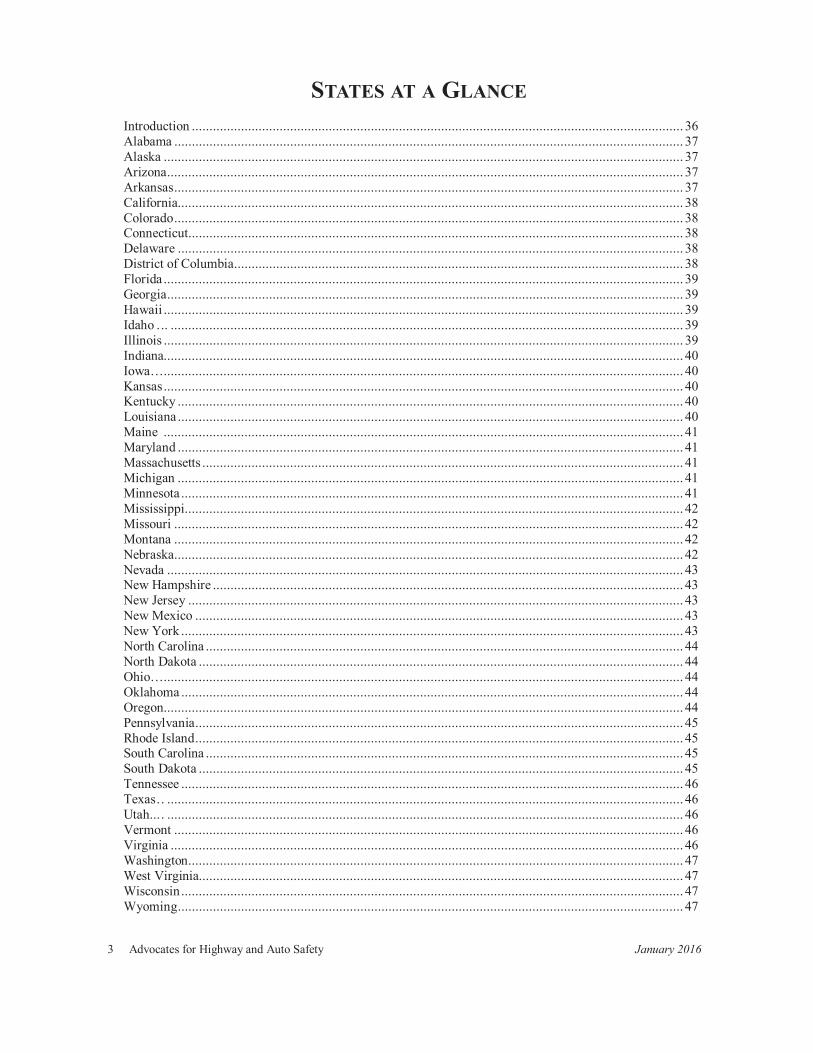
STATES AT A GLANCE Introduction ............................................................................................................................................ 36 Alabama ................................................................................................................................................. 37 Alaska .................................................................................................................................................... 37 Arizona ................................................................................................................................................... 37 Arkansas ................................................................................................................................................. 37 California................................................................................................................................................ 38 Colorado ................................................................................................................................................. 38 Connecticut ............................................................................................................................................. 38 Delaware ................................................................................................................................................ 38 District of Columbia................................................................................................................................ 38 Florida .................................................................................................................................................... 39 Georgia ................................................................................................................................................... 39 Hawaii .................................................................................................................................................... 39 Idaho . .. .................................................................................................................................................. 39 Illinois .................................................................................................................................................... 39 Indiana.................................................................................................................................................... 40 Iowa….................................................................................................................................................... 40 Kansas .................................................................................................................................................... 40 Kentucky ................................................................................................................................................ 40 Louisiana ................................................................................................................................................ 40 Maine .................................................................................................................................................... 41 Maryland ................................................................................................................................................ 41 Massachusetts ......................................................................................................................................... 41 Michigan ................................................................................................................................................ 41 Minnesota ............................................................................................................................................... 41 Mississippi .............................................................................................................................................. 42 Missouri ................................................................................................................................................. 42 Montana ................................................................................................................................................. 42 Nebraska ................................................................................................................................................. 42 Nevada ................................................................................................................................................... 43 New Hampshire ...................................................................................................................................... 43 New Jersey ............................................................................................................................................. 43 New Mexico ........................................................................................................................................... 43 New York ............................................................................................................................................... 43 North Carolina ........................................................................................................................................ 44 North Dakota .......................................................................................................................................... 44 Ohio…. ................................................................................................................................................... 44 Oklahoma ............................................................................................................................................... 44 Oregon.................................................................................................................................................... 44 Pennsylvania ........................................................................................................................................... 45 Rhode Island ........................................................................................................................................... 45 South Carolina ........................................................................................................................................ 45 South Dakota .......................................................................................................................................... 45 Tennessee ............................................................................................................................................... 46 Texas . . ................................................................................................................................................... 46 Utah... . ................................................................................................................................................... 46 Vermont ................................................................................................................................................. 46 Virginia .................................................................................................................................................. 46 Washington ............................................................................................................................................. 47 West Virginia.......................................................................................................................................... 47 Wisconsin ............................................................................................................................................... 47 Wyoming ................................................................................................................................................ 47
January 2016 Advocates for Highway and Auto Safety 4
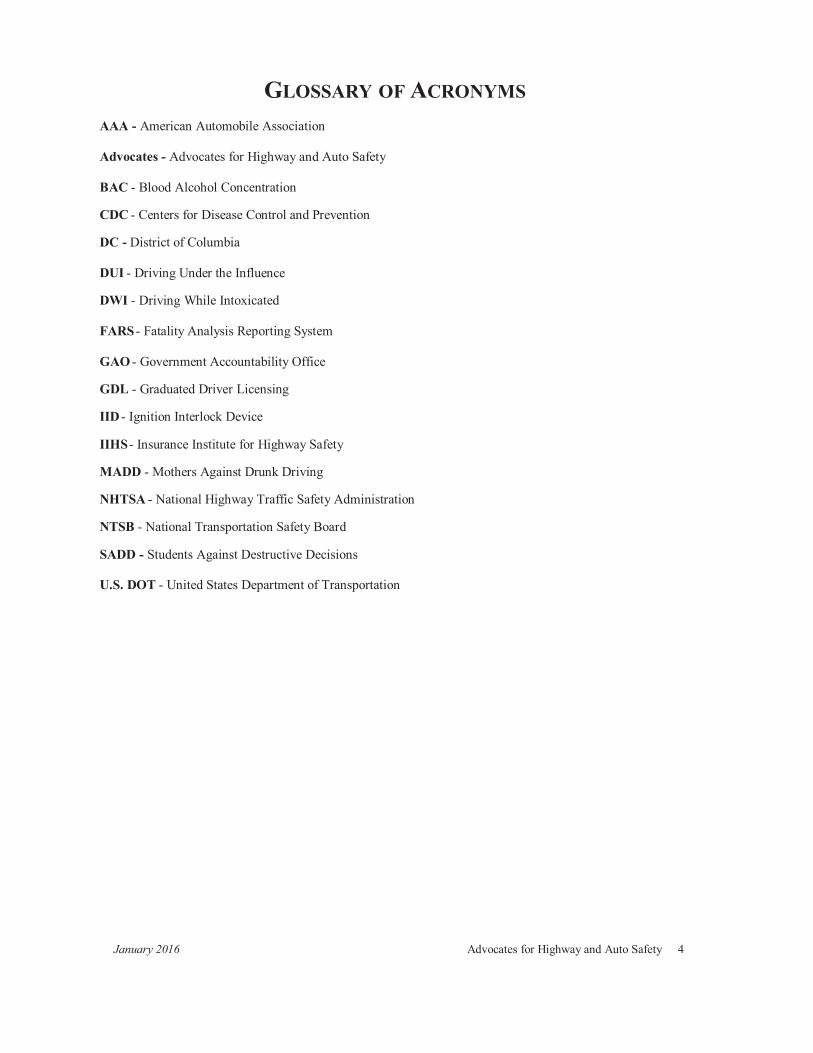
GLOSSARY OF ACRONYMS AAA - American Automobile Association Advocates - Advocates for Highway and Auto Safety BAC - Blood Alcohol Concentration CDC - Centers for Disease Control and Prevention DC - District of Columbia DUI - Driving Under the Influence DWI - Driving While Intoxicated FARS - Fatality Analysis Reporting System GAO - Government Accountability Office GDL - Graduated Driver Licensing IID - Ignition Interlock Device IIHS - Insurance Institute for Highway Safety MADD - Mothers Against Drunk Driving NHTSA - National Highway Traffic Safety Administration NTSB - National Transportation Safety Board SADD - Students Against Destructive Decisions U.S. DOT - United States Department of Transportation
5 Advocates for Highway and Auto Safety January 2016
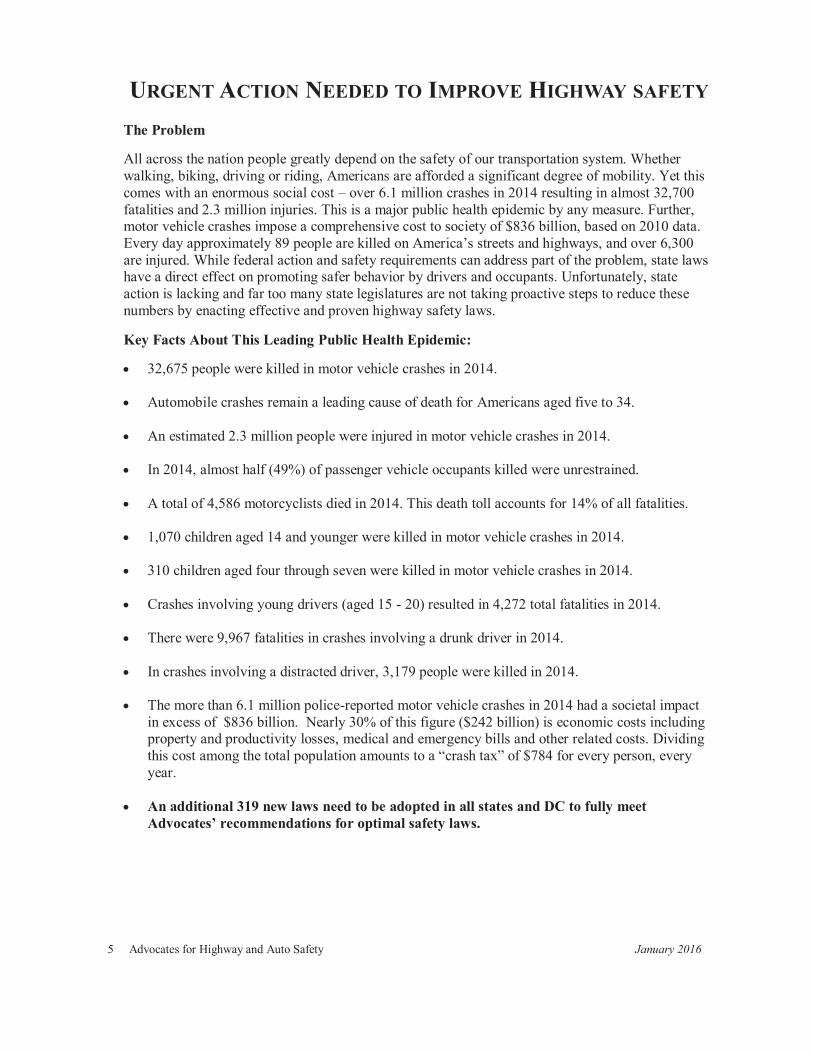
URGENT ACTION NEEDED TO IMPROVE HIGHWAY SAFETY The Problem
All across the nation people greatly depend on the safety of our transportation system. Whether walking, biking, driving or riding, Americans are afforded a significant degree of mobility. Yet this comes with an enormous social cost – over 6.1 million crashes in 2014 resulting in almost 32,700 fatalities and 2.3 million injuries. This is a major public health epidemic by any measure. Further, motor vehicle crashes impose a comprehensive cost to society of $836 billion, based on 2010 data. Every day approximately 89 people are killed on America’s streets and highways, and over 6,300 are injured. While federal action and safety requirements can address part of the problem, state laws have a direct effect on promoting safer behavior by drivers and occupants. Unfortunately, state action is lacking and far too many state legislatures are not taking proactive steps to reduce these numbers by enacting effective and proven highway safety laws.
Key Facts About This Leading Public Health Epidemic:
32,675 people were killed in motor vehicle crashes in 2014.
Automobile crashes remain a leading cause of death for Americans aged five to 34.
An estimated 2.3 million people were injured in motor vehicle crashes in 2014.
In 2014, almost half (49%) of passenger vehicle occupants killed were unrestrained.
A total of 4,586 motorcyclists died in 2014. This death toll accounts for 14% of all fatalities.
1,070 children aged 14 and younger were killed in motor vehicle crashes in 2014.
310 children aged four through seven were killed in motor vehicle crashes in 2014.
Crashes involving young drivers (aged 15 - 20) resulted in 4,272 total fatalities in 2014.
There were 9,967 fatalities in crashes involving a drunk driver in 2014.
In crashes involving a distracted driver, 3,179 people were killed in 2014.
The more than 6.1 million police-reported motor vehicle crashes in 2014 had a societal impact in excess of $836 billion. Nearly 30% of this figure ($242 billion) is economic costs including property and productivity losses, medical and emergency bills and other related costs. Dividing this cost among the total population amounts to a “crash tax” of $784 for every person, every year.
An additional 319 new laws need to be adopted in all states and DC to fully meet Advocates’ recommendations for optimal safety laws.
January 2016 Advocates for Highway and Auto Safety 6
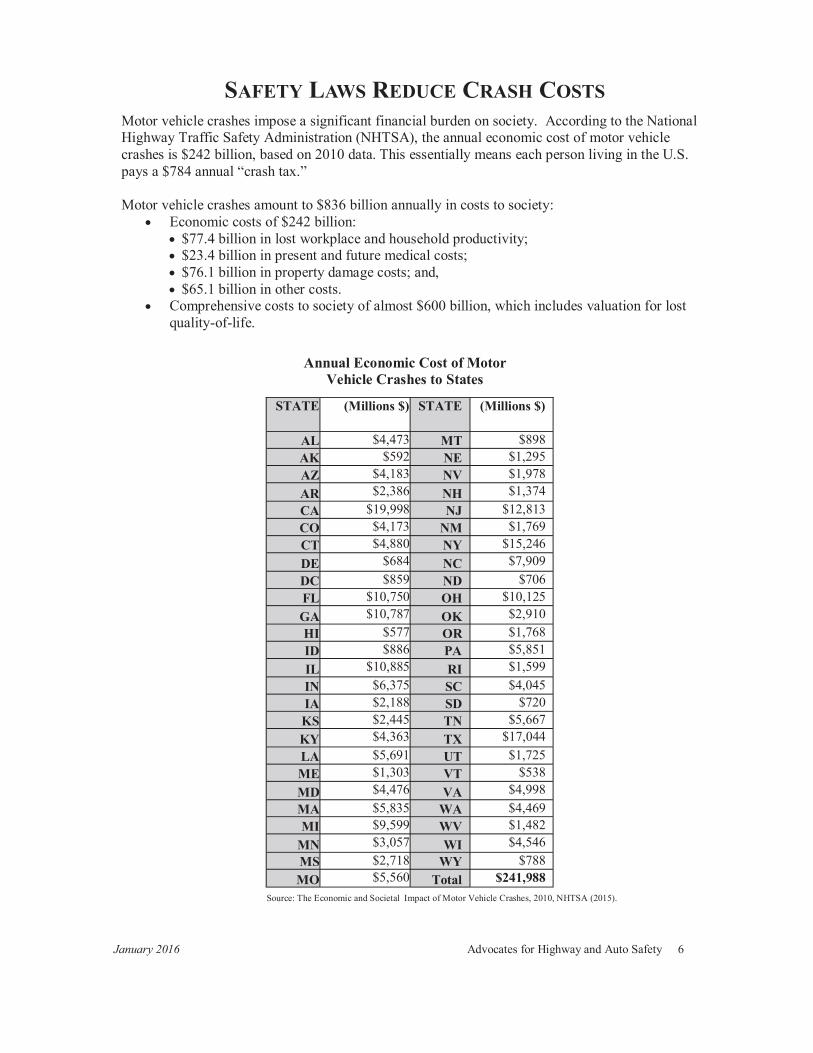
SAFETY LAWS REDUCE CRASH COSTS Motor vehicle crashes impose a significant financial burden on society. According to the National Highway Traffic Safety Administration (NHTSA), the annual economic cost of motor vehicle crashes is $242 billion, based on 2010 data. This essentially means each person living in the U.S. pays a $784 annual “crash tax.” Motor vehicle crashes amount to $836 billion annually in costs to society:
Economic costs of $242 billion: $77.4 billion in lost workplace and household productivity; $23.4 billion in present and future medical costs; $76.1 billion in property damage costs; and, $65.1 billion in other costs.
Comprehensive costs to society of almost $600 billion, which includes valuation for lost quality-of-life.
STATE (Millions $) STATE (Millions $)
AL $4,473 MT $898 AK $592 NE $1,295 AZ $4,183 NV $1,978 AR $2,386 NH $1,374 CA $19,998 NJ $12,813 CO $4,173 NM $1,769 CT $4,880 NY $15,246 DE $684 NC $7,909 DC $859 ND $706 FL $10,750 OH $10,125 GA $10,787 OK $2,910 HI $577 OR $1,768 ID $886 PA $5,851 IL $10,885 RI $1,599 IN $6,375 SC $4,045 IA $2,188 SD $720 KS $2,445 TN $5,667 KY $4,363 TX $17,044 LA $5,691 UT $1,725 ME $1,303 VT $538 MD $4,476 VA $4,998 MA $5,835 WA $4,469 MI $9,599 WV $1,482
MN $3,057 WI $4,546 MS $2,718 WY $788 MO $5,560 Total $241,988
Source: The Economic and Societal Impact of Motor Vehicle Crashes, 2010, NHTSA (2015).
Annual Economic Cost of Motor Vehicle Crashes to States
7 Advocates for Highway and Auto Safety January 2016
LEGISLATIVE ACTIVITY IN 2015 In 2015, there were only eight laws passed in six states that meet the criteria for the 15 basic safety laws included in this report. While there was other legislative activity throughout the states, for purposes of this report we only consider those laws that meet the optimal law criteria, as defined on pages 9 and 10. Laws that do not meet the optimal law criteria, including laws subject only to secondary enforcement, are not included in the legislative activity summary of this report.
Based on Advocates’ safety recommendations, states need to adopt 319 new laws:
16 states need an optimal primary enforcement seat belt law for front seat passengers; 32 states need an optimal primary enforcement seat belt law for rear seat passengers; 31 states need an optimal all-rider motorcycle helmet law; 17 states need an optimal booster seat law; 174 GDL laws need to be adopted to ensure the safety of novice drivers, no state meets all the criteria recommended in this report; 40 critical impaired driving laws are needed in 35 states and DC; and, 9 states need an optimal all-driver text messaging restriction.
Highway Safety Laws Enacted in 2015, in All State Legislatures Primary Enforcement of Seat Belts: Front and Rear Seats—Utah All-Rider Motorcycle Helmet Laws: None adopted, but none repealed Booster Seats (children aged 4 through 7): Kentucky, Oklahoma Graduated Driver Licensing (GDL): None adopted Impaired Driving: Ignition Interlock Devices for all offenders—Texas; Open Container—West Virginia All-Driver Text Messaging Restriction: Mississippi, Oklahoma
States are failing to close important safety gaps because they have not adopted the lifesaving safety laws listed below. While a number of highway safety laws have been enacted during the last few years, many considered to be fundamental to highway safety are still missing in many states.
January 2016 Advocates for Highway and Auto Safety 8
KEY THINGS TO KNOW ABOUT THIS REPORT
The Report is Divided into Five Issue Sections: Occupant Protection: Primary Enforcement Seat Belts Front Seat Occupants; Rear Seat Occupants; and, All-Rider Motorcycle Helmets Child Passenger Safety: Booster Seats Teen Driving (GDL): Minimum Age 16 for Learner’s Permit; 6-Month Holding Period; 30-50 Hours Supervised Driving; Nighttime Driving Restriction; Passenger Restriction; Cell Phone Use Restriction; and Age 18 for Unrestricted License Impaired Driving: Ignition Interlock Devices (IIDs) for All Offenders; Child Endangerment; and Open Container Distracted Driving: All-Driver Text Messaging Restriction
The 15 state laws that are listed in the five sections are essential to save lives, prevent injuries, and reduce health care and other costs. These 15 laws do not comprise the entire list of effective public policy interventions states should take to reduce motor vehicle deaths and injuries. Background information about each law is provided in the respective sections throughout the report. The statistical data on crashes, fatalities and injuries are based on 2014 Fatal Analysis Reporting System (FARS) data, except as otherwise indicated. States are rated only on whether they have adopted a specific law, not on other aspects or measures of an effective highway safety program. A definition of each law as used by Advocates for purposes of this report can be found on pages 9-10. No state can receive the highest rating (Green) without having primary enforcement seat belt laws for both the front and rear seats. Additionally, no state that has repealed its all-rider motorcycle helmet law within the previous ten years can receive a green rating in this report. Each issue section has a state law chart, in alphabetical order, with each state’s rating. The section ratings result in an overall rating, and overall state ratings on pages 32-35 fall into three groupings:
Good—State is significantly advanced toward adopting all of Advocates’ recommended optimal laws.
Caution—State needs improvement because of gaps in Advocates’ recommended optimal laws.
Danger—State falls dangerously behind in adoption of Advocates’ recommended optimal laws.
9 Advocates for Highway and Auto Safety January 2016
DEFINITIONS OF 15 LIFESAVING LAWS
Based on government and private research, crash data and state experience, Advocates has determined the traffic safety laws listed below are critical to reducing motor vehicle deaths and injuries. For the purposes of this report, states are only given credit if the state law meets the optimal safety provisions as defined below. No credit is given for laws that fail to fully meet the criteria in this report (although the existence of a partial law is indicated by an open circle in the booster seat and GDL rating charts, this is for informational purposes only). Also, no credit is given for laws that are subject to secondary enforcement or for GDL laws that permit an exemption based on driver education programs. Occupant Protection
Primary Enforcement Front Seat Belt Law - Allows law enforcement officers to stop and ticket the driver for a violation of the seat belt law for front seat occupants. No other violation need occur first to take action. (Ratings are based on front seat occupants only.) A state that does not have this law, in addition to a primary enforcement rear seat belt law, cannot receive a green overall rating. Primary Enforcement Rear Seat Belt Law - Requires that all occupants in the rear seat of a vehicle wear seat belts and allows law enforcement officers to stop and ticket the driver for a violation of the seat belt law. No other violation need occur first to take action. A state that does not have this law, in addition to a primary enforcement front seat belt law, cannot receive a green overall rating. All-Rider Motorcycle Helmet Law - Requires all motorcycle riders, regardless of age, to use a helmet that meets U.S. DOT standards or face a fine. A state that has repealed an existing all-rider motorcycle helmet law in the previous 10 years cannot achieve a green overall rating.
Child Passenger Safety
Booster Seat Law - Requires, at a minimum, that children aged four through seven be placed in a child restraint system (booster seat) that is certified by the manufacturer to meet U.S. DOT safety standards. Although Advocates does not rate states on whether the law also has a height requirement, states are also urged to mandate that all children less than 57 inches tall be secured by a booster seat, as recommended by the Centers for Disease Control and Prevention (CDC) and others.
Teen Driving GDL programs allow novice teen drivers to learn to drive under lower risk conditions, and consist of a learner's stage, then an intermediate stage, before being granted an unrestricted license. The learner’s stage requires teen drivers to complete a minimum number of months of adult-supervised driving in order to move to the next phase and drive unsupervised. The intermediate stage restricts teens from driving in high-risk situations for a specified period of time before receiving an unrestricted license. Advocates rates state GDL laws on seven key safety components identified in research and data analysis:
Learner’s Stage: Minimum Age 16 for Learner’s Permit - A beginning teen driver is prohibited from obtaining a learner’s permit until the age of 16. States have not been given credit if the law allows for a beginning driver to obtain a learner’s permit before the age of 16. Learner’s Stage: Six-Month Holding Period Provision - A beginning teen driver must be supervised by an adult licensed driver at all times during the learner’s stage. If the learner remains citation-free for six months, he or she may progress to the intermediate stage. States have not been given credit if the length of the holding period is less than six months, or if there is a reduction in the length of the holding period for drivers who take a driver education course.
January 2016 Advocates for Highway and Auto Safety 10
DEFINITIONS OF 15 LIFESAVING LAWS (CONT.) Teen Driving (cont.)
Learner’s Stage: 30-50 Hours of Supervised Driving Provision - A beginning teen driver must receive at least 30-50 hours of behind-the-wheel training with an adult licensed driver during the learner’s stage. States have not been given credit if the number of required supervised driving hours is less than 30, or if there is a reduction in the required number of hours of supervised driving (to less than 30 hours) for drivers who take a driver education course. Intermediate Stage: Nighttime Driving Restriction Provision - Unsupervised driving should be prohibited from at least 10 p.m. to 5 a.m. States have not been given credit if the nighttime driving restriction does not span the entire 10 p.m. to 5 a.m. minimum time range for all days of the week. Intermediate Stage: Passenger Restriction Provision - This provision limits the number of teenage passengers who may legally ride with a teen driver without adult supervision. The optimal limit is no more than one non-familial teenage passenger.
Cell Phone Restriction - This restriction prohibits all use of cellular devices (hand-held, hands-free and text messaging) by beginning teen drivers, except in the case of an emergency. States are only given credit if the provision lasts for the entire duration of the GDL program (both learner’s and intermediate stages). Age 18 for Unrestricted License - A teen driver is prohibited from obtaining an unrestricted license until the age of 18, and one or both of the nighttime and passenger restrictions must last until age 18. States have not been given credit if teen drivers can obtain an unrestricted license before age 18.
Impaired Driving
Ignition Interlock Devices (IIDs) - This law mandates the installation of IIDs on the vehicles of all convicted drunk driving offenders. Without an optimal IID law a state is red for the impaired driving rating. Child Endangerment - This law either creates a separate offense or enhances an existing penalty for an impaired driving offender who endangers a minor. No credit is given if this law applies only to drivers who are under 21 years of age. Open Container - This law prohibits open containers of alcohol in the passenger area of a motor vehicle. To comply with federal requirements, the law must: prohibit both possession of any open alcoholic beverage container and the consumption of alcohol from an open container; apply to the entire passenger area of any motor vehicle; apply to all vehicle occupants except for passengers of buses, taxi cabs, limousines or persons in the living quarters of motor homes; apply to vehicles on the shoulder of public highways; and, require primary enforcement of the law. State laws are counted in this report only if they are in compliance with the federal law and regulation.
Distracted Driving
All-Driver Text Messaging Restriction - This law prohibits all drivers from sending, receiving, or reading a text message from any handheld or electronic data communication device, except in the case of an emergency.
11 Advocates for Highway and Auto Safety January 2016
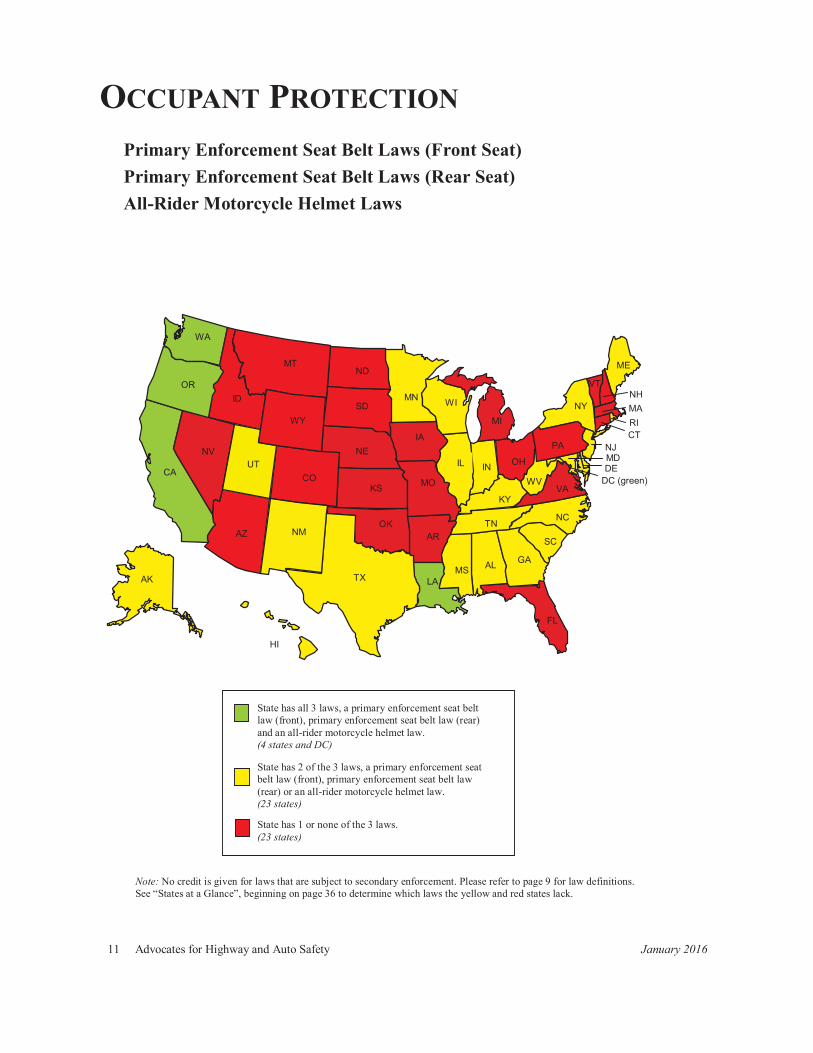
OCCUPANT PROTECTION
Primary Enforcement Seat Belt Laws (Front Seat) Primary Enforcement Seat Belt Laws (Rear Seat)
All-Rider Motorcycle Helmet Laws
State has all 3 laws, a primary enforcement seat belt law (front), primary enforcement seat belt law (rear) and an all-rider motorcycle helmet law. (4 states and DC)
State has 2 of the 3 laws, a primary enforcement seat belt law (front), primary enforcement seat belt law (rear) or an all-rider motorcycle helmet law. (23 states)
State has 1 or none of the 3 laws. (23 states)
NC
OH IN
AL TX
FL
GA MS
OK NM AZ
CA NV
UT CO
KS MO
AR
LA
TN SC
KY VA WV
IL
IA NE
WY
ID OR
SD WI MN
ND MT
WA
PA
NY
ME
NH
VT
MA CT NJ
DE
MD
RI MI
HI
AK
DC (green)
Note: No credit is given for laws that are subject to secondary enforcement. Please refer to page 9 for law definitions. See “States at a Glance”, beginning on page 36 to determine which laws the yellow and red states lack.
January 2016 Advocates for Highway and Auto Safety 12
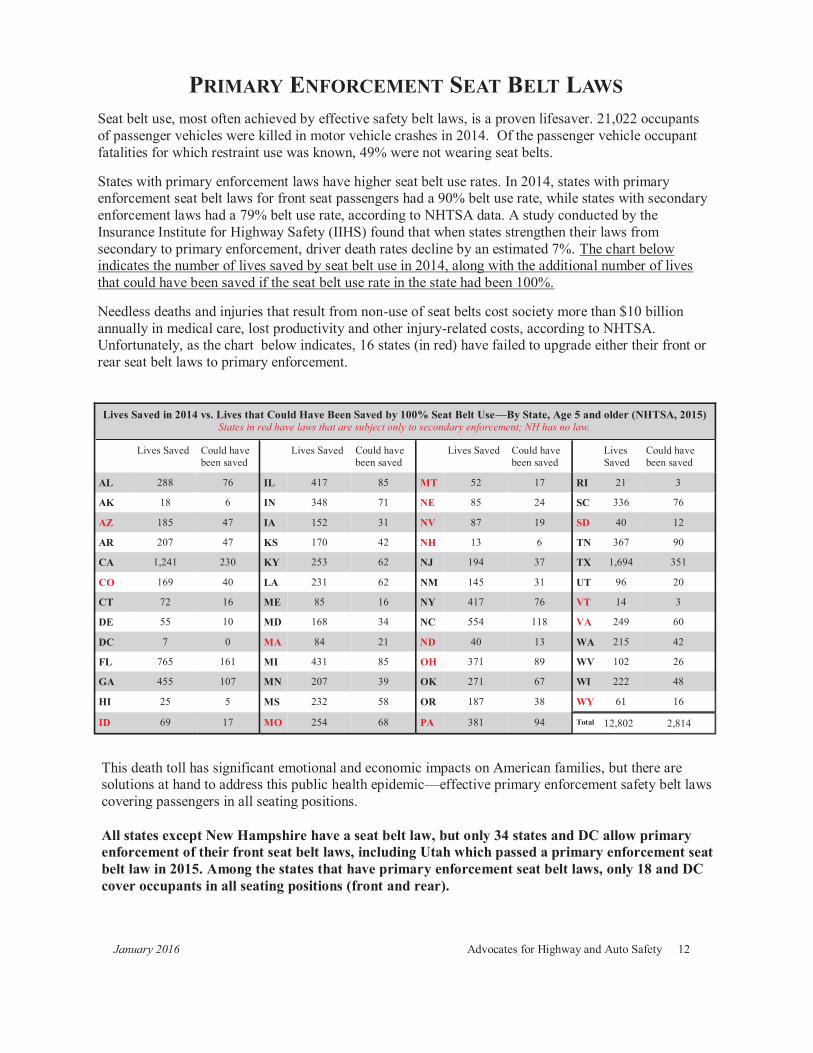
PRIMARY ENFORCEMENT SEAT BELT LAWS Seat belt use, most often achieved by effective safety belt laws, is a proven lifesaver. 21,022 occupants of passenger vehicles were killed in motor vehicle crashes in 2014. Of the passenger vehicle occupant fatalities for which restraint use was known, 49% were not wearing seat belts.
States with primary enforcement laws have higher seat belt use rates. In 2014, states with primary enforcement seat belt laws for front seat passengers had a 90% belt use rate, while states with secondary enforcement laws had a 79% belt use rate, according to NHTSA data. A study conducted by the Insurance Institute for Highway Safety (IIHS) found that when states strengthen their laws from secondary to primary enforcement, driver death rates decline by an estimated 7%. The chart below indicates the number of lives saved by seat belt use in 2014, along with the additional number of lives that could have been saved if the seat belt use rate in the state had been 100%. Needless deaths and injuries that result from non-use of seat belts cost society more than $10 billion annually in medical care, lost productivity and other injury-related costs, according to NHTSA. Unfortunately, as the chart below indicates, 16 states (in red) have failed to upgrade either their front or rear seat belt laws to primary enforcement.
Lives Saved in 2014 vs. Lives that Could Have Been Saved by 100% Seat Belt Use—By State, Age 5 and older (NHTSA, 2015) States in red have laws that are subject only to secondary enforcement; NH has no law.
Lives Saved Could have been saved
Lives Saved Could have been saved
Lives Saved Could have been saved
Lives Saved
Could have been saved
AL 288 76 IL 417 85 MT 52 17 RI 21 3
AK 18 6 IN 348 71 NE 85 24 SC 336 76
AZ 185 47 IA 152 31 NV 87 19 SD 40 12
AR 207 47 KS 170 42 NH 13 6 TN 367 90
CA 1,241 230 KY 253 62 NJ 194 37 TX 1,694 351
CO 169 40 LA 231 62 NM 145 31 UT 96 20
CT 72 16 ME 85 16 NY 417 76 VT 14 3
DE 55 10 MD 168 34 NC 554 118 VA 249 60
DC 7 0 MA 84 21 ND 40 13 WA 215 42
FL 765 161 MI 431 85 OH 371 89 WV 102 26
GA 455 107 MN 207 39 OK 271 67 WI 222 48
HI 25 5 MS 232 58 OR 187 38 WY 61 16
ID 69 17 MO 254 68 PA 381 94 Total 12,802 2,814
This death toll has significant emotional and economic impacts on American families, but there are solutions at hand to address this public health epidemic—effective primary enforcement safety belt laws covering passengers in all seating positions. All states except New Hampshire have a seat belt law, but only 34 states and DC allow primary enforcement of their front seat belt laws, including Utah which passed a primary enforcement seat belt law in 2015. Among the states that have primary enforcement seat belt laws, only 18 and DC cover occupants in all seating positions (front and rear).
13 Advocates for Highway and Auto Safety January 2016
PRIMARY ENFORCEMENT SEAT BELT LAWS
Lap-shoulder belts, when used, reduce the risk of fatal injury to front seat car occupants by 45% and the risk of moderate-to-critical injuries by 50%. For light truck occupants, seat belts reduce the risk of fatal injury by 60% and moderate-to-critical injury by 65%. NHTSA data shows that nationwide seat belts saved an estimated 12,802 lives of passengers age five and older in all seating positions in 2014. An additional 2,814 lives could have been saved if all passenger vehicle occupants had worn seat belts. In fatal crashes in 2014, 80% of passenger vehicle occupants who were totally ejected from the vehicle were killed, according to NHTSA data. Further, only 1% of the occupants reported to have been using restraints were totally ejected, compared with 30% of the unrestrained occupants. Since 1975, over 360,000 lives could have been saved and 5.8 million injuries could have been prevented if all occupants had worn seat belts, according to a recent NHTSA report. Over this same time period, nearly $1.5 trillion in economic costs have been needlessly incurred due to seat belt non-use. In 2014, the proportion of unrestrained passenger vehicle occupants killed that were seated in the front seat was 47%, compared to 58% of unrestrained passenger vehicle occupants killed that were seated in the rear seat, according to NHTSA. The majority of passengers in the rear seats of vehicles are teens and children, and studies have shown that seat belt usage by teens is the lowest of any segment of society. If every state with a secondary seat belt law upgraded to primary enforcement, about 1,000 lives and $4 billion in crash costs could be saved every year, as reported by NHTSA. NHTSA reports that the average in-patient costs for crash victims who don’t use seat belts are 55% higher than for those who use them. Seat belt use rates increase from 10 to 15 percentage points when primary laws are passed, as experienced in a number of states. Opponents often assert that highway safety laws violate personal choice and individual rights, overlooking the impact on society. In response, the U.S. District Court of Massachusetts stated in a decision, affirmed by the U.S. Supreme Court, that “from the moment of injury, society picks the person up off the highway; delivers him to a municipal hospital and municipal doctors; provides him with unemployment compensation if, after recovery, he cannot replace his lost job; and, if the injury causes disability, may assume the responsibility for his and his family’s continued subsistence.” According to a NHTSA study of the relationship between primary enforcement belt laws and minority ticketing, the share of citations for Hispanics and African Americans changed very little after states adopted primary enforcement belt laws. In fact, there were significant gains in seat belt use among all ethnic groups, none of which were proportionately greater in any minority group.
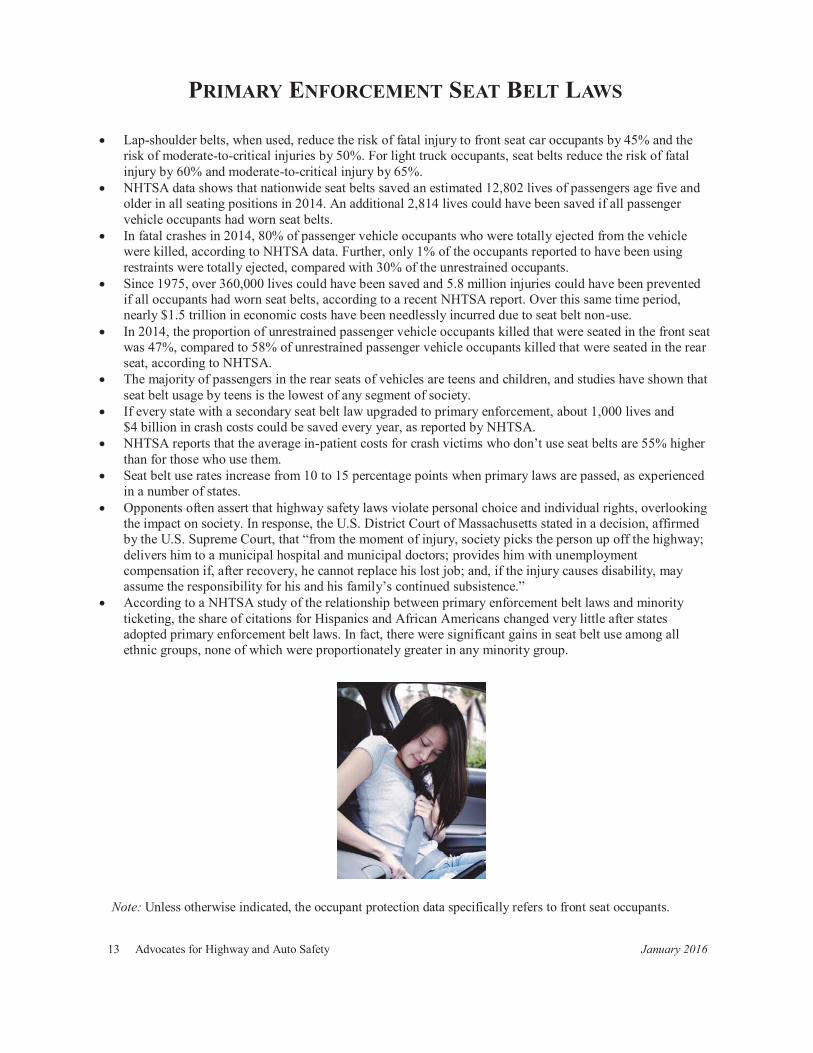
Note: Unless otherwise indicated, the occupant protection data specifically refers to front seat occupants.
January 2016 Advocates for Highway and Auto Safety 14
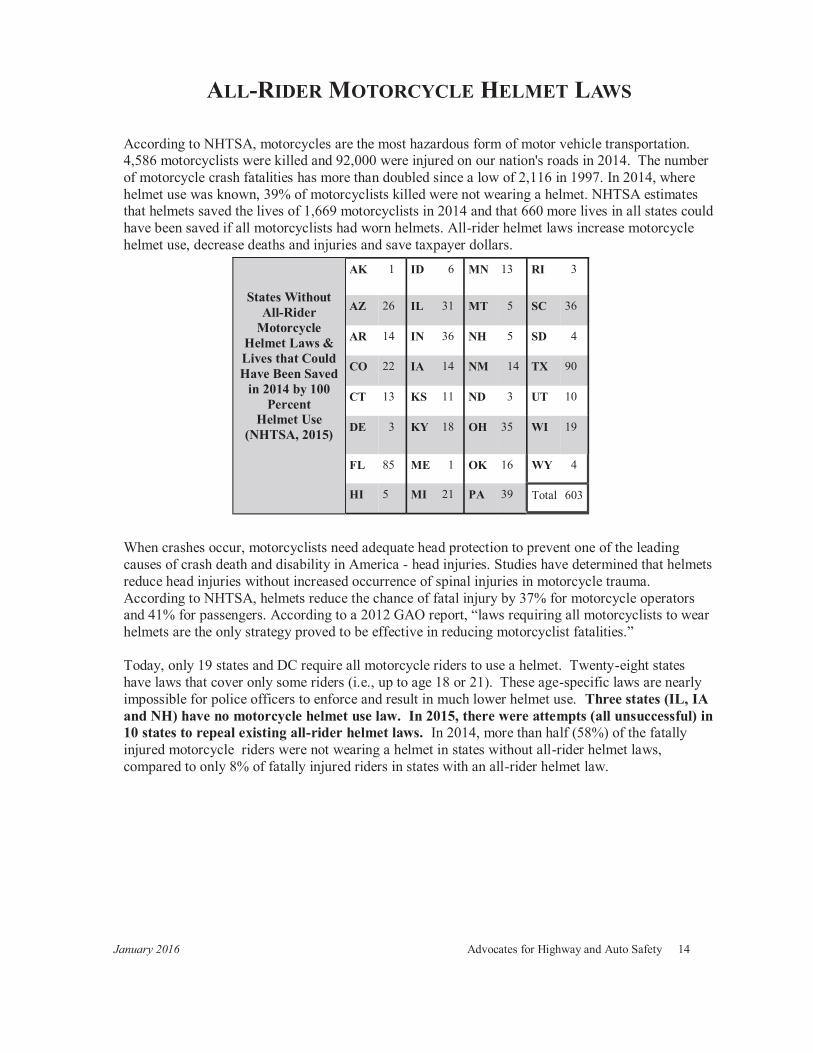
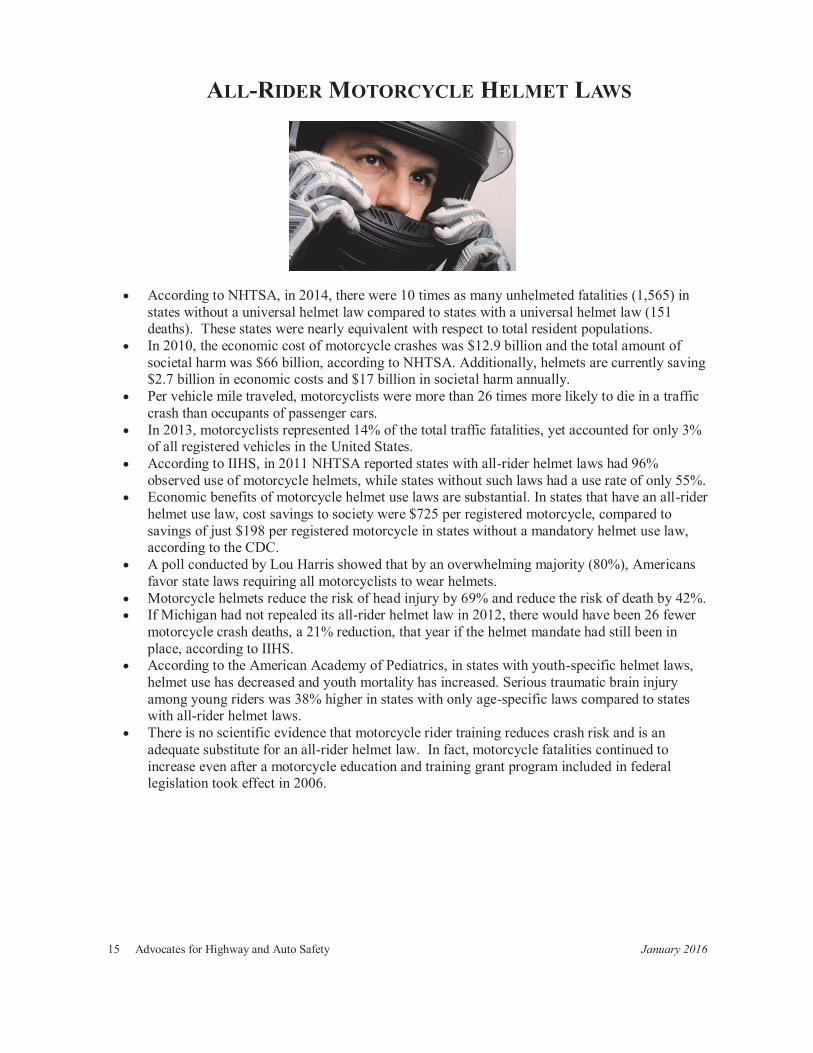
ALL-RIDER MOTORCYCLE HELMET LAWS According to NHTSA, motorcycles are the most hazardous form of motor vehicle transportation. 4,586 motorcyclists were killed and 92,000 were injured on our nation's roads in 2014. The number of motorcycle crash fatalities has more than doubled since a low of 2,116 in 1997. In 2014, where helmet use was known, 39% of motorcyclists killed were not wearing a helmet. NHTSA estimates that helmets saved the lives of 1,669 motorcyclists in 2014 and that 660 more lives in all states could have been saved if all motorcyclists had worn helmets. All-rider helmet laws increase motorcycle helmet use, decrease deaths and injuries and save taxpayer dollars. When crashes occur, motorcyclists need adequate head protection to prevent one of the leading causes of crash death and disability in America - head injuries. Studies have determined that helmets reduce head injuries without increased occurrence of spinal injuries in motorcycle trauma. According to NHTSA, helmets reduce the chance of fatal injury by 37% for motorcycle operators and 41% for passengers. According to a 2012 GAO report, “laws requiring all motorcyclists to wear helmets are the only strategy proved to be effective in reducing motorcyclist fatalities.” Today, only 19 states and DC require all motorcycle riders to use a helmet. Twenty-eight states have laws that cover only some riders (i.e., up to age 18 or 21). These age-specific laws are nearly impossible for police officers to enforce and result in much lower helmet use. Three states (IL, IA and NH) have no motorcycle helmet use law. In 2015, there were attempts (all unsuccessful) in 10 states to repeal existing all-rider helmet laws. In 2014, more than half (58%) of the fatally injured motorcycle riders were not wearing a helmet in states without all-rider helmet laws, compared to only 8% of fatally injured riders in states with an all-rider helmet law.
AK 1 ID 6 MN 13 RI 3
States Without All-Rider
Motorcycle Helmet Laws & Lives that Could Have Been Saved
in 2014 by 100 Percent
Helmet Use (NHTSA, 2015)
AZ 26 IL 31 MT 5 SC 36
AR 14 IN 36 NH 5 SD 4
CO 22 IA 14 NM 14 TX 90
CT 13 KS 11 ND 3 UT 10
DE 3 KY 18 OH 35 WI 19
FL 85 ME 1 OK 16 WY 4
HI 5 MI 21 PA 39 Total 603
15 Advocates for Highway and Auto Safety January 2016
ALL-RIDER MOTORCYCLE HELMET LAWS
According to NHTSA, in 2014, there were 10 times as many unhelmeted fatalities (1,565) in states without a universal helmet law compared to states with a universal helmet law (151 deaths). These states were nearly equivalent with respect to total resident populations. In 2010, the economic cost of motorcycle crashes was $12.9 billion and the total amount of societal harm was $66 billion, according to NHTSA. Additionally, helmets are currently saving $2.7 billion in economic costs and $17 billion in societal harm annually. Per vehicle mile traveled, motorcyclists were more than 26 times more likely to die in a traffic crash than occupants of passenger cars. In 2013, motorcyclists represented 14% of the total traffic fatalities, yet accounted for only 3% of all registered vehicles in the United States. According to IIHS, in 2011 NHTSA reported states with all-rider helmet laws had 96% observed use of motorcycle helmets, while states without such laws had a use rate of only 55%. Economic benefits of motorcycle helmet use laws are substantial. In states that have an all-rider helmet use law, cost savings to society were $725 per registered motorcycle, compared to savings of just $198 per registered motorcycle in states without a mandatory helmet use law, according to the CDC. A poll conducted by Lou Harris showed that by an overwhelming majority (80%), Americans favor state laws requiring all motorcyclists to wear helmets. Motorcycle helmets reduce the risk of head injury by 69% and reduce the risk of death by 42%. If Michigan had not repealed its all-rider helmet law in 2012, there would have been 26 fewer motorcycle crash deaths, a 21% reduction, that year if the helmet mandate had still been in place, according to IIHS. According to the American Academy of Pediatrics, in states with youth-specific helmet laws, helmet use has decreased and youth mortality has increased. Serious traumatic brain injury among young riders was 38% higher in states with only age-specific laws compared to states with all-rider helmet laws. There is no scientific evidence that motorcycle rider training reduces crash risk and is an adequate substitute for an all-rider helmet law. In fact, motorcycle fatalities continued to increase even after a motorcycle education and training grant program included in federal legislation took effect in 2006.
January 2016 Advocates for Highway and Auto Safety 16
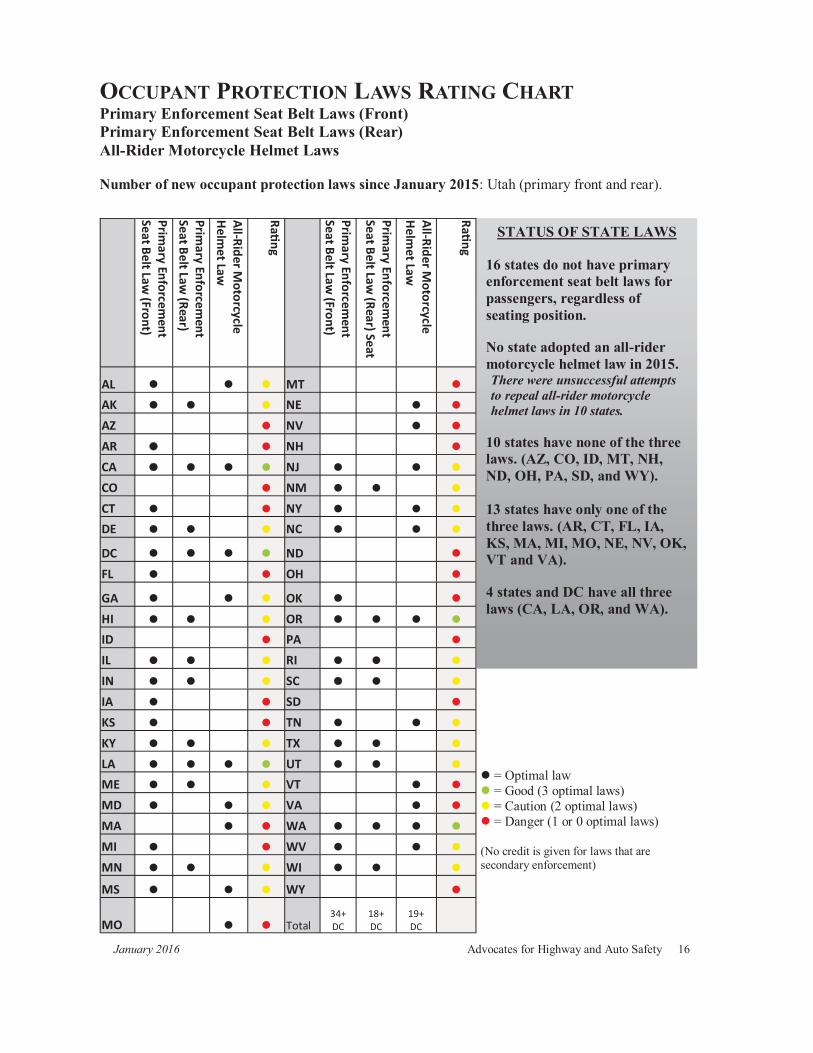
STATUS OF STATE LAWS 16 states do not have primary enforcement seat belt laws for passengers, regardless of seating position.
No state adopted an all-rider motorcycle helmet law in 2015. There were unsuccessful attempts to repeal all-rider motorcycle helmet laws in 10 states.
10 states have none of the three laws. (AZ, CO, ID, MT, NH, ND, OH, PA, SD, and WY). 13 states have only one of the three laws. (AR, CT, FL, IA, KS, MA, MI, MO, NE, NV, OK, VT and VA). 4 states and DC have all three laws (CA, LA, OR, and WA).
OCCUPANT PROTECTION LAWS RATING CHART Primary Enforcement Seat Belt Laws (Front) Primary Enforcement Seat Belt Laws (Rear) All-Rider Motorcycle Helmet Laws Number of new occupant protection laws since January 2015: Utah (primary front and rear).
= Optimal law = Good (3 optimal laws) = Caution (2 optimal laws) = Danger (1 or 0 optimal laws)
(No credit is given for laws that are secondary enforcement)
Primary Enforcem
ent Seat Belt Law
(Front)
Primary Enforcem
ent Seat Belt Law
(Rear)
All-Rider Motorcycle
Helm
et Law
Rang
Primary Enforcem
ent Seat Belt Law
(Front)
Primary Enforcem
ent Seat Belt Law
(Rear) Seat
All-Rider Motorcycle
Helm
et Law
Rang
AL MT AK NE AZ NV AR NH CA NJ CO NM CT NY DE NC
DC ND FL OH
GA OK HI OR ID PA IL RI IN SC IA SD KS TN KY TX LA UT ME VT MD VA MA WA MI WV MN WI MS WY
MO Total 34+ DC
18+ DC
19+ DC
17 Advocates for Highway and Auto Safety January 2016
CHILD PASSENGER SAFETY Booster Seat Laws
NC
OH IN
AL TX
FL
GA MS
OK NM AZ
CA NV
UT CO
KS MO
AR
LA
TN SC
KY VA WV
IL
IA NE
WY
ID OR
SD WI MN
ND MT
WA
PA
NY
ME
NH
VT
MA CT NJ
DE
MD
RI MI
HI
AK
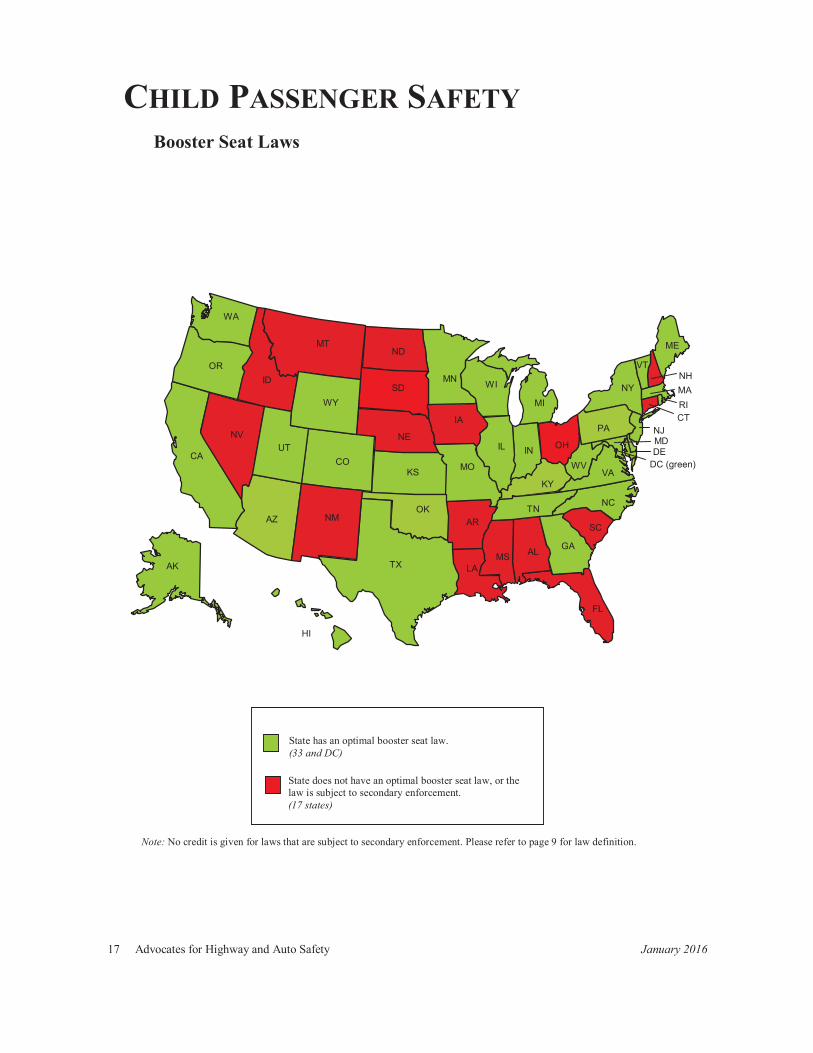
State has an optimal booster seat law. (33 and DC)
State does not have an optimal booster seat law, or the law is subject to secondary enforcement. (17 states)
DC (green)
Note: No credit is given for laws that are subject to secondary enforcement. Please refer to page 9 for law definition.
January 2016 Advocates for Highway and Auto Safety 18
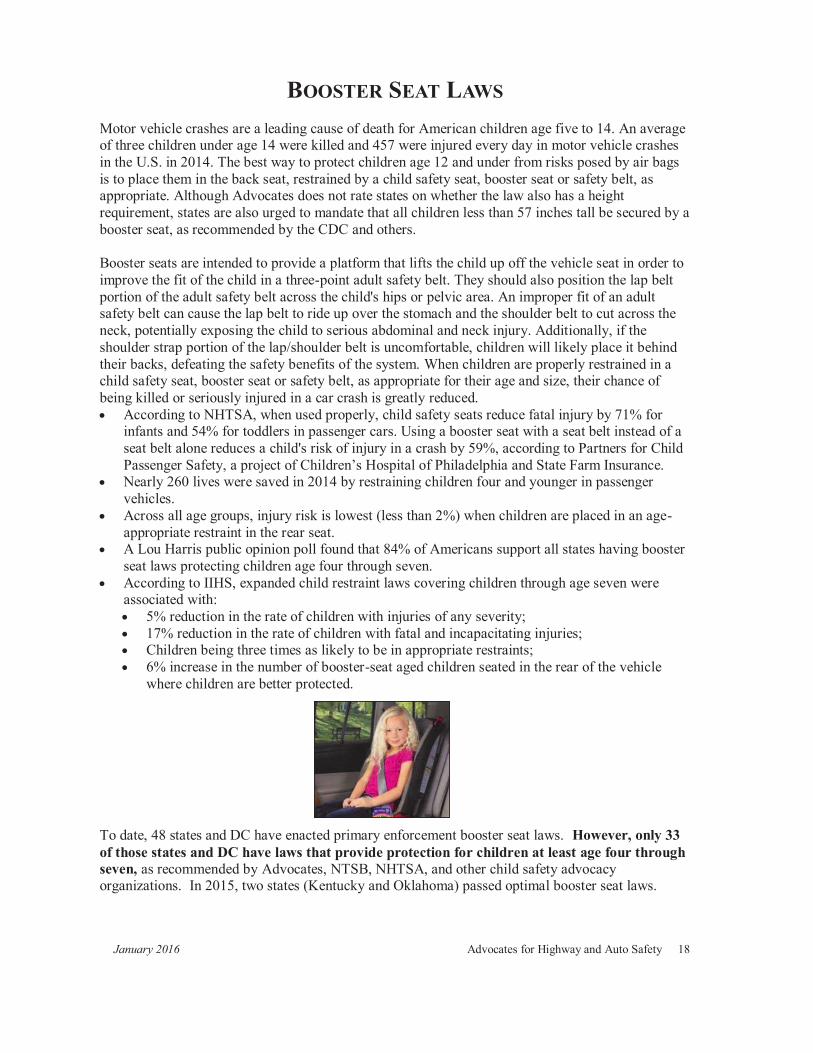
BOOSTER SEAT LAWS Motor vehicle crashes are a leading cause of death for American children age five to 14. An average of three children under age 14 were killed and 457 were injured every day in motor vehicle crashes in the U.S. in 2014. The best way to protect children age 12 and under from risks posed by air bags is to place them in the back seat, restrained by a child safety seat, booster seat or safety belt, as appropriate. Although Advocates does not rate states on whether the law also has a height requirement, states are also urged to mandate that all children less than 57 inches tall be secured by a booster seat, as recommended by the CDC and others. Booster seats are intended to provide a platform that lifts the child up off the vehicle seat in order to improve the fit of the child in a three-point adult safety belt. They should also position the lap belt portion of the adult safety belt across the child's hips or pelvic area. An improper fit of an adult safety belt can cause the lap belt to ride up over the stomach and the shoulder belt to cut across the neck, potentially exposing the child to serious abdominal and neck injury. Additionally, if the shoulder strap portion of the lap/shoulder belt is uncomfortable, children will likely place it behind their backs, defeating the safety benefits of the system. When children are properly restrained in a child safety seat, booster seat or safety belt, as appropriate for their age and size, their chance of being killed or seriously injured in a car crash is greatly reduced.
According to NHTSA, when used properly, child safety seats reduce fatal injury by 71% for infants and 54% for toddlers in passenger cars. Using a booster seat with a seat belt instead of a seat belt alone reduces a child's risk of injury in a crash by 59%, according to Partners for Child Passenger Safety, a project of Children’s Hospital of Philadelphia and State Farm Insurance. Nearly 260 lives were saved in 2014 by restraining children four and younger in passenger vehicles. Across all age groups, injury risk is lowest (less than 2%) when children are placed in an age-appropriate restraint in the rear seat. A Lou Harris public opinion poll found that 84% of Americans support all states having booster seat laws protecting children age four through seven. According to IIHS, expanded child restraint laws covering children through age seven were associated with:
5% reduction in the rate of children with injuries of any severity; 17% reduction in the rate of children with fatal and incapacitating injuries; Children being three times as likely to be in appropriate restraints; 6% increase in the number of booster-seat aged children seated in the rear of the vehicle where children are better protected.
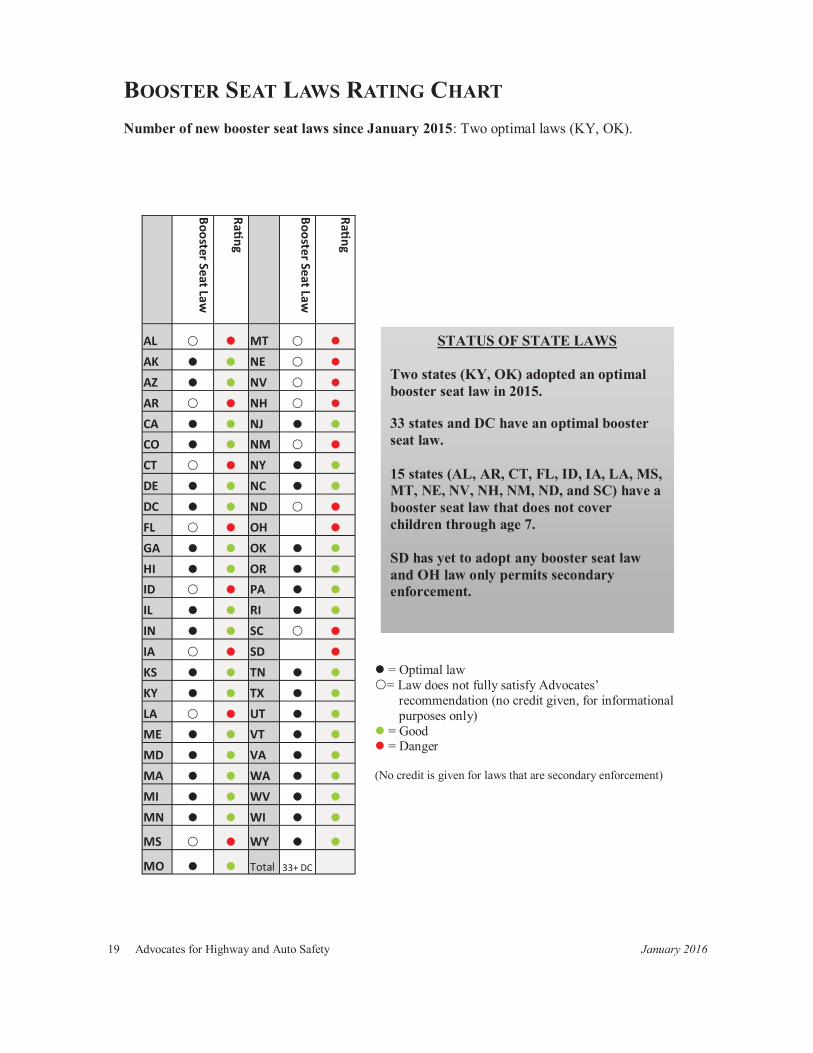
To date, 48 states and DC have enacted primary enforcement booster seat laws. However, only 33 of those states and DC have laws that provide protection for children at least age four through seven, as recommended by Advocates, NTSB, NHTSA, and other child safety advocacy organizations. In 2015, two states (Kentucky and Oklahoma) passed optimal booster seat laws.
19 Advocates for Highway and Auto Safety January 2016
BOOSTER SEAT LAWS RATING CHART Number of new booster seat laws since January 2015: Two optimal laws (KY, OK).
STATUS OF STATE LAWS Two states (KY, OK) adopted an optimal booster seat law in 2015. 33 states and DC have an optimal booster seat law. 15 states (AL, AR, CT, FL, ID, IA, LA, MS, MT, NE, NV, NH, NM, ND, and SC) have a booster seat law that does not cover children through age 7. SD has yet to adopt any booster seat law and OH law only permits secondary enforcement.
Booster Seat Law
Rang
Booster Seat Law
Rang
AL MT AK NE AZ NV AR NH CA NJ CO NM CT NY DE NC DC ND FL OH GA OK HI OR ID PA IL RI IN SC IA SD KS TN KY TX LA UT ME VT MD VA MA WA MI WV MN WI
MS WY
MO Total 33+ DC
= Optimal law = Law does not fully satisfy Advocates’
recommendation (no credit given, for informational purposes only)
= Good = Danger
(No credit is given for laws that are secondary enforcement)
January 2016 Advocates for Highway and Auto Safety 20
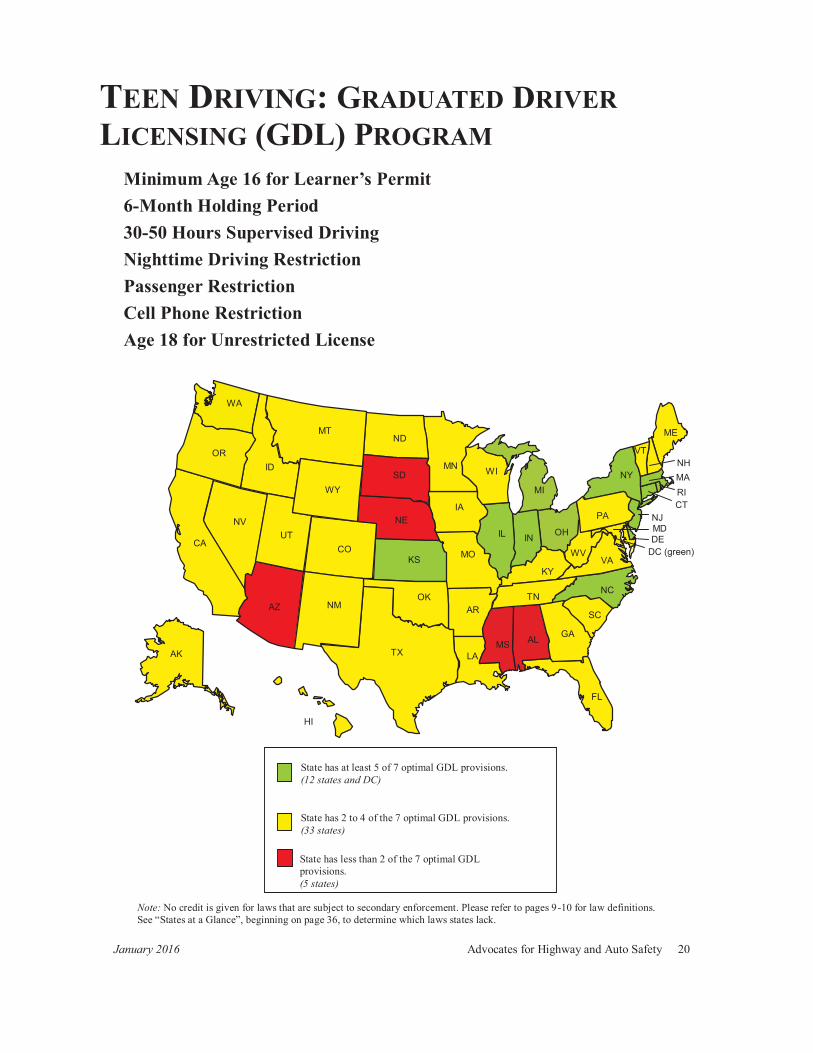
TEEN DRIVING: GRADUATED DRIVER LICENSING (GDL) PROGRAM
Minimum Age 16 for Learner’s Permit 6-Month Holding Period 30-50 Hours Supervised Driving Nighttime Driving Restriction
Passenger Restriction
Cell Phone Restriction Age 18 for Unrestricted License
State has at least 5 of 7 optimal GDL provisions. (12 states and DC)
State has 2 to 4 of the 7 optimal GDL provisions. (33 states)
State has less than 2 of the 7 optimal GDL provisions. (5 states)
NC
OH IN
AL TX
FL
GA MS
OK NM AZ
CA NV
UT CO
KS MO
AR
LA
TN SC
KY VA WV
IL
IA NE
WY
ID OR
SD WI MN
ND MT
WA
PA
NY
ME
NH
VT
MA CT NJ
DE
MD
RI MI
HI
AK
DC (green)
Note: No credit is given for laws that are subject to secondary enforcement. Please refer to pages 9-10 for law definitions. See “States at a Glance”, beginning on page 36, to determine which laws states lack.
21 Advocates for Highway and Auto Safety January 2016
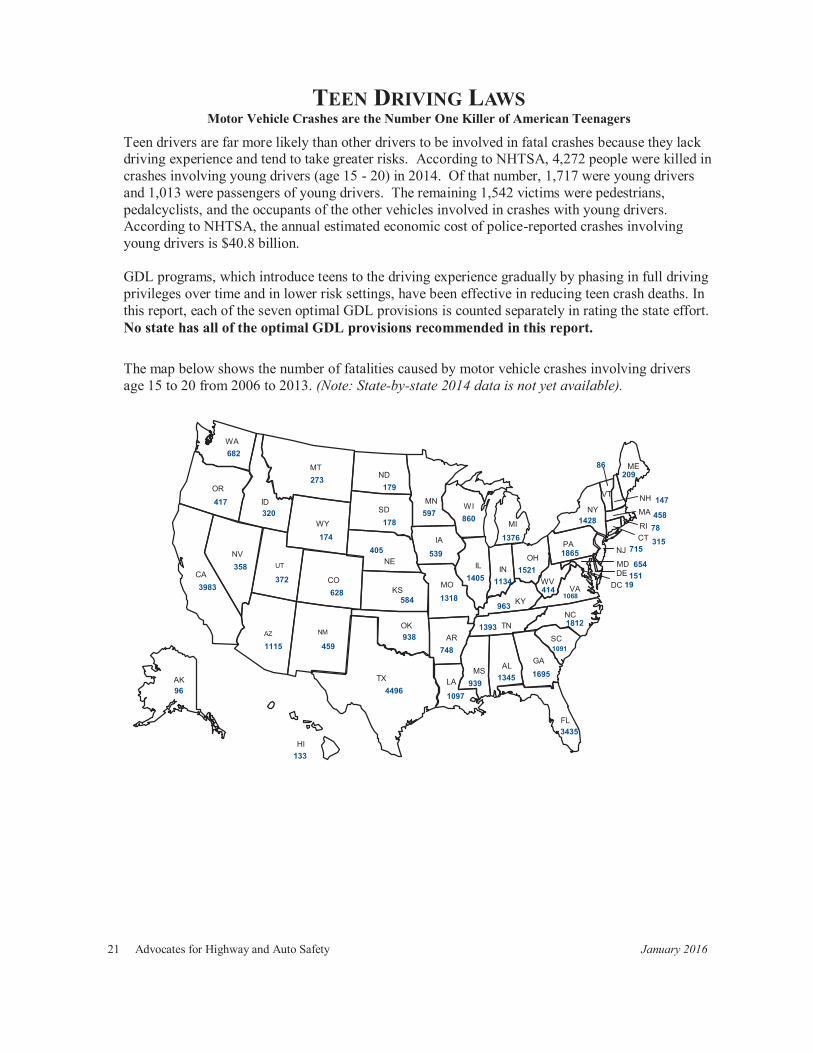
TEEN DRIVING LAWS Motor Vehicle Crashes are the Number One Killer of American Teenagers
Teen drivers are far more likely than other drivers to be involved in fatal crashes because they lack driving experience and tend to take greater risks. According to NHTSA, 4,272 people were killed in crashes involving young drivers (age 15 - 20) in 2014. Of that number, 1,717 were young drivers and 1,013 were passengers of young drivers. The remaining 1,542 victims were pedestrians, pedalcyclists, and the occupants of the other vehicles involved in crashes with young drivers. According to NHTSA, the annual estimated economic cost of police-reported crashes involving young drivers is $40.8 billion. GDL programs, which introduce teens to the driving experience gradually by phasing in full driving privileges over time and in lower risk settings, have been effective in reducing teen crash deaths. In this report, each of the seven optimal GDL provisions is counted separately in rating the state effort. No state has all of the optimal GDL provisions recommended in this report. The map below shows the number of fatalities caused by motor vehicle crashes involving drivers age 15 to 20 from 2006 to 2013. (Note: State-by-state 2014 data is not yet available).
DC
HI
147
458 78 315
NC
OH IN
AL TX
FL
GA MS
OK NM AZ
CA
NV UT
CO KS
MO
AR
LA
TN SC
KY VA
WV
IL
IA
NE
WY
ID
OR
SD WI
MN
ND
MT
WA
PA
NY
ME
NH MA
CT
NJ
DE
MD
RI MI
VT
AK
682
417
3983
96
320
358
1115
273
372
174
628
459
179
178
405
584
938
4496
597
1405
1318
748
1097
860
539
1134
963
1393
939 1345
3435
1695
1091
1812
1068 414
1521
1865
1428
86 209
715
654 151
19
1376
133
January 2016 Advocates for Highway and Auto Safety 22
TEEN DRIVING LAWS
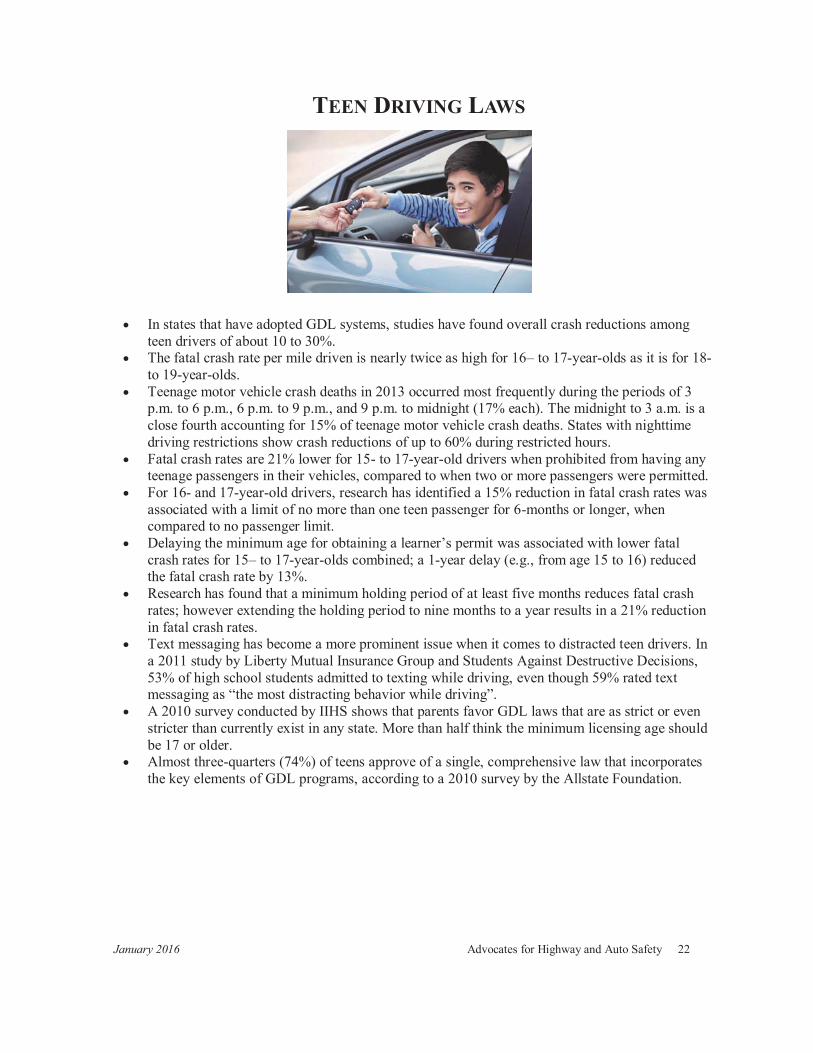
In states that have adopted GDL systems, studies have found overall crash reductions among teen drivers of about 10 to 30%. The fatal crash rate per mile driven is nearly twice as high for 16– to 17-year-olds as it is for 18-to 19-year-olds. Teenage motor vehicle crash deaths in 2013 occurred most frequently during the periods of 3 p.m. to 6 p.m., 6 p.m. to 9 p.m., and 9 p.m. to midnight (17% each). The midnight to 3 a.m. is a close fourth accounting for 15% of teenage motor vehicle crash deaths. States with nighttime driving restrictions show crash reductions of up to 60% during restricted hours. Fatal crash rates are 21% lower for 15- to 17-year-old drivers when prohibited from having any teenage passengers in their vehicles, compared to when two or more passengers were permitted. For 16- and 17-year-old drivers, research has identified a 15% reduction in fatal crash rates was associated with a limit of no more than one teen passenger for 6-months or longer, when compared to no passenger limit. Delaying the minimum age for obtaining a learner’s permit was associated with lower fatal crash rates for 15– to 17-year-olds combined; a 1-year delay (e.g., from age 15 to 16) reduced the fatal crash rate by 13%. Research has found that a minimum holding period of at least five months reduces fatal crash rates; however extending the holding period to nine months to a year results in a 21% reduction in fatal crash rates. Text messaging has become a more prominent issue when it comes to distracted teen drivers. In a 2011 study by Liberty Mutual Insurance Group and Students Against Destructive Decisions, 53% of high school students admitted to texting while driving, even though 59% rated text messaging as “the most distracting behavior while driving”. A 2010 survey conducted by IIHS shows that parents favor GDL laws that are as strict or even stricter than currently exist in any state. More than half think the minimum licensing age should be 17 or older. Almost three-quarters (74%) of teens approve of a single, comprehensive law that incorporates the key elements of GDL programs, according to a 2010 survey by the Allstate Foundation.
23 Advocates for Highway and Auto Safety January 2016
Minim
um Age 16 for Learner’s Perm
it
6-Month Holding Period
30-50 Hrs. Supervised Driving
Nigh
me Restric
on
Passenger Restricon
Cell Phone Restricon
Age 18 Unrestricted License
Teen Driving Laws Ra
ng
Minim
um Age 16 for Learner’s Perm
it
6-Month Holding Period
30-50 Hrs. Supervised Driving
Nigh
me Restric
on
Passenger Restricon
Cell Phone Restricon
Age 18 Unrestricted License
Teen Driving Laws Ra
ng
AL MT AK NE AZ NV AR NH CA NJ CO NM CT NY DE NC DC ND FL OH GA OK HI OR ID PA IL RI IN SC IA SD KS TN KY TX LA UT ME VT MD VA MA WA MI WV MN WI MS WY
MO Total 8+ DC 46+DC
40+DC 11 28+
DC 31 14+ DC
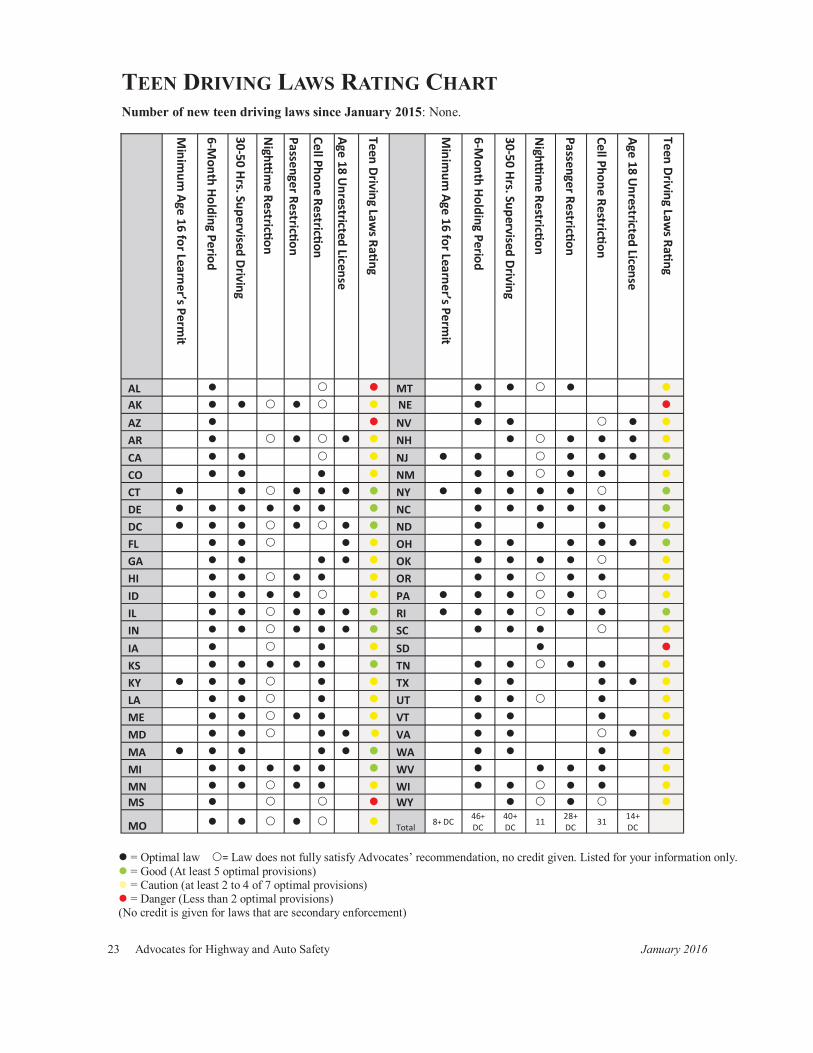
TEEN DRIVING LAWS RATING CHART
Number of new teen driving laws since January 2015: None.
= Optimal law = Law does not fully satisfy Advocates’ recommendation, no credit given. Listed for your information only. = Good (At least 5 optimal provisions) = Caution (at least 2 to 4 of 7 optimal provisions) = Danger (Less than 2 optimal provisions)
(No credit is given for laws that are secondary enforcement)
January 2016 Advocates for Highway and Auto Safety 24
IMPAIRED DRIVING Ignition Interlock Devices
Child Endangerment
Open Container
NC
OH IN
AL TX
FL
GA MS
OK NM AZ
CA NV
UT CO
KS MO
AR
LA
TN SC
KY VA WV
IL
IA
NE
WY
ID OR
SD WI MN
ND MT
WA
PA
NY
ME
NH
VT
MA CT NJ
DE
MD
RI MI
HI
AK
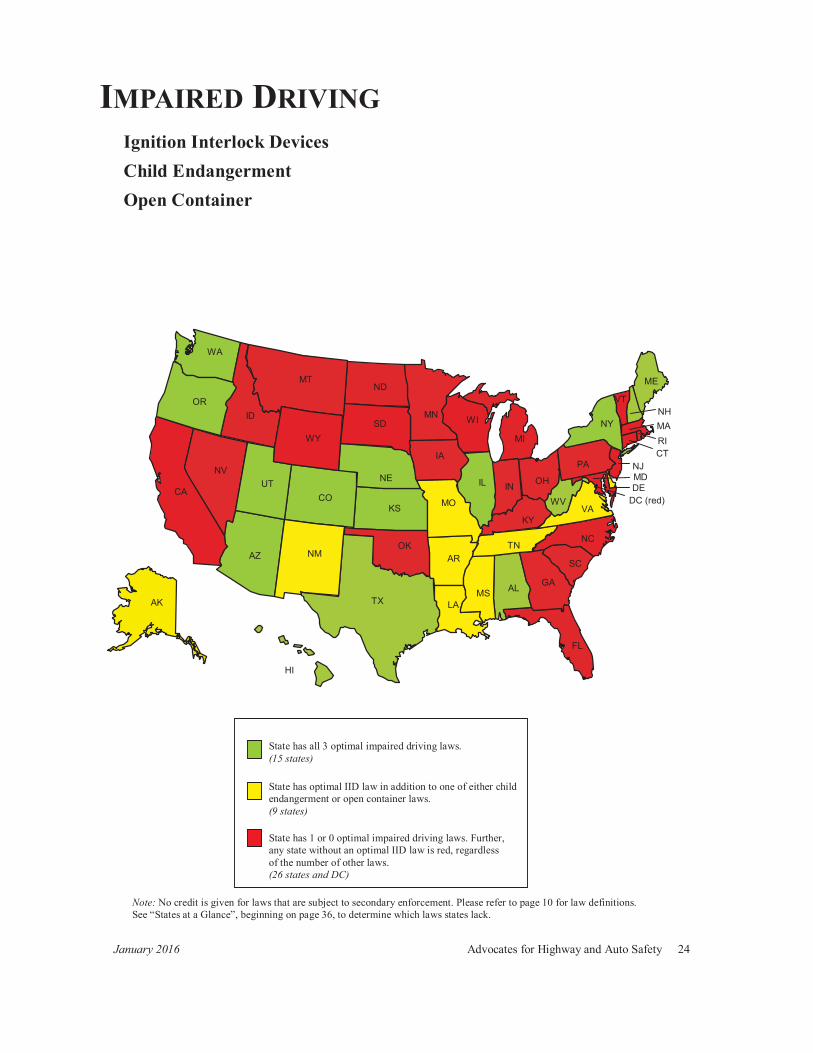
State has all 3 optimal impaired driving laws. (15 states)
State has optimal IID law in addition to one of either child endangerment or open container laws. (9 states)
State has 1 or 0 optimal impaired driving laws. Further, any state without an optimal IID law is red, regardless of the number of other laws. (26 states and DC)
DC (red)
Note: No credit is given for laws that are subject to secondary enforcement. Please refer to page 10 for law definitions. See “States at a Glance”, beginning on page 36, to determine which laws states lack.
25 Advocates for Highway and Auto Safety January 2016
IMPAIRED DRIVING LAWS Impaired driving remains a substantial and serious safety threat, accounting for nearly a third of all traffic deaths in the U.S. Almost 10,000 people died in crashes involving drunk drivers in 2014. According to NHTSA, alcohol-impaired-driving crashes result in $44 billion in economic costs and $201 billion in comprehensive costs to society annually. Clearly, more still needs to be done to reduce the number of impaired drivers on our roadways.
An average of one alcohol-impaired driving fatality occurred every 53 minutes in 2014. This means that each day in America, 27 people are killed in drunk driving crashes on average. A common misconception is that most people who are convicted of their first drunk driving offense are social drinkers who made one mistake. However, studies show that the average first offender will have driven drunk 87 times before getting arrested. According to the CDC, adult drivers drank too much and got behind the wheel approximately 112 million times in 2010, which equals approximately 300,000 incidents of drinking and driving each day. NHTSA reports that drivers with a BAC of .08% or higher involved in fatal crashes were seven times more likely to have a prior conviction for driving while intoxicated (DWI) than were drivers with no alcohol.
Impaired driving laws target a range of behavioral issues associated with alcohol consumption and operation of a motor vehicle on public roads. Federal leadership in critical areas such as impaired driving has resulted in the rapid adoption of lifesaving laws in states across the country. As a result of federal laws enacted with strong sanctions, all 50 states and DC have adopted .08% BAC laws, a national 21 minimum drinking age, and zero tolerance BAC laws for youth.
January 2016 Advocates for Highway and Auto Safety 26
Ignition Interlock Device Laws A breath alcohol ignition interlock device (IID) is a mechanism similar to a breathalyzer which is linked to a vehicle’s ignition system. Its purpose is to deter an individual who has a prior drunk driving conviction from driving the vehicle with a BAC that exceeds a specified level set by the state IID law. Before the vehicle can be started, the driver must breathe into the device, and if the analyzed result is over the specified legal BAC limit, commonly .02% or .04%, the vehicle will not start. In addition, at random times after the engine has been started, the IID will require another breath sample. This prevents cheating where another person breathes into the device to bypass the system in order to enable an intoxicated person to get behind the wheel and drive. If the breath sample is not provided, or the sample exceeds the ignition interlock's preset BAC, the device will log the event, warn the driver and then set off an alarm (e.g., lights flashing, horn honking, etc.) until the ignition is turned off.
Nearly eight in ten Americans support requiring ignition interlocks for all convicted driving under the influence (DUI ) offenders, even if it is their first conviction, according to the American Automobile Association (AAA). 82% of offenders themselves believe the IID was effective in preventing them from driving after drinking. According to the CDC, when IIDs are installed, they are associated with a reduction in arrest rates for impaired driving of approximately 70%. NHTSA research shows that IIDs reduce recidivism among both first-time and repeat DWI offenders, with reductions in subsequent DWI arrests ranging from 50% to 90% while the interlock is installed on the vehicle.
Credit is given only if a state’s IID law applies to all offenders. Currently, IIDs are mandatory for all offenders, including first time offenders, in only 25 states, including Texas which passed an IID law in 2015. These state laws offer the most effective means for denying drunk drivers the opportunity to get behind the wheel after having been convicted of a drunk driving offense. As such, if a state does not have an optimal IID law, it receives a red rating for impaired driving.
27 Advocates for Highway and Auto Safety January 2016
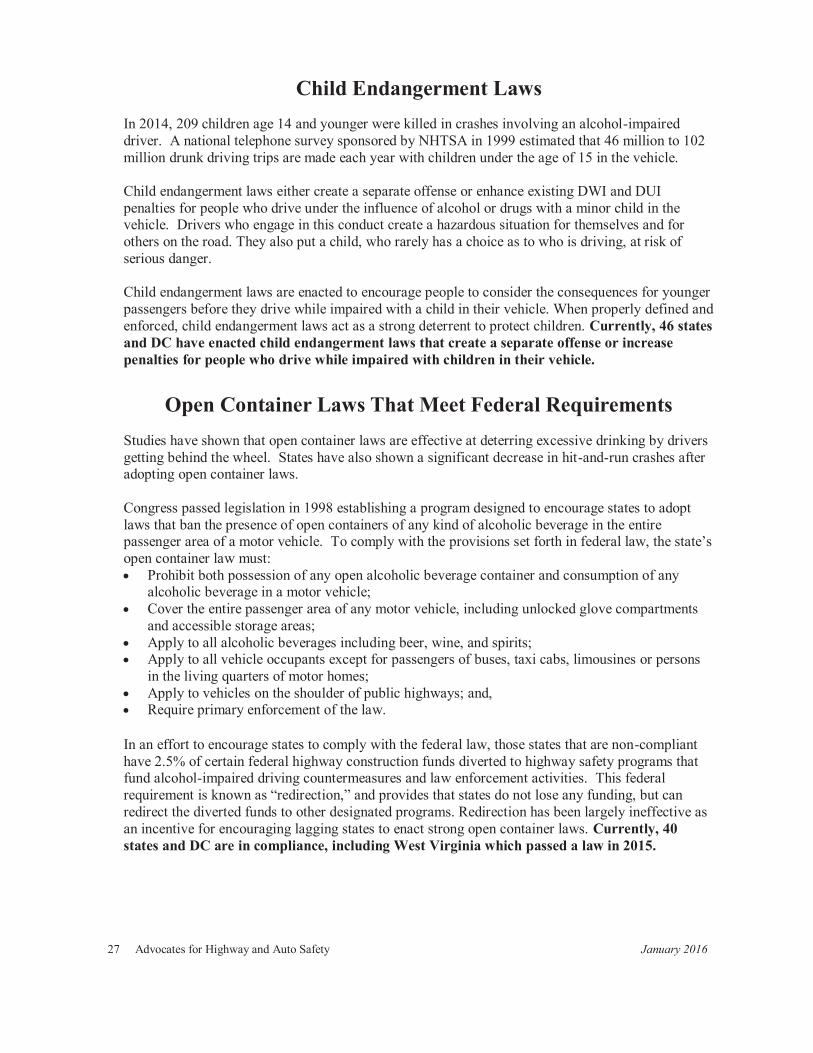
Child Endangerment Laws In 2014, 209 children age 14 and younger were killed in crashes involving an alcohol-impaired driver. A national telephone survey sponsored by NHTSA in 1999 estimated that 46 million to 102 million drunk driving trips are made each year with children under the age of 15 in the vehicle. Child endangerment laws either create a separate offense or enhance existing DWI and DUI penalties for people who drive under the influence of alcohol or drugs with a minor child in the vehicle. Drivers who engage in this conduct create a hazardous situation for themselves and for others on the road. They also put a child, who rarely has a choice as to who is driving, at risk of serious danger. Child endangerment laws are enacted to encourage people to consider the consequences for younger passengers before they drive while impaired with a child in their vehicle. When properly defined and enforced, child endangerment laws act as a strong deterrent to protect children. Currently, 46 states and DC have enacted child endangerment laws that create a separate offense or increase penalties for people who drive while impaired with children in their vehicle.
Open Container Laws That Meet Federal Requirements Studies have shown that open container laws are effective at deterring excessive drinking by drivers getting behind the wheel. States have also shown a significant decrease in hit-and-run crashes after adopting open container laws. Congress passed legislation in 1998 establishing a program designed to encourage states to adopt laws that ban the presence of open containers of any kind of alcoholic beverage in the entire passenger area of a motor vehicle. To comply with the provisions set forth in federal law, the state’s open container law must:
Prohibit both possession of any open alcoholic beverage container and consumption of any alcoholic beverage in a motor vehicle; Cover the entire passenger area of any motor vehicle, including unlocked glove compartments and accessible storage areas; Apply to all alcoholic beverages including beer, wine, and spirits; Apply to all vehicle occupants except for passengers of buses, taxi cabs, limousines or persons in the living quarters of motor homes; Apply to vehicles on the shoulder of public highways; and, Require primary enforcement of the law.
In an effort to encourage states to comply with the federal law, those states that are non-compliant have 2.5% of certain federal highway construction funds diverted to highway safety programs that fund alcohol-impaired driving countermeasures and law enforcement activities. This federal requirement is known as “redirection,” and provides that states do not lose any funding, but can redirect the diverted funds to other designated programs. Redirection has been largely ineffective as an incentive for encouraging lagging states to enact strong open container laws. Currently, 40 states and DC are in compliance, including West Virginia which passed a law in 2015.
January 2016 Advocates for Highway and Auto Safety 28
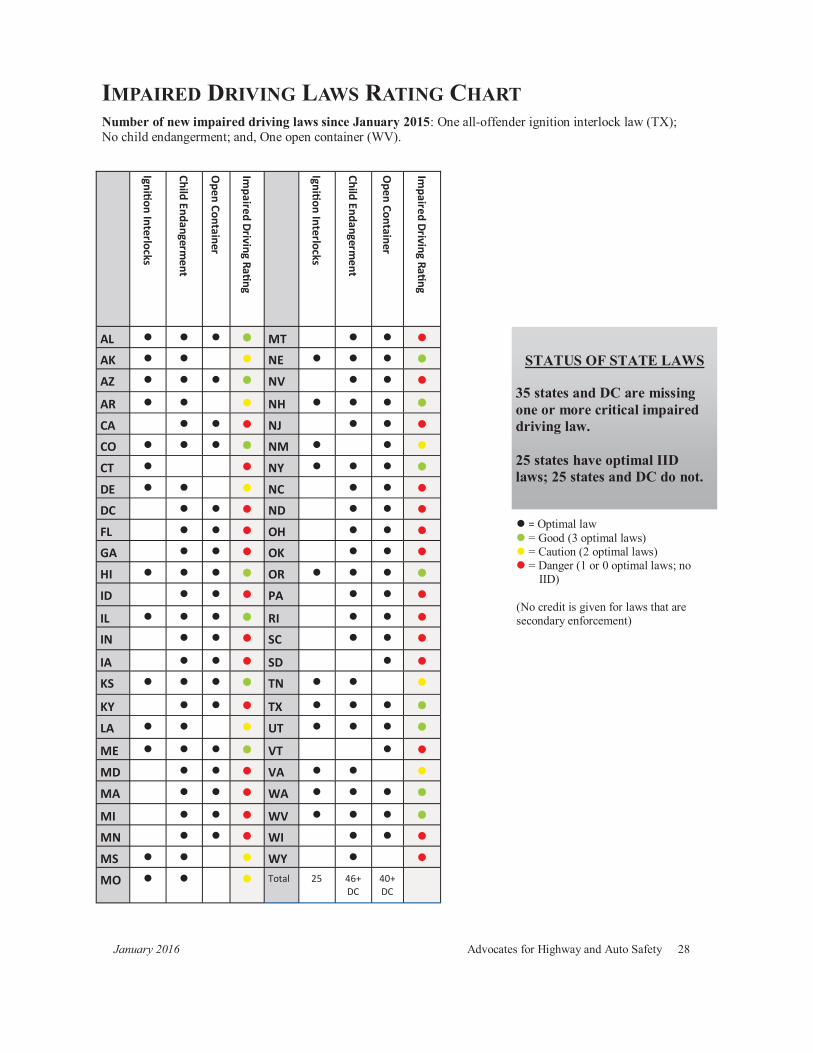
IMPAIRED DRIVING LAWS RATING CHART
Number of new impaired driving laws since January 2015: One all-offender ignition interlock law (TX); No child endangerment; and, One open container (WV).
= Optimal law = Good (3 optimal laws) = Caution (2 optimal laws) = Danger (1 or 0 optimal laws; no
IID) (No credit is given for laws that are secondary enforcement)
Ignion Interlocks
Child Endangerment
Open Container
Impaired Driving Ra
ng
Ignion Interlocks
Child Endangerment
Open Container
Impaired Driving Ra
ng
AL MT
AK NE
AZ NV
AR NH
CA NJ
CO NM
CT NY
DE NC
DC ND
FL OH
GA OK
HI OR
ID PA
IL RI
IN SC
IA SD
KS TN
KY TX
LA UT
ME VT
MD VA
MA WA
MI WV
MN WI
MS WY
MO Total 25 46+ DC
40+ DC
STATUS OF STATE LAWS
35 states and DC are missing one or more critical impaired driving law. 25 states have optimal IID laws; 25 states and DC do not.
29 Advocates for Highway and Auto Safety January 2016
DISTRACTED DRIVING: ALL-DRIVER TEXT MESSAGING RESTRICTION
NC
OH IN
AL TX
FL
GA MS
OK NM AZ
CA NV
UT CO
KS MO
AR
LA
TN SC
KY VA
WV IL
IA NE
WY
ID OR
SD WI MN
ND MT
WA
PA
NY
ME
NH MA CT NJ
DE
MD
RI MI
VT
HI
AK
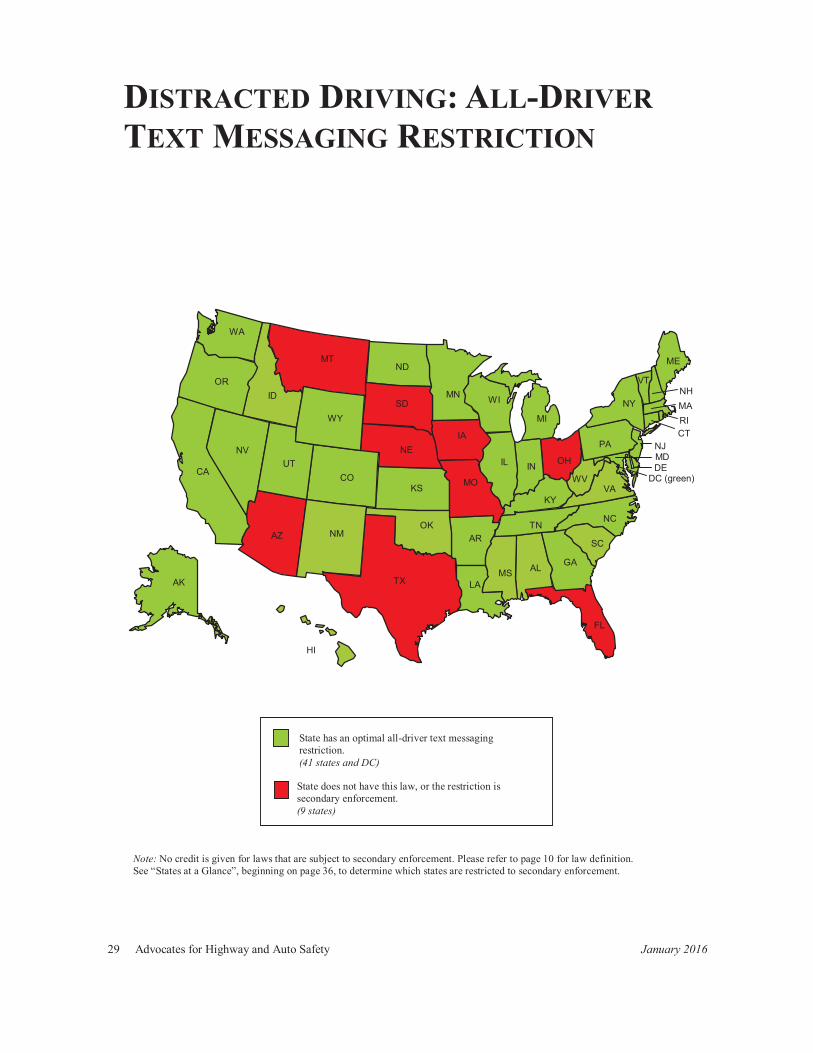
State has an optimal all-driver text messaging restriction. (41 states and DC)
State does not have this law, or the restriction is secondary enforcement. (9 states)
DC (green)
Note: No credit is given for laws that are subject to secondary enforcement. Please refer to page 10 for law definition. See “States at a Glance”, beginning on page 36, to determine which states are restricted to secondary enforcement.
January 2016 Advocates for Highway and Auto Safety 30
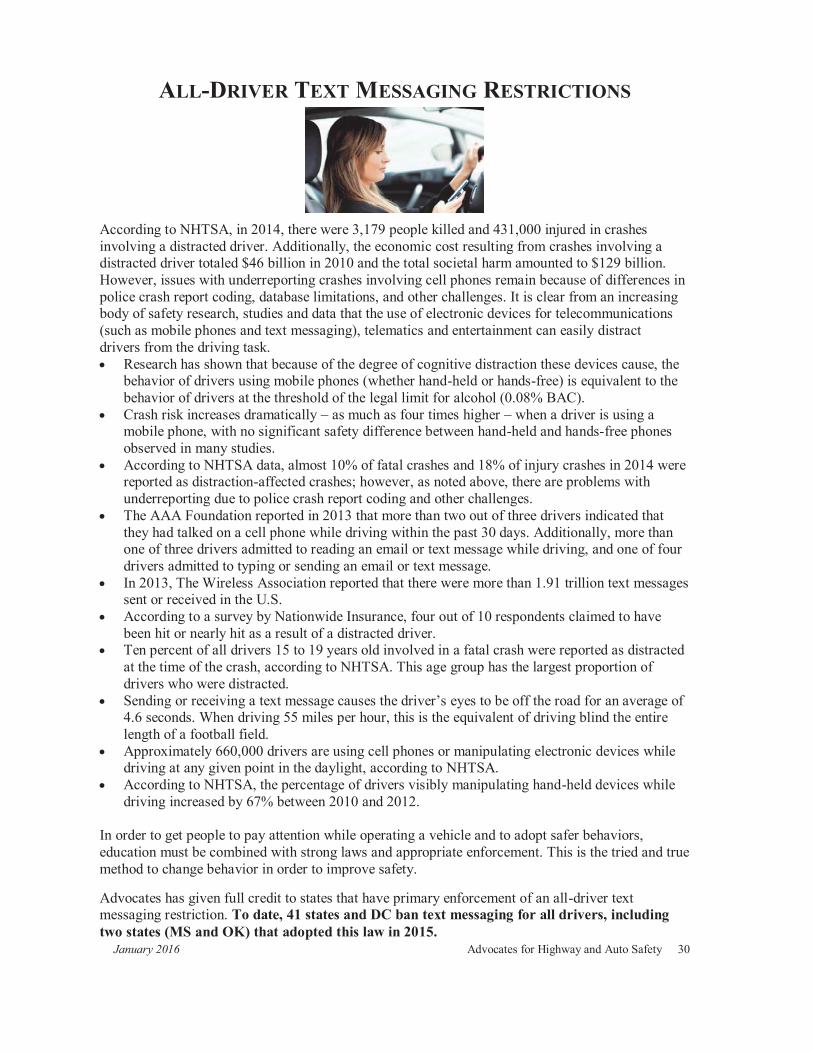
ALL-DRIVER TEXT MESSAGING RESTRICTIONS According to NHTSA, in 2014, there were 3,179 people killed and 431,000 injured in crashes involving a distracted driver. Additionally, the economic cost resulting from crashes involving a distracted driver totaled $46 billion in 2010 and the total societal harm amounted to $129 billion. However, issues with underreporting crashes involving cell phones remain because of differences in police crash report coding, database limitations, and other challenges. It is clear from an increasing body of safety research, studies and data that the use of electronic devices for telecommunications (such as mobile phones and text messaging), telematics and entertainment can easily distract drivers from the driving task.
Research has shown that because of the degree of cognitive distraction these devices cause, the behavior of drivers using mobile phones (whether hand-held or hands-free) is equivalent to the behavior of drivers at the threshold of the legal limit for alcohol (0.08% BAC). Crash risk increases dramatically – as much as four times higher – when a driver is using a mobile phone, with no significant safety difference between hand-held and hands-free phones observed in many studies. According to NHTSA data, almost 10% of fatal crashes and 18% of injury crashes in 2014 were reported as distraction-affected crashes; however, as noted above, there are problems with underreporting due to police crash report coding and other challenges. The AAA Foundation reported in 2013 that more than two out of three drivers indicated that they had talked on a cell phone while driving within the past 30 days. Additionally, more than one of three drivers admitted to reading an email or text message while driving, and one of four drivers admitted to typing or sending an email or text message. In 2013, The Wireless Association reported that there were more than 1.91 trillion text messages sent or received in the U.S. According to a survey by Nationwide Insurance, four out of 10 respondents claimed to have been hit or nearly hit as a result of a distracted driver. Ten percent of all drivers 15 to 19 years old involved in a fatal crash were reported as distracted at the time of the crash, according to NHTSA. This age group has the largest proportion of drivers who were distracted. Sending or receiving a text message causes the driver’s eyes to be off the road for an average of 4.6 seconds. When driving 55 miles per hour, this is the equivalent of driving blind the entire length of a football field. Approximately 660,000 drivers are using cell phones or manipulating electronic devices while driving at any given point in the daylight, according to NHTSA. According to NHTSA, the percentage of drivers visibly manipulating hand-held devices while driving increased by 67% between 2010 and 2012.
In order to get people to pay attention while operating a vehicle and to adopt safer behaviors, education must be combined with strong laws and appropriate enforcement. This is the tried and true method to change behavior in order to improve safety. Advocates has given full credit to states that have primary enforcement of an all-driver text messaging restriction. To date, 41 states and DC ban text messaging for all drivers, including two states (MS and OK) that adopted this law in 2015.
31 Advocates for Highway and Auto Safety January 2016
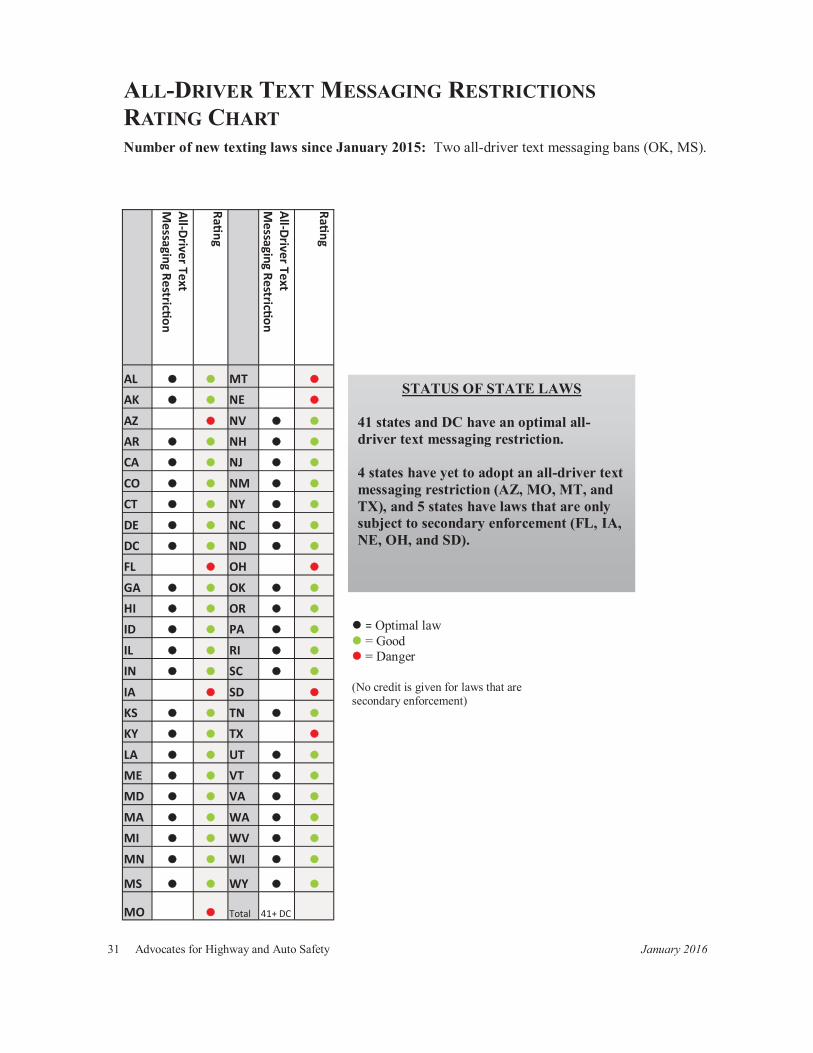
ALL-DRIVER TEXT MESSAGING RESTRICTIONS RATING CHART
Number of new texting laws since January 2015: Two all-driver text messaging bans (OK, MS).
All-Driver Text M
essaging Restricon
Rang
All-Driver Text M
essaging Restricon
Rang
AL MT AK NE AZ NV AR NH CA NJ CO NM CT NY DE NC DC ND FL OH GA OK HI OR ID PA IL RI IN SC IA SD KS TN KY TX LA UT ME VT MD VA MA WA MI WV MN WI
MS WY
MO Total 41+ DC
= Optimal law = Good = Danger
(No credit is given for laws that are secondary enforcement)
STATUS OF STATE LAWS 41 states and DC have an optimal all-driver text messaging restriction. 4 states have yet to adopt an all-driver text messaging restriction (AZ, MO, MT, and TX), and 5 states have laws that are only subject to secondary enforcement (FL, IA, NE, OH, and SD).
January 2016 Advocates for Highway and Auto Safety 32
OVERALL STATE RATINGS BASED ON TOTAL NUMBER OF LAWS
On the following pages, Advocates has given an overall rating to the states based on the number of laws in each state that are recommended in this report. Credit is given only when the law meets Advocates’ optimal law recommendations (see pages 9-10 for law definitions). No credit is given for laws that are subject to secondary enforcement or have a driver education exemption. The overall rating takes into consideration whether a state has certain occupant protection laws. No state without a primary enforcement seat belt law covering passengers in all seating positions (front and rear) or that has repealed an existing all-rider motorcycle helmet law within the previous 10 years, is eligible for a green overall rating, no matter how many other laws it may have. This weighting is to emphasize the significance of comprehensive primary enforcement seat belt laws and all-rider motorcycle helmet laws in saving lives and reducing injuries.
33 Advocates for Highway and Auto Safety January 2016
NC
OH IN
AL TX
FL
GA MS
OK NM AZ
CA NV
UT CO
KS MO
AR
LA
TN SC
KY VA
IL
IA NE
WY
ID OR
SD WI MN
ND MT
WA
PA
NY
ME
NH MA
CT NJ
DC (green) DE MD
RI MI
HI
AK
VT
WV
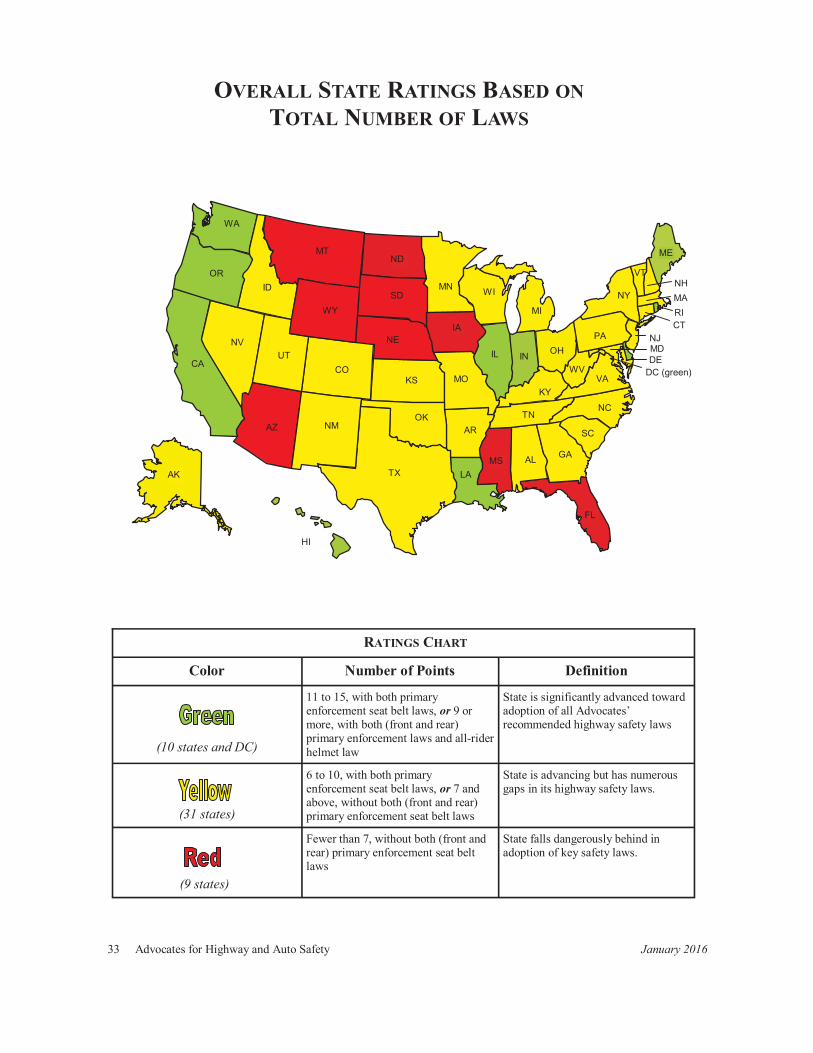
OVERALL STATE RATINGS BASED ON TOTAL NUMBER OF LAWS
RATINGS CHART
Color Number of Points Definition
11 to 15, with both primary enforcement seat belt laws, or 9 or more, with both (front and rear) primary enforcement laws and all-rider helmet law
State is significantly advanced toward adoption of all Advocates’ recommended highway safety laws
6 to 10, with both primary enforcement seat belt laws, or 7 and above, without both (front and rear) primary enforcement seat belt laws
State is advancing but has numerous gaps in its highway safety laws.
Fewer than 7, without both (front and rear) primary enforcement seat belt laws
State falls dangerously behind in adoption of key safety laws.
(10 states and DC)
(31 states)
(9 states)
January 2016 Advocates for Highway and Auto Safety 34
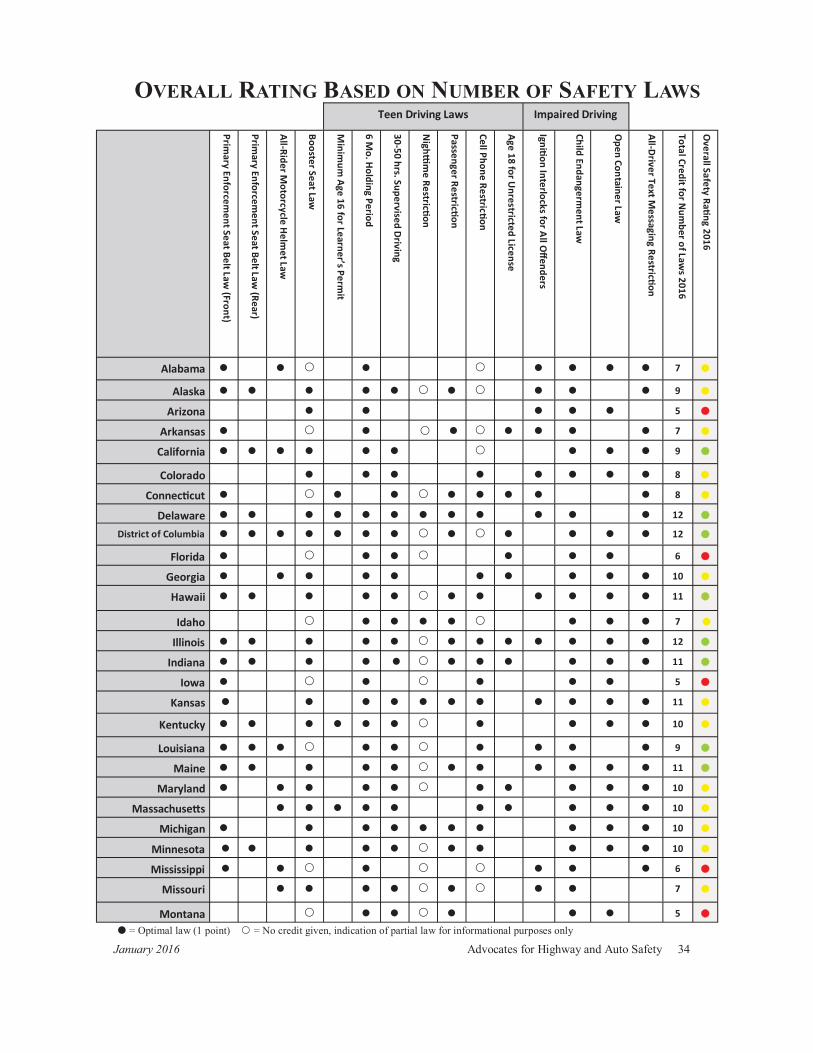
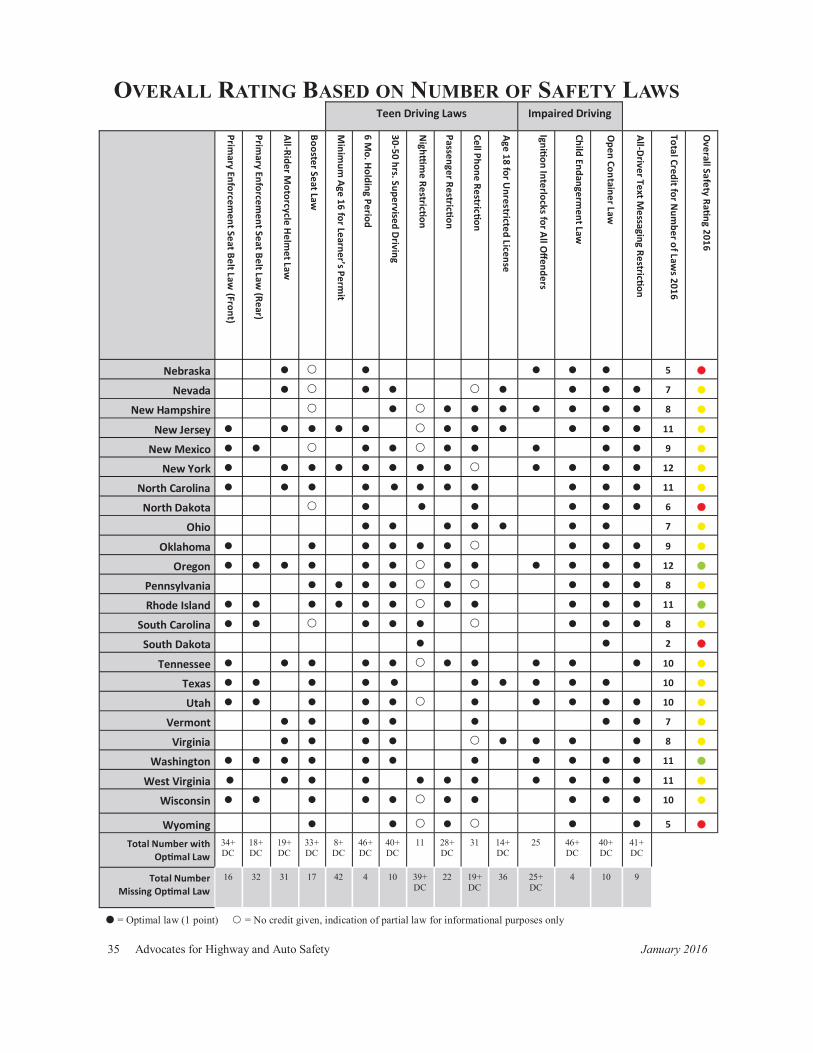
OVERALL RATING BASED ON NUMBER OF SAFETY LAWS
Teen Driving Laws Impaired Driving
Primary Enforcem
ent Seat Belt Law (Front)
All-Rider Motorcycle H
elmet Law
Booster Seat Law
Minim
um Age 16 for Learner’s Perm
it
6 Mo. Holding Period
30-50 hrs. Supervised Driving
Nigh
me Restric
on
Passenger Restricon
Cell Phone Restricon
Age 18 for Unrestricted License
Ignion Interlocks for All O
ffenders
Child Endangerment Law
Open Container Law
All-Driver Text Messaging Restric
on
Total Credit for Num
ber of Laws 2016
Overall Safety Ra
ng 2016
Primary Enforcem
ent Seat Belt Law (Rear)
Alabama 7
Alaska 9
Arizona 5
Arkansas 7
California 9
Colorado 8
Connec cut 8
Delaware 12 District of Columbia 12
Florida 6
Georgia 10
Hawaii 11
Idaho 7
Illinois 12
Indiana 11
Iowa 5
Kansas 11
Kentucky 10
Louisiana 9
Maine 11
Maryland 10
Massachuse s 10
Michigan 10
Minnesota 10
Mississippi 6
Missouri 7
Montana 5 = Optimal law (1 point) = No credit given, indication of partial law for informational purposes only
35 Advocates for Highway and Auto Safety January 2016
Teen Driving Laws Impaired Driving
Primary Enforcem
ent Seat Belt Law (Front)
All-Rider Motorcycle H
elmet Law
Booster Seat Law
Minim
um Age 16 for Learner’s Perm
it
6 Mo. Holding Period
30-50 hrs. Supervised Driving
Nigh
me Restric
on
Passenger Restricon
Cell Phone Restricon
Age 18 for Unrestricted License
Ignion Interlocks for All O
ffenders
Child Endangerment Law
Open Container Law
All-Driver Text Messaging Restric
on
Total Credit for Num
ber of Laws 2016
Overall Safety Ra
ng 2016
Primary Enforcem
ent Seat Belt Law (Rear)
Nebraska 5
Nevada 7
New Hampshire 8
New Jersey 11
New Mexico 9
New York 12
North Carolina 11
North Dakota 6
Ohio 7
Oklahoma 9
Oregon 12
Pennsylvania 8
Rhode Island 11
South Carolina 8
South Dakota 2
Tennessee 10
Texas 10
Utah 10
Vermont 7
Virginia 8
Washington 11
West Virginia 11
Wisconsin 10
Wyoming 5 Total Number with
Op mal Law 34+ DC
19+ DC
33+ DC
8+ DC
46+ DC
40+ DC
11 28+ DC
31 14+ DC
25 46+ DC
40+ DC
41+ DC
18+ DC
Total Number Missing Op mal Law
16 31 17 42 4 10 39+ DC
22 19+DC
36 25+ DC
4 10 9 32
OVERALL RATING BASED ON NUMBER OF SAFETY LAWS
= Optimal law (1 point) = No credit given, indication of partial law for informational purposes only
January 2016 Advocates for Highway and Auto Safety 36
STATES AT A GLANCE Each state and DC are graphically represented in alphabetical order with the following information: • The number of people killed in motor vehicle crashes in each state for the year 2014, as reported
by NHTSA. • The total number of fatalities over the past 10 years, as reported by NHTSA.
• The annual economic cost of motor vehicle crashes to the state, as reported in The Economic
and Societal Impact of Motor Vehicle Crashes, 2010 (NHTSA). (See chart on page 6.)
• The state’s background color represents its overall rating (Green, Yellow or Red) based on the chart on pages 34 and 35 of this report.
• A list of any of the 15 optimal lifesaving laws that the state has not enacted, based on
Advocates’ definitions on pages 9 and 10 as discussed in this report.
States are credited with having laws only if their laws meet Advocates’ optimal criteria (definitions on pages 9 and 10).
Only 10 states and DC (CA, DE, HI, IL, IN, LA, ME, OR, RI, and WA) received a Green rating, showing significant advancement toward adopting all of Advocates’ recommended optimal laws. 31 states (AL, AK, AR, CO, CT, GA, ID, KS, KY, MD, MA, MI, MN, MO, NV, NH, NJ, NM, NY, NC, OH, OK, PA, SC, TN, TX, UT, VT, VA, WI and WV) received a Yellow rating, showing moderately positive performance but with numerous gaps still in their highway safety laws. 9 states (AZ, FL, IA, MS, MT, NE, ND, SD, and WY) received a Red rating, indicating poor performance because of a dangerous lack of basic safety laws.
Abbreviation Key (Explanation for Laws Needed): S = Highway Safety Law is Secondary Enforcement (Advocates gives no credit for any law that is subject to secondary enforcement.) DE = Driver Education exemption included in the GDL provision (Advocates gives no credit for any GDL provision that is exempted based on driver education.)
Note: States without a primary enforcement seat belt law covering passengers in all seating positions (front and rear) or that have repealed an existing all-rider motorcycle helmet law within the previous 10 years are not eligible for a green rating, no matter how many other optimal laws they may have.
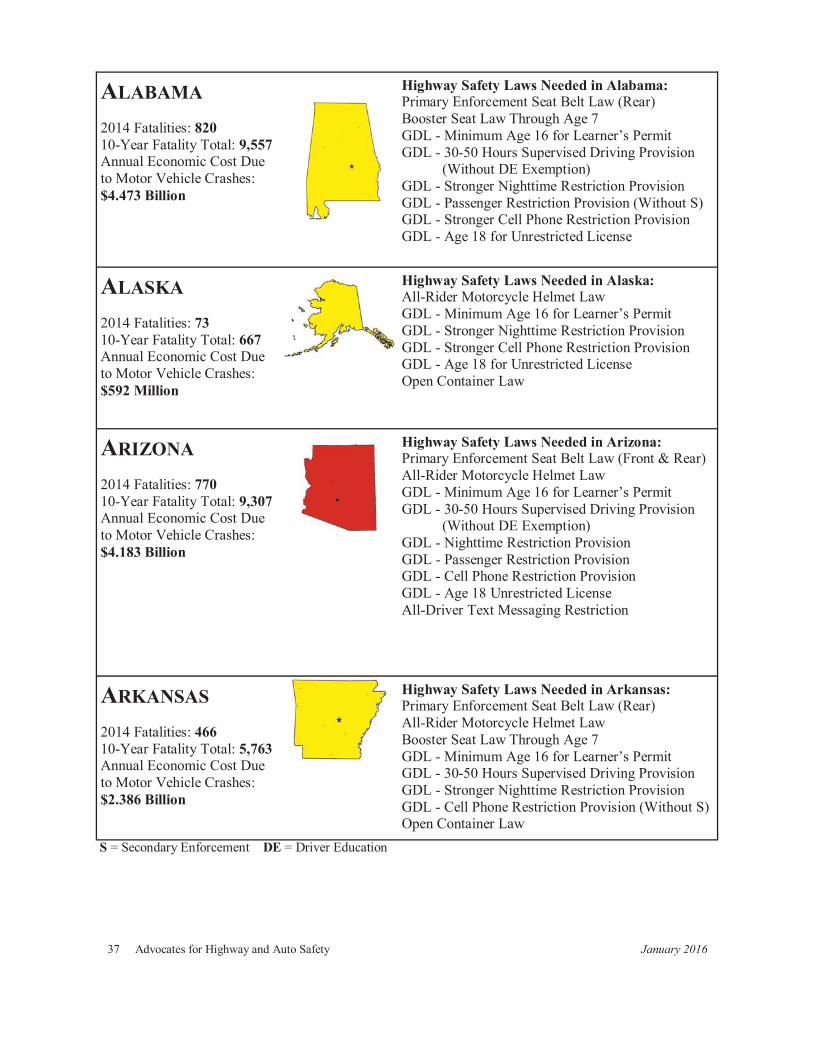
37 Advocates for Highway and Auto Safety January 2016
ALABAMA
2014 Fatalities: 820 10-Year Fatality Total: 9,557 Annual Economic Cost Due to Motor Vehicle Crashes: $4.473 Billion
Highway Safety Laws Needed in Alabama: Primary Enforcement Seat Belt Law (Rear) Booster Seat Law Through Age 7 GDL - Minimum Age 16 for Learner’s Permit GDL - 30-50 Hours Supervised Driving Provision (Without DE Exemption) GDL - Stronger Nighttime Restriction Provision GDL - Passenger Restriction Provision (Without S) GDL - Stronger Cell Phone Restriction Provision GDL - Age 18 for Unrestricted License
ALASKA
2014 Fatalities: 73 10-Year Fatality Total: 667 Annual Economic Cost Due to Motor Vehicle Crashes: $592 Million
Highway Safety Laws Needed in Alaska: All-Rider Motorcycle Helmet Law GDL - Minimum Age 16 for Learner’s Permit GDL - Stronger Nighttime Restriction Provision GDL - Stronger Cell Phone Restriction Provision GDL - Age 18 for Unrestricted License Open Container Law
ARIZONA 2014 Fatalities: 770 10-Year Fatality Total: 9,307 Annual Economic Cost Due to Motor Vehicle Crashes: $4.183 Billion
Highway Safety Laws Needed in Arizona: Primary Enforcement Seat Belt Law (Front & Rear) All-Rider Motorcycle Helmet Law GDL - Minimum Age 16 for Learner’s Permit GDL - 30-50 Hours Supervised Driving Provision (Without DE Exemption) GDL - Nighttime Restriction Provision GDL - Passenger Restriction Provision GDL - Cell Phone Restriction Provision GDL - Age 18 Unrestricted License All-Driver Text Messaging Restriction
ARKANSAS 2014 Fatalities: 466 10-Year Fatality Total: 5,763 Annual Economic Cost Due to Motor Vehicle Crashes: $2.386 Billion
Highway Safety Laws Needed in Arkansas: Primary Enforcement Seat Belt Law (Rear) All-Rider Motorcycle Helmet Law Booster Seat Law Through Age 7 GDL - Minimum Age 16 for Learner’s Permit GDL - 30-50 Hours Supervised Driving Provision GDL - Stronger Nighttime Restriction Provision GDL - Cell Phone Restriction Provision (Without S) Open Container Law
S = Secondary Enforcement DE = Driver Education
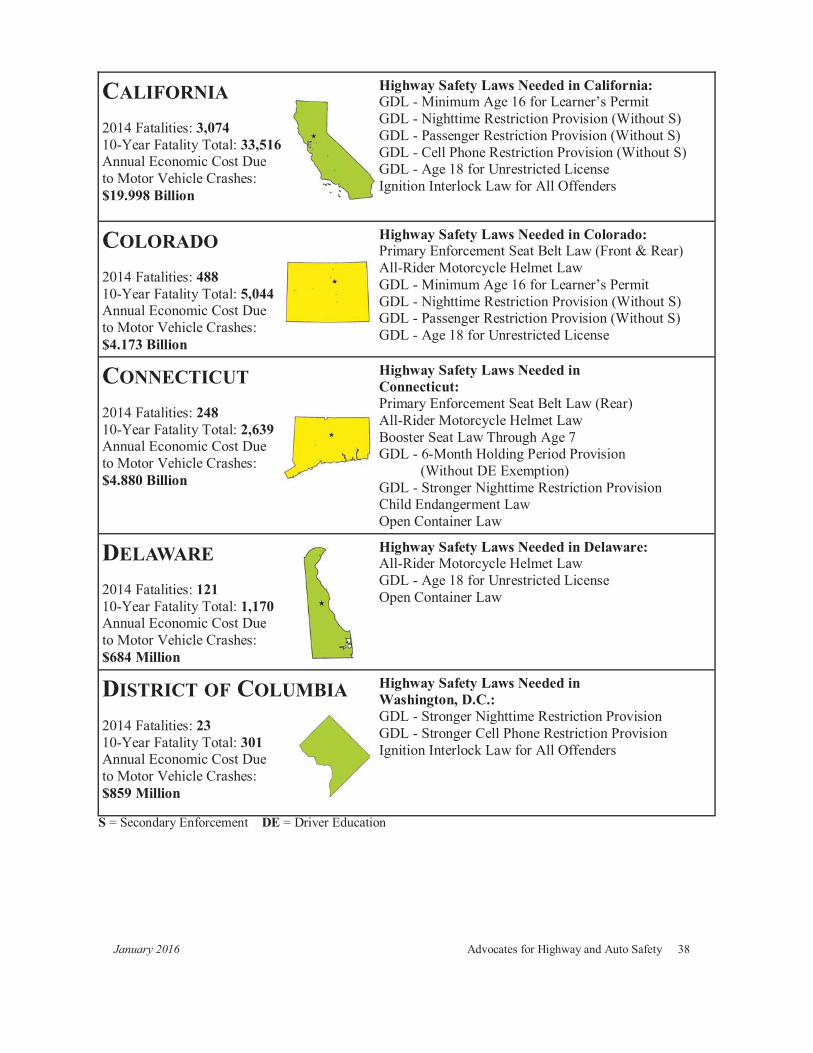
January 2016 Advocates for Highway and Auto Safety 38
CALIFORNIA 2014 Fatalities: 3,074 10-Year Fatality Total: 33,516 Annual Economic Cost Due to Motor Vehicle Crashes: $19.998 Billion
Highway Safety Laws Needed in California: GDL - Minimum Age 16 for Learner’s Permit GDL - Nighttime Restriction Provision (Without S) GDL - Passenger Restriction Provision (Without S) GDL - Cell Phone Restriction Provision (Without S) GDL - Age 18 for Unrestricted License Ignition Interlock Law for All Offenders
COLORADO
2014 Fatalities: 488 10-Year Fatality Total: 5,044 Annual Economic Cost Due to Motor Vehicle Crashes: $4.173 Billion
Highway Safety Laws Needed in Colorado: Primary Enforcement Seat Belt Law (Front & Rear) All-Rider Motorcycle Helmet Law GDL - Minimum Age 16 for Learner’s Permit GDL - Nighttime Restriction Provision (Without S) GDL - Passenger Restriction Provision (Without S) GDL - Age 18 for Unrestricted License
CONNECTICUT
2014 Fatalities: 248 10-Year Fatality Total: 2,639 Annual Economic Cost Due to Motor Vehicle Crashes: $4.880 Billion
Highway Safety Laws Needed in Connecticut: Primary Enforcement Seat Belt Law (Rear) All-Rider Motorcycle Helmet Law Booster Seat Law Through Age 7 GDL - 6-Month Holding Period Provision
(Without DE Exemption) GDL - Stronger Nighttime Restriction Provision Child Endangerment Law Open Container Law
DELAWARE 2014 Fatalities: 121 10-Year Fatality Total: 1,170 Annual Economic Cost Due to Motor Vehicle Crashes: $684 Million
Highway Safety Laws Needed in Delaware: All-Rider Motorcycle Helmet Law GDL - Age 18 for Unrestricted License Open Container Law
DISTRICT OF COLUMBIA 2014 Fatalities: 23 10-Year Fatality Total: 301 Annual Economic Cost Due to Motor Vehicle Crashes: $859 Million
Highway Safety Laws Needed in Washington, D.C.: GDL - Stronger Nighttime Restriction Provision GDL - Stronger Cell Phone Restriction Provision Ignition Interlock Law for All Offenders
S = Secondary Enforcement DE = Driver Education
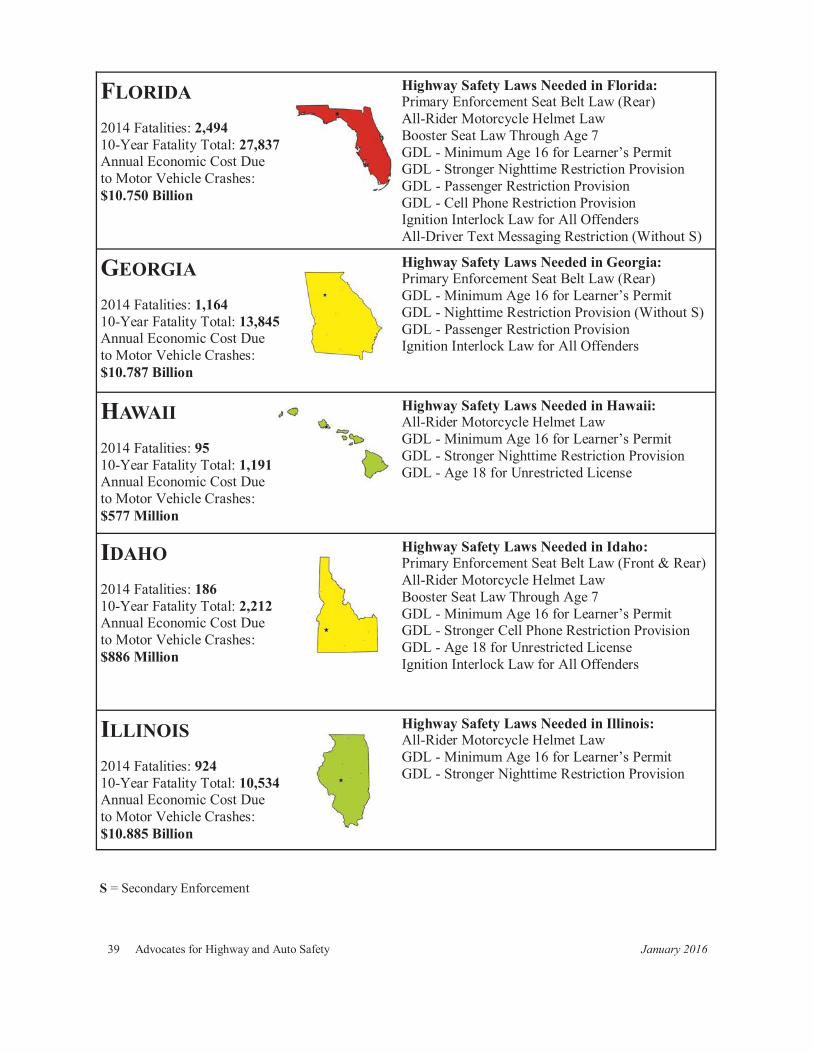
39 Advocates for Highway and Auto Safety January 2016
FLORIDA 2014 Fatalities: 2,494 10-Year Fatality Total: 27,837 Annual Economic Cost Due to Motor Vehicle Crashes: $10.750 Billion
Highway Safety Laws Needed in Florida: Primary Enforcement Seat Belt Law (Rear) All-Rider Motorcycle Helmet Law Booster Seat Law Through Age 7 GDL - Minimum Age 16 for Learner’s Permit GDL - Stronger Nighttime Restriction Provision GDL - Passenger Restriction Provision GDL - Cell Phone Restriction Provision Ignition Interlock Law for All Offenders All-Driver Text Messaging Restriction (Without S)
GEORGIA 2014 Fatalities: 1,164 10-Year Fatality Total: 13,845 Annual Economic Cost Due to Motor Vehicle Crashes: $10.787 Billion
Highway Safety Laws Needed in Georgia: Primary Enforcement Seat Belt Law (Rear) GDL - Minimum Age 16 for Learner’s Permit GDL - Nighttime Restriction Provision (Without S) GDL - Passenger Restriction Provision Ignition Interlock Law for All Offenders
HAWAII
2014 Fatalities: 95 10-Year Fatality Total: 1,191 Annual Economic Cost Due to Motor Vehicle Crashes: $577 Million
Highway Safety Laws Needed in Hawaii: All-Rider Motorcycle Helmet Law GDL - Minimum Age 16 for Learner’s Permit GDL - Stronger Nighttime Restriction Provision GDL - Age 18 for Unrestricted License
IDAHO 2014 Fatalities: 186 10-Year Fatality Total: 2,212 Annual Economic Cost Due to Motor Vehicle Crashes: $886 Million
Highway Safety Laws Needed in Idaho: Primary Enforcement Seat Belt Law (Front & Rear) All-Rider Motorcycle Helmet Law Booster Seat Law Through Age 7 GDL - Minimum Age 16 for Learner’s Permit GDL - Stronger Cell Phone Restriction Provision GDL - Age 18 for Unrestricted License Ignition Interlock Law for All Offenders
ILLINOIS 2014 Fatalities: 924 10-Year Fatality Total: 10,534 Annual Economic Cost Due to Motor Vehicle Crashes: $10.885 Billion
Highway Safety Laws Needed in Illinois: All-Rider Motorcycle Helmet Law GDL - Minimum Age 16 for Learner’s Permit GDL - Stronger Nighttime Restriction Provision
S = Secondary Enforcement
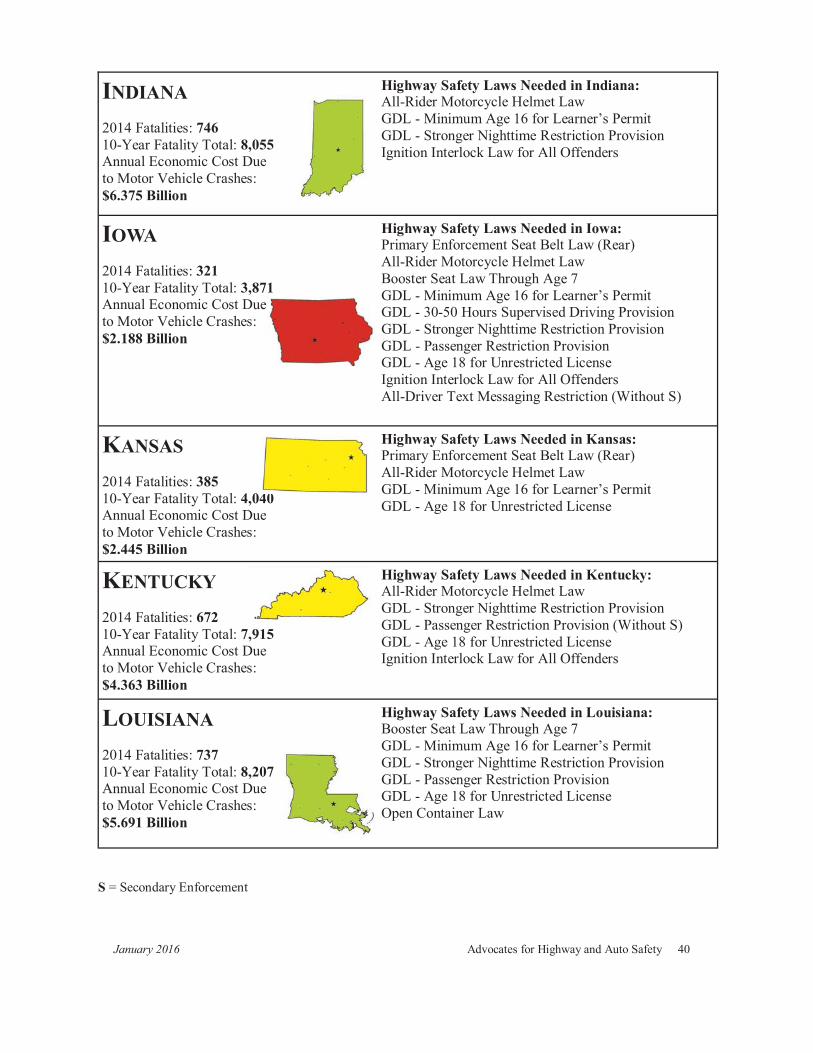
January 2016 Advocates for Highway and Auto Safety 40
INDIANA 2014 Fatalities: 746 10-Year Fatality Total: 8,055 Annual Economic Cost Due to Motor Vehicle Crashes: $6.375 Billion
Highway Safety Laws Needed in Indiana: All-Rider Motorcycle Helmet Law GDL - Minimum Age 16 for Learner’s Permit GDL - Stronger Nighttime Restriction Provision Ignition Interlock Law for All Offenders
IOWA 2014 Fatalities: 321 10-Year Fatality Total: 3,871 Annual Economic Cost Due to Motor Vehicle Crashes: $2.188 Billion
Highway Safety Laws Needed in Iowa: Primary Enforcement Seat Belt Law (Rear) All-Rider Motorcycle Helmet Law Booster Seat Law Through Age 7 GDL - Minimum Age 16 for Learner’s Permit GDL - 30-50 Hours Supervised Driving Provision GDL - Stronger Nighttime Restriction Provision GDL - Passenger Restriction Provision GDL - Age 18 for Unrestricted License Ignition Interlock Law for All Offenders All-Driver Text Messaging Restriction (Without S)
KANSAS 2014 Fatalities: 385 10-Year Fatality Total: 4,040 Annual Economic Cost Due to Motor Vehicle Crashes: $2.445 Billion
Highway Safety Laws Needed in Kansas: Primary Enforcement Seat Belt Law (Rear) All-Rider Motorcycle Helmet Law GDL - Minimum Age 16 for Learner’s Permit GDL - Age 18 for Unrestricted License
KENTUCKY 2014 Fatalities: 672 10-Year Fatality Total: 7,915 Annual Economic Cost Due to Motor Vehicle Crashes: $4.363 Billion
Highway Safety Laws Needed in Kentucky: All-Rider Motorcycle Helmet Law GDL - Stronger Nighttime Restriction Provision GDL - Passenger Restriction Provision (Without S) GDL - Age 18 for Unrestricted License Ignition Interlock Law for All Offenders
LOUISIANA 2014 Fatalities: 737 10-Year Fatality Total: 8,207 Annual Economic Cost Due to Motor Vehicle Crashes: $5.691 Billion
Highway Safety Laws Needed in Louisiana: Booster Seat Law Through Age 7 GDL - Minimum Age 16 for Learner’s Permit GDL - Stronger Nighttime Restriction Provision GDL - Passenger Restriction Provision GDL - Age 18 for Unrestricted License Open Container Law
S = Secondary Enforcement

41 Advocates for Highway and Auto Safety January 2016
MAINE 2014 Fatalities: 131 10-Year Fatality Total: 1,591 Annual Economic Cost Due to Motor Vehicle Crashes: $1.303 Billion
Highway Safety Laws Needed in Maine: All-Rider Motorcycle Helmet Law GDL - Minimum Age 16 for Learner’s Permit GDL - Stronger Nighttime Restriction Provision GDL - Age 18 for Unrestricted License
MARYLAND 2014 Fatalities: 442 10-Year Fatality Total: 5,407 Annual Economic Cost Due to Motor Vehicle Crashes: $4.476 Billion
Highway Safety Laws Needed in Maryland: Primary Enforcement Seat Belt Law (Rear) GDL - Minimum Age 16 for Learner’s Permit GDL - Stronger Nighttime Restriction Provision GDL - Passenger Restriction Provision Ignition Interlock Law for All Offenders
MASSACHUSETTS 2014 Fatalities: 328 10-Year Fatality Total: 3,677 Annual Economic Cost Due to Motor Vehicle Crashes: $5.835 Billion
Highway Safety Laws Needed in Massachusetts: Primary Enforcement Seat Belt Law (Front & Rear) GDL - Nighttime Restriction Provision (Without S) GDL - Passenger Restriction Provision (Without S) Ignition Interlock Law for All Offenders
MICHIGAN 2014 Fatalities: 901 10-Year Fatality Total: 9,770 Annual Economic Cost Due to Motor Vehicle Crashes: $9.599 Billion
Highway Safety Laws Needed in Michigan: Primary Enforcement Seat Belt Law (Rear) All-Rider Motorcycle Helmet Law GDL - Minimum Age 16 for Learner’s Permit GDL - Age 18 for Unrestricted License Ignition Interlock Law for All Offenders
MINNESOTA 2014 Fatalities: 361 10-Year Fatality Total: 4,356 Annual Economic Cost Due to Motor Vehicle Crashes: $3.057 Billion
Highway Safety Laws Needed in Minnesota: All-Rider Motorcycle Helmet Law GDL - Minimum Age 16 for Learner’s Permit GDL - Stronger Nighttime Restriction Provision GDL - Age 18 for Unrestricted License Ignition Interlock Law for All Offenders
S = Secondary Enforcement
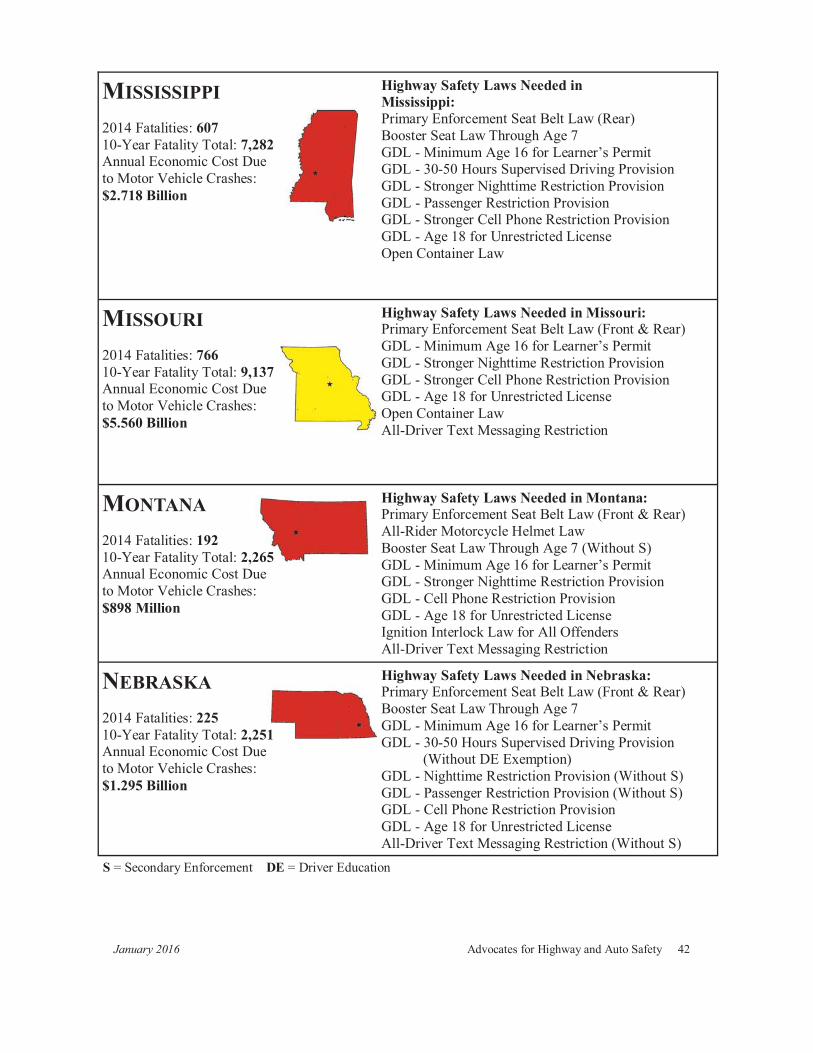
January 2016 Advocates for Highway and Auto Safety 42
MISSISSIPPI 2014 Fatalities: 607 10-Year Fatality Total: 7,282 Annual Economic Cost Due to Motor Vehicle Crashes: $2.718 Billion
Highway Safety Laws Needed in Mississippi: Primary Enforcement Seat Belt Law (Rear) Booster Seat Law Through Age 7 GDL - Minimum Age 16 for Learner’s Permit GDL - 30-50 Hours Supervised Driving Provision GDL - Stronger Nighttime Restriction Provision GDL - Passenger Restriction Provision GDL - Stronger Cell Phone Restriction Provision GDL - Age 18 for Unrestricted License Open Container Law
MISSOURI 2014 Fatalities: 766 10-Year Fatality Total: 9,137 Annual Economic Cost Due to Motor Vehicle Crashes: $5.560 Billion
Highway Safety Laws Needed in Missouri: Primary Enforcement Seat Belt Law (Front & Rear) GDL - Minimum Age 16 for Learner’s Permit GDL - Stronger Nighttime Restriction Provision GDL - Stronger Cell Phone Restriction Provision GDL - Age 18 for Unrestricted License Open Container Law All-Driver Text Messaging Restriction
MONTANA 2014 Fatalities: 192 10-Year Fatality Total: 2,265 Annual Economic Cost Due to Motor Vehicle Crashes: $898 Million
Highway Safety Laws Needed in Montana: Primary Enforcement Seat Belt Law (Front & Rear) All-Rider Motorcycle Helmet Law Booster Seat Law Through Age 7 (Without S) GDL - Minimum Age 16 for Learner’s Permit GDL - Stronger Nighttime Restriction Provision GDL - Cell Phone Restriction Provision GDL - Age 18 for Unrestricted License Ignition Interlock Law for All Offenders All-Driver Text Messaging Restriction
NEBRASKA 2014 Fatalities: 225 10-Year Fatality Total: 2,251 Annual Economic Cost Due to Motor Vehicle Crashes: $1.295 Billion
Highway Safety Laws Needed in Nebraska: Primary Enforcement Seat Belt Law (Front & Rear) Booster Seat Law Through Age 7 GDL - Minimum Age 16 for Learner’s Permit GDL - 30-50 Hours Supervised Driving Provision
(Without DE Exemption) GDL - Nighttime Restriction Provision (Without S) GDL - Passenger Restriction Provision (Without S) GDL - Cell Phone Restriction Provision GDL - Age 18 for Unrestricted License All-Driver Text Messaging Restriction (Without S)
S = Secondary Enforcement DE = Driver Education
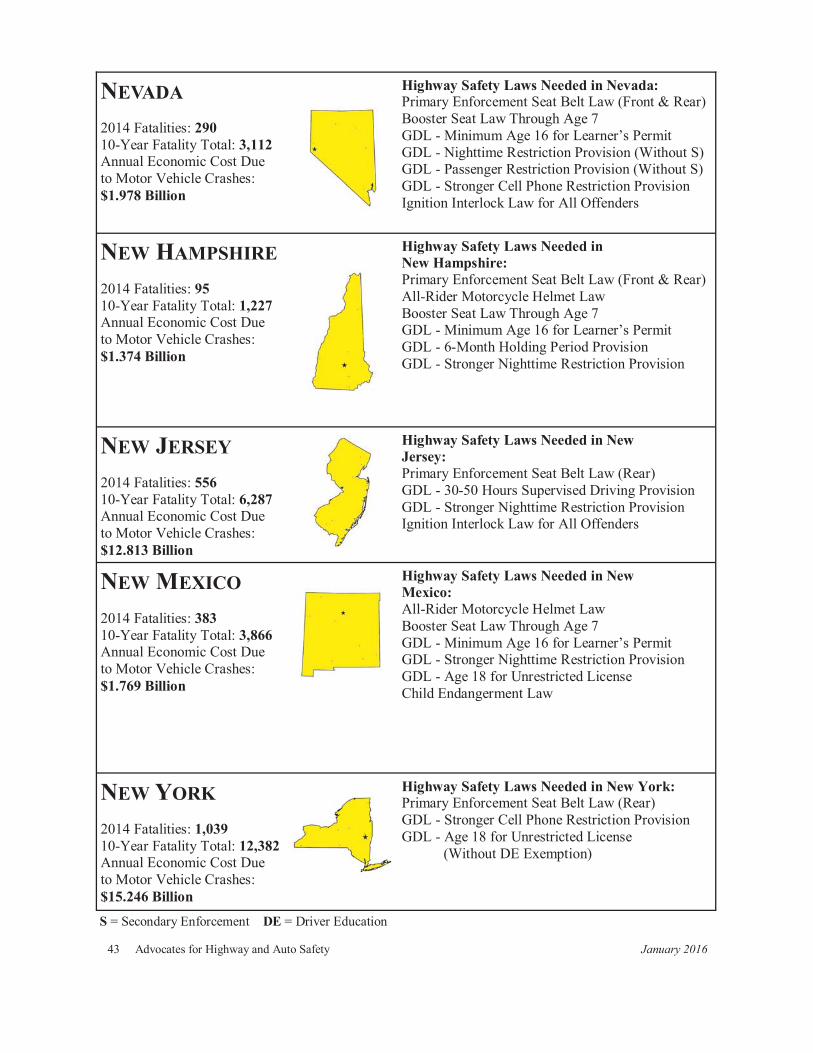
43 Advocates for Highway and Auto Safety January 2016
S = Secondary Enforcement DE = Driver Education
NEVADA 2014 Fatalities: 290 10-Year Fatality Total: 3,112 Annual Economic Cost Due to Motor Vehicle Crashes: $1.978 Billion
Highway Safety Laws Needed in Nevada: Primary Enforcement Seat Belt Law (Front & Rear) Booster Seat Law Through Age 7 GDL - Minimum Age 16 for Learner’s Permit GDL - Nighttime Restriction Provision (Without S) GDL - Passenger Restriction Provision (Without S) GDL - Stronger Cell Phone Restriction Provision Ignition Interlock Law for All Offenders
NEW HAMPSHIRE 2014 Fatalities: 95 10-Year Fatality Total: 1,227 Annual Economic Cost Due to Motor Vehicle Crashes: $1.374 Billion
Highway Safety Laws Needed in New Hampshire: Primary Enforcement Seat Belt Law (Front & Rear) All-Rider Motorcycle Helmet Law Booster Seat Law Through Age 7 GDL - Minimum Age 16 for Learner’s Permit GDL - 6-Month Holding Period Provision GDL - Stronger Nighttime Restriction Provision
NEW JERSEY 2014 Fatalities: 556 10-Year Fatality Total: 6,287 Annual Economic Cost Due to Motor Vehicle Crashes: $12.813 Billion
Highway Safety Laws Needed in New Jersey: Primary Enforcement Seat Belt Law (Rear) GDL - 30-50 Hours Supervised Driving Provision GDL - Stronger Nighttime Restriction Provision Ignition Interlock Law for All Offenders
NEW MEXICO 2014 Fatalities: 383 10-Year Fatality Total: 3,866 Annual Economic Cost Due to Motor Vehicle Crashes: $1.769 Billion
Highway Safety Laws Needed in New Mexico: All-Rider Motorcycle Helmet Law Booster Seat Law Through Age 7 GDL - Minimum Age 16 for Learner’s Permit GDL - Stronger Nighttime Restriction Provision GDL - Age 18 for Unrestricted License Child Endangerment Law
NEW YORK 2014 Fatalities: 1,039 10-Year Fatality Total: 12,382 Annual Economic Cost Due to Motor Vehicle Crashes: $15.246 Billion
Highway Safety Laws Needed in New York: Primary Enforcement Seat Belt Law (Rear) GDL - Stronger Cell Phone Restriction Provision GDL - Age 18 for Unrestricted License
(Without DE Exemption)
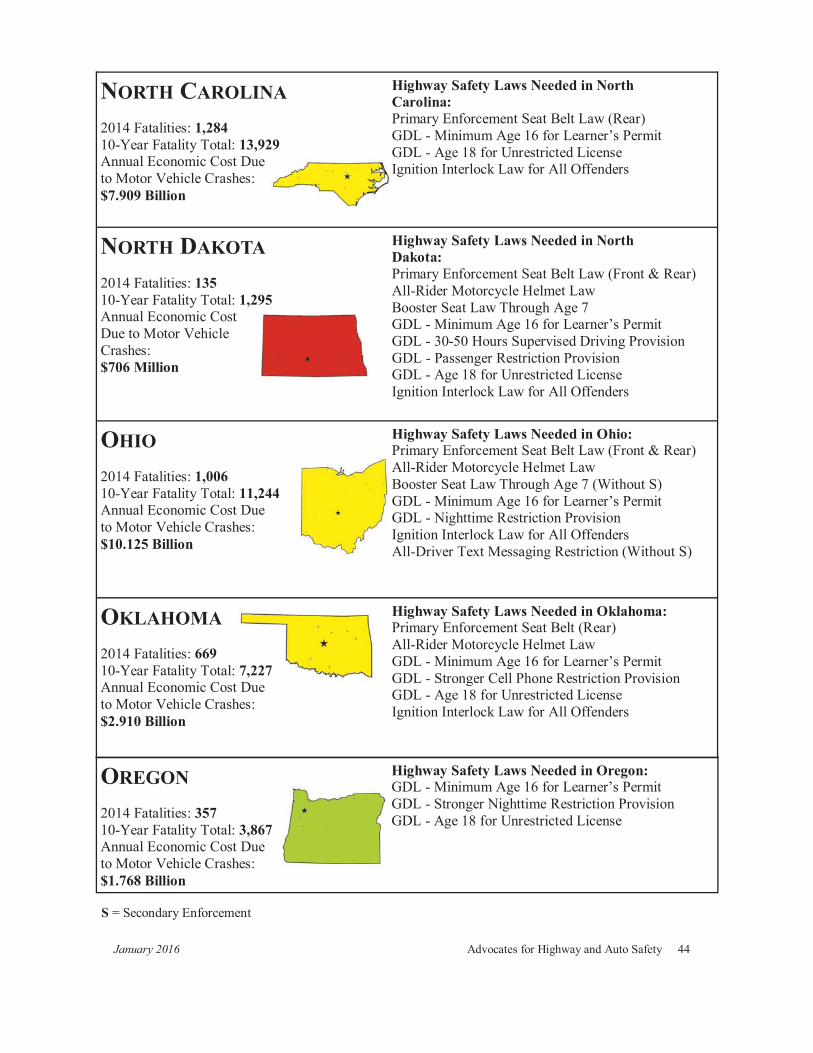
January 2016 Advocates for Highway and Auto Safety 44
NORTH CAROLINA 2014 Fatalities: 1,284 10-Year Fatality Total: 13,929 Annual Economic Cost Due to Motor Vehicle Crashes: $7.909 Billion
Highway Safety Laws Needed in North Carolina: Primary Enforcement Seat Belt Law (Rear) GDL - Minimum Age 16 for Learner’s Permit GDL - Age 18 for Unrestricted License Ignition Interlock Law for All Offenders
NORTH DAKOTA 2014 Fatalities: 135 10-Year Fatality Total: 1,295 Annual Economic Cost Due to Motor Vehicle Crashes: $706 Million
Highway Safety Laws Needed in North Dakota: Primary Enforcement Seat Belt Law (Front & Rear) All-Rider Motorcycle Helmet Law Booster Seat Law Through Age 7 GDL - Minimum Age 16 for Learner’s Permit GDL - 30-50 Hours Supervised Driving Provision GDL - Passenger Restriction Provision GDL - Age 18 for Unrestricted License Ignition Interlock Law for All Offenders
OHIO 2014 Fatalities: 1,006 10-Year Fatality Total: 11,244 Annual Economic Cost Due to Motor Vehicle Crashes: $10.125 Billion
Highway Safety Laws Needed in Ohio: Primary Enforcement Seat Belt Law (Front & Rear) All-Rider Motorcycle Helmet Law Booster Seat Law Through Age 7 (Without S) GDL - Minimum Age 16 for Learner’s Permit GDL - Nighttime Restriction Provision Ignition Interlock Law for All Offenders All-Driver Text Messaging Restriction (Without S)
OKLAHOMA 2014 Fatalities: 669 10-Year Fatality Total: 7,227 Annual Economic Cost Due to Motor Vehicle Crashes: $2.910 Billion
Highway Safety Laws Needed in Oklahoma: Primary Enforcement Seat Belt (Rear) All-Rider Motorcycle Helmet Law GDL - Minimum Age 16 for Learner’s Permit GDL - Stronger Cell Phone Restriction Provision GDL - Age 18 for Unrestricted License Ignition Interlock Law for All Offenders
S = Secondary Enforcement
OREGON 2014 Fatalities: 357 10-Year Fatality Total: 3,867 Annual Economic Cost Due to Motor Vehicle Crashes: $1.768 Billion
Highway Safety Laws Needed in Oregon: GDL - Minimum Age 16 for Learner’s Permit GDL - Stronger Nighttime Restriction Provision GDL - Age 18 for Unrestricted License
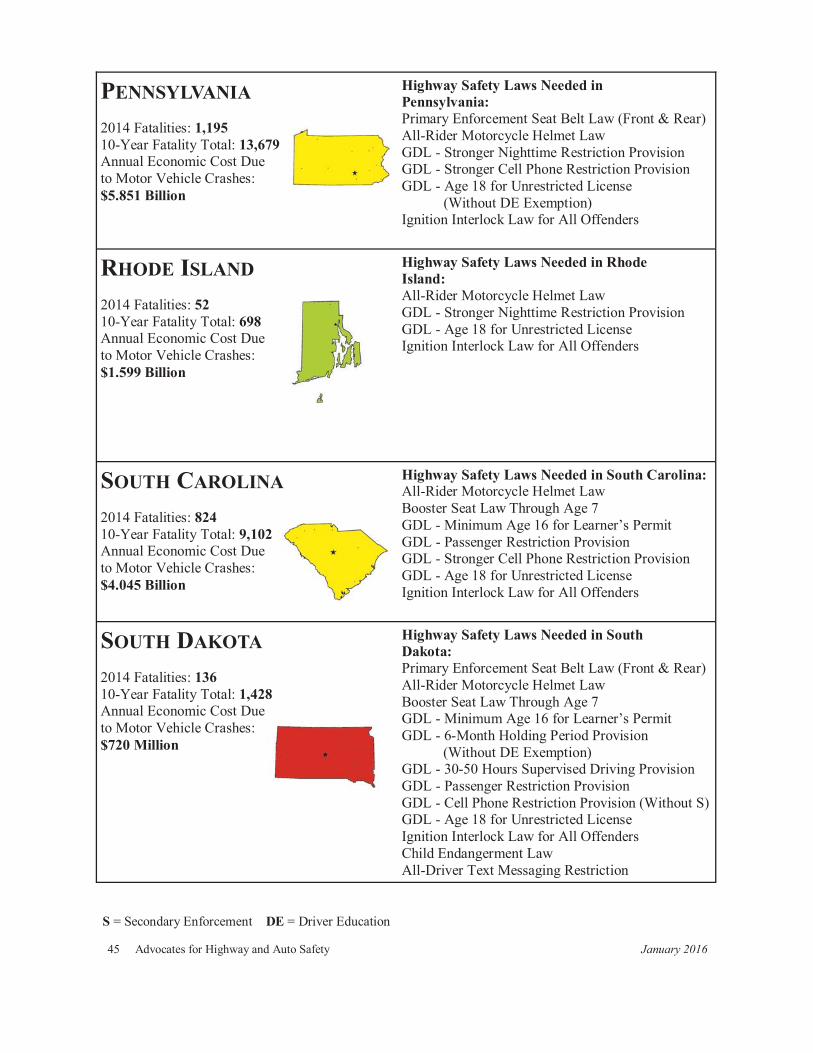
45 Advocates for Highway and Auto Safety January 2016
PENNSYLVANIA 2014 Fatalities: 1,195 10-Year Fatality Total: 13,679 Annual Economic Cost Due to Motor Vehicle Crashes: $5.851 Billion
Highway Safety Laws Needed in Pennsylvania: Primary Enforcement Seat Belt Law (Front & Rear) All-Rider Motorcycle Helmet Law GDL - Stronger Nighttime Restriction Provision GDL - Stronger Cell Phone Restriction Provision GDL - Age 18 for Unrestricted License
(Without DE Exemption) Ignition Interlock Law for All Offenders
RHODE ISLAND 2014 Fatalities: 52 10-Year Fatality Total: 698 Annual Economic Cost Due to Motor Vehicle Crashes: $1.599 Billion
Highway Safety Laws Needed in Rhode Island: All-Rider Motorcycle Helmet Law GDL - Stronger Nighttime Restriction Provision GDL - Age 18 for Unrestricted License Ignition Interlock Law for All Offenders
SOUTH CAROLINA 2014 Fatalities: 824 10-Year Fatality Total: 9,102 Annual Economic Cost Due to Motor Vehicle Crashes: $4.045 Billion
Highway Safety Laws Needed in South Carolina: All-Rider Motorcycle Helmet Law Booster Seat Law Through Age 7 GDL - Minimum Age 16 for Learner’s Permit GDL - Passenger Restriction Provision GDL - Stronger Cell Phone Restriction Provision GDL - Age 18 for Unrestricted License Ignition Interlock Law for All Offenders
SOUTH DAKOTA 2014 Fatalities: 136 10-Year Fatality Total: 1,428 Annual Economic Cost Due to Motor Vehicle Crashes: $720 Million
Highway Safety Laws Needed in South Dakota: Primary Enforcement Seat Belt Law (Front & Rear) All-Rider Motorcycle Helmet Law Booster Seat Law Through Age 7 GDL - Minimum Age 16 for Learner’s Permit GDL - 6-Month Holding Period Provision
(Without DE Exemption) GDL - 30-50 Hours Supervised Driving Provision GDL - Passenger Restriction Provision GDL - Cell Phone Restriction Provision (Without S) GDL - Age 18 for Unrestricted License Ignition Interlock Law for All Offenders Child Endangerment Law All-Driver Text Messaging Restriction
S = Secondary Enforcement DE = Driver Education
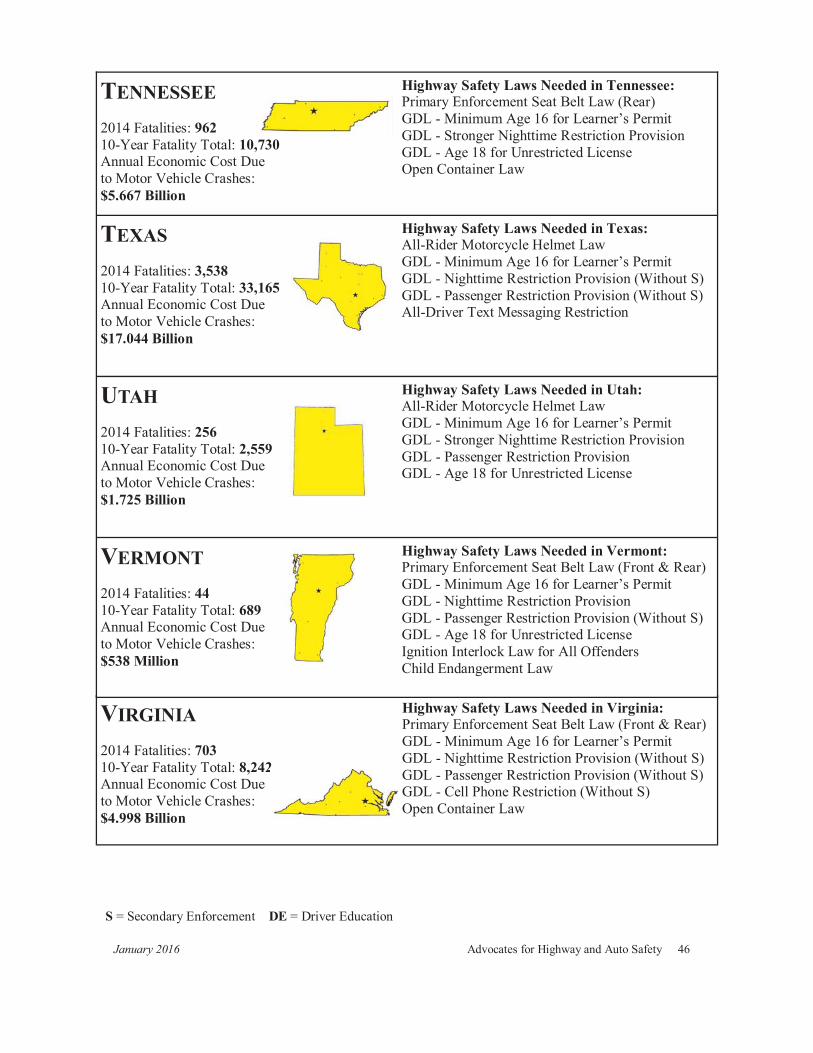
January 2016 Advocates for Highway and Auto Safety 46
TENNESSEE 2014 Fatalities: 962 10-Year Fatality Total: 10,730 Annual Economic Cost Due to Motor Vehicle Crashes: $5.667 Billion
Highway Safety Laws Needed in Tennessee: Primary Enforcement Seat Belt Law (Rear) GDL - Minimum Age 16 for Learner’s Permit GDL - Stronger Nighttime Restriction Provision GDL - Age 18 for Unrestricted License Open Container Law
TEXAS 2014 Fatalities: 3,538 10-Year Fatality Total: 33,165 Annual Economic Cost Due to Motor Vehicle Crashes: $17.044 Billion
Highway Safety Laws Needed in Texas: All-Rider Motorcycle Helmet Law GDL - Minimum Age 16 for Learner’s Permit GDL - Nighttime Restriction Provision (Without S) GDL - Passenger Restriction Provision (Without S) All-Driver Text Messaging Restriction
UTAH 2014 Fatalities: 256 10-Year Fatality Total: 2,559 Annual Economic Cost Due to Motor Vehicle Crashes: $1.725 Billion
Highway Safety Laws Needed in Utah: All-Rider Motorcycle Helmet Law GDL - Minimum Age 16 for Learner’s Permit GDL - Stronger Nighttime Restriction Provision GDL - Passenger Restriction Provision GDL - Age 18 for Unrestricted License
VERMONT 2014 Fatalities: 44 10-Year Fatality Total: 689 Annual Economic Cost Due to Motor Vehicle Crashes: $538 Million
Highway Safety Laws Needed in Vermont: Primary Enforcement Seat Belt Law (Front & Rear) GDL - Minimum Age 16 for Learner’s Permit GDL - Nighttime Restriction Provision GDL - Passenger Restriction Provision (Without S) GDL - Age 18 for Unrestricted License Ignition Interlock Law for All Offenders Child Endangerment Law
S = Secondary Enforcement DE = Driver Education
VIRGINIA 2014 Fatalities: 703 10-Year Fatality Total: 8,242 Annual Economic Cost Due to Motor Vehicle Crashes: $4.998 Billion
Highway Safety Laws Needed in Virginia: Primary Enforcement Seat Belt Law (Front & Rear) GDL - Minimum Age 16 for Learner’s Permit GDL - Nighttime Restriction Provision (Without S) GDL - Passenger Restriction Provision (Without S) GDL - Cell Phone Restriction (Without S) Open Container Law
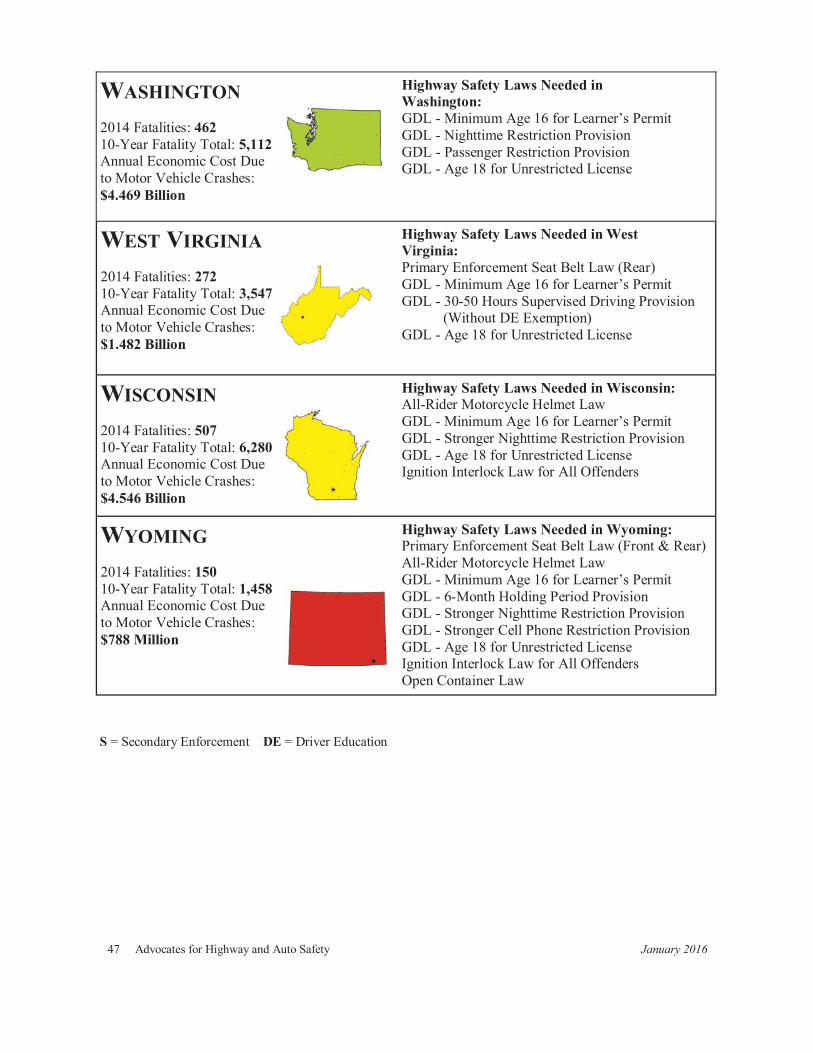
47 Advocates for Highway and Auto Safety January 2016
WASHINGTON 2014 Fatalities: 462 10-Year Fatality Total: 5,112 Annual Economic Cost Due to Motor Vehicle Crashes: $4.469 Billion
Highway Safety Laws Needed in Washington: GDL - Minimum Age 16 for Learner’s Permit GDL - Nighttime Restriction Provision GDL - Passenger Restriction Provision GDL - Age 18 for Unrestricted License
WEST VIRGINIA 2014 Fatalities: 272 10-Year Fatality Total: 3,547 Annual Economic Cost Due to Motor Vehicle Crashes: $1.482 Billion
Highway Safety Laws Needed in West Virginia: Primary Enforcement Seat Belt Law (Rear) GDL - Minimum Age 16 for Learner’s Permit GDL - 30-50 Hours Supervised Driving Provision
(Without DE Exemption) GDL - Age 18 for Unrestricted License
WISCONSIN 2014 Fatalities: 507 10-Year Fatality Total: 6,280 Annual Economic Cost Due to Motor Vehicle Crashes: $4.546 Billion
Highway Safety Laws Needed in Wisconsin: All-Rider Motorcycle Helmet Law GDL - Minimum Age 16 for Learner’s Permit GDL - Stronger Nighttime Restriction Provision GDL - Age 18 for Unrestricted License Ignition Interlock Law for All Offenders
WYOMING 2014 Fatalities: 150 10-Year Fatality Total: 1,458 Annual Economic Cost Due to Motor Vehicle Crashes: $788 Million
Highway Safety Laws Needed in Wyoming: Primary Enforcement Seat Belt Law (Front & Rear) All-Rider Motorcycle Helmet Law GDL - Minimum Age 16 for Learner’s Permit GDL - 6-Month Holding Period Provision GDL - Stronger Nighttime Restriction Provision GDL - Stronger Cell Phone Restriction Provision GDL - Age 18 for Unrestricted License Ignition Interlock Law for All Offenders Open Container Law
S = Secondary Enforcement DE = Driver Education
January 2016 Advocates for Highway and Auto Safety 48
SOURCE INFORMATION
In developing this report, Advocates relied upon numerous research studies, statistical analyses, fact sheets and other public data. Additional information is available upon request.
American Automobile Association, “Crashes vs. Congestion- What's the Cost to Society?,” November 2011. American Automobile Association, “Caution Ahead: New Year’s Ranks as Deadliest Day on US Roads,” December 2012. Allstate Foundation Teen Licensing Survey, “Unlikely Allies in Fight for Stronger Teen Driving Laws: Teens
Themselves,” 2010. Arbogast, Kristy B., Jermakian, Jessica S., Kallan, Michael J., & Durbin, Dennis R., “Effectiveness of Belt Positioning
Booster Seats: An Updated Assessment,” Pediatrics, October 2009. Ascone, Debra, Lindsey, Tonja, & Varghese, Cherian, “An Examination of Driver Distraction in NHTSA Databases,”
Data Reporting and Information Division, National Center for Statistics and Analysis, NHTSA, September 2009. Chen, Baker, Li, “Graduated Driver Licensing Programs and Fatal Crashes of 16-Year-Old Drivers: A National Evaluation,” Pediatrics, July 2006. Centers for Disease Control and Prevention, “10 Leading Causes of Injury Deaths by Age Group Highlighting
Unintentional Injury Deaths, United States,” 2010. Centers for Disease Control and Prevention, “Helmet use among motorcyclists who died in crashes and economic cost
savings associated with state motorcycle helmet laws,” 2012. Centers for Disease Control and Prevention, “Injury Prevention and Control: Motor Vehicle Safety, Get the Facts.” Centers for Disease Control and Prevention, “Teen Driver: Fact Sheet,” 2012. Centers for Disease Control and Prevention, “Vital Signs, Drinking and Driving, a Threat to Everyone,” October 2011. Children’s Hospital of Philadelphia - Partners for Child Passenger Safety: Fact and Trend Report, September 2008. Coronado, VG, Xu, L, Basavaraju, SV, McGuire, LC, Wald, MM, Faul, MD, Guzman, BR, Hemphill, JD, “Surveillance
for Traumatic Brain Injury—Related Deaths—United States, 1997-2007,” 2011. Durbin, D.R., Chen, I. Smith, R. Elliot, M.R., and Winston, F.K., “Effects of seating position and appropriate restraint use
on the risk of injury to children in motor vehicle crashes,” Pediatrics 115:e305, 2005. Durbin, D.R., Elliot, M.R., and Winston, F.K., “Belt-positioning booster seats and reduction in risk of injury among
children in vehicle crashes,” Journal of the American Medical Association 289:2835-40, 2003. Ferguson et al., “Progress in Teenage Crash Risk During the Last Decade,” Journal of Safety Research, 2007. Flannagan, CA, “Analysis of Motorcycle Crashes: Comparison of 2012 to Previous Years,” 18th Michigan Safety Summit,
2013. Government Accountability Office, “Motorcycle Safety: Increasing Federal Flexibility and Identifying Research Priorities
Would Help Support States’ Safety Efforts,” Report 13-42, 2012. Harris, Lou and Peter Harris Research Group, “Survey of the Attitudes of the American People of Highway and Auto Safety,” June 2004. Insurance Institute for Highway Safety, Status Report “Kids in Crashes Far Better If States Have Tough Restraint Laws,”
2011.
49 Advocates for Highway and Auto Safety January 2016
SOURCE INFORMATION, CONT. Insurance Institute for Highway Safety, “Fatality Facts 2011,” Teenagers Website Insurance Institute for Highway Safety, “Graduated Licensing Laws and Fatal Crashes of Teenage Drivers, A National
Study,” June 2010. Insurance Institute for Highway Safety, “Watch Your Head: Michigan’s Weakened Helmet Use Law Leads to Costlier
Injury Claims,” 2013. Intoxalock Legacy Ignition Interlock Device Website. Liberty Mutual Insurance Company, “Liberty Mutual and SADD Study Finds Texting While Driving by Teens Not
Affected by Their Awareness of the Dangers, Text Conversations with Mom and Dad on the Rise,” October 2011. Lui, BC, Ivers, R., Norton, R., Boufous, S., Blows, S, Lo, SK, “Helmets for Preventing Injury in Motorcycle Riders
(Review),” The Cochrane Library, 2009. Mayhew, D., “Reducing the Crash Risk for Young Drivers,” June 2006. McCartt AT, Hellinga LA, Braitman KA, “Cell Phones and Driving: Review of Research,” Traffic Injury Prevention,
7:89-106 (2006). McCartt AT, Mayhew DR, Braitman KA, Ferguson SA, Simpson HM. “Effects of Age and Experience on Young Driver
Crashes: Review of Recent Literature,” Insurance Institute for Highway Safety, Arlington, VA (2008). McCartt, Anne T., Teoh, Eric R., Fields, Michelle, Braitman, Keli A. and Hellinga, Laurie A, “Graduated Licensing Laws
and Fatal Crashes of Teenage Drivers: A National Study,” Traffic Injury Prevention, 11:240-248 (2010). McEvoy SP, et al, “Role of Mobile Phones in Motor Vehicle Crashes Resulting in Hospital Attendance: A Case-Crossover
Study,” British Medical Journal; July 2005:428-432. Miller, Ted R. & Zaloshnja, Eduard, “On a Crash Course: The Dangers and Health Costs of Deficient Roadways,” Pacific
Institute for Research and Evaluation, commissioned by Transportation Construction Coalition, May 2009. Minnesota Department of Public Safety, Minnesota Motor Vehicle Crash Facts 2008 and 2011. Morgan, C., “Effectiveness of lap/shoulder belts in the back outboard seating positions,” NHTSA, DOT HS-808-945,
1999. Morse, B.J., Elliot, D.S., “Hamilton County Drinking and Driving Study, 30 Month Report,” 1990, Mothers Against Drunk Driving, “Fifth Anniversary Report to the Nation.” November 2011. Mothers Against Drunk Driving, Statistics 2011. National Governors Association and National Association of State Budget Officers. The Fiscal Survey of the States: An
Update of State Fiscal Conditions, Fall 2010. Nationwide Mutual Insurance Company, “Driving While Distracted Research Results,” July 2010. Naumann, Rebecca B., Dellinger, Ann M., Zaloshnja, Eduard, Lawrence, Bruce A. and Miller, Ted R.(2010), “Incidence
and Total Lifetime Costs of Motor Vehicle-Related Fatal and Nonfatal Injury by Road User Type, United States, 2005,” Traffic Injury Prevention 11:4, 353-360.
New York Times. (2009) Technology Series: “Driven to Distraction.” Entire series can be found on this website: http://topics.nytimes.com/top/news/technology/series/driven_to_distraction/index.html. NHTSA, “Drinking and Driving Tips, Stops by the Police, and Arrests: Analyses of the 1995 Survey of Drinking and
Driving Attitudes and Behavior,” DOT HS 809 184, 2000.
January 2016 Advocates for Highway and Auto Safety 50
SOURCE INFORMATION, CONT. NHTSA, “Ignition Interlocks—What You Need to Know: A Toolkit for Policymakers, Highway Safety Professionals, and
Advocates,” DOT HS 811 246, November 2009. NHTSA, Traffic Safety Facts: Traffic Tech—Technology Transfer Series, Number 406. Determining the Relationship of
Primary Seat Belt Laws to Minority Ticketing. September 2011. NHTSA, Traffic Safety Facts: Young Drivers, DOT HS 811 744, April 2013. NHTSA, National Evaluation of Graduated Driver Licensing Programs, DOT HS 810 614, 2006, NHTSA, Occupant Restraint Use in 2011, DOT HS 811 697, 2013. NHTSA, The Economic Impact of Motor Vehicle Crashes, 2010. NHTSA, The Nation’s Top Strategies to Stop Impaired Driving: Primary Seat Belt Laws, 2007. NHTSA, Traffic Safety Facts, Alcohol Impaired Driving, DOT HS 812 231, December 2015. NHTSA, Traffic Safety Facts, Children, DOT HS 811 767, July 2012. NHTSA, Traffic Safety Facts, Lives Saved in 2014 by Restraint Use and Minimum Drinking Age Laws,” DOT HS 812
218, 2015. NHTSA, Traffic Safety Facts, Motorcycles, DOT HS 811 765, 2013. NHTSA, Traffic Safety Facts, Occupant Protection, DOT HS 811 892, 2014. NHTSA, Traffic Safety Facts, Young Drivers, DOT HS 811 744, 2013. NHTSA, Traffic Safety Facts, Research Note, “2013 Motor Vehicle Crashes—Overview,” DOT HS 812 101, 2014. NHTSA, Traffic Safety Facts, Research Note, “Calculating Lives Saved by Motorcycle Helmets,” DOT HS 809 861 2005. NHTSA, Traffic Safety Facts, Research Note, “Crash Outcome Data Evaluation System Project Seat Belt and Helmet
Analysis,” 1996. NHTSA, Traffic Safety Facts Research Note, “National Child Restraint Use Special Study”, DOT HS 811 679, 2012. NHTSA, Traffic Safety Facts, Research Note, “Child Restraint Use in 2008—Overall Results,” DOT HS 811 135, 2009. NHTSA, Traffic Safety Facts, Research Note, “Distracted Driving 2011,” DOT HS 811 737, April 2013. NHTSA, Traffic Safety Facts, Research Note, “Driver Electronic Device Use in 2011,” DOT HS 811 719, April 2013. NHTSA, Traffic Safety Facts, Research Note, “Seat Belt Use in 2012—Overall Results,” DOT HS 811 691, November
2012. NHTSA, Traffic Safety Facts, Research Note, “Seat Belt Use in 2013—Overall Results,” DOT HS 811 875, January 2014. NHTSA, Traffic Safety Facts: Traffic Tech—Technology Transfer Series, Number 323. Estimated Minimum
Savings to a State’s Medicaid Budget by Implementing A Primary Seat Belt Law: Arkansas, Colorado, Florida, and Missouri. March 2007.
51 Advocates for Highway and Auto Safety January 2016
SOURCE INFORMATION, CONT. Orsay, E.M.; Muelleman, R.L.; Peterson, T.D.; Jurisic, D.H.; Kosasih, J.B.; and Levy, P. (1994), “Motorcycle
Helmets and Spinal Injuries: Dispelling the Myth,” Annals of Emergency Medicine 23:802-06. Preusser, D.F & Tison, J. (2007), “GDL Then and Now,” Journal of Safety Research, 38(2), 159-163. Redelmeier DA, Tibshirani RJ. “Association between Cellular-Telephone Calls and Motor Vehicle Collisions,” The
New England Journal of Medicine 1997; 336(7):453-58. Research and Innovative Technology Administration, Bureau of Transportation Statistics. State Transportation
Statistics, 2009. Simon v. Sargent, D.C.Mass.1972, 346 F.Supp. 277, affirmed 39 S.Ct. 463, 409 U.S. 1020, 34 L.Ed.2d 312. Strayer DL, Drews FA, Crouch DJ, “A Comparison of the Cell Phone Driver and the Drunk Driver,”
Human Factors 2006; 48:381-391. Sun, K., Bauer, M.J., Hardman, S., “Effects of Upgraded Child Restraint Law Designed to Increase Booster Seat Use in
New York,” Pediatrics, 2010. Vogel, Steve, “Teen Driver Menace: Text Messaging- Studies Show Texting While Driving Is Epidemic,”
Parenting Teens, October 22, 2007. Weiss, Harold, Ph.D., MPH, MS, Agimi, Yl, MPH, and Steiner, Claudia, MD, MPH, “Youth Motorcycle-Related Brain
Injury by State Helmet Law Type: United States 2005 2007,” Pediatrics, November 2010. Williams, A.F. (2007), “Contribution of the Components of Graduated Licensing to Crash Reductions,” Journal of Safety
Research, 38(2), 177-184. Williams, A.F., Braitman, K.A., and McCartt, A.T., “Views of Parents of Teenagers about Licensing Policies: a National
Survey,” 2010. The Wireless Association, “Wireless Quick Facts, Year End Figures,” CTIA. Wisconsin Department of Transportation, Mobility Accountability Preservation Safety Service Performance Improvement
Report, 2013.
January 2016 Advocates for Highway and Auto Safety 52
SOURCE INFORMATION, CONT. Organizations:
Thanks to the many individuals and organizations whose websites and staff provided background and state
law information for The 2016 Roadmap of State Highway Safety Laws.
American Automobile Association (AAA) Foundation for Traffic Safety www.aaafoundation.org American Public Health Association (APHA) www.apha.org Brain Injury Association of America (BIA) www.biausa.org Federal Highway Administration (FHWA) www.fhwa.dot.gov Federal Motor Carrier Safety Administration (FMCSA) www.fmcsa.dot.gov Governors Highway Safety Association (GHSA) www.ghsa.org Insurance Institute for Highway Safety (IIHS) www.iihs.org Mothers Against Drunk Driving (MADD) www.madd.org National Conference of State Legislatures (NCSL) www.ncsl.org National Highway Traffic Safety Administration (NHTSA) and the National Center for Statistics and Analysis www.nhtsa.dot.gov National Safety Council (NSC) www.nsc.org National Transportation Safety Board (NTSB) www.ntsb.gov
Students Against Destructive Decisions (SADD) www.sadd.org Traffic Injury Research Foundation (TIRF) www.trafficinjuryresearch.com U.S. Centers for Disease Control and Prevention (CDC) www.cdc.gov Virginia Tech Transportation Institute www.vtti.vt.edu West Virginia University Injury Control Research Center www.hsc.wvu.edu/icrc
53 Advocates for Highway and Auto Safety January 2016
ABOUT ADVOCATES
Advocates for Highway and Auto Safety is an alliance of consumer, health and safety groups and insurance companies and agents working together to make America's roads safer. Advocates encourages the adoption of federal and state laws, policies and programs that save lives and reduce injuries. By joining its resources with others, Advocates helps build coalitions to increase participation of a wide array of groups in public policy initiatives which advance highway and auto safety.. For more information, please visit www.saferoads.org. Advocates for Highway and Auto Safety 750 First Street, NE, Suite 1130 Washington, D.C. 20002 202-408-1711 Follow us on Twitter: @SafeRoadsNow
ACKNOWLEDGEMENTS Advocates would like to thank Cathy Barzey, Cathy Chase, Lisa Drew, Tara Gill, Henry Jasny, Allison Kennedy, Shaun Kildare and Peter Kurdock for their contributions to The 2015 Roadmap of State Highway Safety Laws. Also, special thanks to Jamie Douglas of DAYLIGHT for the cover design.