Haynesville Shale John Webster, Drilling Engineer –
Haynesville Shale
2
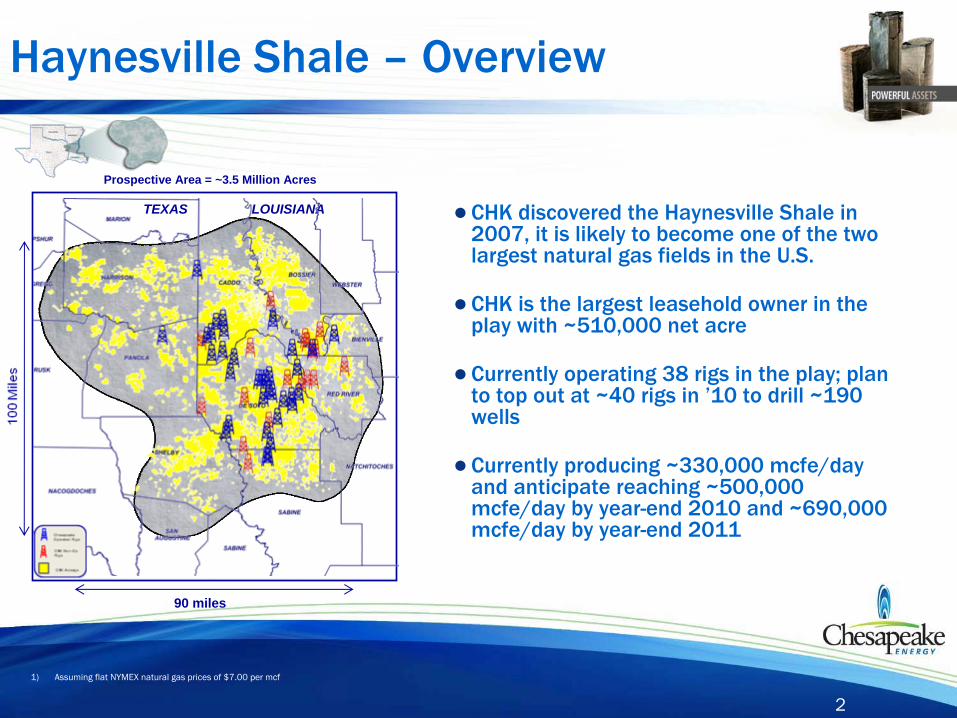
●CHK discovered the Haynesville Shale in 2007, it is likely to become one of the two largest natural gas fields in the U.S.
●CHK is the largest leasehold owner in the play with ~510,000 net acre
●Currently operating 38 rigs in the play; plan to top out at ~40 rigs in ’10 to drill ~190 wells
●Currently producing ~330,000 mcfe/day and anticipate reaching ~500,000 mcfe/day by year-end 2010 and ~690,000 mcfe/day by year-end 2011
Haynesville Shale –
Overview
1)
Assuming flat NYMEX natural gas prices of $7.00 per mcf
Prospective Area = ~3.5 Million Acres
LOUISIANATEXAS
90 miles
3
CHK Position in the Haynesville Core
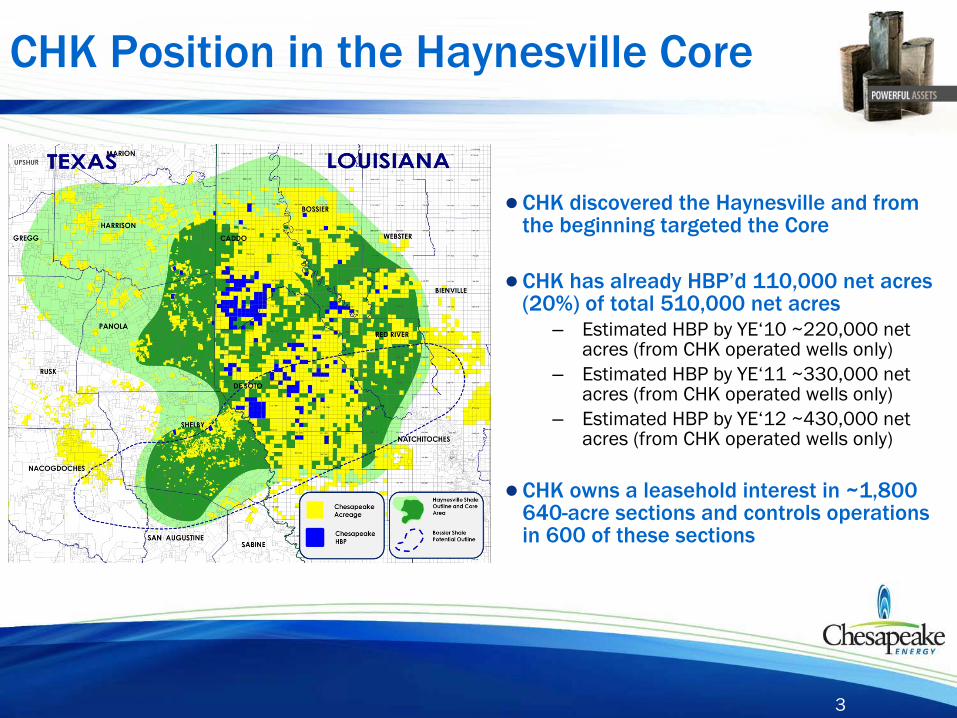
●CHK discovered the Haynesville and from the beginning targeted the Core
●CHK has already HBP’d
110,000 net acres (20%) of total 510,000 net acres
– Estimated HBP by YE‘10 ~220,000 net acres (from CHK operated wells only)
– Estimated HBP by YE‘11 ~330,000 net acres (from CHK operated wells only)
– Estimated HBP by YE‘12 ~430,000 net acres (from CHK operated wells only)
●CHK owns a leasehold interest in ~1,800 640-acre sections and controls operations in 600 of these sections
4
Potential Within Haynesville/Bossier Shale Overlap
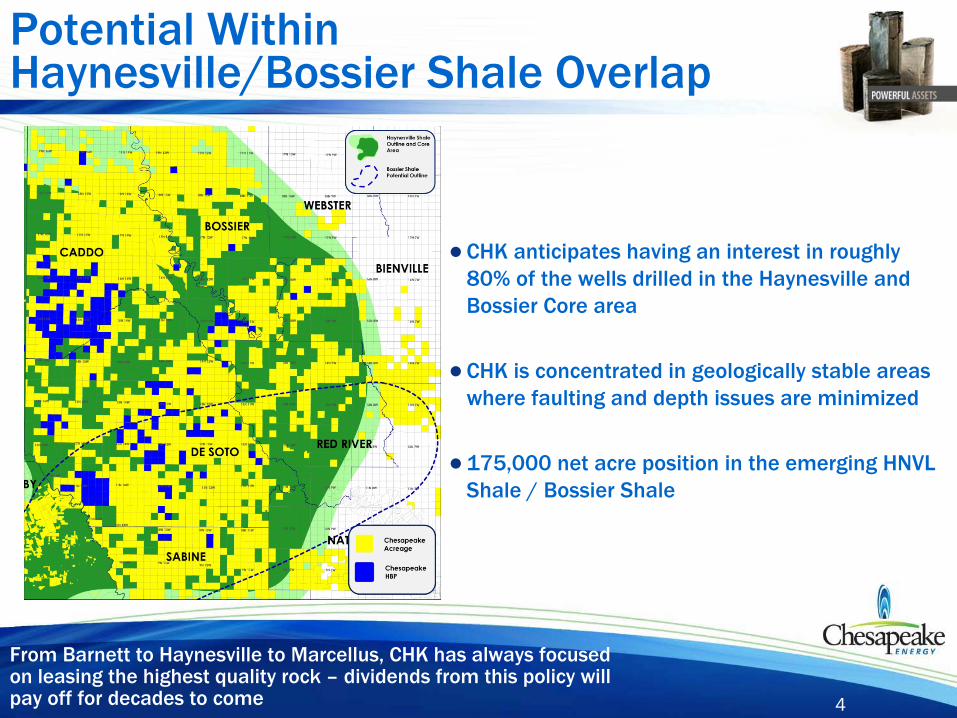
●CHK anticipates having an interest in roughly 80% of the wells drilled in the Haynesville and Bossier Core area
●CHK is concentrated in geologically stable areas where faulting and depth issues are minimized
●175,000 net acre position in the emerging HNVL Shale / Bossier Shale
From Barnett to Haynesville to Marcellus, CHK has always focused
on leasing the highest quality rock – dividends from this policy will pay off for decades to come
5
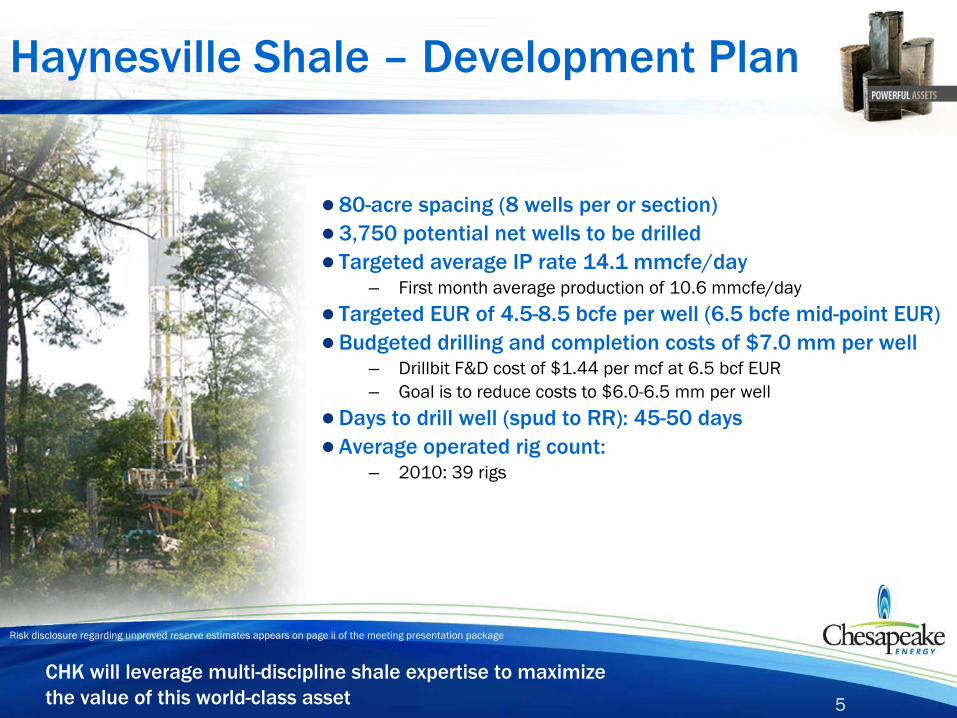
●80-acre spacing (8 wells per or section)●3,750 potential net wells to be drilled● Targeted average IP rate 14.1 mmcfe/day
– First month average production of 10.6 mmcfe/day
● Targeted EUR of 4.5-8.5 bcfe
per well (6.5 bcfe
mid-point EUR)●Budgeted drilling and completion costs of $7.0 mm per well
– Drillbit
F&D cost of $1.44 per mcf
at 6.5 bcf
EUR– Goal is to reduce costs to $6.0-6.5 mm per well
●Days to drill well (spud to RR): 45-50 days●Average operated rig count:
– 2010: 39 rigs
Haynesville Shale –
Development Plan
CHK will leverage multi-discipline shale expertise to maximize the value of this world-class asset
Risk disclosure regarding unproved reserve estimates appears on page ii of the meeting presentation package
6
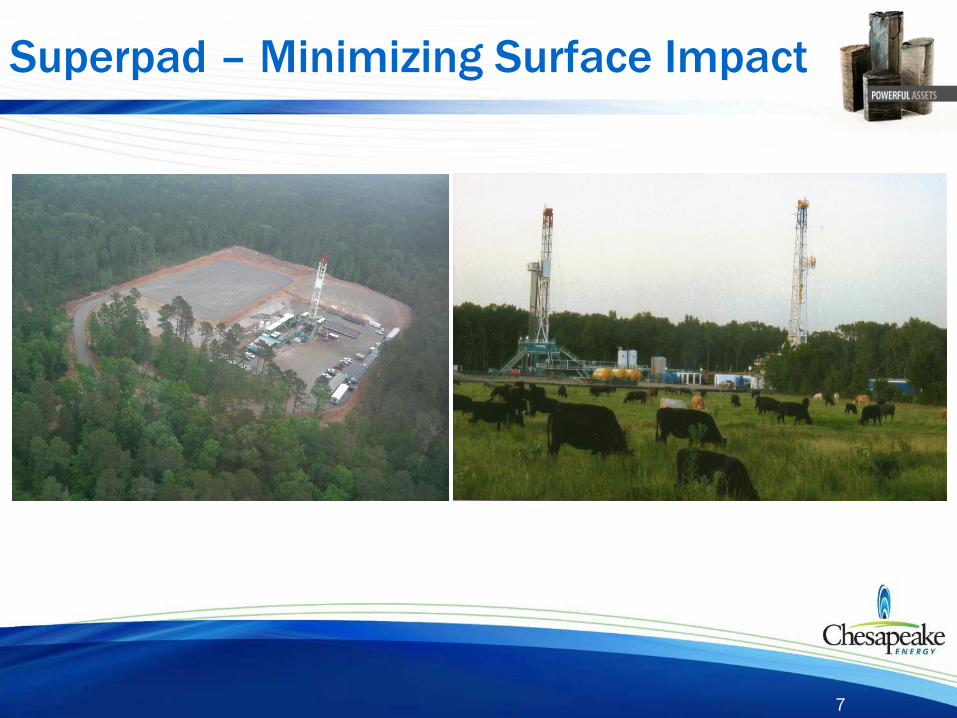
Superpad
–
Minimizing Surface Impact
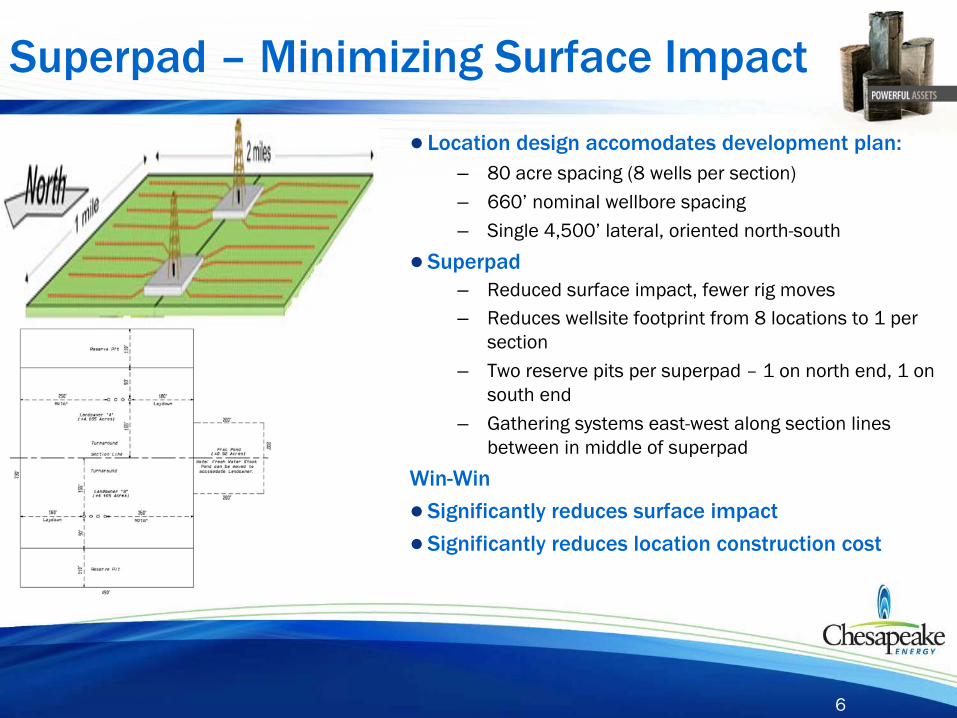
● Location design accomodates
development plan:– 80 acre spacing (8 wells per section)– 660’
nominal wellbore spacing– Single 4,500’
lateral, oriented north-south
●Superpad– Reduced surface impact, fewer rig moves– Reduces wellsite
footprint from 8 locations to 1 per section
– Two reserve pits per superpad
–
1 on north end, 1 on south end
– Gathering systems east-west along section lines between in middle of superpad
Win-Win
●Significantly reduces surface impact
●Significantly reduces location construction cost
7
Superpad
–
Minimizing Surface Impact
8
0
250
500
750
1,000
1,250
0
10
20
30
40
50
Jan-07 Jan-08 Jan-09 Jan-10 Jan-11 Jan-12 Jan-13
Net
Pro
duct
ion
(mm
cfe/
day)
Haynesville Wedge
Haynesville Base
Operated Rigs
Ope
rate
dR
igs
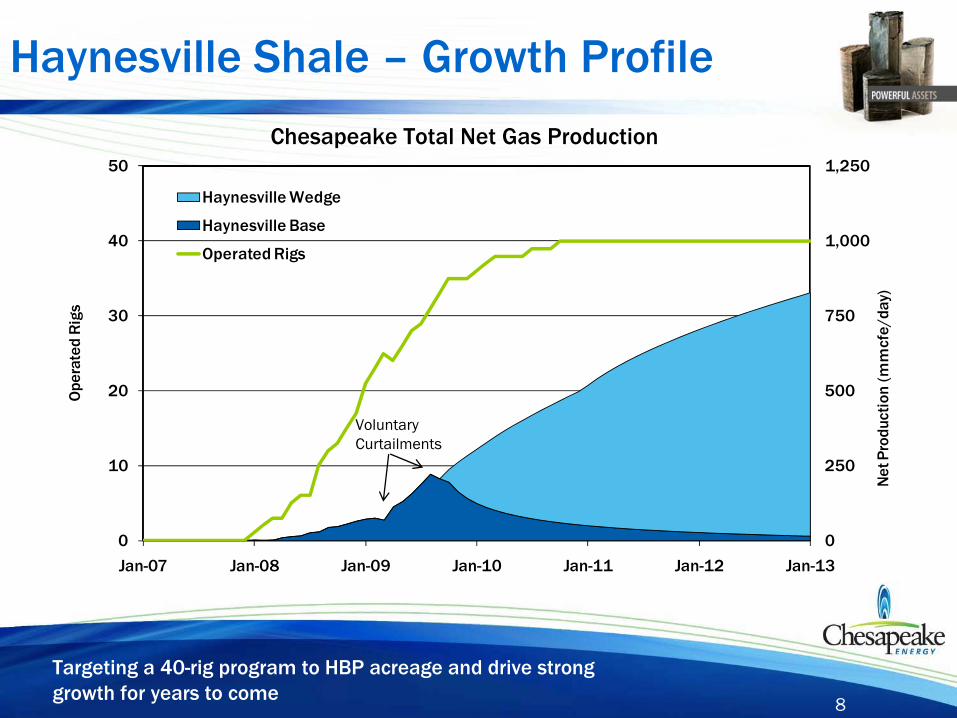
Haynesville Shale –
Growth Profile
Chesapeake Total Net Gas Production
Targeting a 40-rig program to HBP acreage and drive strong growth for years to come
Voluntary Curtailments
9
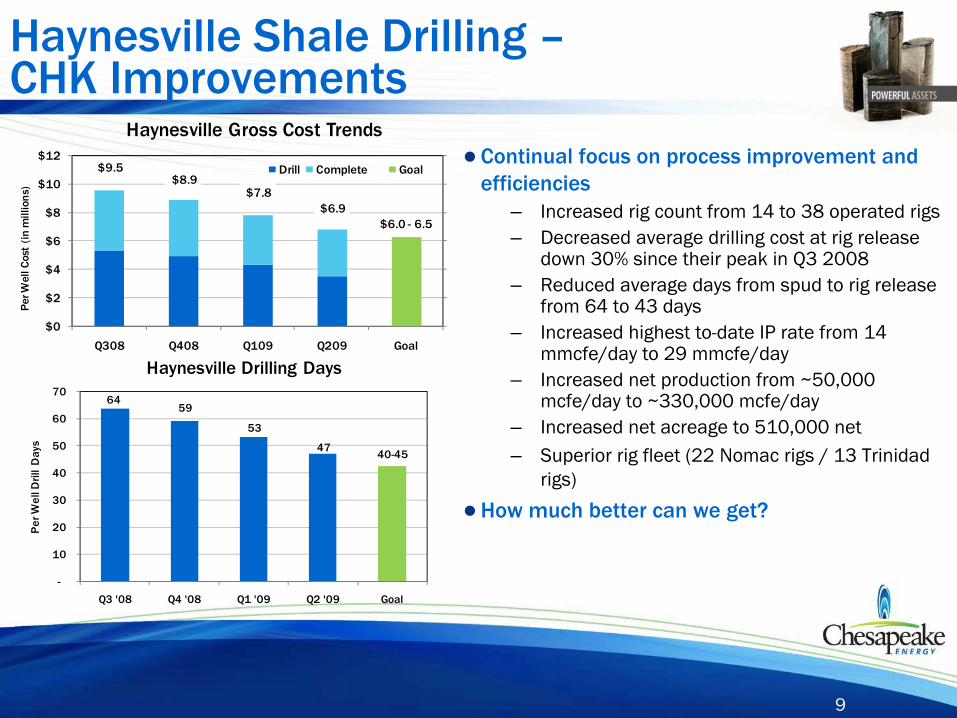
Haynesville Shale Drilling – CHK Improvements
●Continual focus on process improvement and efficiencies
– Increased rig count from 14 to 38 operated rigs– Decreased average drilling cost at rig release
down 30% since their peak in Q3 2008– Reduced average days from spud to rig release
from 64 to 43 days– Increased highest to-date IP rate from 14
mmcfe/day to 29 mmcfe/day– Increased net production from ~50,000
mcfe/day to ~330,000 mcfe/day– Increased net acreage to 510,000 net– Superior rig fleet (22 Nomac rigs / 13 Trinidad
rigs)
●How much better can we get?
64 59
53
47 40-45
-
10
20
30
40
50
60
70
Q3 '08 Q4 '08 Q1 '09 Q2 '09 Goal
Per
Wel
l Dril
l D
ays
Haynesville Drilling Days
$9.5 $8.9
$7.8 $6.9
$6.0 - 6.5
$0
$2
$4
$6
$8
$10
$12
Q308 Q408 Q109 Q209 Goal
Per
Wel
l Cos
t (i
n m
illio
ns)
Haynesville Gross Cost Trends
Drill Complete Goal
10
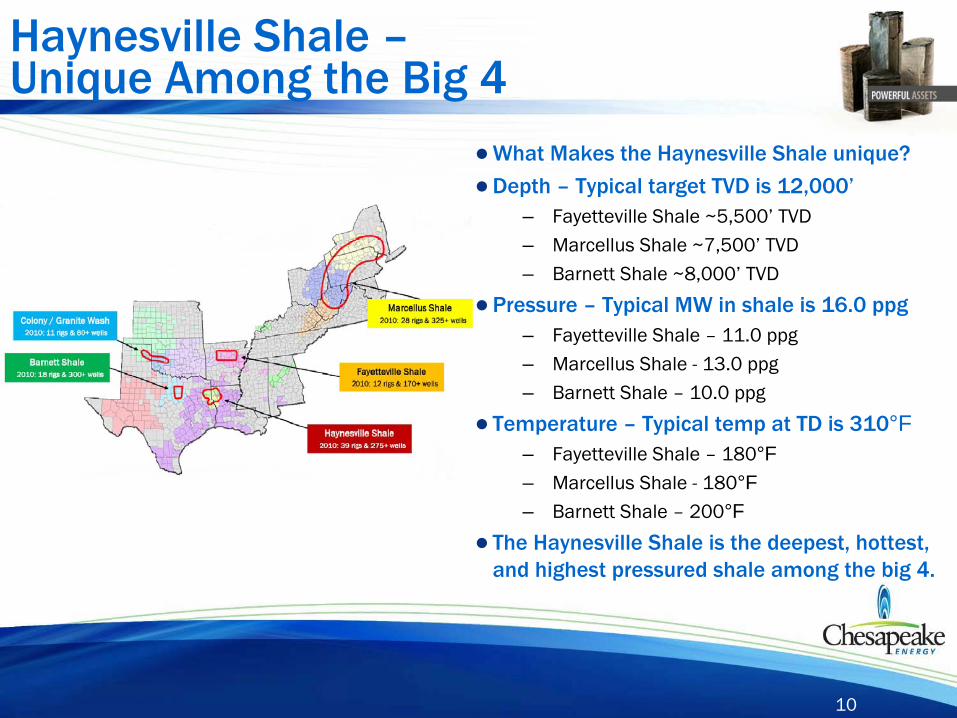
Haynesville Shale – Unique Among the Big 4●What Makes the Haynesville Shale unique?
●Depth –
Typical target TVD is 12,000’– Fayetteville Shale ~5,500’
TVD– Marcellus Shale ~7,500’
TVD– Barnett Shale ~8,000’
TVD
●Pressure –
Typical MW in shale is 16.0 ppg– Fayetteville Shale –
11.0 ppg– Marcellus Shale -
13.0 ppg– Barnett Shale –
10.0 ppg
● Temperature –
Typical temp at TD is 310°F– Fayetteville Shale –
180°F– Marcellus Shale -
180°F– Barnett Shale –
200°F● The Haynesville Shale is the deepest, hottest,
and highest pressured shale among the big 4.
11
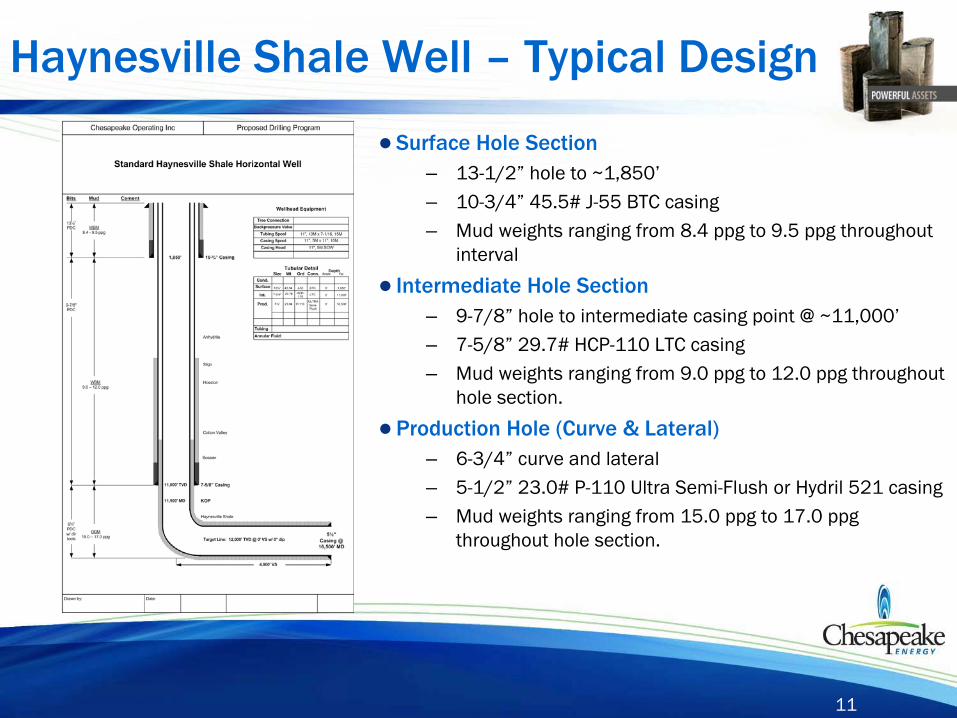
Haynesville Shale Well –
Typical Design
●Surface Hole Section– 13-1/2”
hole to ~1,850’– 10-3/4”
45.5# J-55 BTC casing– Mud weights ranging from 8.4 ppg
to 9.5 ppg
throughout interval
● Intermediate Hole Section– 9-7/8”
hole to intermediate casing point @ ~11,000’– 7-5/8”
29.7# HCP-110 LTC casing– Mud weights ranging from 9.0 ppg
to 12.0 ppg
throughout hole section.
●Production Hole (Curve & Lateral)– 6-3/4”
curve and lateral– 5-1/2”
23.0# P-110 Ultra Semi-Flush or Hydril
521 casing– Mud weights ranging from 15.0 ppg
to 17.0 ppg
throughout hole section.
12
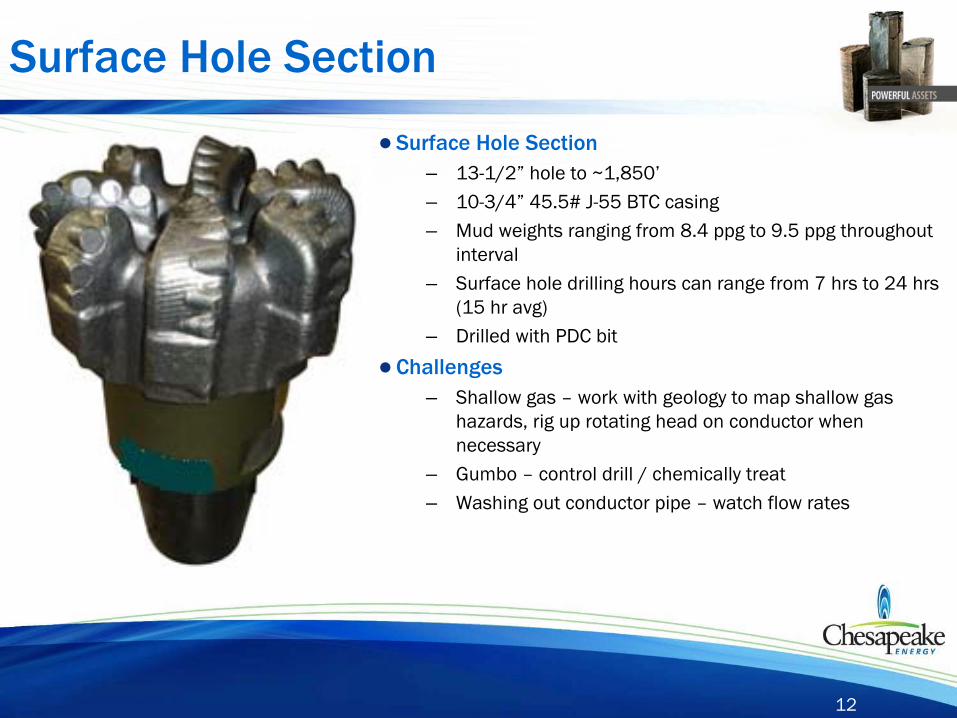
Surface Hole Section
●Surface Hole Section– 13-1/2”
hole to ~1,850’– 10-3/4”
45.5# J-55 BTC casing– Mud weights ranging from 8.4 ppg
to 9.5 ppg
throughout interval
– Surface hole drilling hours can range from 7 hrs to 24 hrs (15 hr avg)
– Drilled with PDC bit
●Challenges– Shallow gas –
work with geology to map shallow gas hazards, rig up rotating head on conductor when necessary
– Gumbo –
control drill / chemically treat– Washing out conductor pipe –
watch flow rates
13
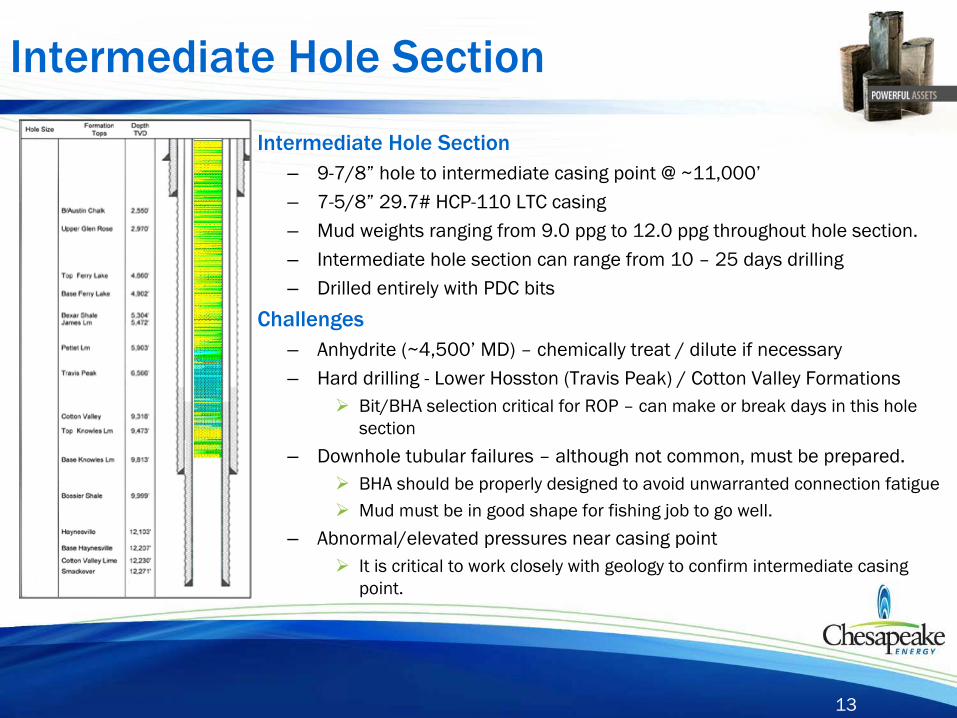
Intermediate Hole Section
● Intermediate Hole Section– 9-7/8”
hole to intermediate casing point @ ~11,000’– 7-5/8”
29.7# HCP-110 LTC casing– Mud weights ranging from 9.0 ppg
to 12.0 ppg
throughout hole section.– Intermediate hole section can range from 10 –
25 days drilling– Drilled entirely with PDC bits
●Challenges– Anhydrite (~4,500’
MD) –
chemically treat / dilute if necessary– Hard drilling -
Lower Hosston
(Travis Peak) / Cotton Valley Formations
Bit/BHA selection critical for ROP –
can make or break days in this hole section
– Downhole tubular failures –
although not common, must be prepared.
BHA should be properly designed to avoid unwarranted connection fatigue
Mud must be in good shape for fishing job to go well.
– Abnormal/elevated pressures near casing point
It is critical to work closely with geology to confirm intermediate casing point.
14
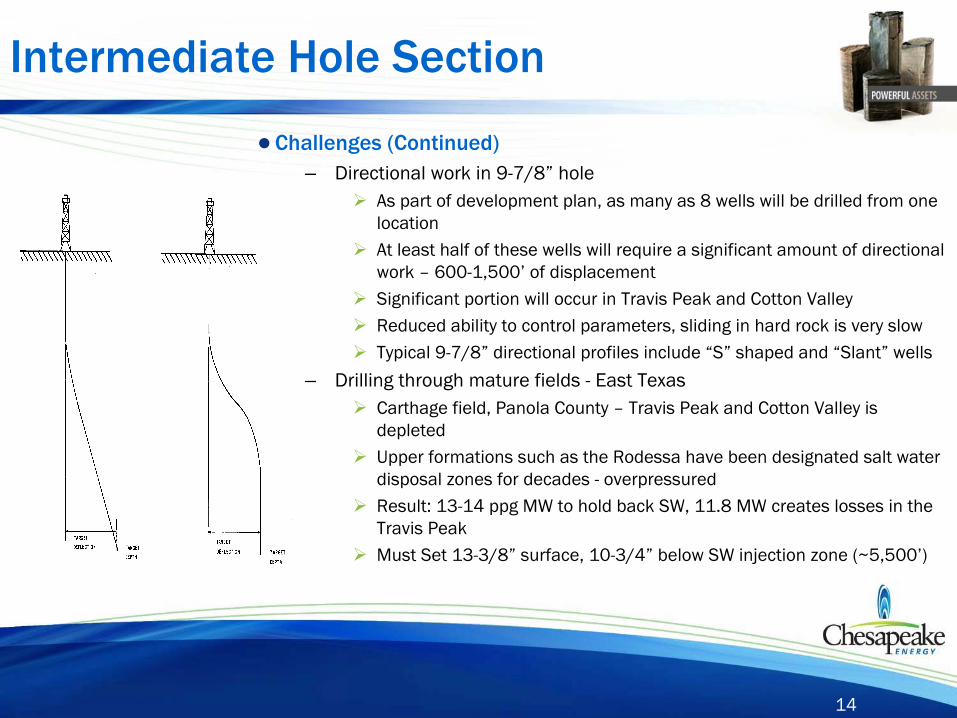
Intermediate Hole Section
●Challenges (Continued)– Directional work in 9-7/8”
hole
As part of development plan, as many as 8 wells will be drilled from one location
At least half of these wells will require a significant amount of directional work –
600-1,500’
of displacement
Significant portion will occur in Travis Peak and Cotton Valley
Reduced ability to control parameters, sliding in hard rock is very slow
Typical 9-7/8”
directional profiles include “S”
shaped and “Slant”
wells
– Drilling through mature fields -
East Texas
Carthage field, Panola County –
Travis Peak and Cotton Valley is depleted
Upper formations such as the Rodessa
have been designated salt water disposal zones for decades -
overpressured
Result: 13-14 ppg
MW to hold back SW, 11.8 MW creates losses in the Travis Peak
Must Set 13-3/8”
surface, 10-3/4”
below SW injection zone (~5,500’)
15
Curve
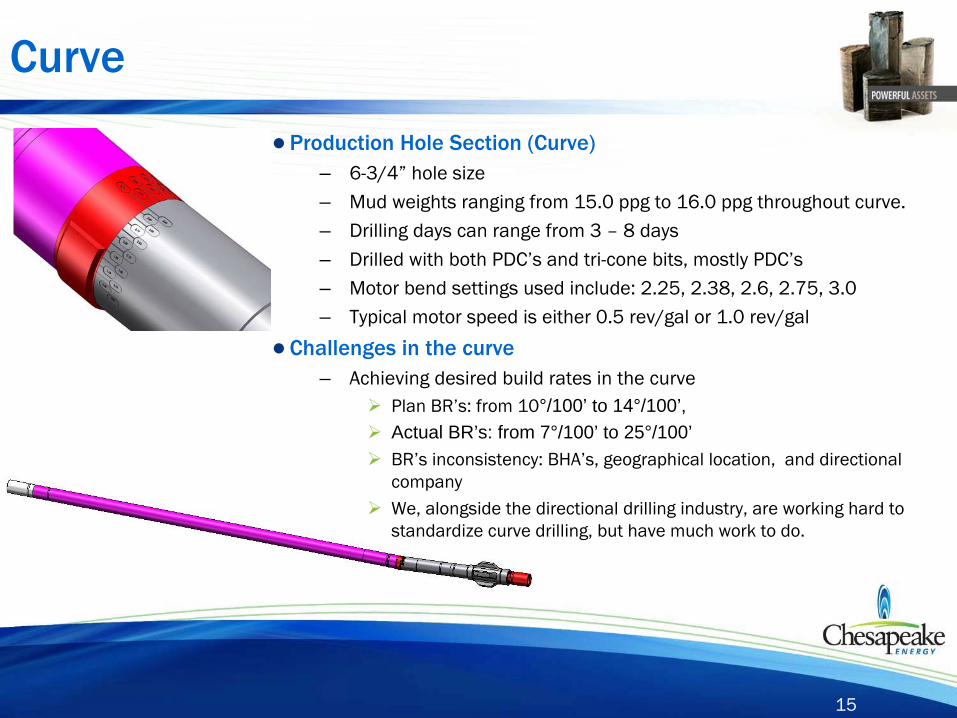
●Production Hole Section (Curve)– 6-3/4”
hole size– Mud weights ranging from 15.0 ppg
to 16.0 ppg
throughout curve.– Drilling days can range from 3 –
8 days– Drilled with both PDC’s
and tri-cone bits, mostly PDC’s– Motor bend settings used include: 2.25, 2.38, 2.6, 2.75, 3.0– Typical motor speed is either 0.5 rev/gal or 1.0 rev/gal
●Challenges in the curve– Achieving desired build rates in the curve
Plan BR’s: from 10°/100’ to 14°/100’,
Actual BR’s: from 7°/100’ to 25°/100’
BR’s inconsistency: BHA’s, geographical location, and directional company
We, alongside the directional drilling industry, are working hard to standardize curve drilling, but have much work to do.
16
Curve
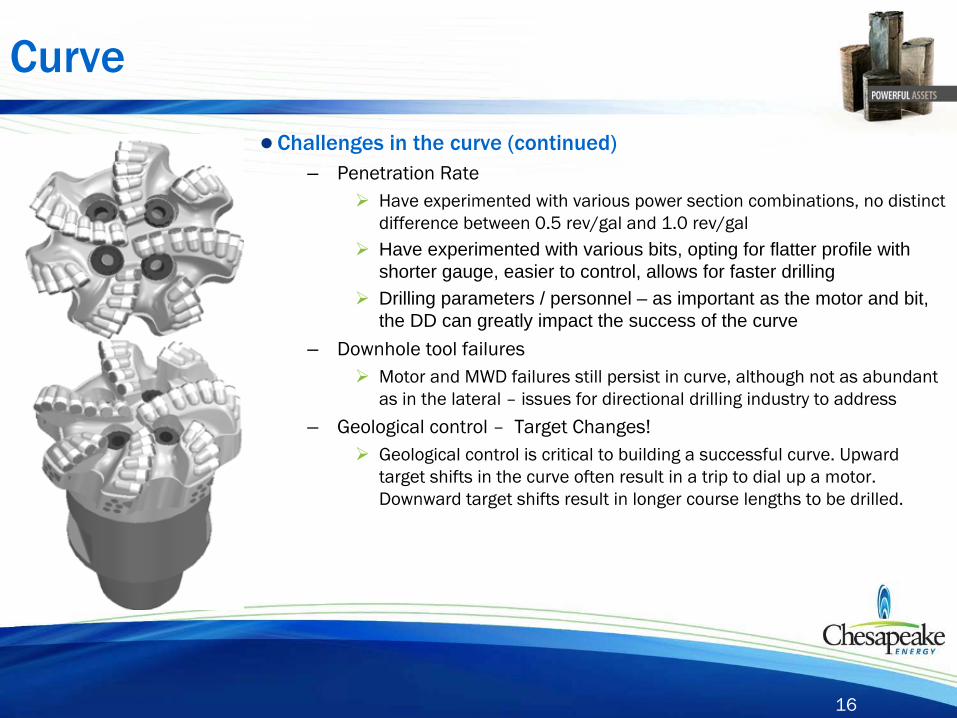
●Challenges in the curve (continued)– Penetration Rate
Have experimented with various power section combinations, no distinct difference between 0.5 rev/gal and 1.0 rev/gal
Have experimented with various bits, opting for flatter profile with shorter gauge, easier to control, allows for faster drilling
Drilling parameters / personnel – as important as the motor and bit, the DD can greatly impact the success of the curve
– Downhole tool failures
Motor and MWD failures still persist in curve, although not as abundant as in the lateral –
issues for directional drilling industry to address
– Geological control –
Target Changes!
Geological control is critical to building a successful curve. Upward target shifts in the curve often result in a trip to dial up a motor. Downward target shifts result in longer course lengths to be drilled.
17
Lateral
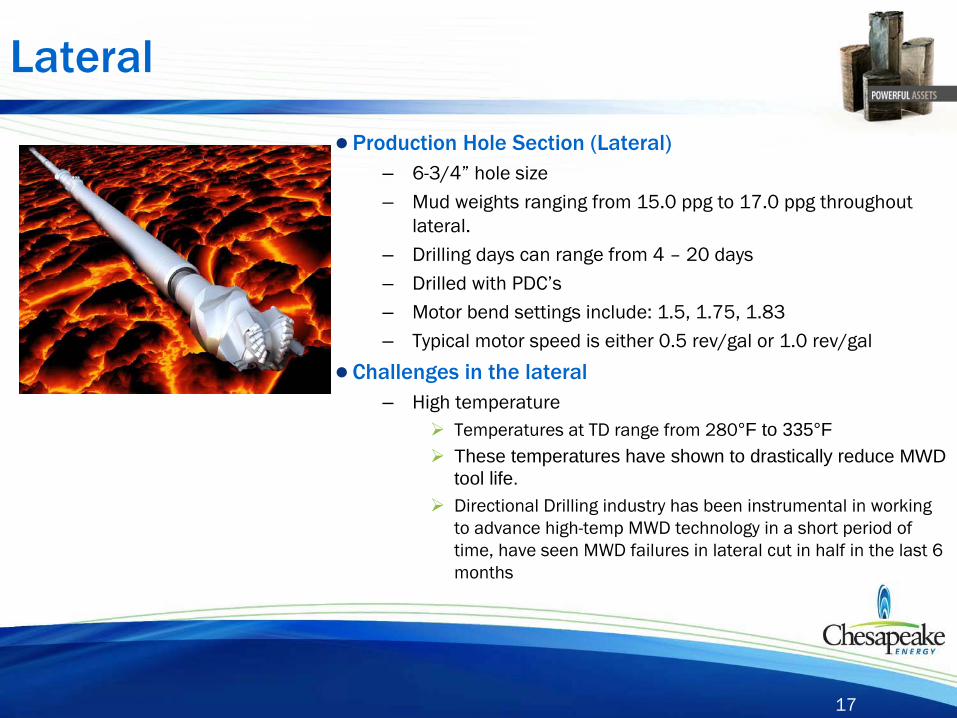
●Production Hole Section (Lateral)– 6-3/4”
hole size– Mud weights ranging from 15.0 ppg
to 17.0 ppg
throughout lateral.
– Drilling days can range from 4 –
20 days– Drilled with PDC’s– Motor bend settings include: 1.5, 1.75, 1.83– Typical motor speed is either 0.5 rev/gal or 1.0 rev/gal
●Challenges in the lateral– High temperature
Temperatures at TD range from 280°F to 335°F
These temperatures have shown to drastically reduce MWD tool life.
Directional Drilling industry has been instrumental in working to advance high-temp MWD technology in a short period of time, have seen MWD failures in lateral cut in half in the last 6 months
18
Lateral
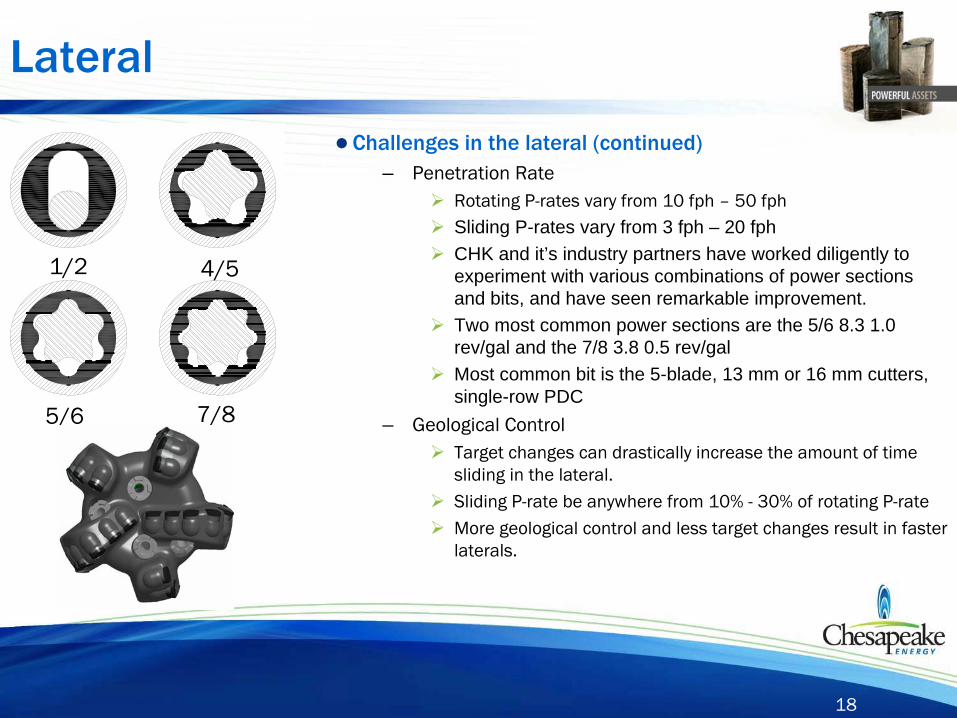
●Challenges in the lateral (continued)– Penetration Rate
Rotating P-rates vary from 10 fph
–
50 fph
Sliding P-rates vary from 3 fph – 20 fph
CHK and it’s industry partners have worked diligently to experiment with various combinations of power sections and bits, and have seen remarkable improvement.
Two most common power sections are the 5/6 8.3 1.0 rev/gal and the 7/8 3.8 0.5 rev/gal
Most common bit is the 5-blade, 13 mm or 16 mm cutters, single-row PDC
– Geological Control
Target changes can drastically increase the amount of time sliding in the lateral.
Sliding P-rate be anywhere from 10% -
30% of rotating P-rate
More geological control and less target changes result in faster
laterals.
1/2 4/5
5/6 7/8
19
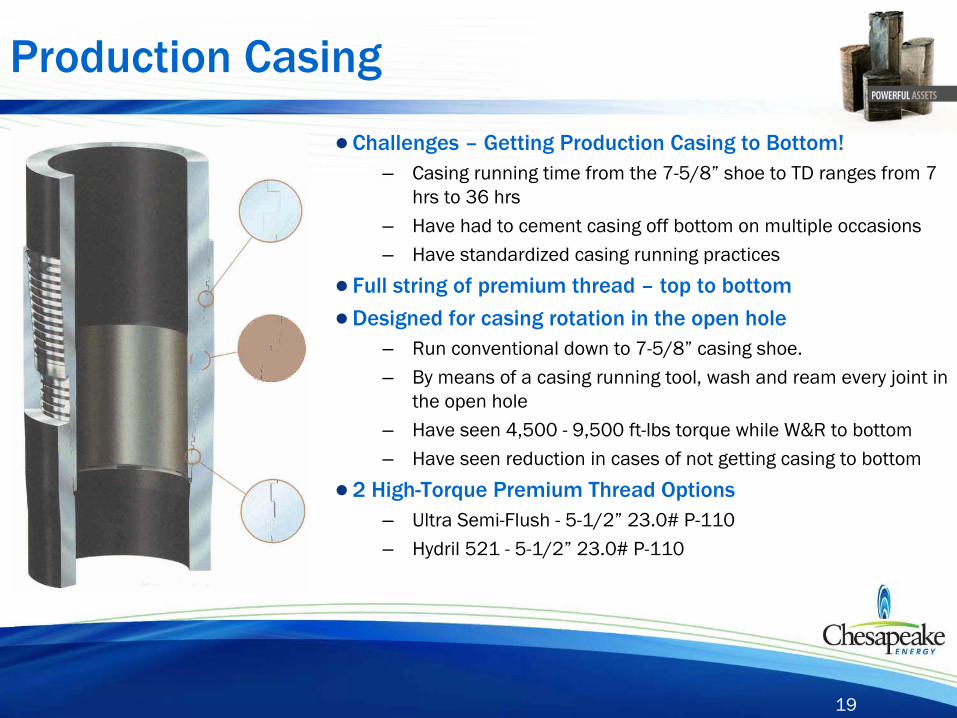
Production Casing
●Challenges –
Getting Production Casing to Bottom!– Casing running time from the 7-5/8”
shoe to TD ranges from 7 hrs to 36 hrs
– Have had to cement casing off bottom on multiple occasions– Have standardized casing running practices
● Full string of premium thread –
top to bottom
●Designed for casing rotation in the open hole– Run conventional down to 7-5/8”
casing shoe.– By means of a casing running tool, wash and ream every joint in
the open hole– Have seen 4,500 -
9,500 ft-lbs torque while W&R to bottom– Have seen reduction in cases of not getting casing to bottom
●2 High-Torque Premium Thread Options– Ultra Semi-Flush -
5-1/2”
23.0# P-110– Hydril
521 -
5-1/2”
23.0# P-110
20
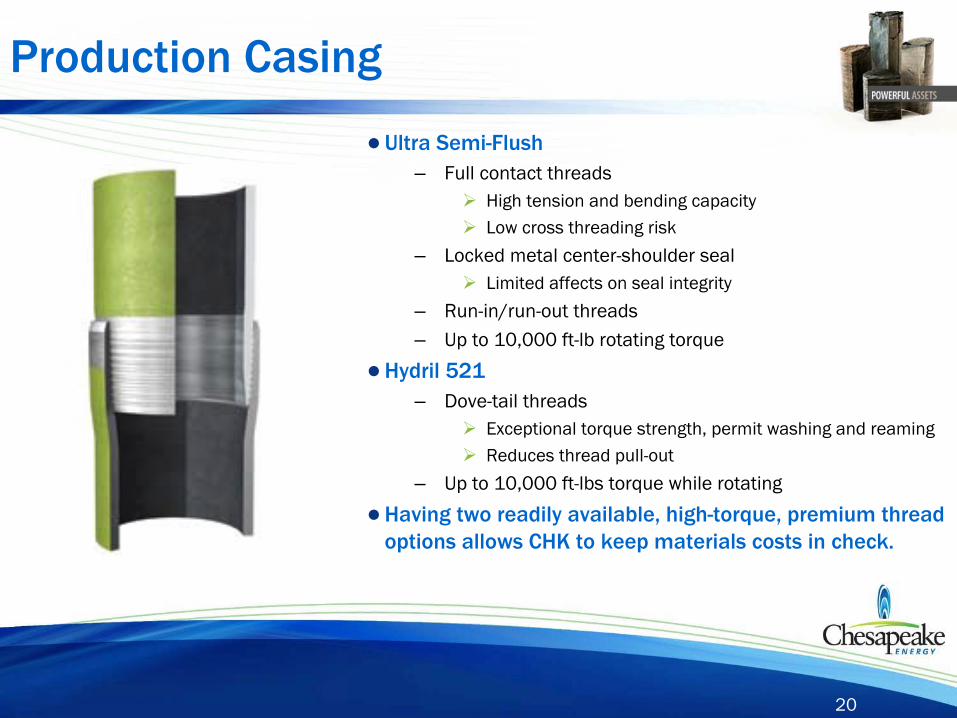
Production Casing
●Ultra Semi-Flush– Full contact threads
High tension and bending capacity
Low cross threading risk
– Locked metal center-shoulder seal
Limited affects on seal integrity
– Run-in/run-out threads– Up to 10,000 ft-lb rotating torque
●Hydril
521– Dove-tail threads
Exceptional torque strength, permit washing and reaming
Reduces thread pull-out
– Up to 10,000 ft-lbs torque while rotating
●Having two readily available, high-torque, premium thread options allows CHK to keep materials costs in check.
21
Going Forward
●What challenges must the industry meet going forward in the Haynesville Shale?
●Bit design and cutter technology must continue to advance; Travis Peak (Hosston)/Cotton Valley
– Abrasive, fractured, quartz cemented sandstone– Interbedded
shales– Hard fractured limestones– Up to 3,000’
in total thickness– 2 years ago drilled with IADC 647 –
837 insert bits
●Directional BHA’s and curve drilling techniques– Industry must strive to develop BHA’s that offer more consistent
build rates,– Field wide DD best practices for curve sections should be developed
●High-temperature down-hole tools– Industry must continue to advance MWD/motor reliability for
hostile/high-temp environments.
22
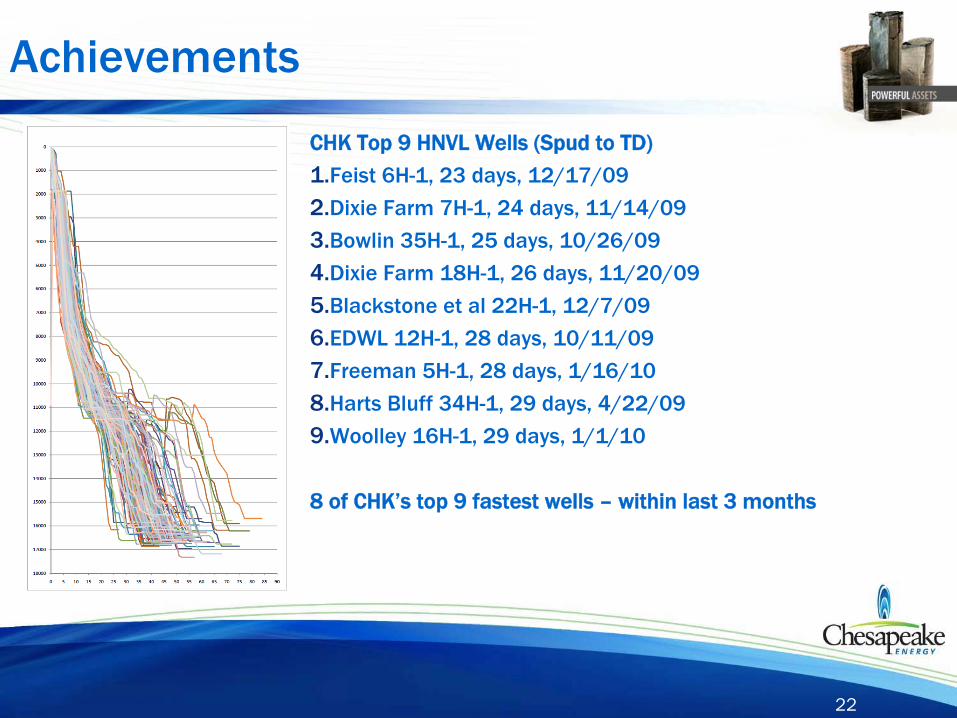
Achievements
CHK Top 9 HNVL Wells (Spud to TD)
1.Feist
6H-1, 23 days, 12/17/09
2.Dixie Farm 7H-1, 24 days, 11/14/09
3.Bowlin
35H-1, 25 days, 10/26/09
4.Dixie Farm 18H-1, 26 days, 11/20/09
5.Blackstone et al 22H-1, 12/7/09
6.EDWL 12H-1, 28 days, 10/11/09
7.Freeman 5H-1, 28 days, 1/16/10
8.Harts Bluff 34H-1, 29 days, 4/22/09
9.Woolley 16H-1, 29 days, 1/1/10
8 of CHK’s
top 9 fastest wells –
within last 3 months
23
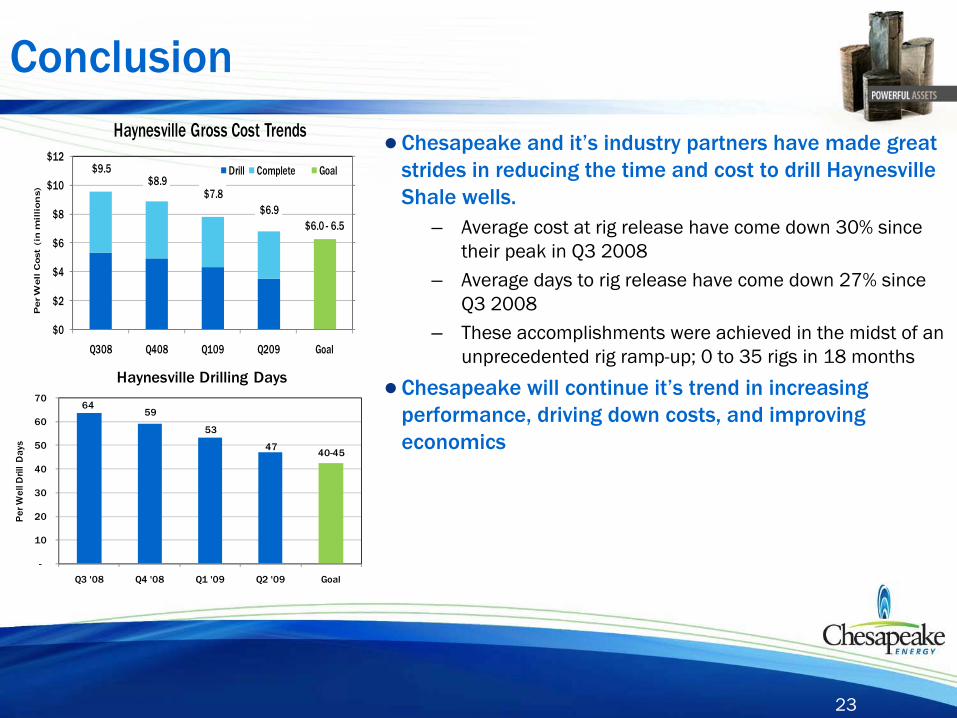
Conclusion
●Chesapeake and it’s industry partners have made great strides in reducing the time and cost to drill Haynesville Shale wells.
– Average cost at rig release have come down 30% since their peak in Q3 2008
– Average days to rig release have come down 27% since Q3 2008
– These accomplishments were achieved in the midst of an unprecedented rig ramp-up; 0 to 35 rigs in 18 months
●Chesapeake will continue it’s trend in increasing performance, driving down costs, and improving economics
$9.5 $8.9
$7.8 $6.9
$6.0 - 6.5
$0
$2
$4
$6
$8
$10
$12
Q308 Q408 Q109 Q209 Goal
Pe
r W
ell
Cost
(in
mil
lio
ns)
Haynesville Gross Cost Trends
Drill Complete Goal
64 59
53
47 40-45
-
10
20
30
40
50
60
70
Q3 '08 Q4 '08 Q1 '09 Q2 '09 Goal
Per
Wel
l Dril
l D
ays
Haynesville Drilling Days

24
The End
●Questions and Answers
Recommended