Embed Size (px)
Citation preview

NYSE:CRK
February 2020

This presentation includes “forward-looking statements” within the meaning of Section 27A of the Securities Act of 1933 and Section 21E of the Securities Exchange Act of 1934. Forward-looking statements give our current expectations or forecasts of future events. These statements include estimates of future natural gas and oil reserves, expected natural gas and oil production and future expenses, assumptions regarding future natural gas and oil prices, budgeted capital expenditures and other anticipated cash outflows, as well as statements concerning anticipated cash flow and liquidity, business strategy and other plans and objectives for future operations.
Our production forecasts are dependent upon many assumptions, including estimates of production decline rates from existing wells and the outcome of future drilling activity.
Important factors that could cause actual results to differ materially from those in the forward-looking statements herein include the timing and extent of changes in market prices for oil and gas, operating risks, liquidity risks, including risks relating to our debt, political and regulatory developments and legislation, and other risk factors and known trends and uncertainties as described in our Annual Report on Form 10-K for fiscal year 2018 filed with the Securities and Exchange Commission. Should one or more of these risks or uncertainties occur, or should underlying assumptions prove incorrect, our actual results and plans could differ materially from those expressed in the forward-looking statements.
Reserve engineering is a process of estimating underground accumulations of hydrocarbons that cannot be measured in an exact way. The accuracy of any reserve estimate depends on the quality of available data, the interpretation of such data and price and cost assumptions made by reserve engineers. In addition, the results of drilling, testing and production activities may justify revisions of estimate that were made previously. If significant, such revisions could impact Comstock’s strategy and change the schedule of any further production and development drilling. Accordingly, reserve estimates may differ significantly from the quantities of oil and natural gas that are ultimately recovered. These quantities do no necessarily constitute or represent reserves as defined by the SEC and are not intended to be representative of all anticipated future well results.
Comstock owns or has rights to various trademarks, service marks and trade names that we use in connection with the operation of our business. This presentation also contains trademarks, service marks and trade names of third parties, which are the property of their respective owners. The use or display of third parties’ trademarks, service marks, trade names or products in this presentation is not intended to, and does not imply, a relationship with, an endorsement or sponsorship by or of Comstock. Solely for convenience, the trademarks, service marks and trade names referred to in this presentation may appear without the ®. TM or SM symbols, but such references are not intended to indicate, in any way, that Comstock will not asset, to the fullest extend under applicable law, their rights or the right of the applicable licensor to these trademarks, service marks and trade names.
2

Why Invest in Comstock?
3
Covey Park Acquisition Meaningfully Increased Scale, More than Doubling Asset Base and Driving Significant Financial and Operational Efficiencies
Comstock / Covey Park Combination Created the Basin Leader in the Haynesville, a Premier Natural Gas Basin with Superior Economics and Geographic Proximity to Gulf Coast
Haynesville Drilling Program Generates Economic Returns Even with Low Natural Gas Prices
Conservative 2020 Operating Plan Provides Growth and Free Cash Flow Generation to Drive Further Deleveraging
Strong Financial Profile Underpinned by Peer-Leading Margins and Economics; No Debt Maturities Through 2024

Covey Park Merger
4
Substantial Scale in the Haynesville Industry-Leading Margins New Management Team
Low-Cost Flexible Gas Marketing Achieving Significant Synergies Focused on Balance Sheet
• 1.2 Bcfe/d of net production
• 5.4 Tcfe of SEC proved reserves
• 309,000 net acres in the Haynesville / Bossier
• Over 2,000 net drilling locations
• New leadership team with half of the VPs coming from each company in place to oversee combination of companies
• Selecting best practices from each company
• Focused on creating an efficient / low overhead company
• 3rd quarter unit cost structure of 66¢ per Mcfe(1)
• 3rd quarter pro forma EBITDAX margin of 74%
• Favorable proximity to Gulf Coast demand with 500 miles of owned gas gathering infrastructure
• Covey Park assets had higher gas price realizations
• Negotiated new gathering contracts and marketing arrangements for access to premium Gulf Coast markets
• Consolidation of Dallas corporate offices expected to be complete by yearend with 41% expected reduction to combined corporate staff
• On track to achieve go-forward annual G&A of ~$30 million
• Adding data scientists to staff and implementing tailored drawdown for every new well
• Leverage metrics immediately improved as result of the transaction
• Expect to generate substantial free cash flow while still providing 6%-8% production growth
• Potential divestitures of non-core assets to reduce debt and enhance liquidity
(1) Costs include LOE , Production Taxes, Gathering & Transportation and G&A.

The Leading Haynesville Operator
5
Haynesville / Bossier Shale Comstock Resources Overview
• Significant Scale in the Haynesville • 309,000 Haynesville shale net
acres • Robust inventory of de-risked, high-
return drilling locations • >2,000 net drilling locations • ~74% of locations >5,000’
laterals • Peer-leading margins with substantial
free cash flow generation in 2020
• Low-cost, flexible marketing options • Own 500 miles of gas gathering
systems • Limited basis risk due to
proximity and contracts tied to Henry Hub
• Low gathering, treating and transportation cost
• No unmet minimum volume commitments
Haynesville Shale
De Soto
Harrison
Panola
Sabine
Shelby
Caddo
Robertson
Bossier
Nacogdoches
San Augustine
Red River
Bienville
Bossier Shale
Company Statistics Net Acres(Haynesville / Bossier) 309,000 Q3 19 PF Production ~1.2 Bcfe/d
Net Locations 2,000+ Proved Reserves 5,364 Bcfe
% Held-by-Production 94% % Gas 97%
% Operated 90% PDP PV-10 $2.3 bn
% Working Interest 77% Total PV-10 $4.1 bn

AREA • Primarily DeSoto Parish, Louisiana
LAND • Approximately 3,000 net acres • ~100% HBP
WELLS • 75 (20.1 net) producing wells • 50 (16.7 net) operated • 36 (11.7 net) Haynesville • Average NRI of 81%
PRODUCTION / RESERVES
• 12 MMcfe per day • 89 Bcfe with an SEC PV 10 of $51
million
OPERATIONS • 3 Comstock-operated wells in progress which are expected to come on line in January ’20
DEVELOPMENT • Horizontal Locations:
44 Gross / 12.7 net • Average ~6500 lateral lengths
which can be optimized further when combined with Comstock’s acreage
TRANSACTION • 4,500,000 shares ($31 million) • Closed on November 1, 2019
Bolt-on Acquisition
6
COMSTOCK EXISTING
COMSTOCK OPERATED
COMSTOCK TO BECOME OPERATOR
NON-OPERATED
De Soto
Caddo
Sabine
Bienville

Haynesville/Bossier Inventory
7
Extensive inventory of drilling opportunities in the Haynesville and Bossier shales
(Gross) (Net) (Gross) (Net) (Gross) (Net)
up to 5,000 ft. 391 306.4 689 93.1 1,080 399.5 5,000 ft. to 8,000 ft. 552 414.0 113 17.2 665 431.2 > 8,000 ft. 517 369.9 198 27.4 715 397.4
1,460 1,090.3 1,000 137.7 2,460 1,228.1
(Gross) (Net) (Gross) (Net) (Gross) (Net)
up to 5,000 ft. 226 181.0 342 44.7 568 225.7 5,000 ft. to 8,000 ft. 366 274.4 65 7.0 431 281.4 > 8,000 ft. 344 271.8 68 3.8 412 275.6
936 727.1 475 55.5 1,411 782.6
2,396 1,817.4 1,475 193.3 3,871 2,010.7
Operated Non-Operated Total
Mid-BossierOperated Non-Operated Total
HaynesvilleAs of 9/30/19

Haynesville Well Economics
Average Well Economics - 4,500' L 7,500' L 9,500' L
Estimated Well Costs ($ millions) $6.6 $9.5 $10.8
Proppant (Pounds per lateral ft.) 3,800 3,800 3,800
EUR (Bcf) (2.2 Bcf per lateral ft.)* 10 16 21
Rate of Return (%)
Net Present Value at 10% (Million $)
8
4,500 ft. 7,500 ft. 9,500 ft.
0%
20%
40%
60%
80%
100%
120%
140%
160%
180%
200%
$2.00 $2.50 $3.00 $3.50
% R
OR
$/MCF
4,500 ft.
7,500 ft.
9,500 ft
$0
$2
$4
$6
$8
$10
$12
$14
$16
$18
$20
$2.00 $2.50 $3.00 $3.50
NPV
@10
(in
mill
ions
)$/MCF
*Wells in inventory range from 2 to 2.5 bcf per 1,000 ft. – Illustrated economics based on 2.2 bcf per 1,000 ft.

(5)
0
5
10
2000 2010 2020 2030 2040 2050
Market Dynamics and LNG Growth Along the Gulf Coast Supports Haynesville Growth and Long-Term Gas Demand
9
• ~23 Bcf/d of new natural gas supply needed to offset the 27% base decline (¹) for total U.S. supply in 2019 alone
• Another 3 Bcf/d of new supply needed to meet demand growth
• LNG export demand expected to double to nearly 9 Bcf/d by year-end 2019 as new U.S. liquefaction capacity comes online
• Thirteen LNG export terminals are approved (five under construction), with twelve located in the Gulf Coast region
• Over 4.0 Bcf/d of demand expected by 2020 from Mexico import needs fueled by the expansion of the country's gas pipeline and power transmission infrastructure
• Continued coal to gas switching momentum expected through 2023
…Almost All of the LNG Capacity Located on the Gulf Coast
28
21
14
7
0
(7)
(14)
LNG exports
Pipeline exports to:
Mexico
Canada
Pipeline imports from:
Canada
LNG imports
Historical Projections 2019
(TCF) (Bcf/d)
LNG Exports Expected to Drive Gas Demand Growth…
Approved LNG Export Terminal
Source: EIA, FERC. (1) Base decline calculated using 4Q over 4Q forecast production rates for all wells
producing as of year-end 2018 based on Platts bottoms up well by well analysis.
• Company has taken proactive approach to enhancing margins, utilizing: • Structured long-term gas
sales agreements linked to premium Gulf Coast markets*
• Nominal legacy firm transportation agreements, at out-of-market rates
• Major shipper with Enterprise Products Partners on ~1 Bcf/d new Haynesville Acadian Extension
• Medium-term sales agreements, which provide pricing certainty and uplift • Termed to coincide with
Acadian Extension in-service date
Midstream and Marketing Accessing True Gulf Coast Demand Centers
Carthage
*Premium Gulf Coast markets include Henry Hub, Gillis, Transco 45 and HSC
Perryville
Henry Hub HSC
Gillis
LNG & Industrial Demand Centers
10

Gas 97%
Oil 3%
PDP31%
PDNP2%
PUD67%
PDP56%
PDNP2%
PUD42%
11
Proved Reserve Base
PV-10 $4,112MM
1P Reserves 5,364 Bcfe
SEC Reserves (1)
SEC Proved by Category (1)
Note: Reserves calculated based on weighted-average adjusted. prices of $61.23 / bbl and $2.92 / Mcf for oil and natural gas, respectively. (1) Pro Forma proved reserves as of 12/31/18 based on 3rd party engineering. Pro forma PV-10 is not a financial measure
calculated or presented in accordance with GAAP and generally differs from standardized measure, the most directly comparable GAAP financial measure, because it does not include the effects of income taxes on future net revenues. After giving effect to a present value of future income taxes discounted at 10% of $766MM (giving pro forma effect to Covey Park’s acquisition by a C-Corporation), the Company’s pro forma Standardized Measure as of December 31, 2018 was $3,346MM.
Reserve Gas Oil Total PV-10Category (Bcf) (MMBbl) (Bcfe) ($MM)
PDP 1,529 21 1,656 $2,299PDNP 92 1 95 $76PUD 3,600 2 3,613 $1,737SEC Proved 5,221 24 5,364 $4,112
1P Gas Reserves 5,221 Bcf

(MMcf / day) Haynesville/Bossier Production
12
13.2 18.2 8.614.210.1 9.3 9.6 10.9 10.0 11.5Net Wells
Completed in Quarter
- 2.8 7.0 2.0 10.2
Expect to complete 19.0 net wells in 4Q19

70%76%
70% 68%
56% 53%45%
38%33% 32%
22% 18%
CRK Oil Peer 2 Oil Peer 1 Oil Peer 3 Gas Peer 1 Gas Peer 2 Gas Peer 6 Gas Peer 4 Gas Peer 5 Gas Peer 3 Gas Peer 7 Gas Peer 8
$0.36 $0.11 $0.21
$1.01
$0.16 $0.10 $0.24 $0.21 $0.21
$0.23 $0.66 $0.56 $0.98 $1.15 $1.00
$1.43
$1.95
$0.07 $0.07 $0.09
$0.20 $0.15
$0.11 $0.24
$0.16
$0.10
$0.66 $0.84 $0.86
$1.21 $1.29 $1.36 $1.47
$1.80
$2.26
CRK Gas Peer 1 Gas Peer 2 Gas Peer 3 Gas Peer 4 Gas Peer 5 Gas Peer 6 Gas Peer 7 Gas Peer 8
LOE & Taxes Gathering & Treating G&A
Low Cost Structure and High EBITDAX Margin
13 Source: Public filings Note: Financial metrics based on Q3’19 reported actuals. Gas peers include: AR, CNX, COG, EQT, GPOR, MR, RRC and SWN. Permian peers include: CXO, FANG and LPI.
Best-In-Class Cost Structure of Gas Producers
Leading Margins Compare Favorably to Both Permian and Gas-Weighted Names
Gas Peers Permian Peers
$ / M
cfe
Unh
edge
d EB
ITD
AX
Mar
gin
(%)

$1,338
$1,423 $1,464 $1,437
$1,537
$1,434 $1,430 $1,445
$1,334 $1,403
$1,229 $1,176
Q1 Q2 Q3 Q4 Q1 Q2 Q3 Q4 Q1 Q2 Q3 Q4
2017 2017 2017 2017 2018 2018 2018 2018 2019 2019 2019 2019
D&C $/ft
Improving D&C Costs ($ per Lateral Foot)
14

($ in millions)
Drilling Program and 2020 Outlook
15
Gross WI Net Gross WI Net Gross WI Net$ Wells Wells $ Wells Wells $ Wells Wells
Haynesville/Bossier Shale:Completion of Wells Drilled in PY (1) 59.2$ 59.2$ 58.2$ Wells Drilled and Completed in CY 231.6 41 28.8 319.5 47 34.0 350.5 44 32.9 Wells Drilled in CY (not completed) 10.4 - - 43.0 18 10.7 33.1 18 11.5 Non-operated and other 35.0 5 0.7 59.2 7 1.1 33.3
336.2$ 46 29.4 480.9$ 72 45.7 475.0$ 62 44.4
Bakken Shale 3.1$ 3.1$ -$ Eagle Ford Shale 16.2 4 2.2 16.2 4 2.2 -
Total Drilling and Completion 355.6$ 50 31.6 500.2$ 76 47.9 475.0$ 62 44.4
(1) DUCs Carryover 16.0 12.6 16.0 12.6 18.0 10.7
2020 1st Nine Months 2019 Full Year 2019
Guidance Q4 2019 FY 2020
Production (Mmcfe/d) 1,300 - 1,400 1,250 - 1,450
% Natural Gas 97% - 99% 97% - 99%
Capital Expenditures ($MM) $140 - $150 $460 - $490
Expenses ($/Mcfe) Lease Operating $0.25 - $0.30 $0.23 - $0.27 Gathering & Transportation $0.27 - $0.31 $0.29 - $0.33 Production Taxes $0.05 - $0.07 $0.06 - $0.08 DD&A $0.80 - $0.95 $0.80 - $0.95 Cash G&A $0.05 - $0.07 $0.06 - $0.08
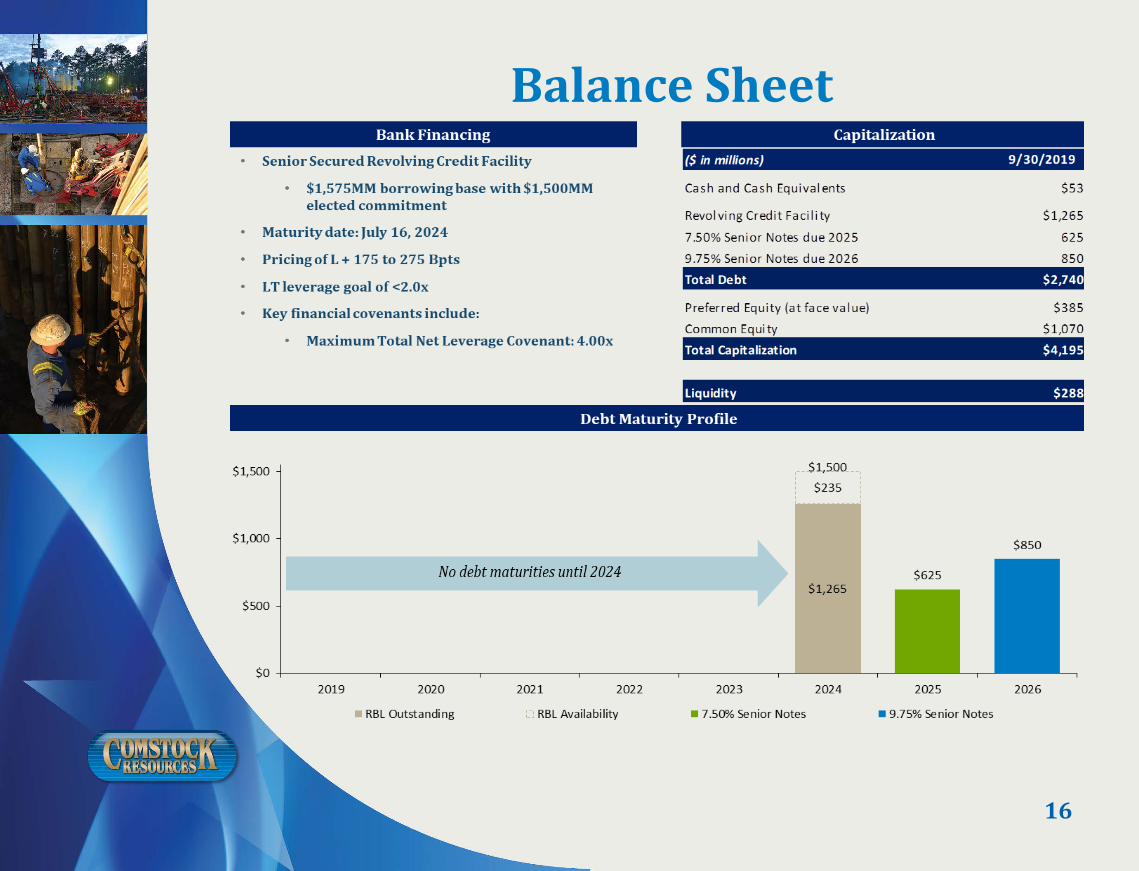
Balance Sheet
16

Oil and Gas Hedging Program
Comstock targets having 50% to 60% of its future twelve months oil and gas production hedged
17
(1) Comstock also sold natural gas swaptions of 195,000 MMBtu/d for calendar 2021 at an average strike price of $2.52/Mmbtu. (2) Comstock also sold natural gas swaptions of 135,000 MMbtu/d for calendar 2021 at an average strike price of $2.521/MMbtu (3) Calculated using the long put price for all two-way and three-way collars.
Natural Gas (MMbtu/d) Crude Oil (Bbl/d)Period Swaps Collars 3-Way Collars Total Collars
2019 4Q 444,547 107,783 140,000 692,329 3,0892019 Remaining 444,547 107,783 140,000 692,329 3,089
2020 1Q 476,938 100,549 110,000 687,487 4,8572020 2Q 486,498 59,341 60,000 605,838 3,1702020 3Q 483,839 9,783 60,000 553,621 2,9632020 4Q 483,027 9,783 60,000 552,809 2,8212020 FY 482,580 44,672 72,432 599,684 3,450
2021 1Q 182,271 - - 182,271 -2021 2Q 107,184 - - 107,184 -2021 3Q 100,000 - - 100,000 -2021 4Q 100,000 - - 100,000 -2021 FY1 122,077 - - 122,077 -2022 FY2 30,000 - - 30,000 -
Weighted Average Hedge PricesNatural Gas ($ MMbtu) Crude Oil ($ Bbl)
Period Swaps Collars 3-Way Collars Total WAVG3 Collars2019 4Q $2.85 $2.39 / $3.52 $2.41 / $2.79 / $3.08 $2.77 $45.00 / $65.632019 Remaining $2.85 $2.39 / $3.52 $2.41 / $2.79 / $3.08 $2.77 $45.00 / $65.63
2020 1Q $2.74 $2.52 / $3.89 $2.35 / $2.68 / $2.97 $2.70 $47.04 / $66.372020 2Q $2.67 $2.38 / $2.88 $2.33 / $2.63 / $2.99 $2.63 $50.00 / $64.562020 3Q $2.67 $2.50 / $3.05 $2.33 / $2.63 / $2.99 $2.66 $49.15 / $63.962020 4Q $2.66 $2.50 / $3.05 $2.33 / $2.63 / $2.99 $2.66 $49.35 / $63.832020 FY $2.68 $2.47 / $3.46 $2.33 / $2.65 / $2.99 $2.66 $48.65 / $64.92
2021 1Q $2.69 - - $2.69 -2021 2Q $2.71 - - $2.71 -2021 3Q $2.67 - - $2.67 -2021 4Q $2.67 - - $2.67 -2021 FY $2.69 - - $2.69 -2022 FY $2.81 - - $2.81 -