(8523($1�&200,66,2118&/($5�6$)(7<�$1'�7+(
(19,521(0(17
5(3257�(85������
+DQGERRN�RQ�PHDVXUHPHQW�PHWKRGV�DQG�VWUDWHJLHVDW�YHU\�ORZ�OHYHOV�DQG�DFWLYLWLHV
P H Burgess
Abstract
Decommissioning of nuclear and other sites which process or employ radioactive materials
is becoming increasingly important. This handbook suggests methods which can be used to assess the
levels of radioactive contamination and neutron activation in materials which have the potential for free
release, ie, those which are only, at worst, contaminated or activated to a low level.
Radiation Metrology
National Radiological Protection Board
Chilton
Didcot
Oxon OX11 0RQ

February 1998
i
ContentsPage
� ,QWURGXFWLRQ �
� 0HDVXUHPHQW�W\SHV� �
� 3ODQQLQJ�D�PHDVXUHPHQW�SURJUDPPH �
� 5HDGLO\�DYDLODEOH�VRXUFHV�RI�LQIRUPDWLRQ �
4.1 Existing radiation protection monitoring data 3
4.2 Authorised discharge route monitoring 3
4.3 Plant integrity monitoring 3
4.4 Activation calculations 3
4.5 Process throughput 3
4.6 Possible problems 4
� $VVHVVLQJ�FXUUHQW�SODQW�FRQGLWLRQ �5.1 Action list for equipment and procedures for waste assessment 4
5.1.1 Surface contamination 45.1.2 Bulk contaminated and neutron activated materials 6
� 0HDVXUHPHQW�RI�VXUIDFH�FRQWDPLQDWLRQ �6.1 Introduction 76.2 Choice of detector 7
6.2.1 Alpha emitters 86.2.1.1 Scintillation counters 86.2.1.2 Proportional counters 96.2.1.3 Geiger Muller counters 116.2.1.4 Semiconductor detectors 116.2.1.5 Ionisation chamber detectors 116.2.1.6 Summary of minimum detectable activities 12
RI� �FRQWDPLQDWLRQ�IRU�WKH�GLIIHUHQW�GHWHFWRU�W\SHV�sizes and integrating periods
6.2.1.7 Summary of minimum measurable activities 13RI� �FRQWDPLQDWLRQ�IRU�WKH�GLIIHUHQW�GHWHFWRU�W\SHV�sizes and integrating periods
6.2.2 Beta emitters 136.2.2.1 Scintillation counters 136.2.2.2 Proportional counters 166.2.2.3 Geiger Muller detectors 176.2.2.4 Solid state detectors 196.2.2.5 Ion chamber detectors 196.2.2.6 Summary of minimum detectable activities 20
IRU� �FRQWDPLQDWLRQ�IRU�GLIIHUHQW�GHWHFWRU�W\SHV�sizes and integrating periods
6.2.2.7 Summary of minimum measurable activities 22IRU� �FRQWDPLQDWLRQ�IRU�GLIIHUHQW�W\SHV�sizes and integrating periods
6.2.3 [�� �HPLWWHUV 236.2.4 Mixtures of radionuclides 25
6.3 Testing of monitoring equipment 276.4 The thickness of typical surface coatings and their influence on contamination 27
monitor performances6.5 Summary 30
6.5.1 Transport 306.5.2 Clearance levels 31
ii
� 0HDVXUHPHQW�RI�VSHFLILF�DFWLYLW\ ��7.1 Introduction 327.2 0RQLWRULQJ�RI�VSHFLILF� �DQG� �DFWLYLW\�XVLQJ�KDQG�KHOG�HTXLSPHQW 337.3 0RQLWRULQJ�RI�VSHFLILF� �DFWLYLW\�XVLQJ�KDQG�KHOG�HTXLSPHQW 34
7.3.1 A close to infinite sample 357.3.2 Samples of limited thickness 387.3.3 Thicker samples and samples of complicated shape 417.3.4 Hand held equipment with spectrometric capability 417.3.5 &DOLEUDWLRQ�RI� �PRQLWRULQJ�HTXLSPHQW 42
7.3.5.1 Using dosimetric sources 427.3.5.2 Using spectrometer energy calibration sources 42
7.4 Problems associated with the use of scintillation detectors and photo multiplier 43tubes
7.5 Monitoring of specific activity using installed equipment 447.5.1 Conveyor belt monitoring using sodium iodide scintillation detectors 447.5.2 Conveyor belt systems using plastic scintillators 45
7.6 0RQLWRULQJ�IRU� �HPLVVLRQV�XVLQJ�VHPLFRQGXFWRU�GHWHFWRUV 457.6.1 The properties of semiconductor detectors 45
7.6.1.1 Energy resolution 467.6.1.2 Peak to Compton ratio 467.6.1.3 Escape peaks 467.6.1.4 Prediction of response 46
7.6.2 Monitoring applications 477.6.2.1 Finger printing 477.6.2.2 Drum scanner 47
7.7 Calibration of intrinsic germanium detectors 487.7.1 Energy calibration 487.7.2 Efficiency calibration 48
7.8 Assessment of transuranic waste 497.9 Radiochemical techniques 49
� 6RPH�H[DPSOHV�RI�GHFRPPLVVLRQLQJ�SURJUDPPHV ��8.1 Removal of a pneumatic tube transport mechanism 528.2 Clearance of asbestos insulation 538.3 Monitoring of the inside of fume cupboards and glove boxes 538.4 Monitoring of equipment used in the handling of 226Ra 548.5 Monitoring of scaffold boards and tubes 548.6 Monitoring of steel beams 558.7 Decommissioning of a gaseous diffusion plant 558.8 Monitoring of earth contaminated by leakage from a fuel storage pond 568.9 Monitoring of the internal and external activity of scaffold poles and 56
process piping8.10 Monitoring of cable 578.11 Monitoring of uranium contaminated plastic covered steel floor plate 58
� (TXLSPHQW�FRVWV ��
�� %LEOLRJUDSK\ ��
�� 5HIHUHQFHV ��
�� )LJXUHV ��
$QQH[�$�RQ�FRVW�FRQVLGHUDWLRQV ��

1
1 Introduction
1.1 Objectives
Interest in decommissioning nuclear facilities is increasing, both in terms of work in progress
and in terms of the long term planning for facilities which are expected to operate for many years or
which are still in the course of construction and planning. Costs of disposal of active waste are rising
and there is an increasing awareness of the value of recycling useful materials. These aspects encourage
operators to classify with increasing care materials from equipment and site demolition and clearance.
Guidance on acceptable levels for the free release of materials is being developed within the
European Community1 (EC) for general application for both surface and bulk activity. This handbook
(i) reviews the capabilities and limitations of various types of monitoring equipment and
practicable applicable methods, which can be used to demonstrate compliance with standards
set for release of material,
(ii) provides generic cost considerations, and
(iii) gives examples of the methods and instrumentation which have been employed and which look
attractive for future work.
Projects considered have ranged in size from the recovery of limited amounts of relatively high
value materials such as copper pipe to large scale projects such as the dismantling of a very large
gaseous diffusion plant.
1.2 Economic background
Decommissioning can be a very difficult process, involving the handling of very heavily
contaminated or activated items, some of which, such as asbestos, are themselves problem materials.
These materials will not be considered in this handbook which will concentrate on the generally much
larger volume of materials which are either very lightly contaminated or activated, or which may not
be radioactive at all. Examples of the latter include structural steel and concrete from a reactor building
which have never been exposed to a significant neutron flux, electrical cables, motors, air conditioning
ducts from the clean side and many others. The operator may however either wish, or be obliged, to
demonstrate that contamination or bulk activities allow free release of these materials.
The economics of such programmes are not always clear cut. Measurement inevitably implies
costs, which can be considerable both for equipment and labour. The value of the recycled materials
may be intrinsically low, and it is possible that potential buyers may well offer prices below the
recognised market value because of an understandable reluctance to handle materials which have been
in any way connected with radiation. For some materials, such as concrete and wood, reuse may be
possible within the nuclear licenced site, if the site is large and developing. Transport costs involved
in, for example, transporting scrap steel to a smelter which is prepared to handle lightly contaminated
materials may be significant. Operators may well be concerned about an individual sorting through a
large volume of materials which have been assessed on the basis of mean activity and finding a small
object which is considerably more radioactive than the mean. This object may then be used, quite
incorrectly, to cast doubt on the whole process. Companies buying scrap materials may well be

2
concerned by the possibility of either honest mistakes or malicious acts by persons involved in
sentencing the waste. Against this, operators may well take the view that costs of disposal to landfill
will probably rise as time goes on and may well find it difficult to get an agreed disposal cost per tonne
from the disposal site operator to cover the duration of the project. For many of these materials
balancing these costs and deciding on the best option is inevitably going to be difficult.
The adoption of measurement strategies and methods that are both cost efficient and provide
a transparent quality characterisation of waste is therefore highly desirable.
2 Measurement types
There are two distinct types of measurement to be considered. One is the monitoring of
surface contamination, ie, the measurement of radioactive materials which may be attached to the
surface of another object. These radioactive materials may well be subject to relatively easy removal,
leading to potential ingestion or inhalation by persons involved in handling, transporting and
UHSURFHVVLQJ�WKH�VFUDS���7KH\�PD\�DOVR�GLUHFWO\�LUUDGLDWH�ZRUNHUV�E\�WKH�HPLVVLRQ�RI�[�� �RU�HQHUJHWLF
�UDGLDWLRQ�� �$V�D�UHVXOW�RI�UHF\FOLQJ� WKH�UDGLRDFWLYH�PDWHULDO�PD\�EH�FRQFHQWUDWHG� LQ� WKH�UHF\FOHG
material or, as is more likely, discharged to the atmosphere or concentrated in recycling waste.
Assessment of surface contamination is thus an important part of the sentencing of decommissioned
materials.
The other broad category is contamination in bulk, caused either by direct neutron activation
of the material and its inherent impurities, or by the diffusion of radionuclides through the surface of
the material to a significant depth. These contaminants are inherently less accessible, which has the
advantage that they are less likely to be ingested or inhaled during recycling. They will, however,
continue to irradiate workers and will also be concentrated in the recycled materials, discharged to
atmosphere or concentrated in waste. They are also more difficult to measure because the geometry is
less defined and because self shielding is inevitable.
The two types of measurement also differ in the sense that surface contamination monitoring
can normally be performed on a relatively well defined area whereas the assessment of contamination
in bulk usually implies a significant averaging volume.
3 Planning a measurement programme
There are two questions to be asked before transporting material from a decommissioning site
for recycling:-
(1) Is the material fit for recycling, ie, does the total activity per unit mass comply with recycling
criteria? This can be composed of two elements, activity from surface contamination and
activity in the mass of the material.
(2) Is the material readily transportable to the recycling facility, if it is off the site, or do special
transport arrangements have to be made? This will normally be dictated by the removable
surface activity under the current (1990) IAEA Regulations for the Safe Transport of
Radioactive Material2 and in future, when implemented, the 1996 Regulations3 . Material is
GHILQHG�DV�FRQWDPLQDWHG�IRU� �DQG� �DFWLYLW\�LQ�H[FHVV�RI�����Bq cm-2 in the 1990 Regulations,
changing to 0.4 Bq cm-2 in the 1996 Regulations, and for alpha activity in excess of 0.03 Bq
cm-2, changing to 0.04 Bq cm-2. Special transport arrangements are required for activities in

3
excess of 4 Bq cm-2�� �DQG� ��DQG�����Bq cm-2�� ����7KH�FRQVHTXHQFHV�RI�WKHVH�YDOXHV�LV�WKDW
some material which is acceptable for free release for recycling, particularly material
FRQWDPLQDWHG� E\� ORZ� HQHUJ\� � HPLWWHUV� VXFK� DV� 147Pm, will have to be transported as
radioactive material.
Producing answers to these questions is the basis of the measurement programme.
4 Readily available sources of information
The process of deciding on the various options for the material generated in decommissioning
is complicated. The extra costs of monitoring to a level sufficient to justify free release have to be
balanced against the costs of storage on site or off-site disposal. It is important to assemble as much
information as is easily available as a first step. For those site operators whose plant is still operating
and some way from decommissioning there is an opportunity to construct monitoring and recording
programmes that will help in the decommissioning phase.
4.1 Existing radiation protection monitoring data
Monitoring information should be available throughout the life of the plant. Such monitoring
will normally have mainly been biased towards the designation of working areas in terms of dose rate,
air and surface activity levels. Measurements in areas where maintenance was performed regularly
should be well documented. Inaccessible areas will not be documented at all. The information may
well be quite basic, such as count rate from a particular type of beta counter, gross alpha count rate on
wipes, gamma ambient dose equivalent rate or neutron dose equivalent rate.
4.2 Authorised discharge route monitoring
For some areas useful information may well be available, especially where there are authorised
discharge routes. Stack discharges on power stations for the heating, ventilation and air conditioning
V\VWHPV�ZLOO�QRUPDOO\�EH�PRQLWRUHG�XVLQJ�KLJK�TXDOLW\� �VSHFWURPHWHUV��JHQHUDWLQJ�YDOXHV�RI�Bq m-3 for
a wide range of nuclides. Liquid discharge routes will also be monitored in a similar manner.
4.3 Plant integrity monitoring
Monitoring may have also been performed to check on plant integrity. A good example is the
secondary cooling circuit on PWRs where regular monitoring is undertaken to identify heat exchanger
leaks or, on gas cooled reactors, the burst can detector system which is designed to identify fuel failure.
4.4 Activation calculations
Knowledge of the likely neutron exposure and of the composition of structural materials will
enable the calculation, if sometimes only very approximately, of the levels of activation nuclides such
as 60Co and 54Mn.
4.5 Process throughput
In areas where fuel fabrication, reprocessing or other chemical operations have been
undertaken, the total throughput of radioactive material may be well known. Care has to be taken where
the deposition varies dramatically between the various chemical species. A good example is
4
the dramatic tendency of 99Tc from reprocessed uranium to plate out on the surface of fuel
fabrication plant.
4.6 Possible problems
Impediments to this process of gathering relevant data are many. In old plant monitoring
results may have been lost or many be intrinsically inadequate. Accidents may have taken place leading
to a much larger release of activity into the system than was anticipated at the construction stage.
Complicated parts of the plant such as pipe bends may have much higher contamination levels than
would be expected from measurements in other areas where deposition is less likely. Plant may have
been deliberately run in an unusual condition or may have been modified and components replaced at
some unspecified time. Alloys of a different composition to those specified may have been used. The
construction of the plant may differ from the plans available. The plant may have been operated under
some form of security condition which may mean that full monitoring data is not available.
The older the plant, and the more unusual the plant, the poorer the information that is likely
to be available in written records. It is important in these circumstances to trace as many of the workers
as possible, including those who have left the plant or retired, in order to get as complete as possible
picture of the real history of the plant.
5 Assessing current plant condition
No matter how good the information available on the plant before shutdown, it will still be
important to conduct more monitoring before planning a decommissioning and disposal operation. This
programme should be designed to give sufficient information to allow the design, at least in broad
outline, of the disposal monitoring programme, including the level of investment in automatic
monitoring equipment, the number of staff to be assigned to the monitoring programme, training needs
and the development of disposal cases for discussion with the relevant authorities.
It should be designed to identify the presence of difficult to monitor nuclides, which may not
have been important while the plant was running but which may contribute significantly to the total
activity. Such nuclides include the low energy (~ 6 keV) electron capture nuclides generated by neutron
activation in steel and the very low energy beta emitters such as 63Ni and 241Pu. Detailed monitoring
should be concentrated in the area between the material which is blatantly too active, as indicated by
dose rate measurements for example, and the material which should definitely be clean or only trivially
contaminated.
The most effective approach is the removal of samples for analysis by gamma spectrometry
and radiochemical analysis. This gives an early opportunity to establish ‘fingerprints’ for different
materials and areas of the site, and the identification of monitoring strategies and instrumentation.
Action lists follow which describe these points in more detail.
5.1 Action list for equipment and procedures for waste assessment
����� 6XUIDFH�FRQWDPLQDWLRQ
(a) Identify likely contaminants from operating data.
(b) Weight the contaminants using the free release levels.
(c) Identify those which are likely to be important.

5
(d) Look at the decay scheme.
(e) Identify nuclides which are likely to be present and emit reasonably penetrating radiation eg,
beta emitters with an Emax in excess of 0.6 MeV.
(f) Choose a suitable instrument ie, one which responds to likely dominating contaminants, has
a suitable area and is sufficiently robust.
(g) Identify contaminated areas.
Are there any problems with gamma background?
(h) 6DPSOH�FRQWDPLQDWLRQ�DQG�DQDO\VH�E\� �VSHFWURPHWU\�DQG�UDGLRFKHPLFDO�DQDO\VLV�IRU�DOSKD�DQG
EHWD�HPLWWHUV�ZLWK�LQVXIILFLHQW� �HPLVVLRQV�
(i) Compare (h) with (a). Are the results in reasonable agreement with prediction? Is the
radionuclide mix reasonably consistent, at least in terms of the nuclides which will influence
the free release of the material? Are there problem nuclides, in the sense of nuclides which
are important in terms of the release criteria but which are difficult to detect on the material
XQGHU�FRQVLGHUDWLRQ"��$�JRRG�H[DPSOH�ZRXOG�EH�VWHHO�ZKLFK�LV�UXVW\�DQG�KDV�VLJQLILFDQW�
contamination.
(j) Decide on whether direct monitoring is possible for the material and the condition in which
it exists. If direct monitoring is not possible would cleaning be possible? If it is, is the initial
instrument appropriate? Would there be advantages in negotiating with any supervisory
authority for an increase in any initial defined averaging area using the initial results for
justification?
(k) Decide on the most appropriate instrument, ie, one which provides the most appropriate
balance of characteristics
: has good sensitivity over background.
: is not dependent on changes in levels of unimportant nuclides.
: is as robust as possible having taken account of the demands above.
: is simple to operate by the staff selected.
: can be tested easily.
: is easy to repair.
: has an appropriate averaging area balanced against cost, complexity of the shape of
the material to be monitored and the permitted averaging area.
(l) Decide on the number of instruments required. Negotiate a repair service or identify a member
of the team who can maintain the equipment. Order sufficient spares, having estimated the
likely damage rate and considered the delivery time for supply of components from the
manufacturer or component supplier.
(m) Organise training for the workforce on both the instrument chosen and the monitoring
technique.
(n) Write monitoring and maintenance procedures.
(o) Set up an auditing process, whereby results are traceable to national standards and also where
a random sample of the result is checked by another competent and independent person.
(p) 'HFLGH�RQ�WKH�IUHTXHQF\�RI�VDPSOLQJ�IRU� �VSHFWURPHWU\�DQG�UDGLRFKHPLFDO�DQDO\VLV�LQ�RUGHU
to support the calculated release level.
(q) Start monitoring for release.
(r) Take an early piece of the material which is contaminated at or around the release level. Ask
all the workforce to monitor it, concealing, as far as possible, that others will have monitored

6
it. Compare the results. Is the spread acceptable? Would significant errors have occurred in
the sense that either:
(i) a piece which was definitely over the acceptable level was marked for free release
or
(ii) a piece which was definitely within the limit was marked as excessively
contaminated. If so, find out why the error occurred and take steps to prevent it, such
as further training or a modification to a written procedure.
(s) Continue the process bearing in mind the need to continue to be confident that the instrument
indication corresponding to free release is unchanging. The process should be reviewed to
ensure that samples are being sorted correctly.
����� %XON�FRQWDPLQDWHG�DQG�QHXWURQ�DFWLYDWHG�PDWHULDOV
(a) Identify likely contaminants from operating data.
(b) Identify a hand held instrument which will respond to those contaminants.
(c) If at all possible remove samples for analysis, using the hand held instrument to aid selection.
(d) $QDO\VH�VDPSOHV�E\� �VSHFWURPHWU\�DQG�E\�UDGLRFKHPLFDO�DQDO\VLV�IRU�DOSKD�DQG�EHWD�HPLWWHUV
ZLWK�LQVXIILFLHQW� �HPLVVLRQV�
(e) Weight the measured activities using the free release levels.
(f) Identify those nuclides which are likely to be important.
Look at the decay scheme for each nuclide.
(g) Are the samples reasonably consistent?
(h) &KRRVH��LI�SRVVLEOH��D�XVHIXO�HPLVVLRQ��VXFK�DV�DQ�HQHUJHWLF� �OLQH��ZKLFK�LV�SUHVHQW�DW�D�OHYHO
proportional to the weighted activity levels in the samples.
In the absence of one useful energy, is there a limited combination of gamma emissions which
could be used to assess the waste?
(i) ,Q�WKH�DEVHQFH�RI�XVHIXO� �HPLVVLRQV�LV�WKHUH�VRPH�RWKHU�SRVVLEOH�PHDQV�RI�PRQLWRring such as
the measurement of gross alpha or gross beta emissions from prepared samples?
(j) Can the monitoring be performed in situ? Can the monitoring be performed after the materials
have been removed but are intact, such as steel beams? Will monitoring have to be performed
on what is essentially debris, such as concrete rubble?
(k) Identify a suitable monitoring technique or techniques. It may well be advantageous to split
the materials into 3 groups, the obviously clean, based on in situ measurement, which can go
directly for free release, the obviously excessively active, again based on in situ measurement,
and the borderline group. Materials in this group may require more sophisticated monitoring
using installed equipment.
(l) Identify suitable equipment to operate the monitoring techniques chosen.
(m) Decide on the number of instruments required. Organise maintenance. Order sufficient spares,
having estimated the likely damage rate and considered the delivery time for the supply of
components from the manufacturer or component supplier.
(n) Organise training for the workforce on the instruments and techniques chosen.
(o) Write monitoring and maintenance procedures.
(p) For installed monitoring, identify building needs and power requirements. As examples a
sodium iodide scintillator conveyor monitoring system for crushed rubble will require a large
but fairly basic building whereas a drum monitoring system using large intrinsic germanium

7
detectors will require a building which offers a good environment and the provision of a liquid
nitrogen supply.
(q) Set up an auditing process, whereby results are traceable to national standards and also where
a random sample of the results are checked by another competent and independent person.
(r) Decide whether there is a requirement for more detailed analysis of samples, by, for example,
germanium detector spectrometry and/or radiochemical analysis. If so, at what frequency?
(s) Start monitoring for release.
(t) In the case of in situ monitoring ask all the work force to monitor at defined positions
concealing, as far as possible, that others will have monitored at the same position. Compare
the results. Is the spread acceptable? Would significant errors have occurred in the sense that
either:
(i) a piece which was definitely over the acceptable level was marked for free release
or
(ii) a piece which was definitely within the limit was marked as excessively
contaminated. If so, can written procedures be improved or is extra training
required?
Continue the process bearing in mind that the operator has to be confident that significant
changes in radionuclide composition are identified and that the release criteria are adjusted
accordingly.
6 Measurement of surface contamination
6.1 Introduction
Measurement of surface contamination is an important aspect of the decommissioning of
nuclear facilities. Much of the effort is devoted to protecting the workforce and avoiding unacceptable
discharges to the environment. However, for many materials which have not encountered significant
neutron exposure and which thus cannot have been activated, contamination monitoring can be used
for clearance of the materials. The method is particularly suitable for materials like stainless steel
which, for the vast majority of nuclides, can be deemed to be a non-absorbing surface. Other metals
fall into the same category, but materials like concrete and wood pose problems because of the effects
of absorption into the surface. Other problems include the presence of paint on the surface which may
have been applied for protection but which also may have been applied to fix loose contamination. This
was a common technique in the past.
Contamination monitoring is particularly suitable for large flat surfaces but can also be
adopted for surfaces like the inside of pipes and ducts if the shape of the detector is suitable.
6.2 Choice of detector
The choice of detector is determined by the radionuclides present, the ease of access to the
surfaces to be monitored, the permissible maximum monitoring area, the presence or absence of a
VLJQLILFDQW� �EDFNJURXQG�DQG�WKH�VNLOOV�RI�WKH�ZRUNIRUFH���7KH�GHWHFWRU�FKRVHQ�REYLRXVO\�KDV�WR�UHVSRQG
effectively to the radionuclides of interest, but in many cases an additional constraint is to avoid
8
responding to other nuclides which may be present but which are of much lower radiological
significance. An example of this is 239Pu, a radionuclide where acceptable levels are very low, which
may be found in the company of beta emitting fission products, where the acceptable levels may be
much higher.
The majority of relevant radionuclides can be detected by direct surface contamination
monitoring but some radionuclides of significance, such as 3H, 241Pu and 63Ni, all of which are low
energy beta emitters, are very difficult to detect directly. Tritium also has a very strong tendency to
become absorbed into surfaces, even of metals such as stainless steel, which makes surface monitoring
unreliable.
The subsequent sections discuss the instrumentation, physics of operation, practical limitations
and minimum detectable activities for different classes of radionuclides.
����� $OSKD�HPLWWHUV
The main characteristics of alpha emissions are their limited disintegration energy range,
typically 4 MeV to 8 MeV, the very high rate of energy loss, and the resultant extremely short range,
typically of the order of 5 mg cm-2 or 5 cm in air.
This means that practical detectors have to be held within 10 mm of the surface under
investigation. However, the very high rate of energy loss means that alpha particle detectors can be
produced with a background of less than 1 count per minute for monitoring areas of 100 cm2. The other
problem with the very short range is that even a very thin surface coating, such as 1 coat of gloss paint
or a smear of oil or grease can reduce the emissions from the surface effectively to zero. Hence, alpha
monitoring can only be used either where an apparently clean surface is available, such as the inside
of a glove box, or where the activity is, to a degree, uniformly mixed, such as in soil. It is not useful
for painted, dirty or porous surfaces, which will require cleaning before monitoring.
������� 6FLQWLOODWLRQ�FRXQWHUV�IRU� �PRQLWRULQJ
7KH�VFLQWLOODWLRQ�FRXQWHU�LV�D�SRSXODU�GHWHFWRU�IRU� �PRQLWRULQJ���7KH�scintillator is almost
always a thin layer of zinc sulphide activated with silver. Zinc sulphide is an efficient scintillator in
terms of light output per unit energy deposited, but it absorbs its own light. However, this is not a
problem given that the crystals only need to be a few tens of microns thick to absorb completely the
energy of the alpha particle. The zinc sulphide crystals are normally dispersed on a plastic sheet and
are protected by a light tight window normally of aluminised melinex of 1 to 2 mg cm-2 total thickness.
Some detectors use a direct coating of aluminium on the surface of the scintillator assembly, which is
difficult to manufacture but which is extremely robust in service.
The size of the scintillator normally ranges from circular ones with an area of 20 cm2 up to
rectangular ones with an area of 600 cm2. The scintillator is mounted in a probe which comprises a
case, the inside of which is painted white, into which protrudes a photomultiplier tube. This apparently
crude arrangement, which relies on the multiple reflection of the light generated by the scintillation
event, works well because of the very high light output per event. The maximum size is limited by a
loss of efficiency of light collection from the corners of the scintillator. However, the maximum area
found in service, 600 cm2, is probably the maximum size that makes operational sense, given typical
averaging areas.
The photomultiplier is connected to a high voltage supply normally between 600 volts and
1500 volts. The pulse that emerges from the anode of the photomultiplier tube is fed to a discriminator,
9
ZKLFK�UHDFWV�WR�WKH�ODUJH� �SXOVHV�DQG�LJQRUHV�WKH�VPDOOHU�RQHV�JHQHUDWHG�E\�[�� �SKRWRQV�DQG�EHWD
particles, and then either to a ratemeter or a counter timer.
Typical detection efficiencies for thin layer surface contamination are up to 40%, ie, 40% of
WKH� �SDUWLFOHV�ZKLFK�VWULNH�WKH�ZLQGRZ�DUH�FRXQWHG��JLYLQJ�W\SLFDO�UHVSRQVHV�RI����V-1 Bq-1 cm2 for the
100 cm2 counter and 100 s-1 Bq-1 cm2 for the 600 cm2 counter while background count rates in well
designed, constructed and maintained equipment can be as low as 1 count per minute per 100 cm2 (4,5).
�0LQLPXP�GHWHFWDEOH�DFWLYLWLHV�WKXV�WHQG�WR�EH�OLPLWHG�E\�VWDWLVWLFDO�XQFHUWDLQWLHV�LQ�WKH� �FRXQW�RYHU�D
particular period, rather than by the influence of background count rate.
The majority of detectors are planar. However, there would be no particular problem in
manufacturing counters which could have windows formed to a particular radius in order to allow the
efficient monitoring of pipes or process vessels.
One particular constraint is the necessity to have the scintillator no more than a few mm from
the surface in question. This can lead to problems in balancing the need to have the detector close
enough to a surface to monitor it effectively while avoiding contamination of the detector. For
decommissioning applications where large areas of flat surfaces or large areas of pipe work are to be
monitored then it might well be worth equipping the detector with an automatic scanning mechanism
which holds the detector at a fixed distance from, and which tracks it in a reproducible manner over,
the surface. For smaller areas then detectors equipped with wheels may offer advantages especially in
situations where there is a strong likelihood that contamination is negligible. Regular checking of the
wheels for accumulated activity is essential. For complicated areas the skill and interest of the operator
become paramount, and it becomes difficult to guarantee the quality of the programme.
Problems associated with scintillation counters are usually dominated by window damage,
especially when the objects to be monitored have complicated or spiky shapes. It is essential to choose
any protection to be fitted over the window with care. The grille should have openings which are
sufficiently small to prevent the objects being monitored reaching the aluminised plastic window,
sufficiently rigid to avoid being deformed onto the window and sufficiently strong to avoid tearing. The
grille should also be sufficiently transparent to allow the monitoring target level to be achieved reliably.
The most satisfactory design uses a thin metal foil which is etched into an open pattern. Woven wire
grilles can appear quite open but have very poor transparency when viewed at oblique angles and are
generally much less satisfactory. The grille should also be spaced two or three mm from the window
to avoid the grille being forced back onto the window by chance contact with a raised part of the object
being monitored.
Scintillation counters are also unsuitable for use in significant magnetic fields such as those
associated with motors, some tools and sometimes even structural steel beams. The magnetic field
deflects the electrons in their paths within the photomultiplier tube, reducing the gain and bringing the
� JHQHUDWHG� SXOVHV� EHORZ� WKH� FRXQWHU� WKUHVKROG�� � $V� D� UDWKHU� VXEMHFWLYH� JXLGH�� D� PHGLXP� VL]HG
screwdriver which is sufficiently magnetic to allow a chain of 4 steel paper clips to hang from its end
is sufficiently magnetised to cause problems.
Prolonged rough use can also lead to problems with the zinc sulphide crystals detaching
themselves from the scintillator plate. These crystals can then abrade the aluminising on the inside of
the plastic foil leading to spurious background counts or unreliable operation in strong light.
Scintillation counters may also not be fail safe when the window is punctured. The counter
FDQ�FHDVH�WR�UHVSRQG�WR� �DFWLYLW\�ZLWKRXW�VKRZLQJ�DQ�LQFUHDVH�LQ�EDFNJURXQG�FRXQW�UDWH���:HOO�GHVLJQHG
instruments should detect a significant light leak as the current from the photomultiplier tube will rise
above the normal operational level. This current can be used to trigger a fault warning which will alert
10
the system or operator. The window can then be replaced which, on a well designed detector, is a
simple operation taking only a few minutes.
2SHUDWLRQ�LQ�KLJK�GRVH�UDWHV�SURGXFHG�E\�ORZ�HQHUJ\� �HPLWWHUV�LV�DOVR�LQDGYLVDEOH���'RVH�UDWHV
of a few hundred 6Y�SHU�KRXU�FDQ�GHSUHVV�WKH�JDLQ�RI�WKH�photomultiplier without generating a high
background count rate4,5. This can be a problem when dealing with glove boxes which have been used
for 241$P���7KH�UHGXFWLRQ�LQ�JDLQ�FDXVHV�WKH� �SXOVHV�WR�IDOO�EHORZ�WKH�FRXQWLQJ�WKUHVKROG�
������� 3URSRUWLRQDO�FRXQWHUV�IRU� �PRQLWRULQJ
3URSRUWLRQDO�FRXQWHUV�DUH�SRSXODU�IRU� �VXUIDFH�FRQWDPLQDWLRQ�PRQLWRULQJ���7KH�GHWHFWRU�LV
extremely simple in construction. Typically they are in the form of a shallow box with one of the large
sides formed from a sheet of aluminised plastic, similar to that used for scintillation counter windows
but with a lower necessary degree of light tightness. The other five sides are generally aluminium.
Across the mid-plane of the detector parallel to the window is an array of thin parallel wires, normally
WXQJVWHQ�RU�VWDLQOHVV�VWHHO�DERXW���� P�LQ�GLDPHWHU���7KHVH�DQRGH�ZLUHV�DUH�PDLQWDLQHG�DW�D�SRWHQWLDO
of about +2 kV with respect to the counter walls and window. The counter is either used as a flow
counter, in which counting gas, normally P10 (90% argon, 10% methane) flows through the counter at
the rate of a few cm3 per minute, as a refillable counter, which is refilled at intervals of a few hours with
butane, or as an air counter, where dry air is used as a counting gas. This last is unusual in that air is
D�YHU\�SRRU�FRXQWLQJ�JDV���+RZHYHU��WKH�YHU\�KLJK�UDWH�RI�HQHUJ\�ORVV�RI�DQ� �SDUWLFOH�RI�JUHDWHU�WKDQ
1 MeV cm-1 generates a sufficiently high charge density to allow detection.
The form of construction allows very large counters, which can have high length to width
ratios. It is generally possible to obtain detectors which match the permissible averaging area and of
a length to width ratio which can be optimised for the objects to be monitored. The output from the
detector is similar to that from the scintillation detector in that it is proportional to the energy deposited
but not proportional to the energy of the incident particle. Typical detectors have depths of
DSSUR[LPDWHO\���FP��ZKLFK�JLYHV�HQHUJLHV�GHSRVLWHG�IRU� �SDUWLFOHV�FURVVLQJ�WKH�GHWHFWRU�DW�ULJKW�DQJOHV
WR�WKH�ZLQGRZ�RI�DERXW���0H9�DQG�IRU�HQHUJHWLF� �SDUWLFOHV�RI�DERXW�����keV. The counting threshold
FDQ�EH�VHW�WR�GLVWLQJXLVK�DJDLQVW� �UDGLDWLRQ�HYHQ�IRU� �SDUWLFOHV�WUDYHOOLQJ�YLUWXDOO\�LQ�WKH�SODQH�RI�WKH
DQRGH�ZLUHV���,Q�D�VLPLODU�ZD\�WR�WKH�VFLQWLOODWLRQ�GHWHFWRU�VRPH�RI�WKH� �SDUWLFOHV�ZLOO�SURGXFH�SXOVHV
EHORZ�WKH�PD[LPXP� �SXOVHV���7KHVH�DUH�SDUWLFOHV�ZKLFK�VWULNH�WKH�ZLQGRZ�DW�VKDOORZ�DQJOHV���7\SLFDO
window thickness is 1 to 2 mg cm-2, and hence particles incident at less than 20° to the window are
unlikely to penetrate the window with sufficient energy to be counted.
Again, similar to scintillation counters, detection efficiencies of 50% for particles striking the
window are possible giving sensitivities of 25 s-1 Bq-1 cm2 for a 100 cm2 counter4,5. Detection efficiency
tends to be much more uniform with a much less pronounced deterioration at edges and corners.
Background count rates are also low, again of the order of 1 per minute per 100 cm2 in a well
maintained instrument. Minimum detectable activities are again limited by statistical uncertainties in
WKH� �FRXQW�RYHU�D�SDUWLFXODU�SHULRG�
In a similar way to scintillation detectors there are no serious problems in producing detectors
with windows formed to a defined radius and which have a 360° view, barring the window supports and
structural stiffeners. Such detectors can be made in diameters down to 15 mm, which allow monitoring
of the inside of Zircalloy reactor fuel cladding tubes, for example.
The constraints on source to detector window spacing and grille transparency are common to
DOO� �GHWHFWRUV���+RZHYHU��IORZ�SURSRUWLRQDO�FRXQWHUV�DUH�VOLJKWO\�PRUH�UHVLVWDQW�WR�GDPDJH���7LQ\�KROHV
which can render scintillation counters unusable can be tolerated. Significant leaks can lead to a loss
11
of response for the volume of the detector down stream in the gas flow direction. The slight positive
pressure in the counter also makes their windows much less susceptible to damage when compared to
Geiger Muller tubes, which have a much higher negative pressure difference to sustain. Proportional
counters are also much less susceptible to magnetic fields because the velocity of the electrons is very
much lower. They can thus be used for monitoring articles with significant magnetic fields.
Window repair for the planar counters is very simple, usually involving removal of the window
frame, replacement of the aluminised plastic and replacement of the window frame. The plastic can
then be tightened by careful heating by a hot air blower. The anode wires are remarkably resilient given
that they are invisible in most lighting conditions. Damage to the anode wires can result in total failure
of the counter or a failure of a segment of the counter. Repair requires skill.
Other than obvious window damage the main problem tends to be chemical contamination of
the counting gas. Low flow rates or tiny leaks can lead to a rise in oxygen concentration which results
in a reduction in gain. The wrong feed piping can also cause problems. Flexible plastic piping can
leach significant levels of plasticiser into the gas, resulting in loss of gain, or requiring excessive gas
flow rates for satisfactory function.
For refillable types, best performance is obtained with continuous use and regular refilling.
If a counter is not refilled for a long period then the purging process can take many minutes until
oxygen is driven from the detector.
Air filled types also require desiccation, and, even with desiccation, may be unreliable in damp
climates.
������� *HLJHU�0XOOHU�FRXQWHUV
*HLJHU�0XOOHU� FRXQWHUV� DUH� QRW� QRUPDOO\� VXLWDEOH� IRU� �PRQLWRULQJ� DW� IUHH� UHOHDVH� OHYHOV
because of their limited window areas and their high background count rates, not because of a low
counting efficiency. The mass per unit area of a good quality mica windowed detector is similar to that
of scintillation and proportional counters and hence the counting efficiency is similar, up to 40%, giving
sensitivities of up to 4 s-1 Bq-1 cm2 for a 20 cm2 counter4,5. The limited window area is a consequence
of the low internal pressure and the subsequent stress on the window and the high background is a
consequence of the inability to distinguish between events depositing different energies.
������� 6HPLFRQGXFWRU�GHWHFWRUV
6HPLFRQGXFWRU�GHWHFWRUV� DUH� FRPPRQO\� IRXQG� LQ� � LQ� DLU�PRQLWRUV�ZKHUH� WKHLU� DELOLW\� WR
SHUIRUP� �VSHFWURPHWU\�LV�XVHIXO�LQ�GLVWLQJXLVKLQJ�SOXWRQLXP�IURP�UDGRQ�SURJHQ\��IRU�H[DPSOH���7KHVH
detectors have a thin entrance window, and areas up to 60 cm2. They have some use in surface
monitoring as it is possible to make a detector of very limited thickness. This can be compared with
the relative bulk of the photomultiplier used in the scintillation detector and the minimal depth of
VHYHUDO�PP� UHTXLUHG� WR�JLYH� HIIHFWLYH� � VHSDUDWLRQ� IURP� �� � HYHQWV� LQ� WKH� SURSRUWLRQDO� FRXQWHU��
Detection efficiency can be up to 30%, giving sensitivities of the order of 9 s-1 Bq-1 cm2.
This detector differs from the scintillation, proportional and Geiger Muller counters in that
there is no gain in the detector. The signal generated is purely that produced directly by the incident
radiation. It thus requires a relatively low noise preamplifier. After amplification it is easy to set a
threshold in a similar way to the scintillation and proportional counters to give a very clear
discrimination against beta and gamma radiation. The lack of gain means that careful precautions have
to be taken against electromagnetic interference, with very effective screening around detector and
preamplifier. This results in detectors generally being fitted with aluminimised plastic windows.
12
Modern examples are relatively robust and can be cleaned with care. Curved detectors can be produced
using an array of relatively small detectors which can be connected in parallel. Operating voltages are
less than 100 volts, which is a significant advantage over the other detectors, but their main advantage,
exploited to the full in the monitoring of environmental samples, for example, is their very low
background.
������� ,RQLVDWLRQ�FKDPEHU�GHWHFWRUV
A limitation of the previous 4 types of detectors described is the need to be very close to the
surface under investigation, which effectively restricts them to flat or smoothly curved surfaces. The
monitoring of complicated or inaccessible surfaces such as the inside of valves is not feasible.
However, it is possible to monitor such objects by detecting the ionisation generated in air blown
WKURXJK�RU�RYHU�WKH�REMHFW���7KLV�DOORZV�WKH�GHWHFWLRQ�RI� �DFWLYLW\�DW�UDQJHV�XS�WR�DW�OHDVW���PHWUHV6.
'LVFULPLQDWLRQ�DJDLQVW� �DQG� �UDGLDWLRQ�LV�JHQHUDOO\�JRRG��DOWKRXJK�QRW�XS�WR�WKH�OHYHO�RI�WKH�PRUH
conventional techniques. Again, this is a consequence of the very high rate of energy deposition of an
�SDUWLFOH�ZKLFK�FDQ�GHSRVLW�VHYHUDO�0H9�ZKHQ�HPLWWHG�LQVLGH�D����PP�GLDPHWHU�SLSH��ZKHUHDV�D�
particle will normally deposit approximately 30 keV.
Detection efficiency is such that it is possible to detect levels of 0.02 Bq cm-2� �LQ�D���PHWUH
OHQJWK�RI����PP�GLDPHWHU�SLSH��LQ�D� �EDFNJURXQG�RI����� 6Y�K-1.
The technique involves blowing air over or through the object to be monitored. The air is then
SDVVHG�WKURXJK�DQ�LRQLVDWLRQ�FKDPEHU�DQG�WKH�FKDUJH�FROOHFWHG���7KH�FXUUHQW�JHQHUDWHG�SHU� �SDUWLFOH
depends on the local air velocity but above a particular level the signal becomes only slightly dependent
on flow rate and, more importantly, only slowly dependent on distance of the source from the detector.
The limitations of the process is that debris must not be blown into the ion chamber. Debris will
inevitably carry an electric charge and will gradually build up on insulators producing high leakage
currents and thus increasing the minimum detectable activity. The technique is thus particularly suitable
for confirming that the insides of apparently clean process pipe work or unirradiated fuel cladding is
in fact uncontaminated.
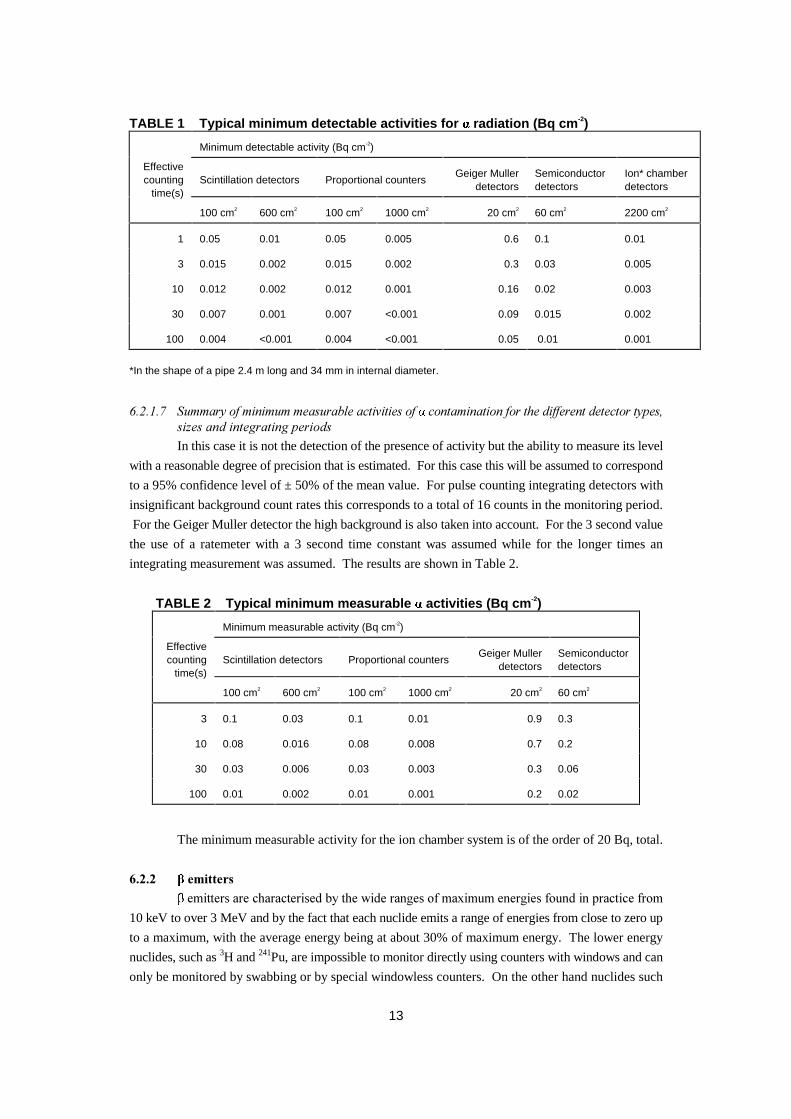
������� 6XPPDU\�RI�PLQLPXP�GHWHFWDEOH�DFWLYLWLHV�RI� �FRQWDPLQDWLRQ�IRU�WKH�GLIIHUHQW�GHWHFWRU�W\SHV�
VL]HV�DQG�LQWHJUDWLQJ�SHULRGV
The minimum detectable activity is defined here as the activity which will be identified on
50% of measurements as being in excess of the background count rate at the 95% confidence level, ie,
for a background sample, only 1 measurement in 40 will generate a false positive signal.
This is tabulated in Table 1 for the detector types described previously and for different
HIIHFWLYH�LQWHJUDWLRQ�WLPHV���0DQXDO� �FRQWDPLQDWLRQ�PRQLWRULQJ�LV�JHQHUDOO\�EDVHG�RQ�WKH�DXGLR�SXOVH
output from an instrument rather than on the indicated count rate. The one second and 3 second
columns are appropriate to this and correspond to rates of movement over a single active particle of the
order of 10 cm s-1 and 3 cm s-1 for a typical 100 cm2 detector and 30 cm s-1 and 10 cm s-1 for a 600 cm2
detector. For the scintillation, proportional and semiconductor detectors an average of 1 count per
second has been taken as significant for the one second survey time and 1 count in 3 seconds for the 3
second survey time. This is based on the observation that a skilled user will normally pause, and wait
a few seconds, at any point where a count has occurred. The longer times are appropriate either to
automatic methods or to fixed position integrating measurements where the area to be monitored is
covered by placing the detector at one spot, integrating and then moving the detector to the adjacent
area.
13
TABLE 1 Typical minimum detectable activities for radiation (Bq cm-2)
Minimum detectable activity (Bq cm-2)
Scintillation detectors Proportional countersGeiger Muller
detectorsSemiconductordetectors
Ion* chamberdetectors
Effectivecounting
time(s)
100 cm2 600 cm2 100 cm2 1000 cm2 20 cm2 60 cm2 2200 cm2
1 0.05 0.01 0.05 0.005 0.6 0.1 0.01
3 0.015 0.002 0.015 0.002 0.3 0.03 0.005
10 0.012 0.002 0.012 0.001 0.16 0.02 0.003
30 0.007 0.001 0.007 <0.001 0.09 0.015 0.002
100 0.004 <0.001 0.004 <0.001 0.05 0.01 0.001
*In the shape of a pipe 2.4 m long and 34 mm in internal diameter.
������� 6XPPDU\�RI�PLQLPXP�PHDVXUDEOH�DFWLYLWLHV�RI� �FRQWDPLQDWLRQ�IRU�WKH�GLIIHUHQW�GHWHFWRU�W\SHV�VL]HV�DQG�LQWHJUDWLQJ�SHULRGV
In this case it is not the detection of the presence of activity but the ability to measure its level
with a reasonable degree of precision that is estimated. For this case this will be assumed to correspond
to a 95% confidence level of ± 50% of the mean value. For pulse counting integrating detectors with
insignificant background count rates this corresponds to a total of 16 counts in the monitoring period.
For the Geiger Muller detector the high background is also taken into account. For the 3 second value
the use of a ratemeter with a 3 second time constant was assumed while for the longer times an
integrating measurement was assumed. The results are shown in Table 2.
TABLE 2 Typical minimum measurable activities (Bq cm-2)
Minimum measurable activity (Bq cm-2)
Scintillation detectors Proportional countersGeiger Muller
detectorsSemiconductordetectors
Effectivecounting
time(s)
100 cm2 600 cm2 100 cm2 1000 cm2 20 cm2 60 cm2
3 0.1 0.03 0.1 0.01 0.9 0.3
10 0.08 0.016 0.08 0.008 0.7 0.2
30 0.03 0.006 0.03 0.003 0.3 0.06
100 0.01 0.002 0.01 0.001 0.2 0.02
The minimum measurable activity for the ion chamber system is of the order of 20 Bq, total.
����� �HPLWWHUV
�HPLWWHUV�DUH�FKDUDFWHULVHG�E\�WKH�ZLGH�UDQJHV�RI�PD[LPXP�HQHUJLHV�IRXQG�LQ�SUDFWLFH�IURP
10 keV to over 3 MeV and by the fact that each nuclide emits a range of energies from close to zero up
to a maximum, with the average energy being at about 30% of maximum energy. The lower energy
nuclides, such as 3H and 241Pu, are impossible to monitor directly using counters with windows and can
only be monitored by swabbing or by special windowless counters. On the other hand nuclides such
14
as 90Y and 106Rh have ranges in air of several metres and penetrate 1 cm thick plastic sheets to a
significant degree. Hence, for some nuclides, beta monitoring is restricted to effectively clean surfaces
with the probe mounted within a few mm of the surface, whereas for other nuclides direct monitoring
is possible even for painted surfaces.
7KH�PDLQ�SUREOHP�RIWHQ�ZLWK�GLUHFW� �PRQLWRULQJ�LV�WKH�SUHVHQFH�RI�D� �EDFNJURXQG��VRPHWLPHV
from the material itself and sometimes from other active materials in the environment. Instruments have
EHHQ�GHVLJQHG�ZKLFK�UHMHFW��WR�D�GHJUHH�� �EDFNJURXQG��E\�FRPSDULQJ��IRU�H[DPSOH��WKH�FRXQW�UDWH�IURP
WZR�VXSHULPSRVHG�GHWHFWRUV�ERWK�RI�ZKLFK�VHH�YLUWXDOO\�WKH�VDPH� �ILHOG�EXW�RQO\�RQH�RI�ZKLFK�VHHV�WKH
�UDGLDWLRQV���7KHVH�DUH�XQFRPPRQ�LQ�VXUIDFH�FRQWDPLQDWLRQ�PRQLWRULQJ�DW�WKH�PRPHQW�DQG�ZLOO�QRW�EH
considered further.
������� 6FLQWLOODWLRQ�FRXQWHUV�IRU� �PRQLWRULQJ
6FLQWLOODWLRQ� FRXQWHUV� IRU� �PRQLWRULQJ� JHQHUDOO\� XVH� WKH� VDPH�EDVLF� IRUP� DV� WKRVH� IRU�
monitoring. Most comprise a flat thin piece of plastic which either contains the scintillant or which is
coated on one side by scintillating crystals. This is protected by a thin light tight window. On some
designs with relatively small areas the scintillator is coupled to the photomultiplier tube by a light guide
but in the majority of cases the scintillator plate is mounted in a probe which comprises a light tight case
the inside of which is painted white and into which protrudes the photomultiplier tube. A proportion
of the light from the scintillator will reach the photomultiplier directly but much will be reflected at least
once by the inside of the case. Again it is surprising how well this arrangement works in practice.
There is a large variety of scintillators which are encountered in practice. Detectors designed
WR�PRQLWRU�ORZ�HQHUJ\� �HPLWWHUV�VXFK�DV�35S and 14C generally use anthracene, which is very efficient.
This is in the form of small crystals. Scintillators normally have thickness of only a few mg per cm2
DV�WKLV�PLQLPLVHV�WKH�UHVSRQVH�WR�[�� �UDGLDWLRQ���,W�DOVR�KDV�WKH�LQWHUHVWLQJ�HIIHFW�RI�OHDGLQJ�WR�HQHUJ\
GHSRVLWLRQV�LQ�WKH�VFLQWLOODWRU� IRU�KLJK�HQHUJ\� �SDUWLFOHV�ZKLFK�DUH� OHVV� WKDQ� WKRVH�JHQHUDWHG�E\�
particles of energies of 100 keV. The window is again normally formed of aluminised plastic with
thicknesses in the range 1 mg cm-2 to 3 mg cm-2. Some detectors intended for high energy emitters use
aluminium sheet windows with thicknesses similar to cooking foil.
Areas range generally from 20 cm2 to 600 cm2, limited by a loss of efficiency of light
collection from the corners of the scintillator.
)RU� �GHWHFWRUV�WKH�FRXQWLQJ�WKUHVKROG�LV�VHW�FORVH�WR�WKH�SRLQW�DW�ZKLFK�WKHUPRHOHFWULF�QRLVH
from the photomultiplier sets in, which for anthracene scintillators corresponds to energy depositions
of approximately 20 keV. The signal is then fed to a ratemeter, normally with an audio output, for
manual use or to a scaler timer for automatic operation. The scintillator is normally flat but there are
some which are formed around a central light guide and, in principal, there is no reason why cylindrical
or curved detectors could not be built for pipe monitoring etc.
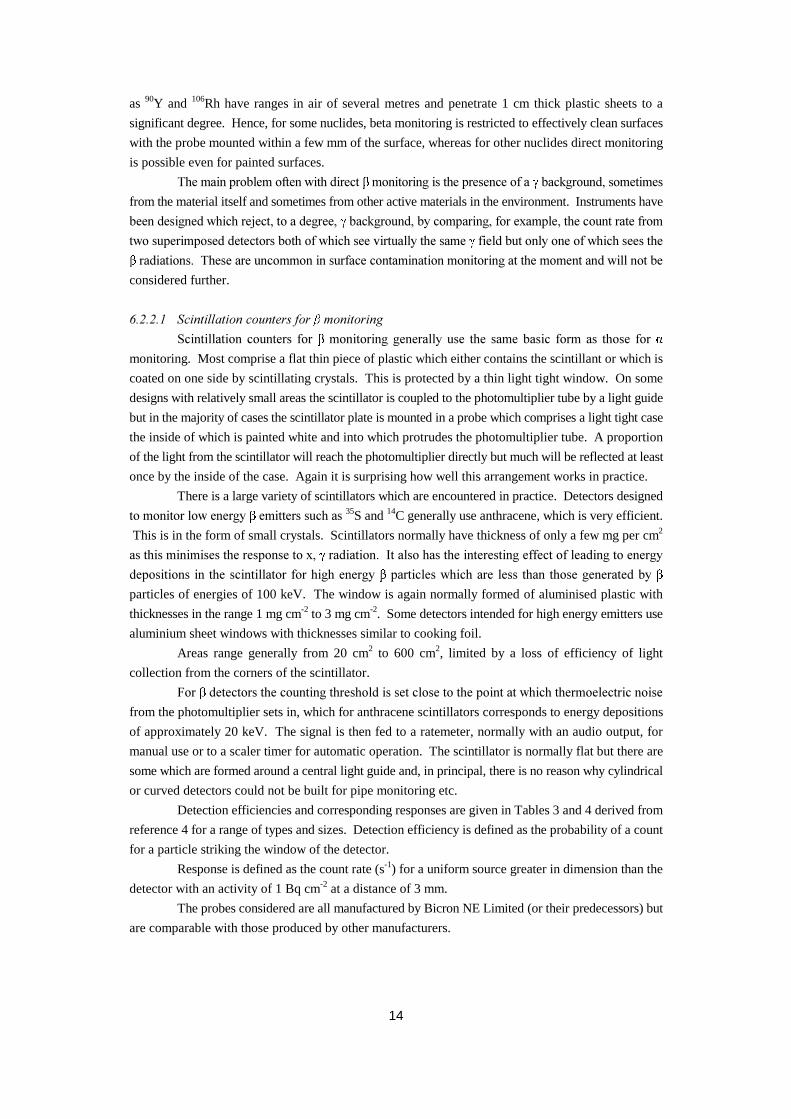
Detection efficiencies and corresponding responses are given in Tables 3 and 4 derived from
reference 4 for a range of types and sizes. Detection efficiency is defined as the probability of a count
for a particle striking the window of the detector.
Response is defined as the count rate (s-1) for a uniform source greater in dimension than the
detector with an activity of 1 Bq cm-2 at a distance of 3 mm.
The probes considered are all manufactured by Bicron NE Limited (or their predecessors) but
are comparable with those produced by other manufacturers.
15
TABLE 3 Typical detection efficiencies ( scintillation probes)
Detection efficiency (%)
TypeArea(cm2) High energy
(90Sr+90Y)Medium energy (36Cl)
Low energy (14C) (238Pu)
BP4 20 55 51 29 36
BP6/4A 100 46 44 17 32
*DP2 49 27 17 – 22
*DP3 100 34 26 – 34
*IDP6AD 100 44 42 – 37
BP17 600 38 33 No data 28
*Dual phosphor probes combining a zinc sulphide layer on a plastic scintillator sheet. Theresponses are obtained using the beta and alpha channels on a dual ratemeter.
16
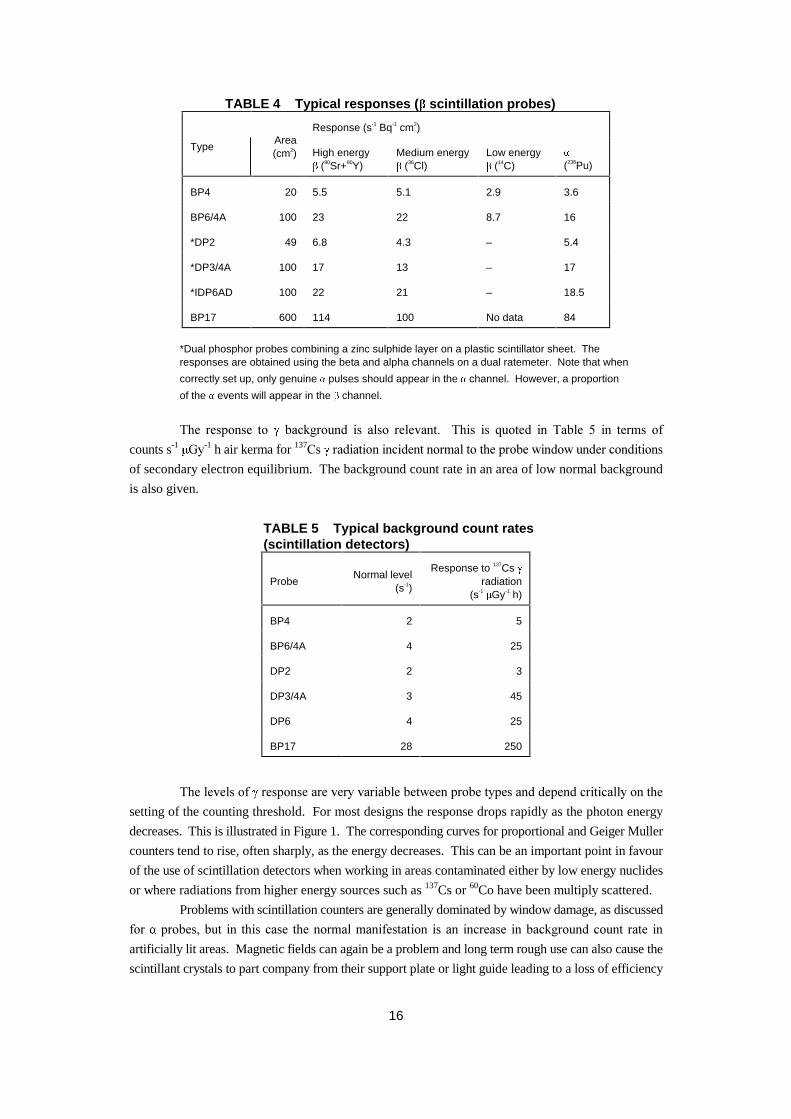
TABLE 4 Typical responses ( scintillation probes)
Response (s-1 Bq-1 cm2)
TypeArea(cm2) High energy
(90Sr+90Y)Medium energy (36Cl)
Low energy (14C) (238Pu)
BP4 20 5.5 5.1 2.9 3.6
BP6/4A 100 23 22 8.7 16
*DP2 49 6.8 4.3 – 5.4
*DP3/4A 100 17 13 – 17
*IDP6AD 100 22 21 – 18.5
BP17 600 114 100 No data 84
*Dual phosphor probes combining a zinc sulphide layer on a plastic scintillator sheet. Theresponses are obtained using the beta and alpha channels on a dual ratemeter. Note that when
correctly set up, only genuine pulses should appear in the channel. However, a proportion
of the events will appear in the channel.
7KH� UHVSRQVH� WR� � EDFNJURXQG� LV� DOVR� UHOHYDQW�� � 7KLV� LV� TXRWHG� LQ� 7DEOH� �� LQ� WHUPV� RI
counts s-1� *\-1 h air kerma for 137&V� �UDGLDWLRQ�LQFLGHQW�QRUPDO�WR�WKH�SUREH�ZLQGRZ�XQGHU�FRQGLWLRQV
of secondary electron equilibrium. The background count rate in an area of low normal background
is also given.
TABLE 5 Typical background count rates(scintillation detectors)
ProbeNormal level
(s-1)
Response to 137Cs radiation
(s-1 Gy-1 h)
BP4 2 5
BP6/4A 4 25
DP2 2 3
DP3/4A 3 45
DP6 4 25
BP17 28 250
7KH�OHYHOV�RI� �UHVSRQVH�DUH�YHU\�YDULDEOH�EHWZHHQ�SUREH�W\SHV�DQG�GHSHQG�FULWLFDOO\�RQ�WKH
setting of the counting threshold. For most designs the response drops rapidly as the photon energy
decreases. This is illustrated in Figure 1. The corresponding curves for proportional and Geiger Muller
counters tend to rise, often sharply, as the energy decreases. This can be an important point in favour
of the use of scintillation detectors when working in areas contaminated either by low energy nuclides
or where radiations from higher energy sources such as 137Cs or 60Co have been multiply scattered.
Problems with scintillation counters are generally dominated by window damage, as discussed
IRU� �SUREHV��EXW� LQ� WKLV�FDVH� WKH�QRUPDO�PDQLIHVWDWLRQ� LV�DQ� LQFUHDVH� LQ�EDFNJURXQG�FRXQW� UDWH� LQ
artificially lit areas. Magnetic fields can again be a problem and long term rough use can also cause the
scintillant crystals to part company from their support plate or light guide leading to a loss of efficiency
17
and abrasion of the metal coating on the window. The detectors are also extremely variable with a
range of operating voltages within any type of a factor of 2.
������� 3URSRUWLRQDO�FRXQWHUV�IRU� �PRQLWRULQJ
3URSRUWLRQDO�FRXQWHUV�DUH�SRSXODU�IRU� �PRQLWRULQJ���7KH�JHQHUDO�GHVLJQ�LV�WKH�VDPH�DV�WKDW�IRU
�PRQLWRULQJ��ZLWK�D�UHODWLYHO\�WKLQ�ZLQGRZ�DQG�DQ�DUUD\�RI�DQRGH�ZLUHV���7KHUH�DUH��KRZHYHU��WZR�IRUPV
which differ in window material and gas fill. One form is the sealed type, which generally use xenon
as a counting gas, and has a titanium window about 5 mg cm-2�WKLFN���7KHVH�KDYH�D�ORZ� �VHQVLWLYLW\�EXW
a relatively high sensitivity to low energy photons, caused by the high Z, high density gas fill. The other
IRUP�LV�EDVLFDOO\�LGHQWLFDO�WR�WKH� �GHWHFWRU��DQG�LV�JHQHUDOO\�IRXQG�LQ�GXDO� � �PRQLWRULQJ�LQVWUXPHQWV
ie, it has a thin plastic window and is either a flow counter or is refilled with counting gas, normally P10
(90% argon, 10% methane) or butane. Air does not work for beta detection. This second variety can
be produced with windows formed to a radius and which have a 360° view, barring structural stiffeners.
Areas range from hand held units, usually with 100 cm2 to 200 cm2 windows, up to units of 1000 cm2
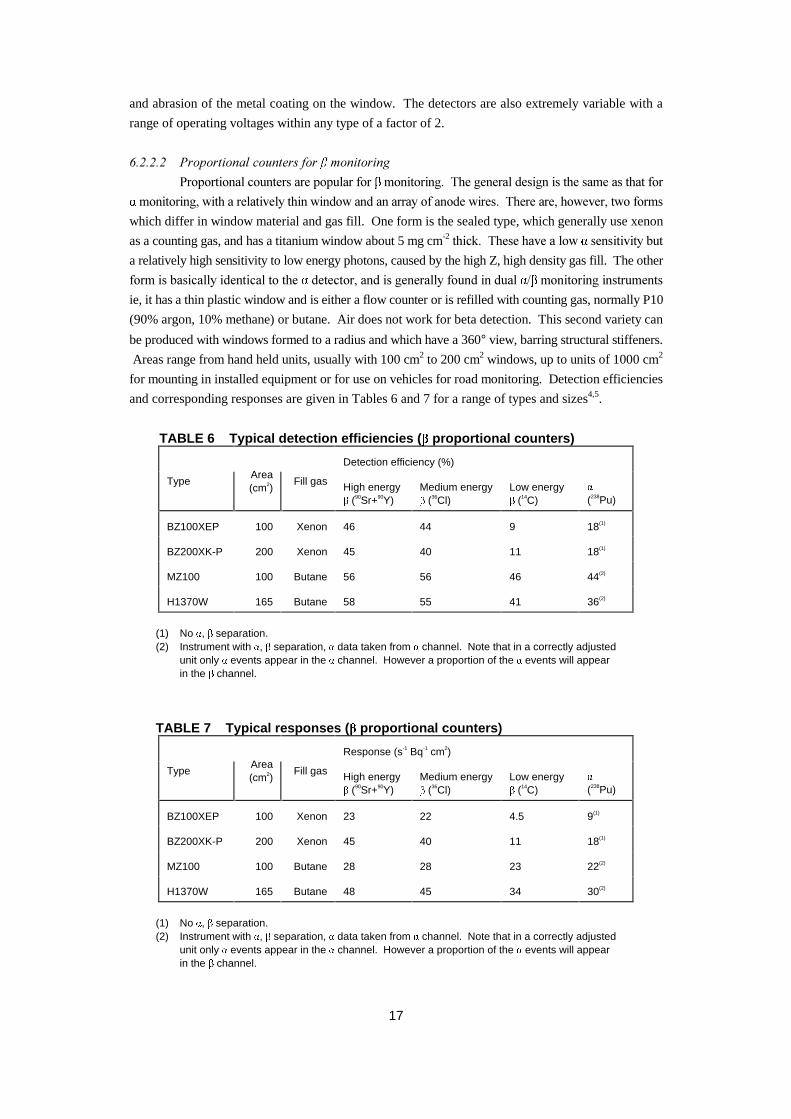
for mounting in installed equipment or for use on vehicles for road monitoring. Detection efficiencies
and corresponding responses are given in Tables 6 and 7 for a range of types and sizes4,5.
TABLE 6 Typical detection efficiencies ( proportional counters)
Detection efficiency (%)
TypeArea(cm2)
Fill gas High energy (90Sr+90Y)
Medium energy (36Cl)
Low energy (14C) (238Pu)
BZ100XEP 100 Xenon 46 44 9 18(1)
BZ200XK-P 200 Xenon 45 40 11 18(1)
MZ100 100 Butane 56 56 46 44(2)
H1370W 165 Butane 58 55 41 36(2)
(1) No , separation.(2) Instrument with , separation, data taken from channel. Note that in a correctly adjusted
unit only events appear in the channel. However a proportion of the events will appearin the channel.
TABLE 7 Typical responses ( proportional counters)
Response (s-1 Bq-1 cm2)
TypeArea(cm2)
Fill gas High energy (90Sr+90Y)
Medium energy (36Cl)
Low energy (14C) (238Pu)
BZ100XEP 100 Xenon 23 22 4.5 9(1)
BZ200XK-P 200 Xenon 45 40 11 18(1)
MZ100 100 Butane 28 28 23 22(2)
H1370W 165 Butane 48 45 34 30(2)
(1) No , separation.(2) Instrument with , separation, data taken from channel. Note that in a correctly adjusted
unit only events appear in the channel. However a proportion of the events will appearin the channel.
18
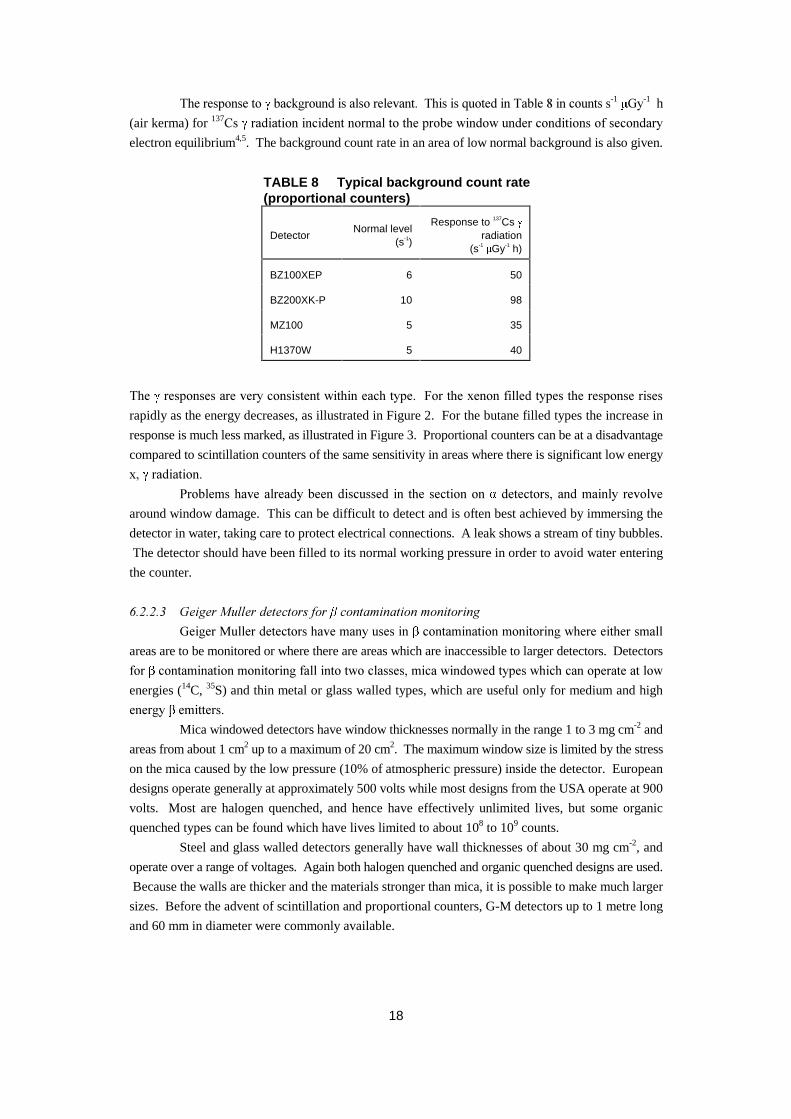
7KH�UHVSRQVH�WR� �EDFNJURXQG�LV�DOVR�UHOHYDQW���7KLV�LV�TXRWHG�LQ�7DEOH���LQ�FRXQWV�V-1� *\-1 h
(air kerma) for 137&V� �UDGLDWLRQ�LQFLGHQW�QRUPDO�WR�WKH�SUREH�ZLQGRZ�XQGHU�FRQGLWLRQV�RI�VHFRQGDU\
electron equilibrium4,5. The background count rate in an area of low normal background is also given.
TABLE 8 Typical background count rate(proportional counters)
DetectorNormal level
(s-1)
Response to 137Cs radiation
(s-1 Gy-1 h)
BZ100XEP 6 50
BZ200XK-P 10 98
MZ100 5 35
H1370W 5 40
7KH� �UHVSRQVHV�DUH�YHU\�FRQVLVWHQW�ZLWKLQ�HDFK�W\SH���)RU�WKH�[HQRQ�ILOOHG�W\SHV�WKH�UHVSRQVH�ULVHV
rapidly as the energy decreases, as illustrated in Figure 2. For the butane filled types the increase in
response is much less marked, as illustrated in Figure 3. Proportional counters can be at a disadvantage
compared to scintillation counters of the same sensitivity in areas where there is significant low energy
[�� �UDGLDWLRQ�
3UREOHPV�KDYH�DOUHDG\�EHHQ�GLVFXVVHG� LQ� WKH�VHFWLRQ�RQ� �GHWHFWRUV�� DQG�PDLQO\� UHYROYH
around window damage. This can be difficult to detect and is often best achieved by immersing the
detector in water, taking care to protect electrical connections. A leak shows a stream of tiny bubbles.
The detector should have been filled to its normal working pressure in order to avoid water entering
the counter.
������� *HLJHU�0XOOHU�GHWHFWRUV�IRU� �FRQWDPLQDWLRQ�PRQLWRULQJ
*HLJHU�0XOOHU�GHWHFWRUV�KDYH�PDQ\�XVHV�LQ� �FRQWDPLQDWLRQ�PRQLWRULQJ�ZKHUH�HLWKHU�VPDOO
areas are to be monitored or where there are areas which are inaccessible to larger detectors. Detectors
IRU� �FRQWDPLQDWLRQ�PRQLWRULQJ�IDOO�LQWR�WZR�FODVVHV��PLFD�ZLQGRZHG�W\SHV�ZKLFK�FDQ�RSHUDWH�DW�ORZ
energies (14C, 35S) and thin metal or glass walled types, which are useful only for medium and high
HQHUJ\� �HPLWWHUV�
Mica windowed detectors have window thicknesses normally in the range 1 to 3 mg cm-2 and
areas from about 1 cm2 up to a maximum of 20 cm2. The maximum window size is limited by the stress
on the mica caused by the low pressure (10% of atmospheric pressure) inside the detector. European
designs operate generally at approximately 500 volts while most designs from the USA operate at 900
volts. Most are halogen quenched, and hence have effectively unlimited lives, but some organic
quenched types can be found which have lives limited to about 108 to 109 counts.
Steel and glass walled detectors generally have wall thicknesses of about 30 mg cm-2, and
operate over a range of voltages. Again both halogen quenched and organic quenched designs are used.
Because the walls are thicker and the materials stronger than mica, it is possible to make much larger
sizes. Before the advent of scintillation and proportional counters, G-M detectors up to 1 metre long
and 60 mm in diameter were commonly available.
19
Unlike scintillation and proportional counters the pulse size is independent of the radiation
FDXVLQJ�LW���1R�HQHUJ\�VHOHFWLRQ�RU� � �GLVFULPLQDWLRQ�LV�SRVVLEOH�HOHFWURQLFDOO\���+RZHYHU�WKH�UHODWLYHO\
simple electronics required to power the detector and detect the subsequent pulses are especially useful
to designers of hand held equipment.
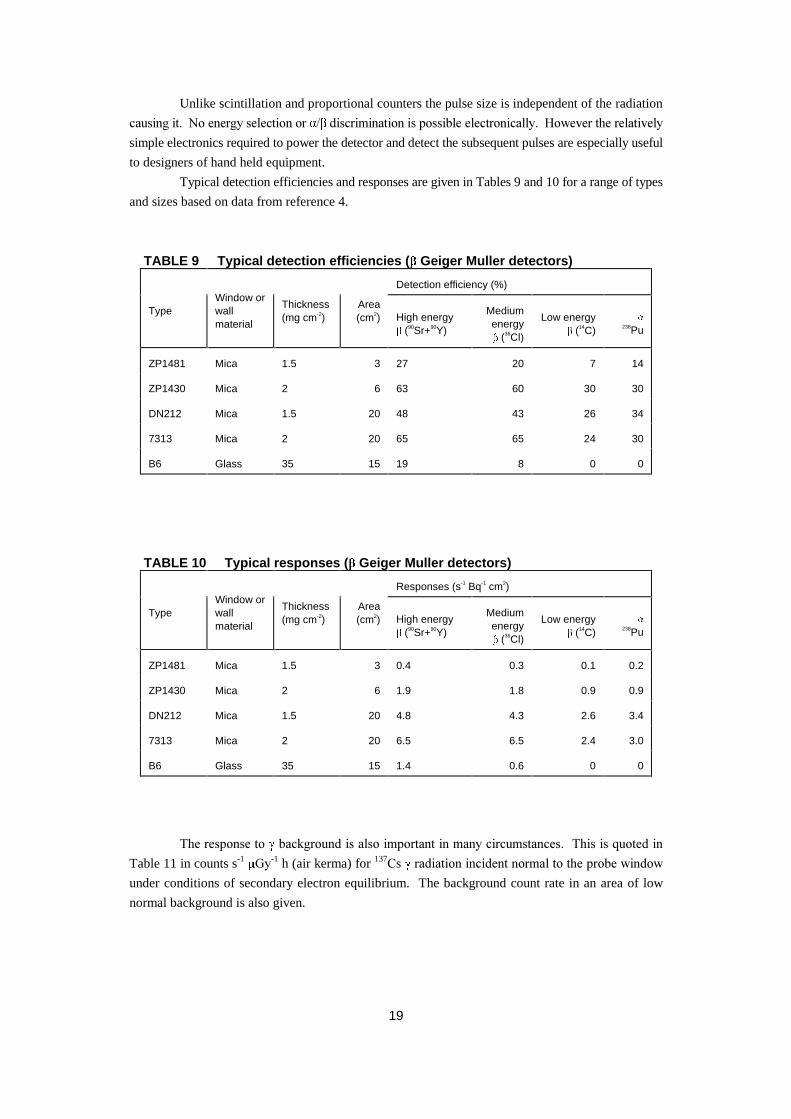
Typical detection efficiencies and responses are given in Tables 9 and 10 for a range of types
and sizes based on data from reference 4.
TABLE 9 Typical detection efficiencies ( Geiger Muller detectors)
Detection efficiency (%)
TypeWindow orwallmaterial
Thickness(mg cm-2)
Area(cm2) High energy
(90Sr+90Y)
Mediumenergy
(36Cl)
Low energy (14C) 238Pu
ZP1481 Mica 1.5 3 27 20 7 14
ZP1430 Mica 2 6 63 60 30 30
DN212 Mica 1.5 20 48 43 26 34
7313 Mica 2 20 65 65 24 30
B6 Glass 35 15 19 8 0 0
TABLE 10 Typical responses ( Geiger Muller detectors)
Responses (s-1 Bq-1 cm2)
TypeWindow orwallmaterial
Thickness(mg cm-2)
Area(cm2) High energy
(90Sr+90Y)
Mediumenergy
(36Cl)
Low energy (14C) 238Pu
ZP1481 Mica 1.5 3 0.4 0.3 0.1 0.2
ZP1430 Mica 2 6 1.9 1.8 0.9 0.9
DN212 Mica 1.5 20 4.8 4.3 2.6 3.4
7313 Mica 2 20 6.5 6.5 2.4 3.0
B6 Glass 35 15 1.4 0.6 0 0
7KH�UHVSRQVH�WR� �EDFNJURXQG�LV�DOVR�LPSRUWDQW�LQ�PDQ\�FLUFXPVWDQFHV���7KLV�LV�TXRWHG�LQ
Table 11 in counts s-1� *\-1 h (air kerma) for 137&V� �UDGLDWLRQ�LQFLGHQW�QRUPDO�WR�WKH�SUREH�ZLQGRZ
under conditions of secondary electron equilibrium. The background count rate in an area of low
normal background is also given.
20
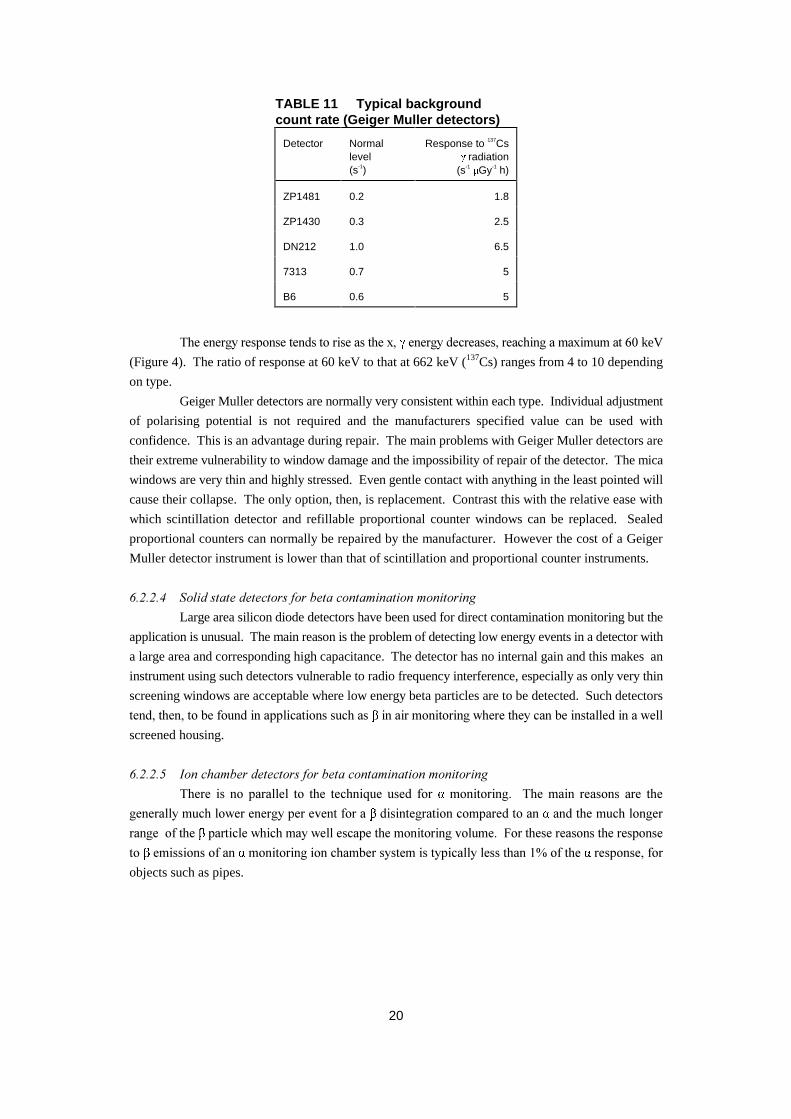
TABLE 11 Typical backgroundcount rate (Geiger Muller detectors)
Detector Normallevel(s-1)
Response to 137Cs radiation
(s-1 Gy-1 h)
ZP1481 0.2 1.8
ZP1430 0.3 2.5
DN212 1.0 6.5
7313 0.7 5
B6 0.6 5
7KH�HQHUJ\�UHVSRQVH�WHQGV�WR�ULVH�DV�WKH�[�� �HQHUJ\�GHFUHDVHV��UHDFKLQJ�D�PD[LPXP�DW��� keV
(Figure 4). The ratio of response at 60 keV to that at 662 keV (137Cs) ranges from 4 to 10 depending
on type.
Geiger Muller detectors are normally very consistent within each type. Individual adjustment
of polarising potential is not required and the manufacturers specified value can be used with
confidence. This is an advantage during repair. The main problems with Geiger Muller detectors are
their extreme vulnerability to window damage and the impossibility of repair of the detector. The mica
windows are very thin and highly stressed. Even gentle contact with anything in the least pointed will
cause their collapse. The only option, then, is replacement. Contrast this with the relative ease with
which scintillation detector and refillable proportional counter windows can be replaced. Sealed
proportional counters can normally be repaired by the manufacturer. However the cost of a Geiger
Muller detector instrument is lower than that of scintillation and proportional counter instruments.
������� 6ROLG�VWDWH�GHWHFWRUV�IRU�EHWD�FRQWDPLQDWLRQ�PRQLWRULQJ
Large area silicon diode detectors have been used for direct contamination monitoring but the
application is unusual. The main reason is the problem of detecting low energy events in a detector with
a large area and corresponding high capacitance. The detector has no internal gain and this makes an
instrument using such detectors vulnerable to radio frequency interference, especially as only very thin
screening windows are acceptable where low energy beta particles are to be detected. Such detectors
WHQG��WKHQ��WR�EH�IRXQG�LQ�DSSOLFDWLRQV�VXFK�DV� �LQ�DLU�PRQLWRULQJ�ZKHUH�WKH\�FDQ�EH�LQVWDOOHG�LQ�D�ZHOO
screened housing.
������� ,RQ�FKDPEHU�GHWHFWRUV�IRU�EHWD�FRQWDPLQDWLRQ�PRQLWRULQJ
7KHUH� LV� QR� SDUDOOHO� WR� WKH� WHFKQLTXH� XVHG� IRU� �PRQLWRULQJ�� � 7KH�PDLQ� UHDVRQV� DUH� WKH
JHQHUDOO\�PXFK�ORZHU�HQHUJ\�SHU�HYHQW�IRU�D� �GLVLQWHJUDWLRQ�FRPSDUHG�WR�DQ� �DQG�WKH�PXFK�ORQJHU
UDQJH��RI�WKH� �SDUWLFOH�ZKLFK�PD\�ZHOO�HVFDSH�WKH�PRQLWRULQJ�YROXPH���)RU�WKHVH�UHDVRQV�WKH�UHVSRQVH
WR� �HPLVVLRQV�RI�DQ� �PRQLWRULQJ�LRQ�FKDPEHU�V\VWHP�LV�W\SLFDOO\�OHVV�WKDQ����RI�WKH� �UHVSRQVH��IRU
objects such as pipes.
21
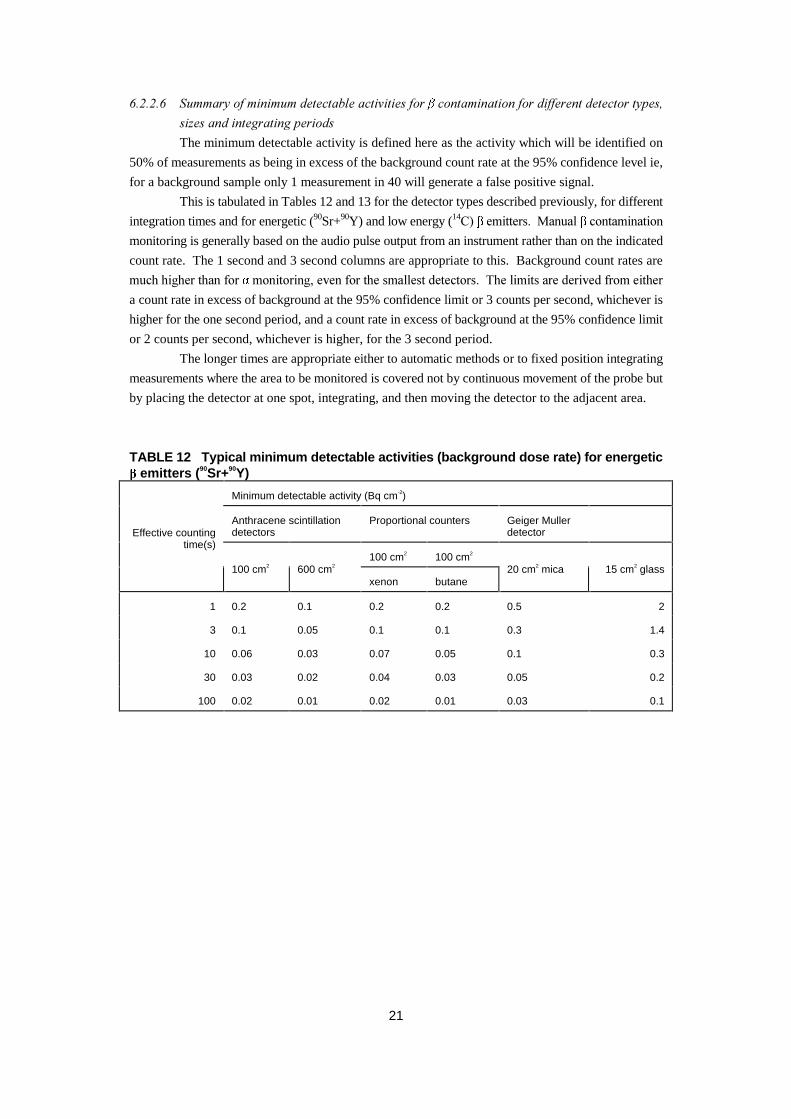
������� 6XPPDU\�RI�PLQLPXP�GHWHFWDEOH�DFWLYLWLHV�IRU� �FRQWDPLQDWLRQ�IRU�GLIIHUHQW�GHWHFWRU�W\SHV�
VL]HV�DQG�LQWHJUDWLQJ�SHULRGV
The minimum detectable activity is defined here as the activity which will be identified on
50% of measurements as being in excess of the background count rate at the 95% confidence level ie,
for a background sample only 1 measurement in 40 will generate a false positive signal.
This is tabulated in Tables 12 and 13 for the detector types described previously, for different
integration times and for energetic (90Sr+90Y) and low energy (14&�� �HPLWWHUV���0DQXDO� �FRQWDPLQDWLRQ
monitoring is generally based on the audio pulse output from an instrument rather than on the indicated
count rate. The 1 second and 3 second columns are appropriate to this. Background count rates are
PXFK�KLJKHU�WKDQ�IRU� �PRQLWRULQJ��HYHQ�IRU�WKH�VPDOOHVW�GHWHFWRUV���7KH�OLPLWV�DUH�GHULYHG�IURP�HLWKHU
a count rate in excess of background at the 95% confidence limit or 3 counts per second, whichever is
higher for the one second period, and a count rate in excess of background at the 95% confidence limit
or 2 counts per second, whichever is higher, for the 3 second period.
The longer times are appropriate either to automatic methods or to fixed position integrating
measurements where the area to be monitored is covered not by continuous movement of the probe but
by placing the detector at one spot, integrating, and then moving the detector to the adjacent area.
TABLE 12 Typical minimum detectable activities (background dose rate) for energetic emitters (90Sr+90Y)
Minimum detectable activity (Bq cm-2)
Anthracene scintillationdetectors
Proportional counters Geiger Mullerdetector
100 cm2 100 cm2
Effective countingtime(s)
100 cm2 600 cm2
xenon butane20 cm2 mica 15 cm2 glass
1 0.2 0.1 0.2 0.2 0.5 2
3 0.1 0.05 0.1 0.1 0.3 1.4
10 0.06 0.03 0.07 0.05 0.1 0.3
30 0.03 0.02 0.04 0.03 0.05 0.2
100 0.02 0.01 0.02 0.01 0.03 0.1
22
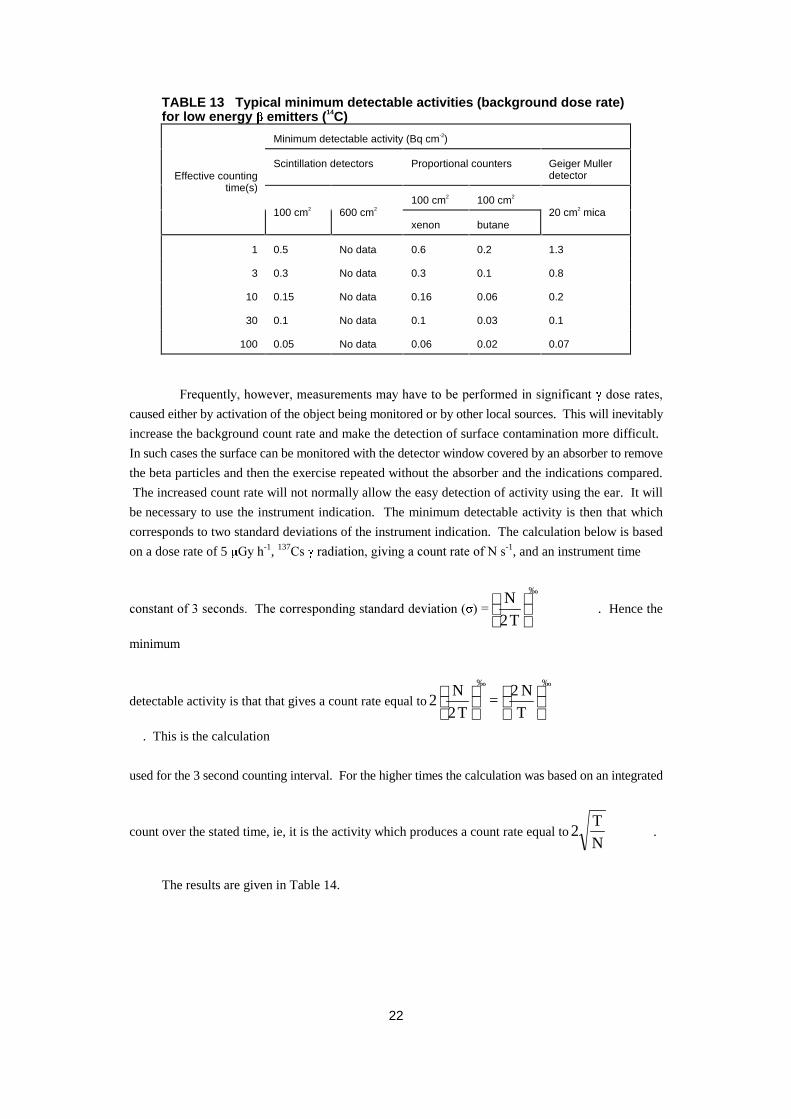
TABLE 13 Typical minimum detectable activities (background dose rate)for low energy emitters (14C)
Minimum detectable activity (Bq cm-2)
Scintillation detectors Proportional counters Geiger Mullerdetector
100 cm2 100 cm2
Effective countingtime(s)
100 cm2 600 cm2
xenon butane20 cm2 mica
1 0.5 No data 0.6 0.2 1.3
3 0.3 No data 0.3 0.1 0.8
10 0.15 No data 0.16 0.06 0.2
30 0.1 No data 0.1 0.03 0.1
100 0.05 No data 0.06 0.02 0.07
)UHTXHQWO\��KRZHYHU��PHDVXUHPHQWV�PD\�KDYH�WR�EH�SHUIRUPHG�LQ�VLJQLILFDQW� �GRVH�UDWHV�
caused either by activation of the object being monitored or by other local sources. This will inevitably
increase the background count rate and make the detection of surface contamination more difficult.
In such cases the surface can be monitored with the detector window covered by an absorber to remove
the beta particles and then the exercise repeated without the absorber and the indications compared.
The increased count rate will not normally allow the easy detection of activity using the ear. It will
be necessary to use the instrument indication. The minimum detectable activity is then that which
corresponds to two standard deviations of the instrument indication. The calculation below is based
on a dose rate of 5 *\�K-1, 137&V� �UDGLDWLRQ��JLYLQJ�D�FRXQW�UDWH�RI�1�V-1, and an instrument time
FRQVWDQW�RI���VHFRQGV���7KH�FRUUHVSRQGLQJ�VWDQGDUG�GHYLDWLRQ�� ��
T2
N‰
. Hence the
minimum
detectable activity is that that gives a count rate equal to
T
N2 =
T2
N2
‰‰
. This is the calculation
used for the 3 second counting interval. For the higher times the calculation was based on an integrated
count over the stated time, ie, it is the activity which produces a count rate equal toN
T2 .
The results are given in Table 14.
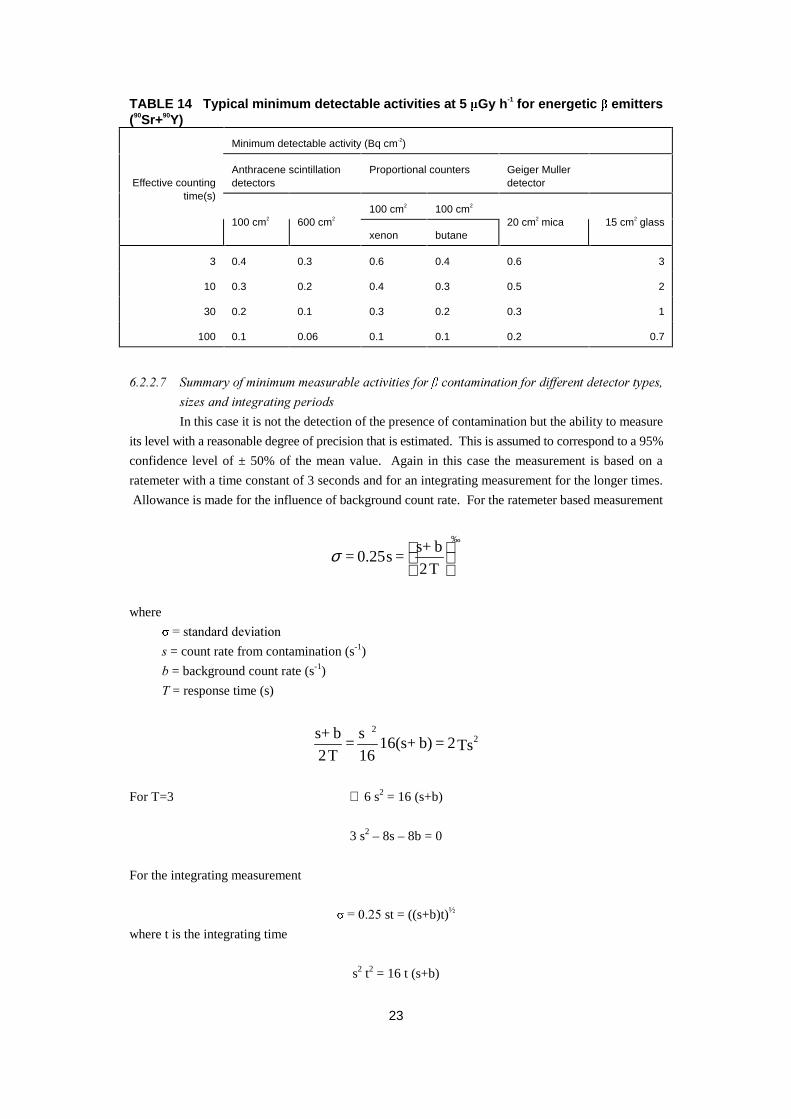
23
TABLE 14 Typical minimum detectable activities at 5 Gy h-1 for energetic emitters(90Sr+90Y)
Minimum detectable activity (Bq cm-2)
Anthracene scintillationdetectors
Proportional counters Geiger Mullerdetector
100 cm2 100 cm2
Effective countingtime(s)
100 cm2 600 cm2
xenon butane20 cm2 mica 15 cm2 glass
3 0.4 0.3 0.6 0.4 0.6 3
10 0.3 0.2 0.4 0.3 0.5 2
30 0.2 0.1 0.3 0.2 0.3 1
100 0.1 0.06 0.1 0.1 0.2 0.7
������� 6XPPDU\�RI�PLQLPXP�PHDVXUDEOH�DFWLYLWLHV�IRU� �FRQWDPLQDWLRQ�IRU�GLIIHUHQW�GHWHFWRU�W\SHV�
VL]HV�DQG�LQWHJUDWLQJ�SHULRGV
In this case it is not the detection of the presence of contamination but the ability to measure
its level with a reasonable degree of precision that is estimated. This is assumed to correspond to a 95%
confidence level of ± 50% of the mean value. Again in this case the measurement is based on a
ratemeter with a time constant of 3 seconds and for an integrating measurement for the longer times.
Allowance is made for the influence of background count rate. For the ratemeter based measurement
T2
bs+ = s0.25 =
‰
σ
where
� �VWDQGDUG�GHYLDWLRQ
V = count rate from contamination (s-1)
E = background count rate (s-1)
7 = response time (s)
Ts2 = b)16(s+ 16
s =
T2
bs+ 22
For T=3 ∴ 6 s2 = 16 (s+b)
3 s2 – 8s – 8b = 0
For the integrating measurement
� ������st = ((s+b)t)½
where t is the integrating time
s2 t2 = 16 t (s+b)
24
s
b)(s+ 16 = t
2
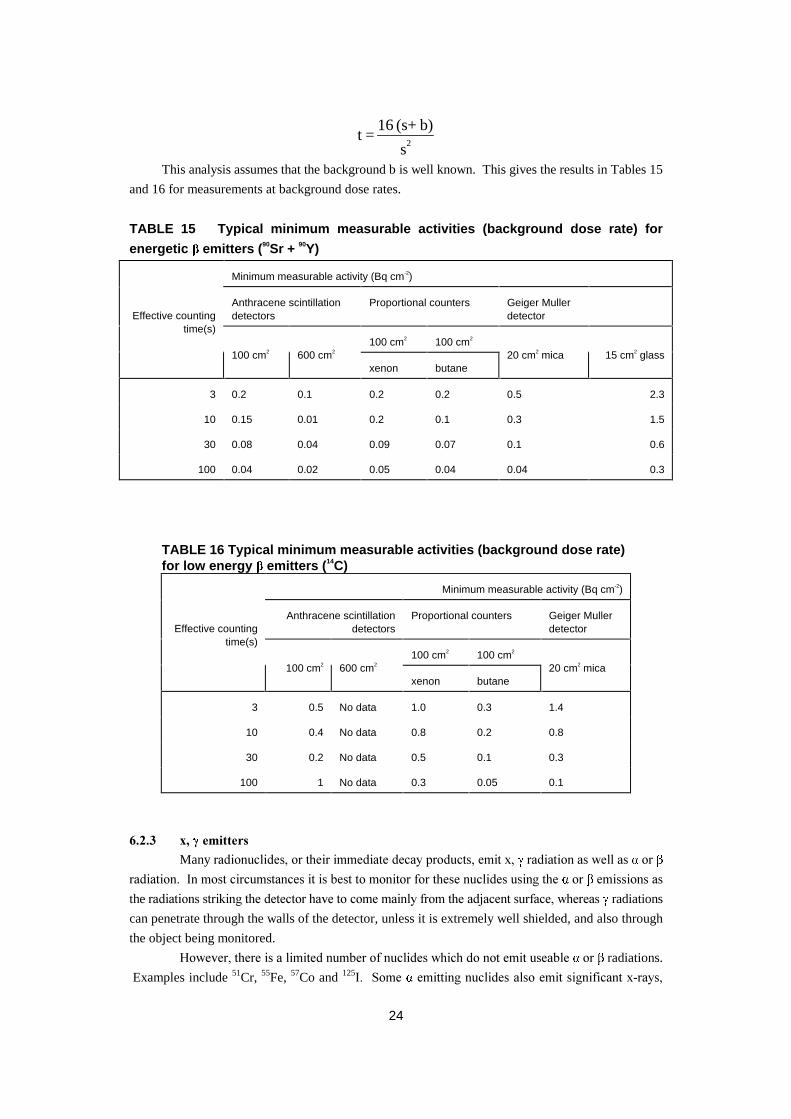
This analysis assumes that the background b is well known. This gives the results in Tables 15
and 16 for measurements at background dose rates.
TABLE 15 Typical minimum measurable activities (background dose rate) for
energetic emitters (90Sr + 90Y)
Minimum measurable activity (Bq cm-2)
Anthracene scintillationdetectors
Proportional counters Geiger Mullerdetector
100 cm2 100 cm2
Effective countingtime(s)
100 cm2 600 cm2
xenon butane20 cm2 mica 15 cm2 glass
3 0.2 0.1 0.2 0.2 0.5 2.3
10 0.15 0.01 0.2 0.1 0.3 1.5
30 0.08 0.04 0.09 0.07 0.1 0.6
100 0.04 0.02 0.05 0.04 0.04 0.3
TABLE 16 Typical minimum measurable activities (background dose rate)for low energy emitters (14C)
Minimum measurable activity (Bq cm-2)
Anthracene scintillationdetectors
Proportional counters Geiger Mullerdetector
100 cm2 100 cm2
Effective countingtime(s)
100 cm2 600 cm2
xenon butane20 cm2 mica
3 0.5 No data 1.0 0.3 1.4
10 0.4 No data 0.8 0.2 0.8
30 0.2 No data 0.5 0.1 0.3
100 1 No data 0.3 0.05 0.1
����� [�� �HPLWWHUV
Many UDGLRQXFOLGHV��RU�WKHLU�LPPHGLDWH�GHFD\�SURGXFWV��HPLW�[�� �UDGLDWLRQ�DV�ZHOO�DV� �RU�
UDGLDWLRQ���,Q�PRVW�FLUFXPVWDQFHV�LW�LV�EHVW�WR�PRQLWRU�IRU�WKHVH�QXFOLGHV�XVLQJ�WKH� �RU� �HPLVVLRQV�DV
the UDGLDWLRQV�VWULNLQJ�WKH�GHWHFWRU�KDYH�WR�FRPH�PDLQO\�IURP�WKH�DGMDFHQW�VXUIDFH��ZKHUHDV� �radiations
can penetrate through the walls of the detector, unless it is extremely well shielded, and also through
the object being monitored.
+RZHYHU��WKHUH�LV�D�OLPLWHG�QXPEHU�RI�QXFOLGHV�ZKLFK�GR�QRW�HPLW�XVHDEOH� �RU� �radiations.
Examples include 51Cr, 55Fe, 57Co and 125,���6RPH� �HPLWWLQJ�QXFOLGHV�DOVR�HPLW�VLJQLILFDQW�[�UD\V�
25
typically L x-rays in the 13 to 20 keV region. Monitoring of these x-rays can provide useful information
RQ�WKH�OHYHOV�RI� �DFWLYLW\�XQGHU�SDLQW��IRU�H[DPSOH���*HQHUDOO\�WKH�PLQLPXP�GHWHFWDEOH�DFWLYLW\�ZLOO�EH
PXFK�LQ�H[FHVV�RI�WKDW�ZKLFK�FDQ�EH�DFKLHYHG�XVLQJ�WKH� �RU� �radiations if they were useable but it may
be adequate for the end point required.
7ZR�W\SHV�RI�LQVWUXPHQW�DUH�JHQHUDOO\�XVHG�IRU�PRQLWRULQJ�ORZ�HQHUJ\�[�� �radiations. They
are the thin sodium iodide scintillation detector, fitted with a beryllium window, and the xenon filled
proportional counter, which is generally fitted with a 5 mg cm-2 titanium window. Both types of
HTXLSPHQW�DUH�LQKHUHQWO\�FDSDEOH�RI�PHDVXULQJ�[�� �UDGLDWLRQ�GRZQ�WR���keV and both are available with
suitable areas for surface contamination monitoring.
Three examples will be discussed here, as illustrations. Two are sodium iodide scintillation
detectors, and one is a xenon filled proportional counter. Both are suitable for connection to gated
counting equipment or multichannel analysers, which helps to reduce the background count rate and
hence the minimum measurable and detectable activities. Electron capture nuclides often have
complicated decay schemes, emitting a range of energies with different probabilities. Hence the most
effective manner for describing the operation of these detectors is to calculate the detection efficiencies
over a range of photon energies. These can be folded with the energy and emission characteristics of
the nuclide in question and the area of the detector to give a response.
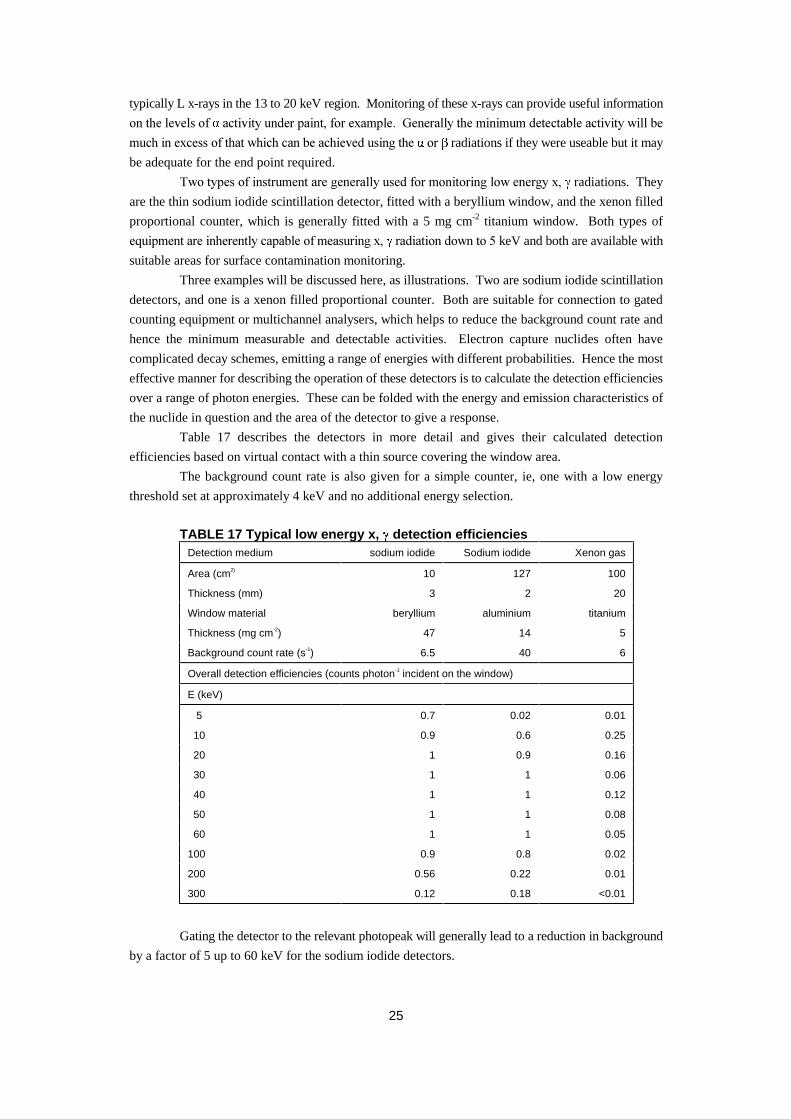
Table 17 describes the detectors in more detail and gives their calculated detection
efficiencies based on virtual contact with a thin source covering the window area.
The background count rate is also given for a simple counter, ie, one with a low energy
threshold set at approximately 4 keV and no additional energy selection.
TABLE 17 Typical low energy x, detection efficienciesDetection medium sodium iodide Sodium iodide Xenon gas
Area (cm2) 10 127 100
Thickness (mm) 3 2 20
Window material beryllium aluminium titanium
Thickness (mg cm-2) 47 14 5
Background count rate (s-1) 6.5 40 6
Overall detection efficiencies (counts photon-1 incident on the window)
E (keV)
5 0.7 0.02 0.01
10 0.9 0.6 0.25
20 1 0.9 0.16
30 1 1 0.06
40 1 1 0.12
50 1 1 0.08
60 1 1 0.05
100 0.9 0.8 0.02
200 0.56 0.22 0.01
300 0.12 0.18 <0.01
Gating the detector to the relevant photopeak will generally lead to a reduction in background
by a factor of 5 up to 60 keV for the sodium iodide detectors.
26
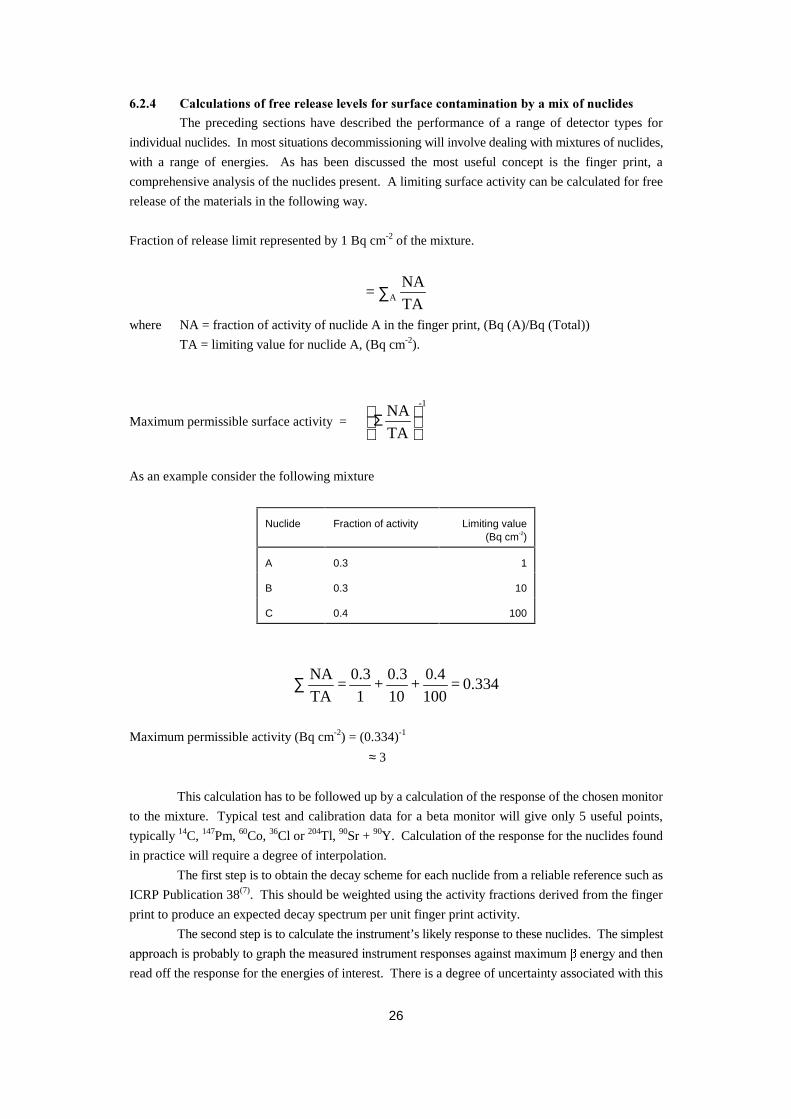
����� &DOFXODWLRQV�RI�IUHH�UHOHDVH�OHYHOV�IRU�VXUIDFH�FRQWDPLQDWLRQ�E\�D�PL[�RI�QXFOLGHV
The preceding sections have described the performance of a range of detector types for
individual nuclides. In most situations decommissioning will involve dealing with mixtures of nuclides,
with a range of energies. As has been discussed the most useful concept is the finger print, a
comprehensive analysis of the nuclides present. A limiting surface activity can be calculated for free
release of the materials in the following way.
Fraction of release limit represented by 1 Bq cm-2 of the mixture.
TA
NA = A∑
where NA = fraction of activity of nuclide A in the finger print, (Bq (A)/Bq (Total))
TA = limiting value for nuclide A, (Bq cm-2).
Maximum permissible surface activity =
Σ
TA
NA-1
As an example consider the following mixture
Nuclide Fraction of activity Limiting value(Bq cm-2)
A 0.3 1
B 0.3 10
C 0.4 100
0.334 = 100
0.4 +
10
0.3 +
1
0.3 =
TA
NA ∑
Maximum permissible activity (Bq cm-2) = (0.334)-1
≈ 3
This calculation has to be followed up by a calculation of the response of the chosen monitor
to the mixture. Typical test and calibration data for a beta monitor will give only 5 useful points,
typically 14C, 147Pm, 60Co, 36Cl or 204Tl, 90Sr + 90Y. Calculation of the response for the nuclides found
in practice will require a degree of interpolation.
The first step is to obtain the decay scheme for each nuclide from a reliable reference such as
ICRP Publication 38(7). This should be weighted using the activity fractions derived from the finger
print to produce an expected decay spectrum per unit finger print activity.
The second step is to calculate the instrument’s likely response to these nuclides. The simplest
DSSURDFK�LV�SUREDEO\�WR�JUDSK�WKH�PHDVXUHG�LQVWUXPHQW�UHVSRQVHV�DJDLQVW�PD[LPXP� �HQHUJ\�DQG�WKHQ
read off the response for the energies of interest. There is a degree of uncertainty associated with this
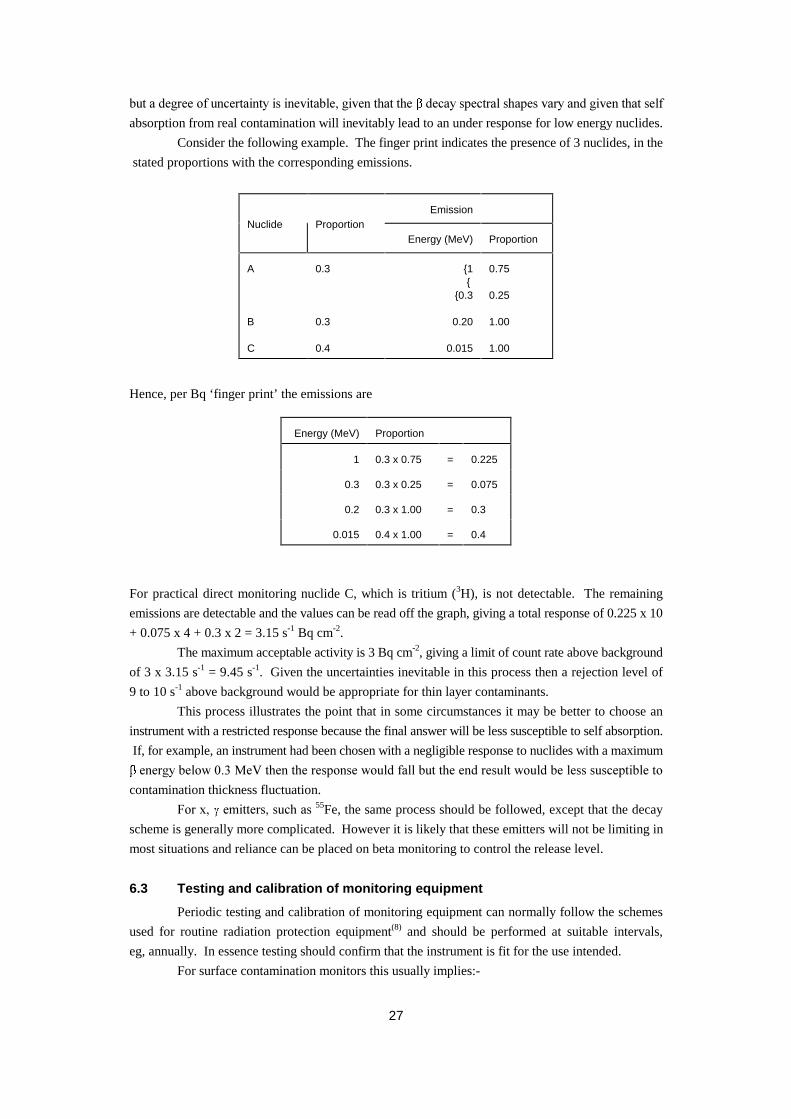
27
EXW�D�GHJUHH�RI�XQFHUWDLQW\�LV�LQHYLWDEOH��JLYHQ�WKDW�WKH� �GHFD\�VSHFWUDO�VKDSHV�YDU\�DQG�JLYHQ�WKDW�VHOI
absorption from real contamination will inevitably lead to an under response for low energy nuclides.
Consider the following example. The finger print indicates the presence of 3 nuclides, in the
stated proportions with the corresponding emissions.
EmissionNuclide Proportion
Energy (MeV) Proportion
A
B
C
0.3
0.3
0.4
{1{
{0.3
0.20
0.015
0.75
0.25
1.00
1.00
Hence, per Bq ‘finger print’ the emissions are
Energy (MeV) Proportion
1 0.3 x 0.75 = 0.225
0.3 0.3 x 0.25 = 0.075
0.2 0.3 x 1.00 = 0.3
0.015 0.4 x 1.00 = 0.4
For practical direct monitoring nuclide C, which is tritium (3H), is not detectable. The remaining
emissions are detectable and the values can be read off the graph, giving a total response of 0.225 x 10
+ 0.075 x 4 + 0.3 x 2 = 3.15 s-1 Bq cm-2.
The maximum acceptable activity is 3 Bq cm-2, giving a limit of count rate above background
of 3 x 3.15 s-1 = 9.45 s-1. Given the uncertainties inevitable in this process then a rejection level of
9 to 10 s-1 above background would be appropriate for thin layer contaminants.
This process illustrates the point that in some circumstances it may be better to choose an
instrument with a restricted response because the final answer will be less susceptible to self absorption.
If, for example, an instrument had been chosen with a negligible response to nuclides with a maximum
�HQHUJ\�EHORZ�����0H9�WKHQ�WKH�UHVSRQVH�ZRXOG�IDOO�EXW�WKH�HQG�UHVXOW�ZRXOG�EH�OHVV�VXVFHSWLEOH�WR
contamination thickness fluctuation.
)RU�[�� �HPLWWHUV��VXFK�DV�55Fe, the same process should be followed, except that the decay
scheme is generally more complicated. However it is likely that these emitters will not be limiting in
most situations and reliance can be placed on beta monitoring to control the release level.
6.3 Testing and calibration of monitoring equipment
Periodic testing and calibration of monitoring equipment can normally follow the schemes
used for routine radiation protection equipment(8) and should be performed at suitable intervals,
eg, annually. In essence testing should confirm that the instrument is fit for the use intended.
For surface contamination monitors this usually implies:-
28
(1) confirmation that the response to large area sources of the type and energy range which the
detector is designed to measure and expected to encounter is close to that specified by the
manufacturer.
(2) that the instrument has a suitably low response to radiation types and energies which it is
GHVLJQHG�QRW�WR�GHWHFW���)RU�H[DPSOH� �VXUIDFH�FRQWDPLQDWLRQ�PRQLWRUV�VKRXOG�KDYH�D�UHVSRQVH
WR�HQHUJHWLF� �FRQWDPLQDWLRQ�RI�OHVV�WKDQ����RI�WKDW�WR� �FRQWDPLQDWLRQ�DQG�DOVR�VKRXOG�KDYH
D�QHJOLJLEOH�FKDQJH�LQ�FKDUDFWHULVWLFV�ZKHQ�H[SRVHG�WR�����DQG����NH9� �radiations at levels
up to 1 mGy h-1.
(3) that the instrument is reasonably linear over its expected operating range i.e. that the ratio of
the instrument indication to the value of the quantity of interest for a fixed radiation type and
energy does not vary seriously.
(4) that the response of the instrument is reasonably uniform over the full area of the instrument
and that there are no large areas of greatly reduced performance.
(5) that the instrument is in a good state of repair, ie, there are no obvious faults which are likely
to cause a falling off in performance.
(6) that the instrument does not respond to and is not inhibited by, for example, strong light levels
or magnetic fields. This last category is very dependent on the exact circumstances of use.
Testing should be performed in a suitably equipped facility staffed by suitably qualified and
knowledgeable personnel. All measured responses should be directly traceable to national standards
and the estimated levels of uncertainty should be such that the field measurements are not significantly
compromised. Testing should be to a written protocol and clearly documented.
If repairs have been performed on instruments which could seriously alter their performance,
they should be checked in the same manner. Examples are replacement of a photomultiplier tube or a
xenon filled proportional counter. Minor repairs, such as the replacement of a knob or the repair of a
battery terminal would require only a simple function check.
Function checks should be performed regularly, especially given that many decommissioning
measurements will be performed in difficult conditions. For each instrument a test should be devised
which is demanding but yet rapid and which can be performed by the actual instrument user or the
person who issues the instruments. As an example, for a typical anthracene scintillation detector a
check of background count rate and a check with a 14C contamination plaque will detect the majority
of faults. Again these tests should be to a simple written procedure. Careful watch has to be kept on
equipment used for decommissioning to identify equipment which is becoming unacceptably
FRQWDPLQDWHG�� � 7KH� FODVVLF� FDVH� LV� DQ� � PRQLWRU� ZKHUH� ORZ� OHYHO� FRQWDPLQDWLRQ� FDQ� FDXVH� WKH
background to rise from 1 count per minute to 1 count every three or four seconds. This level can
compromise the detection of areas of unacceptable contamination.
6.4 The thickness of typical surface coatings and their influence on contaminationmonitor performancesThere is a very limited amount of data on the thickness of paint, varnish, polish and grease
layers found in practice. A short series of measurements was undertaken to estimate the effect, using
pieces of 50 mm square 1 mm thick aluminium plate. These were degreased, weighed and then coated
in the way described. After 4 days the plates were reweighed and the mean mass per unit area of the
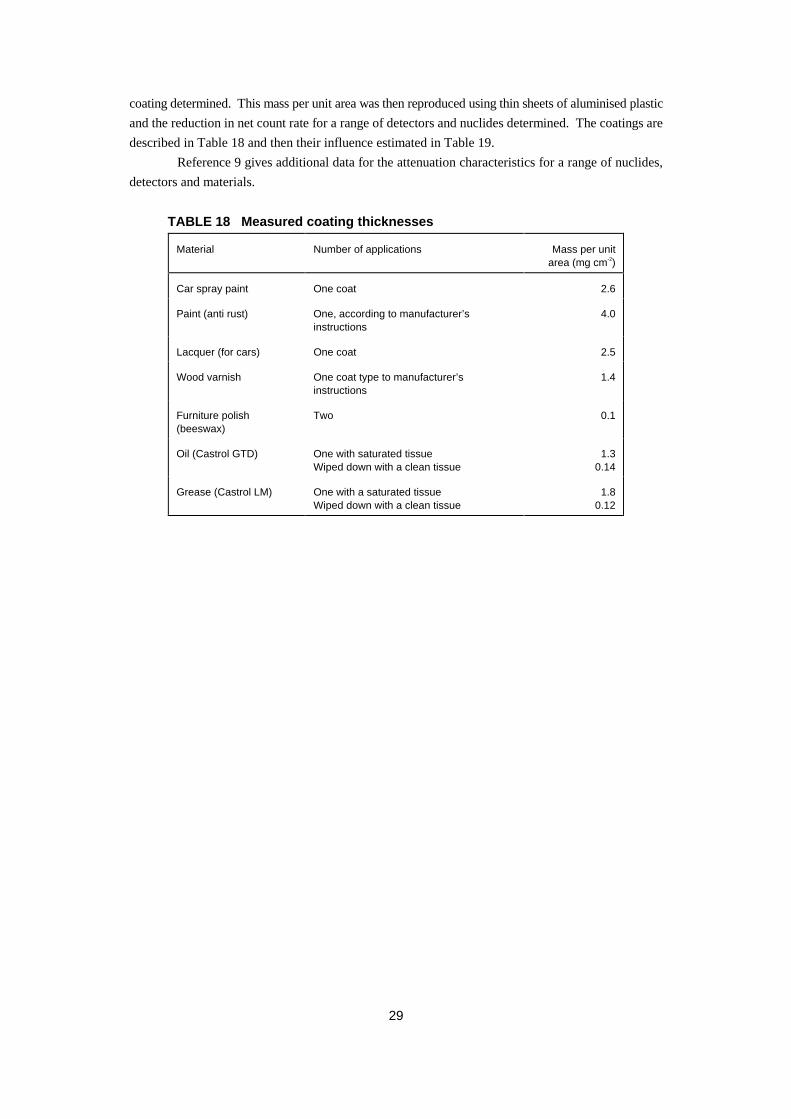
29
coating determined. This mass per unit area was then reproduced using thin sheets of aluminised plastic
and the reduction in net count rate for a range of detectors and nuclides determined. The coatings are
described in Table 18 and then their influence estimated in Table 19.
Reference 9 gives additional data for the attenuation characteristics for a range of nuclides,
detectors and materials.
TABLE 18 Measured coating thicknesses
Material Number of applications Mass per unitarea (mg cm-2)
Car spray paint One coat 2.6
Paint (anti rust) One, according to manufacturer’sinstructions
4.0
Lacquer (for cars) One coat 2.5
Wood varnish One coat type to manufacturer’sinstructions
1.4
Furniture polish(beeswax)
Two 0.1
Oil (Castrol GTD) One with saturated tissueWiped down with a clean tissue
1.30.14
Grease (Castrol LM) One with a saturated tissueWiped down with a clean tissue
1.80.12
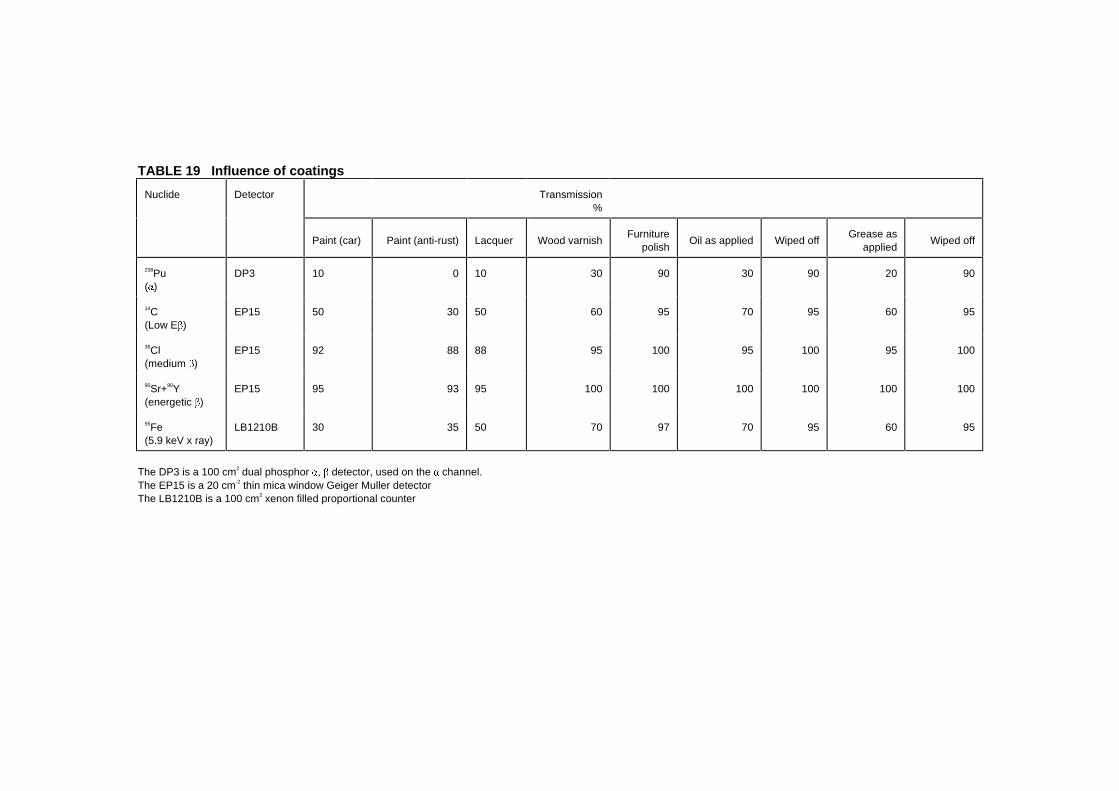
TABLE 19 Influence of coatings
Nuclide Detector Transmission%
Paint (car) Paint (anti-rust) Lacquer Wood varnishFurniture
polishOil as applied Wiped off
Grease asapplied
Wiped off
238Pu( )
DP3 10 0 10 30 90 30 90 20 90
14C(Low E )
EP15 50 30 50 60 95 70 95 60 95
36Cl(medium )
EP15 92 88 88 95 100 95 100 95 100
90Sr+90Y(energetic )
EP15 95 93 95 100 100 100 100 100 100
55Fe(5.9 keV x ray)
LB1210B 30 35 50 70 97 70 95 60 95
The DP3 is a 100 cm2 dual phosphor , detector, used on the channel.The EP15 is a 20 cm-2 thin mica window Geiger Muller detectorThe LB1210B is a 100 cm2 xenon filled proportional counter
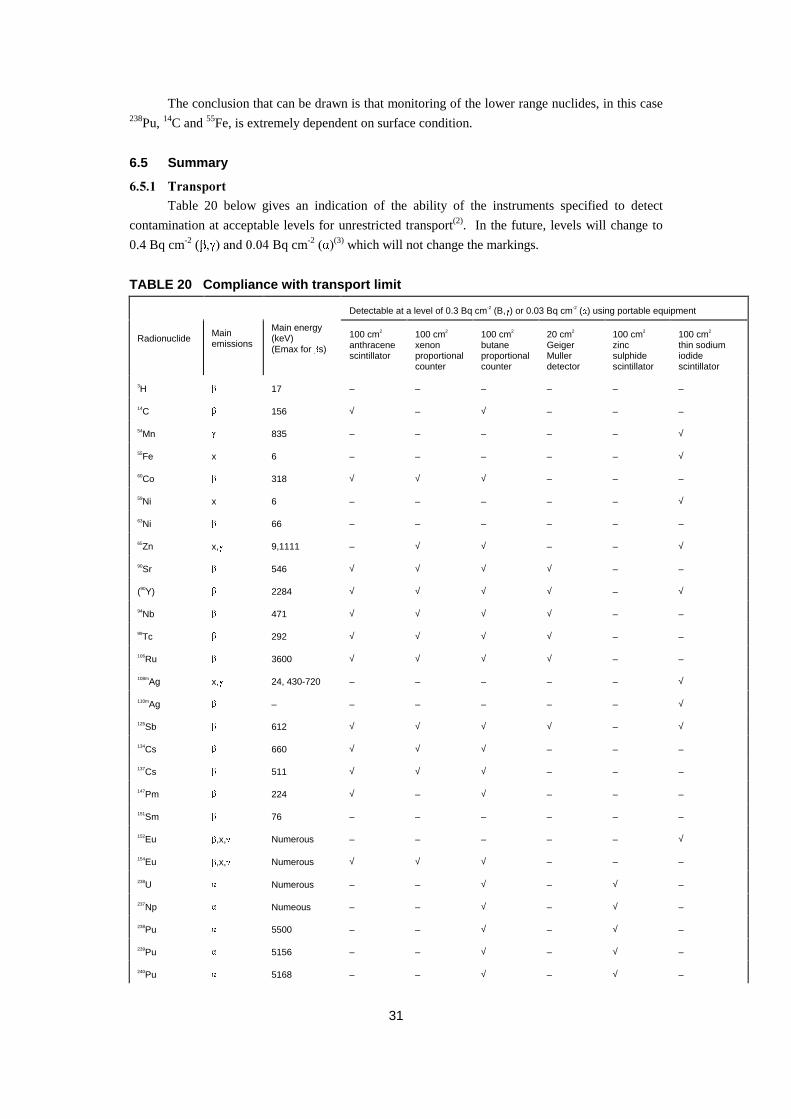
31
The conclusion that can be drawn is that monitoring of the lower range nuclides, in this case238Pu, 14C and 55Fe, is extremely dependent on surface condition.
6.5 Summary
����� 7UDQVSRUW
Table 20 below gives an indication of the ability of the instruments specified to detect
contamination at acceptable levels for unrestricted transport(2). In the future, levels will change to
0.4 Bq cm-2 ( � ��DQG������Bq cm-2�� �(3) which will not change the markings.
TABLE 20 Compliance with transport limit
Detectable at a level of 0.3 Bq cm-2 (B, ) or 0.03 Bq cm-2 ( ) using portable equipment
RadionuclideMainemissions
Main energy(keV)(Emax for s)
100 cm2
anthracenescintillator
100 cm2
xenonproportionalcounter
100 cm2
butaneproportionalcounter
20 cm2
GeigerMullerdetector
100 cm2
zincsulphidescintillator
100 cm2
thin sodiumiodidescintillator
3H 17 – – – – – –
14C 156 √ – √ – – –
54Mn 835 – – – – – √
55Fe x 6 – – – – – √
60Co 318 √ √ √ – – –
59Ni x 6 – – – – – √
63Ni 66 – – – – – –
65Zn x, 9,1111 – √ √ – – √
90Sr 546 √ √ √ √ – –
(90Y) 2284 √ √ √ √ – √
94Nb 471 √ √ √ √ – –
99Tc 292 √ √ √ √ – –
106Ru 3600 √ √ √ √ – –
108mAg x, 24, 430-720 – – – – – √
110mAg – – – – – – √
125Sb 612 √ √ √ √ – √
134Cs 660 √ √ √ – – –
137Cs 511 √ √ √ – – –
147Pm 224 √ – √ – – –
151Sm 76 – – – – – –
152Eu ,x, Numerous – – – – – √
154Eu ,x, Numerous √ √ √ – – –
238U Numerous – – √ – √ –
237Np Numeous – – √ – √ –
238Pu 5500 – – √ – √ –
239Pu 5156 – – √ – √ –
240Pu 5168 – – √ – √ –
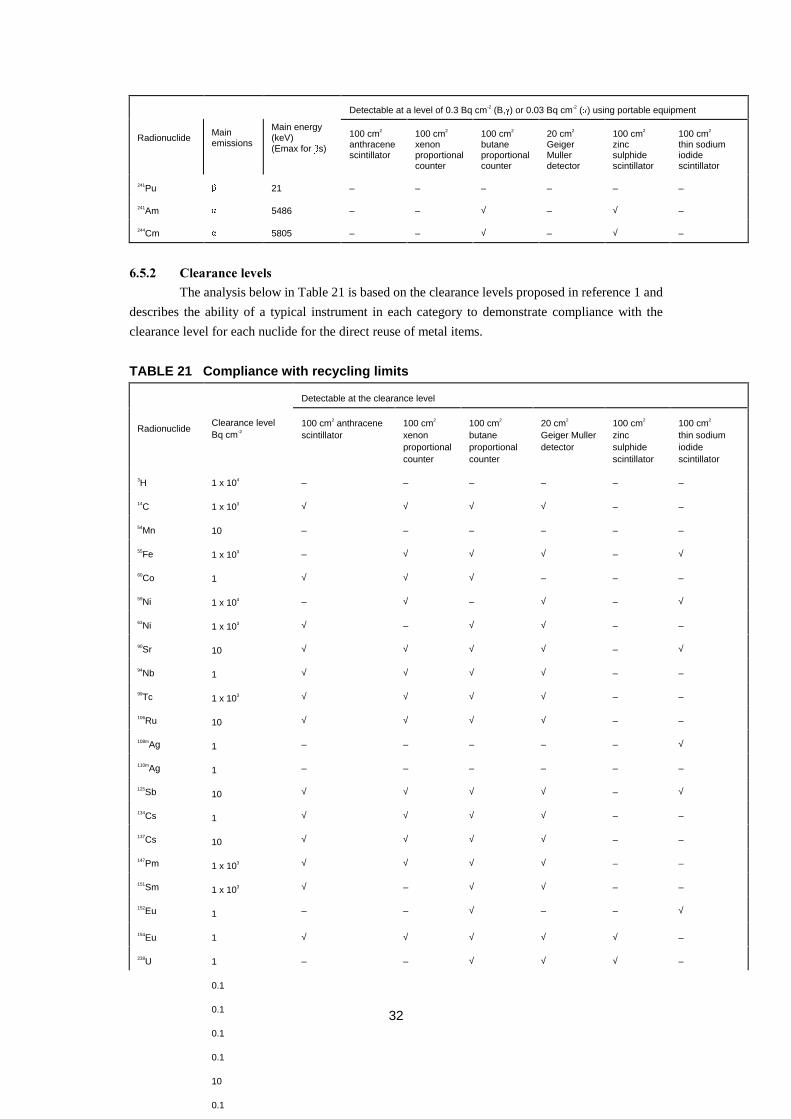
32
Detectable at a level of 0.3 Bq cm-2 (B, ) or 0.03 Bq cm-2 ( ) using portable equipment
RadionuclideMainemissions
Main energy(keV)(Emax for s)
100 cm2
anthracenescintillator
100 cm2
xenonproportionalcounter
100 cm2
butaneproportionalcounter
20 cm2
GeigerMullerdetector
100 cm2
zincsulphidescintillator
100 cm2
thin sodiumiodidescintillator
241Pu 21 – – – – – –
241Am 5486 – – √ – √ –
244Cm 5805 – – √ – √ –
����� &OHDUDQFH�OHYHOV
The analysis below in Table 21 is based on the clearance levels proposed in reference 1 and
describes the ability of a typical instrument in each category to demonstrate compliance with the
clearance level for each nuclide for the direct reuse of metal items.
TABLE 21 Compliance with recycling limits
Detectable at the clearance level
RadionuclideClearance levelBq cm-2
100 cm2 anthracenescintillator
100 cm2
xenonproportionalcounter
100 cm2
butaneproportionalcounter
20 cm2
Geiger Mullerdetector
100 cm2
zincsulphidescintillator
100 cm2
thin sodiumiodidescintillator
3H – – – – – –
14C √ √ √ √ – –
54Mn – – – – – –
55Fe – √ √ √ – √
60Co √ √ √ – – –
59Ni – √ – √ – √
63Ni √ – √ √ – –
90Sr √ √ √ √ – √
94Nb √ √ √ √ – –
99Tc √ √ √ √ – –
106Ru √ √ √ √ – –
108mAg – – – – – √
110mAg – – – – – –
125Sb √ √ √ √ – √
134Cs √ √ √ √ – –
137Cs √ √ √ √ – –
147Pm √ √ √ √ – –
151Sm √ – √ √ – –
152Eu
1 x 10⁴
1 x 10³
10
1 x 10³
1
1 x 10⁴
1 x 10³
10
1
1 x 10³
10
1
1
10
1
10
1 x 10³
1 x 10³
1 – – √ – – √
154Eu √ √ √ √ √ –
238U
1
1
0.1
0.1
0.1
0.1
10
0.1
– – √ √ √ –
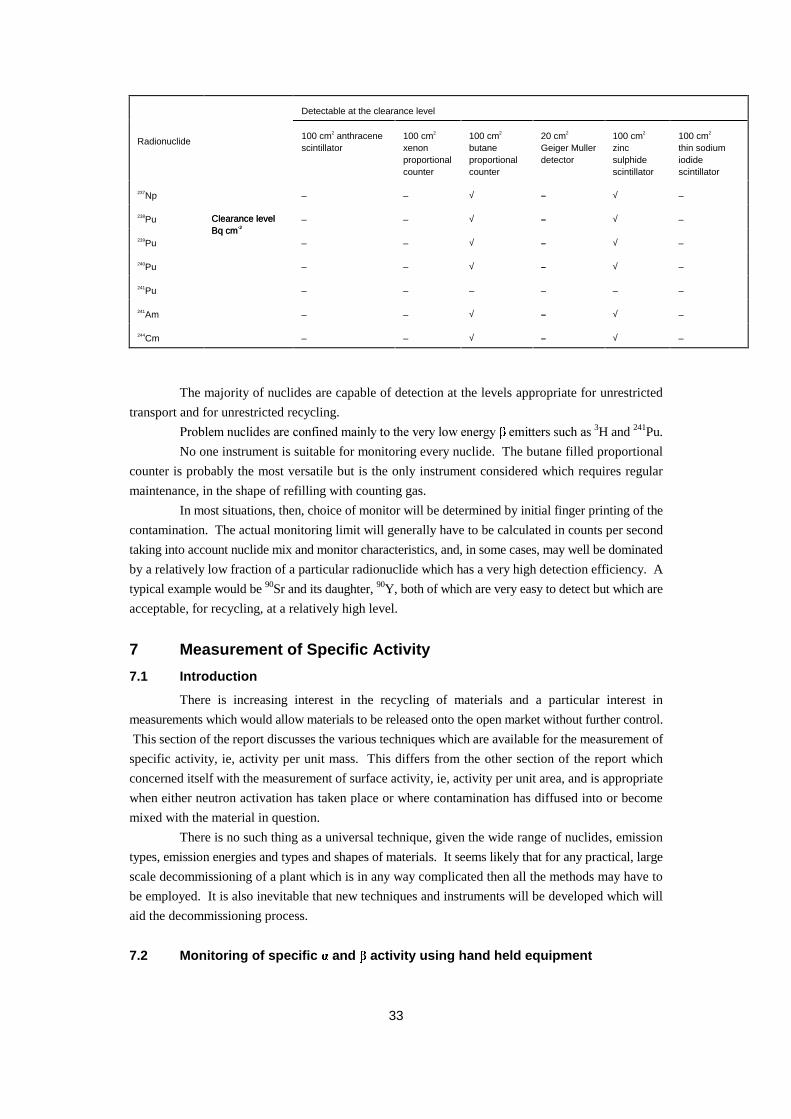
33
Detectable at the clearance level
Radionuclide
Clearance levelBq cm-2
100 cm2 anthracenescintillator
100 cm2
xenonproportionalcounter
100 cm2
butaneproportionalcounter
20 cm2
Geiger Mullerdetector
100 cm2
zincsulphidescintillator
100 cm2
thin sodiumiodidescintillator
237Np – – √ – √ –
238Pu – – √ – √ –
239Pu – – √ – √ –
240Pu – – √ – √ –
241Pu – – – – – –
241Am – – √ – √ –
244Cm
Clearance levelBq cm-2
– – √ – √ –
The majority of nuclides are capable of detection at the levels appropriate for unrestricted
transport and for unrestricted recycling.
3UREOHP�QXFOLGHV�DUH�FRQILQHG�PDLQO\�WR�WKH�YHU\�ORZ�HQHUJ\� �HPLWWHUV�VXFK�DV�3H and 241Pu.
No one instrument is suitable for monitoring every nuclide. The butane filled proportional
counter is probably the most versatile but is the only instrument considered which requires regular
maintenance, in the shape of refilling with counting gas.
In most situations, then, choice of monitor will be determined by initial finger printing of the
contamination. The actual monitoring limit will generally have to be calculated in counts per second
taking into account nuclide mix and monitor characteristics, and, in some cases, may well be dominated
by a relatively low fraction of a particular radionuclide which has a very high detection efficiency. A
typical example would be 90Sr and its daughter, 90Y, both of which are very easy to detect but which are
acceptable, for recycling, at a relatively high level.
7 Measurement of Specific Activity
7.1 Introduction
There is increasing interest in the recycling of materials and a particular interest in
measurements which would allow materials to be released onto the open market without further control.
This section of the report discusses the various techniques which are available for the measurement of
specific activity, ie, activity per unit mass. This differs from the other section of the report which
concerned itself with the measurement of surface activity, ie, activity per unit area, and is appropriate
when either neutron activation has taken place or where contamination has diffused into or become
mixed with the material in question.
There is no such thing as a universal technique, given the wide range of nuclides, emission
types, emission energies and types and shapes of materials. It seems likely that for any practical, large
scale decommissioning of a plant which is in any way complicated then all the methods may have to
be employed. It is also inevitable that new techniques and instruments will be developed which will
aid the decommissioning process.
7.2 Monitoring of specific and activity using hand held equipment
34
Circumstances may arise where materials have to be monitored which are potentially
FRQWDPLQDWHG�PDLQO\�E\� �DQG� �HPLWWLQJ�QXFOLGHV�ZKLFK�KDYH�QHJOLJLEOH�[�DQG� �HPLVVLRQV�� �6XFK
radiations are difficult to detect in bulk samples. This is ameliorated to some extent, as the proposed
FOHDUDQFH�OHYHOV�IRU�WKH� �HPLWWHUV�DUH�PXFK�KLJKHU�WKDQ�WKRVH�SURSRVHG�IRU�WKH� �HPLWWHUV���+RZHYHU�WKH
OHYHOV�IRU�WKH�SXUH� �HPLWWHUV�KDYH�EHHQ�VHW�DW���%T�J-1��WKH�VDPH�YDOXH�DV�WKH� �HPLWWHUV�
7KH�YHU\�OLPLWHG�UDQJH�RI� �DQG� �HPLVVLRQV�GLFWDWHV�WKDW�RQO\�WKH�VXUIDFH�RU�QHDU�VXUIDFH�RI
a sample contributes to the signal. Hence it will be essential that either any measurement sample is
homogenous or sufficient samples are taken from an inhomogeneous material to allow a confident
calculation of the specific activity of a bulk sample equal to the permitted averaging mass.
Problems will also arise for materials which have significant natural activity, such as granite
and many soils.
The instruments of choice for work of this nature are large area scintillation detectors or
proportional counters filled with a low atomic number gas. The last type can be particularly useful as
WKH\�DUH�QRUPDOO\�FDSDEOH�RI�PHDVXUHPHQW�RI� �UDGLDWLRQV�DQG�DOVR� �UDGLDWLRQV�ZLWK�PD[LPXP�HQHUJLHV
above approximately 100 NH9���'XDO� � �VFLQWLOODWRUV�KDYH�D�PXFK�KLJKHU�PLQLPXP�XVHIXO� �HQHUJ\
threshold.
The samples should be prepared with as close to a flat surface as possible so that the detector
can be supported not more than 2 or 3 mm above the surface. The instrument should then be set to
integrate for a suitable period to allow reliable detection of significant contamination. This will depend
on the instrument sensitivity, which should be measured for each type to be employed for a
UHSUHVHQWDWLYH� �QXFOLGH�DQG�DOVR�IRU�D�UDQJH�RI� �HPLWWHUV�
The instrument sensitivity can be determined using suitable sources and a corresponding range
RI�DEVRUEHUV���)RU�SHQHWUDWLQJ� �HPLWWHUV��VXFK�DV�90Sr + 90Y, aluminium sheet 0.5 mm is suitable while
IRU�ORZ�HQHUJ\� �HPLWWHUV�VXFK�DV�14&�DQG�IRU� �HPLWWHUV�SODVWLF�VKHHW�RI���PJ�FP-2 mass per unit area
is suitable. The instrument should be placed on a source of known emission rate per unit area (A) and
the net count rate noted (N1). A single layer of absorber should be placed over the surface, the
instrument replaced and the count rate noted (N2). This process should be continued until the indication
is close to background. Sources to be used for this process should have dimensions greater than the
detector window and should generate net count rates with no absorber of at least 10 times background
to minimise the time required to make the measurements.
The response to distributed activity can be calculated using the following routine.
Surface emission = A particles cm-2 s-1
Effective activity = 2A Bq cm-2
(for 100% emission)
Synthesised net count rate from an infinitely thick sample equals
N = N Ti
k
1=iΣ
where k is the last point above background.
Effective activity per unit area = 2 A kBq cm-2
Effective mass per unit area = (k-1)P
35
where P is the mass per unit area of each absorber.
Instrument response = g Bq s Ak2
P1)(k- N 1-1-T
(for a 100% emission)
This was performed for a Berthold LB1210C and a function derived from the response. The
result was
R = 2.8 (E - 0.1) 1.25
where R is the response (s-1 Bq-1 g)
E is the maximum energy (MeV)
The value of 0.1 was subtracted from E to generate an effective energy threshold of 100 keV.
As examples, for 14C, the response was 0.1 s-1 Bq-1 g and for 36Cl was 1.7 s-1 Bq-1 g. Normal
background count rate was 5 s-1, giving a total count over 100 seconds of 500, with a corresponding
statistical uncertainty of ± 50 counts at the 95% confidence level or 0.5 s-1. Hence minimum detectable
activities for 14C and 36Cl are 5 Bq g-1 and 0.3 Bq g-1.
It is also possible to make a fairly crude estimate of maximum energy by covering the sample
with one or more of the absorbers used in the calibration exercise. Low energy nuclides, such as 14C,
will be attenuated very quickly in comparison with higher energy nuclides.
/RZ�SUREDELOLW\� �HPLVVLRQV�ZLOO�DOVR�FRQWULEXWH�JLYHQ�WKDW�WKH\�ZLOO�EH�UHODWLYHO\�unattenuated
in their passage through the sample. However the detectors suggested have been chosen for their low
[�� �GHWHFWLRQ�SUREDELOLW\��ZKLFK�LV�OHVV�WKDQ������IRU�QRUPDOO\�LQFLGHQW�SKRWRQV���+HQFH�D�VDPSOH�� cm
thick, with a mass per unit area of 2 g cm-2, would generate approximately 1 s-1 in a 100 cm2 counter
for a level of 1 Bq g-1�ZLWK�D������ �HPLVVLRQ�SUREDELOLW\���)RU�ORZ�SUREDELOLW\��������� �HPLVVLRQV
WKH� �VLJQDO�ZLOO�QRUPDOO\�H[FHHG�WKH� �FRQWULEXWLRQ�
7KH�VDPH�GHWHUPLQDWLRQ�RI�LQVWUXPHQW�UHVSRQVH�ZDV�UHSHDWHG�IRU� �HPLWWHUV�XVLQJ�D�238Pu
source. The corresponding result was 0.3 s-1 Bq-1 g. Over a 100 second period such a monitor has a
typical background of one or two counts. Hence a level of 1 Bq g-1, generating 30 counts over 100
VHFRQGV��ZRXOG�EH�FOHDUO\�GLVWLQJXLVKDEOH� IURP�EDFNJURXQG�DQG�KDYH�D� UDQGRP�XQFHUWDLQW\� � ��RI
approximately 40%. Reference 10 illustrates the use of this technique for practical measurements.
7.3 Monitoring of specific activity using hand held equipment
Circumstances may arise where it is possible to use conventional radiation protection
instruments to estimate the gamma activity per unit mass of samples of decommissioning waste. This
technique can be particularly useful for the clearance of large volumes of waste where contamination
is unlikely and where the potential contaminant or contaminants are known and are energetic gamma
emitters. The technique is not appropriate for samples of complicated shape, wide and varying nuclide
mix and for nuclides which emit non penetrating radiations. Typical suitable situations include soil
which might possibly have been contaminated by 137Cs from fuel pond leaks, concrete which might
contain 60Co activated steel reinforcing or potentially activated steel beams or piping which can be
assumed to be uncontaminated.
36
There are two essentially simple situations. One is where the mass of the material is so large
that the sample is close to semi-infinite source and the other is where the sample has a relatively simple
shape and where self absorption is very small.
����� $�FORVH�WR�LQILQLWH�VDPSOH
Samples are close to semi-infinite where doubling the mass adds only a few percent to the
radiation intensity at the position of the detector. A good example is an excavator bucket holding one
or two hundred kg of soil or crushed concrete.
If we consider a hemisphere radius R with the detector placed in contact with the centre of the
flat face it is relatively easy to determine whether this represents a close to semi-infinite source.
Consider a sphere with the detector at the centre and consider a thin shell at radius r thickness dr. If we
assume the detector is spherical and has unit cross sectional area and that the material emits one photon
s-1 per unit volume then the fluence contribution for a shell hanging in free space, G ��LV
dr = r4
1dr r4 = d
22
ππφ
The first term is the volume considered and the second term is the fractional solid angle
subtended by the detector.
However if we assume that the sphere is solid, ie, attenuating, then the contribution, G ��LV
given by
e r4
1dr r4 = d r-
22 µ
ππφ
ZKHUH� �LV�WKH�HIIHFWLYH�OLQHDU�DWWHQXDWLRQ�FRHIILFLHQW�
G � �H- U dr
]e = r-R=r
o=r
[ µφ
µ
]e-[1 1
= r-µ
µAs R lends to infinity then e- U tends to zero.
Hence if the dimension of the source is such that e- U is less than 0.2 then the source can be
taken as acceptably close to infinite.
Solid concrete, as an example, has a density of 2.7 g cm-3. The effective attenuation
coefficients for 137Cs and 60Co(11) are given in Table 22 as are the radii in cm corresponding to e- U = 0.2.
TABLE 22 Thickness of concrete representing dose to an infinite source
Nuclide Attenuation coefficient ( ) R for e- R = 0.2 (cm)
137Cs 0.10 16
60Co 0.08 20
37
A hemisphere of this dimension would have a mass of 86 kg, which is much less than the mass held in
most excavator buckets.
The dose rate at the centre of an infinite mass can be calculated simply from the gamma
energy per disintegration and the activity per unit mass. Any beta decay should be ignored as the
majority of equipment used in assessing waste activity is normally insensitive to beta radiation for
reasons of robustness and also because variations in activity distribution produce large variations in beta
dose rate.
Hence, the dose rate, D_ , in *\�K-1� �$�[� (�[�����[���-13 x 106 x 3600
A = activity concentration (Bq kg-1)
(� �WRWDO� �HQHUJ\�HPLWWHG�SHU�GHFD\��MeV)
1.6 x 10⁻¹³ converts MeV to joules
106 converts Gy to *\
3600 converts Bq to disintegrations per hour.
Thus D_ = A x ΣE x 5.8 x 10⁻⁴
For 60Co ΣE = 2.5 MeV
Choosing A = 1 kBq kg-1 gives a dose rate of 1.44 *\�K-1 within an infinite mass.
At the surface of a semi-infinite mass the dose rate to the material will be something less than half that
at the centre of an infinite mass. It will not be exactly half as the backscatter from the solid material will
not be reproduced if the interface is with air. The dose rate to air will also differ slightly from the dose
rate in the material because of differences in the mass energy attenuation coefficients. Hence, it is
possible to make a reasonably good, but not perfect, calculation of the dose rate to air in air at the
surface of an effectively semi-infinite contaminate medium. Following this argument through gives a
value of air dose rate for a semi-infinite source contaminated by 60Co at a level of 1 kBq kg-1 of
approximately 0.7 *\�K-1. Such a level is not normally easy to measure with instruments designed for
the measurement of occupational dose rates where there is generally a trade off between sensitivity and
the achievement of good dosimetric characteristics, such as a flat energy response and good polar
response. However, there is a large number of sodium iodide based instruments which will detect such
a level with ease. As an example a 50 mm x 50 mm sodium iodide scintillation detector will have a
response of approximately 700 s-1 *\-1 h for 60&R� �UDGLDWLRQ�ZKHQ�XVHG�ZLWK�D�VLPSOH��ie, non energy
selective, ratemeter. The background on such an instrument is usually in the range 20 to 50 s-1. A level
of 0.7 *\�K-1 60Co would then generate an indication of approximately 500 s-1 above a background of
50 s-1. For 137Cs 1 kBq kg-1 will generate a surface dose rate of approximately 0.2 *\�K-1 and with the
detector’s enhanced response of approximately 1000 s-1� *\-1 h will give an indication of 200 s-1 above
background. The actual values will be higher than this because of the rising response of the sodium
iodide scintillation detector at low energies. The gamma radiation spectrum at the surface will comprise
D�PL[WXUH�RI�SULPDU\� �UD\V�RI�WKH�H[SHFWHG�HQHUJ\�DQG�VFDWWHUHG�SKRWRQV�RI�ORZHU�HQHUJ\���7KH�GHWHFWRU
will have a higher response to those energies when compared to the primary energy.
It is also essential to establish a reference background for the measurement, which should
replicate as closely as possible the circumstances of the operational measurement using the same
position and sample container, with the only difference being the use of a clean sample of the material
to be assessed. For many materials the background indication of the instrument when it is placed, for
38
example, at the centre of the top surface of a loaded excavator bucket, will be lower than the free air
value, because the bucket and contents shield the detector from a large proportion of the terrestrial
gamma radiation. However, with materials such as bricks which have relatively high levels of natural
radionuclides, then the background will increase.
The technique as described has a relatively high level of uncertainty. The source is not truely
semi-infinite, which will lead to an underestimate of the activity concentration. The radiation spectrum
can have a relatively large scatter component, which will normally lead to an overestimate of the
activity concentration. The latter point can be addressed by using a gated ratemeter. For a
50 mm x 50 mm detector the photo fractions for 137Cs and 60Co are typically approximately 0.39 and
0.23 for a well set up instrument according to manufacturer’s data ie, approximately 39% and 23% of
the interactions will generate a photoelectron and hence a full energy peak. This would reduce the
instrument responses to 400 s-1� *\-1 h for 137Cs and 160 s-1� *\-1 h for 60Co. For sample levels of 1
kBq kg-1 this would give count rates of 80 s-1 (137Cs) and 110 s-1 (60Co), but against a background of a
few counts per second rather than 50. Hence, it is possible to reduce the uncertainty due to scattered
radiation.
For optimum results, and to generate a very obvious and robust traceability to national
standards, the best technique is to generate a uniform, well mixed, sample, perform the measurements
using the survey meter, take a series of samples from the bulk sample and then count these using an
intrinsic germanium semi-conductor detector in a well defined volume for which the detector efficiency
is well known.
The well mixed sample can also be used to check the variation in response of the instrument
over the top surface of the sample and also to generate correction factors for measurements through the
side of the excavator bucket. It will then be possible to make measurements over the whole sample
container which can be useful if the sample is not close to homogenous, ie, there is the possibility of
localised hot spots which could compromise the disposal process. A typical process would involve a
grid of measurement points spaced at intervals equal to approximately half the smallest dimension (d)
of the bucket. If a localised hot spot is present then it would be unlikely to be more than _ d away if
the bucket is rectangular. A measurement routine can be developed whereby the mean corrected
activity is assessed using the results from all the monitoring points and where statistically significant
deviations from the mean are assumed to be caused by an individual hot particle.
The simplest method of determining this is to place a relatively active source of the relevant
nuclide within the sample at the appropriate position and then noting the instrument count rate. This
may not be practicable and a less effective but still useful method may have to be employed. This uses
a calculation of the expected transmission of the sample and a measurement of the instrument response
to a point source. This should be performed by mounting a source of k Bq in free air at a distance of
x cm from the detector centre and then determining the net count rate n. The response is then n k-1x2.
This value can be used to determine the instrument response to a source at the least favourable distance,
y cm, which will be
If the expected transmission is T at y cm then the final instrument response is:
Bq s counts y
x k n 1-1-2
2-1
39
Again for a 50 mm x 50 mm sodium iodide detector and a depth of 30 cm in crushed concrete the
response will be approximately 1.0 s-1 kBq-1 for 60Co, giving a minimum detectable activity,
corresponding to a doubling of background, of 50 kBq, 60Co.
These techniques can also be employed where there is a range of nuclides present provided
that the ratios of the activity concentrations are not expected to vary greatly or where the waste
sentencing procedure is dominated by the penetrating gamma emitters and the other nuclides are, pro-
rata, much less important.
The simplicity of this technique allows it to be used effectively by a relatively unskilled work
force employing simple and robust equipment. Measurements can be performed where the material is
being removed. It is particularly suitable where it is necessary to check large volumes of material which
are expected to be essentially uncontaminated or where the expected level is well below the limit set.
The main difficulties may well occur when monitoring materials with relatively high levels of natural
radioactivity. These will give much enhanced background count rate in both the simple and gated rate
meter modes, and thus raise the limits of detection.
Another aspect which can be a problem with gated systems is the variation of gain with
temperature of a sodium iodide scintillator - photo multiplier tube combination. A typical gain change
over the temperature range 0°C to + 40 °C is ± 5% compared to + 20°C. Some systems incorporate
gain stabilisation but otherwise this temperature dependency demands either regular adjustment of the
instrument window settings or high voltage, which is extremely undesirable, or that the upper and lower
thresholds be set so that the photopeak always lies within them over the expected temperature range.
This approach increases the background count rate significantly.
����� 6DPSOHV�RI�OLPLWHG�WKLFNQHVV
Some samples such as tubes can be assessed very simply. If a thin walled metal tube is
considered then it is possible to make a series of simplifying assumptions if it is being monitored for
the presence of energetic gamma activity. These are that absorption within the sample is close to zero
and that a side shielded detector mounted in contact with the surface will essentially see radiation
equivalent to that emitted from the surface directly beneath it. The reasoning behind this is the
approximation that in a long thin tube all the radiation escapes and its intensity is uniformly distributed
over its area. In practice the sides of a detector will contribute some signal and hence any measurement
will tend to overestimate the activity level. However this effect can be reduced by side shielding
the detector.
For samples of significant thickness correction can be made for attenuation through the
sample, either by calculation or, in some cases, by performing a measurement using the relevant source.
The measurement of activity per unit mass is less straightforward when dealing with thin
walled tubes or sheets when compared to one measurement of bulk activity, simply because the
DYDLODEOH�PDVV�RI�VDPSOH�LV�PXFK�UHGXFHG���&RQVLGHU�D�WKLQ�ZDOOHG�WXEH��GHQVLW\� ��ZDOO�WKLFNQHVV�[ mm,
diameter y mm and neutron activated, giving a 60Co level of m Bq kg-1. What response would we get
using a sodium iodide scintillation detector with an overall detection efficiency of 70% for normally
incident 60Co photons and area A cm?
y
Tx k n = at ycm) Bq s( response 2
2-11-1-
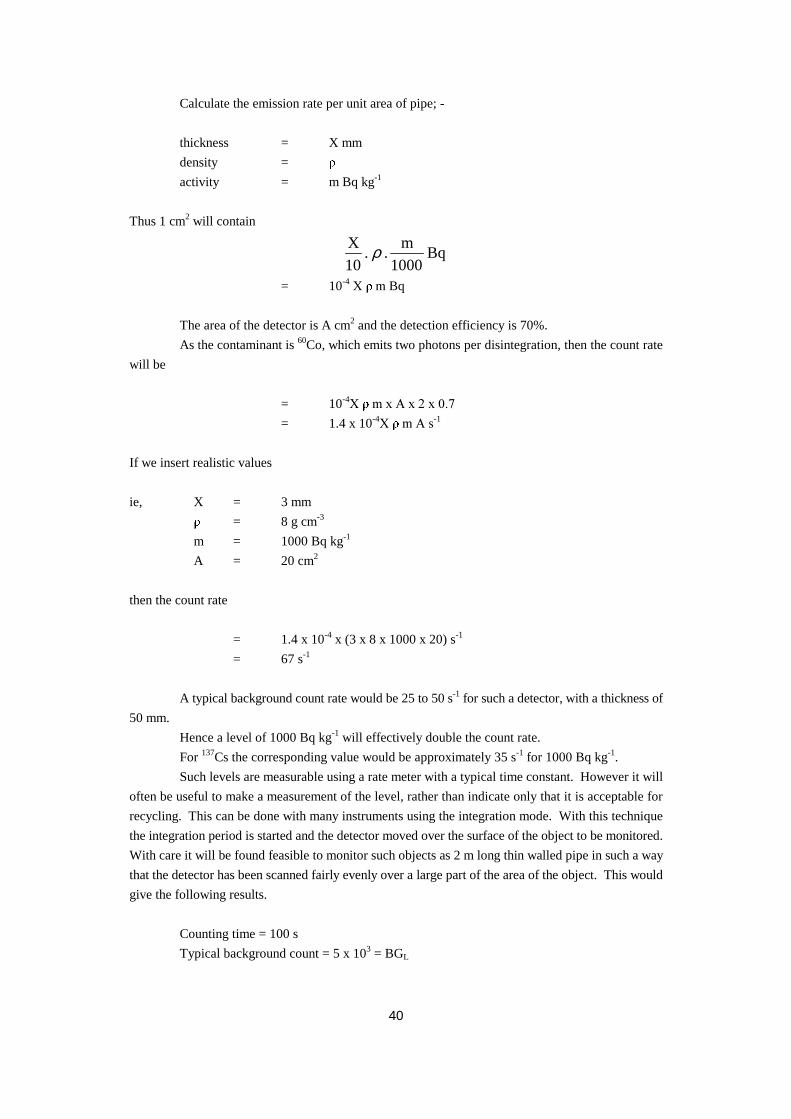
40
Calculate the emission rate per unit area of pipe; -
thickness = X mm
density =
activity = m Bq kg-1
Thus 1 cm2 will contain
Bq1000
m . .
10
X ρ
= 10-4�;� �P�Bq
The area of the detector is A cm2 and the detection efficiency is 70%.
As the contaminant is 60Co, which emits two photons per disintegration, then the count rate
will be
= 10-4;� �P�[�$�[���[����
= 1.4 x 10⁻⁴;� �P�$�V-1
If we insert realistic values
ie, X = 3 mm
= 8 g cm-3
m = 1000 Bq kg-1
A = 20 cm2
then the count rate
= 1.4 x 10-4 x (3 x 8 x 1000 x 20) s-1
= 67 s-1
A typical background count rate would be 25 to 50 s-1 for such a detector, with a thickness of
50 mm.
Hence a level of 1000 Bq kg-1 will effectively double the count rate.
For 137Cs the corresponding value would be approximately 35 s-1 for 1000 Bq kg-1.
Such levels are measurable using a rate meter with a typical time constant. However it will
often be useful to make a measurement of the level, rather than indicate only that it is acceptable for
recycling. This can be done with many instruments using the integration mode. With this technique
the integration period is started and the detector moved over the surface of the object to be monitored.
With care it will be found feasible to monitor such objects as 2 m long thin walled pipe in such a way
that the detector has been scanned fairly evenly over a large part of the area of the object. This would
give the following results.
Counting time = 100 s
Typical background count = 5 x 103 = BGL
41
(This can be established with a high level of precision by making several measurements on
a known clean sample of the material).
As the background count rate is well known then the statistical uncertainty is dominated by
the measurement of the real sample, ie, the count generated by source, S, and background, BG.
Net count = (S + BG) - (BGL)
≈ S
Uncertainty � �� = (S + BG)½
The minimum level of detection (at the 95% confidence level) will be when
S = 2 (S + BG)½
using BG = 5000 gives a value of S = 140 or 1.4 s-1 which corresponds to minimum detectable activities
of 0.02 Bq g-1 60Co and 0.04 Bq g-1 137Cs.
Hence it should be possible to identify clean samples as having levels of one tenth or less of
the appropriate limit.
In areas with abnormally high background levels, advantage can be gained by using a more
sophisticated scaler rate meter equipped with one or more counting channels, provided the likely
contaminants are well known. The most obvious circumstance where this technique shows advantage
is where the monitoring area is irradiated by scattered radiation produced by the nuclides to be
measured. In such a case there can be a relatively high intensity of scattered radiation, which is of a
lower energy than the primary, with only a relatively small component of the primary radiation. Using
a counting channel centred on the photopeak of 60Co will give a low background count rate allowing
the minimum detectable activity to remain unchanged. For example, for a 50 mm x 50 mm detector,
for 60Co.
Total detection probability = 60% ) for normally
Photopeak probability = 20% ) incident photons
Photopeak count rate generated by 1 Bq g-1 60Co ≈ 20 s-1
Typical background = 5 s-1
Hence threshold of detection (allowing for a well established background) and a counting time
of 100 s will be 0.02 Bq g-1. It may seem strange that no advantage has been gained from gating the
unit but this is because of the relatively low photopeak detection probability of an easily portable
detector. However, it has remained unaffected by the higher background.
A problem arises where there is a mix of nuclides, where Compton scattered radiation from
a high energy emitter can appear in the photopeak for a lower energy emitter, thus increasing the
uncertainty. This will be compensated for, to some extent, by the rapidly rising photopeak efficiency
of sodium iodide scintillators. As an illustration the photopeak efficiency for 137Cs is 1.8 times that for60Co for a 50 mm thick detector.
In summary it is possible to sort samples of limited thickness such as thin walled tubes and
plate into three groups; the excessively contaminated, the clearly acceptable and, inevitably, given the
uncertainties, those samples that lie on either side of the acceptable limit. However the technique is
simple, suitable for use by unskilled workers and requires no fixed monitoring stations. Uncertainties
42
can be reduced by taking samples, counting them using more sophisticated equipment and using the
resulting values to generate better calibration values for the hand held equipment.
����� 7KLFNHU�VDPSOHV�DQG�VDPSOHV�RI�FRPSOLFDWHG�VKDSH
Two sample approximations have been discussed, one where the sample is close to infinitely
thick and the other where the sample is very thin, in terms of the mean free paths of the gamma
radiations. For other configurations the situation is much more complicated, ie, thick samples where
there is still a significant probability of a photon emitted from the far surface of the sample reaching the
detector, and samples where the shape is complicated, so that the assumption that the radiation field is
fairly uniform over the surface no longer holds.
One particularly obvious and common example of both situations is the steel “I beam”, used
in building structures. Typical sizes are depths up to 0.5 m and web thicknesses of 20 mm. Steel with
a thickness of 20 mm has a transmission of approximately 60% for 60&R� �radiations and 50% for137Cs (11). Monitoring of such beams can be carried out using modified portable equipment. The
detector should be equipped with a collimator which restricts the influence of radiation incident from
the sides. The limiting factor on the detector size is the maximum weight which a user could be
expected to manipulate in construction site conditions. For example a thickness of 37 mm of lead has
a transmission of 20% for 60Co(11). If a collar of that thickness was placed round a 50 mm detector then
it would have a mass of 1.1 kg per cm of length. It would then just be possible to use a 50 mm x 50 mm
detector with 37 mm shielding around the scintillation crystal with a gradual stepping down of shielding
thickness around the photomultiplier tube, leading to a total detector weight of approximately 12 kg.
Such shielding would essentially limit the detector’s response to the area immediately below
the window.
Compensation for the thickness of the sample can be performed either by calculation or by
actual measurement. The latter is more reliable but it may be administratively unacceptable, because
of the risk of loss of sources under site conditions, and it may also be difficult to place sources reliably
inside such objects as valve cavities. In such cases it may be impossible to perform on site
measurements effectively without cutting the object up into more convenient shapes, with the attendant
potential for spread of contamination and dose uptake.
����� +DQG�KHOG�HTXLSPHQW�ZLWK�VSHFWURPHWHU�FDSDELOLW\
Developments in signal processing power have lead several manufacturers to produce
scintillation detector based instruments with spectrometric capability. These vary from completely self
contained instruments which will acquire spectra and identify contributions from up to 10 nuclides, to
instruments which acquire and store spectra, and require connection to a personal computer for
interpretation. Such instruments are inevitably more expensive and will take longer to make each
measurement, because of the processing involved. However they are extremely useful in checking that
the expected mix of gamma radionuclides has not changed dramatically and that the calculated
maximum acceptable count rates used for the simpler equipment are still valid.
����� &DOLEUDWLRQ�RI�JDPPD�PRQLWRULQJ�HTXLSPHQW
43
Sodium iodide scintillation detectors and other similar devices are simple to set up and
calibrate if they are to be used with only a low energy counting threshold. Their energy detection
probabilities are also well documented. Calibration can be by two different routes. One uses distant
dosimetric sources in a facility designed for the calibration of conventional radiation protection
instruments. The other uses point sources of much lower activity designed for the energy calibration
of spectrometers.
The aim is to demonstrate that
(1)the energy threshold is acceptably low;
(2)the detection efficiencies correspond to the expected values for the detector size;
(3)the response is linear, ie, doubling the number of incident photons of a defined energy doubles the
net count rate;
(4)the background conforms to the expected value.
������� 8VLQJ�GRVLPHWULF�VRXUFHV
For most purposes an energy threshold of approximately 40 keV will be suitable. This gives
a suitable factor above system noise and there is no real point going to a lower threshold as the
attenuation of gamma radiation rises very rapidly for most materials below 60 keV. This can be
achieved using a dosimetric 241$P� �VRXUFH��ie, one designed to generate 60 keV photons only, and
increasing the detector supply voltage until it is just on a plateau. For typical detector sizes of
50 mm x 50 mm and typical source activities of 0.4 GBq a very large source to detector distance will
be required, of approximately 10 metres, to avoid generating very high count rates. For many of these
sources the measured quantity will be air kerma rate in *\�K-1. This can be converted to photons
cm-2 s-1 by dividing the value in *\�K-1 by the appropriate value given in ICRP publication 74(12) for
the air kerma per unit photon fluence. Even at distances of 10 metres the radiation intensity in a well
designed facility should obey the inverse square law as the air absorption is low, ≈ 1 % m-1 and hence
it should be sufficiently accurate to calculate the dose rate at, for example, 10 m based on the most
distant measured dose rate. The detection efficiency for a good crystal should be very close to 100%
for 241Am photons.
The instrument should then be exposed to collimated beams of 137Cs and/or 60&R� �radiations
and the expected detection efficiencies confirmed. Again, using data from ICRP publication 74(12),
1 *\� K-1 air kerma is equivalent to 80 and 54 photons cm-2 s-1 for 137Cs and 60&R� � radiations
respectively. The measured responses should confirm to the expected values. A suitable reference is
Figure 10.22 of Knoll (see Bibliography). The measurement should be repeated at another dose rate
to confirm the linearity of the instrument. Dose rates of less than 1 *\�K-1 are required for 50 mm x
50 mm detectors. The background count rate should also be determined.
If a measurement of total (gamma + cosmic) dose rate is available this should be multiplied
by the 60Co or 137Cs response factors for the scintillation detector and the results compared with the
measured background count rate. Agreement within a factor of 2 is to be expected.
������� 8VLQJ�HQHUJ\�FDOLEUDWLRQ�VRXUFHV
Calibration using these sources is rather simpler, simply because of their relative ease
of manipulation.
Again the threshold should be set in the region of 40 keV. There is an additional complication
in the use of a 241$P�SRLQW�VRXUFH�LQ�WKDW�WKH� �HPLVVLRQV�DW����keV and the x ray lines in the 13 to
20 keV region will also be present(7), unlike in the dosimetric source where the greater thickness and
44
encapsulation will normally virtually eliminate them. Care should be taken to ensure that the first count
plateau is used, as the high voltage is increased. The detection efficiency should be close to 100% in
terms of the probability of detecting a 60 keV photon striking the detector.
Normally if the threshold is set at a much lower energy the background count rate will be
higher than expected.
Measurements should also be made with 137Cs and 60Co point sources and the results
compared with the expected values. Note that there may be a contribution of a few per cent from the
K x ray lines from 137Cs in the 31 to 36 keV range, a small proportion of which will be counted if the
effective threshold is close to 40 keV.
Measurement of linearity can be confirmed by making measurements at two distances. Very
close approach to the detector should be avoided as the detection probability will rise when the detector
subtends a large solid angle because of the increase in mean path through the crystal.
For instruments with gated systems it will be essential to set up each window to correspond
to the photopeak of the radiation of interest. Portable equipment may well not have good energy
linearity, ie, the photopeak for 137Cs (662 keV) should correspond to a pulse amplitude approximately
11 times that of 241Am (60 keV) but it may, in practice, be much lower. There is a balance between
energy linearity and power consumption which makes it difficult for manufacturers to offer both
spectrometric standards of energy linearity and good battery life.
7.4 Problems associated with the use of scintillation detectors and photomultipliertubes
The two main problems are damage to the crystal and the influence of magnetic fields.
Sodium iodide is a relatively brittle material with a strong hygroscopic tendencies. Rapid changes in
temperature and mechanical shock can lead to fracture of the crystal, effectively reducing the detector
volume and the light detection efficiency. Holes in the can around the crystal will allow the entry of
water vapour, generating areas of hygroscopic degradation, in the shape of pockets of yellow powder.
These lead mainly to a reduction in collection efficiency causing a change in effective threshold. It is
important to protect these detectors as well as possible and to arrange regular checking of performance
using 241$P� �UDGLDWLRQ�����keV).
Magnetic fields can also influence the effective threshold of an instrument, by defocusing the
electron beam in the photomultiplier tube which reduces the gain. Well designed instruments have a
mu metal shield around the detector, which acts as a magnetic short circuit, but inevitably protection
is not perfect and the point will be reached where the performance of the instrument is affected.
Monitoring close to surfaces of objects that are intentionally magnetic will always be a problem.
However it is also common for large steel beams to have significant magnetic fields associated with
their manufacture. If there is any doubt that the instrument’s performance has been affected then it
should be checked by fixing a small 241Am source close to the detector. The count rate due to the
source should not change significantly when the detector is moved over the object to be monitored.
This shows that the effective energy threshold is still less than 60 keV. If it does then the results of
monitoring may be in doubt.
If strong magnetic fields are likely to be a problem then a possible solution is the use of a
caesium iodide scintillator coupled to a large area PIN diode. The combination has a higher effective
noise level but this will not drastically affect counting efficiencies for high energy gamma emitters.
Caesium iodide is also a much tougher material, resistant to fracture, and is much less hygroscopic.
45
7.5 Monitoring of specific activity using installed equipment
Monitoring using installed equipment offers both advantages and disadvantages over
monitoring with portable equipment. The advantages are that detectors can be larger, a wider range of
detector types can be employed, shielding and collimation is much easier and the available electronic
processing power is much greater. The disadvantages are that the equipment is much more expensive
and that the objects to be monitored have to be transported to the monitoring station. Inevitably, then,
some in situ monitoring will have to be performed on materials before they are consigned.
����� &RQYH\RU�EHOW�PRQLWRULQJ�XVLQJ�VRGLXP�LRGLGH�VFLQWLOODWLRQ�GHWHFWRUV
Conveyor belt monitoring is very attractive when large quantities of waste are to be processed
which can easily be broken up into relatively small pieces. In such cases the detectors can be large
pieces of sodium iodide scintillator, for example, 75 mm x 125 mm x 400 mm. One detector is
normally placed above the belt across the line of motion of conveyor belt and one beneath it. This
arrangement minimises the effects of self attenuation within the material and also reduces the influence
of height variations in the sample dramatically, as the increase in solid angle subtended by the upper
detector produced by a vertical displacement off the conveyor belt will be virtually balanced out by the
reduction for the lower detector. The detector can be extremely well shielded with the additional effect
that the back shielding for one detector also acts as a shadow shield for the opposing detector.
The detectors are then normally connected to a multichannel analyser. This provides
information on the artificial activity within the sample but also provides a much larger degree of
rejection of signals produced by naturally radioactive elements. A very important example is the
609 keV line from 214Bi which is relatively close to the 662 keV line from 137Cs. Note that scintillation
detectors have relatively poor energy resolutions, typically of approximately 10% full width at half
maximum, which limits their ability to discriminate between energies, especially at low total counts
from each energy.
The detectors can be temperature stabilised to a high degree. This is normally performed by
placing a small source within the detector envelope, often 241Am used as a gamma emitter. The high
voltage applied to the detector is controlled to give a particular ratio of counts between two adjacent
counting windows. The only problem with the technique is that the presence of the stabilisation source
reduces the detection ability for that nuclide dramatically.
The loading depth and conveyor speed is chosen to comply with any restriction on averaging
mass and also to produce acceptable uncertainties caused by self absorption within the sample. It is
possible to generate direct data on sample absorption by placing a relatively active source on one side
of the belt with a detector on the other between the conveyor loading hopper and the activity monitoring
station. The output from this unit can be used to correct the apparent measured contamination level.
The load on the conveyor can also be measured in mass per unit length which can also be correlated
with the monitoring results to give a relatively accurate activity concentration.
The measurement process on the conveyor is a continuous one, unlike many of the other
measurements described in this report where the detector is placed on a sample and its indication noted.
The measurement integration time should be chosen to correspond with the time for which a particular
part of the sample is in view as it passes along the conveyor under the collimator. This ensures that a
particular measurement corresponds to an identifiable volume of sample.
With the detectors suggested it will be possible to measure 137Cs at a level of 0.1 Bq g-1 in low
background activity material using a 5 second monitoring period, and a collimator viewing
approximately 30 cm of the conveyor belt length. Conveyor belt speed would then be approximately
46
3 metres per minute, giving a throughput of the order of 300 kg per minute. Similar results would apply
IRU�RWKHU�HQHUJHWLF� �HPLWWHUV��DIWHU�PDNLQJ�DOORZDQFH�IRU�GHFD\�SUREDELOLWLHV�
The conveyor belt can be controlled to sort the material into 3 volumes; the definitely
acceptable, material on either side of the acceptable level and the unacceptably contaminated. The
centre volume could be run through again at a slower speed, which would increase the precision of the
measurement and reduce the volume of material which is not acceptable for reuse.
����� &RQYH\RU�EHOW�V\VWHPV�XVLQJ�SODVWLF�VFLQWLOODWRUV
In some circumstances large volumes of waste need to be processed where it is expected that
there is no actual contamination or activation. For materials which have a low inherent background
level, such as some concrete, then a significant saving in money and complexity can be produced by
using very large plastic scintillators as the detectors. These scintillators are quite efficient, in the sense
that the probability of a gamma photon passing through the detector without interacting is low. For
example for a 10 cm path length in plastic the probability of 137Cs and 60Co photons escaping without
detection are 40% and 50% respectively. However spectrometry is not feasible because it is unlikely
that the full energy of an energetic photon will be deposited. Photoelectric interactions are unlikely,
and the attenuating properties of the materials do not rise rapidly as the photon energy decreases, unlike
sodium iodide and germanium. Hence Compton scattered photons may well escape from the detector,
either directly or after another interaction.
Scintillator volumes of 10s of litres are possible, giving a factor of increase over a typical
large sodium iodide detector of a factor of 10. The material is much tougher and is not susceptible to
water damage. It is also much more resistant to rapid temperature changes.
,Q�D�FRQYH\RU�EHOW�V\VWHP��ZLWK�UHODWLYHO\�ORZ�EDFNJURXQG�PDWHULDO��WKHQ�HQHUJHWLF� �HPLWWHUV
can be detected at levels of 0.1 Bq g-1 at the same conveyor belt speed etc used earlier.
7.6 Monitoring for emissions using semiconductor detectors
����� 7KH�SURSHUWLHV�RI�VHPLFRQGXFWRU�GHWHFWRUV
The method of choice for situations where a wide range of nuclides may be present is the
intrinsic germanium semiconductor spectrometer. These devices have the ability to determine the
energy of gamma emissions with great accuracy and to separate effectively emissions of very similar
energy. In this way they are superior to sodium iodide based equipment, which has a much poorer
energy resolution.
They are inferior to sodium iodide and other scintillation equipment in some ways. It is not
possible to produce single detectors of very great size. The atomic number of germanium is lower than
that of iodine leading to a lower probability of photoelectric interaction. Current technology can offer
crystals which have 1.5 times the 60Co photopeak detection efficiency of a 76 mm x 76 mm sodium
iodide detector. (Sodium iodide crystals are routinely available with 20 times that efficiency.) They
are also more expensive, require a more sophisticated preamplifier and have to be operated at low
temperatures. This requires either an electrical refrigerator or a supply of liquid nitrogen. The cooling
system inevitably adds bulk to the system and the detectors are also susceptible to vacuum leaks, leading
to a loss of insulation and a rise in liquid nitrogen consumption.
Inevitably, then, the decision on which type of spectrometric equipment to employ requires
the balancing of the metrological advantage of the intrinsic germanium detector with the lower cost and
greater convenience of the scintillation detector.
47
Knoll (see Bibliography) gives a comprehensive description of the physics of these detectors,
and the various factors which should be taken into consideration when selecting a detector. Given the
importance of these detectors, however, the main conclusions are summarised here.
������� (QHUJ\�UHVROXWLRQ
The energy resolution of a good germanium based system designed for high energy gamma
monitoring is typically 2 keV at 1.33 MeV, one of the 60Co lines, ie, approximately 0.2%. This can be
compared with a typical value for sodium iodide of 7%. Both these values approach the theoretical
limit, derived from the number of holes and electrons generated in the germanium crystal and the
number of photoelectrons generated in the photomultiplier tube connected to the scintillator.
������� 3HDN�WR�&RPSWRQ�UDWLR
Germanium has a relatively low atomic number (32) and hence the probability of a
photoelectric interaction is correspondingly lower than that for iodine (53). Events corresponding to
a full energy peak are much more likely to be based on multiple Compton scattering followed by
photoelectric absorption of the scattered photon. However, for comparable sizes or efficiencies a
greater fraction of all detected event will be in the Compton continuum. The improved spectrometric
characteristics do give rise to a much more faithful reproduction of the Compton edge. Peak to
Compton ratios are often quoted for detectors. This is defined as the ratio of the count in the highest
photopeak channel to the count in a typical channel of the Compton continuum associated with that
peak. Normally the 1333 keV line from 60Co is compared with the average count in the 1040 to
1096 keV region. Typical values range from 30 to 60. This high value illustrates that the very high
energy resolution more than compensates in many circumstances for the relatively low photopeak
detection probability.
������� (VFDSH�SHDNV
Escape peaks play a much more important role in germanium detectors than sodium iodide
detectors because of the much higher probability that a germanium characteristic x ray may escape from
the detector. This can lead to a small peak 11 keV below the main peak, and is particularly obvious for
low energy lines.
The effect is even more prominent for very high energy interactions, where pair production
generates a position which can combine with an electron, generating two 511 keV photons. One or
both of these can escape, leading to two peaks 511 keV and 1022 keV below the main peak.
In addition 511 keV photons from outside may also be detected, giving a prominent 511 keV
peak. Such high energies are not normally a problem in decommissioning because of the short half life
RI�KLJK�HQHUJ\� �HPLWWHUV���+RZHYHU�WKH�GHFD\�SURGXFWV�RI�226Ra, which can be an important component
of any natural activity present, have energies up to 2.45 MeV, and will generate these effects.
������� 3UHGLFWLRQ�RI�UHVSRQVH
Sodium iodide detectors are generally manufactured in a limited range of sizes, the
characteristics of which are well documented. Intrinsic germanium detectors are made in a wider range
of shapes and sizes and the most effective way of determining a particular detector’s characteristics is
normally by using a Monte Carlo based code, eg, MCNP. A limited series of measurements is used,
essentially, as input data leading to a prediction of response over the detector’s operating range. This
cuts the cost of detector commissioning.
48
����� 0RQLWRULQJ�DSSOLFDWLRQV
������� )LQJHU�SULQWLQJ
The merits of the germanium and sodium iodide detectors can frequently be combined by
finger printing materials. In this technique samples are taken of the material of interest and assessed
�XVLQJ�D�JHUPDQLXP�GHWHFWRU�IRU�WKH� �HPLWWHUV�DQG�DQ\�DSSURSULDWH�WHFKQLTXHV�IRU�WKH� �DQG� �HPLWWHUV
(see section 7.9). This generates a detailed record of the emitters present. The contents can be assessed
DQG�D�OLPLW�FKRVHQ�IRU�D�SURPLQHQW� �HPLWWHU��LQ�%T�J-1, based on the total radioactive content. Sodium
LRGLGH�EDVHG�HTXLSPHQW�FDQ�EH�XVHG�WR�DVVHVV�WKH�HIIHFWLYH�DFWLYLW\�RI�VDPSOHV�E\�JDWLQJ�LW�RQ�WKDW� �OLQH
and setting the rejection level at an appropriate point. Hence the higher precision, higher cost
equipment can be used to control a larger number of simpler, operationally more convenient, units.
A regular sampling programme is required either to demonstrate that the original nuclide mix
is being maintained or to correct the setting of the sodium iodide equipment. Changes in nuclide mix
can occur, for example, as a result of the change in neutron spectrum with distance from a reactor giving
rise to different nuclide ratios in a steel beam.
������� 'UXP�VFDQQHU
Drums holding 200 litres are frequently used to hold materials such as soil or metal swarf
from a size reduction exercise. A typical use for germanium detector is in a drum scanner. This
comprises a detector, provided with a collimator, which is mounted close to a drum, mounted on a
turntable. The collimator is designed so that it sees, typically, about 10% of the height of the drum.
The drum is rotated and spectral data generated for the first segment. The detector is then lifted, so
that the detector is viewing the adjacent disc shaped segment of the drum. This process is repeated until
the entire drum has been scanned. The segments are analysed in turn and a complete inventory of the
contents generated. This technique is thus capable of measuring total activity and of identifying any
excessively high activity volumes within the drum.
Self absorption within the drum is important for all barring low atomic number, low density
materials. Corrections can be applied based on average waste density, or differential absorption, in
which the correction is derived from the difference in apparent activity of a particular nuclide derived
IURP�GLIIHUHQW� �HQHUJLHV�HPLWWHG�E\�WKDW�QXFOLGH��RU�E\�D�WUDQVPLVVLRQ�VRXUFH�PHDVXUHPHQW�LQ�ZKLFK�WKH
attenuation of an external source is used to generate a correction.
The performance of such a system depends on the detector size and the number of segments.
Larger detectors and a more open collimator will generate either faster answers or a lower limit of
detection. For a drum filled with low density material (0.2 g cm-3) one manufacturer quotes a detection
limit of:
239Pu 0.2g, 5 J�J-1
137Cs 5 → 10 kBq, 0.13 → 0.26 Bq g-1
60Co 5 → 10 kBq, 0.13 → 0.26 Bq g-1
This assumes a 30 minute monitoring time and a 30% efficient detector, and is without any
shielding around the drum.
A similar system can be constructed inside a completely shielded enclosure built from low
background steel, and employing multiple detectors. Typical performance for a 10 minute counting
time and three 20% germanium detectors is given below in Table 23.
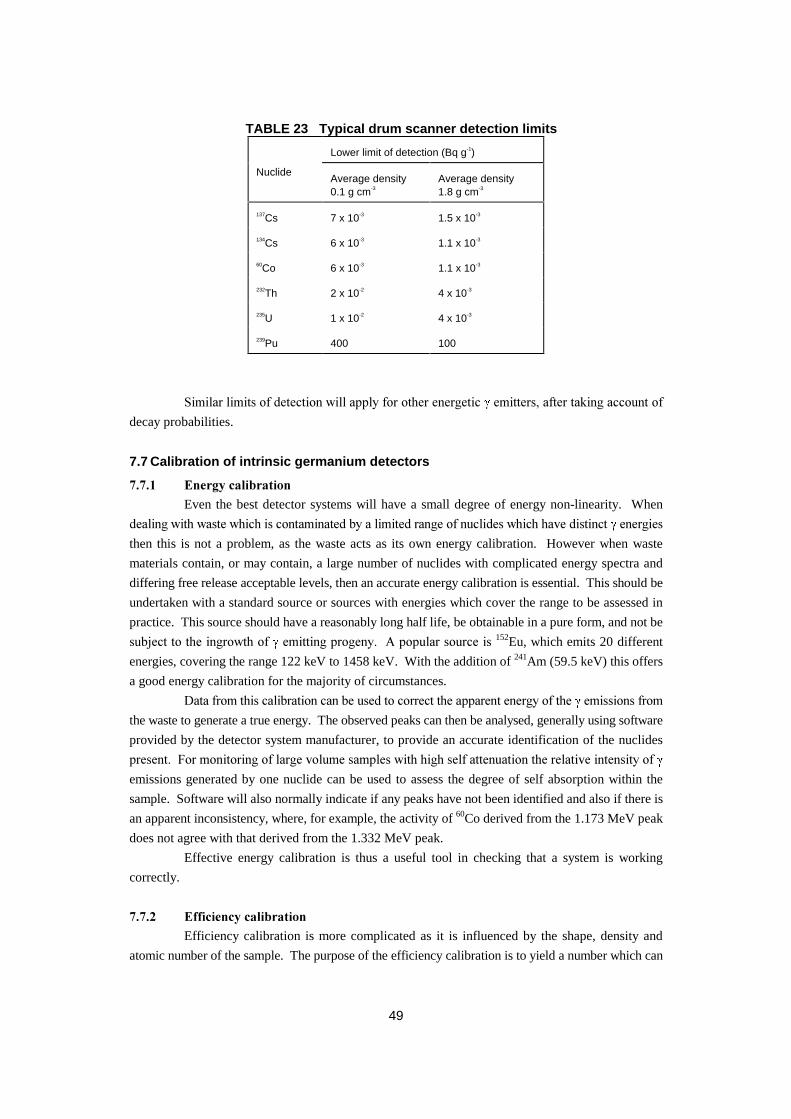
49
TABLE 23 Typical drum scanner detection limits
Lower limit of detection (Bq g-1)
NuclideAverage density0.1 g cm-3
Average density1.8 g cm-3
137Cs 7 x 10⁻³ 1.5 x 10⁻³
134Cs 6 x 10⁻³ 1.1 x 10⁻³
60Co 6 x 10⁻³ 1.1 x 10⁻³
232Th 2 x 10⁻² 4 x 10⁻³
235U 1 x 10⁻² 4 x 10⁻³
239Pu 400 100
6LPLODU�OLPLWV�RI�GHWHFWLRQ�ZLOO�DSSO\�IRU�RWKHU�HQHUJHWLF� �HPLWWHUV��DIWHU�WDNLQJ�DFFRXQW�RI
decay probabilities.
7.7 Calibration of intrinsic germanium detectors
����� (QHUJ\�FDOLEUDWLRQ
Even the best detector systems will have a small degree of energy non-linearity. When
GHDOLQJ�ZLWK�ZDVWH�ZKLFK�LV�FRQWDPLQDWHG�E\�D�OLPLWHG�UDQJH�RI�QXFOLGHV�ZKLFK�KDYH�GLVWLQFW� �HQHUJLHV
then this is not a problem, as the waste acts as its own energy calibration. However when waste
materials contain, or may contain, a large number of nuclides with complicated energy spectra and
differing free release acceptable levels, then an accurate energy calibration is essential. This should be
undertaken with a standard source or sources with energies which cover the range to be assessed in
practice. This source should have a reasonably long half life, be obtainable in a pure form, and not be
VXEMHFW�WR�WKH�LQJURZWK�RI� �HPLWWLQJ�SURJHQ\���$�SRSXODU�VRXUFH�LV�152Eu, which emits 20 different
energies, covering the range 122 keV to 1458 keV. With the addition of 241Am (59.5 keV) this offers
a good energy calibration for the majority of circumstances.
'DWD�IURP�WKLV�FDOLEUDWLRQ�FDQ�EH�XVHG�WR�FRUUHFW�WKH�DSSDUHQW�HQHUJ\�RI�WKH� �HPLVVLRQV�IURP
the waste to generate a true energy. The observed peaks can then be analysed, generally using software
provided by the detector system manufacturer, to provide an accurate identification of the nuclides
SUHVHQW���)RU�PRQLWRULQJ�RI�ODUJH�YROXPH�VDPSOHV�ZLWK�KLJK�VHOI�DWWHQXDWLRQ�WKH�UHODWLYH�LQWHQVLW\�RI�
emissions generated by one nuclide can be used to assess the degree of self absorption within the
sample. Software will also normally indicate if any peaks have not been identified and also if there is
an apparent inconsistency, where, for example, the activity of 60Co derived from the 1.173 MeV peak
does not agree with that derived from the 1.332 MeV peak.
Effective energy calibration is thus a useful tool in checking that a system is working
correctly.
����� (IILFLHQF\�FDOLEUDWLRQ
Efficiency calibration is more complicated as it is influenced by the shape, density and
atomic number of the sample. The purpose of the efficiency calibration is to yield a number which can
50
be used to relate the height of a photopeak above the underlying continuum to a specific activity in a
real sample.
Standards are readily available in the form of a small deposit on a very thin backing material.
These approximate closely to a point source. For large volume samples, such as water and soil,
calibration standards are available for a range of nuclides in the form of a Marinelli beaker. This is a
beaker which fits closely over the end cap of the detector. There is a range of standard sizes.
However, the situation for practical samples encountered during decommissioning is
generally more complicated. Typical samples include drums, beams and pipes. The best option in these
circumstances is to use a detector with known point source efficiency, generally derived using a mixture
of measurement and calculation, and a calculated correction factor, based on the size, shape, density
and atomic number of the sample. Monte Carlo based programmes, such as MCNP, can be used to
derive such correction factors. Generally these are derived for a limited series of sample geometries
and compositions and then each sample is either assumed to conform to one of that series or, for
complicated shapes, is cut up and packaged into a form which conforms to one of the series. It is this
last step which generally generates the largest uncertainty in the monitoring process.
7.8 Assessment of transuranic waste
For the majority of WUDQVXUDQLF�PDWHULDOV� �PRQLWRULQJ� LV�QRW�DGHTXDWH� WR� DOORZ� WKH� IUHH
release of potentially contaminated materials. A notable exception is 241Am but even then the 59.5 keV
�HPLVVLRQ�LV�UDSLGO\�DWWHQXDWHG�E\�HYHQ�WKLQ�VWHHO�VKHHW�RU�RQH�RU�WZR�FP�RI�FRQFUHWH�
Two techniques using neutrons offer some assistance but even these will not generally permit
the free release of materials, and hence strictly do not fall within the remit of this document. The
simplest technique uses passive neutron counting. This employs an array of 3He filled proportional
counters around the drum. These counters are very efficient detectors of thermal neutrons but the
efficiency falls rapidly, approximately as the square root of the energy, as the neutron energy increases.
To compensate for this the detectors are generally imbedded in polyethylene slabs, which moderate the
energetic neutrons and increase the overall detection efficiency. Typical sensitivities for a 200 litre
drum and a 1000 second counting time are of the order of 1 mg of 240Pu. Note, too, that it is only those
nuclides which exhibit spontaneous fission which are detected, along with a small number of neutrons
JHQHUDWHG�E\�� ��Q��UHDFWLRQV���,W�LV�WKXV�HVVHQWLDO�WR�KDYH�VRPH�NQRZOHGJH�RI�WKH�UDWLRV�RI�WKH�YDULRXV
plutonium isotopes before the activity of these isotopes can be assessed. For a low density drum
(0.2 g cm-3), this leads to an overall detection efficiency for 239Pu of the order of 60 Bq g-1, well above
the acceptable level for material which can be freely recycled.
Active neutron techniques involve irradiating the sample in question with an intense neutron
source, either 252Cf spontaneous fission, or an accelerator. This causes a proportion of the uranium and
transuranic materials to fission. The external neutron source is shielded and the delayed neutrons
generated by the sample are counted using the same detector arrangement as in the passive mode.
Typical minimum detectable quantities are of the order of 20 mg of 235U in a 200 litre drum filled with
paper and 60 mg of 235U in a drum mainly containing iron. These correspond to activities of
approximately 0.04 and 0.0002 Bq g-1 235U.
The two modes, active and passive counting, can be combined to give an estimate of the total
spontaneous fission and fissionable isotopes in a container.
7.9 Radiochemical techniques
51
As has been demonstrated in the previous sections there are several nuclides which are
difficult to monitor either as a surface contaminant or as a bulk contaminant, for example 3H and 241Pu.
Such radionuclides can often be assessed by radiochemical methods. These are much slower and more
expensive than direct methods, because of the much longer preparation time before counting.
The first step is the chemical separation of a sample to isolate or concentrate the desired
chemical species. This has two advantages. The more obvious is that it increases the specific activity
of the material to be monitored but sometimes the more important one is that radionuclides which emit
interfering radiations which could compromise the counting process are removed. The initial step is
generally to dissolve the sample. Separation of the chemical species of interest can then be achieved
using ion exchange, chelating techniques, precipitation and solvent extraction. Alternatively, for 3H,
the sample can be oxidised and the resulting tritiated water can be condensed, or synthesised into an
organic compound for scintillation counting or a gas for proportional counting. The resulting product
can then be counted using either the detectors considered earlier or by liquid scintillation counting.
7KLV�WHFKQLTXH�LV�SDUWLFXODUO\�VXLWDEOH�IRU�ORZ�HQHUJ\� �QXFOLGHV�LQ�WKDW�WKH�PDWHULDO�WR�EH
analysed is dissolved in the scintillator material. This immediately avoids the problems associated with
window attentuation. The scintillator material normally comprises a solvent and one or two
scintillators. The second scintillator absorbs radiation from the first scintillator and re-emits it at
another wavelength. This is often necessary either because the solvent absorbs the light from the
primary scintillator and/or because the wavelength of the light from primary scintillator does not match
the response characteristics of appropriate photomultiplier tubes. Common solvents include toluene
and p-xylene, and common scintillators include 2, 5 - diphenyloxazole (PPO) as a primary and 1, 4 -
bis - (2 - (2 - (5 - phenyl - oxazolyl)) - benzene (POPOP) or p - bis - (o - methylstyryl) - benzene
(bis-MSB) as secondary scintillators. Primary scintillators are used in concentrations of 4 to 10 g / litre
of solvent, with secondary scintillators at about 1 g / litre of solvent.
The light output from the scintillator depends on the energy absorbed from the radioactive
decay but is generally reduced by the phenomenon of quenching. The presence of the sample and any
carrier reduces the efficiency of the conversion process from ionising radiation to useful light. The
GHJUHH�RI�TXHQFKLQJ�LV�RIWHQ�DVVHVVHG�E\�EULQJLQJ�DQ�H[WHUQDO� �VRXUFH��VXFK�DV�137Cs, up next to the
sample, measuring the light output, subtracting the light output produced by the sample itself and using
this net output to derive a quenching factor. This is then used to correct the sample output.
Liquid scintillation counting is often used for the simultaneous assessment of 3H and 14C,
with the bulk of the 14C signal appearing in a higher window, and the bulk of the 3H signal in a lower
window.
Liquid scintillation counting is capable of very low level measurement because the materials
involved, such as the solvents, scintillators, counting vials and photomultiplier tubes, can be obtained
with very low levels of radioactivity and also because the system can be effectively shielded.
Coincidence techniques are often used whereby a count is registered only when it has been detected
simultaneously by two photomultiplier detectors mounted at 90°. This reduces the background due to
events in the photomultiplier itself.
The subject is discussed in detail in NCRP report 58 (see Bibliography).
An excellent summary of typical lower limits of detection, and cost per sample (USA 1994)
is given in reference 13 for soil samples, from which the following data (Table 24) has been abstracted.
TABLE 24 Radiochemical detection capabilities
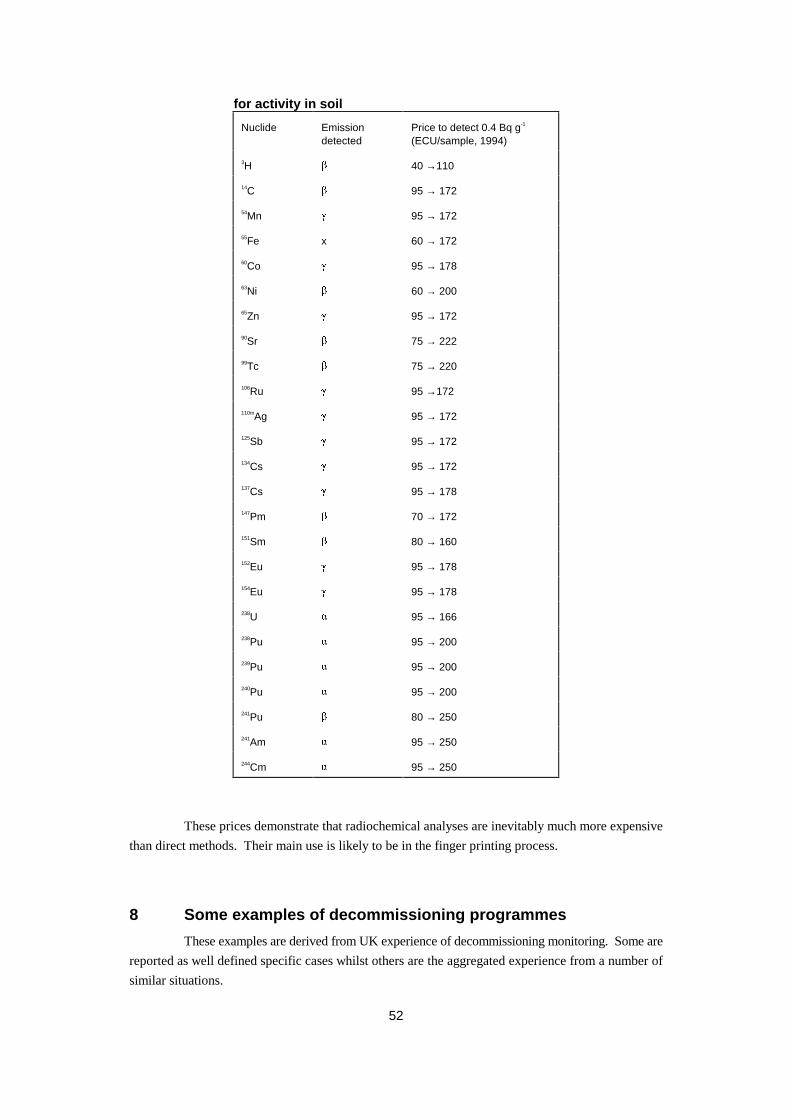
52
for activity in soil
Nuclide Emissiondetected
Price to detect 0.4 Bq g-1
(ECU/sample, 1994)
3H 40 →110
14C 95 → 172
54Mn 95 → 172
55Fe x 60 → 172
60Co 95 → 178
63Ni 60 → 200
65Zn 95 → 172
90Sr 75 → 222
99Tc 75 → 220
106Ru 95 →172
110mAg 95 → 172
125Sb 95 → 172
134Cs 95 → 172
137Cs 95 → 178
147Pm 70 → 172
151Sm 80 → 160
152Eu 95 → 178
154Eu 95 → 178
238U 95 → 166
238Pu 95 → 200
239Pu 95 → 200
240Pu 95 → 200
241Pu 80 → 250
241Am 95 → 250
244Cm 95 → 250
These prices demonstrate that radiochemical analyses are inevitably much more expensive
than direct methods. Their main use is likely to be in the finger printing process.
8 Some examples of decommissioning programmes
These examples are derived from UK experience of decommissioning monitoring. Some are
reported as well defined specific cases whilst others are the aggregated experience from a number of
similar situations.

53
8.1 Removal of a pneumatic tube transport mechanism
This mechanism had been used to transport specimens rapidly from a materials test reactor,
where they had been neutron activated, to analysis facilities elsewhere on site. Use of the mechanism
had ceased several years before. This was a relatively attractive project because
: the route of the pipe was well known.
: the pipe was relatively close to ground surface.
: the pipe ran mostly through areas where excavation was easy, ie, under open grass areas.
: the material, copper, is relatively valuable.
: the pipe had not been used for several years and an assessment of the possible contaminants
showed that 60Co was the only likely problem.
0RQLWRULQJ�DVSHFWV
It was possible to perform all the measurements using only one instrument, a 51 mm x 51 mm
sodium iodide detector connected to a scaler ratemeter. The initial measurements involved walking the
route of the pipe with the instrument held at ground level in the ratemeter mode. This was intended to
identify the presence of any hot spots, ie, the presence of any really active particles within the pipe.
Limits of detection were estimated to be approximately 40 MBq, when buried at a typical depth of 1 m.
None was found.
The ground was then excavated to reveal the pipe. The monitor was then scanned along and
in contact with the pipe, again in the ratemeter mode. This was intended to identify 60Co particles in
excess of 5 kBq. The pipe was then disconnected, the open end sealed on both the off cut and the
remaining section and the 2 m length lifted out and placed on tressels. Agreement had been reached
with the relevant regulatory body to allow sentencing in 2 m lengths. This was performed by setting
the instrument to integrate for 100 seconds and then moving the detector back and fore over the full
length of the pipe. The result was then compared with the local background. The acceptable maximum
level was set at 0.4 Bq cm-2 which corresponded to a net count of 1200 above a typical background of
7000. Problems which were encountered were mainly caused by having to work in areas of enhanced
gamma doserate, generated by other site facilities. This caused the background count to go beyond
9999, the maximum that the instrument could display. In these circumstances the lowest accessible
background area was selected and the time taken for the instrument to reach 9999 noted. This was
displayed automatically. The measurement was then repeated with the pipe to be monitored and the
time to 9999 again noted. The net count rate was then calculated and compared to the release value.
Obviously the statistical uncertainty was increased using this technique but no operational problems
were encountered. The criticism can be levelled that it might have been better to use more sophisticated
equipment but the decision was made to use the simple unit because:-
(1) it is tough, waterproof, and had no external calibration controls.
(2) spare units were available.
(3) the workforce found it easy to use and had confidence in it.
(4) it had a history of use in such operations.
(5) the radiation characteristics were well established.

54
8.2 Clearance of asbestos insulation
Decommissioning of a power station generally involves the removal of large amounts of
asbestos, which has to go to some form of approved waste disposal site. That site may, or may not be,
licensed to handle very low activity radioactive waste. In any case assessment of activity of each bag
of waste is normally performed.
This is a relatively simple task because:-
(1) the likely contaminants can be established and the finger print is likely to contain a significant
SURSRUWLRQ�RI�HQHUJHWLF� �HPLWWHUV���,Q�RQH�FDVH�WKH� �DFWLYLW\�ZDV�DVVHVVHG�DV�����RI�WKH�WRWDO�
(2) the waste will be in sealed bags, which can be weighed.
(3) the density of the material will be low which minimises potential problems from self
absorption.
(4) the outside of the bags will be clean.
(5) WKH�EDJV�FDQ�EH�ILWWHG�LQ�D�VWDQGDUG�VPDOO�LWHPV�PRQLWRU��JLYLQJ�YLUWXDO��� �PRQLWRULQJ�XVLQJ
thick plastic scintillator, under efficient shielding.
This equipment, used with a counting time of 100 seconds, gave reliable detection of bags
ZLWK�D�PHDQ�DFWLYLW\�RI�HQHUJHWLF� �HPLWWHUV�LQ�H[FHVV�RI������Bq g-1 and hence of a total activity in
excess of 0.4 Bq g-1.
8.3 Monitoring of the inside of fume cupboards and glove boxes
Fume cupboards and glove boxes are normally constructed from impervious materials such
as stainless steel and plastic laminates, which are easy to clean and monitor. Experience shows that
dismantling and decommissioning generally involves the following procedure.
(1) Find any historical data on use, nuclide content and monitoring results. It is important not
to trust very old data as records may not be complete.
(2) Perform an initial probe survey using a probe which is suitable for the expected nuclide mix.
�,Q�PDQ\�FDVHV�D�GXDO� �DQG� �SURSRUWLRQDO�FRXQWHU�LV�WKH�PRVW�VXLWDEOH��ZLWK�D�GXDO� �DQG�
VFLQWLOODWLRQ�SUREH�DFFHSWDEOH�LI�ORZ�HQHUJ\� �HPLWWHUV�DUH�XQOLNHO\�
(3) Any areas which are obviously above background should be monitored using a wipe. This
will provide more robust information on the removable activity.
(4) Clean any areas where the apparent activity is not much above the acceptable level for
release. Confirm by probe and swab.
(5) Identify areas where monitoring is impossible in the assembled structure such as joints and
overlaps. These areas may conceal relatively high levels of activity which can be released
during the dismantling process. One option is to cut these areas off before dismantling, if
possible, or monitor them as soon as access is possible.
(6) Sentencing the resulting material based on the allowed averaging area.
All measurements should be recorded which will give confidence to the relevant regulatory
bodies and to the purchasers. This process will also help identify the point of failure if,
further through the process, an article is found to have a different level of surface activity
from that expected.
55
The process can also be used in situations where there is a mix of nuclides, including
nuclides which are very difficult to monitor directly, such as 63Ni and 3H. Radiochemical analysis,
spectrometry and activation analysis can be performed to a range of samples. If a relatively stable
finger print is obtained then a release level limit can be calculated for the probes and wipe counters
employed.
2QH�LPSRUWDQW�SUREOHP�ZKLFK�FDQ�EH�DQWLFLSDWHG� LV� WKDW�D�SUREH�PD\� LQGLFDWH� WKDW�QR�
activity is present while a wipe may indicate significant levels. Monitoring by probe generally involves
a larger surface to detector separation. Probe windows are thicker and are protected by a denser grill.
The result of these differences is that alpha particles emitted from a surface which has significant self
absorption because of the presence of grease, for example, are likley to be recorded in the beta channel
rather than the alpha.
8.4 Monitoring of equipment used in the handling of 226Ra
Historically large quantities of 226Ra were used in luminising and the preparation of sealed
sources. The crux of the problem, and the difference from the majority of other decommissioning
exercises, is that 226Ra decays to 222Rn, which is a noble gas with a half life of 3.8 days. The decay
products of 222Rn, involving such long half life nuclides as 210Pb, can thus be found a long way from
the nominal work site, leading to long lengths of, for example, contaminated air trunking. It is often
impossible to find out exactly what operations took place in such facilities and what quantities of 226Ra
were used. Large quantities may have been spilled in a fume cupboard and drawn into the ventillation
system. Parts of the facility may have been reconditioned. Hence the absence of activity in one part
cannot be taken to indicate the lack of activity in another.
8.5 Monitoring of scaffold boards and tubes
Decommissioning operations also involve the clearance or sentencing of equipment used in
the operation itself, rather than the products of such operations. Typical of these are scaffold boards
and tubes. For work involving radioactivity, boards should not be made of wood, which is very difficult
to monitor, but of some impervious material, such as aluminium. Scaffold tubes should also be capped
before entry to the site so that the interior can be guaranteed uncontaminated.
Monitoring of such large areas is best done using a very large array of gas flow proportional
counters. The counters should be wider than the width of the greatest object to allow monitoring of the
sides of boards. The length of the array should be chosen by balancing the cost of the equipment
against throughput. For a large operation, where regular monitoring of the equipment is desirable, a
full length double (top and bottom) array may be justified. For smaller operations monitoring in
quarters, ie, top and bottom face for one half, and then repeated for the other half, may be the
most economic.
The equipment can be set up to monitor both alpha and beta activity but inevitably for any
object which is not flat the alpha measurement will be inefficient. The length of each monitoring
element can be chosen to give monitoring areas corresponding to those permitted in relevant
regulations. Each element can be connected to an alarm, which will clearly indicate to the operator
which, if any, segment is contaminated.
Scaffolding boards and tubes are relatively light and 2 people can manipulate them easily.
Consideration should be given as to whether automatic identification by bar code has merit although
the rough usage involved in demolition and clearance may well preclude it.

56
8.6 Monitoring of steel beams
Large quantities of steel beams can be expected during the demolition of any large structure.
In some areas it will be easy to calculate that activation is insignificant and that surface contamination
is unlikely. In other areas, particularly with early reactors where significant neutron exposure of steel
outside the pressure vessel and biological shield may have occurred, then activation is possible.
Steel beams are very heavy and in most circumstances it will be better to fix the beam and
move the monitoring equipment along it. Suitable techniques would involve sodium iodide
spectrometry to identify activation products such as 60Co, combined with gas flow proportional
counters mounted in an array giving a good view of the whole surface of the beam for the monitoring
of contamination.
Rates of monitoring could be up to one metre per minute using large area proportional
counters and large volume sodium iodide detectors.
For this sort of operation the beam has to be uniform, which means that rivetted and welded
joints will have to be cut off and treated separately. Again the problem arises that overlaps are difficult
to monitor if the possibility exists of unacceptable levels of activity within the overlap.
Another problem which may be encountered is if the steel has been painted after the facility
has been in use. Paint will mask low energy beta emitters very successfully (see section 6.4) and, in
common with many circumstances, removal of paint may be necessary in order to allow clearance
monitoring. However, in areas where fingerprinting indicates that energetic beta emitters will generally
be present it may be possible to set an initial reject level on the basis of the calculated response for the
monitor at the limiting level with the maximum thickness of paint expected. Beams which fail this
criterion can be stripped and re-monitored. Build up of data from this process may allow the relaxation
of the initial reject level for areas where there is no reason to suspect gross non uniformity
of deposition.
8.7 Decommissioning of a gaseous diffusion plant
Gaseous diffusion plants are very attractive targets for decommissioning operations. They
tend to use large quantities of potentially valuable materials such as aluminium, nickel and stainless
steel. Activation is not a problem. The radionuclides present are generally well known and monitoring
during repair and maintenance operations will give a useful historical background. Plants tend to be
composed of large numbers of very similar units. Hence it is possible to start the process with a
reasonable expectation of the problems and to build up knowledge relatively quickly.
Monitoring of large simple surfaces is easy, either by hand or automatically. The main
problem in components like process vessels is the presence of welds. The material being processed is
gaseous and tends to penetrate welds. Cleaning on shut down is normally very effective for exposed
surfaces but not for welds. Hence it is possible to have a clean surface covering a contaminated volume.
The implication of this is that welds must either be split and monitored or cut off and treated separately.
Dealing with valves and other small components is more difficult. An attractive technique is to cut the
components up to lay surfaces open to wet decontamination in a purpose designed plant and then melt
the resulting cleaned objects. The furnace off gases can be filtered and treated to minimise discharges
to the environment and the resulting ingots monitored for sentencing. This process has
many advantages.
Monitoring of the ingots can generally be done by performing a limited programme of
fingerprinting by radiochemical methods. Data from this process can be used to calculate the response
of a low background alpha and beta counter based on samples of fixed geometry. Counting times of
57
the order of one thousand seconds will generally confirm whether the residual activity in the sample
allows free release, ie, it is less than 1 Bq g-1�WRWDO�IRU� �HPLWWHUV�
The main cost of this process is the installation of the melting plant. The monitoring costs
are relatively trivial. Even if the material produced is not fit for free release the volume has been
reduced and burial will be followed by a much slower release to the environment.
8.8 Monitoring of earth contaminated by leakage from a fuel storage pond
This was a particularly simple situation. Samples of the soil were subjected to gamma
spectrometry and radiochemical analysis. The dominant nuclide was found to be 137Cs and agreement
was established with the regulator that the waste was sentenced on that basis. Measurement was
performed using a simple 50 mm x 50 mm sodium iodide scintillation detector connected to a ratemeter.
Calculation (see 7.3.1) indicated that a response of approximately 200 s-1 Bq-1 g was to be expected
with the probe held close to a large volume of the material. Final calibration of the process was
achieved by filling the loader bucket with a well mixed sample with an average activity established by
gamma spectrometry. Measurements were performed with the scintillation probe on top of the bucket,
where there was no shielding, and in contact with the sides of the bucket, where there was shielding by
the steel wall.
Maximum acceptable count rates for unrestricted release were calculated using these data for
measurements on top and in contact with the side of the bucket.
8.9 Monitoring of the internal and external activity of scaffold poles and process piping
Normally scaffold poles have capped ends welded into place. However, on some older sites,
open poles can be found. These are difficult to monitor either for reuse off site or for recycling because
of the difficulty of confirming that there is no contamination inside the pole. It is possible to some
extent to pull a wipe through the pipe using a wire and then to monitor the wipe. However this is rarely
deemed acceptable by licensing authorities because of the difficulty of interpretation of the apparent
activity on the wipe. Pipes can, of course, be cut into shorter sections which are easier to monitor or,
indeed, cut open length ways. Both these processes are laborious and mean that the pole becomes scrap
metal.
It is possible, however, to monitor a 6 m length of pole as one unit for alpha activity using
the ion chamber detector described in section 6.1.2.5. In a current design the pole is loaded into the
machine, air sucked through and over the pole and the current generated measured. The end of the pole
can then be capped, or a gag valve closed around the pipe, and the process repeated. From this process
two currents can be determined, one generated by any activity within the pipe and the other by activity
on the outside of the pipe. An appropriate calibration factor can be used to derive equivalent total
activities in Bq, with a lower limit of detection of the order of 20 Bq. The process only really works
with poles which are reasonably clean, in the sense of not having obvious loose surface deposits, but
does offer rapid monitoring, with a time of approximately 2 minutes per piece, with a low limit of
detection and acceptable precision.
The same technique can also be applied to process pipework, valves and, with appropriate
adaptors, ducts.
8.10 Monitoring of cable
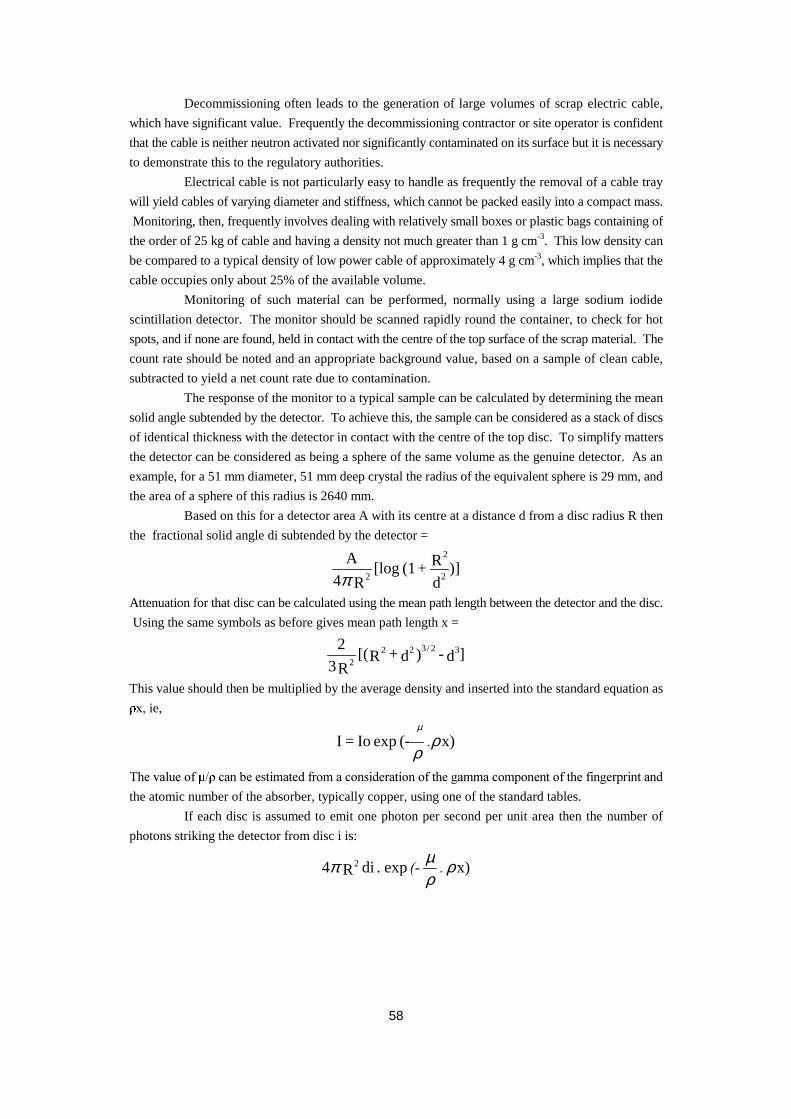
58
Decommissioning often leads to the generation of large volumes of scrap electric cable,
which have significant value. Frequently the decommissioning contractor or site operator is confident
that the cable is neither neutron activated nor significantly contaminated on its surface but it is necessary
to demonstrate this to the regulatory authorities.
Electrical cable is not particularly easy to handle as frequently the removal of a cable tray
will yield cables of varying diameter and stiffness, which cannot be packed easily into a compact mass.
Monitoring, then, frequently involves dealing with relatively small boxes or plastic bags containing of
the order of 25 kg of cable and having a density not much greater than 1 g cm-3. This low density can
be compared to a typical density of low power cable of approximately 4 g cm-3, which implies that the
cable occupies only about 25% of the available volume.
Monitoring of such material can be performed, normally using a large sodium iodide
scintillation detector. The monitor should be scanned rapidly round the container, to check for hot
spots, and if none are found, held in contact with the centre of the top surface of the scrap material. The
count rate should be noted and an appropriate background value, based on a sample of clean cable,
subtracted to yield a net count rate due to contamination.
The response of the monitor to a typical sample can be calculated by determining the mean
solid angle subtended by the detector. To achieve this, the sample can be considered as a stack of discs
of identical thickness with the detector in contact with the centre of the top disc. To simplify matters
the detector can be considered as being a sphere of the same volume as the genuine detector. As an
example, for a 51 mm diameter, 51 mm deep crystal the radius of the equivalent sphere is 29 mm, and
the area of a sphere of this radius is 2640 mm.
Based on this for a detector area A with its centre at a distance d from a disc radius R then
the fractional solid angle di subtended by the detector =
)]d
R + (1 [log R4
A2
2
2πAttenuation for that disc can be calculated using the mean path length between the detector and the disc.
Using the same symbols as before gives mean path length x =
]d - )d + R[( R32 32/322
2
This value should then be multiplied by the average density and inserted into the standard equation as
[��ie,
x)(- exp Io = I ρρ
µ
���
7KH�YDOXH�RI� � �FDQ�EH�HVWLPDWHG�IURP�D�FRQVLGHUDWLRQ�RI�WKH�JDPPD�FRPSRQHQW�RI�WKH�ILQJHUSULQW�DQG
the atomic number of the absorber, typically copper, using one of the standard tables.
If each disc is assumed to emit one photon per second per unit area then the number of
photons striking the detector from disc i is:
x) exp . di R4 2 ρρµπ ������
59
These values can be summed for the stack of discs approximating to the complete volume of the bag
or box. The mean detection efficiency of the detector can be estimated from the response of the
detector in s-1� *\-1 h derived from its calibration at an appropriate energy.
From this, the response of the detector can be determined, at least approximately, in terms
of counts per photon emitted per unit volume which can then be expressed as a count rate corresponding
to the limiting activity in the bag.
There are obvious uncertainties and approximations in this process but it can often be
sufficient to allow recycling of the large volumes of cable which have been in an active area but which
can reasonably be expected to be uncontaminated.
8.11 Monitoring of uranium contaminated plastic covered steel floor plate
Steel floor plate is frequently found in buildings on nuclear licensed sites. On older sites
these floors are occasionally covered with plastic flooring material which has sometimes been laid over,
what was at the time, an acceptable level of contamination. One example concerned a building which
had been used for work with depleted uranium.
The aim was to sentence the waste without removing the plastic floor covering, which was
approximately 2 mm thick and of unit density and which was extremely well stuck down. It is obviously
impossible to monitor the uranium alpha emissions through the significant covering. However 238U will
normally be found in equilibrium with 234mPa, which is an energetic beta emitter with a maximum
energy of 2.28 MeV. There were two aspects to the task.
The first aspect was to connect a large area anthracene based scintillation detector to a gated
ratemeter, ie, one with a selectable counting window. A contaminated sample of the plate was obtained
and the detector set up so that its minimum detectable activity was as low as possible, which in this case
involved narrowing the window to reduce the background upto the point where a significant reduction
in the signal was observed.
The second aspect was that this detector was then calibrated using a uranium source of
known activity covered by a layer of material of the same mass per unit area as the floor covering.
In this manner a monitor was produced which had a background of approximately 2 counts
per second and a response to 1 Bq cm-2 of 238U in equilibrium of 3 counts per second. This allowed
disposal as the surface of the plastic material was uncontaminated and the mass per unit area of the plate
was 3 g cm-2, giving compliance with the suggested 1 Bq g-1 limit.
9 Equipment costs
Equipment costs are an important part of the equation when comparing the cost effectiveness
of attempting free release of material to the costs of on site storage or disposal.
Some examples are given below. A good general rule is that equipment which is in use for
general radiation protection applications is relatively inexpensive whereas equipment which is designed
for a particular application is expensive, especially if the manufacturer considers that further sales are
unlikely. Additional cost considerations are given in Annex A.

60
Instrument Typical cost, 1997
ECU
1 6LPSOH�ODUJH�DUHD� �FRQWDPLQDWLRQ�SUREH�DQG�ratemeter 1,800
2 50 mm x 50 mm sodium iodide scintillation probe and ratemeter
with simple pulse height selection
4,000
3 /DUJH�DUHD��UHILOODEOH��KDQG�KHOG� � �SURSRUWLRQDO�FRXQWHU 3,000
4 6LPSOH� �VSHFWURPHWHU�XVLQJ�D�UREXVW����PP�[����PP�VRGLXP�LRGLGH
scintillation detector and multi channel analyser in a single, hand
held, unit.
15,000
5 High efficiency intrinsic germanium detector and multi channel
analyser with emulation software, as a drum monitor
100,000
6 Set of proportional counters for scaffold board monitor and control
electronics
75,000
7 �PRQLWRULQJ�XQLW�IRU�WXEHV��HWF� Under development
No price availabe
8 %DJ�PRQLWRU�IRU�WKH�PHDVXUHPHQW�RI�JURVV� �DFWLYLW\ 50,000
9 Small article monitor for small pieces of pipe and individual
components
20,000
10 Bibliography
The following references offer general information on the measurement of radioactivity.
They will be found extremely useful in gaining understanding of the physics of measurement of
radioactivity and in the design of a monitoring programme.
1. Radiation Detection and Measurement
2nd Edition
Glen F Knoll
John Wiley and Sons 1989
ISBN 0-471-81504-7
2. A Handbook of Radioactivity
Measurement Procedures
NCRP Report 58
Washington DC 1978
ISBN 0-913392-41-3
61
11 References
1 Recommended Radiological Protection Criteria for the Recylcing of Metals from theDismantling of Nuclear Installations. CEC 1998.
2 Regulations for the Safe Transport of Radioactive Material 1985 Edition (as Amended 1990). Safety Series 6, IAEA, Vienna (1990).
3 Regulations for the Safe Transport of Radioactive Material. ST-1, IAEA, Vienna (1996).
4 McClure, D R, Hill, C E, Burgess, P H, Clark, M J. Evaluation of some hand heldinstruments for measuring radioactive surface contamination. NRPB-R232 (1990).
5 Hill, C E, Burgess, P H. Evaluation of some hand held instruments for measuring radioactivesurface contamination (1995). NRPB-M700 (1996).
6 MacArthur, D W, Allander, K S, Bounds, J A, Butterfield, K B, McAtee, J L. Long-RangeAlpha Detector. Health Physics 63, 3, 324–330 (1992).
7 Radionuclide transformations. Energy and intensity of emissions. ICRP Publication 38,Pergamon, (1983).
8 Health and Safety Series Booklet HS(G)49. The examination and testing of portableradiation instruments for external radiations. HMSO, London (1990).
9 Abelquist, E, Walker, E. The effects of surface condition on in situ measurement of beta andalpha surface contamination. Health Physics Society Annual Meeting Seattle, WA, USA(1996).
10 Wahl, L E, Smith, W J, Martin, B. Evaluating plutonium-239 levels using field detectors. Health Physics Society Annual Meeting, Seattle, WA, USA (1996).
11 Handbook of Radiological Protection. Part 1 : Data, HMSO (London) (1971). ISBN 11 360079 8.
12 Conversion coefficients for use in radiological protection against external radiation. ICRPPublication 74, Pergamon, (1996).
13 Cox, F M, Guenther, C F. An industry survey of current lower limits of detection for variousradionuclides. Health Physics 69, 1, 121–129.
12 Figures
1 Photon energy response of NE Technology IDP6AD.
2 Photon energy response of the Berthold LB6357 xenon filled detector.
3 Photon energy response of the Berthold LB6358G Butane detector.
4 Photon energy response of the Mini Instruments 1000 EP15.

65
Annex A
Cost Considerations
A1 Cost considerations
The costs of monitoring during decommissioning for disposal or recycling of materials will
need to be assessed on a case by case basis, but there are some general features which will be amenable
to a systematic analysis of costs, so they can be minimised.
A2 Radionuclide inventory
The initial assessment of the radionuclide inventory in materials on a site will be a cost which
will vary from site to site, and will require a mixture of monitoring and a study of archive documents
to establish the extent of the inventory. The monitoring will need to be specialised, and will require
a mixture of hand held instrumentation and laboratory analysis of samples to establish radionuclide
fingerprints. In order to minimise the number of man-hours required to do monitoring with hand-held
equipment, it will be an advantage to have the most sensitive instrumentation available. However, the
prospects for making large cost savings by using different monitoring systems or techniques are likely
to be small compared to other costs. So, despite the inventory assessment varying from case to case,
the costs for a particular site will be relatively fixed with respect to changes in monitoring equipment.
The main opportunity for cost savings will come at the next stage when significant quantities of
materials are being processed for recycling or disposal.
After the initial assessment of a radionuclide inventory has been carried out, decisions can
be made for disposal or recycling materials. In respect of considerations of the cost of monitoring, there
are two significant decisions that are amenable to a systematic analysis of the costs involved: first,
whether to use an automated or manual system for monitoring materials, and second, decisions on the
type of monitoring equipment to be used. Both these decisions can be analysed using cost-effectiveness
techniques.
A3 Cost-effectiveness analysisThe technique of cost effectiveness analysis involves the examination of options to define a
ratio of benefits, b, to costs, c. The most cost effective option is that which maximises benefits for a
fixed cost, or which minimises costs for a fixed benefit. In respect of decommissioning and recycling,
the benefit is likely to be a quantity of material sentenced either to disposal or to recycling (kg/ECU).
Hence a cost effectiveness analysis should demonstrate the options which can sentence the most
material for a fixed cost or which can minimise the cost of sentencing a fixed amount of material.
The technique of cost effectiveness analysis is fundamentally different from cost benefit
analysis, with which it is often confused1,2,3. Cost benefit analysis seeks to optimise (ie, maximise) the
net benefit minus costs (b-c) of particular options. This requires a much broader treatment of benefits
in monetary terms, which can be both difficult and contentious4.
A4 Automated versus manual monitoring
The decision to use automated or manual monitoring will require a detailed analysis of the
amount and properties of the material to be processed, and the availability of suitably trained staff for
monitoring. If there are large amounts of relatively uniform material that will have to be processed in
66
some way before removal from the site, the intuitive arguments for an automated monitoring process
are strong. Conversely, if there are smaller amounts of very disparate materials with a variety of shapes
and sizes, manual monitoring by skilled staff may be more appropriate. However, if such material will
have to be processed in some way before its removal from the site, (eg, because of regulatory
requirements) then the arguments for an automated monitoring system will become strong, especially
if there are large amounts of material. This can be shown in terms of a schematic example.
Let us assume a site for decommissioning has been designated and the assessment monitoring
and archive studies have been carried out to establish the likely radionuclide inventory. (This is then
a fixed cost, whatever subsequent monitoring regime is adopted.) This inventory suggests that some
material may be recycled but some other material may need disposal either using general disposal
techniques or special disposal at sites suitable for radioactive wastes.
Let the total mass of material be M kg and the process diagram given in Figure 1A illustrates
how the cost effectiveness of monitoring regimes can be calculated.
The schematic diagram demonstrates that automatic or manual monitoring may be the only
significantly variable cost in the overall process. Assuming conservation of mass during the three
different process chains:-
I Processing; automatic monitoring; disposal
II Processing; manual monitoring; disposal
III Manual monitoring; processing; disposal
and that the amounts of material eventually sentenced to recycling, disposal or radioactive waste are
not significantly different at the end of the three process chains then a straightforward summation of
costs is revealing. For example:
Process I will have a total cost (X + Y - R* + D + S)ECU,
Process II will be (X + Z′ - R′ + D′ + S′)ECU and
Process III will be (Z″ + X″ - R″ + D″ + S″)ECU where X″ = x1″ + x2″ + x3″
where X (or x) denotes the cost of processing material before its removal from the site.
Y denotes the cost of automated monitoring material (ie, after processing).
Z denotes the cost of manually monitoring material (before or after processing).
R denotes the cost of recycling material (this should actually be a net income because of the
value of recycled materials).
D denotes the cost of disposal of non-radioactive materials.
S denotes the cost of disposal of radioactive waste.
The assumption that amounts of material eventually sentenced will not vary significantly
between I, II and III means that
R = R′ = R″ ; X = (x1″ + x2″ + x3″) = X″
*Recycling should be a net income
67
D = D′ = D″ ; Z′ = Z″; and
S = S′ = S″and the costs of process II and process III are therefore equal. The only difference between process I
and process II/III is then the cost of automated and manual monitoring. Hence, what decides the cost
effectiveness of the overall scheme is the cost of the monitoring process.
Taking a more “real world” approach, the above assumptions are naive and it is unreasonable
to assume that the masses of materials eventually sentenced to recycling, disposal or radioactive waste
are independent of the monitoring process. For example, a manual monitoring procedure may not
reveal the extent of radioactive materials in concealed or obscure places, which subsequent automated
monitoring could discover. Conversely, the processing of material may obscure some radioactive
objects in an automatic monitoring regime. Such difficulties are best considered by experts/regulators
involved in the process, but this analysis shows that the cost of the monitoring process could actually
be a major contributor to the overall cost-effectiveness of an operation, and can equally have an effect
on the amounts of material eventually sentenced to recycling, disposal or radioactive waste. This may
be particularly sensitive for recycling which is a negative cost (ie, an income) and for disposal which
is likely to be a major cost, especially for radioactive materials.
A5 Selection of monitoring equipment
Given that cost effectiveness analysis has been used to decide whether to use automatic or
manual monitoring should be used these two techniques can also be subject to a separate cost
effectiveness analysis. It is straightforward to assess that more sensitive equipment can minimise the
time required for manual monitoring and also improve the efficiency of automated monitoring because
a larger amount of material can be processed for a fixed time. Such analyses could be complex and,
in practice, will depend on the nature of the decommissioning project. For example, the equipment
required to deal with materials with potential surface contamination will be very different from that
required to monitor materials suspected of containing activation products. However, a cost
effectiveness analysis designed to assess the maximum amount of material for a fixed cost, or the
minimum cost to monitor a fixed amount of material, will be revealing in either case. For any sizeable
project involving large amounts of material, a cost effectiveness analysis will reveal that a more
sensitive instrument will be able to monitor larger volumes of material more quickly, or minimise the
amount of time for manual monitoring.
It should be noted also that there is no straightforward relationship between the sensitivity
of the instrument and its cost; some very sensitive instruments can be relatively inexpensive.
A6 Conclusions
The schematic analysis of costs given above shows how significant the cost of monitoring
can be in a decommissioning project if the regulatory regime demands that all material must be subject
to monitoring before leaving the site. This is expected to be the case where there are significant
quantities of contaminated material on site and the arguments for setting up an automated monitoring
system on site are strong. If however the assessment of radionuclide inventory reveals only small
amounts of contaminated materials, such a rigorous regime may not be necessary and there are
arguments for a less expensive manual monitoring scheme.

68
A7 References
1 OECD. The economic appraisal of environmental projects and policies. A practical guide. OECD
Paris (1995).
2 Begg, D, Fischer, S and Dornbusch, R. Economics, 2nd Ed. McGraw-Hill (1987).
3 Stokell, P J et al. ALARA: From theory towards practice. EUR13796EN, CEC, Luxembourg
(1991).
4 Mishan, E J. Cost Benefit Analysis. London, George Allen and Unwin (1975).
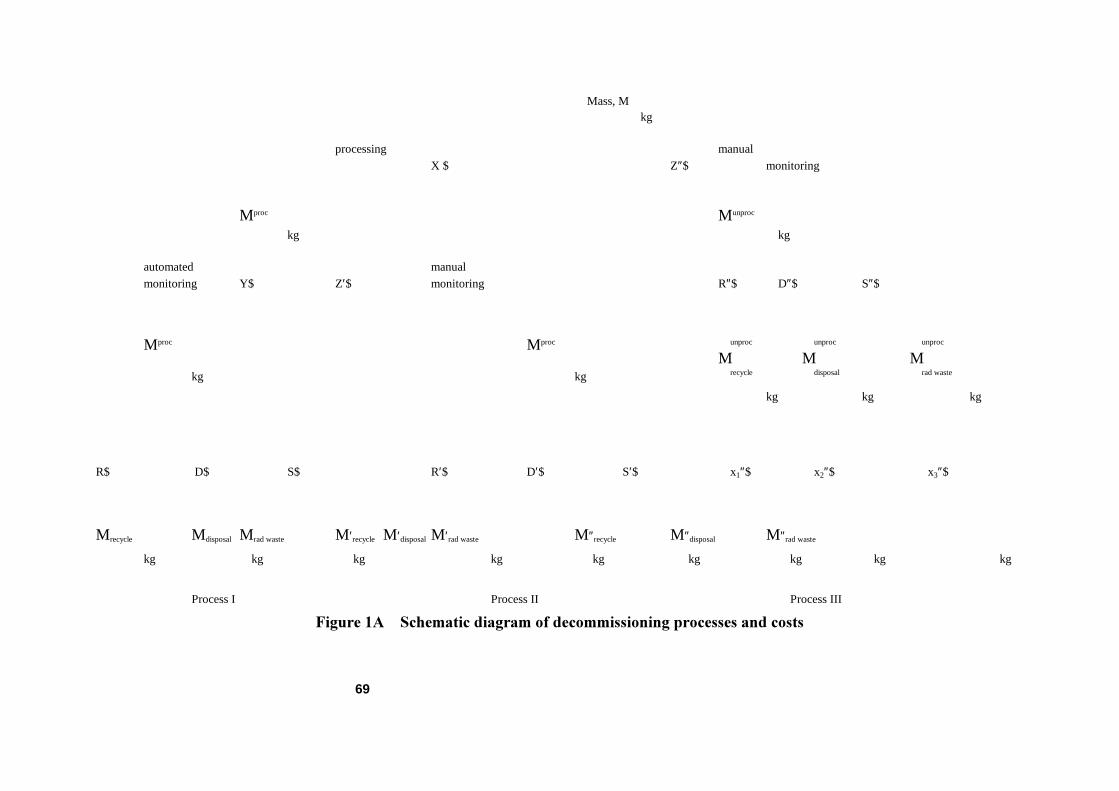
69
Mass, Mkg
processing manual
X $ Z″$ monitoring
Mproc Munproc
kg kg
automated manual
monitoring Y$ Z′$ monitoring R″$ D″$ S″$
Mproc Mproc unproc unproc unproc
M M Mkg kg recycle disposal rad waste
kg kg kg
R$ D$ S$ R′$ D′$ S′$ x1″$ x2″$ x3″$
Mrecycle Mdisposal Mrad waste M′recycle M′disposal M′rad waste M″recycle M″disposal M″rad waste
kg kg kg kg kg kg kg kg kg
Process I Process II Process III
)LJXUH��$����6FKHPDWLF�GLDJUDP�RI�GHFRPPLVVLRQLQJ�SURFHVVHV�DQG�FRVWV
Recommended