Gorgon Gas Development and Jansz Feed Gas
Pipeline Environmental Performance
Report 2019
Document ID: ABU190900639
Revision ID: 1.0
Revision Date: 4 November 2019
Information Sensitivity: Public
Gorgon Gas Development and Jansz Feed Gas Pipeline Environmental Performance Report 2019
Document ID: ABU190900639 Revision ID: 1.0 Revision Date: 4 November 2019 Page iii Information Sensitivity: Public Uncontrolled when Printed
Contents
1 Introduction ....................................................................................................................... 1
1.1 Proponent ................................................................................................................ 1
1.2 Purpose of this Environmental Performance Report................................................. 1
1.3 Contents of this EPR ................................................................................................ 1
1.4 Project ..................................................................................................................... 2
1.4.1 Status of Implementation ................................................................................ 4
2 Terrestrial and Subterranean Environment State .............................................................. 5
2.1 Monitoring Results ................................................................................................... 5
2.2 Event Data ............................................................................................................. 18
3 Terrestrial and Marine Quarantine ................................................................................... 19
3.1 Audits .................................................................................................................... 20
3.2 Monitoring Results ................................................................................................. 20
3.3 Event Data ............................................................................................................. 21
4 Marine Turtles ................................................................................................................. 23
4.1 Monitoring Results ................................................................................................. 23
4.2 Studies................................................................................................................... 31
4.2.1 Flatback Turtle Tagging – A07, Junction, and Camp Beaches ..................... 31
4.2.2 Incubation Success – A07, Junction, YCS, and YCN Beaches ..................... 31
4.2.3 Flatback Turtle Hatchling Dispersal and Survivorship ................................... 32
4.3 Event Data ............................................................................................................. 32
4.4 Audit and Review ................................................................................................... 32
4.5 Changes to the Long-term Marine Turtle Management Plan .................................. 34
4.6 Conclusion ............................................................................................................. 34
5 Short-range Endemics and Subterranean Fauna ............................................................ 36
5.1 Monitoring Results ................................................................................................. 36
6 Fire Management ............................................................................................................ 37
6.1 Event Data ............................................................................................................. 37
6.2 Changes to the Fire Management Plan .................................................................. 38
7 Carbon Dioxide Injection Project ..................................................................................... 39
7.1 Volume of Reservoir Carbon Dioxide Removed ..................................................... 39
7.2 Volume of Reservoir Carbon Dioxide Injected ........................................................ 40
7.3 Reasons for Shortfall Between Volume Extracted and Injected .............................. 40
7.4 Measures Being Implemented ............................................................................... 40
8 Air Quality ....................................................................................................................... 42
8.1 Monitoring Results ................................................................................................. 42
Gorgon Gas Development and Jansz Feed Gas Pipeline Environmental Performance Report 2019
Document ID: ABU190900639 Revision ID: 1.0 Revision Date: 4 November 2019 Page iv Information Sensitivity: Public Uncontrolled when Printed
9 Coastal Stability .............................................................................................................. 45
9.1 Monitoring Results ................................................................................................. 45
9.2 Conclusion ............................................................................................................. 58
10 Terrestrial Rehabilitation ................................................................................................. 60
10.1 Changes to the Post-Construction Rehabilitation Plan ........................................... 60
10.2 Rehabilitation Activities .......................................................................................... 60
10.3 Rehabilitation Monitoring ....................................................................................... 62
10.4 Topsoil Activities .................................................................................................... 63
10.5 Monitoring Results ................................................................................................. 64
11 Greenhouse Gas Abatement ........................................................................................... 65
11.1 Monitoring Results ................................................................................................. 65
12 Spill Management ........................................................................................................... 66
12.1 Event Data ............................................................................................................. 66
13 Terminology .................................................................................................................... 67
14 References ..................................................................................................................... 74
Tables
Table 1-1: Environmental Performance Reporting Requirements Addressed in this EPR ........ 2
Table 2-1: EPR Reporting Requirements for Terrestrial and Subterranean Environment ......... 5
Table 2-2: EPBC Act Threatened or Listed Fauna Recorded as Injured or Deceased within the TDF ........................................................................................................................................ 18
Table 3-1: EPR Reporting Requirements for Terrestrial and Marine Quarantine .................... 19
Table 4-1: EPR Reporting Requirements for Marine Turtles................................................... 23
Table 5-1: EPR Reporting Requirements for Short-range Endemics and Subterranean Fauna .............................................................................................................................................. 36
Table 6-1: EPR Reporting Requirements for Fire Management ............................................. 37
Table 6-2: Causes, Completed Actions, and Lessons Learnt for Fire Events Attributable to Gorgon Gas Development Activities during the Reporting Period .......................................... 38
Table 7-1: EPR Reporting Requirements for Carbon Dioxide Injection Project ....................... 39
Table 8-1: EPR Reporting Requirements for Air Quality ......................................................... 42
Table 8-2: Summary of Exceedances against Guideline Values during the Reporting Period 43
Table 8-3: Summary of Exceedances against Stationary Source Emissions Targets during the Reporting Period .................................................................................................................... 44
Table 9-1: EPR Reporting Requirements for Coastal Stability ................................................ 45
Table 9-2: Net Volume Changes (m3) across the Active Zone1 of the Beach at Monitored Beaches ................................................................................................................................. 50
Table 9-3: Management Trigger Exceedances at Terminal and Bivalve Beaches During the Reporting Period .................................................................................................................... 52
Gorgon Gas Development and Jansz Feed Gas Pipeline Environmental Performance Report 2019
Document ID: ABU190900639 Revision ID: 1.0 Revision Date: 4 November 2019 Page v Information Sensitivity: Public Uncontrolled when Printed
Table 10-1: EPR Reporting Requirements for Terrestrial Rehabilitation ................................. 60
Table 11-1: EPR Reporting Requirements for Greenhouse Gas Abatement .......................... 65
Table 12-1: EPR Reporting Requirements for Spill Management ........................................... 66
Table 13-1: Terminology ........................................................................................................ 67
Table 14-1: References .......................................................................................................... 74
Figures
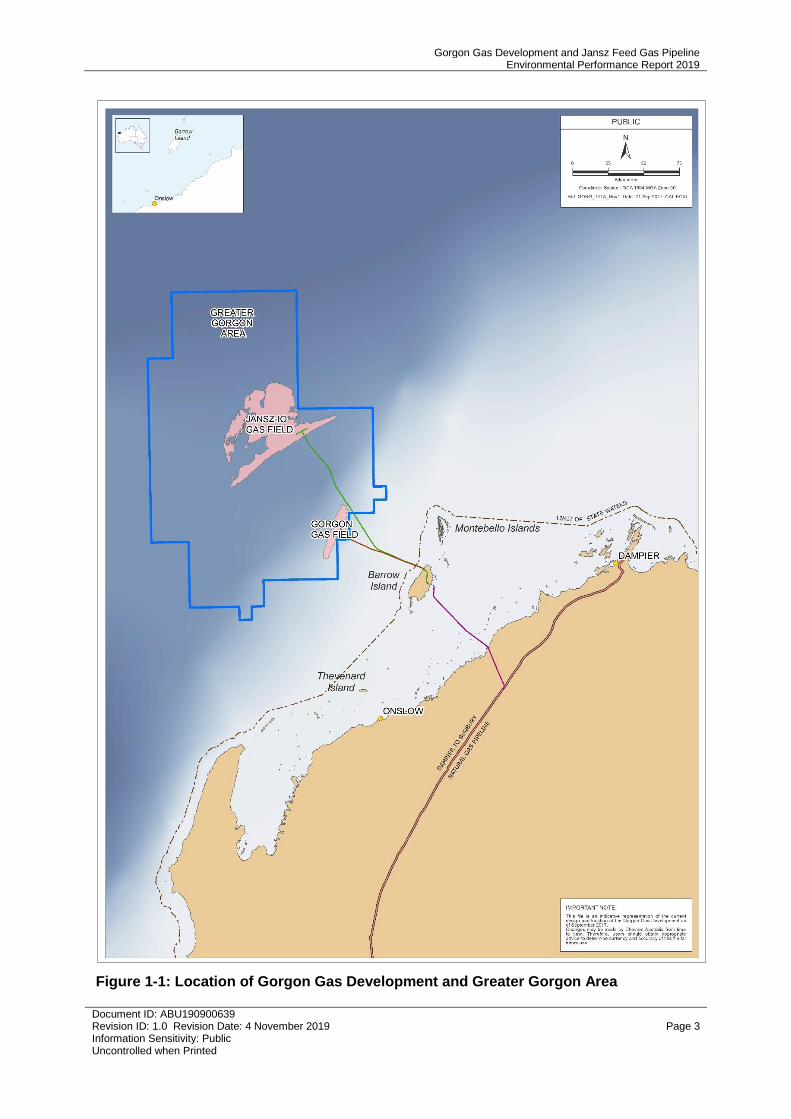
Figure 1-1: Location of Gorgon Gas Development and Greater Gorgon Area .......................... 3
Figure 2-1: Control Charts for: (a) Total Species Richness, (b) Percent foliage Cover and (c) Vegetation Health1 ................................................................................................................... 7
Figure 2-2: Control Chart for White-winged Fairy-wren Population Density at Barrow Island: Difference between At Risk and Reference Zone1 .................................................................... 8
Figure 2-3: Control Chart for Euro Population Density at Barrow Island: Difference between At Risk and Reference Zone1 ....................................................................................................... 9
Figure 2-4: Control Chart for Spectacled Hare-wallaby Population Density at Barrow Island: Difference between At Risk and Reference Zone1 .................................................................. 10
Figure 2-5: Control Chart for Boodie Population Density at Barrow Island: Difference between At Risk and Reference Zone2 ................................................................................................. 11
Figure 2-6: Control Charts for Wedge-tailed Shearwater1, 2 .................................................... 13
Figure 2-7: Control Charts for Bridled Tern1, 2 ......................................................................... 15
Figure 4-1: Control Chart for Adult Female Flatback Turtle Survival Probability at Barrow Island1 .................................................................................................................................... 24
Figure 4-2: Control Chart for Adult Female Flatback Turtle Breeding Omission Probability at Barrow Island1 ........................................................................................................................ 25
Figure 4-3: Control Chart for Adult Female Flatback Turtle Nester Abundance at Barrow Island: Difference between At Risk and Reference Sites2 ...................................................... 25
Figure 4-4: Control Chart for Adult Female Flatback Turtle Clutch Frequency at Barrow Island1
.............................................................................................................................................. 26
Figure 4-5: Control Charts for Hatchling Post-emergence Dispersion: Fan Spread and Offset Estimates at Terminal and Bivalve Beaches1 ......................................................................... 28
Figure 4-6: Control Chart for Egg Hatching Probability for Complete Clutches at Barrow Island (all Monitored Beaches [Bivalve, Terminal, Inga, and Mushroom] combined)1, 2 ..................... 29
Figure 4-7: Control Chart for Hatchling Emergence Probability for Complete Clutches at Barrow Island (all Monitored Beaches [Bivalve, Terminal, Inga and Mushroom] combined)1, 2 30
Figure 9-1: Surface Elevation Changes at Terminal Beach1 ................................................... 47
Figure 9-2: Surface Elevation Changes at Bivalve Beach1 ..................................................... 47
Figure 9-3: Surface Elevation Changes at Inga Beach1 .......................................................... 48
Figure 9-4: Surface Elevation Changes at YCN Beach1 ......................................................... 48
Figure 9-5: Surface Elevation Changes at YCS Beach1 ......................................................... 49
Gorgon Gas Development and Jansz Feed Gas Pipeline Environmental Performance Report 2019
Document ID: ABU190900639 Revision ID: 1.0 Revision Date: 4 November 2019 Page vi Information Sensitivity: Public Uncontrolled when Printed
Figure 9-6: Annual Net Volume Change of the Active Zone of the Beach (below the Sparse Vegetation Line) at Monitored Beaches, October to October, 2009–2018 .............................. 49
Figure 9-7: Seasonal Net Volume Change of the Active Zone of the Beach (below the Sparse Vegetation Line) at Monitored Beaches ................................................................................. 50
Figure 9-8: Pre-cyclone (left image) and peak storm surge (right image) conditions at Terminal Beach, TC Veronica ............................................................................................................... 51
Figure 9-9: Storm surge flooding on 23 March 2019 at Terminal Creek. Photo taken approximately 400 m from the coast, looking east towards the coast (left image), and west towards inland facilities (right image) ..................................................................................... 51
Figure 9-10: Proportions (%) of Marine Turtle Nesting Habitat Zones for Monitored Beaches in October 2009 (Baseline), October 2017, and October 2018 ................................................... 55
Figure 9-11: Marine Turtle Nesting Habitat Zones for Terminal Beach1 .................................. 56
Figure 9-12: Marine Turtle Nesting Habitat Zones for Bivalve Beach1 .................................... 56
Figure 9-13: Marine Turtle Nesting Habitat Zones for Inga Beach1 ......................................... 57
Figure 9-14: Marine Turtle Nesting Habitat Zones for YCN Beach1 ........................................ 57
Figure 9-15: Marine Turtle Nesting Habitat Zones for YCS Beach1 ........................................ 58
Figure 10-1: Areas Rehabilitated for the Gorgon Gas Development ....................................... 61
Gorgon Gas Development and Jansz Feed Gas Pipeline Environmental Performance Report 2019
Document ID: ABU190900639 Revision ID: 1.0 Revision Date: 4 November 2019 Page 1 Information Sensitivity: Public Uncontrolled when Printed
1 Introduction
1.1 Proponent
Chevron Australia Pty Ltd (CAPL) is the Proponent and the person taking the action for the Gorgon Gas Development and Jansz Feed Gas Pipeline (collectively referred to hereafter as the Gorgon Gas Development [the ‘Project’]) on behalf of these companies (collectively known as the Gorgon Joint Venture Participants):
• Chevron Australia Pty Ltd
• Chevron (TAPL) Pty Ltd
• Shell Australia Pty Ltd
• Mobil Australia Resources Company Pty Ltd
• Osaka Gas Gorgon Pty Ltd
• Tokyo Gas Gorgon Pty Ltd
• JERA Gorgon Pty Ltd.
1.2 Purpose of this Environmental Performance Report
CAPL, as the Proponent, is required to prepare an Environmental Performance Report (EPR) in accordance with:
• Condition 5 and Schedule 3 of Ministerial Statement (MS) 800 (and Condition 2 of MS 965)
• Condition 5 and Schedule 3 of MS 769
• Condition 4 and Schedule 3 of EPBC 2003/1294
• Condition 4 and Schedule 3 of EPBC 2008/4178
• relevant systems, programs, and plans as amended or replaced from time to time approved under MS 800, MS 769, MS 965, and EPBC 2003/1294 and 2008/4178.
1.3 Contents of this EPR
This EPR covers the period from 10 August 2018 to 9 August 2019 (the ‘Reporting Period’) unless otherwise stated. Table 1-1 lists the State and Commonwealth Condition requirements of this EPR and the sections in this EPR that fulfil them. This includes the EPR requirements under Schedule 3 of MS 800, MS 769, EPBC 2003/1294, and EPBC 2008/4178 and any additional EPR commitments contained in relevant systems, programs, and plans.
Gorgon Gas Development and Jansz Feed Gas Pipeline Environmental Performance Report 2019
Document ID: ABU190900639 Revision ID: 1.0 Revision Date: 4 November 2019 Page 2 Information Sensitivity: Public Uncontrolled when Printed
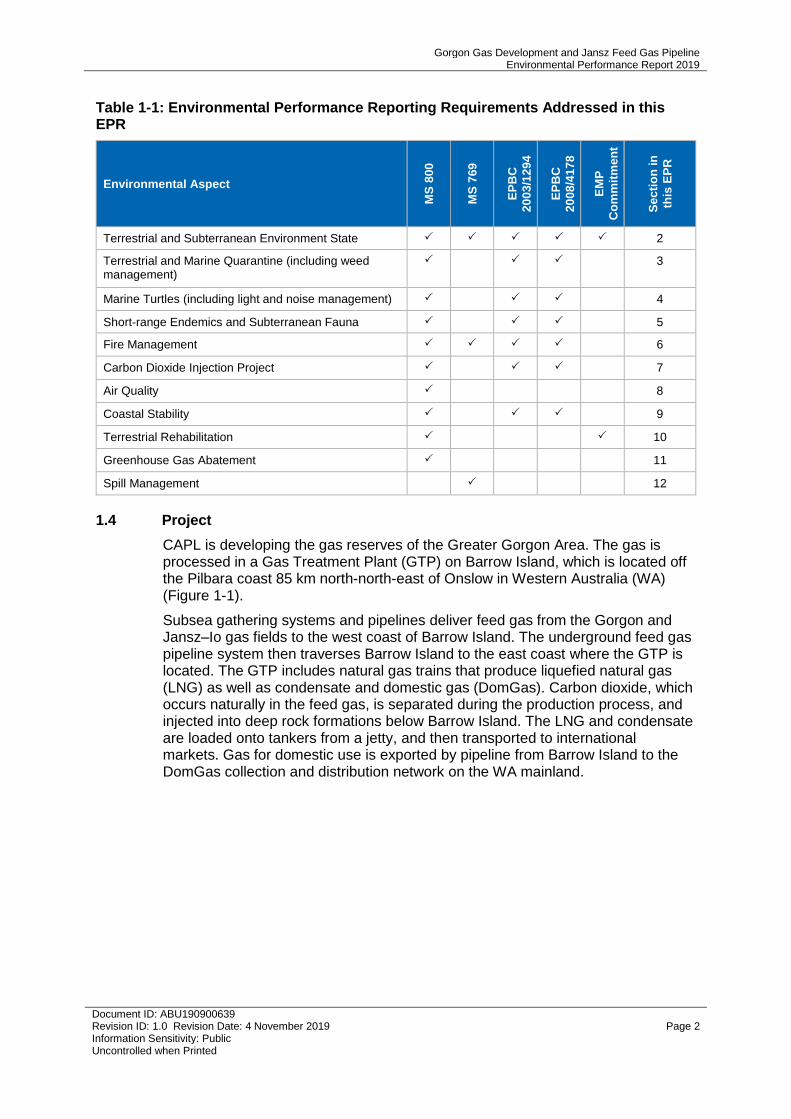
Table 1-1: Environmental Performance Reporting Requirements Addressed in this EPR
Environmental Aspect
MS
800
MS
769
EP
BC
20
03
/12
94
EP
BC
20
08
/41
78
EM
P
Co
mm
itm
en
t
Se
cti
on
in
this
EP
R
Terrestrial and Subterranean Environment State 2
Terrestrial and Marine Quarantine (including weed management)
3
Marine Turtles (including light and noise management) 4
Short-range Endemics and Subterranean Fauna 5
Fire Management 6
Carbon Dioxide Injection Project 7
Air Quality 8
Coastal Stability 9
Terrestrial Rehabilitation 10
Greenhouse Gas Abatement 11
Spill Management 12
1.4 Project
CAPL is developing the gas reserves of the Greater Gorgon Area. The gas is processed in a Gas Treatment Plant (GTP) on Barrow Island, which is located off the Pilbara coast 85 km north-north-east of Onslow in Western Australia (WA) (Figure 1-1).
Subsea gathering systems and pipelines deliver feed gas from the Gorgon and Jansz–Io gas fields to the west coast of Barrow Island. The underground feed gas pipeline system then traverses Barrow Island to the east coast where the GTP is located. The GTP includes natural gas trains that produce liquefied natural gas (LNG) as well as condensate and domestic gas (DomGas). Carbon dioxide, which occurs naturally in the feed gas, is separated during the production process, and injected into deep rock formations below Barrow Island. The LNG and condensate are loaded onto tankers from a jetty, and then transported to international markets. Gas for domestic use is exported by pipeline from Barrow Island to the DomGas collection and distribution network on the WA mainland.
Gorgon Gas Development and Jansz Feed Gas Pipeline Environmental Performance Report 2019
Document ID: ABU190900639 Revision ID: 1.0 Revision Date: 4 November 2019 Page 3 Information Sensitivity: Public Uncontrolled when Printed
Figure 1-1: Location of Gorgon Gas Development and Greater Gorgon Area
Gorgon Gas Development and Jansz Feed Gas Pipeline Environmental Performance Report 2019
Document ID: ABU190900639 Revision ID: 1.0 Revision Date: 4 November 2019 Page 4 Information Sensitivity: Public Uncontrolled when Printed
1.4.1 Status of Implementation
Significant progress has been made on the Gorgon Gas Development since construction commenced in December 2009.
During the Reporting Period, CAPL:
• commenced the Gorgon Stage Two drilling campaign of 11 additional wells, which were part of the Gorgon Gas Development’s original development plan
• delivered the 500th LNG cargo from the Gorgon Gas Development
• commenced the safe start-up and operation of the carbon dioxide injection system.
Gorgon Gas Development and Jansz Feed Gas Pipeline Environmental Performance Report 2019
Document ID: ABU190900639 Revision ID: 1.0 Revision Date: 4 November 2019 Page 5 Information Sensitivity: Public Uncontrolled when Printed
2 Terrestrial and Subterranean Environment State
Table 2-1: EPR Reporting Requirements for Terrestrial and Subterranean Environment
Item Source Section in this EPR
Results of monitoring and any measurable impacts from the Project, including any changes from the baseline
MS 800, Schedule 3(1i)
MS 769, Schedule 3(1i)
EPBC 2003/1294 and 2008/4178, Schedule 3(1i)
2.1
Conclusions as to the Project stressors (if any) causing the impacts identified
MS 800, Schedule 3(1ii)
MS 769, Schedule 3(1ii)
EPBC 2003/1294 and 2008/4178, Schedule 3(1ii)
Not applicable
(N/A)1
Any mitigation measures applied during the Reporting Period, and results of that mitigation
MS 800, Schedule 3(1iii)
MS 769, Schedule 3(1iii)
EPBC 2003/1294 and 2008/4178, Schedule 3(1iii)
N/A2
Any changes to monitoring sites MS 800, Schedule 3(1iv)
MS 769, Schedule 3(1iv)
EPBC 2003/1294 and 2008/4178, Schedule 3(1iv)
2.1
Any changes to monitoring sites below the minimum number required
Terrestrial and Subterranean Environment Monitoring Program (TSEMP) (Ref. 1), Section 3.4
N/A3
Any changes to ecological elements TSEMP (Ref. 1), Section 5 2.1
Threatened or listed fauna cared for, injured, or killed within the Terrestrial Disturbance Footprint (TDF)
Terrestrial and Subterranean Environment Protection Plan (Ref. 2), Section 7.2
2.2
1 No Project-related adverse impacts to ecological elements (as listed in Condition 6.1 of MS 800 and MS 769, and Condition 5.1 EPBC 2003/1294 and 2008/4178) were identified outside the TDF during the Reporting Period; therefore, reporting is not applicable at this time.
2 No mitigation measures were implemented in response to Project-related adverse impacts outside the TDF during the Reporting Period; therefore, reporting is not applicable at this time.
3 No changes were made to the TSEMP monitoring sites during the Reporting Period.
2.1 Monitoring Results
The objective of the TSEMP (Ref. 1), as defined by Ministerial conditions, is to establish a statistically valid ecological monitoring program to detect any Material or Serious Environmental Harm to the ecological elements outside the TDF.
The ecological elements considered at risk from the Gorgon Gas Development that require monitoring on Barrow Island are listed in the TSEMP (Ref. 1).
At Risk zones (located within the relevant TDF - a zone where potential impacts are predicted to occur) and Reference zones (located in comparable areas beyond the TDF) were established for each monitoring program to detect changes attributable to Gorgon Gas Development activities.
Where applicable, monitoring data are presented in time-series control charts used to diagnose trends in population abundance and identify deviations from baseline estimates. Trends identified in control charts act as early-warning signals to guide a tiered management approach. A management response is triggered if a parameter demonstrates a trend towards or changes beyond statistical deviations (±1, ±2, or ±3 statistical deviations [e.g. standard deviation (SD)]) from baseline conditions or other reference point (e.g. the zero centre-line of a ratio).
Gorgon Gas Development and Jansz Feed Gas Pipeline Environmental Performance Report 2019
Document ID: ABU190900639 Revision ID: 1.0 Revision Date: 4 November 2019 Page 6 Information Sensitivity: Public Uncontrolled when Printed
This is the fourth Reporting Period in which an annual difference between the standardised At Risk and Reference zone population density metric (standardised density difference ratio) was applied to control charts for mammals and birds, to improve diagnosis of trends. Alternative analyses are applied to groundwater and surface water landform monitoring data, where control charting was inappropriate for comparing trends over time.
Formal monitoring of Silver Gull abundance and distribution ceased in 2016 after a review of results since monitoring began in 2009. Silver Gull monitoring results remained within control limits for At Risk zones for all years monitored, and CAPL has demonstrated ongoing management of waste, surface water, and light, which were identified as potential drivers for an increase in Silver Gull abundance. However, data on Silver Gull abundance and nesting distribution continued to be collected in 2019 during the marine turtle nesting season, and opportunistically on islands monitored for migratory seabird nesting.
The Gorgon Gas Development is now in the operations phase. Consequently, Golden Bandicoot monitoring, which was last completed in 2018, is being undertaken at least every five years, or in response to three consecutive years of above- or below-average annual rainfall. Therefore, Golden Bandicoot monitoring results are not included in this EPR.
The 2018–20191 monitoring results for the ecological elements listed in the TSEMP (Ref. 1) are summarised in the following tables.
Ecological Element: Vegetation
Objective: • To detect loss of diversity—attributable to the Gorgon Gas Development—over time.
Methodology: • Survey Method: Biennial survey of 124 vegetation monitoring transects across 15 vegetation associations encompassing both At Risk and Reference sites. Parameters comprised: percentage foliage cover (PFC); total species richness; known, suspected, or potential non-indigenous species (NIS); and plant health.
• Analysis Method: An exponentially weighted moving average (EWMA) control chart approach was applied to total species richness, percentage foliage cover, and plant health. A permutation-based multivariate analysis of variance was used to examine if there were differences in floristic composition and health of plants between the At Risk and Reference sites, or between years. The site type by year interaction was also tested for significance.
Changes to Monitoring Sites:
• No changes were made to the vegetation monitoring sites since the previous monitoring survey in 2017.
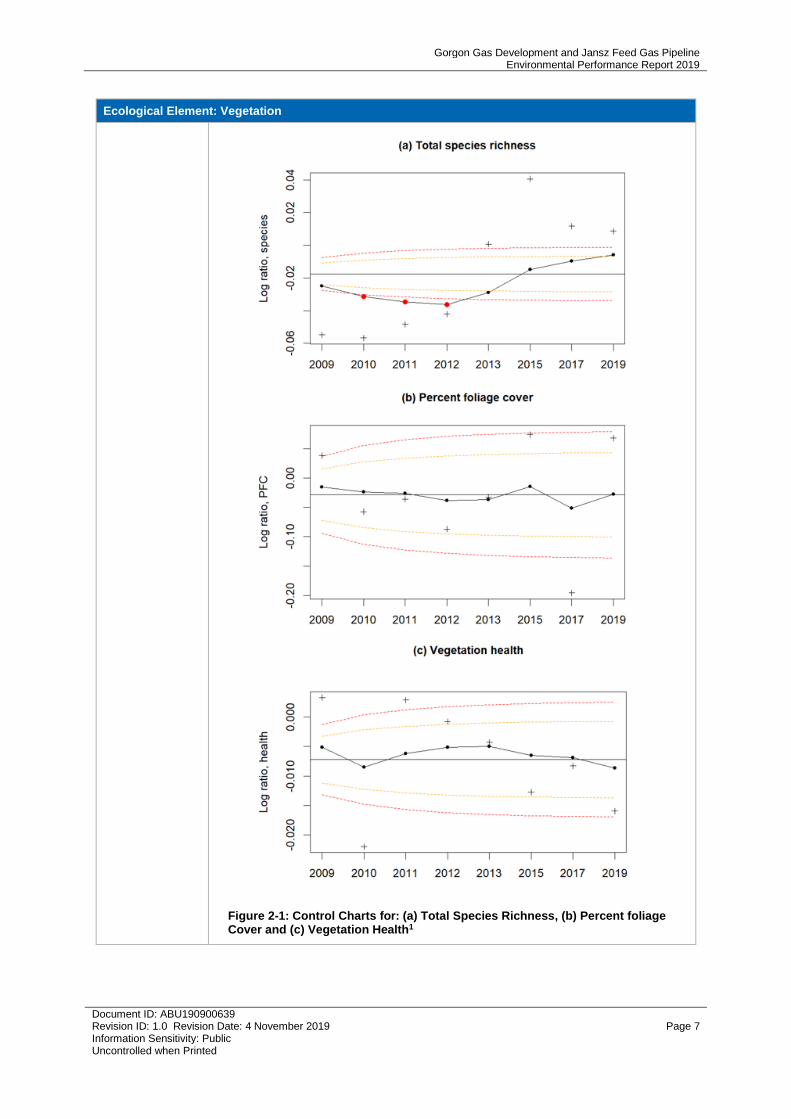
Results: • No significant decline was recorded in species richness, PFC, or plant health in 2019 compared to the results of the previous vegetation monitoring survey in 2017 (Figure 2-1).
• All monitored variables, when considered individually by vegetation type, remained within the 3 SD control limit. Within the vegetation associations, five variables exceeded the 2 SD or 3 SD control limits due to a favourable trend at the At Risk sites, relative to Reference sites, except for C3b1 in the coastal dune system, which recorded a higher rate of decline in perennial species health at the At Risk sites, relative to Reference sites.
• No known, suspected, or potential NIS were identified in the transects.
• Analysis of the multivariate species assemblage did not detect an impact to At Risk sites.
1 Note: Due to seasonal monitoring requirements, Barrow Island Boodie monitoring was undertaken near the end of the 2017–2018 reporting period. These data were analysed and are reported on in this Reporting Period.
Gorgon Gas Development and Jansz Feed Gas Pipeline Environmental Performance Report 2019
Document ID: ABU190900639 Revision ID: 1.0 Revision Date: 4 November 2019 Page 7 Information Sensitivity: Public Uncontrolled when Printed
Ecological Element: Vegetation
Figure 2-1: Control Charts for: (a) Total Species Richness, (b) Percent foliage Cover and (c) Vegetation Health1
Gorgon Gas Development and Jansz Feed Gas Pipeline Environmental Performance Report 2019
Document ID: ABU190900639 Revision ID: 1.0 Revision Date: 4 November 2019 Page 8 Information Sensitivity: Public Uncontrolled when Printed
Ecological Element: Vegetation
Conclusions: • Monitoring has not detected an adverse impact (attributable to the Gorgon Gas Development) on total species richness or percentage foliage cover within the TDF since vegetation monitoring commenced in 2009.
• No significant and detrimental change in plant health has been detected, either spatially or temporally within or outside the TDF, since vegetation monitoring commenced in 2009.
• Vegetation affected by the bushfire (caused by lightning) in October 2013 (Ref. 29) continues to progress towards a similar structure to that surveyed before being burnt (Ref. 30).
1 EWMA Chart: Solid horizontal line = random effects estimate of all sampled seasons. Solid dots = smoothed log response ratio metric based on an EWMA. Crosses = the calculated log response ratio metric for the At-risk sites compared with the Reference sites. Red dots are exceedances of the 3 SD control limit. Orange dotted line = 2 SD control limit. Red dotted line = 3 SD control limit.
Ecological Element: White-winged Fairy-wren (Barrow Island)
Objective: • Detect variation in abundance—attributable to the Gorgon Gas Development—over time.
Changes to Monitoring Sites:
• The number of transects monitored increased from 128 in 2017 to 132 in 2018.
Methodology: • Survey method: Annual distance sampling across 132 transects to compare the densities of White-winged Fairy-wrens within the At Risk and Reference zones. The combined total length of the transects was 228 km, with 137 km of transects located in the Reference zone and 89 km in the At Risk zone.
• Analysis method: Changes in relative density were determined by the degree of variation observed between At Risk and Reference zones, and were plotted using time-series control charts to understand trends in abundance over time.
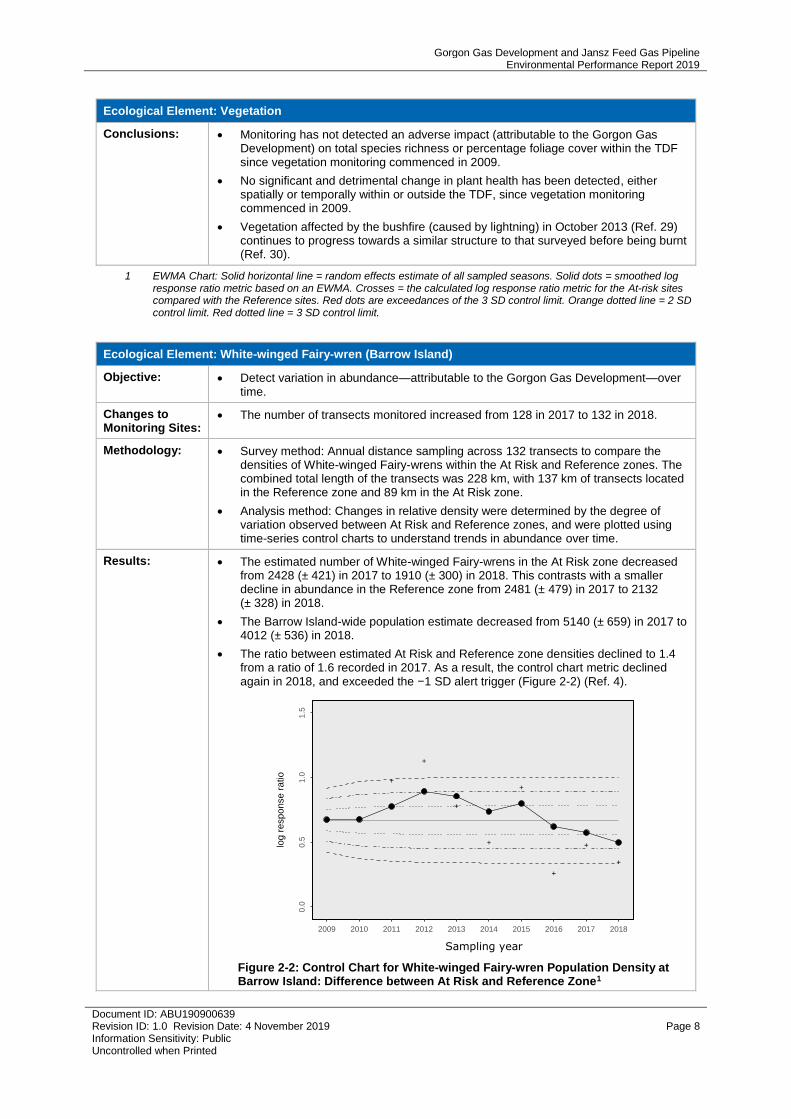
Results: • The estimated number of White-winged Fairy-wrens in the At Risk zone decreased from 2428 (± 421) in 2017 to 1910 (± 300) in 2018. This contrasts with a smaller decline in abundance in the Reference zone from 2481 (± 479) in 2017 to 2132 (± 328) in 2018.
• The Barrow Island-wide population estimate decreased from 5140 (± 659) in 2017 to 4012 (± 536) in 2018.
• The ratio between estimated At Risk and Reference zone densities declined to 1.4 from a ratio of 1.6 recorded in 2017. As a result, the control chart metric declined again in 2018, and exceeded the −1 SD alert trigger (Figure 2-2) (Ref. 4).
Sampling year
Figure 2-2: Control Chart for White-winged Fairy-wren Population Density at Barrow Island: Difference between At Risk and Reference Zone1
+ +
+
+
+
+
+
+
+
+
0.0
0.5
1.0
1.5
2009 2010 2011 2012 2013 2014 2015 2016 2017 2018
log r
esponse r
atio
white-winged fairy wren density EWMA control chartROM for at-risk vs reference zones
03
000
60
00
90
00
12
00
01
50
00
2009 2010 2011 2012 2013 2014 2015 2016 2017 2018
sampling year
isla
nd-w
ide p
opu
lation s
ize
Gorgon Gas Development and Jansz Feed Gas Pipeline Environmental Performance Report 2019
Document ID: ABU190900639 Revision ID: 1.0 Revision Date: 4 November 2019 Page 9 Information Sensitivity: Public Uncontrolled when Printed
Ecological Element: White-winged Fairy-wren (Barrow Island)
Conclusions: • Estimated densities in both the At Risk and Reference zones declined compared to 2017 estimates. This decline in density was likely due to summer rainfall in 2017-2018 being just 21 mm, which was less than 10% of the 2016-2017 rainfall of 277 mm. However, the decline was proportionally greater in the At Risk zone, and the density EWMA metric exceeded the −1 SD Alert trigger level.
• Monitoring has not detected an adverse impact (attributable to the Gorgon Gas Development) to the Barrow Island White-winged Fairy-wren population outside the TDF.
1 EWMA Chart: + = standardised difference metric; • = smoothed standardised difference metric based on exponentially weighted 3-year moving average; dotted curves represent ±1 SD, ±2 SD, and ±3 SD; solid line = zero centre-line.
Monitoring Program: Euro (Barrow Island)
Objective: • Detect variation in abundance—attributable to the Gorgon Gas Development—over time.
Changes to Monitoring Sites:
• Nocturnal monitoring was run concurrently with the Spectacled Hare-wallaby program. The number of nocturnal transects monitored decreased from 119 in 2017 back to 100 in 2018.
Methodology: • Survey method: Nocturnal distance sampling across 100 transects up to 2 km long was completed, with a total distance of 177 km walked. Transects totalled 64 km in the At Risk zone and 113 km in the Reference zone.
• Analysis method: Changes in relative density were determined by the degree of variation observed between At Risk and Reference zones, and were plotted using time-series control charts to understand trends in abundance over time.
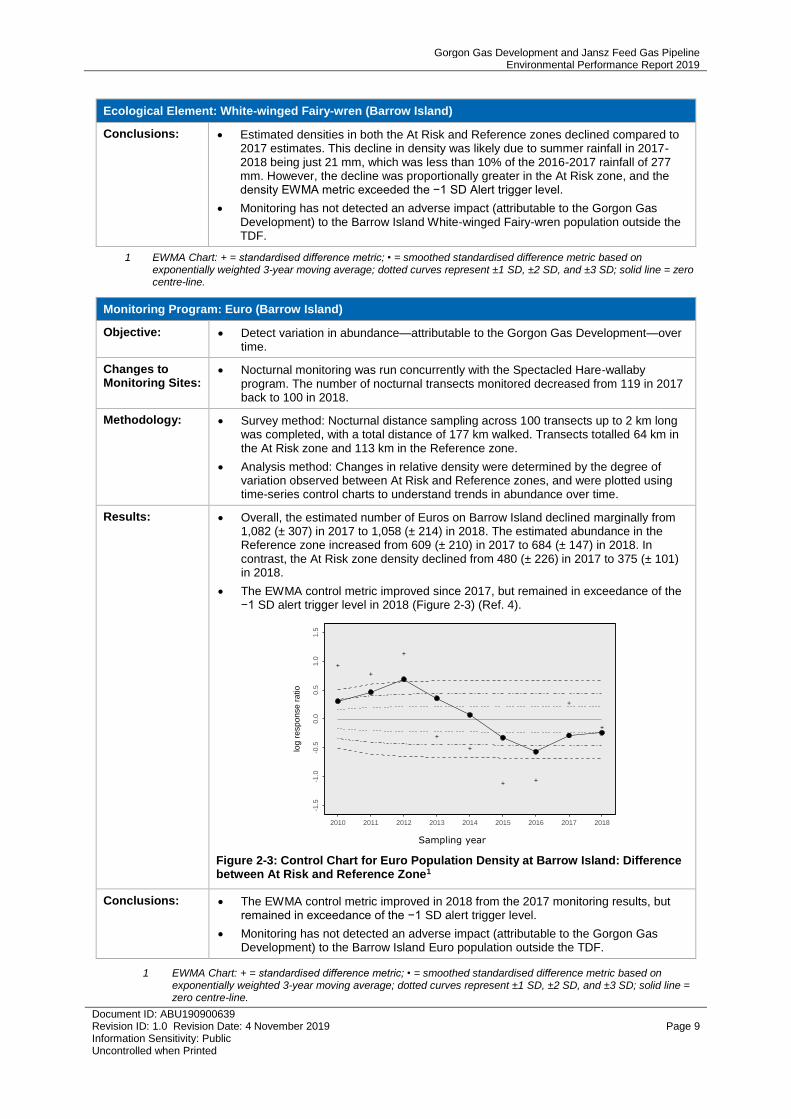
Results: • Overall, the estimated number of Euros on Barrow Island declined marginally from 1,082 (± 307) in 2017 to 1,058 (± 214) in 2018. The estimated abundance in the Reference zone increased from 609 (± 210) in 2017 to 684 (± 147) in 2018. In contrast, the At Risk zone density declined from 480 (± 226) in 2017 to 375 (± 101) in 2018.
• The EWMA control metric improved since 2017, but remained in exceedance of the −1 SD alert trigger level in 2018 (Figure 2-3) (Ref. 4).
Sampling year
Figure 2-3: Control Chart for Euro Population Density at Barrow Island: Difference between At Risk and Reference Zone1
Conclusions: • The EWMA control metric improved in 2018 from the 2017 monitoring results, but remained in exceedance of the −1 SD alert trigger level.
• Monitoring has not detected an adverse impact (attributable to the Gorgon Gas Development) to the Barrow Island Euro population outside the TDF.
1 EWMA Chart: + = standardised difference metric; • = smoothed standardised difference metric based on exponentially weighted 3-year moving average; dotted curves represent ±1 SD, ±2 SD, and ±3 SD; solid line = zero centre-line.
+
+
+
+
+
+ +
+
+
-1.5
-1.0
-0.5
0.0
0.5
1.0
1.5
2010 2011 2012 2013 2014 2015 2016 2017 2018
log
respon
se r
atio
euro density EWMA control chartROM for at-risk vs reference zones
05
00
10
00
15
00
200
02
50
03
000
2010 2011 2012 2013 2014 2015 2016 2017 2018
sampling year
isla
nd
-wid
e p
op
ula
tion s
ize
Gorgon Gas Development and Jansz Feed Gas Pipeline Environmental Performance Report 2019
Document ID: ABU190900639 Revision ID: 1.0 Revision Date: 4 November 2019 Page 10 Information Sensitivity: Public Uncontrolled when Printed
Monitoring Program: Spectacled Hare-wallaby (Barrow Island)
Objective: • Detect variation in abundance—attributable to the Gorgon Gas Development—over time.
Changes to Monitoring Sites:
• The number of nocturnal transects monitored decreased from 119 in 2017 to 100 in 2018. This resulted in a decrease in the distance covered, from 206 km in 2017 to 177 km in 2018.
Methodology: • Survey method: Annual distance sampling across 100 transects up to 2 km long was completed, with a total distance of 177 km walked. Transects totalled 64 km in the At Risk zone and 113 km in the Reference zone.
• Analysis method: Changes in relative density were determined by the degree of variation observed between At Risk and Reference zones, and were plotted using time-series control charts to understand trends in abundance over time.
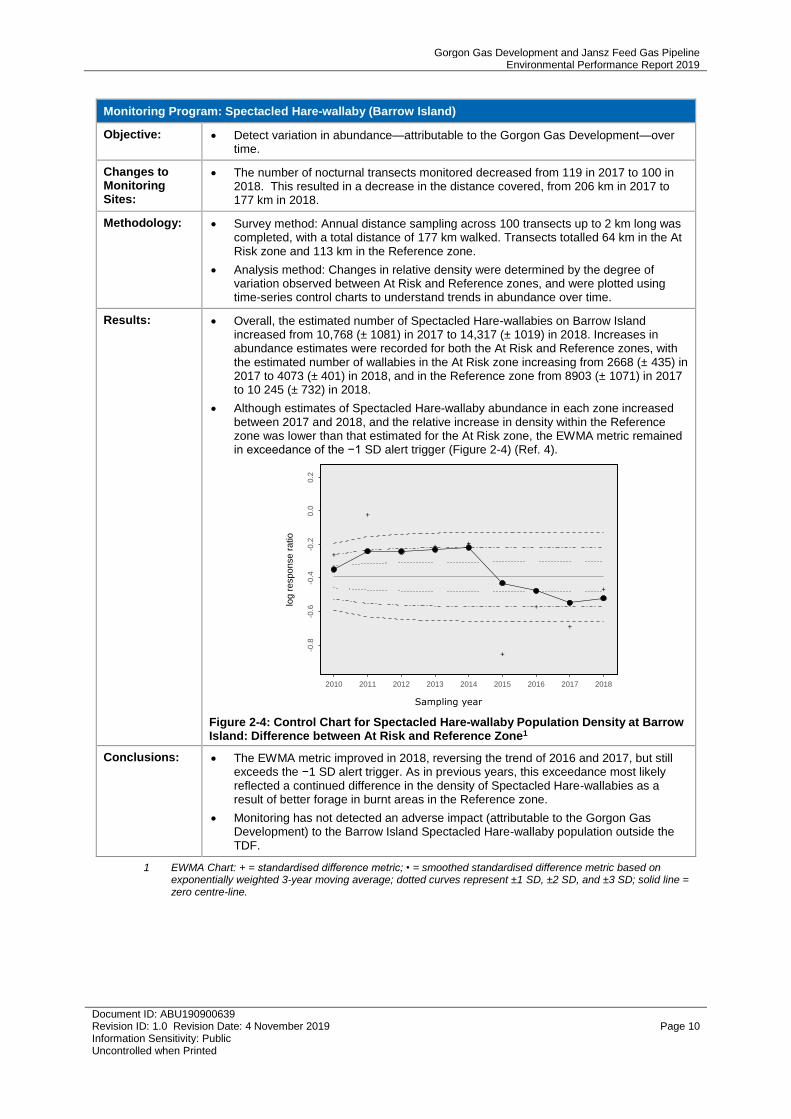
Results: • Overall, the estimated number of Spectacled Hare-wallabies on Barrow Island increased from 10,768 (± 1081) in 2017 to 14,317 (± 1019) in 2018. Increases in abundance estimates were recorded for both the At Risk and Reference zones, with the estimated number of wallabies in the At Risk zone increasing from 2668 (± 435) in 2017 to 4073 (± 401) in 2018, and in the Reference zone from 8903 (± 1071) in 2017 to 10 245 (± 732) in 2018.
• Although estimates of Spectacled Hare-wallaby abundance in each zone increased between 2017 and 2018, and the relative increase in density within the Reference zone was lower than that estimated for the At Risk zone, the EWMA metric remained in exceedance of the −1 SD alert trigger (Figure 2-4) (Ref. 4).
Sampling year
Figure 2-4: Control Chart for Spectacled Hare-wallaby Population Density at Barrow Island: Difference between At Risk and Reference Zone1
Conclusions: • The EWMA metric improved in 2018, reversing the trend of 2016 and 2017, but still exceeds the −1 SD alert trigger. As in previous years, this exceedance most likely reflected a continued difference in the density of Spectacled Hare-wallabies as a result of better forage in burnt areas in the Reference zone.
• Monitoring has not detected an adverse impact (attributable to the Gorgon Gas Development) to the Barrow Island Spectacled Hare-wallaby population outside the TDF.
1 EWMA Chart: + = standardised difference metric; • = smoothed standardised difference metric based on exponentially weighted 3-year moving average; dotted curves represent ±1 SD, ±2 SD, and ±3 SD; solid line = zero centre-line.
+
+
++ +
+
+
+
+
-0.8
-0.6
-0.4
-0.2
0.0
0.2
2010 2011 2012 2013 2014 2015 2016 2017 2018
log r
esponse r
atio
spectacled hare-wallaby density EWMA control chartROM for at-risk vs reference zones
30
00
60
00
90
00
12
00
01
50
00
18
00
0
2010 2011 2012 2013 2014 2015 2016 2017 2018
sampling year
isla
nd-w
ide p
opula
tion s
ize
Gorgon Gas Development and Jansz Feed Gas Pipeline Environmental Performance Report 2019
Document ID: ABU190900639 Revision ID: 1.0 Revision Date: 4 November 2019 Page 11 Information Sensitivity: Public Uncontrolled when Printed
Monitoring Program: Boodie (Barrow Island)
Objective: • Detect variation in abundance—attributable to the Gorgon Gas Development—over time.
Changes to Monitoring Sites:
• Warren B045 (midway between the Landing and Terminal Tank clusters) was included as a trapping site for the first time during the Reporting Period.
• Warren B018 was not trapped in 2018 because it had no discernible recent Boodie activity.
Methodology: • Survey method: Annual capture-mark-recapture sampling at 391 Boodie warrens.
• Analysis method: The capture-mark-recapture analyses included all capture histories from 40 historically trapped warrens. New warrens were included to better incorporate warrens that form part of a social cluster of warrens.
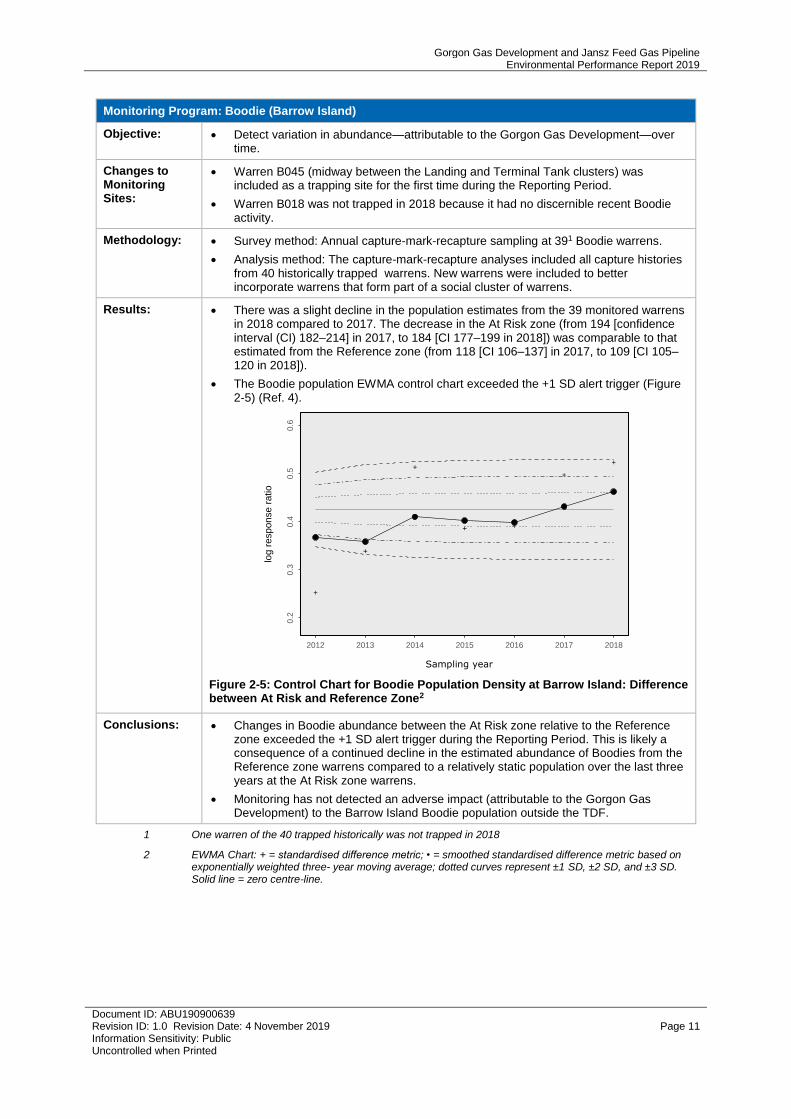
Results: • There was a slight decline in the population estimates from the 39 monitored warrens in 2018 compared to 2017. The decrease in the At Risk zone (from 194 [confidence interval (CI) 182–214] in 2017, to 184 [CI 177–199 in 2018]) was comparable to that estimated from the Reference zone (from 118 [CI 106–137] in 2017, to 109 [CI 105–120 in 2018]).
• The Boodie population EWMA control chart exceeded the +1 SD alert trigger (Figure 2-5) (Ref. 4).
Sampling year
Figure 2-5: Control Chart for Boodie Population Density at Barrow Island: Difference between At Risk and Reference Zone2
Conclusions: • Changes in Boodie abundance between the At Risk zone relative to the Reference zone exceeded the +1 SD alert trigger during the Reporting Period. This is likely a consequence of a continued decline in the estimated abundance of Boodies from the Reference zone warrens compared to a relatively static population over the last three years at the At Risk zone warrens.
• Monitoring has not detected an adverse impact (attributable to the Gorgon Gas Development) to the Barrow Island Boodie population outside the TDF.
1 One warren of the 40 trapped historically was not trapped in 2018
2 EWMA Chart: + = standardised difference metric; • = smoothed standardised difference metric based on exponentially weighted three- year moving average; dotted curves represent ±1 SD, ±2 SD, and ±3 SD. Solid line = zero centre-line.
+
+
+
+ +
+
+
0.2
0.3
0.4
0.5
0.6
2012 2013 2014 2015 2016 2017 2018
sampling year
log r
esponse r
atio
burrowing bettong population size EWMA control chartROM for at-risk vs reference zones
250
30
03
50
40
04
50
50
05
50
2012 2013 2014 2015 2016 2017 2018
sampling year
abun
dance a
t m
onitore
d m
ound
s
Gorgon Gas Development and Jansz Feed Gas Pipeline Environmental Performance Report 2019
Document ID: ABU190900639 Revision ID: 1.0 Revision Date: 4 November 2019 Page 12 Information Sensitivity: Public Uncontrolled when Printed
Monitoring Program: Perentie (Barrow Island)
Objective: • Detect variation in abundance—attributable to the Gorgon Gas Development—over time.
Changes to Monitoring Sites:
• Not applicable to this monitoring program. Impacts to Perentie individuals and populations are measured by recording road mortality data. Therefore, there are no prescribed monitoring sites.
Methodology: • A reliable monitoring tool does not exist to assess changes to the abundance of the Perentie on Barrow Island. Therefore, potential impacts to the Perentie population are measured by recording road mortality data.
Results: • Four road mortalities of Perentie were recorded during the Reporting Period1, which was half the number from 2017–2018, and significantly fewer than the 18 reported in 2016–2017.
• Of these recorded mortalities, two were adult Perenties and two were juveniles.
Conclusion: • A reliable monitoring tool currently does not exist to assess changes to the abundance of Perentie on Barrow Island. It is difficult to identify potential impacts from the Gorgon Gas Development on the abundance of Perenties based on the mortality data collected during the Reporting Period.
1 Includes mortalities where the cause of the mortality was attributed to the Gorgon Gas Development, or where the cause of the mortality was unknown; does not include mortalities where the cause of the mortality was natural.
Monitoring Program: Wedge-tailed Shearwater
Objective: • Detect variation in abundance and demographics—attributable to the Gorgon Gas Development—over time.
Changes to Monitoring Sites:
• No changes were made to the Wedge-tailed Shearwater monitoring sites during the Reporting Period.
Methodology: • Survey method: Three fixed long-term transects (100 m × 10 m) on each of Double Island North, Double Island South (At Risk islands), and Boodie Islanda, (Reference island), were surveyed twice during the summer breeding season. During the first survey (to measure Breeding Participation during early egg incubation period), all burrows within transects were counted, giving Burrow Density, and contents checked using a purpose-built burrow scope to identify breeding attempts (as indicated by the presence of an egg). During the second visit (to measure Fledging Success), all burrows present in the transects were re-examined to identify presence of chicks/fledglings. Nests containing live, well-developed fledglings at this time were considered to be fledged.
• a Note: From the 2018 season onward, Ah Chong Island (an island in the Montebello group, 31 km NNE of the Gorgon Gas Development) will replace Boodie Island as a Reference island for the Wedge-tailed Shearwater monitoring program.
• Analysis method: The three metrics used for control charting were:
– Burrow Density = total number of burrows (active and inactive) in the transect per 100 m2
– Breeding Participation = number of breeding attempts divided by the number of burrows (active and inactive), expressed as a percentage
– Fledging Success = number of chicks/fledglings present during the second field visit divided by the number of breeding attempts derived from the first field visit, expressed as a percentage.
• In the 2016 and 2017 seasons, burrows that contained an adult Wedge-tailed Shearwater alone were included as a breeding attempt in the analysis, regardless of whether an egg was visually confirmed as being present. In the 2018 season, breeding attempts were only determined on the confirmed presence of an egg, since the presence of an adult bird alone was not considered to be a reliable indicator of a breeding attempt.
• Changes were determined by the degree of variation observed between At Risk and Reference islands, and were plotted using time-series control charts to understand trends in abundance over time.
Gorgon Gas Development and Jansz Feed Gas Pipeline Environmental Performance Report 2019
Document ID: ABU190900639 Revision ID: 1.0 Revision Date: 4 November 2019 Page 13 Information Sensitivity: Public Uncontrolled when Printed
Monitoring Program: Wedge-tailed Shearwater
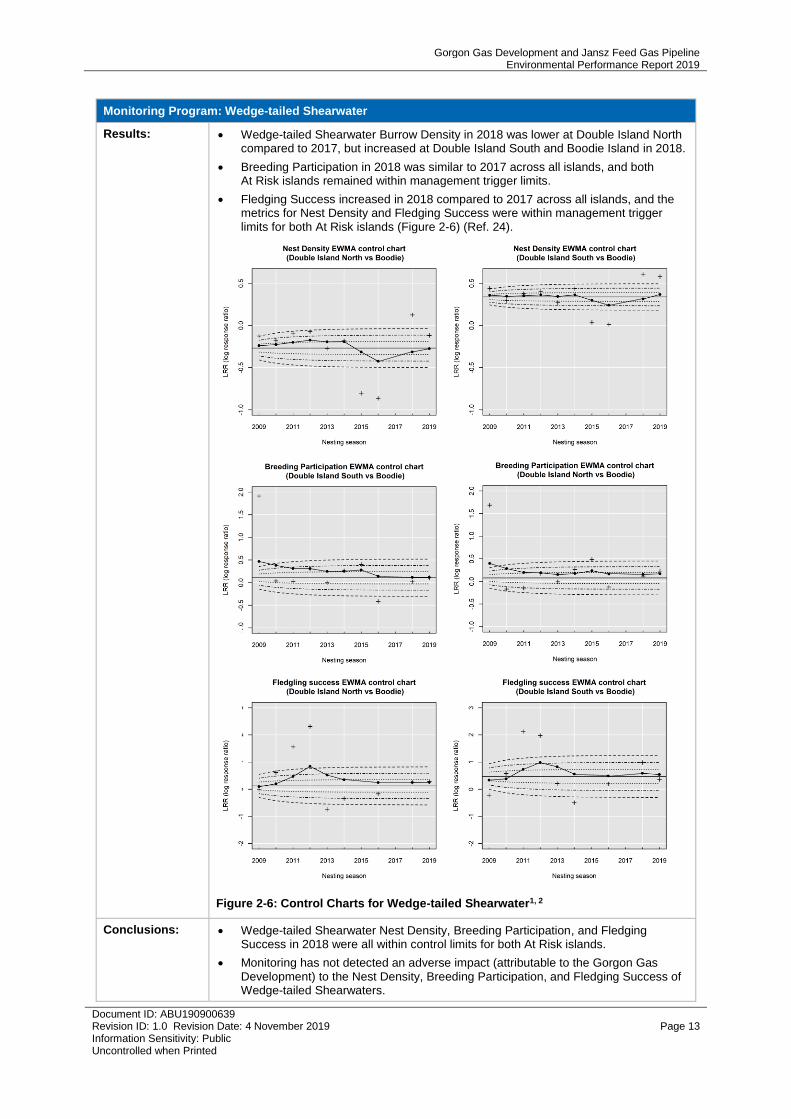
Results: • Wedge-tailed Shearwater Burrow Density in 2018 was lower at Double Island North compared to 2017, but increased at Double Island South and Boodie Island in 2018.
• Breeding Participation in 2018 was similar to 2017 across all islands, and both At Risk islands remained within management trigger limits.
• Fledging Success increased in 2018 compared to 2017 across all islands, and the metrics for Nest Density and Fledging Success were within management trigger limits for both At Risk islands (Figure 2-6) (Ref. 24).
Figure 2-6: Control Charts for Wedge-tailed Shearwater1, 2
Conclusions: • Wedge-tailed Shearwater Nest Density, Breeding Participation, and Fledging Success in 2018 were all within control limits for both At Risk islands.
• Monitoring has not detected an adverse impact (attributable to the Gorgon Gas Development) to the Nest Density, Breeding Participation, and Fledging Success of Wedge-tailed Shearwaters.
Gorgon Gas Development and Jansz Feed Gas Pipeline Environmental Performance Report 2019
Document ID: ABU190900639 Revision ID: 1.0 Revision Date: 4 November 2019 Page 14 Information Sensitivity: Public Uncontrolled when Printed
1 EWMA Chart: + = log response ratio metric for the At Risk population compared with the Reference population, which is then centred around the random effects estimate of all sampled seasons (= thin horizontal line); • = smoothed log response ratio metric based on an exponentially weighted 3-year moving average; dotted curves represent ±1 SD, ±2 SD, and ±3 SD.
2 Notes: (i) The 2017 EPR (Ref. 25) referred to the control metric ‘Breeding Participation’ as ‘Breed Rate’ and ‘Fledging Success’ as ‘Egg Success’. (ii) The Nest Density metric for the Reporting Period included all nests, as was done in all seasons prior to 2016-2017, whereas only active nests were included in 2016-2017; the 2016-2017 data point has therefore been removed from the relevant EWMA charts due to long-term dataset incompatibility. No fledgling success data were collected for the 2014-2015 reporting period.
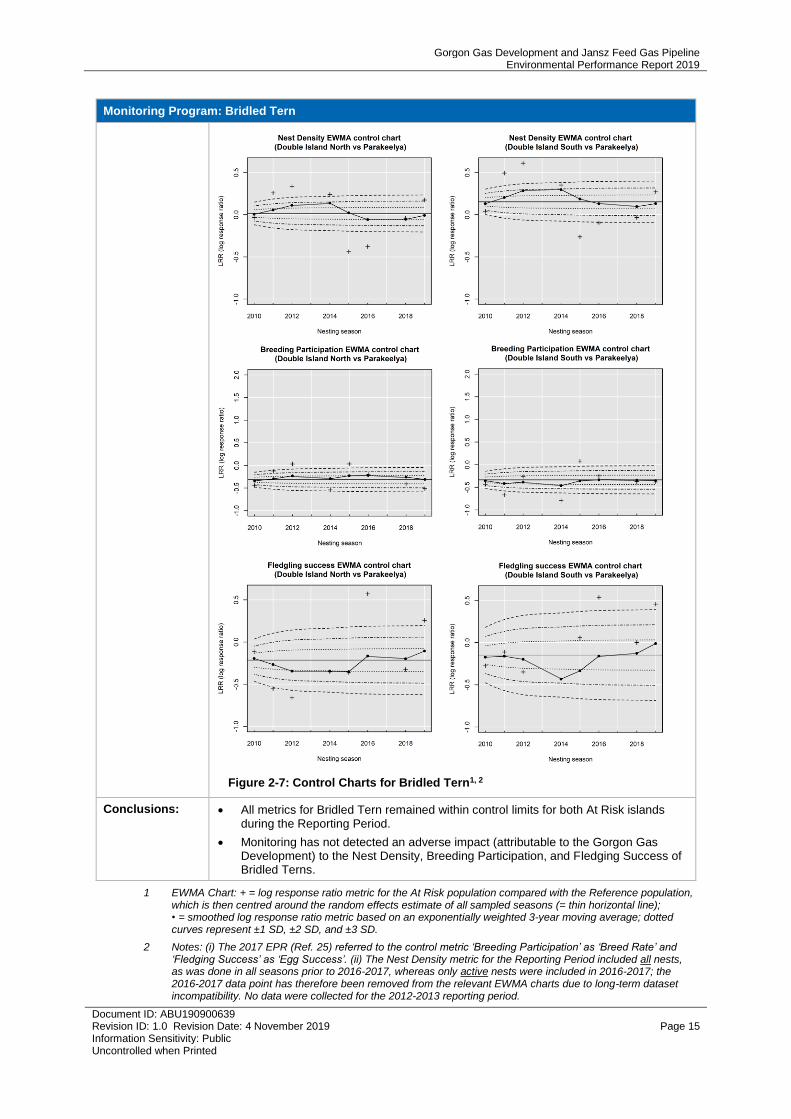
Monitoring Program: Bridled Tern
Objective: • Detect variation in abundance and demographics—attributable to the Gorgon Gas Development—over time.
Changes to Monitoring Sites:
• No changes were made to the Bridled Tern monitoring sites during the Reporting Period.
Methodology: • Survey method: Three fixed long-term transects (100 m × 10 m) on each of Double Island North, Double Island South (At Risk islands), and Parakeelya Island (Reference island) were surveyed twice during the summer breeding season. During the first survey (to determine Breeding Participation during early egg incubation period), all nesting sites within transects were counted, giving Nest Density, and those containing either an egg or signs of a chick, were counted as a breeding attempt. During the second visit (to measure Fledging Success just prior to predicted fledging), all nests present in the transects were re-examined for evidence of breeding activity, and nests identified as having a breeding attempt during the first survey were revisited to check for pre-fledging chicks.
• Analysis method: The three metrics used for control charting were:
– Nest Density = total number of nests (active and inactive) in the transect per 100 m2
– Breeding Participation = number of breeding attempts divided by the number of nests (active and inactive), expressed as a percentage
– Fledging Success = number of fledglings present during the second field visit divided by the number of breeding attempts derived from the first field visit, expressed as a percentage.
• In 2017, a breeding attempt was determined if an egg, chick, chick scats, or adult tern was present. However, in 2018, the presence of an adult tern alone was not considered a reliable indicator of a breeding attempt. A purpose-built scope was also used to inspect deep rocky crevices or burrows (where terns are known to nest) that showed signs of activity.
• Changes were determined by the degree of variation observed between At Risk and Reference islands, and were plotted using time-series control charts to understand trends in abundance over time.
Results: • Nest density increased at all monitored islands between 2017 and 2018. Although this increase was more notable at the At Risk islands, resulting in a relative increase in the control chart for this metric, both At Risk islands remained within management control limits.
• Breeding Participation was lower in 2018 compared to 2017, but both At Risk islands remained within management control limits.
• Fledging Success improved between 2017 and 2018 on both At Risk islands, but was lower on the Reference island, and remained within management control limits (Figure 2-7) (Ref. 24).
Gorgon Gas Development and Jansz Feed Gas Pipeline Environmental Performance Report 2019
Document ID: ABU190900639 Revision ID: 1.0 Revision Date: 4 November 2019 Page 15 Information Sensitivity: Public Uncontrolled when Printed
Monitoring Program: Bridled Tern
Figure 2-7: Control Charts for Bridled Tern1, 2
Conclusions: • All metrics for Bridled Tern remained within control limits for both At Risk islands during the Reporting Period.
• Monitoring has not detected an adverse impact (attributable to the Gorgon Gas Development) to the Nest Density, Breeding Participation, and Fledging Success of Bridled Terns.
1 EWMA Chart: + = log response ratio metric for the At Risk population compared with the Reference population, which is then centred around the random effects estimate of all sampled seasons (= thin horizontal line); • = smoothed log response ratio metric based on an exponentially weighted 3-year moving average; dotted curves represent ±1 SD, ±2 SD, and ±3 SD.
2 Notes: (i) The 2017 EPR (Ref. 25) referred to the control metric ‘Breeding Participation’ as ‘Breed Rate’ and ‘Fledging Success’ as ‘Egg Success’. (ii) The Nest Density metric for the Reporting Period included all nests, as was done in all seasons prior to 2016-2017, whereas only active nests were included in 2016-2017; the 2016-2017 data point has therefore been removed from the relevant EWMA charts due to long-term dataset incompatibility. No data were collected for the 2012-2013 reporting period.
Gorgon Gas Development and Jansz Feed Gas Pipeline Environmental Performance Report 2019
Document ID: ABU190900639 Revision ID: 1.0 Revision Date: 4 November 2019 Page 16 Information Sensitivity: Public Uncontrolled when Printed
Monitoring Program: Groundwater
Objective: • Collect information on groundwater levels and the physicochemical parameters of the groundwater to diagnose observed changes—attributable to the Gorgon Gas Development—over time.
Changes to Monitoring Sites:
• No deviation from the Gorgon GTP Groundwater Monitoring Sampling and Analysis Quality Plan (GMSAQP) (Ref. 5).
Methodology: Survey method
• During the Reporting Period, two six-monthly groundwater monitoring events were undertaken—September 2018 (Ref. 6), and March and May1 2019 (Ref. 7). 1 Note: A cyclone resulted in early demobilisation from Barrow Island in March 2019, so two GTP wells (GW-GTP-24A and GW-GTP-24B) were sampled in May 2019.
• Groundwater samples were collected from 13 wells within the GTP. Samples were also collected from two wells near the permanent water disposal location on Road 5 and from two wells near the temporary water disposal location at the central processing facility. Samples were collected using low-flow sampling techniques. Physical parameters (including water level, pH, electrical conductivity [EC], redox potential [ORP], dissolved oxygen and temperature) were recorded in the field. Samples were also sent to a National Association of Testing Authorities accredited laboratory for further analysis.
Analysis method
GTP Wells – Shallow
• Laboratory analysis was conducted for physical parameters, major cations, major anions, mercury, monoethylene glycol (MEG), activated methyl diethanolamine (aMDEA), benzene, toluene, ethylbenzene, and xylenes (BTEX), total recoverable hydrocarbons (TRH), and dissolved organic carbon (DOC).
GTP Wells – Deep
• Laboratory analysis was conducted for physical parameters, major cations, major anions, mercury, MEG, aMDEA, and DOC.
Permanent Disposal Wells
• Laboratory analysis was conducted for physical parameters, major cations, major anions, mercury, MEG, aMDEA, BTEX, TRH, DOC, and nutrients.
Temporary Disposal Wells
• Laboratory analysis was conducted for physical parameters, major cations, major anions, mercury, BTEX, TRH, DOC, and nutrients.
All Wells
• Where applicable, wells were analysed for additional analytes such as TRH silica gel clean-up, polycyclic aromatic hydrocarbons, monocyclic aromatic hydrocarbons, and a full metals suite.
• Field and laboratory results were compared to published water quality criteria guidelines, limits of reporting (LORs), and/or maximum recorded baseline values. Changes in selected groundwater parameters are used as an indirect habitat indicator for stygofauna.
Results: GTP Wells
• Analysis of results for the GTP wells indicated that parameters were generally within the range of baseline results, were not detected above the LOR, and/or were below assessment criteria, as outlined in the GMSAQP (Ref. 5), except for:
– The groundwater at GTP Wells GW-GTP-04A and GW-GTP-04B recorded oxidising conditions in September 2018, compared to neutral redox conditions during previous monitoring events. The March 2019 results were consistent with historical conditions.
– The groundwater at GW-GTP-02B recorded oxidising conditions in September 2018, compared to neutral to reducing conditions in previous monitoring rounds. The March 2019 results were consistent with historical conditions.
– The pH of the groundwater at GW05-B was slightly basic in September 2018, compared to neutral conditions recorded in previous monitoring events. The
Gorgon Gas Development and Jansz Feed Gas Pipeline Environmental Performance Report 2019
Document ID: ABU190900639 Revision ID: 1.0 Revision Date: 4 November 2019 Page 17 Information Sensitivity: Public Uncontrolled when Printed
Monitoring Program: Groundwater
March 2019 results were consistent with historical conditions. The pH recorded during September 2018 may be slightly elevated compared to previous monitoring rounds because laboratory pH was used in place of in situ readings due to issues with the field instrument.
Temporary Disposal Wells
• Analysis of results for the temporary disposal wells indicated that parameters were generally within the range of baseline results, were not detected above the LOR, and/or were below assessment criteria, as outlined in the GMSAQP (Ref. 5), except for:
– The groundwater at Temporary Disposal Wells DWDB1-MW2 and DWDB1-MW3 recorded nitrate (as N) exceedances of the assessment criteria in September 2018 and March 2019, although results were within the historical range of nitrate concentrations.
– Total phosphorus (as P) was recorded above the assessment criterion at DWDB1-MW2 and DWDB1-MW3 in September 2018 and March 2019, but the concentrations of total phosphorus remain within the range of historical concentrations for both wells.
– TRH Fraction 3 (F3) was recorded above the adopted assessment criterion (laboratory LOR) at DWDB1-MW2 (0.21 mg/L) in March 2019. This concentration is similar to what was reported during the April 2016 baseline monitoring event (0.20 mg/L). The chromatogram was typical of TPH from a weathered crude or produced water source.
Permanent Disposal Wells
• Analysis of results for the permanent disposal wells indicated that parameters were not detected above the LOR and/or were below assessment criteria, as outlined in the GMSAQP (Ref. 5), except for:
– Groundwater conditions at the permanent disposal wells GW-RD5-02 and GW-RD5-03 recorded reduced salinity, increased dissolved oxygen, and a change in anionic composition relative to historical monitoring in both September 2018 and March 2019. These changes were also recorded in previous monitoring events (August 2017 onwards).
– Concentrations of nitrate (as N) exceeded the relevant assessment criteria at GW-RD5-02 in both September 2018 and March 2019, but concentrations were within the historical range recorded at this well.
– Total phosphorus (as P) was recorded above the assessment criteria at GW-RD5-02 in September 2018, but remained within historical concentrations. Total phosphorus (as P) was below the laboratory LOR at GW-RD5-02 in March 2019 (Ref. 6; Ref. 7).
Conclusions: • Groundwater monitoring during the Reporting Period was completed in accordance with the TSEMP (Ref. 1). Transition to the operations phase of monitoring commenced in August 2017 with the implementation of the GMSAQP (Ref. 5).
• Monitoring in the GTP and temporary disposal wells has generally indicated no significant observable changes have occurred to groundwater (attributable to the Gorgon Gas Development) during the Reporting Period.
• Monitoring in the permanent disposal wells (GW-RD5-02 and GW-RD5-03) has indicated reduced salinity, increased dissolved oxygen and a change in anionic composition relative to historical monitoring.
Monitoring Program: Surface Water Landform
Objective: • Detect impacts to surface water landforms extending beyond the TDF, which over time, may be attributable to the Gorgon Gas Development.
Changes to Monitoring Sites:
• No changes were made to the 14 surface water landform monitoring sites during the Reporting Period.
Gorgon Gas Development and Jansz Feed Gas Pipeline Environmental Performance Report 2019
Document ID: ABU190900639 Revision ID: 1.0 Revision Date: 4 November 2019 Page 18 Information Sensitivity: Public Uncontrolled when Printed
Monitoring Program: Surface Water Landform
Methodology: • Desktop review of annual airborne light detection and ranging survey results, coupled with field verification as required, to identify areas of potential significant erosion or sedimentation of surface water landforms.
Results: • Based on spatial analysis interpretations, no significant erosion or sedimentation was observed at any of the 14 monitoring sites.
• Because no areas of significant impact to surface water landforms were identified through desktop analysis, follow-up field inspections were not required (Ref. 3).
Conclusion: • Monitoring to date has not detected an adverse impact (attributable to the Gorgon Gas Development) to surface water landforms.
2.2 Event Data
The Threatened or Listed fauna reporting undertaken during the Reporting Period is summarised in the following table.
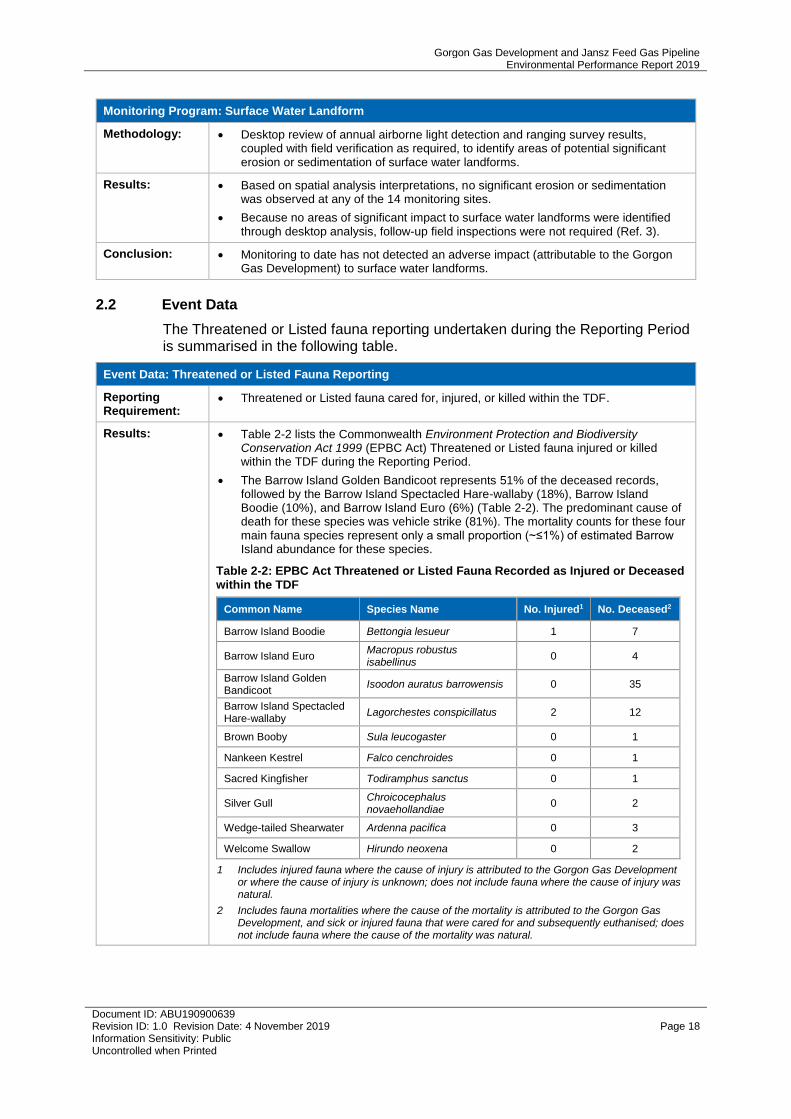
Event Data: Threatened or Listed Fauna Reporting
Reporting Requirement:
• Threatened or Listed fauna cared for, injured, or killed within the TDF.
Results: • Table 2-2 lists the Commonwealth Environment Protection and Biodiversity Conservation Act 1999 (EPBC Act) Threatened or Listed fauna injured or killed within the TDF during the Reporting Period.
• The Barrow Island Golden Bandicoot represents 51% of the deceased records, followed by the Barrow Island Spectacled Hare-wallaby (18%), Barrow Island Boodie (10%), and Barrow Island Euro (6%) (Table 2-2). The predominant cause of death for these species was vehicle strike (81%). The mortality counts for these four main fauna species represent only a small proportion (~≤1%) of estimated Barrow Island abundance for these species.
Table 2-2: EPBC Act Threatened or Listed Fauna Recorded as Injured or Deceased within the TDF
Common Name Species Name No. Injured1 No. Deceased2
Barrow Island Boodie Bettongia lesueur 1 7
Barrow Island Euro Macropus robustus isabellinus
0 4
Barrow Island Golden Bandicoot
Isoodon auratus barrowensis 0 35
Barrow Island Spectacled Hare-wallaby
Lagorchestes conspicillatus 2 12
Brown Booby Sula leucogaster 0 1
Nankeen Kestrel Falco cenchroides 0 1
Sacred Kingfisher Todiramphus sanctus 0 1
Silver Gull Chroicocephalus novaehollandiae
0 2
Wedge-tailed Shearwater Ardenna pacifica 0 3
Welcome Swallow Hirundo neoxena 0 2
1 Includes injured fauna where the cause of injury is attributed to the Gorgon Gas Development or where the cause of injury is unknown; does not include fauna where the cause of injury was natural.
2 Includes fauna mortalities where the cause of the mortality is attributed to the Gorgon Gas Development, and sick or injured fauna that were cared for and subsequently euthanised; does not include fauna where the cause of the mortality was natural.
Gorgon Gas Development and Jansz Feed Gas Pipeline Environmental Performance Report 2019
Document ID: ABU190900639 Revision ID: 1.0 Revision Date: 4 November 2019 Page 19 Information Sensitivity: Public Uncontrolled when Printed
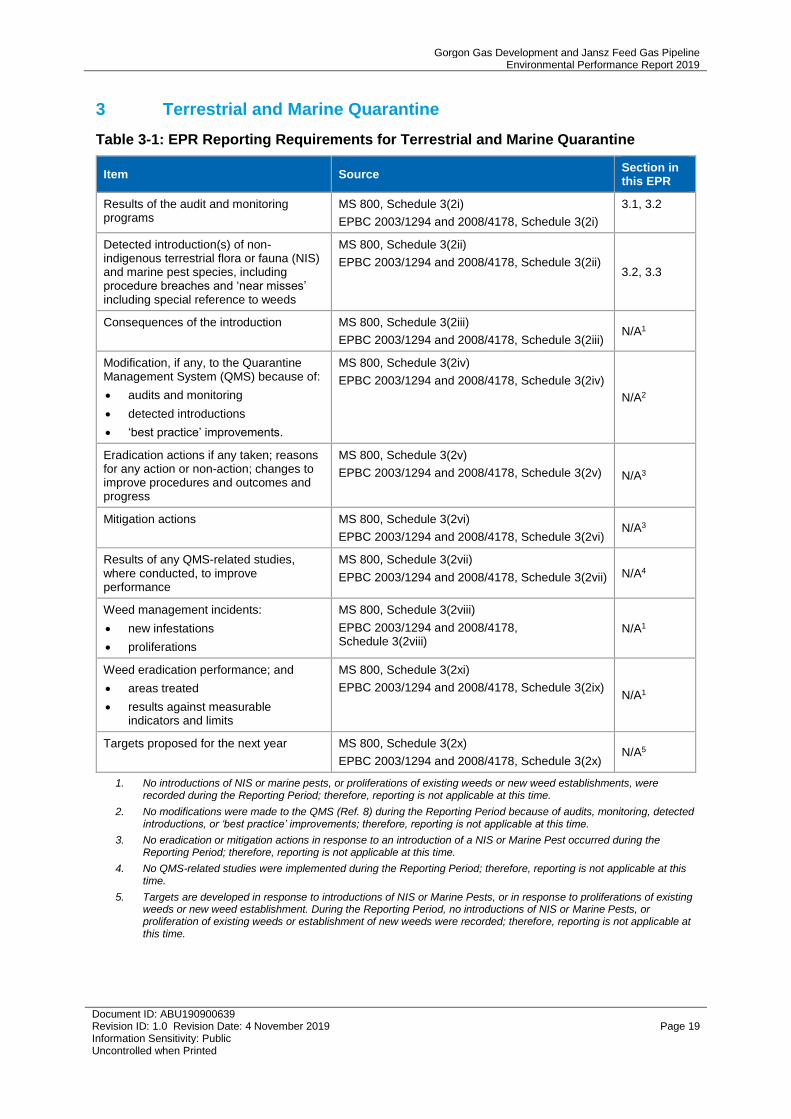
3 Terrestrial and Marine Quarantine
Table 3-1: EPR Reporting Requirements for Terrestrial and Marine Quarantine
Item Source Section in this EPR
Results of the audit and monitoring programs
MS 800, Schedule 3(2i)
EPBC 2003/1294 and 2008/4178, Schedule 3(2i)
3.1, 3.2
Detected introduction(s) of non-indigenous terrestrial flora or fauna (NIS) and marine pest species, including procedure breaches and ‘near misses’ including special reference to weeds
MS 800, Schedule 3(2ii)
EPBC 2003/1294 and 2008/4178, Schedule 3(2ii) 3.2, 3.3
Consequences of the introduction MS 800, Schedule 3(2iii)
EPBC 2003/1294 and 2008/4178, Schedule 3(2iii) N/A1
Modification, if any, to the Quarantine Management System (QMS) because of:
• audits and monitoring
• detected introductions
• ‘best practice’ improvements.
MS 800, Schedule 3(2iv)
EPBC 2003/1294 and 2008/4178, Schedule 3(2iv)
N/A2
Eradication actions if any taken; reasons for any action or non-action; changes to improve procedures and outcomes and progress
MS 800, Schedule 3(2v)
EPBC 2003/1294 and 2008/4178, Schedule 3(2v) N/A3
Mitigation actions MS 800, Schedule 3(2vi)
EPBC 2003/1294 and 2008/4178, Schedule 3(2vi) N/A3
Results of any QMS-related studies, where conducted, to improve performance
MS 800, Schedule 3(2vii)
EPBC 2003/1294 and 2008/4178, Schedule 3(2vii) N/A4
Weed management incidents:
• new infestations
• proliferations
MS 800, Schedule 3(2viii)
EPBC 2003/1294 and 2008/4178, Schedule 3(2viii)
N/A1
Weed eradication performance; and
• areas treated
• results against measurable indicators and limits
MS 800, Schedule 3(2xi)
EPBC 2003/1294 and 2008/4178, Schedule 3(2ix) N/A1
Targets proposed for the next year MS 800, Schedule 3(2x)
EPBC 2003/1294 and 2008/4178, Schedule 3(2x) N/A5
1. No introductions of NIS or marine pests, or proliferations of existing weeds or new weed establishments, were recorded during the Reporting Period; therefore, reporting is not applicable at this time.
2. No modifications were made to the QMS (Ref. 8) during the Reporting Period because of audits, monitoring, detected introductions, or ‘best practice’ improvements; therefore, reporting is not applicable at this time.
3. No eradication or mitigation actions in response to an introduction of a NIS or Marine Pest occurred during the Reporting Period; therefore, reporting is not applicable at this time.
4. No QMS-related studies were implemented during the Reporting Period; therefore, reporting is not applicable at this time.
5. Targets are developed in response to introductions of NIS or Marine Pests, or in response to proliferations of existing weeds or new weed establishment. During the Reporting Period, no introductions of NIS or Marine Pests, or proliferation of existing weeds or establishment of new weeds were recorded; therefore, reporting is not applicable at this time.
Gorgon Gas Development and Jansz Feed Gas Pipeline Environmental Performance Report 2019
Document ID: ABU190900639 Revision ID: 1.0 Revision Date: 4 November 2019 Page 20 Information Sensitivity: Public Uncontrolled when Printed
3.1 Audits
CAPL audits of the quarantine management measures described in the QMS (Ref. 8) are conducted at least biennially during Project operations. Therefore, no CAPL audits were undertaken on the QMS during the Reporting Period. Similarly, no Regulator audits were carried out on the QMS during the Reporting Period.
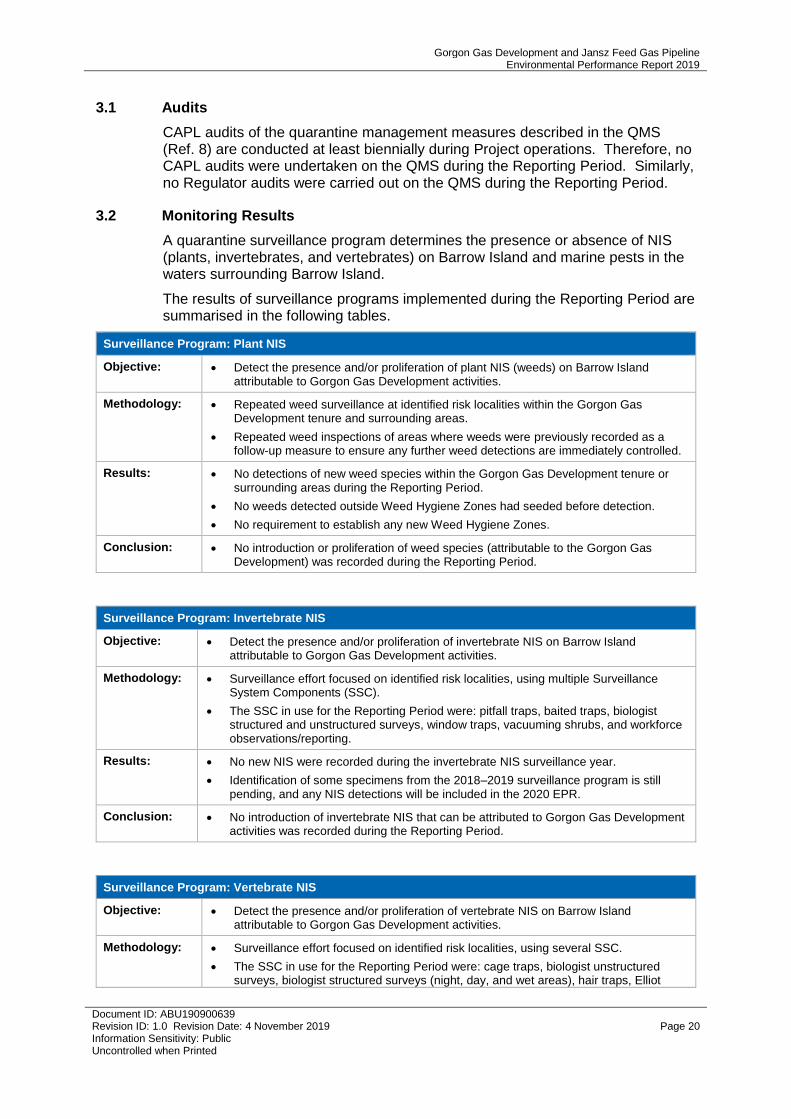
3.2 Monitoring Results
A quarantine surveillance program determines the presence or absence of NIS (plants, invertebrates, and vertebrates) on Barrow Island and marine pests in the waters surrounding Barrow Island.
The results of surveillance programs implemented during the Reporting Period are summarised in the following tables.
Surveillance Program: Plant NIS
Objective: • Detect the presence and/or proliferation of plant NIS (weeds) on Barrow Island attributable to Gorgon Gas Development activities.
Methodology: • Repeated weed surveillance at identified risk localities within the Gorgon Gas Development tenure and surrounding areas.
• Repeated weed inspections of areas where weeds were previously recorded as a follow-up measure to ensure any further weed detections are immediately controlled.
Results: • No detections of new weed species within the Gorgon Gas Development tenure or surrounding areas during the Reporting Period.
• No weeds detected outside Weed Hygiene Zones had seeded before detection.
• No requirement to establish any new Weed Hygiene Zones.
Conclusion: • No introduction or proliferation of weed species (attributable to the Gorgon Gas Development) was recorded during the Reporting Period.
Surveillance Program: Invertebrate NIS
Objective: • Detect the presence and/or proliferation of invertebrate NIS on Barrow Island attributable to Gorgon Gas Development activities.
Methodology: • Surveillance effort focused on identified risk localities, using multiple Surveillance System Components (SSC).
• The SSC in use for the Reporting Period were: pitfall traps, baited traps, biologist structured and unstructured surveys, window traps, vacuuming shrubs, and workforce observations/reporting.
Results: • No new NIS were recorded during the invertebrate NIS surveillance year.
• Identification of some specimens from the 2018–2019 surveillance program is still pending, and any NIS detections will be included in the 2020 EPR.
Conclusion: • No introduction of invertebrate NIS that can be attributed to Gorgon Gas Development activities was recorded during the Reporting Period.
Surveillance Program: Vertebrate NIS
Objective: • Detect the presence and/or proliferation of vertebrate NIS on Barrow Island attributable to Gorgon Gas Development activities.
Methodology: • Surveillance effort focused on identified risk localities, using several SSC.
• The SSC in use for the Reporting Period were: cage traps, biologist unstructured surveys, biologist structured surveys (night, day, and wet areas), hair traps, Elliot
Gorgon Gas Development and Jansz Feed Gas Pipeline Environmental Performance Report 2019
Document ID: ABU190900639 Revision ID: 1.0 Revision Date: 4 November 2019 Page 21 Information Sensitivity: Public Uncontrolled when Printed
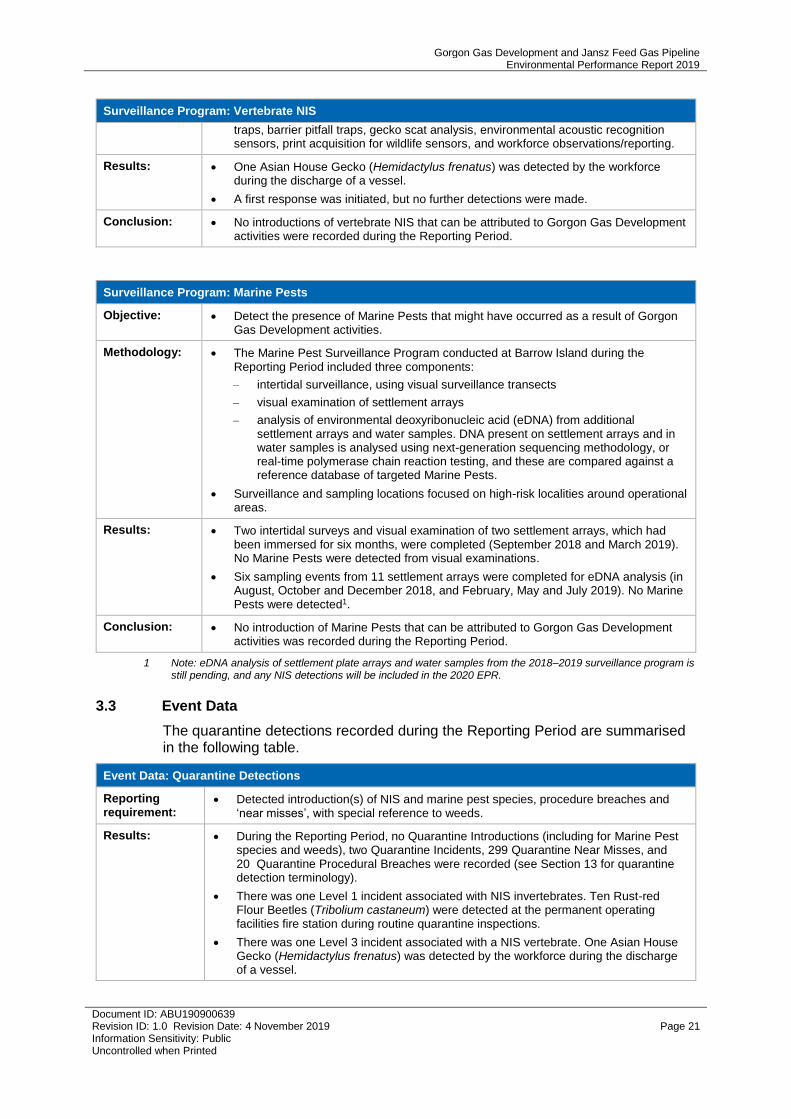
Surveillance Program: Vertebrate NIS
traps, barrier pitfall traps, gecko scat analysis, environmental acoustic recognition sensors, print acquisition for wildlife sensors, and workforce observations/reporting.
Results: • One Asian House Gecko (Hemidactylus frenatus) was detected by the workforce during the discharge of a vessel.
• A first response was initiated, but no further detections were made.
Conclusion: • No introductions of vertebrate NIS that can be attributed to Gorgon Gas Development activities were recorded during the Reporting Period.
Surveillance Program: Marine Pests
Objective: • Detect the presence of Marine Pests that might have occurred as a result of Gorgon Gas Development activities.
Methodology: • The Marine Pest Surveillance Program conducted at Barrow Island during the Reporting Period included three components:
– intertidal surveillance, using visual surveillance transects
– visual examination of settlement arrays
– analysis of environmental deoxyribonucleic acid (eDNA) from additional settlement arrays and water samples. DNA present on settlement arrays and in water samples is analysed using next-generation sequencing methodology, or real-time polymerase chain reaction testing, and these are compared against a reference database of targeted Marine Pests.
• Surveillance and sampling locations focused on high-risk localities around operational areas.
Results: • Two intertidal surveys and visual examination of two settlement arrays, which had been immersed for six months, were completed (September 2018 and March 2019). No Marine Pests were detected from visual examinations.
• Six sampling events from 11 settlement arrays were completed for eDNA analysis (in August, October and December 2018, and February, May and July 2019). No Marine Pests were detected1.
Conclusion: • No introduction of Marine Pests that can be attributed to Gorgon Gas Development activities was recorded during the Reporting Period.
1 Note: eDNA analysis of settlement plate arrays and water samples from the 2018–2019 surveillance program is still pending, and any NIS detections will be included in the 2020 EPR.
3.3 Event Data
The quarantine detections recorded during the Reporting Period are summarised in the following table.
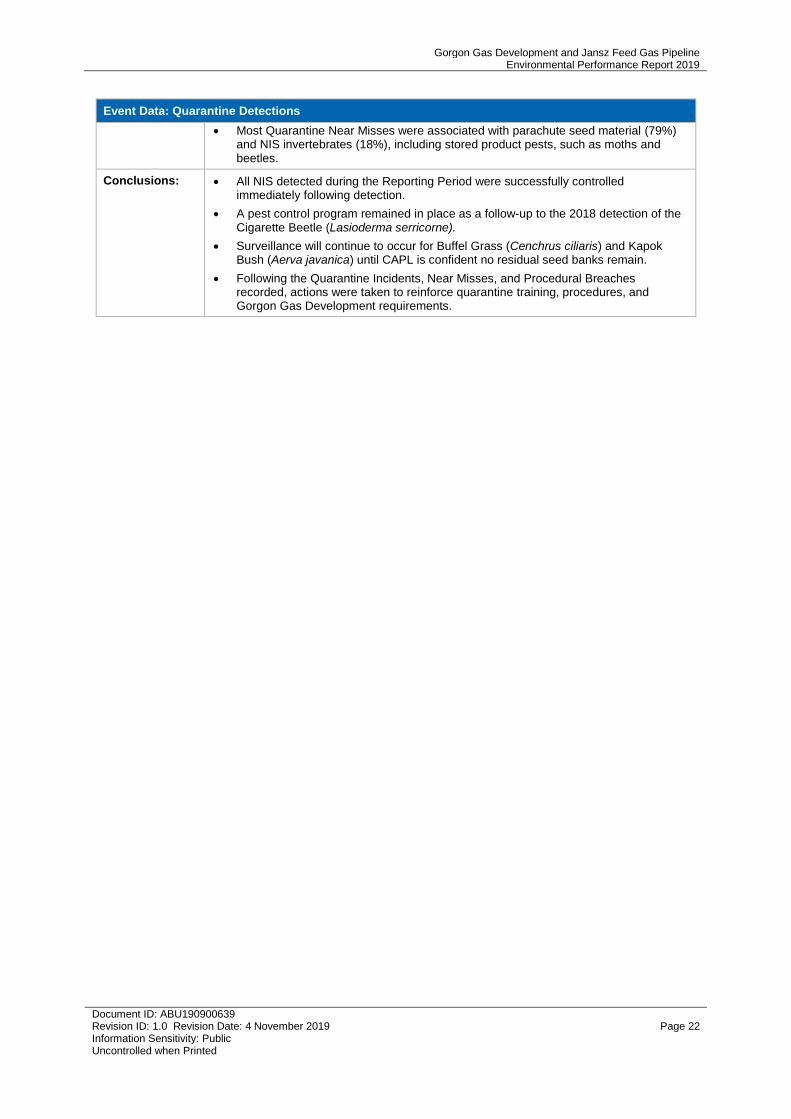
Event Data: Quarantine Detections
Reporting requirement:
• Detected introduction(s) of NIS and marine pest species, procedure breaches and ‘near misses’, with special reference to weeds.
Results: • During the Reporting Period, no Quarantine Introductions (including for Marine Pest species and weeds), two Quarantine Incidents, 299 Quarantine Near Misses, and 20 Quarantine Procedural Breaches were recorded (see Section 13 for quarantine detection terminology).
• There was one Level 1 incident associated with NIS invertebrates. Ten Rust-red Flour Beetles (Tribolium castaneum) were detected at the permanent operating facilities fire station during routine quarantine inspections.
• There was one Level 3 incident associated with a NIS vertebrate. One Asian House Gecko (Hemidactylus frenatus) was detected by the workforce during the discharge of a vessel.
Gorgon Gas Development and Jansz Feed Gas Pipeline Environmental Performance Report 2019
Document ID: ABU190900639 Revision ID: 1.0 Revision Date: 4 November 2019 Page 22 Information Sensitivity: Public Uncontrolled when Printed
Event Data: Quarantine Detections
• Most Quarantine Near Misses were associated with parachute seed material (79%) and NIS invertebrates (18%), including stored product pests, such as moths and beetles.
Conclusions: • All NIS detected during the Reporting Period were successfully controlled immediately following detection.
• A pest control program remained in place as a follow-up to the 2018 detection of the Cigarette Beetle (Lasioderma serricorne).
• Surveillance will continue to occur for Buffel Grass (Cenchrus ciliaris) and Kapok Bush (Aerva javanica) until CAPL is confident no residual seed banks remain.
• Following the Quarantine Incidents, Near Misses, and Procedural Breaches recorded, actions were taken to reinforce quarantine training, procedures, and Gorgon Gas Development requirements.
Gorgon Gas Development and Jansz Feed Gas Pipeline Environmental Performance Report 2019
Document ID: ABU190900639 Revision ID: 1.0 Revision Date: 4 November 2019 Page 23 Information Sensitivity: Public Uncontrolled when Printed
4 Marine Turtles
Table 4-1: EPR Reporting Requirements for Marine Turtles
Item Source Section in this EPR
Results of all marine turtle monitoring carried out by the Proponent, including any detected changes to the Flatback Turtle population
MS 800, Schedule 3(3i)
EPBC 2003/1294 and 2008/4178, Schedule 3(3i)
4.1, 4.6
Reportable incidents involving harm to marine turtles
MS 800, Schedule 3(3ii)
EPBC 2003/1294 and 2008/4178, Schedule 3(3ii)
4.3
Changes to the marine turtle monitoring program MS 800, Schedule 3(3iii)
EPBC 2003/1294 and 2008/4178, Schedule 3(3iii)
4.1
Conclusions about the status of Flatback and other marine turtle populations on Barrow Island
MS 800, Schedule 3(3iv)
EPBC 2003/1294 and 2008/4178, Schedule 3(3iv)
4.1, 4.6
Changes (if any) to the Long-term Marine Turtle Management Plan
MS 800, Schedule 3(3v)
EPBC 2003/1294 and 2008/4178, Schedule 3(3v)
4.5
Findings of the annual audit and review on the effectiveness of lighting design features, management measures, and operating controls including details of light management initiatives and activities undertaken during the year
MS 800, Schedule 3(3vi)
EPBC 2003/1294 and 2008/4178, Schedule 3(3vi)
4.4
Results of studies undertaken MS 800, Schedule 3(3vii)
EPBC 2003/1294 and 2008/4178, Schedule 3(3vii)
4.2
Noise monitoring results and a discussion on the success (or otherwise) in meeting noise emission targets
MS 800, Schedule 3(3viii)
EPBC 2003/1294 and 2008/4178, Schedule 3(3viii)
N/A1
1 No specific noise emission targets for the Gorgon Gas Development apply to environmental receptors; noise monitoring is considered in relation to monitoring results for the Flatback Turtle population. As reported in the Five-year EPR (Ref. 9): ‘Given the results to date, the difficulty in detecting any onshore noise or vibration effects from Project activities on the beaches, and endorsement from the Marine Turtle Expert Panel (and subsequent regulatory approval), the noise and vibration monitoring program was suspended after the 2011–2012 season.’ Therefore, reporting for this item is not applicable.
4.1 Monitoring Results
An objective of the Long-term Marine Turtle Management Plan (LTMTMP) (Ref. 10), as defined by Ministerial conditions, is to establish a statistically valid monitoring program to measure and detect changes to the Flatback Turtle population on Barrow Island.
Key demographic parameters have been identified as necessary for understanding the population dynamics and population viability of the Flatback Turtle rookery on Barrow Island. A mainland Reference site (Mundabullangana [MDA]) has also been established. Where relevant, data related to these key parameters are also captured at MDA for comparison with the Barrow Island Flatback Turtle data (Ref. 10).
Changes in key demographic parameters are measured using time-series control charts. Trends identified in control charts act as early-warning signals to guide a tiered management approach. A management response is triggered if a
Gorgon Gas Development and Jansz Feed Gas Pipeline Environmental Performance Report 2019
Document ID: ABU190900639 Revision ID: 1.0 Revision Date: 4 November 2019 Page 24 Information Sensitivity: Public Uncontrolled when Printed
demographic parameter demonstrates a trend towards, or changes beyond statistical deviations (±1, ±2, or ±3 SD, standard error [SE], or median absolute deviation [MAD]) from baseline conditions (Ref. 10).
The 2018–2019 results (Ref. 11) for the monitoring programs listed in the LTMTMP, including any changes detected to the Barrow Island Flatback Turtle population, are summarised in the following tables.
Monitoring Program: Flatback Turtle Abundance and Distribution
Objective: • To measure and detect changes to the abundance, distribution, and nesting behaviour of adult Flatback Turtles.
Methodology: • Capture-recapture sampling of nesting adult female Flatback Turtles to estimate these demographic parameters:
– adult female survival probability
– adult female breeding omission probability
– annual nester abundance
– nesting activity
– clutch frequency
– internesting interval.
• Only key demographic parameters are control-charted; these include adult female survival probability, adult female breeding omission probability, annual nester abundance, and clutch frequency.
• Variation in modelled estimates can occur when models are re-run each year with additional data. Consequently, minor variations from year to year might occur in control-charted parameter estimates presented in this EPR.
Changes to Program:
• The amended LTMTMP (Ref. 10), which was approved in July 2018 (see Section 4.5), does not include the requirement to monitor the remigration interval, growth rate, and tag loss for the female Flatback Turtle population at Barrow Island and MDA.
• No other changes were made to the Flatback Turtle Tagging Program during the Reporting Period.
Results: Adult Female Survival Probability
• The estimated annual survival probability for nesting Flatback Turtles on Barrow Island in 2018–2019 was 0.95, similar to MDA (0.96). Survival probability at Barrow Island has been consistently high, and has remained within management trigger limits (Figure 4-1). This indicates a stable and demographically healthy population.
Nesting season beginning in October
Figure 4-1: Control Chart for Adult Female Flatback Turtle Survival Probability at Barrow Island1
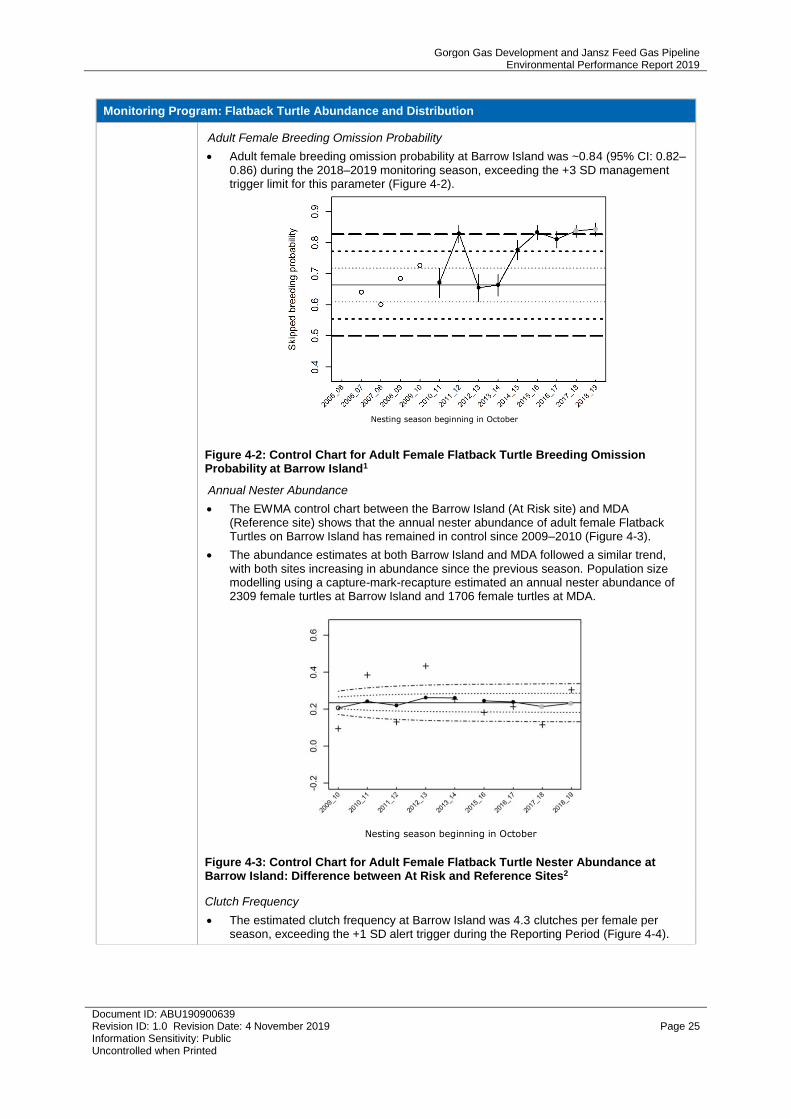
Gorgon Gas Development and Jansz Feed Gas Pipeline Environmental Performance Report 2019
Document ID: ABU190900639 Revision ID: 1.0 Revision Date: 4 November 2019 Page 25 Information Sensitivity: Public Uncontrolled when Printed
Monitoring Program: Flatback Turtle Abundance and Distribution
Adult Female Breeding Omission Probability
• Adult female breeding omission probability at Barrow Island was ~0.84 (95% CI: 0.82–0.86) during the 2018–2019 monitoring season, exceeding the +3 SD management trigger limit for this parameter (Figure 4-2).
Nesting season beginning in October
Figure 4-2: Control Chart for Adult Female Flatback Turtle Breeding Omission Probability at Barrow Island1
Annual Nester Abundance
• The EWMA control chart between the Barrow Island (At Risk site) and MDA (Reference site) shows that the annual nester abundance of adult female Flatback Turtles on Barrow Island has remained in control since 2009–2010 (Figure 4-3).
• The abundance estimates at both Barrow Island and MDA followed a similar trend, with both sites increasing in abundance since the previous season. Population size modelling using a capture-mark-recapture estimated an annual nester abundance of 2309 female turtles at Barrow Island and 1706 female turtles at MDA.
Nesting season beginning in October
Figure 4-3: Control Chart for Adult Female Flatback Turtle Nester Abundance at Barrow Island: Difference between At Risk and Reference Sites2
Clutch Frequency
• The estimated clutch frequency at Barrow Island was 4.3 clutches per female per season, exceeding the +1 SD alert trigger during the Reporting Period (Figure 4-4).
Gorgon Gas Development and Jansz Feed Gas Pipeline Environmental Performance Report 2019
Document ID: ABU190900639 Revision ID: 1.0 Revision Date: 4 November 2019 Page 26 Information Sensitivity: Public Uncontrolled when Printed
Monitoring Program: Flatback Turtle Abundance and Distribution
Nesting season beginning in October
Figure 4-4: Control Chart for Adult Female Flatback Turtle Clutch Frequency at Barrow Island1
Internesting Interval
• The mean internesting interval for Flatback Turtles at Barrow Island and MDA during the Reporting Period was 15.2 ± 2.3 days and 13.4 ± 3.0 days, respectively.
Nesting Activity (spatial and temporal distribution)
• Nesting Flatback Turtles continued to show a strong fidelity to the beach where they were sighted at least once. The beaches with the strongest fidelity were situated north of the causeway/Materials Offloading Facility (MOF), i.e. Terminal Beach (69.6%) and Mushroom Beach (78.0%). Consistent with previous seasons, Inga Beach had the lowest fidelity (52.7%) out of the long-term monitored beaches.
1 Open dots = baseline estimate derived from empirical data, black dots = construction parameter estimate, grey dots = operations parameter estimate, solid horizontal line = long-term expected estimate derived from baseline estimates (mean or median), dotted lines = ±1 SE (or 1 MAD for annual nester abundance), small dashed lines = ±2 SE (or 2 MAD), long dashed lines = ±3 SE (or 3 MAD). Error bars indicate 95% CI.
2 EWMA chart based on an exponentially weighted 3-year moving average. Open dot = smoothed log response ratio (LRR) in baseline; black dots = smoothed LRR in construction; grey dots = smoothed LRR in operations; crosses = unsmoothed LRR. Positive values show an effect that is higher at the At Risk site compared to the Reference site, and vice versa. The solid horizontal centre-line is the estimated average true LRR effect. Dotted curves = ±1 SD at each year for the smoothed metric, and dot-dashed curves = ±2 SD. Note: There was no annual abundance estimate for MDA in 2014-2015 due to the limited sampling in that season.
Monitoring Program: Hatchling Orientation
Objectives: • To measure and detect variation in dispersal patterns of Flatback Turtle hatchlings following emergence from the nest.
Methodology: • Measures of artificial light (magnitude and bearing) on marine turtle nesting beaches using specialised light-measurement cameras.
• Measures of the orientation (fan spread angle [disorientation] and fan offset angle [from most direct line to the ocean—misorientation]) of marine turtle hatchling tracks on beaches. These parameters are control-charted for Bivalve and Terminal beaches.
Changes to Program:
• Flow-rate data for the ground flare’s wet and dry gas header, for every 15-minute period during the light monitoring survey, was extrapolated to estimate a total flare volume during each night between 19:00 and 05:00, and included to investigate variation in sky brightness during the field survey.
• No other changes were made to the hatchling orientation monitoring program during the Reporting Period.
Light Results: • Sources of night-time light emissions included the GTP, ground flare, offshore infrastructure including the MOF, LNG Jetty head, and LNG tanker (when present), Main Camp, and Butler Park. A muster point lighting tower at the western end of the
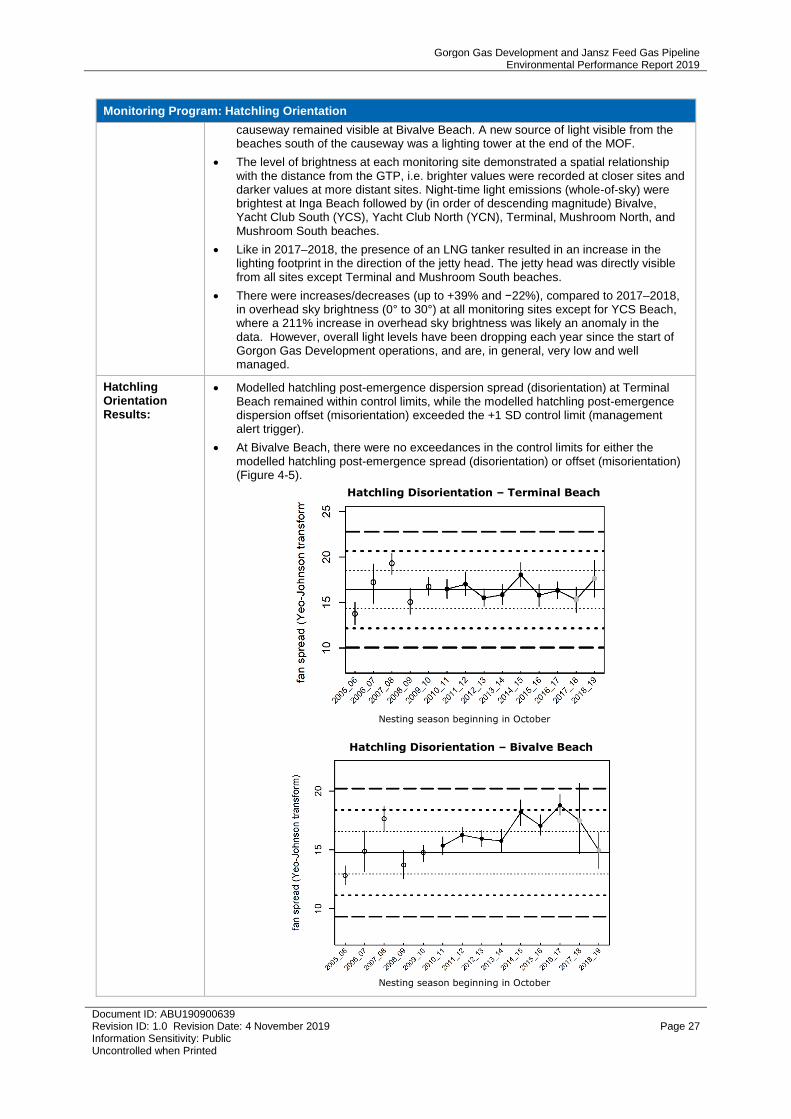
Gorgon Gas Development and Jansz Feed Gas Pipeline Environmental Performance Report 2019
Document ID: ABU190900639 Revision ID: 1.0 Revision Date: 4 November 2019 Page 27 Information Sensitivity: Public Uncontrolled when Printed
Monitoring Program: Hatchling Orientation
causeway remained visible at Bivalve Beach. A new source of light visible from the beaches south of the causeway was a lighting tower at the end of the MOF.
• The level of brightness at each monitoring site demonstrated a spatial relationship with the distance from the GTP, i.e. brighter values were recorded at closer sites and darker values at more distant sites. Night-time light emissions (whole-of-sky) were brightest at Inga Beach followed by (in order of descending magnitude) Bivalve, Yacht Club South (YCS), Yacht Club North (YCN), Terminal, Mushroom North, and Mushroom South beaches.
• Like in 2017–2018, the presence of an LNG tanker resulted in an increase in the lighting footprint in the direction of the jetty head. The jetty head was directly visible from all sites except Terminal and Mushroom South beaches.
• There were increases/decreases (up to +39% and −22%), compared to 2017–2018, in overhead sky brightness (0° to 30°) at all monitoring sites except for YCS Beach, where a 211% increase in overhead sky brightness was likely an anomaly in the data. However, overall light levels have been dropping each year since the start of Gorgon Gas Development operations, and are, in general, very low and well managed.
Hatchling Orientation Results:
• Modelled hatchling post-emergence dispersion spread (disorientation) at Terminal Beach remained within control limits, while the modelled hatchling post-emergence dispersion offset (misorientation) exceeded the +1 SD control limit (management alert trigger).
• At Bivalve Beach, there were no exceedances in the control limits for either the modelled hatchling post-emergence spread (disorientation) or offset (misorientation) (Figure 4-5).
Hatchling Disorientation – Terminal Beach
Nesting season beginning in October
Hatchling Disorientation – Bivalve Beach
Nesting season beginning in October
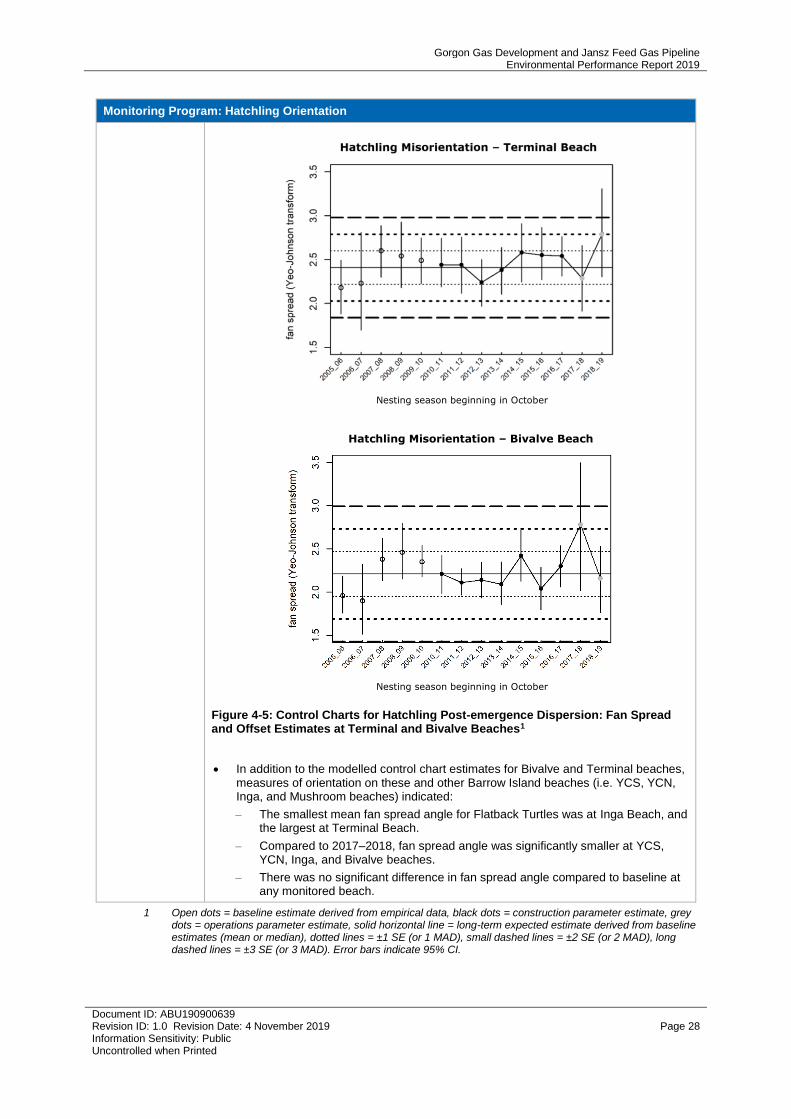
Gorgon Gas Development and Jansz Feed Gas Pipeline Environmental Performance Report 2019
Document ID: ABU190900639 Revision ID: 1.0 Revision Date: 4 November 2019 Page 28 Information Sensitivity: Public Uncontrolled when Printed
Monitoring Program: Hatchling Orientation
Nesting season beginning in October
Hatchling Misorientation – Bivalve Beach
Nesting season beginning in October
Figure 4-5: Control Charts for Hatchling Post-emergence Dispersion: Fan Spread and Offset Estimates at Terminal and Bivalve Beaches1
• In addition to the modelled control chart estimates for Bivalve and Terminal beaches, measures of orientation on these and other Barrow Island beaches (i.e. YCS, YCN, Inga, and Mushroom beaches) indicated:
– The smallest mean fan spread angle for Flatback Turtles was at Inga Beach, and the largest at Terminal Beach.
– Compared to 2017–2018, fan spread angle was significantly smaller at YCS, YCN, Inga, and Bivalve beaches.
– There was no significant difference in fan spread angle compared to baseline at any monitored beach.
1 Open dots = baseline estimate derived from empirical data, black dots = construction parameter estimate, grey dots = operations parameter estimate, solid horizontal line = long-term expected estimate derived from baseline estimates (mean or median), dotted lines = ±1 SE (or 1 MAD), small dashed lines = ±2 SE (or 2 MAD), long dashed lines = ±3 SE (or 3 MAD). Error bars indicate 95% CI.
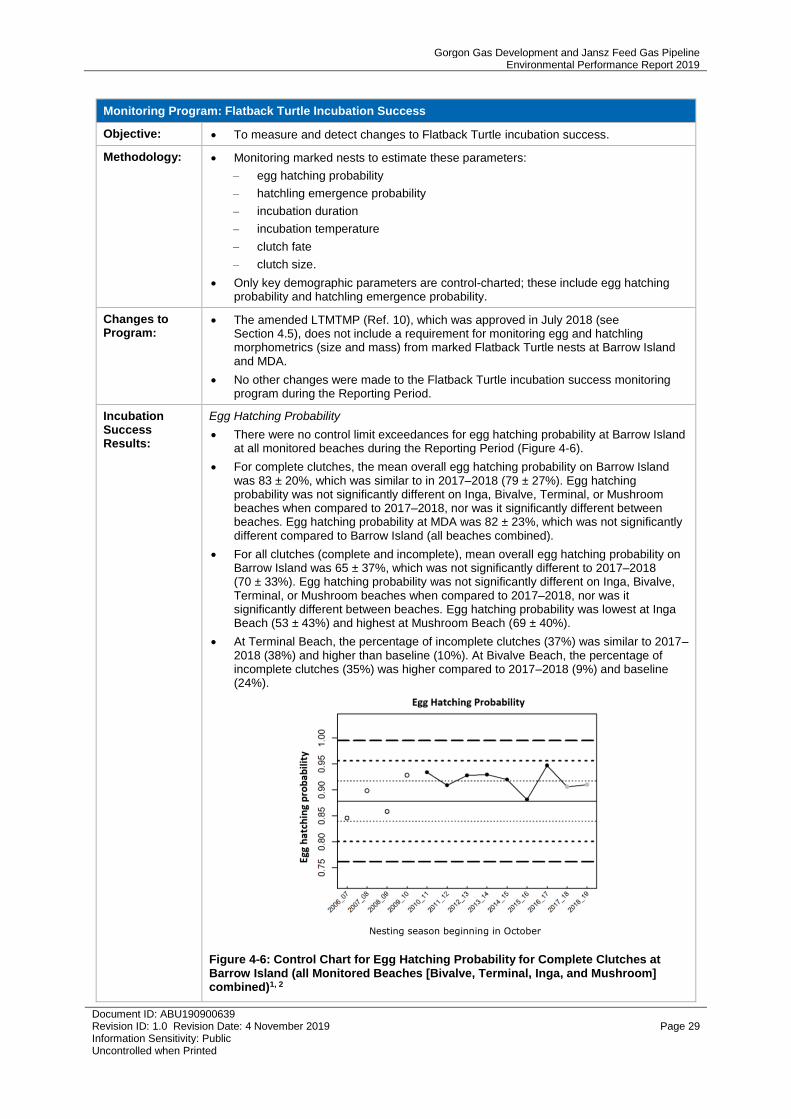
Gorgon Gas Development and Jansz Feed Gas Pipeline Environmental Performance Report 2019
Document ID: ABU190900639 Revision ID: 1.0 Revision Date: 4 November 2019 Page 29 Information Sensitivity: Public Uncontrolled when Printed
Monitoring Program: Flatback Turtle Incubation Success
Objective: • To measure and detect changes to Flatback Turtle incubation success.
Methodology: • Monitoring marked nests to estimate these parameters:
– egg hatching probability
– hatchling emergence probability
– incubation duration
– incubation temperature
– clutch fate
– clutch size.
• Only key demographic parameters are control-charted; these include egg hatching probability and hatchling emergence probability.
Changes to Program:
• The amended LTMTMP (Ref. 10), which was approved in July 2018 (see Section 4.5), does not include a requirement for monitoring egg and hatchling morphometrics (size and mass) from marked Flatback Turtle nests at Barrow Island and MDA.
• No other changes were made to the Flatback Turtle incubation success monitoring program during the Reporting Period.
Incubation Success Results:
Egg Hatching Probability
• There were no control limit exceedances for egg hatching probability at Barrow Island at all monitored beaches during the Reporting Period (Figure 4-6).
• For complete clutches, the mean overall egg hatching probability on Barrow Island was 83 ± 20%, which was similar to in 2017–2018 (79 ± 27%). Egg hatching probability was not significantly different on Inga, Bivalve, Terminal, or Mushroom beaches when compared to 2017–2018, nor was it significantly different between beaches. Egg hatching probability at MDA was 82 ± 23%, which was not significantly different compared to Barrow Island (all beaches combined).
• For all clutches (complete and incomplete), mean overall egg hatching probability on Barrow Island was 65 ± 37%, which was not significantly different to 2017–2018 (70 ± 33%). Egg hatching probability was not significantly different on Inga, Bivalve, Terminal, or Mushroom beaches when compared to 2017–2018, nor was it significantly different between beaches. Egg hatching probability was lowest at Inga Beach (53 ± 43%) and highest at Mushroom Beach (69 ± 40%).
• At Terminal Beach, the percentage of incomplete clutches (37%) was similar to 2017–2018 (38%) and higher than baseline (10%). At Bivalve Beach, the percentage of incomplete clutches (35%) was higher compared to 2017–2018 (9%) and baseline (24%).
Nesting season beginning in October
Figure 4-6: Control Chart for Egg Hatching Probability for Complete Clutches at Barrow Island (all Monitored Beaches [Bivalve, Terminal, Inga, and Mushroom] combined)1, 2
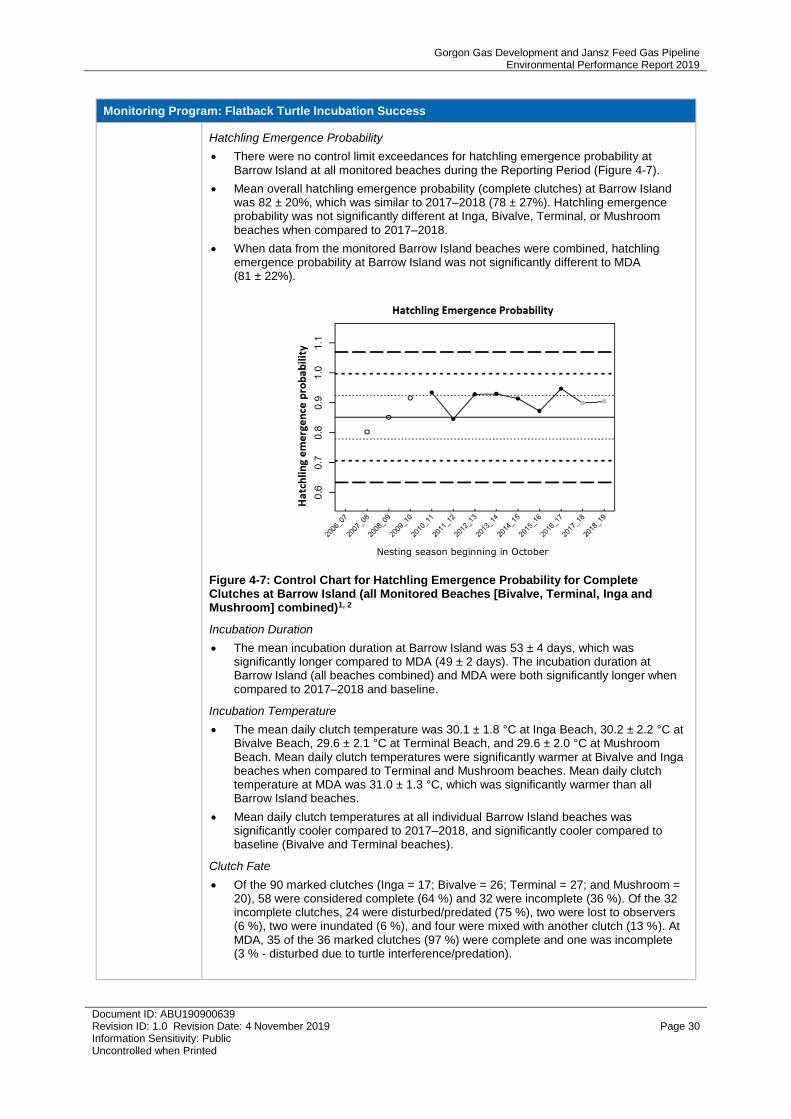
Gorgon Gas Development and Jansz Feed Gas Pipeline Environmental Performance Report 2019
Document ID: ABU190900639 Revision ID: 1.0 Revision Date: 4 November 2019 Page 30 Information Sensitivity: Public Uncontrolled when Printed
Monitoring Program: Flatback Turtle Incubation Success
Hatchling Emergence Probability
• There were no control limit exceedances for hatchling emergence probability at Barrow Island at all monitored beaches during the Reporting Period (Figure 4-7).
• Mean overall hatchling emergence probability (complete clutches) at Barrow Island was 82 ± 20%, which was similar to 2017–2018 (78 ± 27%). Hatchling emergence probability was not significantly different at Inga, Bivalve, Terminal, or Mushroom beaches when compared to 2017–2018.
• When data from the monitored Barrow Island beaches were combined, hatchling emergence probability at Barrow Island was not significantly different to MDA (81 ± 22%).
Nesting season beginning in October
Figure 4-7: Control Chart for Hatchling Emergence Probability for Complete Clutches at Barrow Island (all Monitored Beaches [Bivalve, Terminal, Inga and Mushroom] combined)1, 2
Incubation Duration
• The mean incubation duration at Barrow Island was 53 ± 4 days, which was significantly longer compared to MDA (49 ± 2 days). The incubation duration at Barrow Island (all beaches combined) and MDA were both significantly longer when compared to 2017–2018 and baseline.
Incubation Temperature
• The mean daily clutch temperature was 30.1 ± 1.8 °C at Inga Beach, 30.2 ± 2.2 °C at Bivalve Beach, 29.6 ± 2.1 °C at Terminal Beach, and 29.6 ± 2.0 °C at Mushroom Beach. Mean daily clutch temperatures were significantly warmer at Bivalve and Inga beaches when compared to Terminal and Mushroom beaches. Mean daily clutch temperature at MDA was 31.0 ± 1.3 °C, which was significantly warmer than all Barrow Island beaches.
• Mean daily clutch temperatures at all individual Barrow Island beaches was significantly cooler compared to 2017–2018, and significantly cooler compared to baseline (Bivalve and Terminal beaches).
Clutch Fate
• Of the 90 marked clutches (Inga = 17; Bivalve = 26; Terminal = 27; and Mushroom = 20), 58 were considered complete (64 %) and 32 were incomplete (36 %). Of the 32 incomplete clutches, 24 were disturbed/predated (75 %), two were lost to observers (6 %), two were inundated (6 %), and four were mixed with another clutch (13 %). At MDA, 35 of the 36 marked clutches (97 %) were complete and one was incomplete (3 % - disturbed due to turtle interference/predation).
Gorgon Gas Development and Jansz Feed Gas Pipeline Environmental Performance Report 2019
Document ID: ABU190900639 Revision ID: 1.0 Revision Date: 4 November 2019 Page 31 Information Sensitivity: Public Uncontrolled when Printed
Monitoring Program: Flatback Turtle Incubation Success
Clutch Size
• The mean clutch size at excavation was 45.7 ± 8.9 eggs at Barrow Island and 49.5 ± 8.9 eggs at MDA. There was no significant difference in clutch size among Barrow Island beaches or compared to MDA. There was no significant difference in clutch size at Barrow Island or at MDA when compared to 2017–2018 and baseline.
1 Open dots = baseline estimate derived from empirical data, black dots = construction parameter estimate, grey dots = operations parameter estimate, solid horizontal line = long-term expected estimate derived from baseline estimates (mean or median), dotted lines = ±1 SE (or 1 MAD), small dashed lines = ±2 SE (or 2 MAD), long dashed lines = ±3 SE (or 3 MAD).
2 Note: The control chart estimates for 2016-2017 and 2017-2018 include the Inga Beach incubation success study data (see Section 4.2.2).
4.2 Studies
4.2.1 Flatback Turtle Tagging – A07, Junction, and Camp Beaches
A study was initiated during 2017–2018 to better understand the spatial and temporal variation in nesting beach usage and beach fidelity for those turtles encountered at A07, Junction, and Camp beaches, which are not monitored during the routine Flatback Turtle Abundance and Distribution Monitoring Program. This study was continued during the Reporting Period, with additional tagging effort at two of the study beaches—A07 and Junction.
The additional monitoring at A07 and Junction beaches identified 461 Flatback Turtles (75% remigrant and 25% new turtles) that were not encountered on the routine long-term monitored beaches during the season. In total, 597 Flatback Turtles were encountered at the two beaches (78% remigrant and 22% new turtles). These turtles continued to show a strong fidelity to the two beaches, with 87.0% and 86.1% of the turtles sighted at least once on A07 and Junction beaches, respectively, being sighted again on one of these same two beaches (Ref. 11).
4.2.2 Incubation Success – A07, Junction, YCS, and YCN Beaches
To better understand the hatch/emergence success and incubation environment of Flatback Turtles clutches on A07, Junction, YCS, and YCN beaches, CAPL continued a study during the Reporting Period that had been initiated in 2016–2017 (at Inga Beach). The study used the same methodology as the routine Incubation Success Program.
Of the 60 marked clutches, most (70%) were found to be undisturbed; of the 18 incomplete clutches, 11 were disturbed by other nesters or natural predators, three could not be found, three were mixed with another clutch, and one was inundated (by tidal or wave action). For all clutches, mean overall egg hatching probability continued to be high, ranging from 53 ± 34% at Junction Beach to 83 ± 14% at YCN Beach, and the mean incubation period was not significantly different between any of the beaches.
With regard to incubation environment, the results of the study showed that while marked clutches on A07, Junction, Camp, YCS, and YCN beaches were again found to be warmer than marked clutches on beaches routinely monitored for incubation success (except Bivalve Beach), these beaches (except Junction) provide an incubation environment for Flatback Turtle nests that is comparable to the routinely monitored beaches and at MDA (Ref. 11).
Gorgon Gas Development and Jansz Feed Gas Pipeline Environmental Performance Report 2019
Document ID: ABU190900639 Revision ID: 1.0 Revision Date: 4 November 2019 Page 32 Information Sensitivity: Public Uncontrolled when Printed
4.2.3 Flatback Turtle Hatchling Dispersal and Survivorship
A study was initiated during the Reporting Period to monitor how Flatback Turtle hatchling in-water dispersal, survivorship, and predation from select east coast beaches of Barrow Island are impacted by the physical presence of infrastructure associated with the Gorgon Gas Development causeway, MOF, and LNG Jetty, and sources of offshore artificial light (including the LNG/condensate vessels). For the 2018–2019 season, vessels were used to manually track Flatback Turtle hatchlings at night from three primary release beaches (YCS, YCN and Mushroom), and three secondary release beaches (Junction, Inga, and Terminal).
A total of 106 Flatback Turtle hatchlings were tracked from the release beaches during 21 survey nights. Most hatchlings were released at YCS and YCN beaches (n = 59; 55%), followed by Mushroom (n = 26; 25%), Inga (n = 15; 14%), Terminal (n = 4; 4%), and Junction (n = 2; 2%) beaches. The mean tracking duration for each hatchling was 103 ± 100 minutes, and the longest was 356 minutes.
Modelling results indicated that the hatchlings’ orientation towards the jetty head was not increased or decreased by the amount of moonlight, the presence of the LNG/condensate vessel, or the wind or wave direction. However, the closer a hatchling was to the LNG Jetty, the more it oriented towards it, an effect that was more pronounced during strong tidal change rates on an ebb tide.
Flatback Turtle hatchling in-water dispersal (as represented by the hatchlings’ travel speed) was found to be influenced by the presence of the LNG/condensate vessel at the LNG Jetty, with the hatchlings’ travel speed slowing down as they dispersed closer to the jetty. The slower travel speed was considered to be due to hatchlings’ attraction to artificial light, which was shown to increase as hatchlings approached the jetty when an LNG/condensate vessel was present. Despite the increased exposure to predation from the longer transit time to open water, the hatchlings’ slower speed did not appear to affect their overall survivorship, with the greatest risk of predation occurring within the intertidal area <500 m from the Barrow Island coastline and away from infrastructure (Ref. 27).
4.3 Event Data
Incidents involving harm to marine turtles reported during the Reporting Period are summarised in the following table.
Event Data: Harm to Marine Turtles
Reporting Requirement:
• Reportable incidents involving harm to marine turtles.
Results: • Four reportable incidents occurred during the Reporting Period, none of which were considered Project-attributable.
– Two were for deceased Green Turtles found on two Barrow Island beaches, and one was for a stranded but alive Green Turtle. The cause of the observed injuries from these three incidents was determined to be either due to natural causes, or was not able to be conclusively determined as anthropogenic.
– The fourth incident was for a deceased Flatback Turtle hatchling that was predated and subsequently dropped by a bird onto the MOF.
4.4 Audit and Review
Findings of the annual audit and review of lighting design features, management measures, and operating controls, including details of light management initiatives and activities undertaken during the Reporting Period, are summarised in the following table.
Gorgon Gas Development and Jansz Feed Gas Pipeline Environmental Performance Report 2019
Document ID: ABU190900639 Revision ID: 1.0 Revision Date: 4 November 2019 Page 33 Information Sensitivity: Public Uncontrolled when Printed
Stressor: Light
Audit Results: • CAPL completed an audit of the LTMTMP (Ref. 10) in July 2019. This included verifying compliance with lighting design features, management measures, and operating controls, as described in the LTMTMP. The requirements specified in the LTMTMP were fulfilled except for one audit finding:
– Reviews of lighting onsite have identified areas where task lighting was noted to be permanently on.
o Action: Corrective actions, including a review of area task lighting on site, have been assigned to address this finding and work is underway to complete (In progress).
• There was also an observation from the audit relating to temporary lighting towers used on site, and a formal process not in place to check requirements of the LTMTMP, during initial set up.
– Action: Implement a process to ensure that temporary lighting (lighting towers) are assessed for requirements of the LTMTMP during initial setup (Complete).
• No direct impacts to turtles were identified from the audit.
Light Management Initiatives, Activities and Reasonably Practicable Lighting Improvements:
• The lighting requirements within the LTMTMP were fulfilled except for one audit finding identified above.
• Lighting inspections of offshore vessels were conducted to ensure compliance requirements were met.
• Site planning sessions continued for activities with the potential to affect marine turtle behaviour before and during the marine turtle nesting season.
• Marine turtle awareness communications were sent to all staff and contractors at the start of, and throughout the turtle season, highlighting the relationships between lighting management and impacts to marine turtles. These were incorporated into Daily Pre-Start Meetings, and Weekly Incident Free Operations/Health and Safety Representatives Committee Meetings.
• Personnel engagement continued via the marine turtle nesting and turtle hatchling tours to raise awareness of the environmental commitments associated with marine turtles.
• Lighting along the LNG Jetty and MOF was switched off, except where required for work and safety reasons.
• A specialist consultant conducted a lightning inspection over the GTP and associated facilities during May 2019, and raised some short-, medium-, and longer-term future lighting improvements. This work is currently being progressed.
Conclusions on the Effectiveness of Lighting Design Features, Management Measures, and Operating Controls:
• CAPL considers lighting design features, management measures, and operating controls are ‘effective’ if the environmental objectives of the LTMTMP (Ref. 10) are met, and if they reduce potential adverse impacts to Barrow Island marine turtle populations. Lighting management for the Gorgon Gas Development was considered effective during the Reporting Period, for these reasons:
– There were no internal audit findings for lighting that represented Material or Serious Environmental Harm to the marine turtle populations on Barrow Island.
– Artificial light levels varied across monitored marine turtle nesting beaches, and there was evidence of localised misorientation (+1 SD management trigger exceedance) of hatchlings at Terminal Beach, which could be due to a combination of low sample size and location of nest fans providing greater exposure to light from the GTP and associated infrastructure. Both spread and offset angles remain in control for Bivalve Beach.
– Overall, analysis of hatchling sea-finding parameters on monitored beaches demonstrated that Gorgon Gas Development lighting did not adversely affect the sea-finding ability of hatchlings during the Reporting Period, and emergent Flatback Turtle hatchlings continued to orientate successfully towards the ocean (see Section 4.1).
• Given the above, no changes were required to lighting design features, management measures, and operating controls, beyond the improvements and initiatives undertaken to reduce artificial lighting during the Reporting Period, and actions identified from the 2019 LTMTMP audit.
Gorgon Gas Development and Jansz Feed Gas Pipeline Environmental Performance Report 2019
Document ID: ABU190900639 Revision ID: 1.0 Revision Date: 4 November 2019 Page 34 Information Sensitivity: Public Uncontrolled when Printed
4.5 Changes to the Long-term Marine Turtle Management Plan
An amendment to the LTMTMP (Ref. 10) was approved by the WA Department of Water and Environmental Regulation and the Commonwealth Department of the Environment and Energy in July 2018. No further amendments to the LTMTMP were proposed and/or approved during the Reporting Period.
4.6 Conclusion
The continued high estimate of nester abundance, together with high predicted annual survival probability, continues to indicate a demographically stable and healthy nesting Flatback Turtle population at Barrow Island, and there is no evidence to suggest observed interannual variations in nester abundance are the result of Gorgon Gas Development activities.
Investigation into patterns of increased breeding omission indicate that a sustained elevation in breeding omission rate over consecutive seasons is likely driven by a combination of varying conditions at, and long migration distances to, remote foraging grounds used between breeding cycles. High energy demands for large migration distances and reproduction, coupled with fluctuations in food supply, have been demonstrated to influence breeding omission probability for other marine turtle species. Flatback Turtles tracked from the Barrow Island and MDA rookeries in previous seasons confirm these nesting populations forage in widely distributed foraging grounds across the North West Shelf. This suggests that the interannual fluctuation in Flatback Turtle breeding omission rate at Barrow Island is likely a function of natural variables, not the Gorgon Gas Development activities.
The levels of visible light from monitored Barrow Island beaches has varied each season since monitoring began in 2009–2010, with the light level dependent on temporal and spatial variation in Gorgon Gas Development activities, and natural environmental variables at the time of monitoring. It is unlikely that artificial light levels contributed to the +1 SD control limit exceedance for the modelled hatchling post-emergence dispersion offset at Terminal Beach, since there was a 22% decrease in light recorded at the beach compared to 2017–2018. One potential cause for the +1 SD exceedance in fan offset was the low nest fan sample size recorded during the eight days of monitoring (n = 13) and narrower spatial distribution across the beach in comparison to baseline. In addition, natural variations in lunar and atmospheric conditions, and hatchling orientation behaviour, is also likely to have influenced orientation indices.
Except for YCS Beach, there was little variability in night-time sky brightness compared to 2017–2018, with the small percentage changes no greater than variability observed within a night of monitoring, or across monitoring nights during a survey. This indicated that the variation was related to natural causes such as cloud cover, dust, nearby vegetation, and atmospheric aerosols, which are all known to influence sky brightness. There is no evidence to suggest that variations in orientation indices, or variations in Gorgon Gas Development artificial lighting, adversely affected the dispersion success of emergent Flatback Turtle hatchlings at Barrow Island, which continued to disperse successfully towards the ocean.
Gradual alongshore sand redistribution at the beach face since construction of the MOF has exposed sections of the underlying rock platform on Terminal, Bivalve and Inga beaches, which reduces access to some of the available nesting habitat (see Section 9). The redistribution of sand towards the MOF on these beaches has also formed new areas of beach (created through accretion) that were previously inaccessible or unsuitable for nesting. Nesting distribution changes
Gorgon Gas Development and Jansz Feed Gas Pipeline Environmental Performance Report 2019
Document ID: ABU190900639 Revision ID: 1.0 Revision Date: 4 November 2019 Page 35 Information Sensitivity: Public Uncontrolled when Printed
corresponded to further, minor localised changes in beach sand cover at Bivalve and Inga beaches during the Reporting Period. Continuation of the trend for an increase in nesting activity towards the MOF, and decreases in the area used for nesting, are likely to be in response to the gradual exposure of the rock platform. This reflects a preference for those areas of beach where access to nesting habitat remains unimpeded; this includes new habitat formed since the MOF was installed.
Despite the localised shifts in nesting activity and variations in incubation success of some monitored nests, overall, incubation success and nesting success analyses indicate that turtles have not been deterred from using the monitored beaches, and that primary areas used for nesting still provide a suitable incubation environment. In addition:
• measures of incubation success (egg hatching probability and hatchling emergence probability) for Barrow Island remained within control limits
• there were no detected exceedances of the marine turtle nesting habitat management triggers at Terminal and Bivalve beaches (see Section 9).
Outcomes of the monitoring programs, investigations into observed deviations in demographic parameters, and nesting behaviour, indicate that the Flatback Turtle population nesting on Barrow Island remains stable and demographically healthy, with consistently high survival rates observed for nesting females.
As required by the LTMTMP, CAPL will continue to routinely monitor key marine turtle demographic parameters to detect and evaluate potential implications for marine turtle nesting. If exceedances of LTMTMP management triggers or performance standards are detected, these will be assessed in accordance with the requirements identified in the LTMTMP and relevant Ministerial conditions.
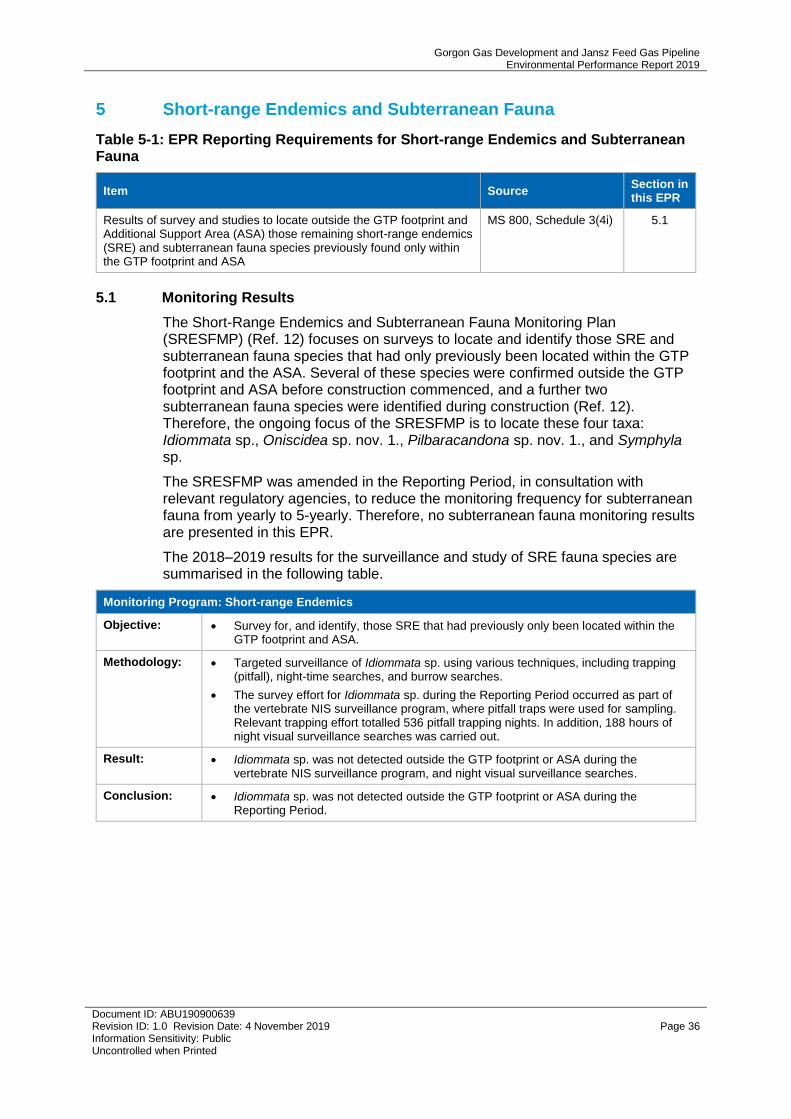
Gorgon Gas Development and Jansz Feed Gas Pipeline Environmental Performance Report 2019
Document ID: ABU190900639 Revision ID: 1.0 Revision Date: 4 November 2019 Page 36 Information Sensitivity: Public Uncontrolled when Printed
5 Short-range Endemics and Subterranean Fauna
Table 5-1: EPR Reporting Requirements for Short-range Endemics and Subterranean Fauna
Item Source Section in this EPR
Results of survey and studies to locate outside the GTP footprint and Additional Support Area (ASA) those remaining short-range endemics (SRE) and subterranean fauna species previously found only within the GTP footprint and ASA
MS 800, Schedule 3(4i) 5.1
5.1 Monitoring Results
The Short-Range Endemics and Subterranean Fauna Monitoring Plan (SRESFMP) (Ref. 12) focuses on surveys to locate and identify those SRE and subterranean fauna species that had only previously been located within the GTP footprint and the ASA. Several of these species were confirmed outside the GTP footprint and ASA before construction commenced, and a further two subterranean fauna species were identified during construction (Ref. 12). Therefore, the ongoing focus of the SRESFMP is to locate these four taxa: Idiommata sp., Oniscidea sp. nov. 1., Pilbaracandona sp. nov. 1., and Symphyla sp.
The SRESFMP was amended in the Reporting Period, in consultation with relevant regulatory agencies, to reduce the monitoring frequency for subterranean fauna from yearly to 5-yearly. Therefore, no subterranean fauna monitoring results are presented in this EPR.
The 2018–2019 results for the surveillance and study of SRE fauna species are summarised in the following table.
Monitoring Program: Short-range Endemics
Objective: • Survey for, and identify, those SRE that had previously only been located within the GTP footprint and ASA.
Methodology: • Targeted surveillance of Idiommata sp. using various techniques, including trapping (pitfall), night-time searches, and burrow searches.
• The survey effort for Idiommata sp. during the Reporting Period occurred as part of the vertebrate NIS surveillance program, where pitfall traps were used for sampling. Relevant trapping effort totalled 536 pitfall trapping nights. In addition, 188 hours of night visual surveillance searches was carried out.
Result: • Idiommata sp. was not detected outside the GTP footprint or ASA during the vertebrate NIS surveillance program, and night visual surveillance searches.
Conclusion: • Idiommata sp. was not detected outside the GTP footprint or ASA during the Reporting Period.
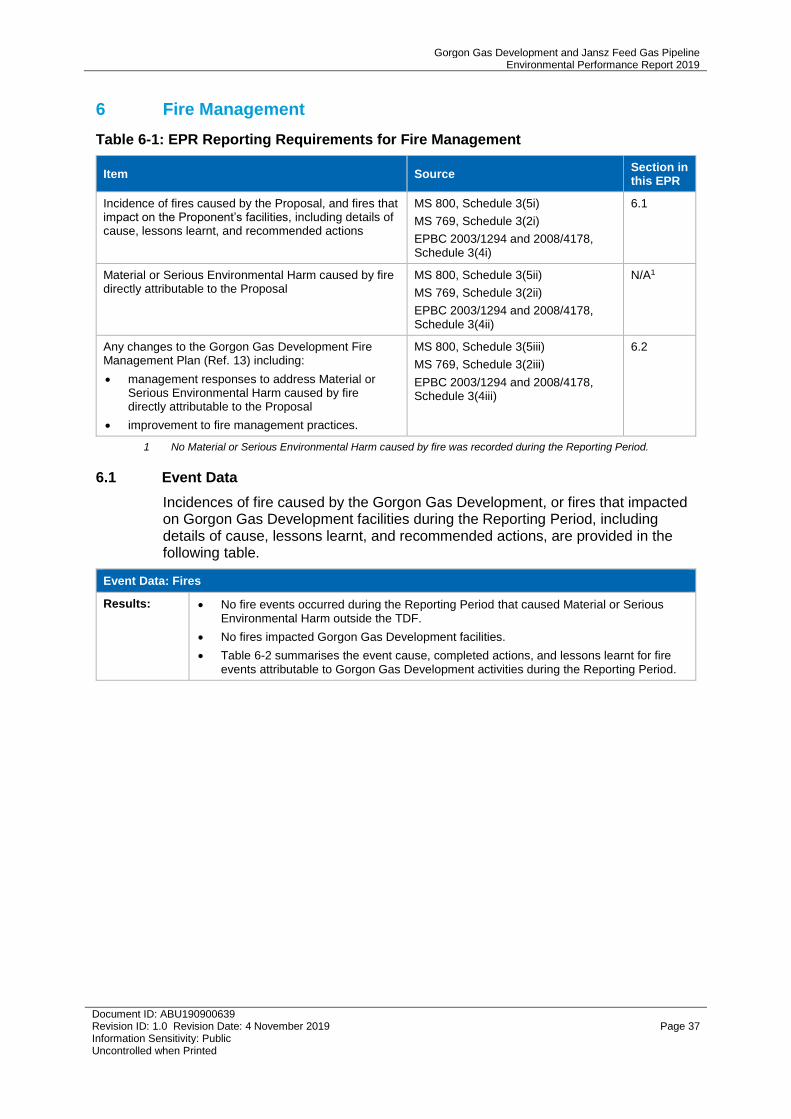
Gorgon Gas Development and Jansz Feed Gas Pipeline Environmental Performance Report 2019
Document ID: ABU190900639 Revision ID: 1.0 Revision Date: 4 November 2019 Page 37 Information Sensitivity: Public Uncontrolled when Printed
6 Fire Management
Table 6-1: EPR Reporting Requirements for Fire Management
Item Source Section in this EPR
Incidence of fires caused by the Proposal, and fires that impact on the Proponent’s facilities, including details of cause, lessons learnt, and recommended actions
MS 800, Schedule 3(5i)
MS 769, Schedule 3(2i)
EPBC 2003/1294 and 2008/4178, Schedule 3(4i)
6.1
Material or Serious Environmental Harm caused by fire directly attributable to the Proposal
MS 800, Schedule 3(5ii)
MS 769, Schedule 3(2ii)
EPBC 2003/1294 and 2008/4178, Schedule 3(4ii)
N/A1
Any changes to the Gorgon Gas Development Fire Management Plan (Ref. 13) including:
• management responses to address Material or Serious Environmental Harm caused by fire directly attributable to the Proposal
• improvement to fire management practices.
MS 800, Schedule 3(5iii)
MS 769, Schedule 3(2iii)
EPBC 2003/1294 and 2008/4178, Schedule 3(4iii)
6.2
1 No Material or Serious Environmental Harm caused by fire was recorded during the Reporting Period.
6.1 Event Data
Incidences of fire caused by the Gorgon Gas Development, or fires that impacted on Gorgon Gas Development facilities during the Reporting Period, including details of cause, lessons learnt, and recommended actions, are provided in the following table.
Event Data: Fires
Results: • No fire events occurred during the Reporting Period that caused Material or Serious Environmental Harm outside the TDF.
• No fires impacted Gorgon Gas Development facilities.
• Table 6-2 summarises the event cause, completed actions, and lessons learnt for fire events attributable to Gorgon Gas Development activities during the Reporting Period.
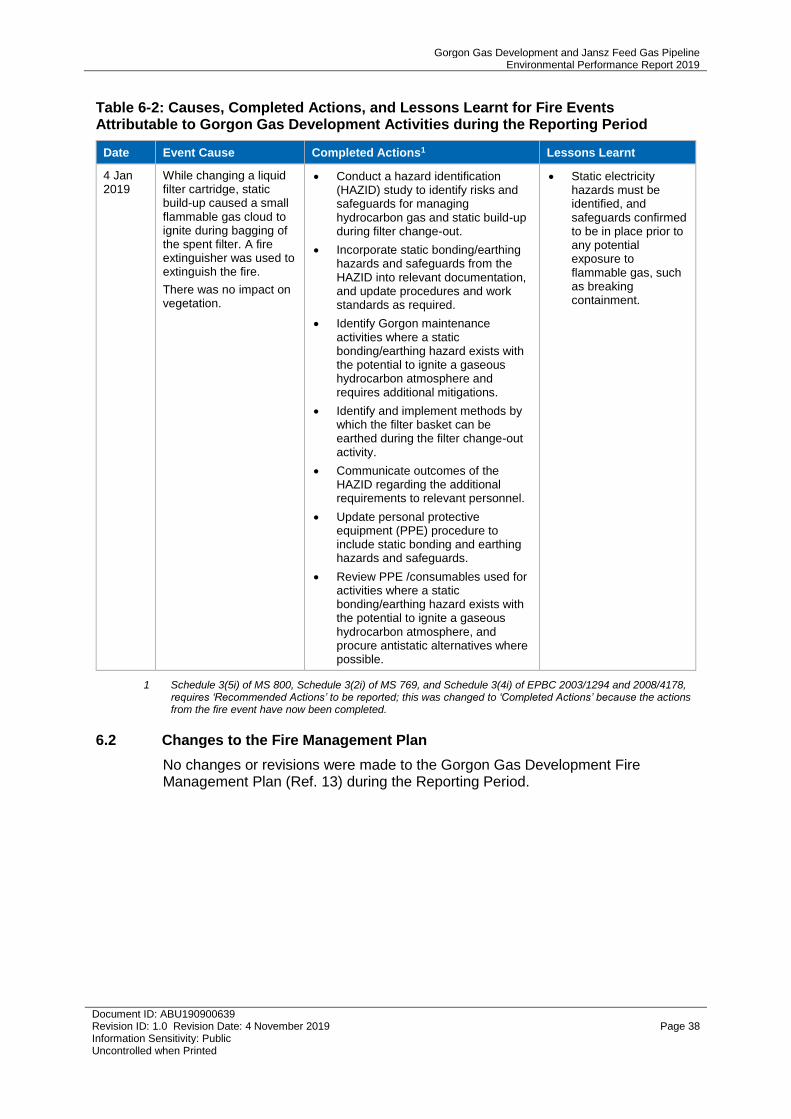
Gorgon Gas Development and Jansz Feed Gas Pipeline Environmental Performance Report 2019
Document ID: ABU190900639 Revision ID: 1.0 Revision Date: 4 November 2019 Page 38 Information Sensitivity: Public Uncontrolled when Printed
Table 6-2: Causes, Completed Actions, and Lessons Learnt for Fire Events Attributable to Gorgon Gas Development Activities during the Reporting Period
Date Event Cause Completed Actions1 Lessons Learnt
4 Jan 2019
While changing a liquid filter cartridge, static build-up caused a small flammable gas cloud to ignite during bagging of the spent filter. A fire extinguisher was used to extinguish the fire.
There was no impact on vegetation.
• Conduct a hazard identification (HAZID) study to identify risks and safeguards for managing hydrocarbon gas and static build-up during filter change-out.
• Incorporate static bonding/earthing hazards and safeguards from the HAZID into relevant documentation, and update procedures and work standards as required.
• Identify Gorgon maintenance activities where a static bonding/earthing hazard exists with the potential to ignite a gaseous hydrocarbon atmosphere and requires additional mitigations.
• Identify and implement methods by which the filter basket can be earthed during the filter change-out activity.
• Communicate outcomes of the HAZID regarding the additional requirements to relevant personnel.
• Update personal protective equipment (PPE) procedure to include static bonding and earthing hazards and safeguards.
• Review PPE /consumables used for activities where a static bonding/earthing hazard exists with the potential to ignite a gaseous hydrocarbon atmosphere, and procure antistatic alternatives where possible.
• Static electricity hazards must be identified, and safeguards confirmed to be in place prior to any potential exposure to flammable gas, such as breaking containment.
1 Schedule 3(5i) of MS 800, Schedule 3(2i) of MS 769, and Schedule 3(4i) of EPBC 2003/1294 and 2008/4178, requires ‘Recommended Actions’ to be reported; this was changed to ‘Completed Actions’ because the actions from the fire event have now been completed.
6.2 Changes to the Fire Management Plan
No changes or revisions were made to the Gorgon Gas Development Fire Management Plan (Ref. 13) during the Reporting Period.
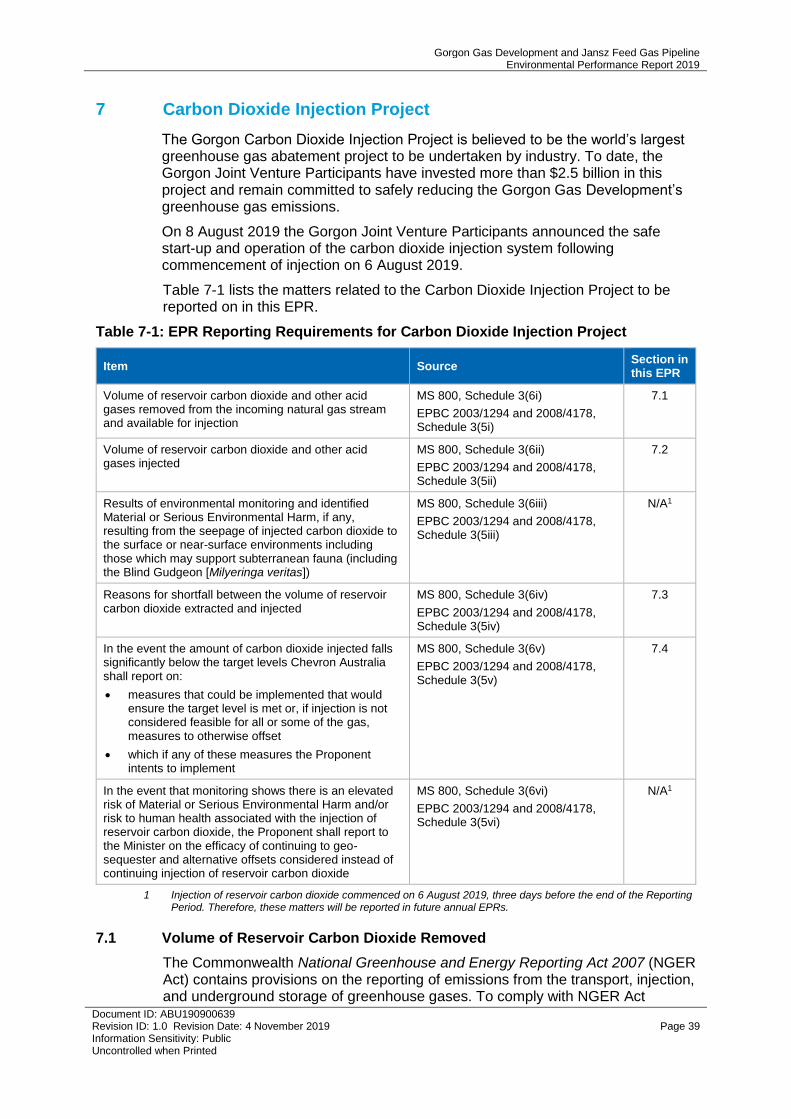
Gorgon Gas Development and Jansz Feed Gas Pipeline Environmental Performance Report 2019
Document ID: ABU190900639 Revision ID: 1.0 Revision Date: 4 November 2019 Page 39 Information Sensitivity: Public Uncontrolled when Printed
7 Carbon Dioxide Injection Project
The Gorgon Carbon Dioxide Injection Project is believed to be the world’s largest greenhouse gas abatement project to be undertaken by industry. To date, the Gorgon Joint Venture Participants have invested more than $2.5 billion in this project and remain committed to safely reducing the Gorgon Gas Development’s greenhouse gas emissions.
On 8 August 2019 the Gorgon Joint Venture Participants announced the safe start-up and operation of the carbon dioxide injection system following commencement of injection on 6 August 2019.
Table 7-1 lists the matters related to the Carbon Dioxide Injection Project to be reported on in this EPR.
Table 7-1: EPR Reporting Requirements for Carbon Dioxide Injection Project
Item Source Section in this EPR
Volume of reservoir carbon dioxide and other acid gases removed from the incoming natural gas stream and available for injection
MS 800, Schedule 3(6i)
EPBC 2003/1294 and 2008/4178, Schedule 3(5i)
7.1
Volume of reservoir carbon dioxide and other acid gases injected
MS 800, Schedule 3(6ii)
EPBC 2003/1294 and 2008/4178, Schedule 3(5ii)
7.2
Results of environmental monitoring and identified Material or Serious Environmental Harm, if any, resulting from the seepage of injected carbon dioxide to the surface or near-surface environments including those which may support subterranean fauna (including the Blind Gudgeon [Milyeringa veritas])
MS 800, Schedule 3(6iii)
EPBC 2003/1294 and 2008/4178, Schedule 3(5iii)
N/A1
Reasons for shortfall between the volume of reservoir carbon dioxide extracted and injected
MS 800, Schedule 3(6iv)
EPBC 2003/1294 and 2008/4178, Schedule 3(5iv)
7.3
In the event the amount of carbon dioxide injected falls significantly below the target levels Chevron Australia shall report on:
• measures that could be implemented that would ensure the target level is met or, if injection is not considered feasible for all or some of the gas, measures to otherwise offset
• which if any of these measures the Proponent intents to implement
MS 800, Schedule 3(6v)
EPBC 2003/1294 and 2008/4178, Schedule 3(5v)
7.4
In the event that monitoring shows there is an elevated risk of Material or Serious Environmental Harm and/or risk to human health associated with the injection of reservoir carbon dioxide, the Proponent shall report to the Minister on the efficacy of continuing to geo-sequester and alternative offsets considered instead of continuing injection of reservoir carbon dioxide
MS 800, Schedule 3(6vi)
EPBC 2003/1294 and 2008/4178, Schedule 3(5vi)
N/A1
1 Injection of reservoir carbon dioxide commenced on 6 August 2019, three days before the end of the Reporting Period. Therefore, these matters will be reported in future annual EPRs.
7.1 Volume of Reservoir Carbon Dioxide Removed
The Commonwealth National Greenhouse and Energy Reporting Act 2007 (NGER Act) contains provisions on the reporting of emissions from the transport, injection, and underground storage of greenhouse gases. To comply with NGER Act
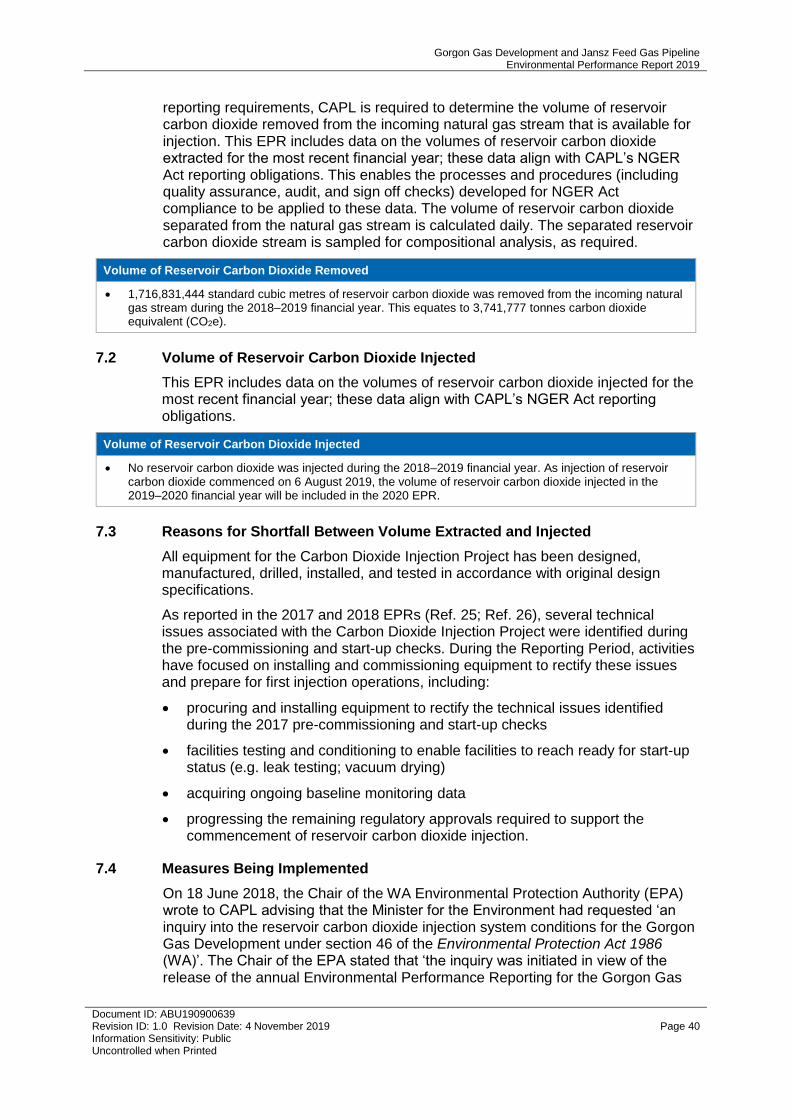
Gorgon Gas Development and Jansz Feed Gas Pipeline Environmental Performance Report 2019
Document ID: ABU190900639 Revision ID: 1.0 Revision Date: 4 November 2019 Page 40 Information Sensitivity: Public Uncontrolled when Printed
reporting requirements, CAPL is required to determine the volume of reservoir carbon dioxide removed from the incoming natural gas stream that is available for injection. This EPR includes data on the volumes of reservoir carbon dioxide extracted for the most recent financial year; these data align with CAPL’s NGER Act reporting obligations. This enables the processes and procedures (including quality assurance, audit, and sign off checks) developed for NGER Act compliance to be applied to these data. The volume of reservoir carbon dioxide separated from the natural gas stream is calculated daily. The separated reservoir carbon dioxide stream is sampled for compositional analysis, as required.
Volume of Reservoir Carbon Dioxide Removed
• 1,716,831,444 standard cubic metres of reservoir carbon dioxide was removed from the incoming natural gas stream during the 2018–2019 financial year. This equates to 3,741,777 tonnes carbon dioxide equivalent (CO2e).
7.2 Volume of Reservoir Carbon Dioxide Injected
This EPR includes data on the volumes of reservoir carbon dioxide injected for the most recent financial year; these data align with CAPL’s NGER Act reporting obligations.
Volume of Reservoir Carbon Dioxide Injected
• No reservoir carbon dioxide was injected during the 2018–2019 financial year. As injection of reservoir carbon dioxide commenced on 6 August 2019, the volume of reservoir carbon dioxide injected in the 2019–2020 financial year will be included in the 2020 EPR.
7.3 Reasons for Shortfall Between Volume Extracted and Injected
All equipment for the Carbon Dioxide Injection Project has been designed, manufactured, drilled, installed, and tested in accordance with original design specifications.
As reported in the 2017 and 2018 EPRs (Ref. 25; Ref. 26), several technical issues associated with the Carbon Dioxide Injection Project were identified during the pre-commissioning and start-up checks. During the Reporting Period, activities have focused on installing and commissioning equipment to rectify these issues and prepare for first injection operations, including:
• procuring and installing equipment to rectify the technical issues identified during the 2017 pre-commissioning and start-up checks
• facilities testing and conditioning to enable facilities to reach ready for start-up status (e.g. leak testing; vacuum drying)
• acquiring ongoing baseline monitoring data
• progressing the remaining regulatory approvals required to support the commencement of reservoir carbon dioxide injection.
7.4 Measures Being Implemented
On 18 June 2018, the Chair of the WA Environmental Protection Authority (EPA) wrote to CAPL advising that the Minister for the Environment had requested ‘an inquiry into the reservoir carbon dioxide injection system conditions for the Gorgon Gas Development under section 46 of the Environmental Protection Act 1986 (WA)’. The Chair of the EPA stated that ‘the inquiry was initiated in view of the release of the annual Environmental Performance Reporting for the Gorgon Gas
Gorgon Gas Development and Jansz Feed Gas Pipeline Environmental Performance Report 2019
Document ID: ABU190900639 Revision ID: 1.0 Revision Date: 4 November 2019 Page 41 Information Sensitivity: Public Uncontrolled when Printed
Development and the need to have a clearly defined starting point for the commencement of the carbon dioxide injection system’.
Until this inquiry is complete, and the Minister has made a determination with respect of the matter, it is not possible to report on the requirement in MS 800 Schedule 3(6v).
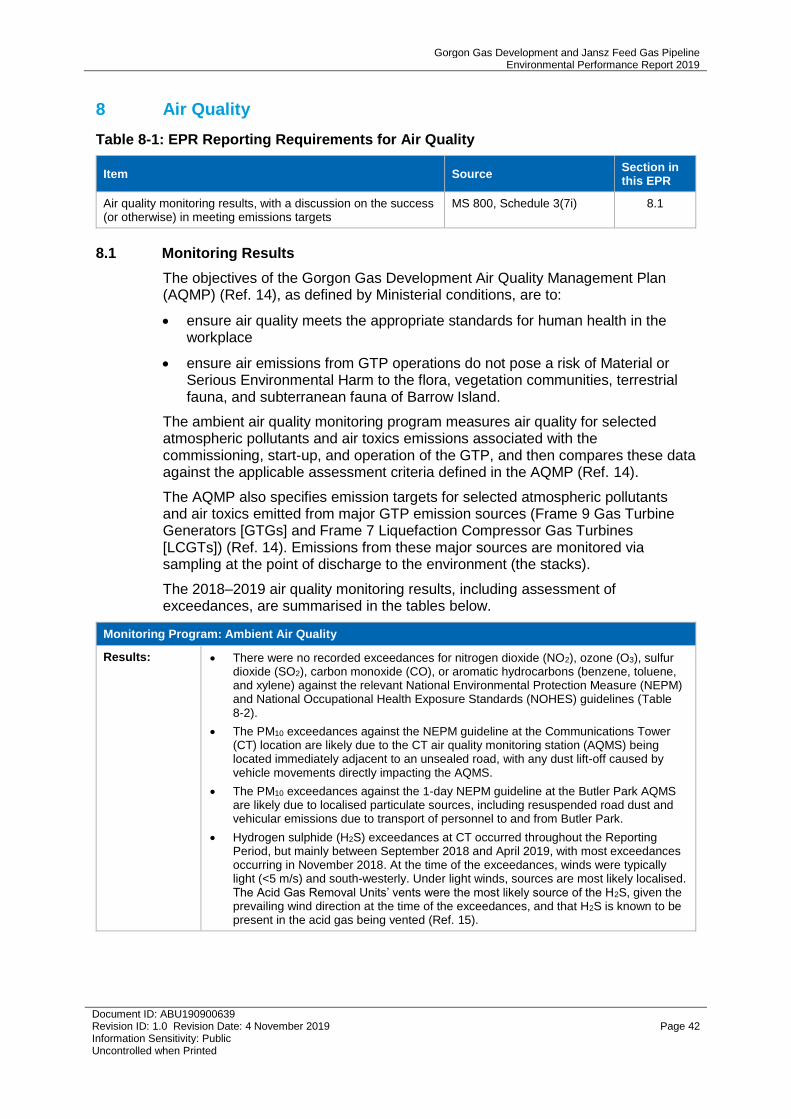
Gorgon Gas Development and Jansz Feed Gas Pipeline Environmental Performance Report 2019
Document ID: ABU190900639 Revision ID: 1.0 Revision Date: 4 November 2019 Page 42 Information Sensitivity: Public Uncontrolled when Printed
8 Air Quality
Table 8-1: EPR Reporting Requirements for Air Quality
Item Source Section in this EPR
Air quality monitoring results, with a discussion on the success (or otherwise) in meeting emissions targets
MS 800, Schedule 3(7i) 8.1
8.1 Monitoring Results
The objectives of the Gorgon Gas Development Air Quality Management Plan (AQMP) (Ref. 14), as defined by Ministerial conditions, are to:
• ensure air quality meets the appropriate standards for human health in the workplace
• ensure air emissions from GTP operations do not pose a risk of Material or Serious Environmental Harm to the flora, vegetation communities, terrestrial fauna, and subterranean fauna of Barrow Island.
The ambient air quality monitoring program measures air quality for selected atmospheric pollutants and air toxics emissions associated with the commissioning, start-up, and operation of the GTP, and then compares these data against the applicable assessment criteria defined in the AQMP (Ref. 14).
The AQMP also specifies emission targets for selected atmospheric pollutants and air toxics emitted from major GTP emission sources (Frame 9 Gas Turbine Generators [GTGs] and Frame 7 Liquefaction Compressor Gas Turbines [LCGTs]) (Ref. 14). Emissions from these major sources are monitored via sampling at the point of discharge to the environment (the stacks).
The 2018–2019 air quality monitoring results, including assessment of exceedances, are summarised in the tables below.
Monitoring Program: Ambient Air Quality
Results: • There were no recorded exceedances for nitrogen dioxide (NO2), ozone (O3), sulfur dioxide (SO2), carbon monoxide (CO), or aromatic hydrocarbons (benzene, toluene, and xylene) against the relevant National Environmental Protection Measure (NEPM) and National Occupational Health Exposure Standards (NOHES) guidelines (Table 8-2).
• The PM10 exceedances against the NEPM guideline at the Communications Tower (CT) location are likely due to the CT air quality monitoring station (AQMS) being located immediately adjacent to an unsealed road, with any dust lift-off caused by vehicle movements directly impacting the AQMS.
• The PM10 exceedances against the 1-day NEPM guideline at the Butler Park AQMS are likely due to localised particulate sources, including resuspended road dust and vehicular emissions due to transport of personnel to and from Butler Park.
• Hydrogen sulphide (H2S) exceedances at CT occurred throughout the Reporting Period, but mainly between September 2018 and April 2019, with most exceedances occurring in November 2018. At the time of the exceedances, winds were typically light (<5 m/s) and south-westerly. Under light winds, sources are most likely localised. The Acid Gas Removal Units’ vents were the most likely source of the H2S, given the prevailing wind direction at the time of the exceedances, and that H2S is known to be present in the acid gas being vented (Ref. 15).
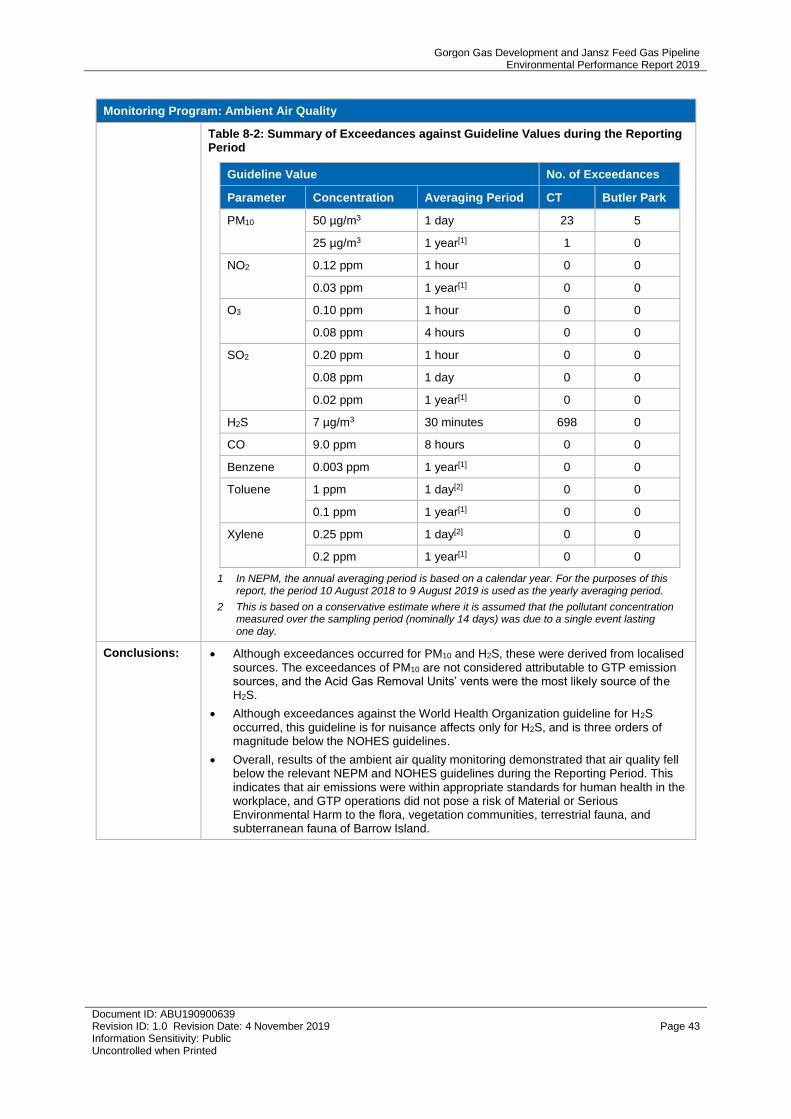
Gorgon Gas Development and Jansz Feed Gas Pipeline Environmental Performance Report 2019
Document ID: ABU190900639 Revision ID: 1.0 Revision Date: 4 November 2019 Page 43 Information Sensitivity: Public Uncontrolled when Printed
Monitoring Program: Ambient Air Quality
Table 8-2: Summary of Exceedances against Guideline Values during the Reporting Period
Guideline Value No. of Exceedances
Parameter Concentration Averaging Period CT Butler Park
PM10 50 µg/m3 1 day 23 5
25 µg/m3 1 year[1] 1 0
NO2 0.12 ppm 1 hour 0 0
0.03 ppm 1 year[1] 0 0
O3 0.10 ppm 1 hour 0 0
0.08 ppm 4 hours 0 0
SO2 0.20 ppm 1 hour 0 0
0.08 ppm 1 day 0 0
0.02 ppm 1 year[1] 0 0
H2S 7 µg/m3 30 minutes 698 0
CO 9.0 ppm 8 hours 0 0
Benzene 0.003 ppm 1 year[1] 0 0
Toluene 1 ppm 1 day[2] 0 0
0.1 ppm 1 year[1] 0 0
Xylene 0.25 ppm 1 day[2] 0 0
0.2 ppm 1 year[1] 0 0
1 In NEPM, the annual averaging period is based on a calendar year. For the purposes of this report, the period 10 August 2018 to 9 August 2019 is used as the yearly averaging period.
2 This is based on a conservative estimate where it is assumed that the pollutant concentration measured over the sampling period (nominally 14 days) was due to a single event lasting one day.
Conclusions: • Although exceedances occurred for PM10 and H2S, these were derived from localised sources. The exceedances of PM10 are not considered attributable to GTP emission sources, and the Acid Gas Removal Units’ vents were the most likely source of the H2S.
• Although exceedances against the World Health Organization guideline for H2S occurred, this guideline is for nuisance affects only for H2S, and is three orders of magnitude below the NOHES guidelines.
• Overall, results of the ambient air quality monitoring demonstrated that air quality fell below the relevant NEPM and NOHES guidelines during the Reporting Period. This indicates that air emissions were within appropriate standards for human health in the workplace, and GTP operations did not pose a risk of Material or Serious Environmental Harm to the flora, vegetation communities, terrestrial fauna, and subterranean fauna of Barrow Island.
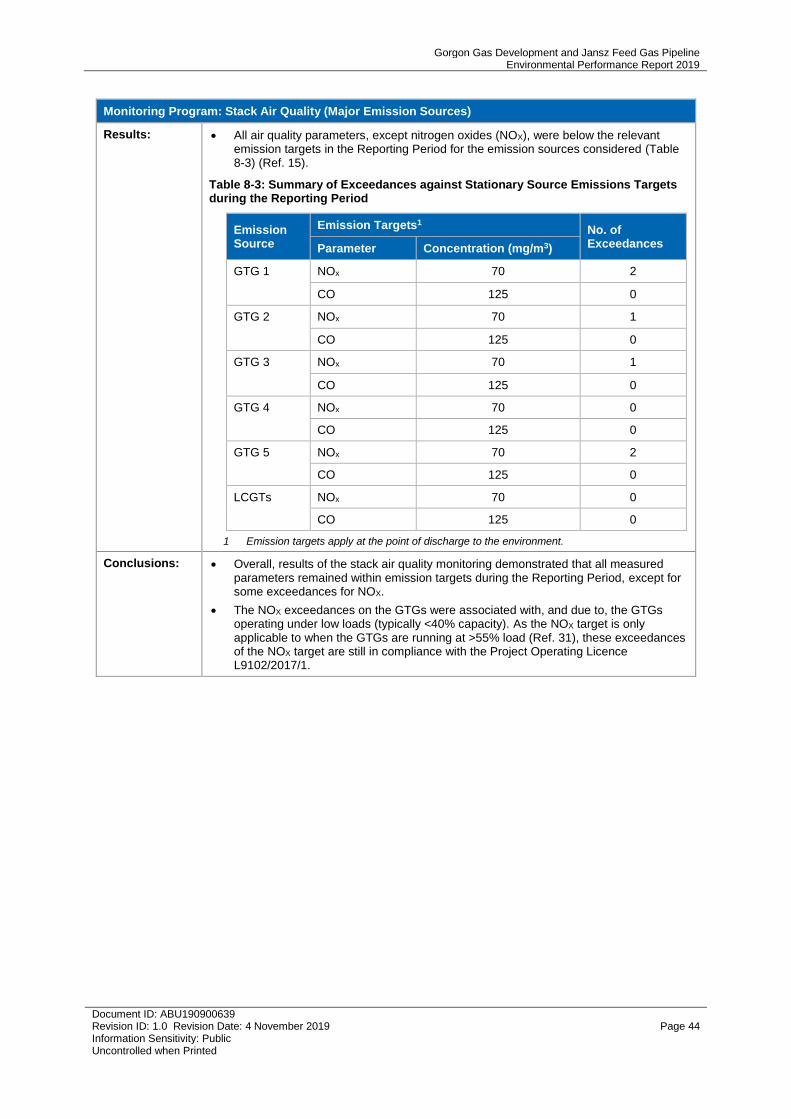
Gorgon Gas Development and Jansz Feed Gas Pipeline Environmental Performance Report 2019
Document ID: ABU190900639 Revision ID: 1.0 Revision Date: 4 November 2019 Page 44 Information Sensitivity: Public Uncontrolled when Printed
Monitoring Program: Stack Air Quality (Major Emission Sources)
Results: • All air quality parameters, except nitrogen oxides (NOX), were below the relevant emission targets in the Reporting Period for the emission sources considered (Table 8-3) (Ref. 15).
Table 8-3: Summary of Exceedances against Stationary Source Emissions Targets during the Reporting Period
Emission Source
Emission Targets1 No. of Exceedances Parameter Concentration (mg/m3)
GTG 1 NOx 70 2
CO 125 0
GTG 2 NOx 70 1
CO 125 0
GTG 3 NOx 70 1
CO 125 0
GTG 4 NOx 70 0
CO 125 0
GTG 5 NOx 70 2
CO 125 0
LCGTs NOx 70 0
CO 125 0
1 Emission targets apply at the point of discharge to the environment.
Conclusions: • Overall, results of the stack air quality monitoring demonstrated that all measured parameters remained within emission targets during the Reporting Period, except for some exceedances for NOX.
• The NOX exceedances on the GTGs were associated with, and due to, the GTGs operating under low loads (typically <40% capacity). As the NOX target is only applicable to when the GTGs are running at >55% load (Ref. 31), these exceedances of the NOX target are still in compliance with the Project Operating Licence L9102/2017/1.
Gorgon Gas Development and Jansz Feed Gas Pipeline Environmental Performance Report 2019
Document ID: ABU190900639 Revision ID: 1.0 Revision Date: 4 November 2019 Page 45 Information Sensitivity: Public Uncontrolled when Printed
9 Coastal Stability
Table 9-1: EPR Reporting Requirements for Coastal Stability
Item Source Section in this EPR
Results of beach and sediment monitoring
MS 800, Schedule 3(8i)
EPBC 2003/1294 and 2008/4178, Schedule 3(6i)
9.1, 9.2
Any mitigation measures applied in response to action-related impacts of beach profile
MS 800, Schedule 3(8ii)
EPBC 2003/1294 and 2008/4178, Schedule 3(6ii)
N/A1
All exceedances of management triggers
Approval letter from the former WA Department of Environment and Conservation to CAPL (Ref. 16)
9.1, 9.2
1 No mitigation measures as required under Condition 25.6(iii) of MS 800 and Condition 18.6(iii) of EPBC 2003/1294 and 2008/4178 were implemented during the Reporting Period; therefore, reporting is not applicable at this time.
9.1 Monitoring Results
The objectives of the Gorgon Gas Development Coastal Stability Management and Monitoring Plan (CSMMP) (Ref. 17), as defined by Ministerial conditions, are to:
• ensure that the MOF and LNG Jetty do not cause significant adverse impacts to the beaches adjacent to those facilities
• establish a monitoring program to detect adverse changes to the beach structure and beach sediments that could have implications for marine turtles nesting on the beaches adjacent to the MOF and LNG Jetty.
The monitoring program detects changes to the beach morphology (beach structure and beach sediments) that could have potential implications for coastal stability and/or marine turtle nesting (Ref. 17).
Coastal stability management triggers have been established for beach volume, beach slope, and sediment particle size, and data from each monitoring event are compared against the management triggers. The actions required if a management trigger exceedance occurs are set out in the CSMMP Supplement: Management Triggers (Ref. 18). Management triggers specific to changes in turtle nesting habitat, based on the quantification of marine turtle nesting areas through habitat mapping, have been defined. These marine turtle nesting habitat management triggers only apply to the beaches adjacent to the MOF and LNG Jetty (Terminal and Bivalve), and only to data collected in the end of dry season monitoring event (Ref. 17; Ref. 18).
The 2018–2019 monitoring results, including any detected exceedances and major event monitoring, are summarised in the following tables.
Monitoring Program: Beach Structure
Objective: • Detect changes to the beaches adjacent to the marine facilities that may affect the stability of those beaches by measuring beach profile, beach volume, and quantifying the extent of any erosion or accretion of sediment over time.
Methodology: • Remote sensing surveys are completed twice each year (at the end of the dry and wet seasons where practicable, typically October and April) or after a major weather event. These surveys capture horizontal (x,y-plane) and vertical (z-plane) data to generate digital surface elevation models over the entire beach (landward of the primary dune to the waterline) at Terminal, Bivalve, Inga, YCN, and YCS beaches.
Gorgon Gas Development and Jansz Feed Gas Pipeline Environmental Performance Report 2019
Document ID: ABU190900639 Revision ID: 1.0 Revision Date: 4 November 2019 Page 46 Information Sensitivity: Public Uncontrolled when Printed
Monitoring Program: Beach Structure
• Topographic surveys (using remote sensing or real-time kinetic global positioning methods) to record beach morphology are also undertaken, where practicable, after a major weather event.
Survey Timing • End of dry season routine monitoring event: on-ground surveys 25-28 October 2018, topographic survey 11 October 2018
• End of wet season routine monitoring event: on-ground surveys 4-8 April 2019, topographic survey 6 May 2019
• Tropical Cyclone (TC) Riley: pre-cyclone inspection and photographs 25 January 2019, post-cyclone inspection 3 February 2019
• TC Veronica: pre-cyclone inspection and photographs 20 March 2019, during cyclone photographs 23 March 2019, post-cyclone monitoring captured in routine end of wet season survey
• June 2019 storm: post-storm monitoring 8-11 July 2019
Results: Surface Elevation – Patterns of Erosion and Accretion
• Measurements of surface elevation are presented in the context of change since baseline condition (October 2009 to May 2019), annual change (May 2018 to May 2019) and seasonal change (October 2018 to May 2019). Tropical Cyclone (TC) Veronica (March 2019) considerably affected beach morphology, therefore all comparisons of surface elevation change presented here includes that effect. See the Major Event Monitoring section below for more detail.
Terminal Beach
• Between October 2009 and May 2019, Terminal Beach eroded at the northern end of the beach, and accreted at the southern end of the beach, with some accretion also evident in the creek bed at the centre of the beach (Figure 9-1).
• Between May 2018 and May 2019, changes to surface elevation occurred at the southern end of Terminal Beach, with localised erosion along the sparse vegetation line and in localised areas at the southern end (Figure 9-1) (Ref. 19).
Bivalve Beach
• Conversely to Terminal Beach, between October 2009 and May 2019 Bivalve Beach (immediately south of the MOF) exhibited erosion in the south (particularly in the creek bed) and accretion in the north (Figure 9-2).
• Between May 2018 and May 2019, localised erosion occurred along the sparse vegetation line at Bivalve Beach, and at the northern end (i.e. adjacent to the MOF) (Figure 9-2) (Ref. 19).
Inga Beach
• Between October 2009 and May 2019, Inga Beach exhibited similar trends to Bivalve Beach, with accretion at its northern end, predominantly at the beach face. Erosion at Inga Beach starts approximately one-third of the way south along the beach, extending to just beyond the beginning of the subaerial rock platform (Figure 9-3).
• Between May 2018 and May 2019, there was some localised erosion along the sparse vegetation line (Figure 9-3) (Ref. 19).
YCN Beach
• Between October 2009 and May 2019, YCN Beach mainly exhibited erosion at the southern end and accretion at the northern end (Figure 9-4). YCN Beach is highly variable at the northern boundary, where the Terminal Creek sandbar is frequently redistributed by wave action and creek flows.
• Between May 2018 and May 2019, YCN Beach remained relatively stable (Figure 9-4) (Ref. 19).
YCS Beach
• Between October 2009 and May 2019, YCS Beach exhibited mainly accretion at the base of the foredune and erosion predominantly north of the intertidal rock platforms / outcropping rock (Figure 9-5).
• Between May 2018 and May 2019, there was a net volume reduction of sand at YCS Beach that spanned the length of the beach, mainly along the sparse vegetation line (Figure 9-5) (Ref. 19).
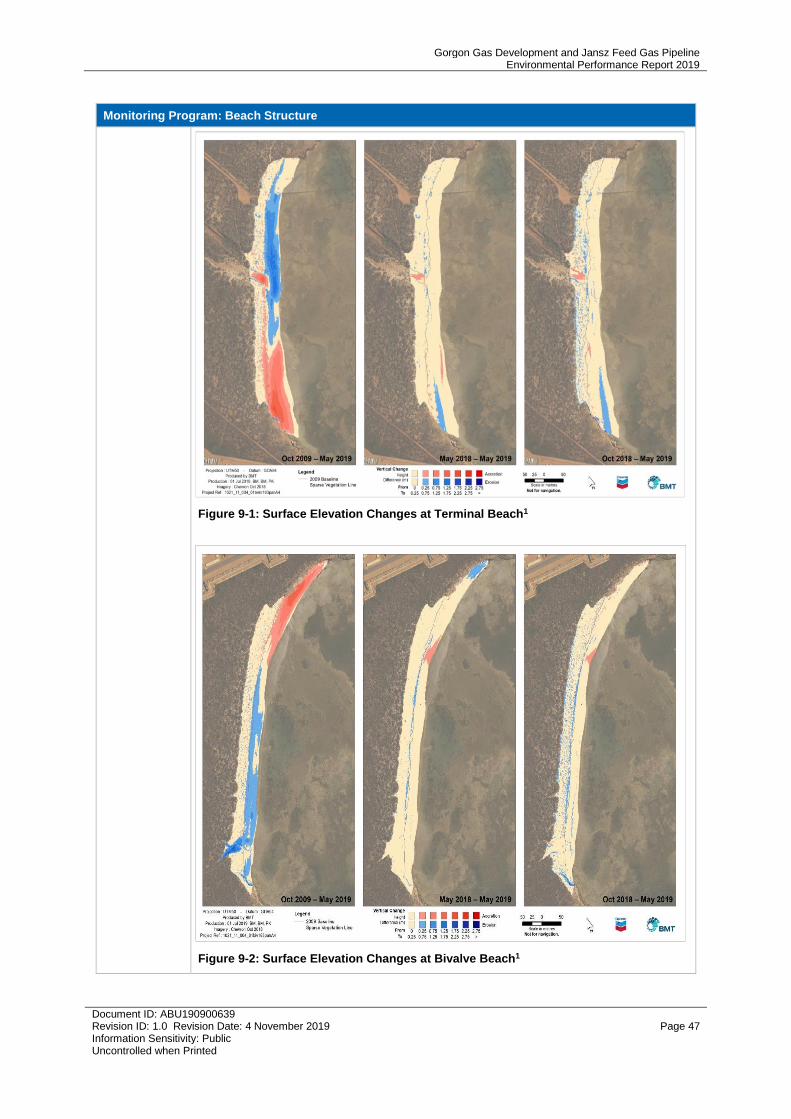
Gorgon Gas Development and Jansz Feed Gas Pipeline Environmental Performance Report 2019
Document ID: ABU190900639 Revision ID: 1.0 Revision Date: 4 November 2019 Page 47 Information Sensitivity: Public Uncontrolled when Printed
Monitoring Program: Beach Structure
Figure 9-1: Surface Elevation Changes at Terminal Beach1
Figure 9-2: Surface Elevation Changes at Bivalve Beach1
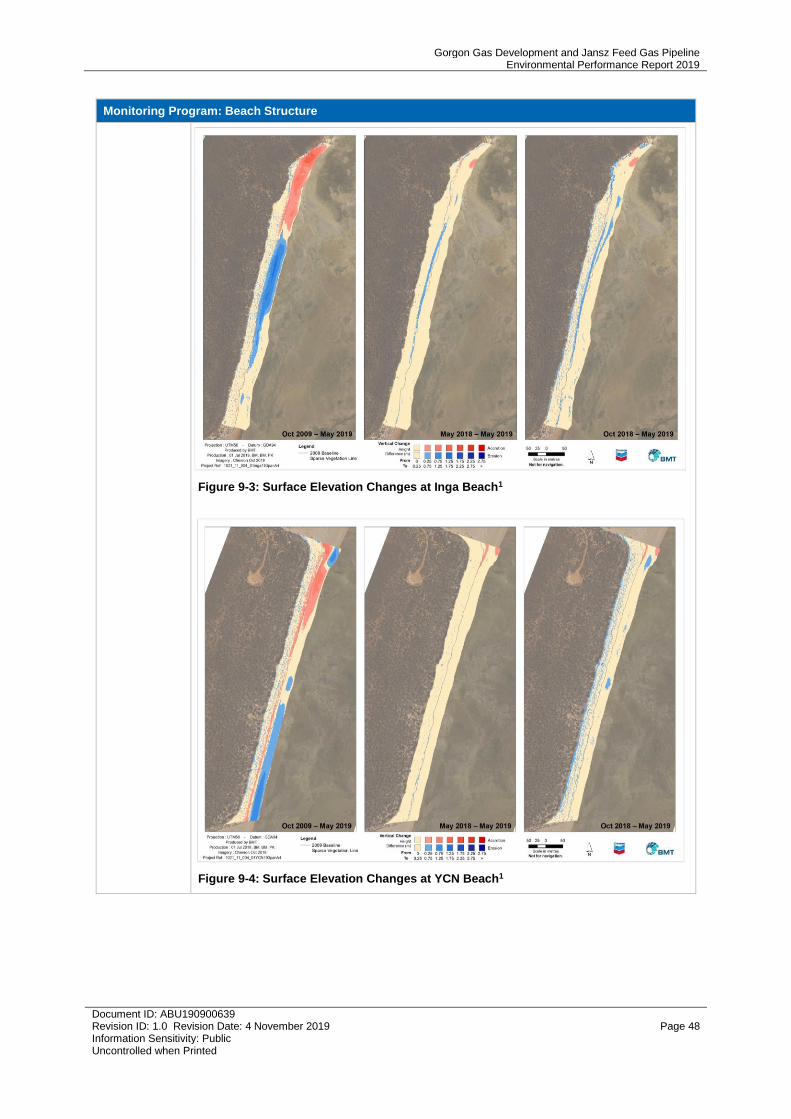
Gorgon Gas Development and Jansz Feed Gas Pipeline Environmental Performance Report 2019
Document ID: ABU190900639 Revision ID: 1.0 Revision Date: 4 November 2019 Page 48 Information Sensitivity: Public Uncontrolled when Printed
Monitoring Program: Beach Structure
Figure 9-3: Surface Elevation Changes at Inga Beach1
Figure 9-4: Surface Elevation Changes at YCN Beach1
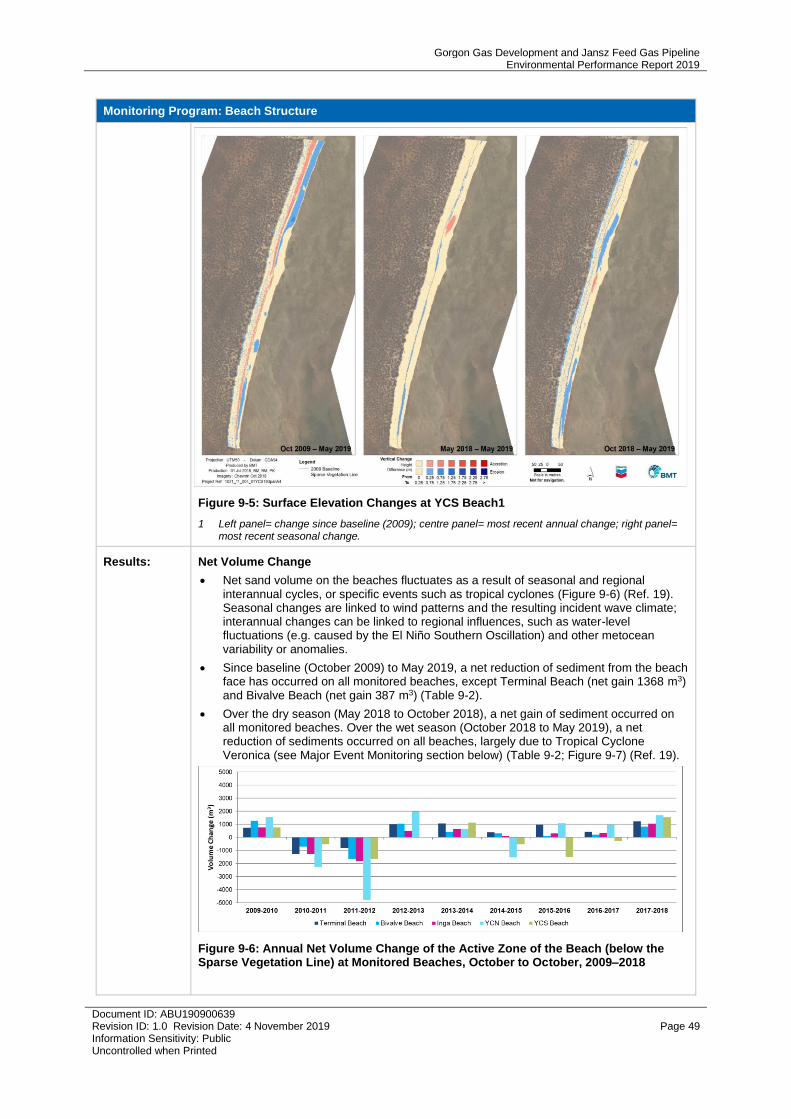
Gorgon Gas Development and Jansz Feed Gas Pipeline Environmental Performance Report 2019
Document ID: ABU190900639 Revision ID: 1.0 Revision Date: 4 November 2019 Page 49 Information Sensitivity: Public Uncontrolled when Printed
Monitoring Program: Beach Structure
Figure 9-5: Surface Elevation Changes at YCS Beach1
1 Left panel= change since baseline (2009); centre panel= most recent annual change; right panel= most recent seasonal change.
Results: Net Volume Change
• Net sand volume on the beaches fluctuates as a result of seasonal and regional interannual cycles, or specific events such as tropical cyclones (Figure 9-6) (Ref. 19). Seasonal changes are linked to wind patterns and the resulting incident wave climate; interannual changes can be linked to regional influences, such as water-level fluctuations (e.g. caused by the El Niño Southern Oscillation) and other metocean variability or anomalies.
• Since baseline (October 2009) to May 2019, a net reduction of sediment from the beach face has occurred on all monitored beaches, except Terminal Beach (net gain 1368 m3) and Bivalve Beach (net gain 387 m3) (Table 9-2).
• Over the dry season (May 2018 to October 2018), a net gain of sediment occurred on all monitored beaches. Over the wet season (October 2018 to May 2019), a net reduction of sediments occurred on all beaches, largely due to Tropical Cyclone Veronica (see Major Event Monitoring section below) (Table 9-2; Figure 9-7) (Ref. 19).
Figure 9-6: Annual Net Volume Change of the Active Zone of the Beach (below the Sparse Vegetation Line) at Monitored Beaches, October to October, 2009–2018
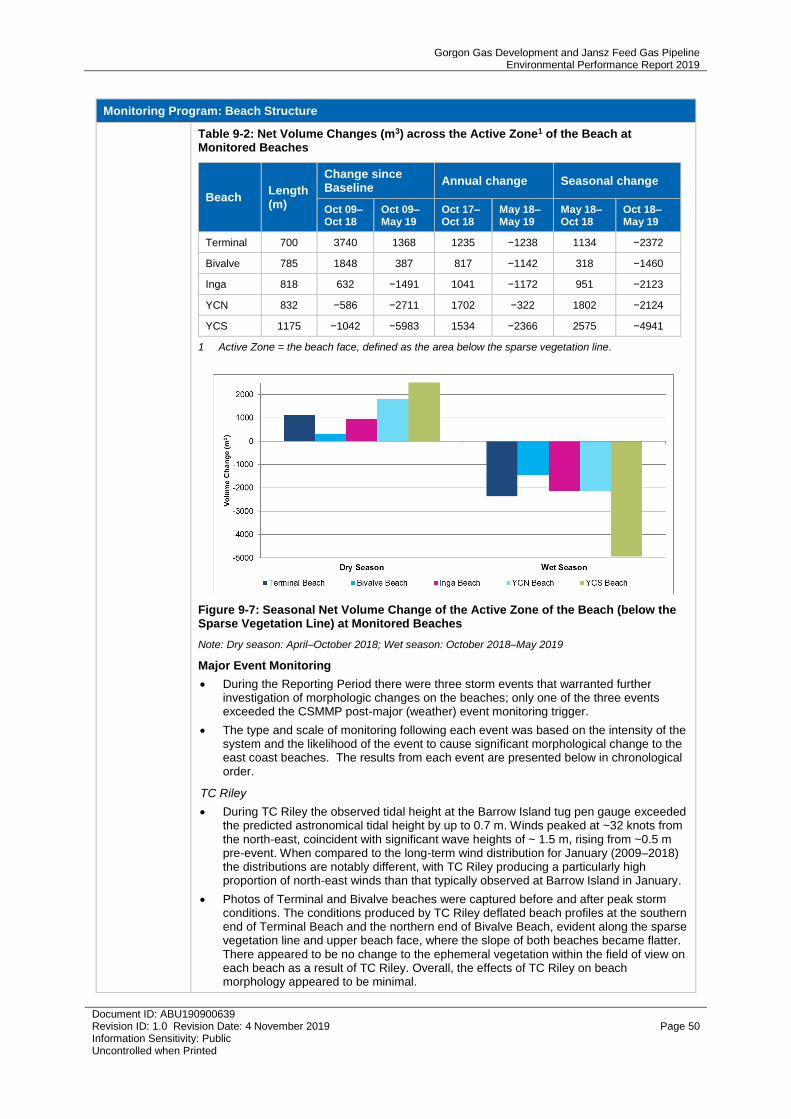
Gorgon Gas Development and Jansz Feed Gas Pipeline Environmental Performance Report 2019
Document ID: ABU190900639 Revision ID: 1.0 Revision Date: 4 November 2019 Page 50 Information Sensitivity: Public Uncontrolled when Printed
Monitoring Program: Beach Structure
Table 9-2: Net Volume Changes (m3) across the Active Zone1 of the Beach at Monitored Beaches
Beach Length (m)
Change since Baseline
Annual change Seasonal change
Oct 09–Oct 18
Oct 09–May 19
Oct 17–Oct 18
May 18–May 19
May 18–Oct 18
Oct 18–May 19
Terminal 700 3740 1368 1235 −1238 1134 −2372
Bivalve 785 1848 387 817 −1142 318 −1460
Inga 818 632 −1491 1041 −1172 951 −2123
YCN 832 −586 −2711 1702 −322 1802 −2124
YCS 1175 −1042 −5983 1534 −2366 2575 −4941
1 Active Zone = the beach face, defined as the area below the sparse vegetation line.
Figure 9-7: Seasonal Net Volume Change of the Active Zone of the Beach (below the Sparse Vegetation Line) at Monitored Beaches
Note: Dry season: April–October 2018; Wet season: October 2018–May 2019
Major Event Monitoring
• During the Reporting Period there were three storm events that warranted further investigation of morphologic changes on the beaches; only one of the three events exceeded the CSMMP post-major (weather) event monitoring trigger.
• The type and scale of monitoring following each event was based on the intensity of the system and the likelihood of the event to cause significant morphological change to the east coast beaches. The results from each event are presented below in chronological order.
TC Riley
• During TC Riley the observed tidal height at the Barrow Island tug pen gauge exceeded the predicted astronomical tidal height by up to 0.7 m. Winds peaked at ~32 knots from the north-east, coincident with significant wave heights of ~ 1.5 m, rising from ~0.5 m pre-event. When compared to the long-term wind distribution for January (2009–2018) the distributions are notably different, with TC Riley producing a particularly high proportion of north-east winds than that typically observed at Barrow Island in January.
• Photos of Terminal and Bivalve beaches were captured before and after peak storm conditions. The conditions produced by TC Riley deflated beach profiles at the southern end of Terminal Beach and the northern end of Bivalve Beach, evident along the sparse vegetation line and upper beach face, where the slope of both beaches became flatter. There appeared to be no change to the ephemeral vegetation within the field of view on each beach as a result of TC Riley. Overall, the effects of TC Riley on beach morphology appeared to be minimal.
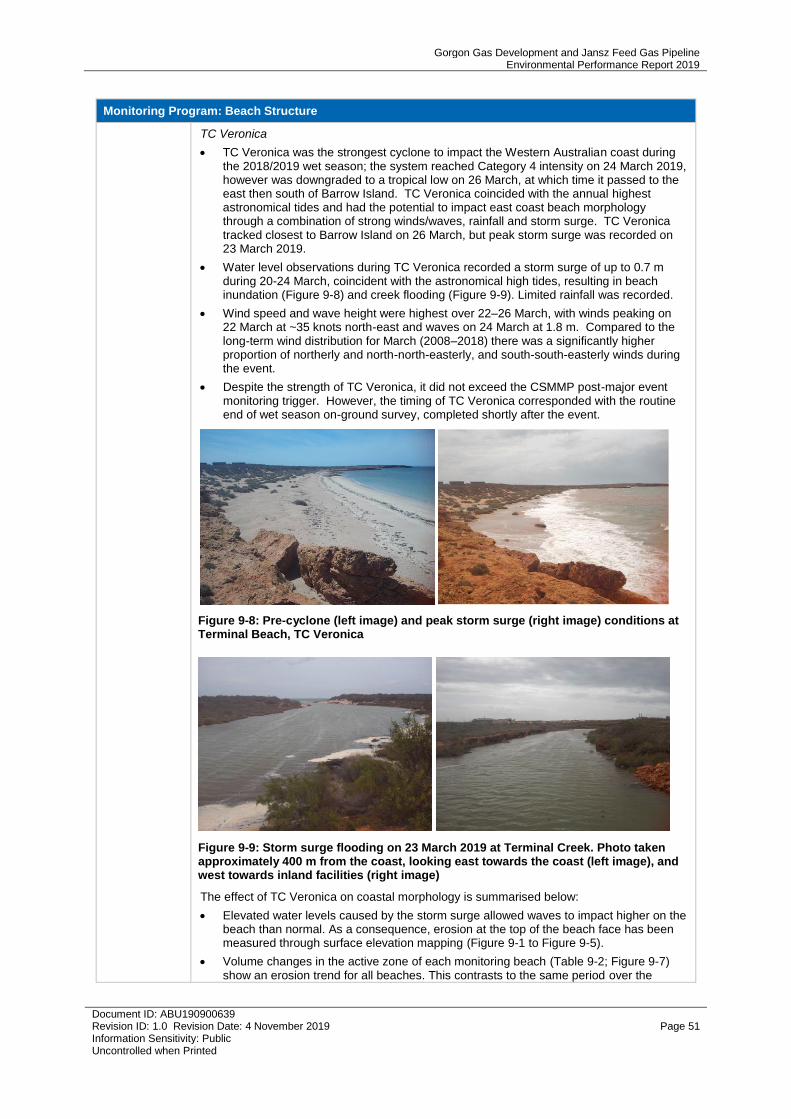
Gorgon Gas Development and Jansz Feed Gas Pipeline Environmental Performance Report 2019
Document ID: ABU190900639 Revision ID: 1.0 Revision Date: 4 November 2019 Page 51 Information Sensitivity: Public Uncontrolled when Printed
Monitoring Program: Beach Structure
TC Veronica
• TC Veronica was the strongest cyclone to impact the Western Australian coast during the 2018/2019 wet season; the system reached Category 4 intensity on 24 March 2019, however was downgraded to a tropical low on 26 March, at which time it passed to the east then south of Barrow Island. TC Veronica coincided with the annual highest astronomical tides and had the potential to impact east coast beach morphology through a combination of strong winds/waves, rainfall and storm surge. TC Veronica tracked closest to Barrow Island on 26 March, but peak storm surge was recorded on 23 March 2019.
• Water level observations during TC Veronica recorded a storm surge of up to 0.7 m during 20-24 March, coincident with the astronomical high tides, resulting in beach inundation (Figure 9-8) and creek flooding (Figure 9-9). Limited rainfall was recorded.
• Wind speed and wave height were highest over 22–26 March, with winds peaking on 22 March at ~35 knots north-east and waves on 24 March at 1.8 m. Compared to the long-term wind distribution for March (2008–2018) there was a significantly higher proportion of northerly and north-north-easterly, and south-south-easterly winds during the event.
• Despite the strength of TC Veronica, it did not exceed the CSMMP post-major event monitoring trigger. However, the timing of TC Veronica corresponded with the routine end of wet season on-ground survey, completed shortly after the event.
Figure 9-8: Pre-cyclone (left image) and peak storm surge (right image) conditions at Terminal Beach, TC Veronica
Figure 9-9: Storm surge flooding on 23 March 2019 at Terminal Creek. Photo taken approximately 400 m from the coast, looking east towards the coast (left image), and west towards inland facilities (right image)
The effect of TC Veronica on coastal morphology is summarised below:
• Elevated water levels caused by the storm surge allowed waves to impact higher on the beach than normal. As a consequence, erosion at the top of the beach face has been measured through surface elevation mapping (Figure 9-1 to Figure 9-5).
• Volume changes in the active zone of each monitoring beach (Table 9-2; Figure 9-7) show an erosion trend for all beaches. This contrasts to the same period over the
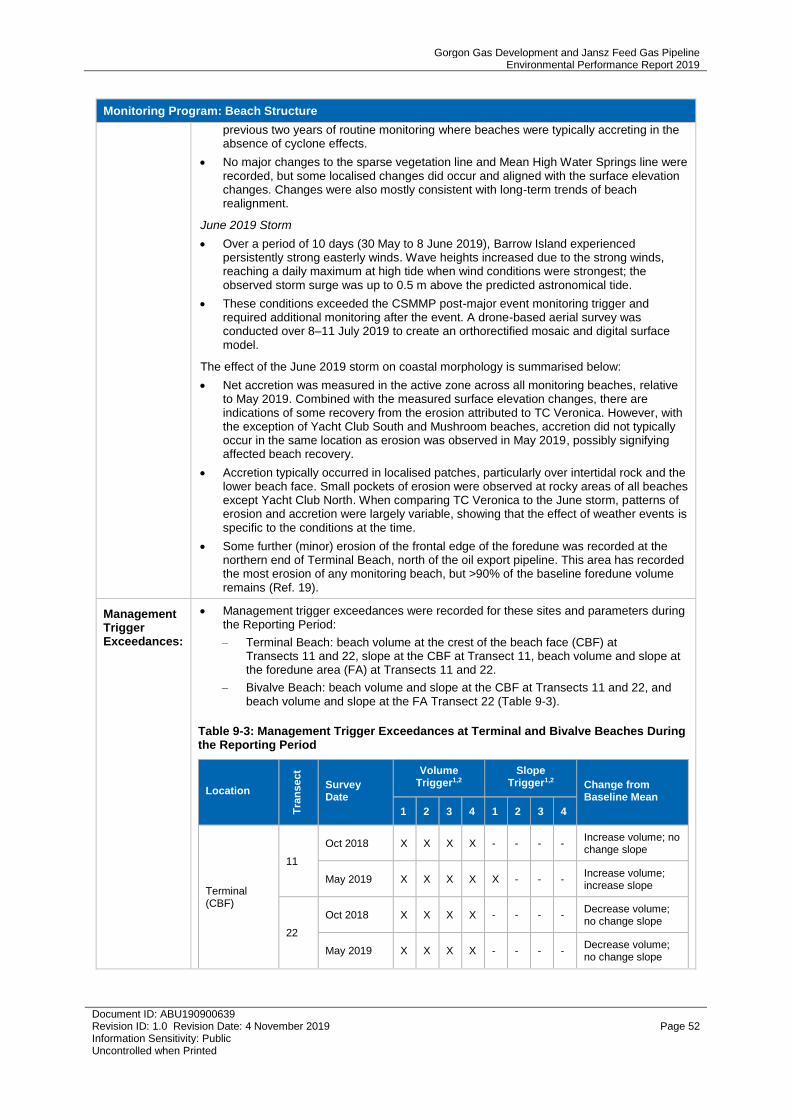
Gorgon Gas Development and Jansz Feed Gas Pipeline Environmental Performance Report 2019
Document ID: ABU190900639 Revision ID: 1.0 Revision Date: 4 November 2019 Page 52 Information Sensitivity: Public Uncontrolled when Printed
Monitoring Program: Beach Structure
previous two years of routine monitoring where beaches were typically accreting in the absence of cyclone effects.
• No major changes to the sparse vegetation line and Mean High Water Springs line were recorded, but some localised changes did occur and aligned with the surface elevation changes. Changes were also mostly consistent with long-term trends of beach realignment.
June 2019 Storm
• Over a period of 10 days (30 May to 8 June 2019), Barrow Island experienced persistently strong easterly winds. Wave heights increased due to the strong winds, reaching a daily maximum at high tide when wind conditions were strongest; the observed storm surge was up to 0.5 m above the predicted astronomical tide.
• These conditions exceeded the CSMMP post-major event monitoring trigger and required additional monitoring after the event. A drone-based aerial survey was conducted over 8–11 July 2019 to create an orthorectified mosaic and digital surface model.
The effect of the June 2019 storm on coastal morphology is summarised below:
• Net accretion was measured in the active zone across all monitoring beaches, relative to May 2019. Combined with the measured surface elevation changes, there are indications of some recovery from the erosion attributed to TC Veronica. However, with the exception of Yacht Club South and Mushroom beaches, accretion did not typically occur in the same location as erosion was observed in May 2019, possibly signifying affected beach recovery.
• Accretion typically occurred in localised patches, particularly over intertidal rock and the lower beach face. Small pockets of erosion were observed at rocky areas of all beaches except Yacht Club North. When comparing TC Veronica to the June storm, patterns of erosion and accretion were largely variable, showing that the effect of weather events is specific to the conditions at the time.
• Some further (minor) erosion of the frontal edge of the foredune was recorded at the northern end of Terminal Beach, north of the oil export pipeline. This area has recorded the most erosion of any monitoring beach, but >90% of the baseline foredune volume remains (Ref. 19).
Management Trigger Exceedances:
• Management trigger exceedances were recorded for these sites and parameters during the Reporting Period:
– Terminal Beach: beach volume at the crest of the beach face (CBF) at Transects 11 and 22, slope at the CBF at Transect 11, beach volume and slope at the foredune area (FA) at Transects 11 and 22.
– Bivalve Beach: beach volume and slope at the CBF at Transects 11 and 22, and beach volume and slope at the FA Transect 22 (Table 9-3).
Table 9-3: Management Trigger Exceedances at Terminal and Bivalve Beaches During the Reporting Period
Location
Tra
ns
ect
Survey Date
Volume Trigger1,2
Slope Trigger1,2
Change from Baseline Mean
1 2 3 4 1 2 3 4
Terminal (CBF)
11
Oct 2018 X X X X - - - - Increase volume; no change slope
May 2019 X X X X X - - - Increase volume; increase slope
22
Oct 2018 X X X X - - - - Decrease volume; no change slope
May 2019 X X X X - - - - Decrease volume; no change slope
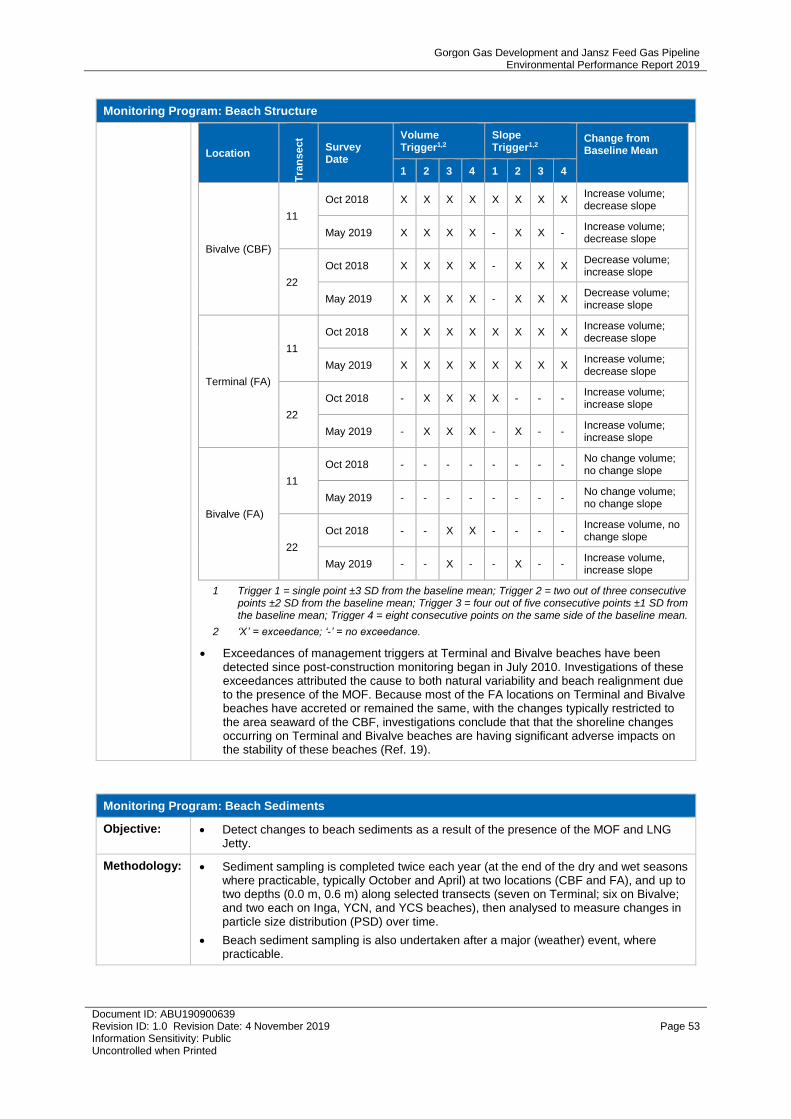
Gorgon Gas Development and Jansz Feed Gas Pipeline Environmental Performance Report 2019
Document ID: ABU190900639 Revision ID: 1.0 Revision Date: 4 November 2019 Page 53 Information Sensitivity: Public Uncontrolled when Printed
Monitoring Program: Beach Structure
Location
Tra
ns
ect
Survey Date
Volume Trigger1,2
Slope Trigger1,2
Change from Baseline Mean
1 2 3 4 1 2 3 4
Bivalve (CBF)
11
Oct 2018 X X X X X X X X Increase volume; decrease slope
May 2019 X X X X - X X - Increase volume; decrease slope
22
Oct 2018 X X X X - X X X Decrease volume; increase slope
May 2019 X X X X - X X X Decrease volume; increase slope
Terminal (FA)
11
Oct 2018 X X X X X X X X Increase volume; decrease slope
May 2019 X X X X X X X X Increase volume; decrease slope
22
Oct 2018 - X X X X - - - Increase volume; increase slope
May 2019 - X X X - X - - Increase volume; increase slope
Bivalve (FA)
11
Oct 2018 - - - - - - - - No change volume; no change slope
May 2019 - - - - - - - - No change volume; no change slope
22
Oct 2018 - - X X - - - - Increase volume, no change slope
May 2019 - - X - - X - - Increase volume, increase slope
1 Trigger 1 = single point ±3 SD from the baseline mean; Trigger 2 = two out of three consecutive points ±2 SD from the baseline mean; Trigger 3 = four out of five consecutive points ±1 SD from the baseline mean; Trigger 4 = eight consecutive points on the same side of the baseline mean.
2 ‘X’ = exceedance; ‘-’ = no exceedance.
• Exceedances of management triggers at Terminal and Bivalve beaches have been detected since post-construction monitoring began in July 2010. Investigations of these exceedances attributed the cause to both natural variability and beach realignment due to the presence of the MOF. Because most of the FA locations on Terminal and Bivalve beaches have accreted or remained the same, with the changes typically restricted to the area seaward of the CBF, investigations conclude that that the shoreline changes occurring on Terminal and Bivalve beaches are having significant adverse impacts on the stability of these beaches (Ref. 19).
Monitoring Program: Beach Sediments
Objective: • Detect changes to beach sediments as a result of the presence of the MOF and LNG Jetty.
Methodology: • Sediment sampling is completed twice each year (at the end of the dry and wet seasons where practicable, typically October and April) at two locations (CBF and FA), and up to two depths (0.0 m, 0.6 m) along selected transects (seven on Terminal; six on Bivalve; and two each on Inga, YCN, and YCS beaches), then analysed to measure changes in particle size distribution (PSD) over time.
• Beach sediment sampling is also undertaken after a major (weather) event, where practicable.
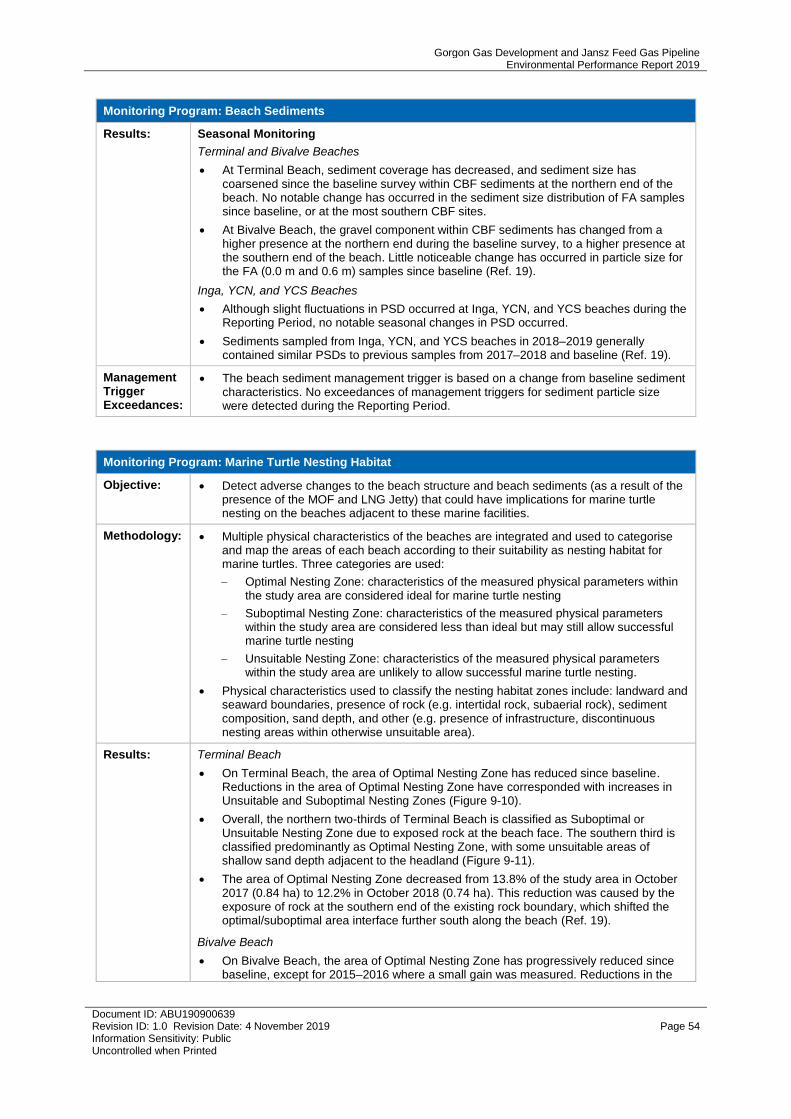
Gorgon Gas Development and Jansz Feed Gas Pipeline Environmental Performance Report 2019
Document ID: ABU190900639 Revision ID: 1.0 Revision Date: 4 November 2019 Page 54 Information Sensitivity: Public Uncontrolled when Printed
Monitoring Program: Beach Sediments
Results: Seasonal Monitoring
Terminal and Bivalve Beaches
• At Terminal Beach, sediment coverage has decreased, and sediment size has coarsened since the baseline survey within CBF sediments at the northern end of the beach. No notable change has occurred in the sediment size distribution of FA samples since baseline, or at the most southern CBF sites.
• At Bivalve Beach, the gravel component within CBF sediments has changed from a higher presence at the northern end during the baseline survey, to a higher presence at the southern end of the beach. Little noticeable change has occurred in particle size for the FA (0.0 m and 0.6 m) samples since baseline (Ref. 19).
Inga, YCN, and YCS Beaches
• Although slight fluctuations in PSD occurred at Inga, YCN, and YCS beaches during the Reporting Period, no notable seasonal changes in PSD occurred.
• Sediments sampled from Inga, YCN, and YCS beaches in 2018–2019 generally contained similar PSDs to previous samples from 2017–2018 and baseline (Ref. 19).
Management Trigger Exceedances:
• The beach sediment management trigger is based on a change from baseline sediment characteristics. No exceedances of management triggers for sediment particle size were detected during the Reporting Period.
Monitoring Program: Marine Turtle Nesting Habitat
Objective: • Detect adverse changes to the beach structure and beach sediments (as a result of the presence of the MOF and LNG Jetty) that could have implications for marine turtle nesting on the beaches adjacent to these marine facilities.
Methodology: • Multiple physical characteristics of the beaches are integrated and used to categorise and map the areas of each beach according to their suitability as nesting habitat for marine turtles. Three categories are used:
– Optimal Nesting Zone: characteristics of the measured physical parameters within the study area are considered ideal for marine turtle nesting
– Suboptimal Nesting Zone: characteristics of the measured physical parameters within the study area are considered less than ideal but may still allow successful marine turtle nesting
– Unsuitable Nesting Zone: characteristics of the measured physical parameters within the study area are unlikely to allow successful marine turtle nesting.
• Physical characteristics used to classify the nesting habitat zones include: landward and seaward boundaries, presence of rock (e.g. intertidal rock, subaerial rock), sediment composition, sand depth, and other (e.g. presence of infrastructure, discontinuous nesting areas within otherwise unsuitable area).
Results: Terminal Beach
• On Terminal Beach, the area of Optimal Nesting Zone has reduced since baseline. Reductions in the area of Optimal Nesting Zone have corresponded with increases in Unsuitable and Suboptimal Nesting Zones (Figure 9-10).
• Overall, the northern two-thirds of Terminal Beach is classified as Suboptimal or Unsuitable Nesting Zone due to exposed rock at the beach face. The southern third is classified predominantly as Optimal Nesting Zone, with some unsuitable areas of shallow sand depth adjacent to the headland (Figure 9-11).
• The area of Optimal Nesting Zone decreased from 13.8% of the study area in October 2017 (0.84 ha) to 12.2% in October 2018 (0.74 ha). This reduction was caused by the exposure of rock at the southern end of the existing rock boundary, which shifted the optimal/suboptimal area interface further south along the beach (Ref. 19).
Bivalve Beach
• On Bivalve Beach, the area of Optimal Nesting Zone has progressively reduced since baseline, except for 2015–2016 where a small gain was measured. Reductions in the
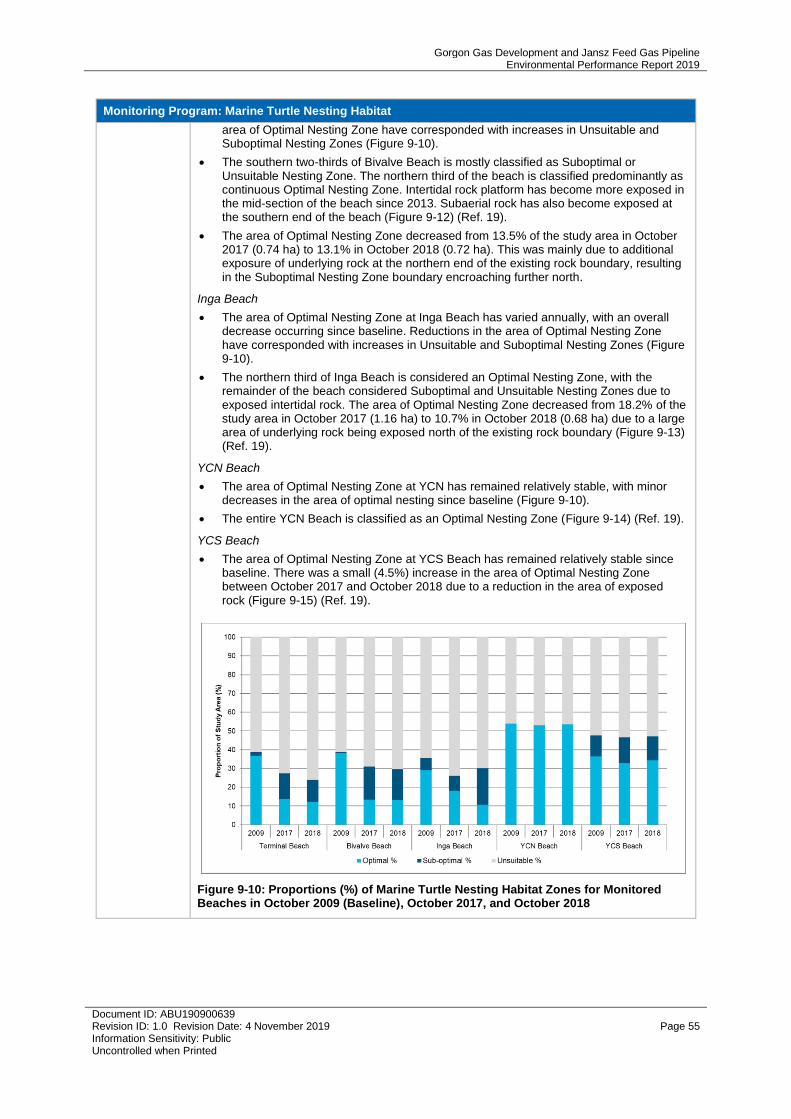
Gorgon Gas Development and Jansz Feed Gas Pipeline Environmental Performance Report 2019
Document ID: ABU190900639 Revision ID: 1.0 Revision Date: 4 November 2019 Page 55 Information Sensitivity: Public Uncontrolled when Printed
Monitoring Program: Marine Turtle Nesting Habitat
area of Optimal Nesting Zone have corresponded with increases in Unsuitable and Suboptimal Nesting Zones (Figure 9-10).
• The southern two-thirds of Bivalve Beach is mostly classified as Suboptimal or Unsuitable Nesting Zone. The northern third of the beach is classified predominantly as continuous Optimal Nesting Zone. Intertidal rock platform has become more exposed in the mid-section of the beach since 2013. Subaerial rock has also become exposed at the southern end of the beach (Figure 9-12) (Ref. 19).
• The area of Optimal Nesting Zone decreased from 13.5% of the study area in October 2017 (0.74 ha) to 13.1% in October 2018 (0.72 ha). This was mainly due to additional exposure of underlying rock at the northern end of the existing rock boundary, resulting in the Suboptimal Nesting Zone boundary encroaching further north.
Inga Beach
• The area of Optimal Nesting Zone at Inga Beach has varied annually, with an overall decrease occurring since baseline. Reductions in the area of Optimal Nesting Zone have corresponded with increases in Unsuitable and Suboptimal Nesting Zones (Figure 9-10).
• The northern third of Inga Beach is considered an Optimal Nesting Zone, with the remainder of the beach considered Suboptimal and Unsuitable Nesting Zones due to exposed intertidal rock. The area of Optimal Nesting Zone decreased from 18.2% of the study area in October 2017 (1.16 ha) to 10.7% in October 2018 (0.68 ha) due to a large area of underlying rock being exposed north of the existing rock boundary (Figure 9-13) (Ref. 19).
YCN Beach
• The area of Optimal Nesting Zone at YCN has remained relatively stable, with minor decreases in the area of optimal nesting since baseline (Figure 9-10).
• The entire YCN Beach is classified as an Optimal Nesting Zone (Figure 9-14) (Ref. 19).
YCS Beach
• The area of Optimal Nesting Zone at YCS Beach has remained relatively stable since baseline. There was a small (4.5%) increase in the area of Optimal Nesting Zone between October 2017 and October 2018 due to a reduction in the area of exposed rock (Figure 9-15) (Ref. 19).
Figure 9-10: Proportions (%) of Marine Turtle Nesting Habitat Zones for Monitored Beaches in October 2009 (Baseline), October 2017, and October 2018
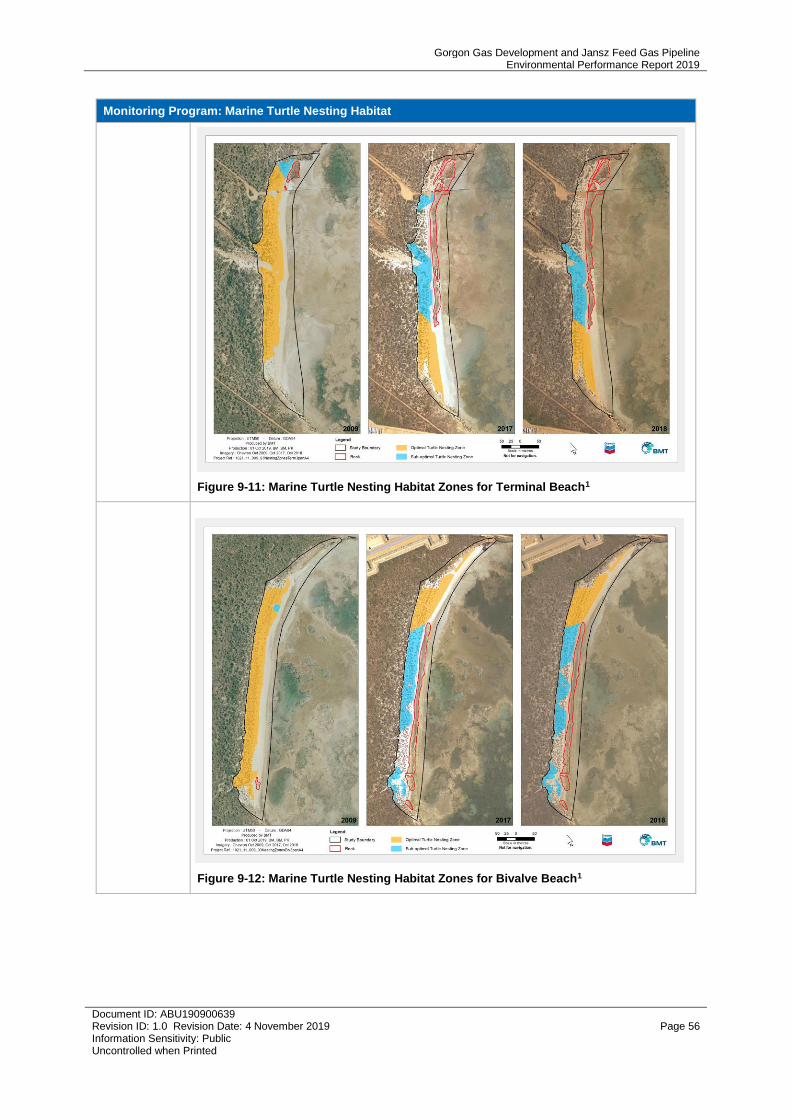
Gorgon Gas Development and Jansz Feed Gas Pipeline Environmental Performance Report 2019
Document ID: ABU190900639 Revision ID: 1.0 Revision Date: 4 November 2019 Page 56 Information Sensitivity: Public Uncontrolled when Printed
Monitoring Program: Marine Turtle Nesting Habitat
Figure 9-11: Marine Turtle Nesting Habitat Zones for Terminal Beach1
Figure 9-12: Marine Turtle Nesting Habitat Zones for Bivalve Beach1
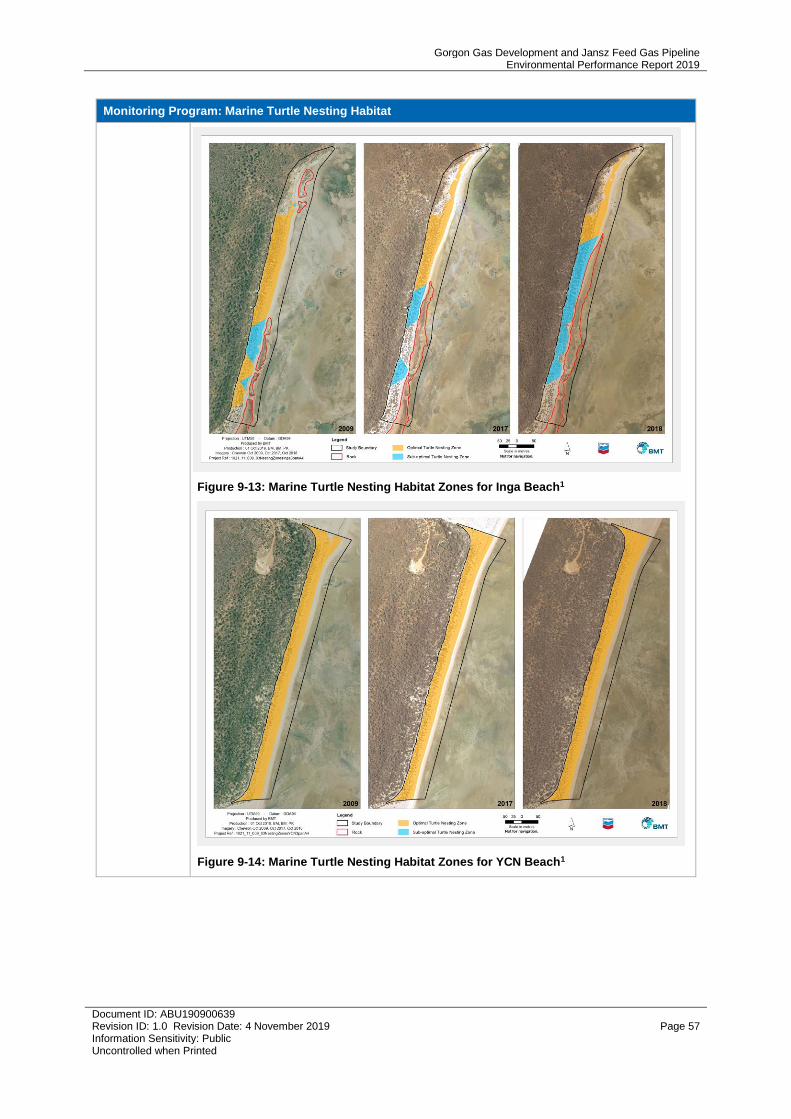
Gorgon Gas Development and Jansz Feed Gas Pipeline Environmental Performance Report 2019
Document ID: ABU190900639 Revision ID: 1.0 Revision Date: 4 November 2019 Page 57 Information Sensitivity: Public Uncontrolled when Printed
Monitoring Program: Marine Turtle Nesting Habitat
Figure 9-13: Marine Turtle Nesting Habitat Zones for Inga Beach1
Figure 9-14: Marine Turtle Nesting Habitat Zones for YCN Beach1
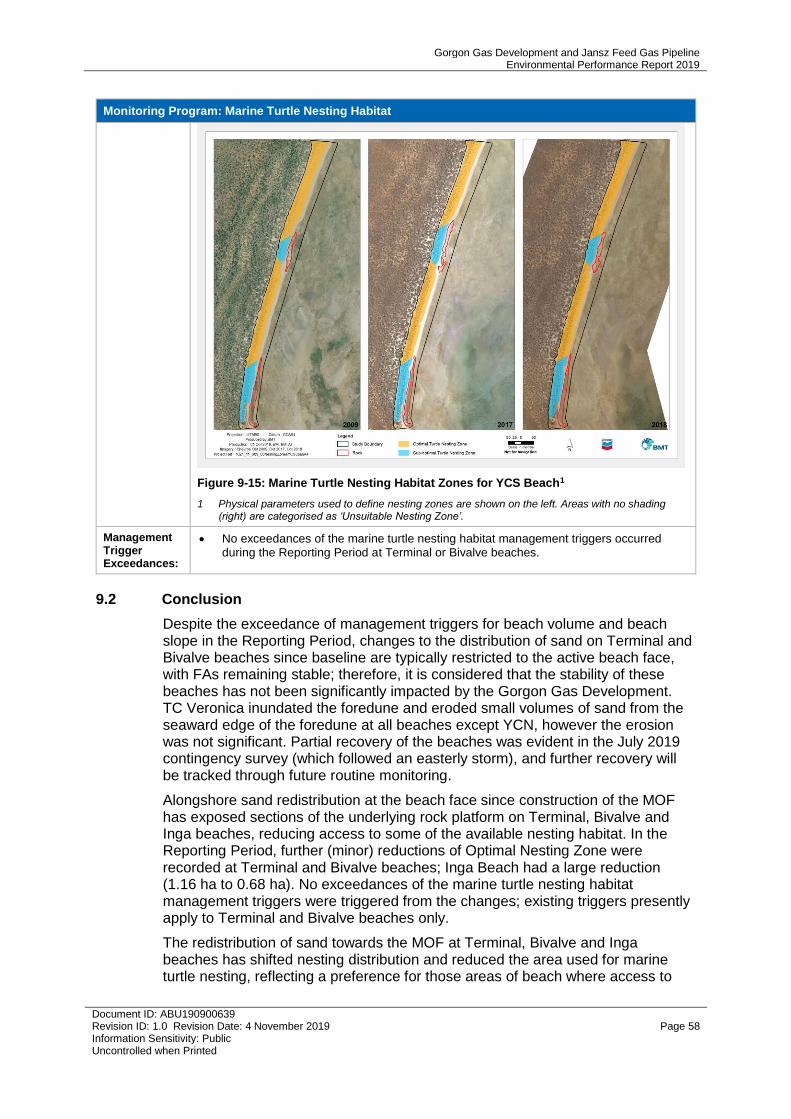
Gorgon Gas Development and Jansz Feed Gas Pipeline Environmental Performance Report 2019
Document ID: ABU190900639 Revision ID: 1.0 Revision Date: 4 November 2019 Page 58 Information Sensitivity: Public Uncontrolled when Printed
Monitoring Program: Marine Turtle Nesting Habitat
Figure 9-15: Marine Turtle Nesting Habitat Zones for YCS Beach1
1 Physical parameters used to define nesting zones are shown on the left. Areas with no shading (right) are categorised as ‘Unsuitable Nesting Zone’.
Management Trigger Exceedances:
• No exceedances of the marine turtle nesting habitat management triggers occurred during the Reporting Period at Terminal or Bivalve beaches.
9.2 Conclusion
Despite the exceedance of management triggers for beach volume and beach slope in the Reporting Period, changes to the distribution of sand on Terminal and Bivalve beaches since baseline are typically restricted to the active beach face, with FAs remaining stable; therefore, it is considered that the stability of these beaches has not been significantly impacted by the Gorgon Gas Development. TC Veronica inundated the foredune and eroded small volumes of sand from the seaward edge of the foredune at all beaches except YCN, however the erosion was not significant. Partial recovery of the beaches was evident in the July 2019 contingency survey (which followed an easterly storm), and further recovery will be tracked through future routine monitoring.
Alongshore sand redistribution at the beach face since construction of the MOF has exposed sections of the underlying rock platform on Terminal, Bivalve and Inga beaches, reducing access to some of the available nesting habitat. In the Reporting Period, further (minor) reductions of Optimal Nesting Zone were recorded at Terminal and Bivalve beaches; Inga Beach had a large reduction (1.16 ha to 0.68 ha). No exceedances of the marine turtle nesting habitat management triggers were triggered from the changes; existing triggers presently apply to Terminal and Bivalve beaches only.
The redistribution of sand towards the MOF at Terminal, Bivalve and Inga beaches has shifted nesting distribution and reduced the area used for marine turtle nesting, reflecting a preference for those areas of beach where access to
Gorgon Gas Development and Jansz Feed Gas Pipeline Environmental Performance Report 2019
Document ID: ABU190900639 Revision ID: 1.0 Revision Date: 4 November 2019 Page 59 Information Sensitivity: Public Uncontrolled when Printed
nesting habitat remains unimpeded. New areas of beach (created through accretion) have formed that were previously inaccessible or unsuitable for nesting.
Turtle monitoring data (see Section 4) shows that, despite shifts in marine turtle nesting activity at Terminal, Bivalve and Inga beaches, the proportion of nesting Flatback Turtles using Terminal Beach remains consistent with historical usage pre- and post-MOF construction. However, Bivalve Beach had reduced usage over the 2016/17–2018/19 seasons compared to previous years. Primary areas used for nesting on each beach still provide a suitable and successful incubation environment; however, there are indications that local effects on clutch disturbance and incubation success are occurring in new areas of beach (created through accretion) adjacent to the MOF (see Section 4).
Overall, the results of the marine turtle monitoring programs indicate that detected changes in beach morphology have not, to date, significantly adversely impacted the productivity of the Flatback Turtle rookery, or other marine turtle populations of Barrow Island.
As required by the CSMMP (Ref. 17), CAPL will continue to routinely monitor trends in beach morphology to detect and evaluate any potential implications for marine turtle nesting. If exceedances of CSMMP management triggers or performance standards are detected, they will be assessed in accordance with the requirements identified in the CSMMP and relevant Ministerial conditions.
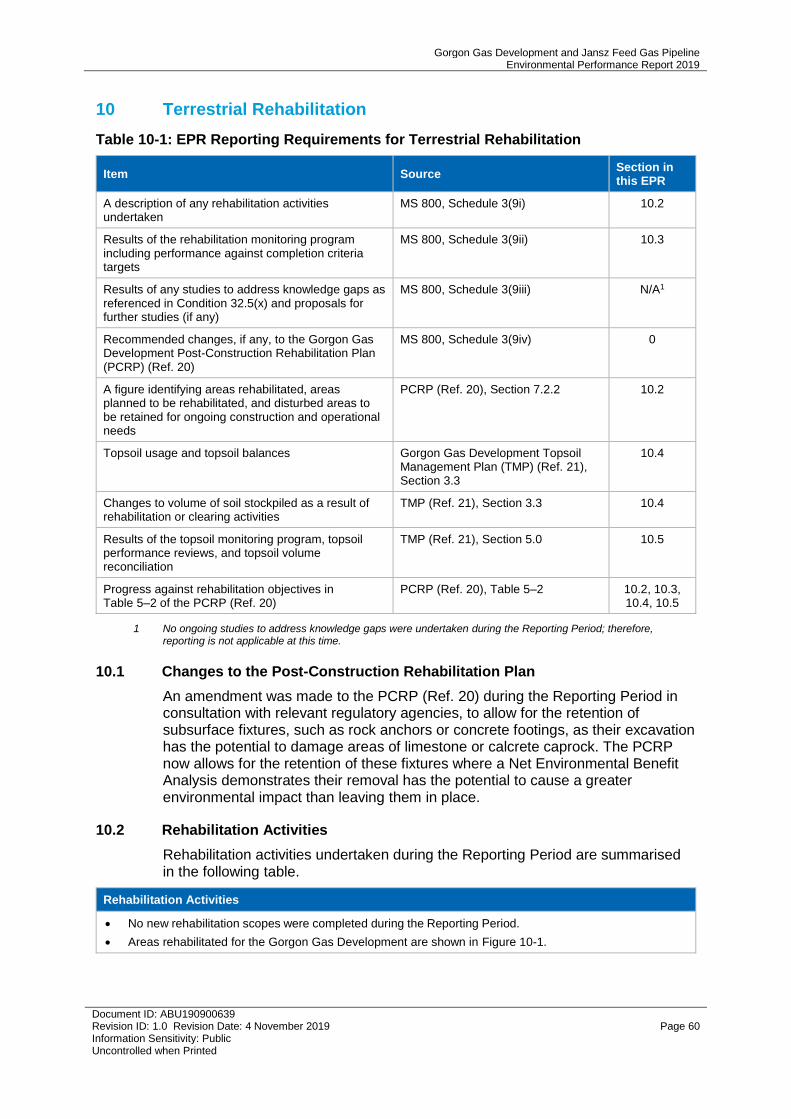
Gorgon Gas Development and Jansz Feed Gas Pipeline Environmental Performance Report 2019
Document ID: ABU190900639 Revision ID: 1.0 Revision Date: 4 November 2019 Page 60 Information Sensitivity: Public Uncontrolled when Printed
10 Terrestrial Rehabilitation
Table 10-1: EPR Reporting Requirements for Terrestrial Rehabilitation
Item Source Section in this EPR
A description of any rehabilitation activities undertaken
MS 800, Schedule 3(9i) 10.2
Results of the rehabilitation monitoring program including performance against completion criteria targets
MS 800, Schedule 3(9ii) 10.3
Results of any studies to address knowledge gaps as referenced in Condition 32.5(x) and proposals for further studies (if any)
MS 800, Schedule 3(9iii) N/A1
Recommended changes, if any, to the Gorgon Gas Development Post-Construction Rehabilitation Plan (PCRP) (Ref. 20)
MS 800, Schedule 3(9iv) 0
A figure identifying areas rehabilitated, areas planned to be rehabilitated, and disturbed areas to be retained for ongoing construction and operational needs
PCRP (Ref. 20), Section 7.2.2 10.2
Topsoil usage and topsoil balances Gorgon Gas Development Topsoil Management Plan (TMP) (Ref. 21), Section 3.3
10.4
Changes to volume of soil stockpiled as a result of rehabilitation or clearing activities
TMP (Ref. 21), Section 3.3 10.4
Results of the topsoil monitoring program, topsoil performance reviews, and topsoil volume reconciliation
TMP (Ref. 21), Section 5.0 10.5
Progress against rehabilitation objectives in Table 5–2 of the PCRP (Ref. 20)
PCRP (Ref. 20), Table 5–2 10.2, 10.3, 10.4, 10.5
1 No ongoing studies to address knowledge gaps were undertaken during the Reporting Period; therefore, reporting is not applicable at this time.
10.1 Changes to the Post-Construction Rehabilitation Plan
An amendment was made to the PCRP (Ref. 20) during the Reporting Period in consultation with relevant regulatory agencies, to allow for the retention of subsurface fixtures, such as rock anchors or concrete footings, as their excavation has the potential to damage areas of limestone or calcrete caprock. The PCRP now allows for the retention of these fixtures where a Net Environmental Benefit Analysis demonstrates their removal has the potential to cause a greater environmental impact than leaving them in place.
10.2 Rehabilitation Activities
Rehabilitation activities undertaken during the Reporting Period are summarised in the following table.
Rehabilitation Activities
• No new rehabilitation scopes were completed during the Reporting Period.
• Areas rehabilitated for the Gorgon Gas Development are shown in Figure 10-1.
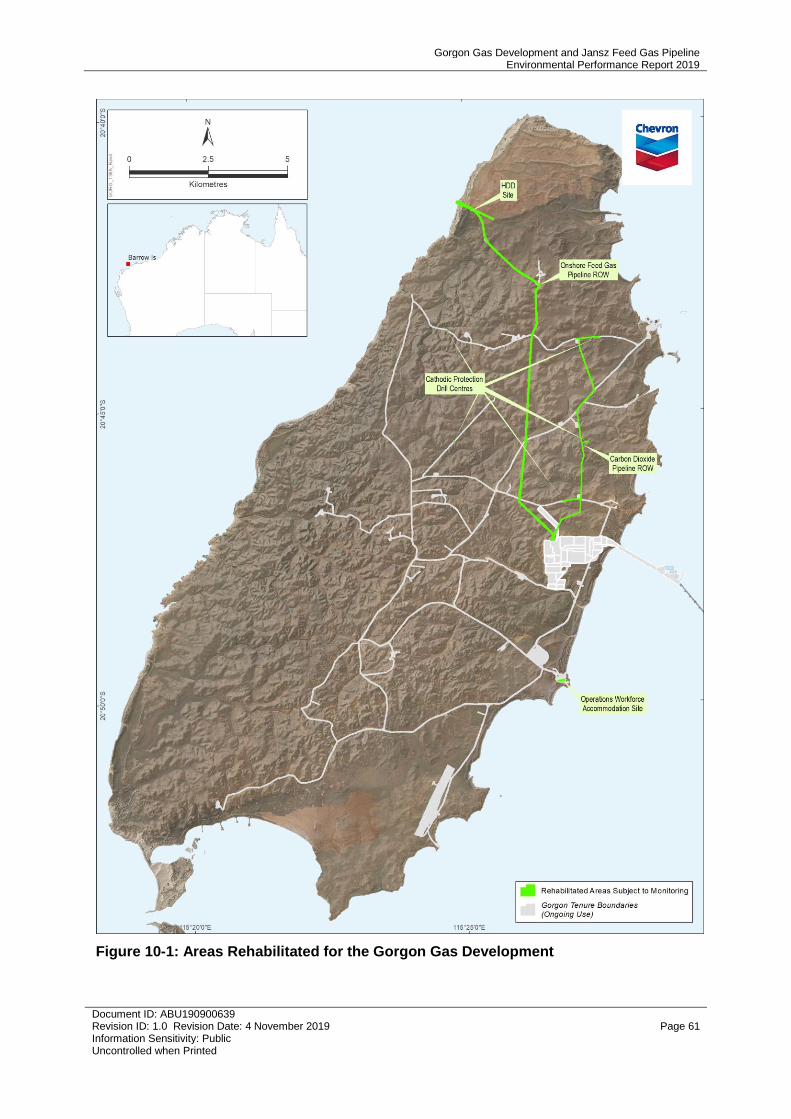
Gorgon Gas Development and Jansz Feed Gas Pipeline Environmental Performance Report 2019
Document ID: ABU190900639 Revision ID: 1.0 Revision Date: 4 November 2019 Page 61 Information Sensitivity: Public Uncontrolled when Printed
Figure 10-1: Areas Rehabilitated for the Gorgon Gas Development
Gorgon Gas Development and Jansz Feed Gas Pipeline Environmental Performance Report 2019
Document ID: ABU190900639 Revision ID: 1.0 Revision Date: 4 November 2019 Page 62 Information Sensitivity: Public Uncontrolled when Printed
10.3 Rehabilitation Monitoring
The PCRP (Ref. 20) details the rehabilitation methodology and completion criteria for rehabilitating temporarily disturbed lands on the Gorgon Gas Development. The rehabilitation monitoring methodology being used is Ecosystem Function Analysis (EFA), a method that has been used on Barrow Island since 2004.
The rehabilitation monitoring methodology and results are summarised in the following table.
Monitoring Program: Rehabilitation
Objectives: • To meet the intent of the ministerial objectives for rehabilitated areas, the PCRP (Table 5-2) (Ref. 20) further defines specific objectives for the rehabilitation of temporarily disturbed areas:
– The rehabilitated land surface and soil properties are appropriate to support the target ecosystem
– Vegetation in rehabilitated areas will have equivalent values as surrounding natural ecosystems
– The rehabilitated ecosystem has equivalent functions and resilience as the target ecosystem
– Rehabilitated areas provide appropriate habitat for fauna and fauna recruitment including EPBC Act (Commonwealth) listed species
– The rehabilitated area should be able to be managed in the same way as surrounding land.
Methodology: • EFA is based on a methodology developed by Commonwealth Scientific and Industrial Research Organisation, originally described as Landscape Function Analysis (LFA), which uses indicators that assess and determine functional status of the landscape. EFA differs from LFA in that ecosystem components such as vegetation composition, cover, and habitat complexity are also recorded and assessed to provide a quantitative measure of the ecological functionality of the site. LFA is a core component of EFA, and primarily focuses on stability, water infiltration, and nutrient indices. For arid environments, permanent EFA transects are set up to follow a line of resource flow, typically up to 50 m long.
• A new methodology, Object-Based Image Analysis (OBIA), was added to the existing monitoring methods in 2018 to estimate vegetation cover at each rehabilitated and analogue site. Aerial images of the sites were processed using PCI Geomatica® software, and estimates of vegetation cover were made using OBIA in eCognition® software. This method was implemented to obtain vegetation cover estimates for the area of an entire site, rather than a single transect. As the OBIA technique is relatively new, the level of accuracy that this software provides is still being demonstrated in the Barrow Island context.
• In total, 22 rehabilitation Impact sites were monitored - 8 and 14 sites in the carbon dioxide and feed gas pipeline corridors, respectively. Eight Reference sites corresponding to limestone, drainage, or plain habitats were also monitored to allow assessment against completion criteria in the PCRP. Broadly, the monitoring gathered data on these attributes:
– landscape function (stability, infiltration, and nutrient cycling)
– vegetation (Triodia cover, species diversity, density, cover and height, floristic composition, and functional structure)
– erosion and visual amenity.
Results: • Although none of the Impact sites monitored met all the completion criteria within the PCRP, none would be expected to at this relatively early stage of vegetation re-establishment. Criteria that were consistently not met for all sites were Triodia cover and total plant cover/height. This is not unexpected given that these criteria require time to reach completion.
• Criteria that were frequently met were erosion, weed presence, and landform consistency with surrounding areas (Ref. 22), indicating that the rehabilitation areas are fundamentally sound. Species diversity in rehabilitated areas was generally higher than in analogue sites, as is characteristic of disturbed landscapes transitioning from primary
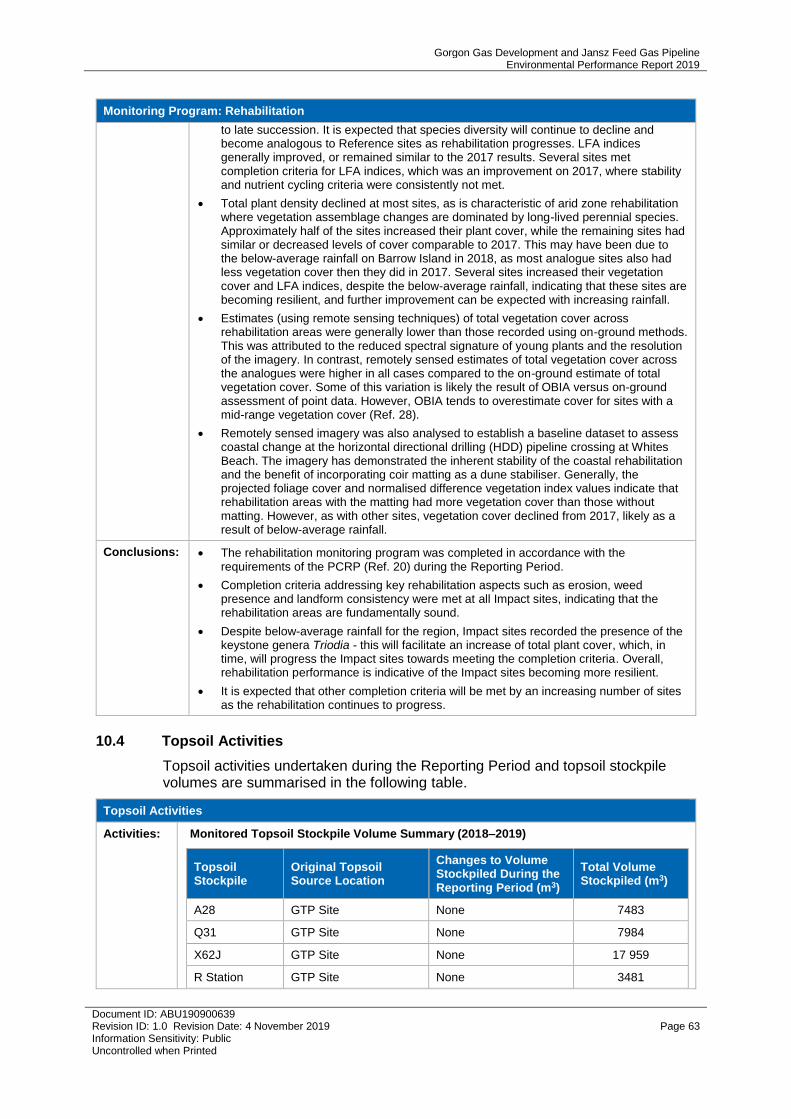
Gorgon Gas Development and Jansz Feed Gas Pipeline Environmental Performance Report 2019
Document ID: ABU190900639 Revision ID: 1.0 Revision Date: 4 November 2019 Page 63 Information Sensitivity: Public Uncontrolled when Printed
Monitoring Program: Rehabilitation
to late succession. It is expected that species diversity will continue to decline and become analogous to Reference sites as rehabilitation progresses. LFA indices generally improved, or remained similar to the 2017 results. Several sites met completion criteria for LFA indices, which was an improvement on 2017, where stability and nutrient cycling criteria were consistently not met.
• Total plant density declined at most sites, as is characteristic of arid zone rehabilitation where vegetation assemblage changes are dominated by long-lived perennial species. Approximately half of the sites increased their plant cover, while the remaining sites had similar or decreased levels of cover comparable to 2017. This may have been due to the below-average rainfall on Barrow Island in 2018, as most analogue sites also had less vegetation cover then they did in 2017. Several sites increased their vegetation cover and LFA indices, despite the below-average rainfall, indicating that these sites are becoming resilient, and further improvement can be expected with increasing rainfall.
• Estimates (using remote sensing techniques) of total vegetation cover across rehabilitation areas were generally lower than those recorded using on-ground methods. This was attributed to the reduced spectral signature of young plants and the resolution of the imagery. In contrast, remotely sensed estimates of total vegetation cover across the analogues were higher in all cases compared to the on-ground estimate of total vegetation cover. Some of this variation is likely the result of OBIA versus on-ground assessment of point data. However, OBIA tends to overestimate cover for sites with a mid-range vegetation cover (Ref. 28).
• Remotely sensed imagery was also analysed to establish a baseline dataset to assess coastal change at the horizontal directional drilling (HDD) pipeline crossing at Whites Beach. The imagery has demonstrated the inherent stability of the coastal rehabilitation and the benefit of incorporating coir matting as a dune stabiliser. Generally, the projected foliage cover and normalised difference vegetation index values indicate that rehabilitation areas with the matting had more vegetation cover than those without matting. However, as with other sites, vegetation cover declined from 2017, likely as a result of below-average rainfall.
Conclusions: • The rehabilitation monitoring program was completed in accordance with the requirements of the PCRP (Ref. 20) during the Reporting Period.
• Completion criteria addressing key rehabilitation aspects such as erosion, weed presence and landform consistency were met at all Impact sites, indicating that the rehabilitation areas are fundamentally sound.
• Despite below-average rainfall for the region, Impact sites recorded the presence of the keystone genera Triodia - this will facilitate an increase of total plant cover, which, in time, will progress the Impact sites towards meeting the completion criteria. Overall, rehabilitation performance is indicative of the Impact sites becoming more resilient.
• It is expected that other completion criteria will be met by an increasing number of sites as the rehabilitation continues to progress.
10.4 Topsoil Activities
Topsoil activities undertaken during the Reporting Period and topsoil stockpile volumes are summarised in the following table.
Topsoil Activities
Activities: Monitored Topsoil Stockpile Volume Summary (2018–2019)
Topsoil Stockpile
Original Topsoil Source Location
Changes to Volume Stockpiled During the Reporting Period (m3)
Total Volume Stockpiled (m3)
A28 GTP Site None 7483
Q31 GTP Site None 7984
X62J GTP Site None 17 959
R Station GTP Site None 3481
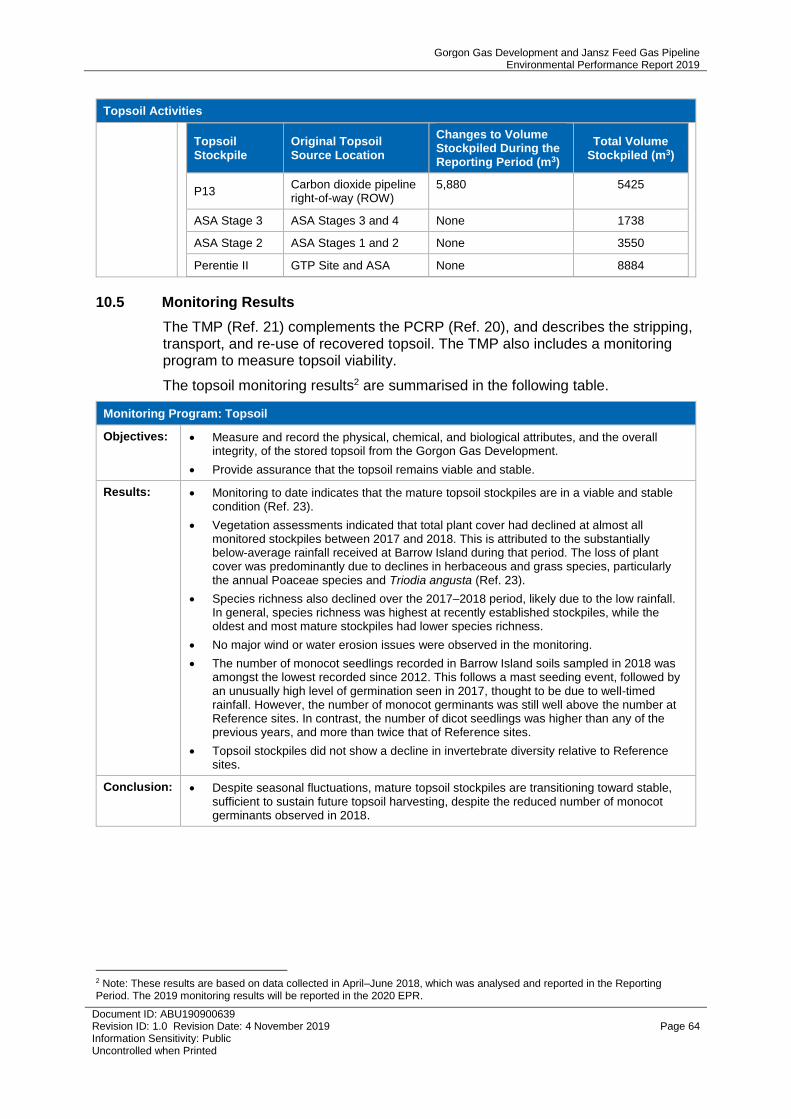
Gorgon Gas Development and Jansz Feed Gas Pipeline Environmental Performance Report 2019
Document ID: ABU190900639 Revision ID: 1.0 Revision Date: 4 November 2019 Page 64 Information Sensitivity: Public Uncontrolled when Printed
Topsoil Activities
Topsoil Stockpile
Original Topsoil Source Location
Changes to Volume Stockpiled During the Reporting Period (m3)
Total Volume Stockpiled (m3)
P13 Carbon dioxide pipeline right-of-way (ROW)
5,880 5425
ASA Stage 3 ASA Stages 3 and 4 None 1738
ASA Stage 2 ASA Stages 1 and 2 None 3550
Perentie II GTP Site and ASA None 8884
10.5 Monitoring Results
The TMP (Ref. 21) complements the PCRP (Ref. 20), and describes the stripping, transport, and re-use of recovered topsoil. The TMP also includes a monitoring program to measure topsoil viability.
The topsoil monitoring results2 are summarised in the following table.
Monitoring Program: Topsoil
Objectives: • Measure and record the physical, chemical, and biological attributes, and the overall integrity, of the stored topsoil from the Gorgon Gas Development.
• Provide assurance that the topsoil remains viable and stable.
Results: • Monitoring to date indicates that the mature topsoil stockpiles are in a viable and stable condition (Ref. 23).
• Vegetation assessments indicated that total plant cover had declined at almost all monitored stockpiles between 2017 and 2018. This is attributed to the substantially below-average rainfall received at Barrow Island during that period. The loss of plant cover was predominantly due to declines in herbaceous and grass species, particularly the annual Poaceae species and Triodia angusta (Ref. 23).
• Species richness also declined over the 2017–2018 period, likely due to the low rainfall. In general, species richness was highest at recently established stockpiles, while the oldest and most mature stockpiles had lower species richness.
• No major wind or water erosion issues were observed in the monitoring.
• The number of monocot seedlings recorded in Barrow Island soils sampled in 2018 was amongst the lowest recorded since 2012. This follows a mast seeding event, followed by an unusually high level of germination seen in 2017, thought to be due to well-timed rainfall. However, the number of monocot germinants was still well above the number at Reference sites. In contrast, the number of dicot seedlings was higher than any of the previous years, and more than twice that of Reference sites.
• Topsoil stockpiles did not show a decline in invertebrate diversity relative to Reference sites.
Conclusion: • Despite seasonal fluctuations, mature topsoil stockpiles are transitioning toward stable, sufficient to sustain future topsoil harvesting, despite the reduced number of monocot germinants observed in 2018.
2 Note: These results are based on data collected in April–June 2018, which was analysed and reported in the Reporting Period. The 2019 monitoring results will be reported in the 2020 EPR.
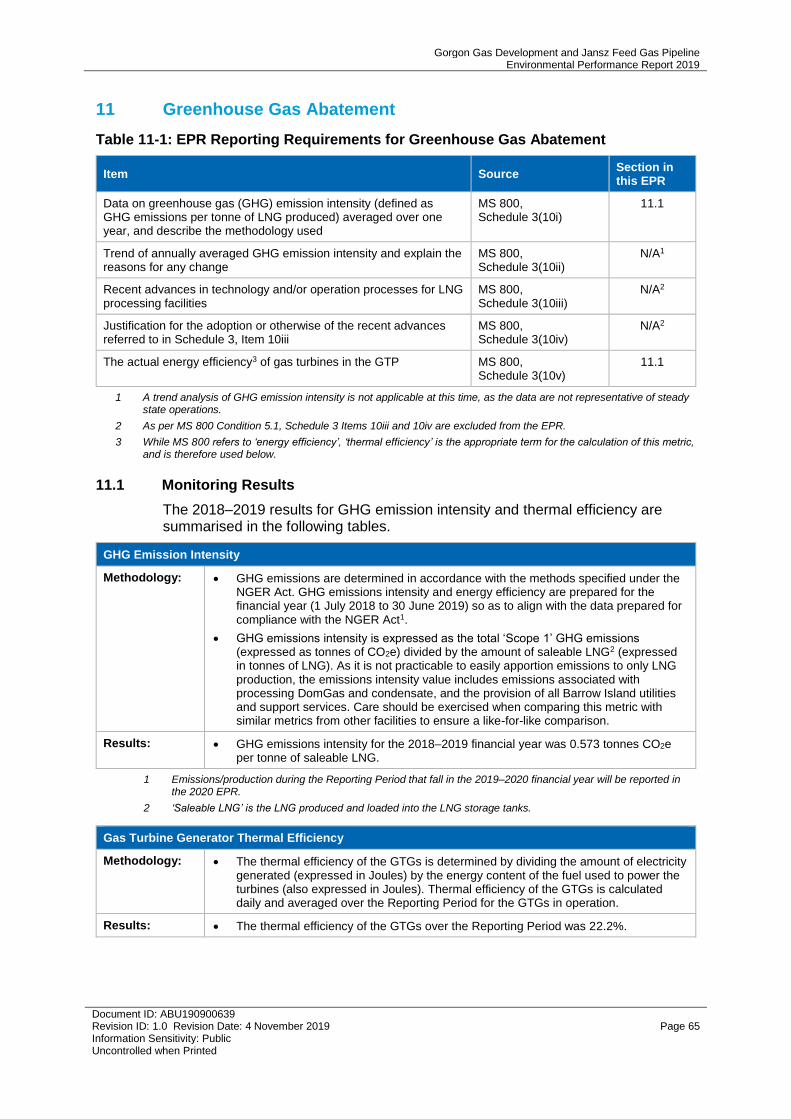
Gorgon Gas Development and Jansz Feed Gas Pipeline Environmental Performance Report 2019
Document ID: ABU190900639 Revision ID: 1.0 Revision Date: 4 November 2019 Page 65 Information Sensitivity: Public Uncontrolled when Printed
11 Greenhouse Gas Abatement
Table 11-1: EPR Reporting Requirements for Greenhouse Gas Abatement
Item Source Section in this EPR
Data on greenhouse gas (GHG) emission intensity (defined as GHG emissions per tonne of LNG produced) averaged over one year, and describe the methodology used
MS 800, Schedule 3(10i)
11.1
Trend of annually averaged GHG emission intensity and explain the reasons for any change
MS 800, Schedule 3(10ii)
N/A1
Recent advances in technology and/or operation processes for LNG processing facilities
MS 800, Schedule 3(10iii)
N/A2
Justification for the adoption or otherwise of the recent advances referred to in Schedule 3, Item 10iii
MS 800, Schedule 3(10iv)
N/A2
The actual energy efficiency3 of gas turbines in the GTP MS 800, Schedule 3(10v)
11.1
1 A trend analysis of GHG emission intensity is not applicable at this time, as the data are not representative of steady state operations.
2 As per MS 800 Condition 5.1, Schedule 3 Items 10iii and 10iv are excluded from the EPR.
3 While MS 800 refers to ‘energy efficiency’, ‘thermal efficiency’ is the appropriate term for the calculation of this metric, and is therefore used below.
11.1 Monitoring Results
The 2018–2019 results for GHG emission intensity and thermal efficiency are summarised in the following tables.
GHG Emission Intensity
Methodology: • GHG emissions are determined in accordance with the methods specified under the NGER Act. GHG emissions intensity and energy efficiency are prepared for the financial year (1 July 2018 to 30 June 2019) so as to align with the data prepared for compliance with the NGER Act1.
• GHG emissions intensity is expressed as the total ‘Scope 1’ GHG emissions (expressed as tonnes of CO2e) divided by the amount of saleable LNG2 (expressed in tonnes of LNG). As it is not practicable to easily apportion emissions to only LNG production, the emissions intensity value includes emissions associated with processing DomGas and condensate, and the provision of all Barrow Island utilities and support services. Care should be exercised when comparing this metric with similar metrics from other facilities to ensure a like-for-like comparison.
Results: • GHG emissions intensity for the 2018–2019 financial year was 0.573 tonnes CO2e per tonne of saleable LNG.
1 Emissions/production during the Reporting Period that fall in the 2019–2020 financial year will be reported in the 2020 EPR.
2 ‘Saleable LNG’ is the LNG produced and loaded into the LNG storage tanks.
Gas Turbine Generator Thermal Efficiency
Methodology: • The thermal efficiency of the GTGs is determined by dividing the amount of electricity generated (expressed in Joules) by the energy content of the fuel used to power the turbines (also expressed in Joules). Thermal efficiency of the GTGs is calculated daily and averaged over the Reporting Period for the GTGs in operation.
Results: • The thermal efficiency of the GTGs over the Reporting Period was 22.2%.
Gorgon Gas Development and Jansz Feed Gas Pipeline Environmental Performance Report 2019
Document ID: ABU190900639 Revision ID: 1.0 Revision Date: 4 November 2019 Page 66 Information Sensitivity: Public Uncontrolled when Printed
12 Spill Management
Table 12-1: EPR Reporting Requirements for Spill Management
Item Source Section in this EPR
Incidence of spills caused by the Proposal, and spills that impact on the Proponent’s facilities including details of cause and recommended actions
MS 769, Schedule 3(3i)
12.1
12.1 Event Data
No spills caused by the Jansz Feed Gas Pipeline, or spills that impacted on Jansz Feed Gas Pipeline facilities, occurred during the Reporting Period.
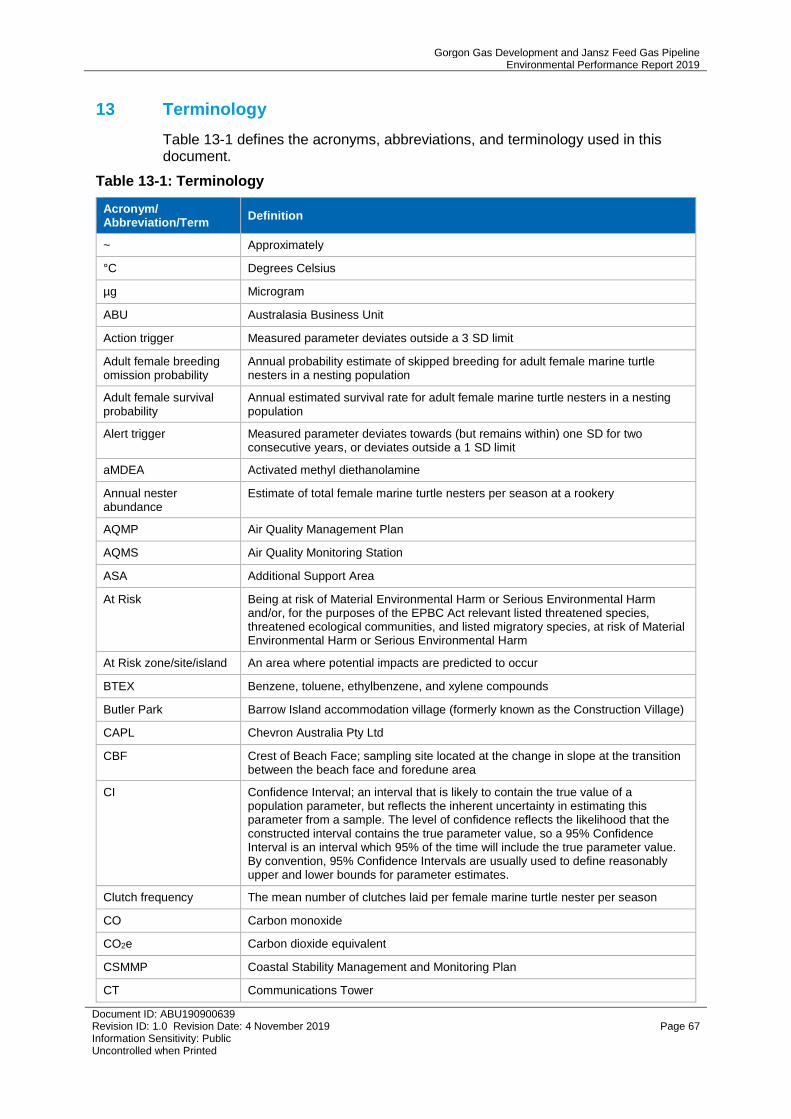
Gorgon Gas Development and Jansz Feed Gas Pipeline Environmental Performance Report 2019
Document ID: ABU190900639 Revision ID: 1.0 Revision Date: 4 November 2019 Page 67 Information Sensitivity: Public Uncontrolled when Printed
13 Terminology
Table 13-1 defines the acronyms, abbreviations, and terminology used in this document.
Table 13-1: Terminology
Acronym/ Abbreviation/Term
Definition
~ Approximately
°C Degrees Celsius
µg Microgram
ABU Australasia Business Unit
Action trigger Measured parameter deviates outside a 3 SD limit
Adult female breeding omission probability
Annual probability estimate of skipped breeding for adult female marine turtle nesters in a nesting population
Adult female survival probability
Annual estimated survival rate for adult female marine turtle nesters in a nesting population
Alert trigger Measured parameter deviates towards (but remains within) one SD for two consecutive years, or deviates outside a 1 SD limit
aMDEA Activated methyl diethanolamine
Annual nester abundance
Estimate of total female marine turtle nesters per season at a rookery
AQMP Air Quality Management Plan
AQMS Air Quality Monitoring Station
ASA Additional Support Area
At Risk Being at risk of Material Environmental Harm or Serious Environmental Harm and/or, for the purposes of the EPBC Act relevant listed threatened species, threatened ecological communities, and listed migratory species, at risk of Material Environmental Harm or Serious Environmental Harm
At Risk zone/site/island An area where potential impacts are predicted to occur
BTEX Benzene, toluene, ethylbenzene, and xylene compounds
Butler Park Barrow Island accommodation village (formerly known as the Construction Village)
CAPL Chevron Australia Pty Ltd
CBF Crest of Beach Face; sampling site located at the change in slope at the transition between the beach face and foredune area
CI Confidence Interval; an interval that is likely to contain the true value of a population parameter, but reflects the inherent uncertainty in estimating this parameter from a sample. The level of confidence reflects the likelihood that the constructed interval contains the true parameter value, so a 95% Confidence Interval is an interval which 95% of the time will include the true parameter value. By convention, 95% Confidence Intervals are usually used to define reasonably upper and lower bounds for parameter estimates.
Clutch frequency The mean number of clutches laid per female marine turtle nester per season
CO Carbon monoxide
CO2e Carbon dioxide equivalent
CSMMP Coastal Stability Management and Monitoring Plan
CT Communications Tower
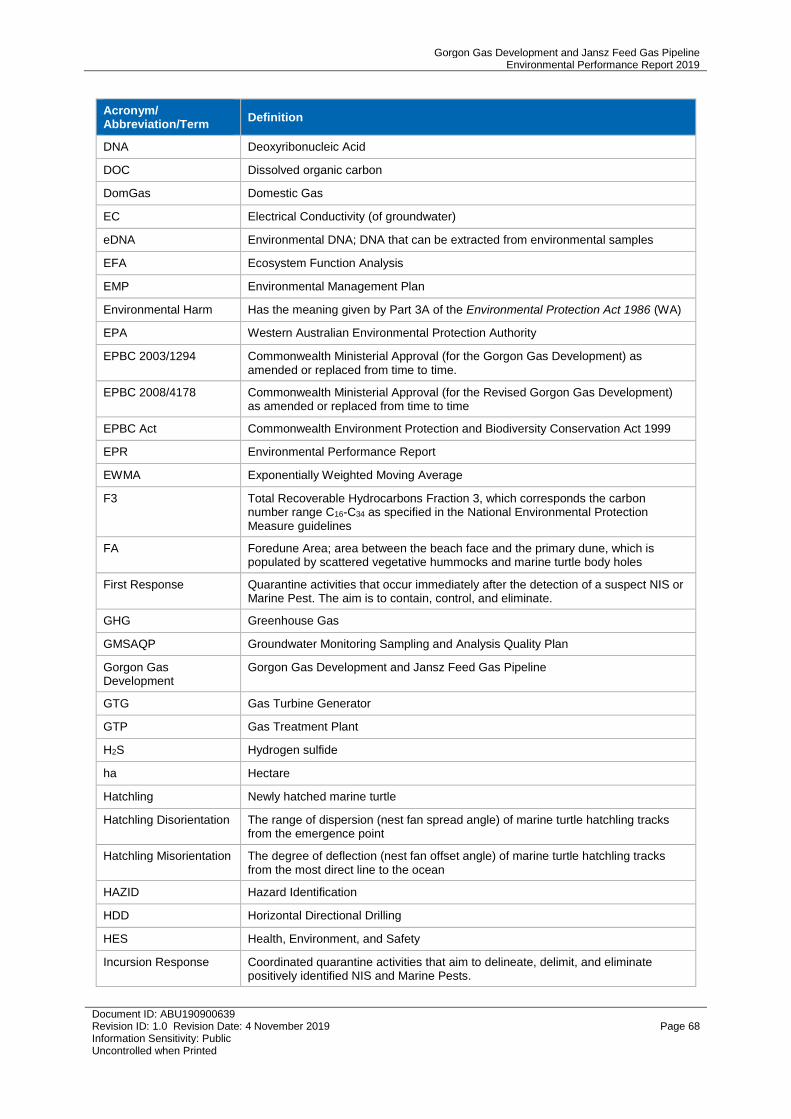
Gorgon Gas Development and Jansz Feed Gas Pipeline Environmental Performance Report 2019
Document ID: ABU190900639 Revision ID: 1.0 Revision Date: 4 November 2019 Page 68 Information Sensitivity: Public Uncontrolled when Printed
Acronym/ Abbreviation/Term
Definition
DNA Deoxyribonucleic Acid
DOC Dissolved organic carbon
DomGas Domestic Gas
EC Electrical Conductivity (of groundwater)
eDNA Environmental DNA; DNA that can be extracted from environmental samples
EFA Ecosystem Function Analysis
EMP Environmental Management Plan
Environmental Harm Has the meaning given by Part 3A of the Environmental Protection Act 1986 (WA)
EPA Western Australian Environmental Protection Authority
EPBC 2003/1294 Commonwealth Ministerial Approval (for the Gorgon Gas Development) as amended or replaced from time to time.
EPBC 2008/4178 Commonwealth Ministerial Approval (for the Revised Gorgon Gas Development) as amended or replaced from time to time
EPBC Act Commonwealth Environment Protection and Biodiversity Conservation Act 1999
EPR Environmental Performance Report
EWMA Exponentially Weighted Moving Average
F3 Total Recoverable Hydrocarbons Fraction 3, which corresponds the carbon number range C16-C34 as specified in the National Environmental Protection Measure guidelines
FA Foredune Area; area between the beach face and the primary dune, which is populated by scattered vegetative hummocks and marine turtle body holes
First Response Quarantine activities that occur immediately after the detection of a suspect NIS or Marine Pest. The aim is to contain, control, and eliminate.
GHG Greenhouse Gas
GMSAQP Groundwater Monitoring Sampling and Analysis Quality Plan
Gorgon Gas Development
Gorgon Gas Development and Jansz Feed Gas Pipeline
GTG Gas Turbine Generator
GTP Gas Treatment Plant
H2S Hydrogen sulfide
ha Hectare
Hatchling Newly hatched marine turtle
Hatchling Disorientation The range of dispersion (nest fan spread angle) of marine turtle hatchling tracks from the emergence point
Hatchling Misorientation The degree of deflection (nest fan offset angle) of marine turtle hatchling tracks from the most direct line to the ocean
HAZID Hazard Identification
HDD Horizontal Directional Drilling
HES Health, Environment, and Safety
Incursion Response Coordinated quarantine activities that aim to delineate, delimit, and eliminate positively identified NIS and Marine Pests.
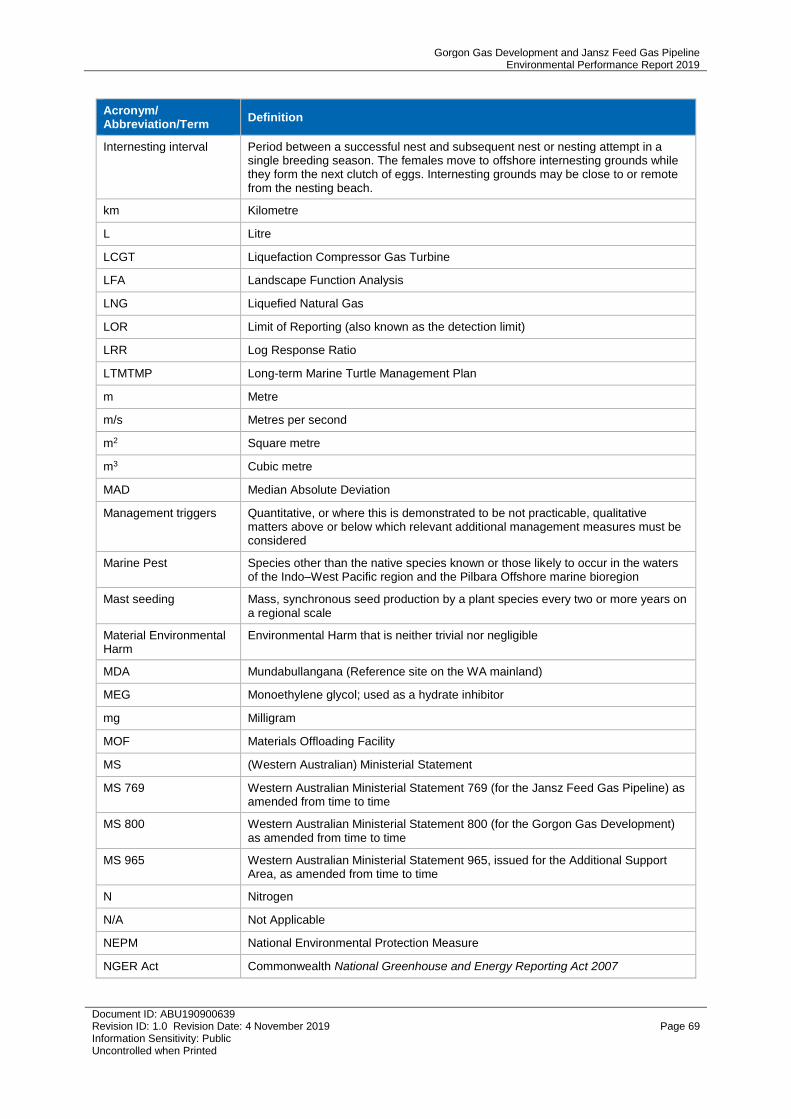
Gorgon Gas Development and Jansz Feed Gas Pipeline Environmental Performance Report 2019
Document ID: ABU190900639 Revision ID: 1.0 Revision Date: 4 November 2019 Page 69 Information Sensitivity: Public Uncontrolled when Printed
Acronym/ Abbreviation/Term
Definition
Internesting interval Period between a successful nest and subsequent nest or nesting attempt in a single breeding season. The females move to offshore internesting grounds while they form the next clutch of eggs. Internesting grounds may be close to or remote from the nesting beach.
km Kilometre
L Litre
LCGT Liquefaction Compressor Gas Turbine
LFA Landscape Function Analysis
LNG Liquefied Natural Gas
LOR Limit of Reporting (also known as the detection limit)
LRR Log Response Ratio
LTMTMP Long-term Marine Turtle Management Plan
m Metre
m/s Metres per second
m2 Square metre
m3 Cubic metre
MAD Median Absolute Deviation
Management triggers Quantitative, or where this is demonstrated to be not practicable, qualitative matters above or below which relevant additional management measures must be considered
Marine Pest Species other than the native species known or those likely to occur in the waters of the Indo–West Pacific region and the Pilbara Offshore marine bioregion
Mast seeding Mass, synchronous seed production by a plant species every two or more years on a regional scale
Material Environmental Harm
Environmental Harm that is neither trivial nor negligible
MDA Mundabullangana (Reference site on the WA mainland)
MEG Monoethylene glycol; used as a hydrate inhibitor
mg Milligram
MOF Materials Offloading Facility
MS (Western Australian) Ministerial Statement
MS 769 Western Australian Ministerial Statement 769 (for the Jansz Feed Gas Pipeline) as amended from time to time
MS 800 Western Australian Ministerial Statement 800 (for the Gorgon Gas Development) as amended from time to time
MS 965 Western Australian Ministerial Statement 965, issued for the Additional Support Area, as amended from time to time
N Nitrogen
N/A Not Applicable
NEPM National Environmental Protection Measure
NGER Act Commonwealth National Greenhouse and Energy Reporting Act 2007
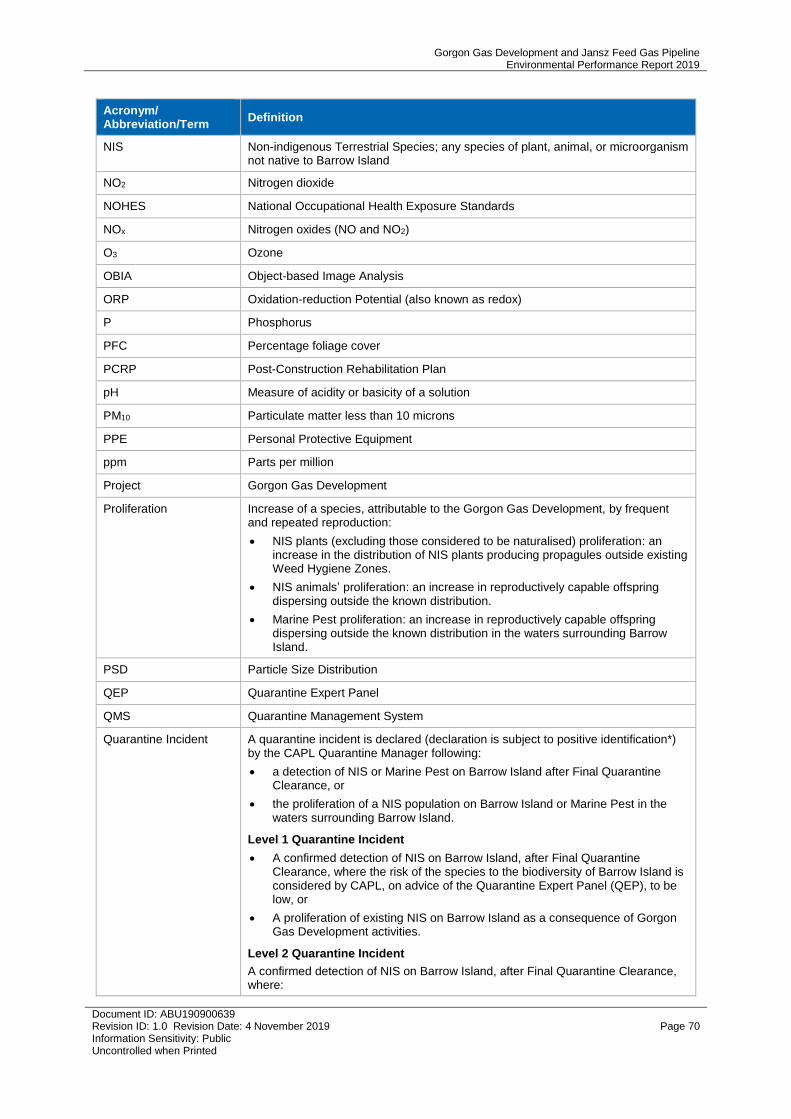
Gorgon Gas Development and Jansz Feed Gas Pipeline Environmental Performance Report 2019
Document ID: ABU190900639 Revision ID: 1.0 Revision Date: 4 November 2019 Page 70 Information Sensitivity: Public Uncontrolled when Printed
Acronym/ Abbreviation/Term
Definition
NIS Non-indigenous Terrestrial Species; any species of plant, animal, or microorganism not native to Barrow Island
NO2 Nitrogen dioxide
NOHES National Occupational Health Exposure Standards
NOx Nitrogen oxides (NO and NO2)
O3 Ozone
OBIA Object-based Image Analysis
ORP Oxidation-reduction Potential (also known as redox)
P Phosphorus
PFC Percentage foliage cover
PCRP Post-Construction Rehabilitation Plan
pH Measure of acidity or basicity of a solution
PM10 Particulate matter less than 10 microns
PPE Personal Protective Equipment
ppm Parts per million
Project Gorgon Gas Development
Proliferation Increase of a species, attributable to the Gorgon Gas Development, by frequent and repeated reproduction:
• NIS plants (excluding those considered to be naturalised) proliferation: an increase in the distribution of NIS plants producing propagules outside existing Weed Hygiene Zones.
• NIS animals’ proliferation: an increase in reproductively capable offspring dispersing outside the known distribution.
• Marine Pest proliferation: an increase in reproductively capable offspring dispersing outside the known distribution in the waters surrounding Barrow Island.
PSD Particle Size Distribution
QEP Quarantine Expert Panel
QMS Quarantine Management System
Quarantine Incident A quarantine incident is declared (declaration is subject to positive identification*) by the CAPL Quarantine Manager following:
• a detection of NIS or Marine Pest on Barrow Island after Final Quarantine Clearance, or
• the proliferation of a NIS population on Barrow Island or Marine Pest in the waters surrounding Barrow Island.
Level 1 Quarantine Incident
• A confirmed detection of NIS on Barrow Island, after Final Quarantine Clearance, where the risk of the species to the biodiversity of Barrow Island is considered by CAPL, on advice of the Quarantine Expert Panel (QEP), to be low, or
• A proliferation of existing NIS on Barrow Island as a consequence of Gorgon Gas Development activities.
Level 2 Quarantine Incident
A confirmed detection of NIS on Barrow Island, after Final Quarantine Clearance, where:
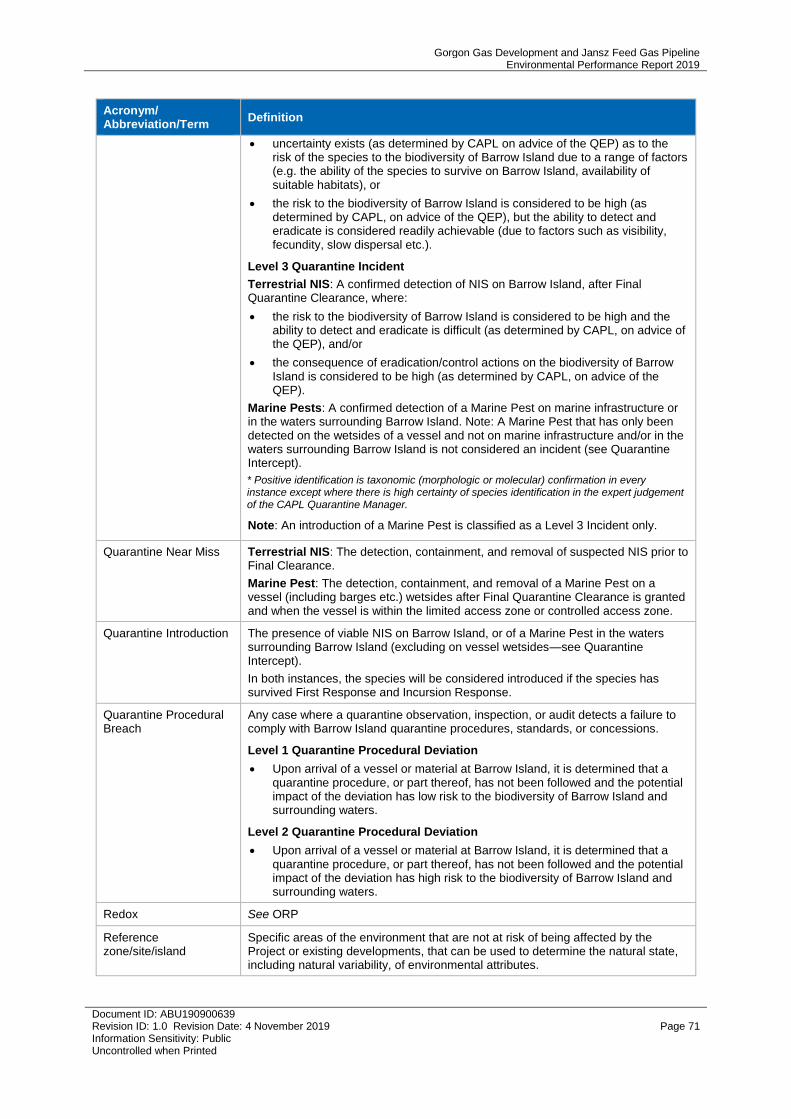
Gorgon Gas Development and Jansz Feed Gas Pipeline Environmental Performance Report 2019
Document ID: ABU190900639 Revision ID: 1.0 Revision Date: 4 November 2019 Page 71 Information Sensitivity: Public Uncontrolled when Printed
Acronym/ Abbreviation/Term
Definition
• uncertainty exists (as determined by CAPL on advice of the QEP) as to the risk of the species to the biodiversity of Barrow Island due to a range of factors (e.g. the ability of the species to survive on Barrow Island, availability of suitable habitats), or
• the risk to the biodiversity of Barrow Island is considered to be high (as determined by CAPL, on advice of the QEP), but the ability to detect and eradicate is considered readily achievable (due to factors such as visibility, fecundity, slow dispersal etc.).
Level 3 Quarantine Incident
Terrestrial NIS: A confirmed detection of NIS on Barrow Island, after Final Quarantine Clearance, where:
• the risk to the biodiversity of Barrow Island is considered to be high and the ability to detect and eradicate is difficult (as determined by CAPL, on advice of the QEP), and/or
• the consequence of eradication/control actions on the biodiversity of Barrow Island is considered to be high (as determined by CAPL, on advice of the QEP).
Marine Pests: A confirmed detection of a Marine Pest on marine infrastructure or in the waters surrounding Barrow Island. Note: A Marine Pest that has only been detected on the wetsides of a vessel and not on marine infrastructure and/or in the waters surrounding Barrow Island is not considered an incident (see Quarantine Intercept).
* Positive identification is taxonomic (morphologic or molecular) confirmation in every instance except where there is high certainty of species identification in the expert judgement of the CAPL Quarantine Manager.
Note: An introduction of a Marine Pest is classified as a Level 3 Incident only.
Quarantine Near Miss Terrestrial NIS: The detection, containment, and removal of suspected NIS prior to Final Clearance.
Marine Pest: The detection, containment, and removal of a Marine Pest on a vessel (including barges etc.) wetsides after Final Quarantine Clearance is granted and when the vessel is within the limited access zone or controlled access zone.
Quarantine Introduction The presence of viable NIS on Barrow Island, or of a Marine Pest in the waters surrounding Barrow Island (excluding on vessel wetsides—see Quarantine Intercept).
In both instances, the species will be considered introduced if the species has survived First Response and Incursion Response.
Quarantine Procedural Breach
Any case where a quarantine observation, inspection, or audit detects a failure to comply with Barrow Island quarantine procedures, standards, or concessions.
Level 1 Quarantine Procedural Deviation
• Upon arrival of a vessel or material at Barrow Island, it is determined that a quarantine procedure, or part thereof, has not been followed and the potential impact of the deviation has low risk to the biodiversity of Barrow Island and surrounding waters.
Level 2 Quarantine Procedural Deviation
• Upon arrival of a vessel or material at Barrow Island, it is determined that a quarantine procedure, or part thereof, has not been followed and the potential impact of the deviation has high risk to the biodiversity of Barrow Island and surrounding waters.
Redox See ORP
Reference zone/site/island
Specific areas of the environment that are not at risk of being affected by the Project or existing developments, that can be used to determine the natural state, including natural variability, of environmental attributes.
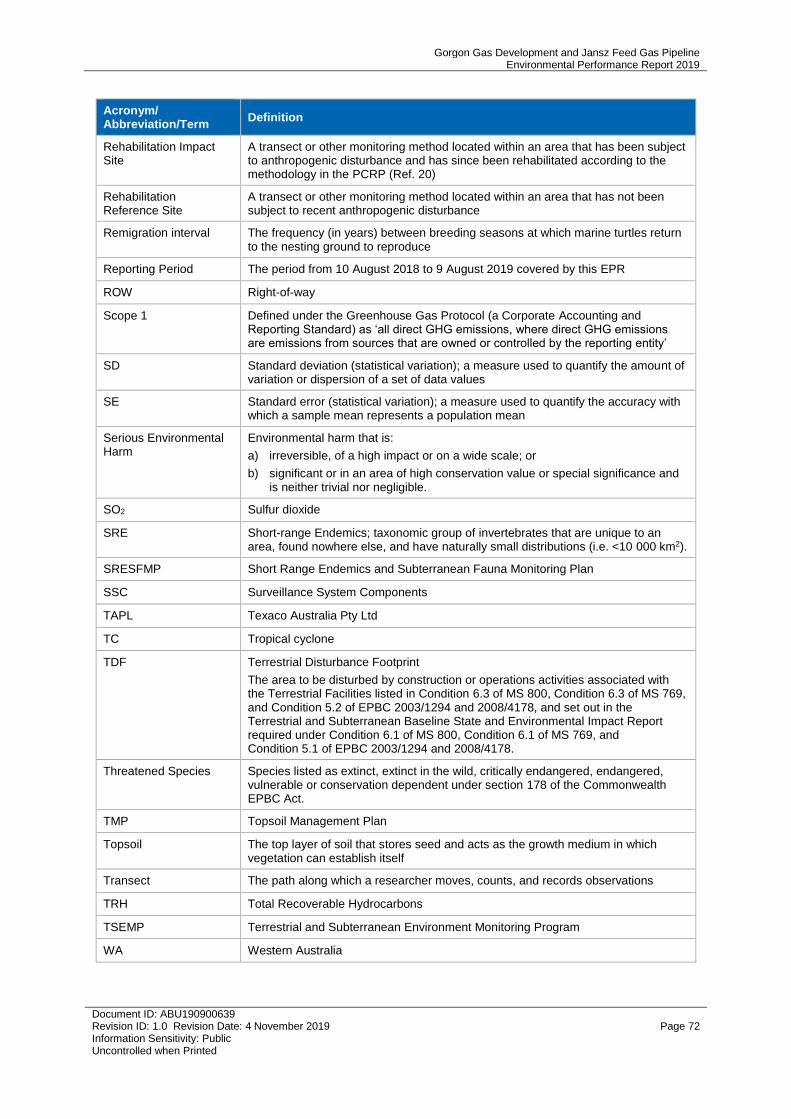
Gorgon Gas Development and Jansz Feed Gas Pipeline Environmental Performance Report 2019
Document ID: ABU190900639 Revision ID: 1.0 Revision Date: 4 November 2019 Page 72 Information Sensitivity: Public Uncontrolled when Printed
Acronym/ Abbreviation/Term
Definition
Rehabilitation Impact Site
A transect or other monitoring method located within an area that has been subject to anthropogenic disturbance and has since been rehabilitated according to the methodology in the PCRP (Ref. 20)
Rehabilitation Reference Site
A transect or other monitoring method located within an area that has not been subject to recent anthropogenic disturbance
Remigration interval The frequency (in years) between breeding seasons at which marine turtles return to the nesting ground to reproduce
Reporting Period The period from 10 August 2018 to 9 August 2019 covered by this EPR
ROW Right-of-way
Scope 1 Defined under the Greenhouse Gas Protocol (a Corporate Accounting and Reporting Standard) as ‘all direct GHG emissions, where direct GHG emissions are emissions from sources that are owned or controlled by the reporting entity’
SD Standard deviation (statistical variation); a measure used to quantify the amount of variation or dispersion of a set of data values
SE Standard error (statistical variation); a measure used to quantify the accuracy with which a sample mean represents a population mean
Serious Environmental Harm
Environmental harm that is:
a) irreversible, of a high impact or on a wide scale; or
b) significant or in an area of high conservation value or special significance and is neither trivial nor negligible.
SO2 Sulfur dioxide
SRE Short-range Endemics; taxonomic group of invertebrates that are unique to an area, found nowhere else, and have naturally small distributions (i.e. <10 000 km2).
SRESFMP Short Range Endemics and Subterranean Fauna Monitoring Plan
SSC Surveillance System Components
TAPL Texaco Australia Pty Ltd
TC Tropical cyclone
TDF Terrestrial Disturbance Footprint
The area to be disturbed by construction or operations activities associated with the Terrestrial Facilities listed in Condition 6.3 of MS 800, Condition 6.3 of MS 769, and Condition 5.2 of EPBC 2003/1294 and 2008/4178, and set out in the Terrestrial and Subterranean Baseline State and Environmental Impact Report required under Condition 6.1 of MS 800, Condition 6.1 of MS 769, and Condition 5.1 of EPBC 2003/1294 and 2008/4178.
Threatened Species Species listed as extinct, extinct in the wild, critically endangered, endangered, vulnerable or conservation dependent under section 178 of the Commonwealth EPBC Act.
TMP Topsoil Management Plan
Topsoil The top layer of soil that stores seed and acts as the growth medium in which vegetation can establish itself
Transect The path along which a researcher moves, counts, and records observations
TRH Total Recoverable Hydrocarbons
TSEMP Terrestrial and Subterranean Environment Monitoring Program
WA Western Australia
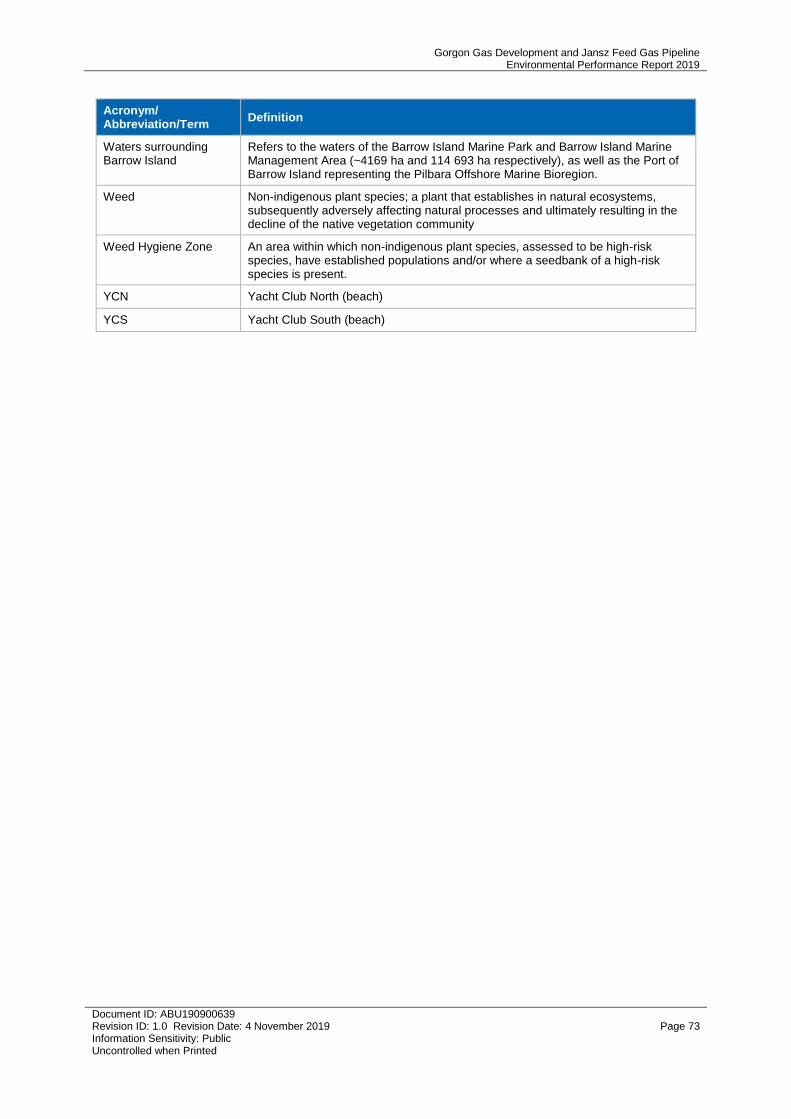
Gorgon Gas Development and Jansz Feed Gas Pipeline Environmental Performance Report 2019
Document ID: ABU190900639 Revision ID: 1.0 Revision Date: 4 November 2019 Page 73 Information Sensitivity: Public Uncontrolled when Printed
Acronym/ Abbreviation/Term
Definition
Waters surrounding Barrow Island
Refers to the waters of the Barrow Island Marine Park and Barrow Island Marine Management Area (~4169 ha and 114 693 ha respectively), as well as the Port of Barrow Island representing the Pilbara Offshore Marine Bioregion.
Weed Non-indigenous plant species; a plant that establishes in natural ecosystems, subsequently adversely affecting natural processes and ultimately resulting in the decline of the native vegetation community
Weed Hygiene Zone An area within which non-indigenous plant species, assessed to be high-risk species, have established populations and/or where a seedbank of a high-risk species is present.
YCN Yacht Club North (beach)
YCS Yacht Club South (beach)
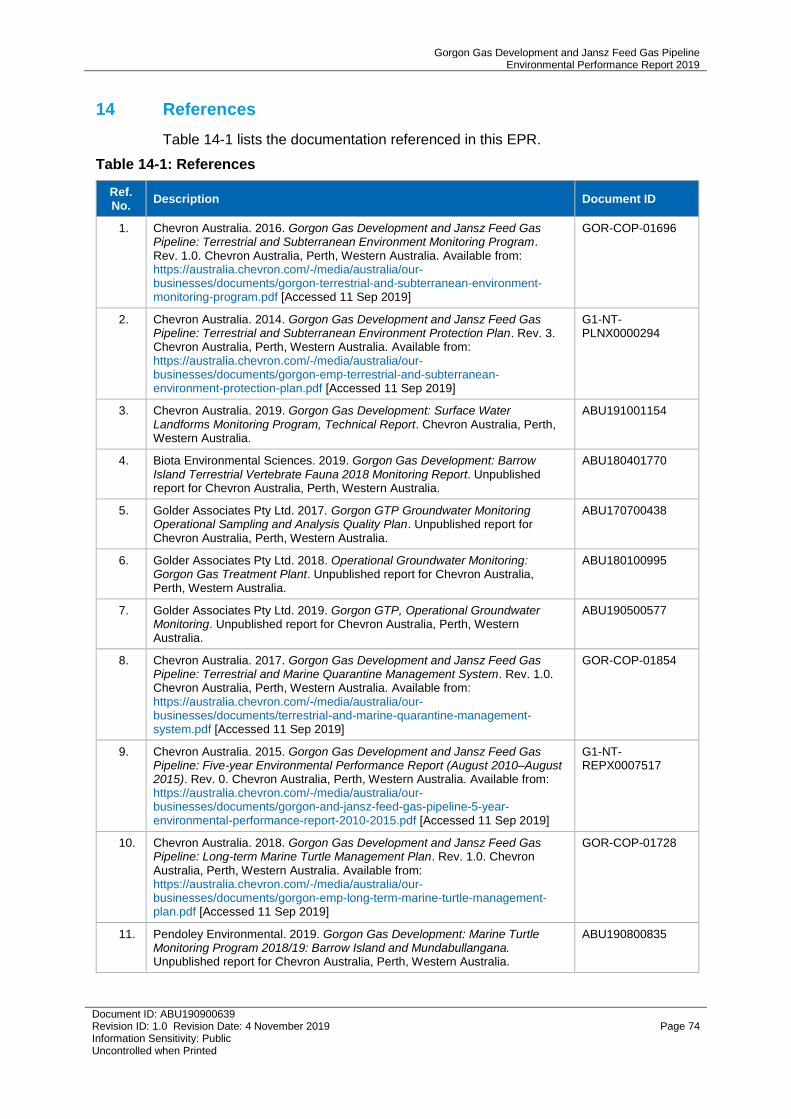
Gorgon Gas Development and Jansz Feed Gas Pipeline Environmental Performance Report 2019
Document ID: ABU190900639 Revision ID: 1.0 Revision Date: 4 November 2019 Page 74 Information Sensitivity: Public Uncontrolled when Printed
14 References
Table 14-1 lists the documentation referenced in this EPR.
Table 14-1: References
Ref. No.
Description Document ID
1. Chevron Australia. 2016. Gorgon Gas Development and Jansz Feed Gas Pipeline: Terrestrial and Subterranean Environment Monitoring Program. Rev. 1.0. Chevron Australia, Perth, Western Australia. Available from: https://australia.chevron.com/-/media/australia/our-businesses/documents/gorgon-terrestrial-and-subterranean-environment-monitoring-program.pdf [Accessed 11 Sep 2019]
GOR-COP-01696
2. Chevron Australia. 2014. Gorgon Gas Development and Jansz Feed Gas Pipeline: Terrestrial and Subterranean Environment Protection Plan. Rev. 3. Chevron Australia, Perth, Western Australia. Available from: https://australia.chevron.com/-/media/australia/our-businesses/documents/gorgon-emp-terrestrial-and-subterranean-environment-protection-plan.pdf [Accessed 11 Sep 2019]
G1-NT-PLNX0000294
3. Chevron Australia. 2019. Gorgon Gas Development: Surface Water Landforms Monitoring Program, Technical Report. Chevron Australia, Perth, Western Australia.
ABU191001154
4. Biota Environmental Sciences. 2019. Gorgon Gas Development: Barrow Island Terrestrial Vertebrate Fauna 2018 Monitoring Report. Unpublished report for Chevron Australia, Perth, Western Australia.
ABU180401770
5. Golder Associates Pty Ltd. 2017. Gorgon GTP Groundwater Monitoring Operational Sampling and Analysis Quality Plan. Unpublished report for Chevron Australia, Perth, Western Australia.
ABU170700438
6. Golder Associates Pty Ltd. 2018. Operational Groundwater Monitoring: Gorgon Gas Treatment Plant. Unpublished report for Chevron Australia, Perth, Western Australia.
ABU180100995
7. Golder Associates Pty Ltd. 2019. Gorgon GTP, Operational Groundwater Monitoring. Unpublished report for Chevron Australia, Perth, Western Australia.
ABU190500577
8. Chevron Australia. 2017. Gorgon Gas Development and Jansz Feed Gas Pipeline: Terrestrial and Marine Quarantine Management System. Rev. 1.0. Chevron Australia, Perth, Western Australia. Available from: https://australia.chevron.com/-/media/australia/our-businesses/documents/terrestrial-and-marine-quarantine-management-system.pdf [Accessed 11 Sep 2019]
GOR-COP-01854
9. Chevron Australia. 2015. Gorgon Gas Development and Jansz Feed Gas Pipeline: Five-year Environmental Performance Report (August 2010–August 2015). Rev. 0. Chevron Australia, Perth, Western Australia. Available from: https://australia.chevron.com/-/media/australia/our-businesses/documents/gorgon-and-jansz-feed-gas-pipeline-5-year-environmental-performance-report-2010-2015.pdf [Accessed 11 Sep 2019]
G1-NT-REPX0007517
10. Chevron Australia. 2018. Gorgon Gas Development and Jansz Feed Gas Pipeline: Long-term Marine Turtle Management Plan. Rev. 1.0. Chevron Australia, Perth, Western Australia. Available from: https://australia.chevron.com/-/media/australia/our-businesses/documents/gorgon-emp-long-term-marine-turtle-management-plan.pdf [Accessed 11 Sep 2019]
GOR-COP-01728
11. Pendoley Environmental. 2019. Gorgon Gas Development: Marine Turtle Monitoring Program 2018/19: Barrow Island and Mundabullangana. Unpublished report for Chevron Australia, Perth, Western Australia.
ABU190800835
Gorgon Gas Development and Jansz Feed Gas Pipeline Environmental Performance Report 2019
Document ID: ABU190900639 Revision ID: 1.0 Revision Date: 4 November 2019 Page 75 Information Sensitivity: Public Uncontrolled when Printed
Ref. No.
Description Document ID
12. Chevron Australia. 2019. Gorgon Gas Development and Jansz Feed Gas Pipeline: Short-Range Endemics and Subterranean Fauna Monitoring Plan. Rev. 4. Chevron Australia, Perth, Western Australia. Available from: https://australia.chevron.com/-/media/australia/our-businesses/documents/gorgon-emp-short-range-endemics-and-subterranean-fauna-monitoring-plan.pdf [Accessed 11 Sep 2019]
G1-NT-PLNX0000295
13. Chevron Australia. 2015. Gorgon Gas Development and Jansz Feed Gas Pipeline: Fire Management Plan. Rev. 1.0. Chevron Australia, Perth, Western Australia. Available from: https://australia.chevron.com/-/media/australia/our-businesses/documents/gorgon-emp-fire-management-plan.pdf [Accessed 11 Sep 2019]
GOR-COP-01238
14. Chevron Australia. 2016. Gorgon Gas Development and Jansz Feed Gas Pipeline: Air Quality Management Plan. Rev. 2. Amendment 1. Chevron Australia, Perth, Western Australia. Available from: https://australia.chevron.com/-/media/australia/our-businesses/documents/gorgon_project_emp_air_quality_management_planrev2amendment1.pdf [Accessed 11 Sep 2019]
G1-NT-PLNX0000301
15. Compliance Monitoring Pty Ltd. 2019. Gorgon Air Quality Atmospheric Pollutants: Operations Phase Summary Report: August 2018 to August 2019: Annual Environmental Performance Report. Rev. 0. Document Reference RPA088-545. Unpublished report for Chevron Australia, Perth, Western Australia.
ABU190901358
16. Department of Environment and Conservation. 2010. Gorgon Gas Development and Jansz Feed Gas Pipeline: Coastal Stability Management and Monitoring Plan Supplement: Management Triggers. Approval Letter. Department of Environment and Conservation, Perth, Western Australia.
G1-CO-LTR-DECWH-CVXPH-0000109
17. Chevron Australia. 2016. Gorgon Project: Coastal Stability Management and Monitoring Plan. Rev. 2. Chevron Australia, Perth, Western Australia. Available from: https://australia.chevron.com/-/media/australia/our-businesses/documents/coastal-stability-management-and-monitoring-plan.pdf [Accessed 11 Sep 2019]
G1-NT-PLNX0000300
18. Chevron Australia. 2016. Gorgon Gas Development and Jansz Feed Gas Pipeline: Coastal Stability Management and Monitoring Plan Supplement: Management Triggers. Rev. 1. Chevron Australia, Perth, Western Australia. Available from: https://australia.chevron.com/-/media/australia/our-businesses/documents/gorgon_project_coastal_stability_management_and_monitoring_plan_supplement.pdf [Accessed 11 Sep 2019]
G1-NT-REPX0002461
19. BMT Global Pty Ltd. 2019. Gorgon Project Coastal Stability Monitoring Annual Report – 2018/2019. Report No. R-1201_11-1. Unpublished report for Chevron Australia, Perth, Western Australia.
ABU190900575
20. Chevron Australia. 2019. Gorgon Gas Development and Jansz Feed Gas Pipeline: Post-Construction Rehabilitation Plan. Rev. 3.0. Chevron Australia, Perth, Western Australia. Available from: https://australia.chevron.com/-/media/australia/our-businesses/documents/gorgon-emp-post-construction-rehabilitation-plan.pdf [Accessed 27 Sep 2019]
G1-NT-PLNX0000303
21. Chevron Australia. 2014. Gorgon Gas Development and Jansz Feed Gas Pipeline: Topsoil Management Plan. Rev. 3. Chevron Australia, Perth, Western Australia. Available from: https://australia.chevron.com/-/media/australia/our-businesses/documents/gorgon-emp-topsoil-management-plan.pdf [Accessed 11 Sep 2019]
G1-NT-PLNX0000769
22. Stantec. 2019. Ecosystem Function Analysis 2018: Gorgon Pipeline Rehabilitation Monitoring on Barrow Island. Unpublished report for Chevron Australia, Perth, Western Australia.
ABU190901312
23. Stantec. 2019. Gorgon Project: Topsoil Stockpile Monitoring Program in 2018. Unpublished report for Chevron Australia, Perth, Western Australia.
ABU181001449
Gorgon Gas Development and Jansz Feed Gas Pipeline Environmental Performance Report 2019
Document ID: ABU190900639 Revision ID: 1.0 Revision Date: 4 November 2019 Page 76 Information Sensitivity: Public Uncontrolled when Printed
Ref. No.
Description Document ID
24. Pendoley Environmental. 2019. Gorgon Gas Development: ENV-GOR-Seabird Monitoring Report 2018/19. Unpublished report for Chevron Australia, Perth, Western Australia.
ABU190801371
25. Chevron Australia. 2017. Gorgon Gas Development and Jansz Feed Gas Pipeline: Environmental Performance Report 2017. Rev. 2.0. Chevron Australia, Perth, Western Australia.
ABU170800879
26. Chevron Australia. 2018. Gorgon Gas Development and Jansz Feed Gas Pipeline: Environmental Performance Report 2018. Rev. 1.0. Chevron Australia, Perth, Western Australia.
ABU180900011
27. Pendoley Environmental. 2019. Gorgon Gas Development: Flatback Turtle Hatchling Dispersal & Survivorship Study 2018/19. Unpublished report for Chevron Australia, Perth, Western Australia.
ABU190800836
28. Stantec. 2019. Ecosystem Function Analysis: Rehabilitated Well Sites and Gravel Pits on Barrow Island – 2018 Monitoring. Unpublished report for Chevron Australia, Perth, Western Australia.
ABU190700810
29. Chevron Australia. 2014. Gorgon Gas Development and Jansz Feed Gas Pipeline: Environmental Performance Report. Rev. 0. Chevron Australia, Perth, Western Australia.
G1-NT-REPX0007079
30. Astron Environmental Services. 2019. Gorgon Gas Development: Barrow Island Vegetation Monitoring Program. Unpublished report for Chevron Australia, Perth, Western Australia.
ABU190800596
31. Licence L9102/2017/1 Decision Report (File No. DER2017/001839),
16 July 2018.
ABU190901271
Recommended


![Schedule 1 — Gorgon Gas Processing and Infrastructure ... · PDF fileSchedule 1 — Gorgon Gas Processing and Infrastructure Project Agreement [s. 3] THIS AGREEMENT is made this](https://img.pdfslide.us/doc/110x75/5aabb8637f8b9a8d678c2b1b/schedule-1-gorgon-gas-processing-and-infrastructure-1-gorgon-gas-processing.jpg)


![2019.12.16 [526 Jansz-lo | Gorgon FEED ITT 19년 11ࡗ~12ࡗ 02 2122 …file.mk.co.kr/imss/write/20191216103211__00.pdf · 2019. 12. 16. · 2019.12.16 [526호] 최광식 02_2122_9197](https://img.pdfslide.us/doc/110x75/604b2f39fcc95f4a8a0a2d7b/20191216-526-jansz-lo-gorgon-feed-itt-19e-11a12a-02-2122-filemkcokrimsswrite2019121610321100pdf.jpg)