SUSTAININGRECOVERY AND DYNAMISM
FOR INCLUSIVE DEVELOPMENT
2010
ESCAP is the regional development arm of the United Nations and serves asthe main economic and social development centre for the United Nations inAsia and the Pacific. Its mandate is to foster cooperation between its 53members and 9 associate members. ESCAP provides the strategic linkbetween global and country-level programmes and issues. It supportsGovernments of countries in the region in consolidating regional positions andadvocates regional approaches to meeting the region’s unique socio-economicchallenges in a globalizing world. The ESCAP office is located in Bangkok,Thailand. Please visit the ESCAP website at www.unescap.org for furtherinformation.
The shaded areas of the map indicate ESCAP members and associate members.
The cover design concept
The vertical structures (red and green) represent patterns of developmentpursued in the past. The inability to return to ‘business as usual’ in theaftermath of the crisis has led to a discussion on the need for a rebalancing infavour of greater domestic and regional demand. The Survey argues that thiscould be achieved through more inclusive and sustainable growth. This isrepresented by the orange structure which is horizontal and wider, thus morestable and durable, signifying inclusiveness and sustainability whereas verticalstructures strive upwards monolithically, leaving out people, ideas and issues.
Design by Marie Ange Sylvain-Holmgren
SUSTAINING RECOVERY AND DYNAMISMFOR INCLUSIVE DEVELOPMENT
2010
Sustaining Recovery and Dynamism for Inclusive Development
ECONOMIC AND SOCIAL SURVEYOF ASIA AND THE PACIFIC 2010
United Nations publicationSales No. E.10.II.F.2Copyright © United Nations 2010All rights reservedManufactured in ThailandISBN: 978-92-1-120592-3ISSN: 0252-5704ST/ESCAP/2547
This publication may be reproduced in whole or in part for educational or non-profit purposes without special permission from the copyright holder, provided that the source is acknowledged. The ESCAP Publications Office would appreciate receiving a copy of any publication that uses this publication as a source.
No use may be made of this publication for resale or any other commercial purpose whatsoever without prior permission. Applications for such permission, with a statement of the purpose and extent of reproduction, should be addressed to the Secretary of the Publications Board, United Nations, New York.
ii
FOREWORD
The Asia-Pacific region leads the process of recovery from the global financial and economic crisis and emerges as a focus of global growth and stability.
However, the recovery of the world economy at large remains fragile. This poses risks for sustained recovery in Asia as well, given its export dependence. A more balanced recovery is needed and this will require more globally concerted policy efforts.
As we embrace the emerging role of the region as a significant driver of economic growth, we should not lose sight of the challenges ahead. In parts of Asia, unemployment rates are still up and poverty remains widespread. Without addressing the poverty and climate change challenges, economic growth will prove elusive over time.
The challenges are linked. Our solutions must be, too. We must recognize our interdependence; no nation can hope to find economic security without taking into account the well-being of others. Therefore our strategies must address both global and regional imbalances, and must do so in many spheres at once: economic, social and environmental.
The United Nations will convene a Summit in September 2010 to review progress in achieving the Millennium Development Goals (MDGs). The Asia-Pacific region has made remarkable headway, which demonstrates that the MDGs are indeed achievable. But more needs to be done to scale up successes and identify and remove barriers and obstacles. Five years before the 2015 deadline, the Summit provides us with a timely opportunity to address major interconnected development challenges and to give the MDGs a final push, including in the Asia-Pacific region.
iii
In this regard, the 2010 Economic and Social Survey of Asia and the Pacific provides a comprehensive analysis of the challenging policy landscape and offers recommendations for the way forward. In the aftermath of the crisis, we see clear momentum for regional economic cooperation. ESCAP, as the only intergovern-mental forum which brings together all the countries and territories in the Asia-Pacific region, will be playing a critical role in leading the deliberations over next steps.
As it turns out, the global crisis may give new impetus for establishing a robust regional framework for economic cooperation that will help us build more equal and sustainable economies in Asia and the Pacific. This would not only be the region’s gain, but essential for the sustainable development of the world at large.
BAN Ki-moon Secretary-General of the United NationsApril 2010
iv

EXECUTIVESECRETARY’SPREFACE
By early 2010, following the first global economic contraction in modern history, the contours of a V-shaped rebound were evident in the Asia-Pacific economies – assisted in large part by a number of unprecedented fiscal stimulus packages. But the rebound remains fragile and uneven, with a number of downside risks. While 2009 was a year of emergency crisis management, 2010 will be a year when economic policy making will be even more complex. Turning the rebound into a sustained recovery will mean keeping up the momentum while maintaining macroeconomic stability in the face of rising inflationary tendencies and the potential for asset bubbles.
The crisis has also drawn attention to the underlying global and regional structural imbalances built up over decades. Redressing these multiple imbalances and development gaps, and achieving a sustained recovery after the withdrawal of the fiscal stimuli, will require moving towards fairer, more balanced and sustainable patterns of development. Asia and the Pacific is unlikely to be able to return to business as usual. Instead it will increasingly have to drive its own development and create new sources of economic growth from within the region.
In this radically altered global panorama, the Asia-Pacific region is now emerging as a central participant in international economic relations. To fulfil this potential, however, it will need to implement an ambitious set of policies. The Economic and Social Survey of Asia and the Pacific 2010 explores this complex environment and – lest the V-shaped rebound induces complacency – outlines the elements of a coherent regional policy agenda.
v
vi
2009: an uneven pattern of impacts
Even at the height of this crisis, Asia and the Pacific displayed a new-found resilience. Its developing economies achieved an annual growth rate of 4.0%, making it the fastest-growing region in the world. However, almost all of this growth came from the two most populous countries: China, which grew by 8.7%, and India, by 7.2%. Indeed, excluding these fast-growing sub-continental economies, the Asia-Pacific developing economies contracted in 2009 by 0.6%.
These contrasting performances resulted from many different factors. The first concerned the extent of dependence on developed country markets. All the worst-affected countries had shares of exports to GDP that exceeded 60%, and the greater the share of these exports that were absorbed by the developed markets the greater was the economic contraction. Related to this, the countries most exposed to global trade perturbations were those, including many in East and South-East Asia, whose exports involved regional production networking arrangements – for products such as apparel, machinery, electronics, and motor vehicles. They saw their exports plummet almost twice as rapidly as in the 1997 crisis. On the other hand, countries such as Bangladesh, which exported simpler products such as low-cost garments, became more competitive and gained market share. There is also evidence that intra-regional trade has continued to expand, especially through exports to China and India.
The second factor concerned the extent of exposure to the exit of portfolio capital as investors sought to cover their losses in the western capital markets. This brought pressures on exchange rates and created financial instability as well as liquidity problems in countries that did not have adequate reserves. Although, compared with the 1997 crisis, more countries had strong foreign exchange reserves, some had to arrange bilateral swaps, as the Republic of Korea and Singapore, or seek liquidity from the IMF, as Pakistan and Sri Lanka. Nevertheless, it is by no means clear what is an optimum stock of foreign reserves since, as the crisis revealed, holding foreign reserves idle also entails both costs and risks. Survey 2010 proposes a yardstick for gauging such vulnerabilities.
The third factor explaining the contrasting experiences was the varying capacity to respond. The countries best able to mount rapid and large counter-cyclical spending programmes were those that entered the crisis with strong macroeconomic fundamentals; in particular, stable inflationary trends, sound fiscal balances and low ratios of public debt to GDP. The massive additional fiscal spending helped reduce the impact of lower exports and the falling demand for services such as tourism, as well as reduced growth of migrant remittances. Even more important, the stimulus also afforded some protection to the vulnerable workers who had lost their jobs, typically the unskilled and very often women in the manufacturing sector and in the informal economy.
A quantitative analysis reported in Survey 2010 shows that the stimulus packages certainly had an impact – offsetting to some extent the loss of exports. For the key economies of the region, Survey 2010 shows that for each $1.00 lost in exports there was an average loss of $0.88 in GDP – though the figure ranged from $1.1 in Japan, to $0.4 in Malaysia and Singapore, and to $0.7 for China. If the only variable affecting GDP had been a shortfall of exports, then GDP growth in 2009 would have dropped by 7.8 percentage points. However, the actual shortfall in 2009 was only 4.2 percentage points – thanks largely to the region’s fiscal stimulus packages. The forecasts also suggest that Asia and the Pacific is unlikely to see a return to pre-crisis export growth rates. In the medium term the region will need to look beyond expansionary policies and instead seek new engines to sustain the region’s dynamism.
vii
The outlook for 2010: a sharp rebound, with downside risks
The outlook for 2010 has improved significantly. The Asia-Pacific developing economies are forecast to grow by 7.0% in 2010 compared to 4.0% in 2009, led by the self-sustaining motors of China, growing at 9.5%, and India at 8.3%.
But the road ahead has a number of potential pitfalls. One concerns protectionism. Many developed countries, facing anaemic growth coupled with high unemployment, may restrict trade. This has led to prominent trade disputes that pit developed countries against large exporters from this region. Another concern is that greater liquidity in the global financial system is finding its way to Asia-Pacific emerging markets – causing exchange rates to appreciate, stoking inflationary pressures, and leading to the formation of asset bubbles. There are also echoes of the food-fuel crisis of 2007, with food prices rising again in some countries and causing special hardship for the poor.
Policy-makers are thus faced with tough balancing acts on both monetary and fiscal policy. While they will want to tighten monetary policy to restrain inflationary pressures they will need to maintain real interest rates at par with global levels – to keep their exchange rates competitive and to encourage domestic economic growth. And while they will inevitably have to move toward fiscal consolidation they will have to judge the timing and sequencing carefully if they are not to choke off economic recovery and trigger the need for further stimulus packages. Another policy consideration will be to manage portfolio capital inflows through various types of capital controls. The benefits of maintaining open capital accounts, if any, are ambiguous. Instead there is a growing consensus that capital controls should be seen as important components of the policy toolkit.
As argued by the APEC leaders at their November 2009 Summit in Singapore, the advanced economies are unlikely to be able to return to ‘growth as usual’ or ‘trade as usual’. Even if the advanced countries achieve a substantial economic recovery their demand for imports from Asia and the Pacific will not return to pre-crisis levels. This is because in order to unwind the global imbalances, many of the developed economies will need to restrain debt-fuelled consumption. The Asia-Pacific countries, for their part, will therefore need to seek new sources of growth – ‘rebalancing’ their economies in favour of greater domestic and regional consumption.
Survey 2010 explores different imbalances and gaps – macroeconomic, social, developmental, and ecological – and considers the potential of closing them for creating additional aggregate demand that could serve as new regional impulses for growth.
Imbalances, gaps and new sources of growth
In the past, the global imbalances have assisted the Asia-Pacific region by providing expanding markets for exports, and augmenting foreign exchange reserves. But these imbalances are not sustainable. They have resulted in growing trade and current account imbalances which the United States in particular, with its high levels of accumulated debt, will have to unwind.
There are also macroeconomic imbalances within the region – notably between the economies of East and South-East Asia and those of South Asia. In East and South-East Asia net exports have been increasing as a proportion of GDP growth while in South Asia they have been increasingly negative. In the case of East Asia this reflects a declining share of consumption in long-term growth, and in the case of South-East Asia, a declining share of fixed investment. In South Asia’s case, on the other hand, the share of investment has been rising along with growing net imports.
viii
Perhaps the most disturbing aspect of the global imbalances is the anomaly of capital flowing from Asia-Pacific developing countries to finance consumption and investment in rich countries such as the United States. This has happened largely because Asia and the Pacific lacks a well developed regional financial architecture that might have enabled the countries running current account surpluses to deploy these productively in other parts of the region.
At the same time, Asia and the Pacific has large socioeconomic and development gaps. Although the region as a whole has achieved rapid economic growth that has helped lift millions of people out of poverty it is still home to over 950 million people living under the $1.25 per day poverty line. Moreover, development has been very uneven, across subregions and between countries. This is reflected in varying patterns of progress towards the Millennium Development Goals – with South-East Asia leading the way and South Asia and the Pacific Island economies lagging behind. There are similar gaps in the levels of infrastructure development; this is evident from the composite infrastructure development scores presented in Survey 2010. Some economies register high scores, including: Singapore; Japan; New Zealand; Republic of Korea; Australia; Brunei Darussalam; Hong Kong, China; and Macao, China. Others still have considerable infrastructure gaps, particularly the least developed, landlocked and small island economies, such as Papua New Guinea, Nepal, Lao People’s Democratic Republic, Solomon Islands, Cambodia, Bhutan, Vanuatu, and Mongolia. If the countries of the region invest in closing these socio-economic development gaps they cannot only lift levels of human development but also boost regional aggregate demand – making economic growth more inclusive and sustainable. This will demand high and sustained levels of investment that will rely on creating a new regional financial architecture that can be used to mobilize the necessary resources – from within the region and beyond.
The Asia-Pacific region also has serious ecological imbalances. These are evident, for example, in the degradation of key natural resources, such as forests and fresh water, the unsustainable use of energy, and a rapid growth of carbon emissions. Although some of these imbalances may not appear to have immediate economic consequences, they will make it much more difficult to sustain economic growth in the long term. If countries can invest in addressing these imbalances they will not only preserve the natural environment, on which so many poor people depend, but also maintain the basis for long-term growth. And in the short term they will also provide an immediate economic stimulus and thus further alleviate poverty.
In sum, therefore, as the countries of the region take steps to address macroeconomic, developmental and ecological imbalances they have an opportunity to create new motors of inclusive growth that will help them regain their economic dynamism. The region has close to one billion people living in poverty, which combined with wide development gaps, gives it considerable headroom for augmenting aggregate demand through boosting private consumption and investment. Similarly, the Asia-Pacific economies have the opportunity to develop new and greener industries and businesses based on innovations that will save energy and materials. In so doing they can provide more affordable products for the poor while maintaining growth and promoting environmental sustainability.
Survey 2010 argues, therefore, that in the aftermath of the global economic crisis, inclusive and sustainable growth is not only desirable but also a necessary condition for regaining the region’s dynamism. It then goes on to outline a policy agenda at national and regional levels that might assist in unleashing the latent potential of domestic and regional demand to address the three imbalances in an integrated manner.
ix
A regional policy agenda for inclusive and sustainable growth
Survey 2010 explores ways of increasing aggregate demand and supply – establishing the region on a more inclusive and sustainable path of development and boosting regional connectivity. For this purpose it proposes an agenda with five prongs. The first four may assist in expanding domestic consumption while addressing socio-economic and ecological imbalances. The fifth deals with regional consumption.
1. Strengthening social protection
If poor households can rely on systems of social protection that will automatically trigger social safety nets at times of adversity they will be able to maintain food intake and continue to use education and health services. Just as important, at normal times they will have less need to maintain precautionary savings and can use more of their income for consumption. By serving as automatic stabilizers, systems of social protection not only support households at times of crisis but also enhance opportunities for individual development.
The Asia-Pacific region now has a number of examples of ambitious social security programmes. Thailand has a universal health-care programme – formerly called the ‘30 baht’ scheme, but now free. India has the National Rural Employment Guarantee Act (NREGA) which provides a guaranteed 100 days of employment each year to adult members of rural households and also has gender-sensitive provisions. The Philippines has the Pantawid Pamilyang Pilipino Program (4Ps), which provides conditional cash transfers to poor households for their health and educational needs. Despite these efforts, a common agenda built around social protection has been slow to emerge. Social policy institutions often remain rooted in out-dated assumptions about the household, how individuals are cared for, and its coping mechanism in times of crises. Rather than using short-term measures, interventions need to sustain a trajectory from poverty to security, as basic rights.
2. Promoting agriculture and rural development: fostering a second green revolution
In Asia and the Pacific the majority of poor people live in the rural areas and derive most of their income from agriculture – so are likely to benefit from agricultural growth. Since the 1970s such growth was based largely on the Green Revolution which helped the region achieve significant yield increases – though the high input intensity also caused well documented problems. Now, as the region aims for more balanced economic growth, it needs a second, more knowledge-intensive green revolution that combines advances in science and agricultural engineering with the region’s unique traditional knowledge to make agriculture more environmentally resilient. But countries will also need to make agriculture more socially inclusive by returning ownership of land and resources to farmers, especially women, and economically empowering the poor. This will mean setting appropriate prices for key inputs and establishing institutions to help small producers achieve economies of scale in marketing and in accessing international markets. In the past, governments may have tried to achieve this through state or parastatal agencies, but in future they may choose to encourage community-based organizations and farmers’ self-help groups. International partnerships and South-South cooperation can also help foster such a green revolution while also addressing concerns for food security.
3. Supporting new engines of growth: green innovations
Green Growth emphasizes environmentally sustainable consumption and production that foster low-carbon, socially inclusive development. For this purpose, countries can take an industrial policy approach – encouraging strategic collaborations between government and industry to promote
x
investments in environmentally-friendly technologies and products. Because of market failures such investments may not be immediately profitable, so many environmentally-friendly technological innovations will initially need government support. The public support can also help develop and commercialize products that serve to raise the wellbeing of the poor and the rural areas generally by encouraging affordable and environmentally-friendly technologies such as the rural solar home electricity systems popularized by Grameen Shakti in Bangladesh. A number of Asia-Pacific countries including Japan, China, India, and the Republic of Korea are promoting such innovations as a part of their national action plans on climate change. China, for example, has become the top investor in clean energy, with investments reaching $34.6 billion in 2009, while the Republic of Korea plans to spend $84 billion over five years to develop environmentally-friendly industries and use them as engines of growth. Governments can also encourage the adoption of environmentally-sound practices and technologies through appropriate regulations and systems of incentives and taxes.
In the developing countries the introduction of these innovations can be accelerated if the developed countries that already have a range of environmentally-friendly technologies, transfer them and relax some of the provisions of intellectual property rights, and also provide some of the necessary finance – following the principle of common but differentiated responsibilities established in the United Nations Framework Convention on Climate Change.
But the developing countries can also help each other in the area of sustainable consumption and production by sharing experiences and best practices. A number of Asia-Pacific developing countries now have capabilities in a range of technologies, such as biofuels production, waste management and solar and wind power. For example, Waste Concern, an NGO in Bangladesh which has developed a system of decentralized treatment plants for managing solid waste, with ESCAP support, is promoting similar approaches in cities in Pakistan, Sri Lanka, and Viet Nam.
4. Enhancing financial inclusion
A well functioning financial system is crucial to economic growth, but this will not be enough to ensure expanded aggregate demand. If the poor are to release their pent-up demand they will need access to a more diverse and appropriate range of financial products and services. This would include savings, credit and insurance products tailored to their requirements – on more favourable terms and with less stringent demands for collateral. This has been shown to have clear benefits. Households that can take advantage of micro-finance and micro-insurance, for example, are in a much stronger position to increase their incomes – and boost their levels of nutrition and standards of education. Moreover, women in such households tend to have greater autonomy in decision making and are better able to improve the well being of their families. To date however, across most developing countries in Asia and the Pacific, financial services are used by only a small proportion of the population. The poor are typically excluded from the formal financial sector and from the services of commercial banks. Barriers exist on both the demand and supply sides. Governments will therefore need to ensure an institutional and regulatory environment that fosters an inclusive, fairer and more efficient banking system and expands and safeguards the options for the poor.
5. Evolving a regional framework for cooperative action
With some of the world’s largest and fastest-growing economies, Asia and the Pacific can become an even greater economic powerhouse if it develops a more integrated regional market. But this should be on the basis of a new development paradigm that is more inclusive and sustainable.
xi
Thus far, for historical, political and topographical reasons, the region has been better connected with Europe and North America than it has been with itself. Survey 2010 identifies four priorities that can leverage complementarities across the region and lay the foundations for a more inclusive and sustainable path of development:
(a) Regional economic integration – The Asia-Pacific region is home to a complex network of political groupings, whose leaders in recent times have consistently envisioned the evolution of a unified economic space. The time has come to move from vision to action. For this purpose they can accelerate progress on two current overlapping proposals. The first is the East Asia Free Trade Agreement (EAFTA) which brings together the ASEAN+3 grouping. The second is the Comprehensive Economic Partnership of East Asia (CEPEA) of the East Asia Summit (EAS) whose members include those in the ASEAN+3 grouping plus Australia, India, and New Zealand (or ASEAN+6). These proposals can serve as stepping stones to an even broader, unified Asia-Pacific market and an economic community.
(b) Integrated trade and transport policies – The region has improved its highway and railway networks, but it cannot use the infrastructure effectively without the legal and regulartory bases for vehicles, goods, and people to move across borders and transit countries. Currently, many international movements are hindered by slow and costly processes, formalities and procedures. The cost of red tape is considerable and often wipes out the benefits of tariff reductions enacted over the past two decades. In future the region will need an integrated, multimodal transport system. For this purpose, it can, for example, build intermodal transfer points, also known as dry ports, where goods, containers or vehicles can be transhipped using the most efficient mode of transport – along with facilities for product grading, packaging, inspections and the processing of trade documentation. The areas surrounding dry ports can then emerge as growth poles, bringing new investment and employment opportunities to impoverished hinterlands while reducing the pressure on coastal areas. Building on its Asian Highway and Trans Asian Railway Networks, the ESCAP secretariat is now helping the region develop a network of dry ports while improving trade and transport facilitation. ESCAP, along with the ADB is collaborating with ASEAN in developing a connectivity master plan.
(c) ICT superhighways – Expanding markets and business opportunities and creating a more unified economic space will depend crucially on better intraregional ICT connectivity to reduce the digital divide and accelerate cross-border information and communication flows. One of the main tasks will be to offer greater international bandwidth – particularly for the landlocked developing countries and the Pacific island developing countries. As well as boosting economic development such connectivity can also be used to establish systems for emergency early warnings and disaster response.
(d) Regional financial architecture – The economic crisis highlighted the lack of regional response options. Most of the measures had to be taken by national governments. So far the cooperation has been largely limited to the Chiang Mai Initiative that has now been multilateralized with a reserve pool of $120 billion for meeting the temporary liquidity needs of the ASEAN+3 countries. The region now needs to further develop its financial architecture, which would include systems of intermediation between its large savings and its unmet investment needs. One option would be to create an infrastructure development fund managed by a regional institution. If this secured just 5% of the region’s reserves of nearly $5 trillion it could have start-up capital of $250 billion, as well as the ability to borrow from the region’s central banks. This pooling of reserves could assist the region in meeting some of its investment needs for transport, energy, water and telecommunications – estimated at more than $800 billion per annum.
Noeleen HeyzerUnder-Secretary-General of the United Nations and Executive Secretary, United Nations Economic and Social Commission for Asia and the Pacific
Another area where regional financial architecture could make a positive contribution is in exchange rate coordination. As the economies of the region increasingly trade with each other they will need a currency management system that facilitates trade and macroeconomic stability.
If governments had access to a well endowed regional crisis response and prevention facility they would feel less need to build up large foreign exchange reserves to protect their economies against speculative attacks and liquidity crises, and could thus free up reserves for more productive investments. Enhanced regional cooperation should not, however, be regarded as an alternative to full participation in global economic relations. Rather it should be seen as a complement to it, filling in the gaps and establishing the building blocks for global multilateral cooperation.
The development of a regional financial architecture would also assist in policy coordination and in providing an Asia-Pacific perspective on various global proposals that are emerging in the G-20, the United Nations and other forums. These include, for example, an SDR-based global reserve currency, a global tax on financial transactions to moderate short-term capital flows, and international regulations for the financial sector to curb excessive risk taking.
Asia and the Pacific now has an historic opportunity for cooperation, and in recent months some of the region’s major economies have started a process of deeper mutual engagement – though if they are to carry through their more ambitious plans they will need to add greater detail to general statements of intent.
xii
xiii
This report was prepared under the overall direction and guidance of Noeleen Heyzer, Under-Secretary-General of the United Nations and Executive Secretary of the Economic and SocialCommission for Asia and the Pacific (ESCAP), and under the substantive direction of NageshKumar, Chief Economist and Director of the Macroeconomic Policy and Development Division. Thecore team, led by Tiziana Bonapace, included Shuvojit Banerjee, Somchai Congtavinsutti, EugeneGherman, Yejin Ha, Alberto Isgut, Nobuko Kajiura, Muhammad H. Malik, George Manzano and AmyWong.
ESCAP staff who contributed substantively include: Amitava Mukherjee of Macroeconomic Policyand Development Division (MPDD); Aneta Nikolova and Hitomi Rankine of the Environment andDevelopment Division; Jorge Martinez-Navarrete, Atsuko Okuda and Nokeo Ratanavong of theInformation and Communications Technology and Disaster Risk Reduction Division; Yu Kanosue andSarah Lowder of the Social Development Division; Clovis Freire, Erik Hermouet and Ilpo Survo ofthe Statistics Division; Yann Duval of the Trade and Investment Division; John Moon of theTransport Division; and Krishnamurthy Ramanathan, N. Srinivasan and Krishnan Srinivasaraghavanof the Asian and Pacific Centre for Transfer of Technology (APCTT).
Valuable advice, comments and inputs were received from many staff of the United Nations whichinclude: Kee Beom Kim and Gyorgy Sziraczki of the International Labour Organisation; PingfanHong and Matthias Kempf of the Department of Economic and Social Affairs, United Nations, NewYork; and Aynul Hasan, Syed Nuruzzaman, Seung Hun Jung, Ouk Heon Song, and Marin Yari ofMPDD. Iosefa Maiava, Michal Kuzawinski and David Smith of the ESCAP Pacific Operations Centreof ESCAP.
The following experts provided country reports and other inputs: Zamir Ahmed, Rajeev Malhotra,Ron Duncan, Mohammad Kordbache, Ramkishen S. Rajan, Prabir De and Prakash Shrestha.
The report benefitted from an external peer review, comments and suggestions from an eminentgroup of Asian policy makers, scholars and development practitioners, namely: Yilmaz Akyuz,Special Economic Advisor, South Centre, Switzerland; Mohamed Ariff, Executive Director, MalaysianInstitute of Economic Research (MIER), Malaysia; Ramgopal Agarwala, Distinguished Fellow, Re-search and Information System for Developing Countries, India; Md. Mosharraf Hossain Bhuiyan,Additional Secretary, Economic Relations Division, Ministry of Finance, Bangladesh; Michael Busai,Acting Director/Principal Economist, Ministry of Finance and Economic Management, Vanuatu; AbdulWassay Haqiqi, Senior Advisor to the Minister of Economy, Ministry of Economy, Afghanistan;Mohamed Imad, Assistant Executive Director, Department of National Planning, Maldives; SamanKelegama, Executive Director, Institute of Policy Studies of Sri Lanka, Sri Lanka; Ambassador K.Kesavapany, Director, Institute of Southeast Asian Studies, Singapore; Norman Lenga, PolicyAnalyst, Ministry of Finance and Treasury, Solomon Islands; Ashfaque H. Khan, Dean & Professor,National University of Sciences and Technology, NUST Business School, Pakistan; GombosurenKhandtsooj, Officer, Financial and Economic Policy Department, Mongolia; Martin Khor, ExecutiveDirector, South Centre, Switzerland; Tin Htut Oo, Director-General, Department of AgriculturalPlanning, Ministry of Agriculture and Irrigation, Myanmar; Pichit Patrawimolpon, Director, Office ofthe Governor, Bank of Thailand, Thailand; Kim Phalla, Director, Economic and Public FinanceDepartment, Ministry of Economic and Finance, Cambodia; Prabowo, Strategic Asia (Indonesia),Indonesia; Atiur Rahman, Governor, Bangladesh Bank, Bangladesh; Reteta Rimon-Nikuata, Kiribati
ACKNOWLEDGEMENTS
xiv
High Commissioner, Fiji; João Mariano Saldanha, Senior Management Adviser for Policy Analysis andResearch, Timor-Leste; Pushpa Lal Shakya, Joint Secretary of National Planning Commission, Nepal;Vo Tri Thanh, Vice President, Central Institute of Economic Management, Viet Nam; and TandinWangchuk, Planning Officer, Perspective Planning Division, Bhutan.
Erik Huldt and Amornrat Supornsinchai of the Macroeconomic Policy and Development Division,ESCAP provided research assistance.
Orestes Plasencia, Kim Atkinson and Chirudee Pungtrakul of the Editorial Unit of ESCAP and PeterStalker edited the manuscript. The graphic design was created by Marie Ange Sylvain-Holmgren,and the layout and printing were provided by TR Enterprise.
Woranut Sompitayanurak, supported by Metinee Hunkosol, Anong Pattanathanes and SutineeYeamkitpibul of the Macroeconomic Policy and Development Division, ESCAP, proofread the manu-script and undertook all administrative processing necessary for the issuance of the publication.
Paul Risley, Mitchell Hsieh, Bentley Jenson, Thawadi Pachariyangkun and Chavalit Boonthanom ofthe United Nations Information Services, coordinated the launch and dissemination of the report.
xv
CONTENTS
Page
Foreword ..................................................................................................................................... iii
Executive Secretary’s preface .................................................................................................. v
Acknowledgements .................................................................................................................... xiii
Abbreviations .............................................................................................................................. xxvii
Sources of quotations ............................................................................................................... xxix
Chapter 1. The beginnings of recovery and policy responses ........................................... 3
Coping with vulnerability ................................................................................. 5
Vulnerable to trade and financial exposure ................................................... 5Exposure to developed-country demand ....................................................... 7Exposure to capital flows ............................................................................... 17Capital markets and exchange rates: renewed inflows bring instability ...... 22Emerging reorientation of foreign direct investment ...................................... 25Evolving impacts on jobs and income ........................................................... 27Migration and remittances: bucking the pressures ...................................... 31Domestic demand and fiscal space shaping responses ............................... 33
Growth outlook for 2010 ................................................................................. 41
Recovery underway ........................................................................................ 41Backdrop for 2010 forecast ........................................................................... 41Different paces of expansion ......................................................................... 44Downside risks persist ................................................................................... 45
Balancing growth with stability ...................................................................... 46
Inflation threatens from demand and supply sides ....................................... 46Asset bubbles build up ................................................................................... 49Avoiding premature exit .................................................................................. 52Sustaining Asia’s dynamism ........................................................................... 53
Chapter 2. Crisis and rebound: the differentiated impacts, policy responsesand outlook at the subregional level .................................................................. 57
East and North-East Asia ................................................................................ 58
Impact of the crisis ......................................................................................... 60Policy responses............................................................................................. 65Outlook and policy challenges ....................................................................... 68
North and Central Asia ................................................................................... 69
Impact of the crisis ......................................................................................... 71Policy responses............................................................................................. 73Outlook and policy challenges ....................................................................... 77
xvi
CONTENTS (continued)
Page
Oceania .................................................................................................................... 78
Impact of the crisis .............................................................................................. 78Policy responses .................................................................................................. 86Outlook and policy challenges ............................................................................ 88
South and South-West Asia ................................................................................. 89
Impact of the crisis .............................................................................................. 89Policy responses .................................................................................................. 95Outlook and policy challenges ............................................................................ 98
South-East Asia ...................................................................................................... 100
Impact of the crisis .............................................................................................. 100Policy responses .................................................................................................. 105Prospects ............................................................................................................. 109
Chapter 3. Multiple imbalances and development gaps as new engines of growth ........ 115
Macroeconomic imbalances ............................................................................ 118
Sources of imbalances ................................................................................... 121
Socio-economic imbalances and development gaps ................................... 125
Poverty reduction: remarkable but uneven .................................................... 125Poverty-inequality-household consumption nexus .......................................... 126Poverty and multiple deprivations .................................................................. 129Infrastructure and other development gaps ................................................... 133
Growing ecological imbalances ...................................................................... 136
Linkages between the three imbalances ....................................................... 140
Annex I ................................................................................................................ 142
Annex II ............................................................................................................... 143
Chapter 4. A regional policy agenda for regaining the dynamism .................................... 147
Redressing socio-economic and environmental imbalancesfor expanding domestic consumption ........................................................... 148
Strengthening social protection ...................................................................... 148A “Green revolution” for food security and poverty reduction ....................... 151“Green growth”: new green industries as engines of growth ........................ 154Enhancing financial inclusiveness .................................................................. 158
xvii
CONTENTS (continued)
Page
Expanding demand through cooperation ....................................................... 160
Evolving a broader framework for economic integration ............................... 161Developing regional transportation networks and improving
trade facilitation ........................................................................................... 162Strengthening connectivity through information and communications
technology (ICT).......................................................................................... 165Developing financial architecture for crisis prevention and narrowing
the gaps ...................................................................................................... 167
References and further readings ............................................................................................. 179
Statistical annex ......................................................................................................................... 195
xviii
BOXES
Page
1. Assessing the impact of expected downturns in export growth ........................................ 35
2. Potential for economic cooperation: the Democratic People’s Republic of Korea .......... 69
3. Creating a “Eurasian Union”: the Russian Federation, Kazakhstan, and Belarus .......... 77
4. Connectivity in the Pacific .................................................................................................. 89
5. Indian National Rural Employment Guarantee Scheme .................................................... 96
6. The changing direction of ASEAN trade ............................................................................ 111
7. Sensitivity of the results to alternative methods to compute the contribution ofaggregate demand components to GDP growth ............................................................... 123
8. Pro-poor investments in renewable energy and beyond ................................................... 156
9. Connectivity for improved disaster preparedness, response and management ............... 166
xix
Page
1. World economic growth: a post-war story of rising prosperity, 1930 to 2010 ................ 4
2. The Asia-Pacific region is the fastest growing of all, 2009 and 2010 .............................. 4
3. Real GDP growth, year-on-year, in selected developing and developed countries,2008 and 2009 ................................................................................................................... 6
4. Spread of overnight LIBOR rates to overnight United States Federal Reserveeffective fund rates, February 2007 to January 2010 ....................................................... 7
5. Real GDP growth of six export-oriented developing economies, by quarter,2008 and 2009 ................................................................................................................... 8
6. Comparative growth performance of goods exports of major developing economiesduring three crises, 1997 to 2009 ...................................................................................... 9
7. Index of total United States imports and United States imports from Asianand Pacific developing and developed economies, by quarter, 2007 to 2009 ................. 9
8. Export dependence in subregions of Asia and the Pacific, in three-yearaverages, in percentage shares of GDP, 1994 to 1996 and 2005 to 2007 ..................... 13
9. Net private capital flows to “emerging” Asia, 1991 to 2010 .............................................. 18
10. Loan-to-deposit ratios in major Asian developing economies, third quarter of 2009 ....... 19
11. Vulnerability yardstick as a percentage of foreign reserves in majordeveloping economies, 2008 .............................................................................................. 22
12. Exchange rate movements in major developing economies, 2007 to 2009 ..................... 23
13. Change in nominal effective exchange rates from peak to trough in major developingeconomies during two crises, 1997 to 1998 and 2008 to 2009 ....................................... 24
14. Foreign reserves in six developing economies, December 2007 to December 2009 ...... 24
15. Gross inward direct investment in major developing economies, 2007 to 2009 .............. 26
16. Social expenditure as a percentage of GDP, worldwide, during mostrecent year available .......................................................................................................... 28
17. Labour market trends in four Asian economies, 1996 to 2008 ........................................ 30
18. Monthly and quarterly unemployment rates in six Asian economies,2008 and 2009 ................................................................................................................... 31
FIGURES
xx
FIGURES (continued)
Page
19. Annual growth rate in overseas workers’ remittances in four developing economies,2007/08 and 2008/09 .......................................................................................................... 32
20. Contributions of domestic demand, exports and imports to real GDPgrowth in major Asian developing economies, 2008 and 2009 ........................................ 34
21. Real exports of 11 major Asian economies ....................................................................... 37
22. Interest rates in major Asian developing economies, 2008 and 2009 .............................. 40
23. Economic growth rates of Asian and Pacific developing economies and worlddeveloped economies, 2003 to 2010 ................................................................................. 41
24. Average growth rates and forecasts of Asian and Pacific economies by subregion,2003 to 2010 ...................................................................................................................... 44
25. Consumer price inflation, year-on-year, in major Asian developing economies,2008 and 2009 ................................................................................................................... 47
26. Credit growth, year-on-year, in major Asian developing economies,January 2007 to October 2009 .......................................................................................... 50
27. Equity market performance in major Asian developing economies,January 2008 to December 2009 ...................................................................................... 50
28. Equity market behaviour peak-to-trough during two crises, 1997 to 1998 and2008 to 2009 ...................................................................................................................... 51
29. Performance indices of regional emerging-market equities, 15 September 2008 to8 January 2010 ................................................................................................................... 52
30. Real GDP growth of Asian and Pacific developing and world developedeconomies, 2003 to 2010 ................................................................................................... 58
31. Map of growth deceleration among Asian and Pacific economies:Comparison of crisis-period growth with pre-crisis growth trends..................................... 59
32. Real GDP growth, year-on-year, of major East and North-East Asian economies,2008 and 2009 ................................................................................................................... 61
33. Export growth, year-on-year, of major East and North-East Asian economies,2008 and 2009 ................................................................................................................... 63
34. Import growth, year-on-year, of major East and North-East Asian economies,2008 and 2009 ................................................................................................................... 63
xxi
FIGURES (continued)
Page
35. Current account balance as a percentage of GDP in major East and North-EastAsian economies, 2007 to 2009 ........................................................................................ 64
36. Interest rates in major East and North-East Asian economies, 2008 and 2009 .............. 66
37. Budget balance as a percentage of GDP of major East and North-East Asianeconomies, 2007 to 2009 ................................................................................................... 67
38. Current account balance as a percentage of GDP in North and Central Asianeconomies, 2007 to 2009 ................................................................................................... 72
39. Budget balance as a percentage of GDP in North and Central Asian economies,2007 to 2009 ...................................................................................................................... 75
40. Index of exchange rates movements in selected North and Central Asianeconomies, 2007 to 2009 ................................................................................................... 76
41. Current account balances as a percentage of GDP of the countries in Oceania,2007 to 2009 ...................................................................................................................... 83
42. Current account balance as a percentage of GDP in South and South-WestAsian economies, 2007 to 2009 ........................................................................................ 94
43. Budget balance as a percentage of GDP in selected South and South-WestAsian economies, 2007 to 2009 ........................................................................................ 97
44. Combined share of United States and European Union purchases of merchandiseexports of selected South-East Asian economies, 2006 to 2007 and 2008..................... 101
45. Export share of electronics, machinery, motor vehicles and apparel in totalexports, selected South-East Asian economies, 2006 to 2008 ......................................... 102
46. Budget balance as a percentage of GDP in selected South-East Asian economies,2007 to 2009 ...................................................................................................................... 106
47. Current account balance as a percentage of GDP in selected South-East Asianeconomies, 2007 to 2009 ................................................................................................... 107
48. Index of exchange rate movements in selected South-East Asian economies, 2009 ..... 109
49. Trends in the real GDP of selected regions and countries .............................................. 116
50. Real GDP per capita adjusted by purchasing power parity .............................................. 117
51. Trade and current account balances ................................................................................. 119
xxii
FIGURES (continued)
Page
52. Share of net exports of goods and services in long-term real GDP growth .................... 120
53. Share of gross fixed investment in long-term real GDP growth ....................................... 121
54. Share of consumption in long-term real GDP growth ....................................................... 122
55. Paths of poverty rates and GDPs per capita in selected countries ................................. 126
56. Per capita household consumption and per capita GDP in 15 Asian and Pacificdeveloping countries ........................................................................................................... 128
57. Headcount poverty and employment in the informal sector in theAsia-Pacific region .............................................................................................................. 130
58. Headcount poverty and underweight children in the Asia-Pacific region .......................... 131
59. Headcount poverty and primary education survival rate in the Asia-Pacific region .......... 131
60. Headcount poverty and access to improved sanitation in the Asia-Pacific region ........... 132
61. Infrastructure composite scores in Asia and the Pacific, 2007 ......................................... 135
62. Net loss or increase in forest area between 1990 and 2005 ........................................... 136
63. Proportion of total renewable freshwater resources withdrawn ......................................... 138
64. A schematic view of the three imbalances ........................................................................ 141
65. FAO food price index and Brent crude oil price, January 2004 to February 2010 .......... 152
66. Asian Highway and Trans-Asian Railway Networks .......................................................... 162
xxiii
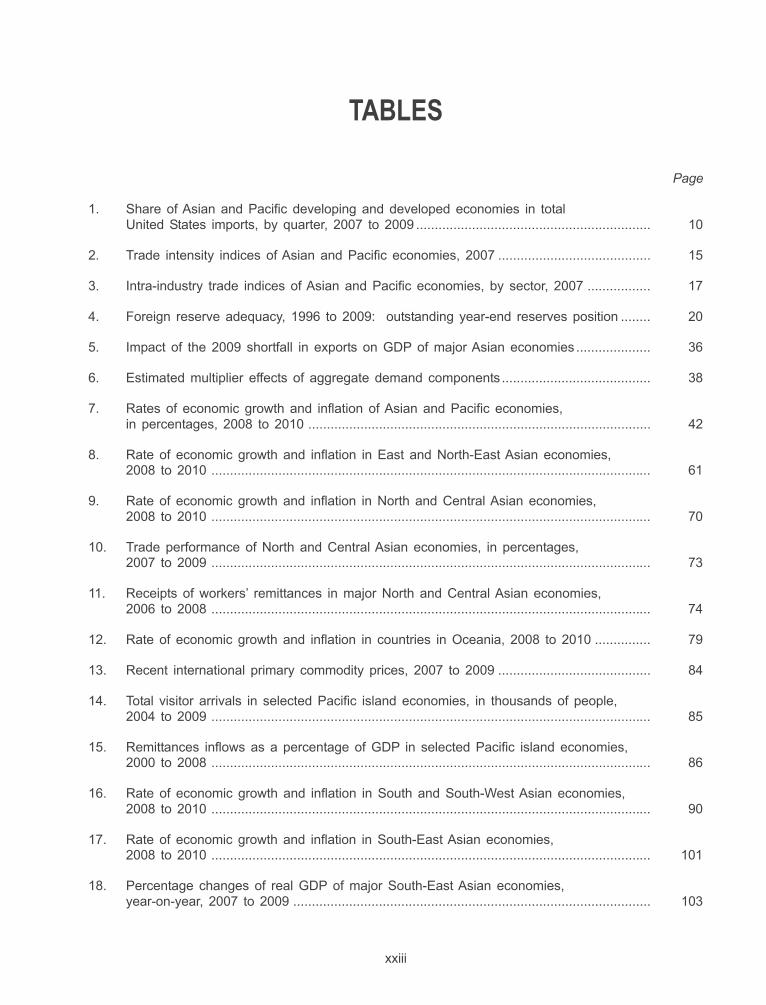
TABLES
Page
1. Share of Asian and Pacific developing and developed economies in totalUnited States imports, by quarter, 2007 to 2009 ............................................................... 10
2. Trade intensity indices of Asian and Pacific economies, 2007 ......................................... 15
3. Intra-industry trade indices of Asian and Pacific economies, by sector, 2007 ................. 17
4. Foreign reserve adequacy, 1996 to 2009: outstanding year-end reserves position ........ 20
5. Impact of the 2009 shortfall in exports on GDP of major Asian economies .................... 36
6. Estimated multiplier effects of aggregate demand components ........................................ 38
7. Rates of economic growth and inflation of Asian and Pacific economies,in percentages, 2008 to 2010 ............................................................................................ 42
8. Rate of economic growth and inflation in East and North-East Asian economies,2008 to 2010 ...................................................................................................................... 61
9. Rate of economic growth and inflation in North and Central Asian economies,2008 to 2010 ...................................................................................................................... 70
10. Trade performance of North and Central Asian economies, in percentages,2007 to 2009 ...................................................................................................................... 73
11. Receipts of workers’ remittances in major North and Central Asian economies,2006 to 2008 ...................................................................................................................... 74
12. Rate of economic growth and inflation in countries in Oceania, 2008 to 2010 ............... 79
13. Recent international primary commodity prices, 2007 to 2009 ......................................... 84
14. Total visitor arrivals in selected Pacific island economies, in thousands of people,2004 to 2009 ...................................................................................................................... 85
15. Remittances inflows as a percentage of GDP in selected Pacific island economies,2000 to 2008 ...................................................................................................................... 86
16. Rate of economic growth and inflation in South and South-West Asian economies,2008 to 2010 ...................................................................................................................... 90
17. Rate of economic growth and inflation in South-East Asian economies,2008 to 2010 ...................................................................................................................... 101
18. Percentage changes of real GDP of major South-East Asian economies,year-on-year, 2007 to 2009 ................................................................................................ 103
xxiv
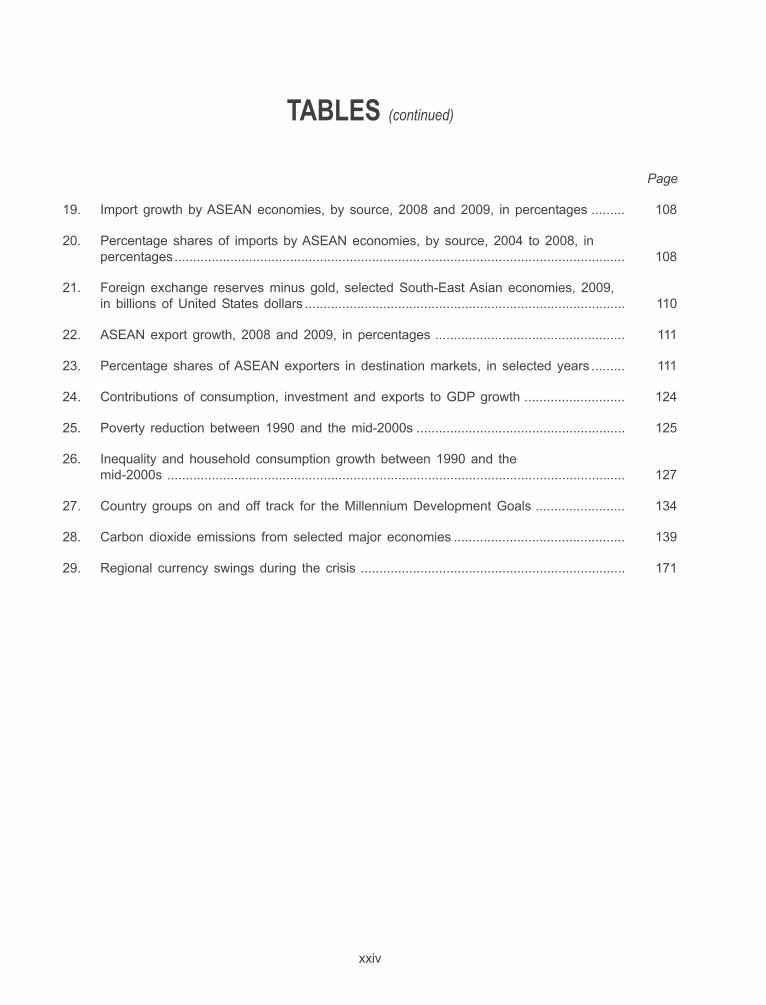
TABLES (continued)
Page
19. Import growth by ASEAN economies, by source, 2008 and 2009, in percentages ......... 108
20. Percentage shares of imports by ASEAN economies, by source, 2004 to 2008, inpercentages......................................................................................................................... 108
21. Foreign exchange reserves minus gold, selected South-East Asian economies, 2009,in billions of United States dollars ...................................................................................... 110
22. ASEAN export growth, 2008 and 2009, in percentages ................................................... 111
23. Percentage shares of ASEAN exporters in destination markets, in selected years ......... 111
24. Contributions of consumption, investment and exports to GDP growth ........................... 124
25. Poverty reduction between 1990 and the mid-2000s ........................................................ 125
26. Inequality and household consumption growth between 1990 and themid-2000s ........................................................................................................................... 127
27. Country groups on and off track for the Millennium Development Goals ........................ 134
28. Carbon dioxide emissions from selected major economies .............................................. 139
29. Regional currency swings during the crisis ....................................................................... 171
xxv
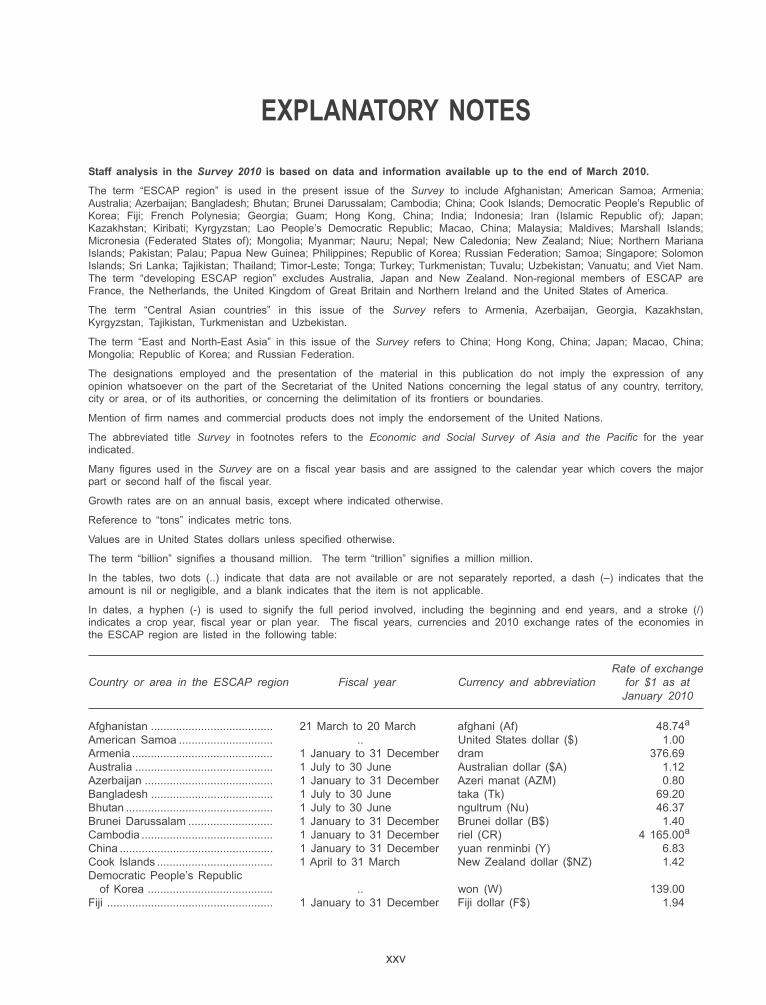
Staff analysis in the Survey 2010 is based on data and information available up to the end of March 2010.
The term “ESCAP region” is used in the present issue of the Survey to include Afghanistan; American Samoa; Armenia;Australia; Azerbaijan; Bangladesh; Bhutan; Brunei Darussalam; Cambodia; China; Cook Islands; Democratic People’s Republic ofKorea; Fiji; French Polynesia; Georgia; Guam; Hong Kong, China; India; Indonesia; Iran (Islamic Republic of); Japan;Kazakhstan; Kiribati; Kyrgyzstan; Lao People’s Democratic Republic; Macao, China; Malaysia; Maldives; Marshall Islands;Micronesia (Federated States of); Mongolia; Myanmar; Nauru; Nepal; New Caledonia; New Zealand; Niue; Northern MarianaIslands; Pakistan; Palau; Papua New Guinea; Philippines; Republic of Korea; Russian Federation; Samoa; Singapore; SolomonIslands; Sri Lanka; Tajikistan; Thailand; Timor-Leste; Tonga; Turkey; Turkmenistan; Tuvalu; Uzbekistan; Vanuatu; and Viet Nam.The term “developing ESCAP region” excludes Australia, Japan and New Zealand. Non-regional members of ESCAP areFrance, the Netherlands, the United Kingdom of Great Britain and Northern Ireland and the United States of America.
The term “Central Asian countries” in this issue of the Survey refers to Armenia, Azerbaijan, Georgia, Kazakhstan,Kyrgyzstan, Tajikistan, Turkmenistan and Uzbekistan.
The term “East and North-East Asia” in this issue of the Survey refers to China; Hong Kong, China; Japan; Macao, China;Mongolia; Republic of Korea; and Russian Federation.
The designations employed and the presentation of the material in this publication do not imply the expression of anyopinion whatsoever on the part of the Secretariat of the United Nations concerning the legal status of any country, territory,city or area, or of its authorities, or concerning the delimitation of its frontiers or boundaries.
Mention of firm names and commercial products does not imply the endorsement of the United Nations.
The abbreviated title Survey in footnotes refers to the Economic and Social Survey of Asia and the Pacific for the yearindicated.
Many figures used in the Survey are on a fiscal year basis and are assigned to the calendar year which covers the majorpart or second half of the fiscal year.
Growth rates are on an annual basis, except where indicated otherwise.
Reference to “tons” indicates metric tons.
Values are in United States dollars unless specified otherwise.
The term “billion” signifies a thousand million. The term “trillion” signifies a million million.
In the tables, two dots (..) indicate that data are not available or are not separately reported, a dash (–) indicates that theamount is nil or negligible, and a blank indicates that the item is not applicable.
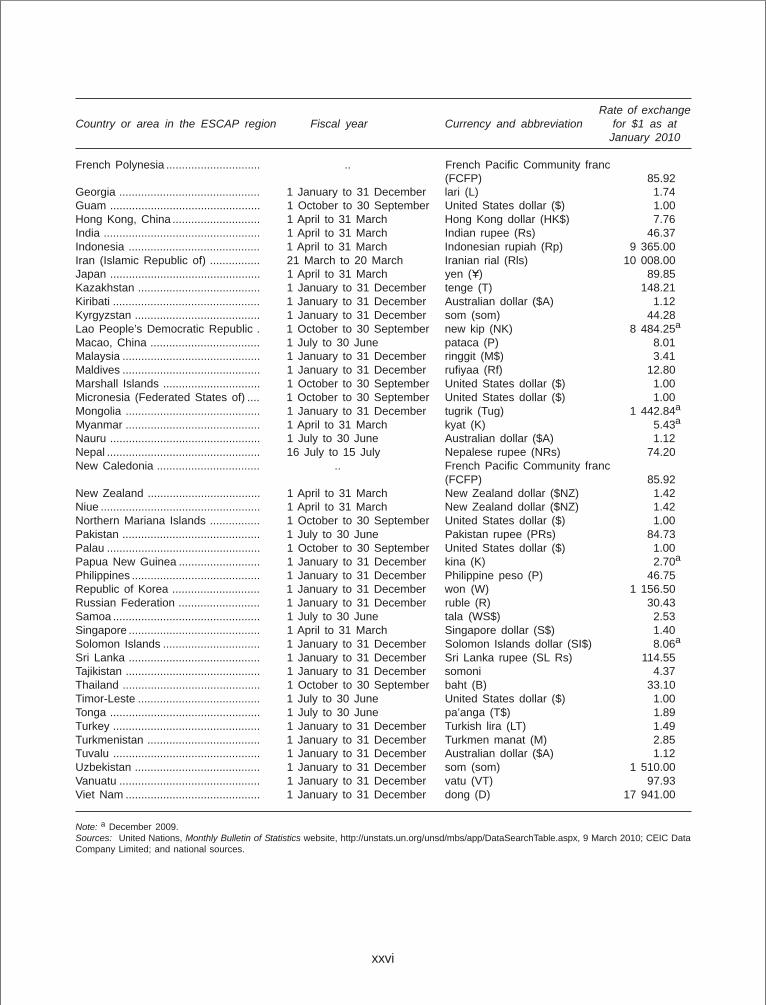
In dates, a hyphen (-) is used to signify the full period involved, including the beginning and end years, and a stroke (/)indicates a crop year, fiscal year or plan year. The fiscal years, currencies and 2010 exchange rates of the economies inthe ESCAP region are listed in the following table:
Rate of exchangeCountry or area in the ESCAP region Fiscal year Currency and abbreviation for $1 as at
January 2010
Afghanistan ....................................... 21 March to 20 March afghani (Af) 48.74a
American Samoa .............................. .. United States dollar ($) 1.00Armenia ............................................. 1 January to 31 December dram 376.69Australia ............................................ 1 July to 30 June Australian dollar ($A) 1.12Azerbaijan ......................................... 1 January to 31 December Azeri manat (AZM) 0.80Bangladesh ....................................... 1 July to 30 June taka (Tk) 69.20Bhutan ............................................... 1 July to 30 June ngultrum (Nu) 46.37Brunei Darussalam ........................... 1 January to 31 December Brunei dollar (B$) 1.40Cambodia .......................................... 1 January to 31 December riel (CR) 4 165.00a
China ................................................. 1 January to 31 December yuan renminbi (Y) 6.83Cook Islands ..................................... 1 April to 31 March New Zealand dollar ($NZ) 1.42Democratic People’s Republic
of Korea ........................................ .. won (W) 139.00Fiji ..................................................... 1 January to 31 December Fiji dollar (F$) 1.94
EXPLANATORY NOTES
xxvi
Rate of exchangeCountry or area in the ESCAP region Fiscal year Currency and abbreviation for $1 as at
January 2010
French Polynesia .............................. .. French Pacific Community franc(FCFP) 85.92
Georgia ............................................. 1 January to 31 December lari (L) 1.74Guam ................................................ 1 October to 30 September United States dollar ($) 1.00Hong Kong, China ............................ 1 April to 31 March Hong Kong dollar (HK$) 7.76India .................................................. 1 April to 31 March Indian rupee (Rs) 46.37Indonesia .......................................... 1 April to 31 March Indonesian rupiah (Rp) 9 365.00Iran (Islamic Republic of) ................ 21 March to 20 March Iranian rial (Rls) 10 008.00Japan ................................................ 1 April to 31 March yen (Y=) 89.85Kazakhstan ....................................... 1 January to 31 December tenge (T) 148.21Kiribati ............................................... 1 January to 31 December Australian dollar ($A) 1.12Kyrgyzstan ........................................ 1 January to 31 December som (som) 44.28Lao People’s Democratic Republic . 1 October to 30 September new kip (NK) 8 484.25a
Macao, China ................................... 1 July to 30 June pataca (P) 8.01Malaysia ............................................ 1 January to 31 December ringgit (M$) 3.41Maldives ............................................ 1 January to 31 December rufiyaa (Rf) 12.80Marshall Islands ............................... 1 October to 30 September United States dollar ($) 1.00Micronesia (Federated States of) .... 1 October to 30 September United States dollar ($) 1.00Mongolia ........................................... 1 January to 31 December tugrik (Tug) 1 442.84a
Myanmar ........................................... 1 April to 31 March kyat (K) 5.43a
Nauru ................................................ 1 July to 30 June Australian dollar ($A) 1.12Nepal ................................................. 16 July to 15 July Nepalese rupee (NRs) 74.20New Caledonia ................................. .. French Pacific Community franc
(FCFP) 85.92New Zealand .................................... 1 April to 31 March New Zealand dollar ($NZ) 1.42Niue ................................................... 1 April to 31 March New Zealand dollar ($NZ) 1.42Northern Mariana Islands ................ 1 October to 30 September United States dollar ($) 1.00Pakistan ............................................ 1 July to 30 June Pakistan rupee (PRs) 84.73Palau ................................................. 1 October to 30 September United States dollar ($) 1.00Papua New Guinea .......................... 1 January to 31 December kina (K) 2.70a
Philippines ......................................... 1 January to 31 December Philippine peso (P) 46.75Republic of Korea ............................ 1 January to 31 December won (W) 1 156.50Russian Federation .......................... 1 January to 31 December ruble (R) 30.43Samoa ............................................... 1 July to 30 June tala (WS$) 2.53Singapore .......................................... 1 April to 31 March Singapore dollar (S$) 1.40Solomon Islands ............................... 1 January to 31 December Solomon Islands dollar (SI$) 8.06a
Sri Lanka .......................................... 1 January to 31 December Sri Lanka rupee (SL Rs) 114.55Tajikistan ........................................... 1 January to 31 December somoni 4.37Thailand ............................................ 1 October to 30 September baht (B) 33.10Timor-Leste ....................................... 1 July to 30 June United States dollar ($) 1.00Tonga ................................................ 1 July to 30 June pa’anga (T$) 1.89Turkey ............................................... 1 January to 31 December Turkish lira (LT) 1.49Turkmenistan .................................... 1 January to 31 December Turkmen manat (M) 2.85Tuvalu ............................................... 1 January to 31 December Australian dollar ($A) 1.12Uzbekistan ........................................ 1 January to 31 December som (som) 1 510.00Vanuatu ............................................. 1 January to 31 December vatu (VT) 97.93Viet Nam ........................................... 1 January to 31 December dong (D) 17 941.00
Note: a December 2009.Sources: United Nations, Monthly Bulletin of Statistics website, http://unstats.un.org/unsd/mbs/app/DataSearchTable.aspx, 9 March 2010; CEIC DataCompany Limited; and national sources.
xxvii
AADMER ASEAN Agreement on Disaster Management and Emergency Response
ABMI Asian Bond Market Initiative
ADB Asian Development Bank
ADBI Asian Development Bank Institute
AFTA ASEAN Free Trade Agreement
APCAEM Asian and Pacific Centre for Agricultural Engineering and Machinery
APEC Asia-Pacific Economic Cooperation
APTA Asia-Pacific Trade Agreement
ASEAN Association of Southeast Asian Nations
BIMSTEC Bay of Bengal Initiative for Multi-Sectoral Technical and Economic Cooperation
BIS Bank for International Settlements
CAPSA Centre for Alleviation of Poverty through Secondary Crops’Development in Asia and the Pacific
c.i.f. cost, insurance, freight
CAREC Central Asia Regional Economic Cooperation Corridors
CD-ROM compact disk read-only memory
CEPEA comprehensive economic partnership of East Asia
CMI Chiang Mai Initiative
CNG compressed natural gas
CPI consumer price index
EAFTA East Asia Free Trade Agreement
EAS East Asia Summit
ECE Economic Commission for Europe
EIU Economist Intelligence Unit
ERIA Economic Research Institute of ASEAN and East Asia
EU European Union
EurAsEC Eurasian Economic Community
FAO Food and Agriculture Organization of the United Nations
FDI foreign direct investment
ABBREVIATIONS
xxviii
f.o.b. free on board
FTA Free trade area
GDP gross domestic product
GMS Greater Mekong Subregion
HIV Human immunodeficiency virus
ICT information and communication technology
ILO International Labour Organization
IMF International Monetary Fund
IPCC Intergovernmental Panel on Climate Change
MDG Millennium Development Goal
NGOs non-governmental organizations
NREGA National Rural Employment Guarantee Act
ODA official development assistance
OECD Organisation for Economic Cooperation and Development
PPP purchasing power parity
R&D research and development
SAARC South Asian Association for Regional Cooperation
SARS severe acute respiratory syndrome
SDRs special drawing rights
TRIPs Trade-Related Aspects of Intellectual Property Rights
UNCTAD United Nations Conference on Trade and Development
UNDP United Nations Development Programme
UNFCCC United Nations Framework Convention on Climate Change
WTO World Trade Organization
ABBREVIATIONS (continued)
xxix
(a) Page 1: an excerpt from the message of President Hu Jintao (China) at the APEC meeting onthe theme “Sustaining Growth, Connecting the Region” on 15 November 2009 (source: http://english.gov.cn/2009-11/15/content_1465068.htm).
(b) Page 55: an excerpt from the message of Prime Minister Manmohan Singh (India) at the G-20Meeting at Pittsburgh: Plenary Session, 25 September 2009 (source: http://pmindia.nic.in/speeches.htm).
(c) Page 113: an excerpt from a speech by President Susilo Bambang Yudhoyono (Indonesia),Speech at the APEC CEO Summit, Rebuilding the Global Economy: Crisis and Opportunity,Singapore, 13 November 2009 (source: http://www.globalentrepolis.com/downloads/PresidentSBYSpeech-CEOSummit.pdf).
(d) Page 145: an excerpt from a speech by Prime Minister Edward Natapei (Vanuatu), Speech atthe Global Economic Crisis Conference, Port Vila, Vanuatu, 10-12 February 2010 (source: http://vanuatu2010.un.org.fj/pages.cfm/press-corner/speeches-statements/speech-by-hon-edward-natapei-prime-minister-of-vanuatu.html).
(e) Page 177: an excerpt from a speech by Under-Secretary-General of the United Nations andExecutive Secretary of ESCAP, Noeleen Heyzer, Innovative Government: Innovation on theRoad To Economic Recovery in Singapore, 3 December 2009.
(f) Back cover: an excerpt from an article by BAN Ki-moon, Secretary-General of the UnitedNations, Daily News (Egypt), 4 July 2009 (source: http://www.un.org/sgarticleFull.asp?TID=103&Type=Op-Ed).
SOURCES OF QUOTATIONS


“We should all the more get united, follow the principle of openness, cooperation and mutual benefit, strengthen coordination and work together to secure the momentum of world economic recovery and promote balanced and orderly economic growth”
Hu JintaoPresident, People’s Republic of China

THE BEGINNINGS OFRECOVERY AND POLICY
RESPONSES 1
A year and a half after the global economic crisis hit Asian and Pacific shores, the region faces rapidly evolving challenges that underline the need for policy reforms geared to more inclusive and sustainable modes of economic growth. While the crisis did not originate here, Asian and Pacific economies have been significantly impacted because of their vulnerability to extraregional developments, primarily through trade and financial channels. This chapter reviews the differentiated impact of the crisis on countries and the challenges to recovery.
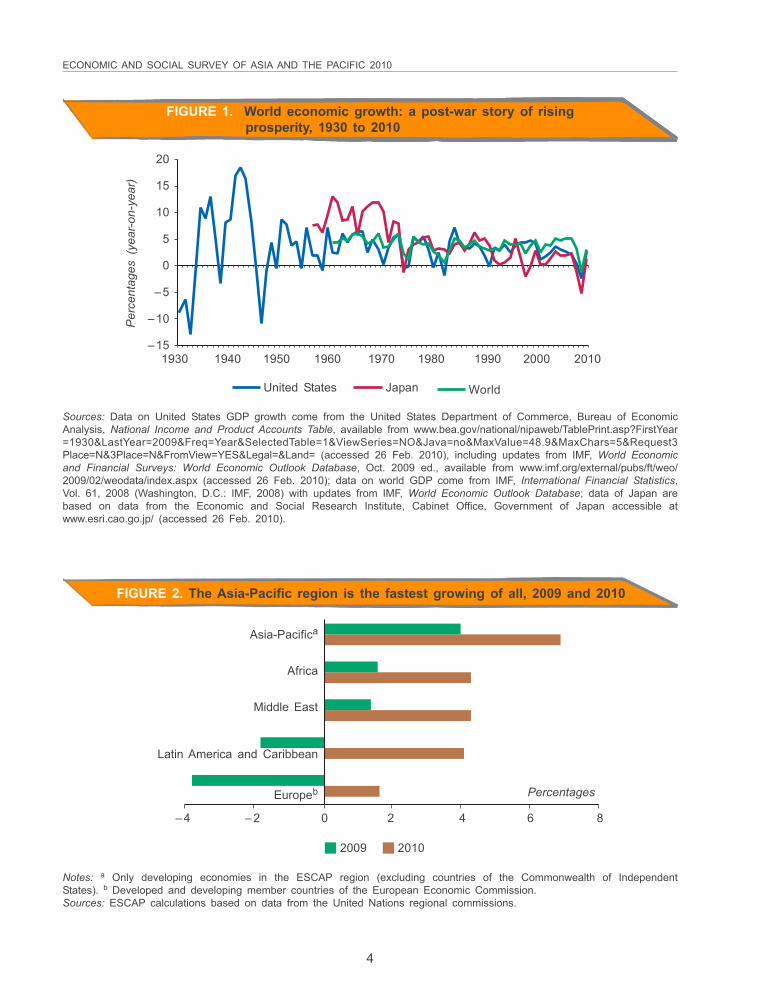
Some six decades of stable world economic growth had appeared to confirm that policymakers had mastered the art of fine-tuning countercyclical policies (figure 1). Then in 2008 financial crisis propelled a synchronized decline in world economic growth, calling into question many of the premises on which market economies had functioned since the Second World War.
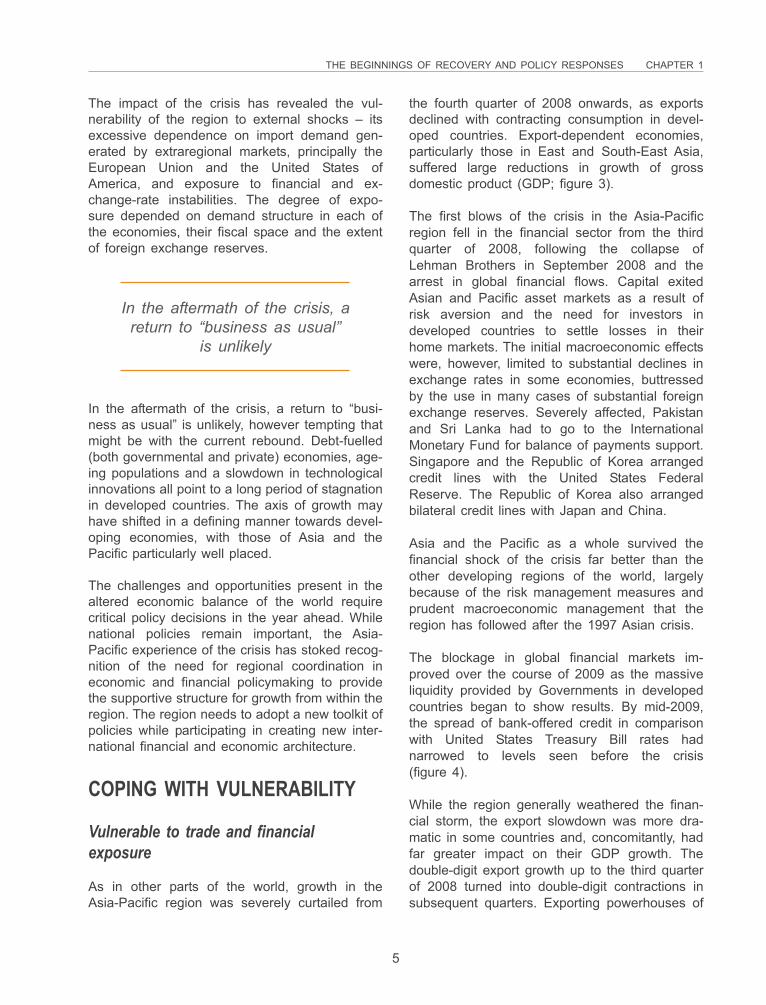
Policy response at the global level was swift and unprecedented in size. Financial meltdown was averted. Emerging from the crisis, Asian and Pacific economies have shown greater resilience with faster and higher growth than have the developed world and all the other developing regions (figure 2).
ECONOMIC AND SOCIAL SURVEY OF ASIA AND THE PACIFIC 2010
4
FIGURE 1. World economic growth: a post-war story of risingprosperity, 1930 to 2010
20
15
10
5
0
–5
–10
–15
Per
cent
ages
(ye
ar-o
n-ye
ar)
1930 1940 1950 1960 1970 1980 1990 2000 2010
United States Japan World
FIGURE 2. The Asia-Pacific region is the fastest growing of all, 2009 and 2010
Asia-Pacifica
Africa
Middle East
Latin America and Caribbean
Europeb
2009 2010
–4 –2 0 2 4 6 8
Percentages
Sources: Data on United States GDP growth come from the United States Department of Commerce, Bureau of EconomicAnalysis, National Income and Product Accounts Table, available from www.bea.gov/national/nipaweb/TablePrint.asp?FirstYear=1930&LastYear=2009&Freq=Year&SelectedTable=1&ViewSeries=NO&Java=no&MaxValue=48.9&MaxChars=5&Request3Place=N&3Place=N&FromView=YES&Legal=&Land= (accessed 26 Feb. 2010), including updates from IMF, World Economicand Financial Surveys: World Economic Outlook Database, Oct. 2009 ed., available from www.imf.org/external/pubs/ft/weo/2009/02/weodata/index.aspx (accessed 26 Feb. 2010); data on world GDP come from IMF, International Financial Statistics,Vol. 61, 2008 (Washington, D.C.: IMF, 2008) with updates from IMF, World Economic Outlook Database; data of Japan arebased on data from the Economic and Social Research Institute, Cabinet Office, Government of Japan accessible atwww.esri.cao.go.jp/ (accessed 26 Feb. 2010).
Notes: a Only developing economies in the ESCAP region (excluding countries of the Commonwealth of IndependentStates). b Developed and developing member countries of the European Economic Commission.Sources: ESCAP calculations based on data from the United Nations regional commissions.
THE BEGINNINGS OF RECOVERY AND POLICY RESPONSES CHAPTER 1
5
The impact of the crisis has revealed the vul-nerability of the region to external shocks – itsexcessive dependence on import demand gen-erated by extraregional markets, principally theEuropean Union and the United States ofAmerica, and exposure to financial and ex-change-rate instabilities. The degree of expo-sure depended on demand structure in each ofthe economies, their fiscal space and the extentof foreign exchange reserves.
the fourth quarter of 2008 onwards, as exportsdeclined with contracting consumption in devel-oped countries. Export-dependent economies,particularly those in East and South-East Asia,suffered large reductions in growth of grossdomestic product (GDP; figure 3).
The first blows of the crisis in the Asia-Pacificregion fell in the financial sector from the thirdquarter of 2008, following the collapse ofLehman Brothers in September 2008 and thearrest in global financial flows. Capital exitedAsian and Pacific asset markets as a result ofrisk aversion and the need for investors indeveloped countries to settle losses in theirhome markets. The initial macroeconomic effectswere, however, limited to substantial declines inexchange rates in some economies, buttressedby the use in many cases of substantial foreignexchange reserves. Severely affected, Pakistanand Sri Lanka had to go to the InternationalMonetary Fund for balance of payments support.Singapore and the Republic of Korea arrangedcredit lines with the United States FederalReserve. The Republic of Korea also arrangedbilateral credit lines with Japan and China.
Asia and the Pacific as a whole survived thefinancial shock of the crisis far better than theother developing regions of the world, largelybecause of the risk management measures andprudent macroeconomic management that theregion has followed after the 1997 Asian crisis.
The blockage in global financial markets im-proved over the course of 2009 as the massiveliquidity provided by Governments in developedcountries began to show results. By mid-2009,the spread of bank-offered credit in comparisonwith United States Treasury Bill rates hadnarrowed to levels seen before the crisis(figure 4).
While the region generally weathered the finan-cial storm, the export slowdown was more dra-matic in some countries and, concomitantly, hadfar greater impact on their GDP growth. Thedouble-digit export growth up to the third quarterof 2008 turned into double-digit contractions insubsequent quarters. Exporting powerhouses of
In the aftermath of the crisis, areturn to “business as usual”
is unlikely
In the aftermath of the crisis, a return to “busi-ness as usual” is unlikely, however tempting thatmight be with the current rebound. Debt-fuelled(both governmental and private) economies, age-ing populations and a slowdown in technologicalinnovations all point to a long period of stagnationin developed countries. The axis of growth mayhave shifted in a defining manner towards devel-oping economies, with those of Asia and thePacific particularly well placed.
The challenges and opportunities present in thealtered economic balance of the world requirecritical policy decisions in the year ahead. Whilenational policies remain important, the Asia-Pacific experience of the crisis has stoked recog-nition of the need for regional coordination ineconomic and financial policymaking to providethe supportive structure for growth from within theregion. The region needs to adopt a new toolkit ofpolicies while participating in creating new inter-national financial and economic architecture.
COPING WITH VULNERABILITY
Vulnerable to trade and financialexposure
As in other parts of the world, growth in theAsia-Pacific region was severely curtailed from
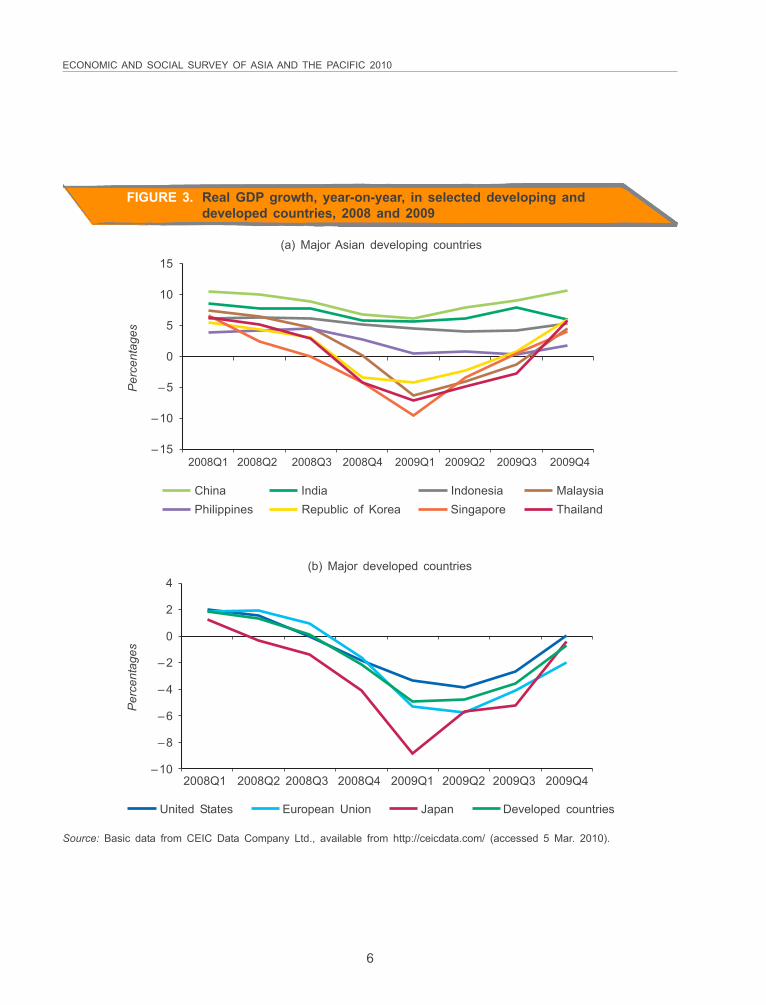
ECONOMIC AND SOCIAL SURVEY OF ASIA AND THE PACIFIC 2010
6
(a) Major Asian developing countries15
10
5
0
–5
–10
–15
Per
cent
ages
2008Q1 2008Q2 2008Q3 2008Q4 2009Q1 2009Q2 2009Q3 2009Q4
China India Indonesia MalaysiaPhilippines Republic of Korea Singapore Thailand
(b) Major developed countries4
2
0
–2
–4
–6
–8
–10
Per
cent
ages
2008Q1 2008Q2 2008Q3 2008Q4 2009Q1 2009Q2 2009Q3 2009Q4
United States European Union Japan Developed countries
Source: Basic data from CEIC Data Company Ltd., available from http://ceicdata.com/ (accessed 5 Mar. 2010).
FIGURE 3. Real GDP growth, year-on-year, in selected developing anddeveloped countries, 2008 and 2009
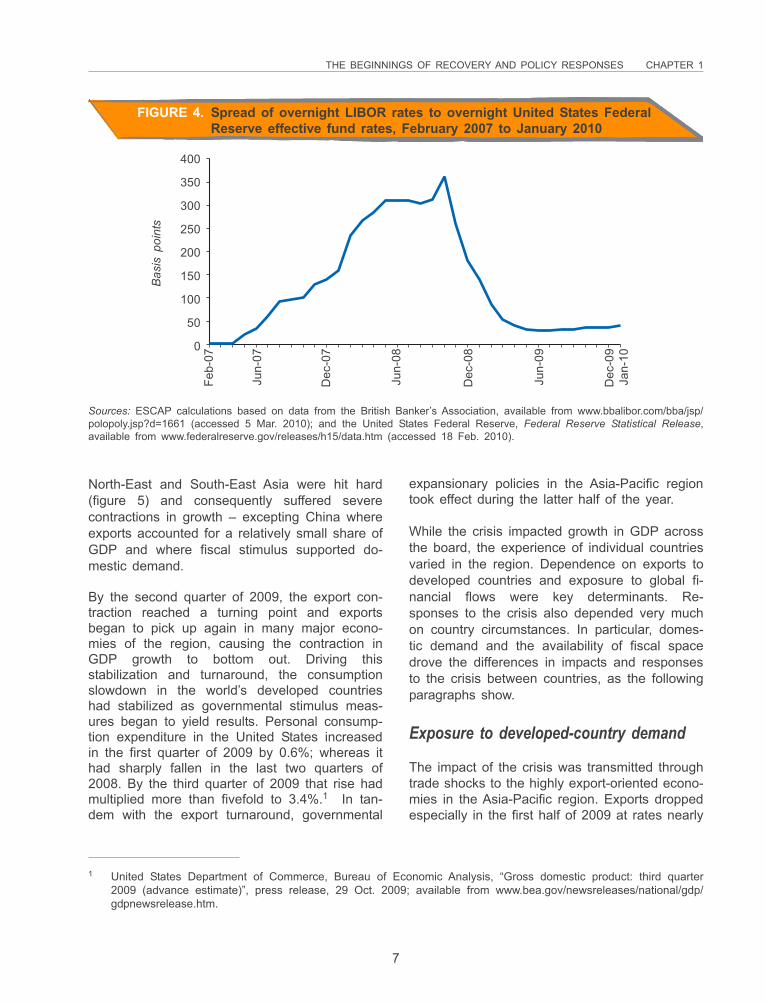
THE BEGINNINGS OF RECOVERY AND POLICY RESPONSES CHAPTER 1
7
FIGURE 4. Spread of overnight LIBOR rates to overnight United States FederalReserve effective fund rates, February 2007 to January 2010
400
350
300
250
200
150
100
50
0
Bas
is p
oint
s
Feb-
07
Jun-
07
Dec
-07
Jun-
08
Dec
-08
Jun-
09
Dec
-09
Jan-
10
Sources: ESCAP calculations based on data from the British Banker’s Association, available from www.bbalibor.com/bba/jsp/polopoly.jsp?d=1661 (accessed 5 Mar. 2010); and the United States Federal Reserve, Federal Reserve Statistical Release,available from www.federalreserve.gov/releases/h15/data.htm (accessed 18 Feb. 2010).
North-East and South-East Asia were hit hard(figure 5) and consequently suffered severecontractions in growth – excepting China whereexports accounted for a relatively small share ofGDP and where fiscal stimulus supported do-mestic demand.
By the second quarter of 2009, the export con-traction reached a turning point and exportsbegan to pick up again in many major econo-mies of the region, causing the contraction inGDP growth to bottom out. Driving thisstabilization and turnaround, the consumptionslowdown in the world’s developed countrieshad stabilized as governmental stimulus meas-ures began to yield results. Personal consump-tion expenditure in the United States increasedin the first quarter of 2009 by 0.6%; whereas ithad sharply fallen in the last two quarters of2008. By the third quarter of 2009 that rise hadmultiplied more than fivefold to 3.4%.1 In tan-dem with the export turnaround, governmental
expansionary policies in the Asia-Pacific regiontook effect during the latter half of the year.
While the crisis impacted growth in GDP acrossthe board, the experience of individual countriesvaried in the region. Dependence on exports todeveloped countries and exposure to global fi-nancial flows were key determinants. Re-sponses to the crisis also depended very muchon country circumstances. In particular, domes-tic demand and the availability of fiscal spacedrove the differences in impacts and responsesto the crisis between countries, as the followingparagraphs show.
Exposure to developed-country demand
The impact of the crisis was transmitted throughtrade shocks to the highly export-oriented econo-mies in the Asia-Pacific region. Exports droppedespecially in the first half of 2009 at rates nearly
1 United States Department of Commerce, Bureau of Economic Analysis, “Gross domestic product: third quarter2009 (advance estimate)”, press release, 29 Oct. 2009; available from www.bea.gov/newsreleases/national/gdp/gdpnewsrelease.htm.
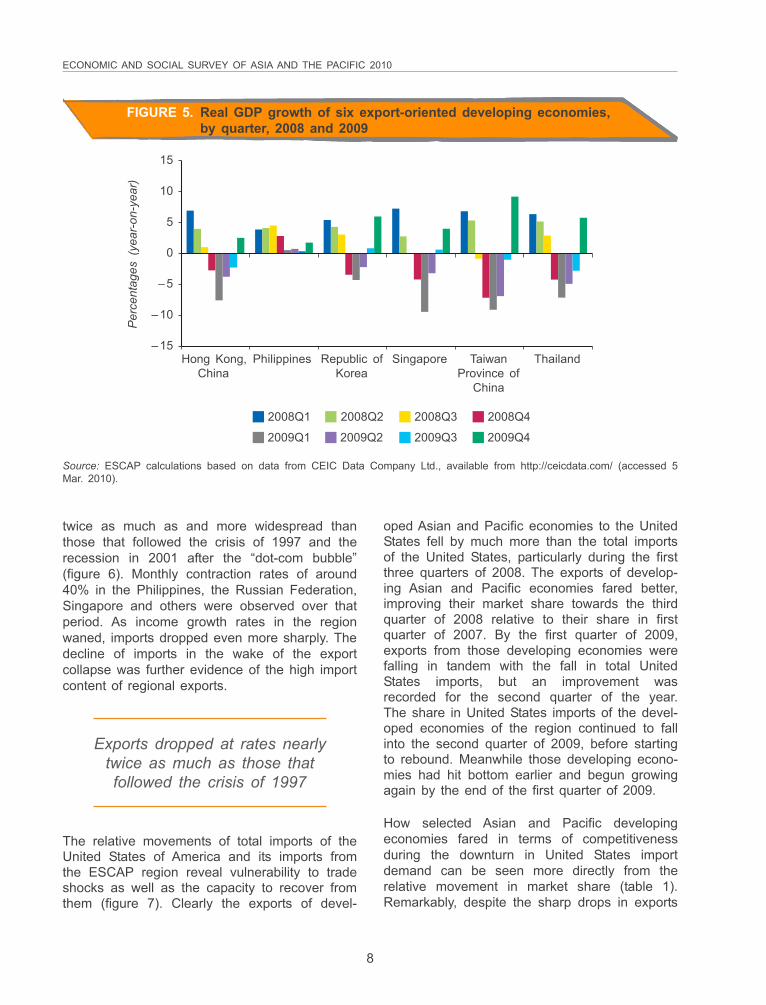
ECONOMIC AND SOCIAL SURVEY OF ASIA AND THE PACIFIC 2010
8
twice as much as and more widespread thanthose that followed the crisis of 1997 and therecession in 2001 after the “dot-com bubble”(figure 6). Monthly contraction rates of around40% in the Philippines, the Russian Federation,Singapore and others were observed over thatperiod. As income growth rates in the regionwaned, imports dropped even more sharply. Thedecline of imports in the wake of the exportcollapse was further evidence of the high importcontent of regional exports.
oped Asian and Pacific economies to the UnitedStates fell by much more than the total importsof the United States, particularly during the firstthree quarters of 2008. The exports of develop-ing Asian and Pacific economies fared better,improving their market share towards the thirdquarter of 2008 relative to their share in firstquarter of 2007. By the first quarter of 2009,exports from those developing economies werefalling in tandem with the fall in total UnitedStates imports, but an improvement wasrecorded for the second quarter of the year.The share in United States imports of the devel-oped economies of the region continued to fallinto the second quarter of 2009, before startingto rebound. Meanwhile those developing econo-mies had hit bottom earlier and begun growingagain by the end of the first quarter of 2009.
How selected Asian and Pacific developingeconomies fared in terms of competitivenessduring the downturn in United States importdemand can be seen more directly from therelative movement in market share (table 1).Remarkably, despite the sharp drops in exports
FIGURE 5. Real GDP growth of six export-oriented developing economies,by quarter, 2008 and 2009
15
10
5
0
–5
–10
–15
Per
cent
ages
(ye
ar-o
n-ye
ar)
Hong Kong, Philippines Republic of Singapore Taiwan ThailandChina Korea Province of
China
2008Q1 2008Q2 2008Q3 2008Q4
2009Q1 2009Q2 2009Q3 2009Q4
Source: ESCAP calculations based on data from CEIC Data Company Ltd., available from http://ceicdata.com/ (accessed 5Mar. 2010).
Exports dropped at rates nearlytwice as much as those thatfollowed the crisis of 1997
The relative movements of total imports of theUnited States of America and its imports fromthe ESCAP region reveal vulnerability to tradeshocks as well as the capacity to recover fromthem (figure 7). Clearly the exports of devel-
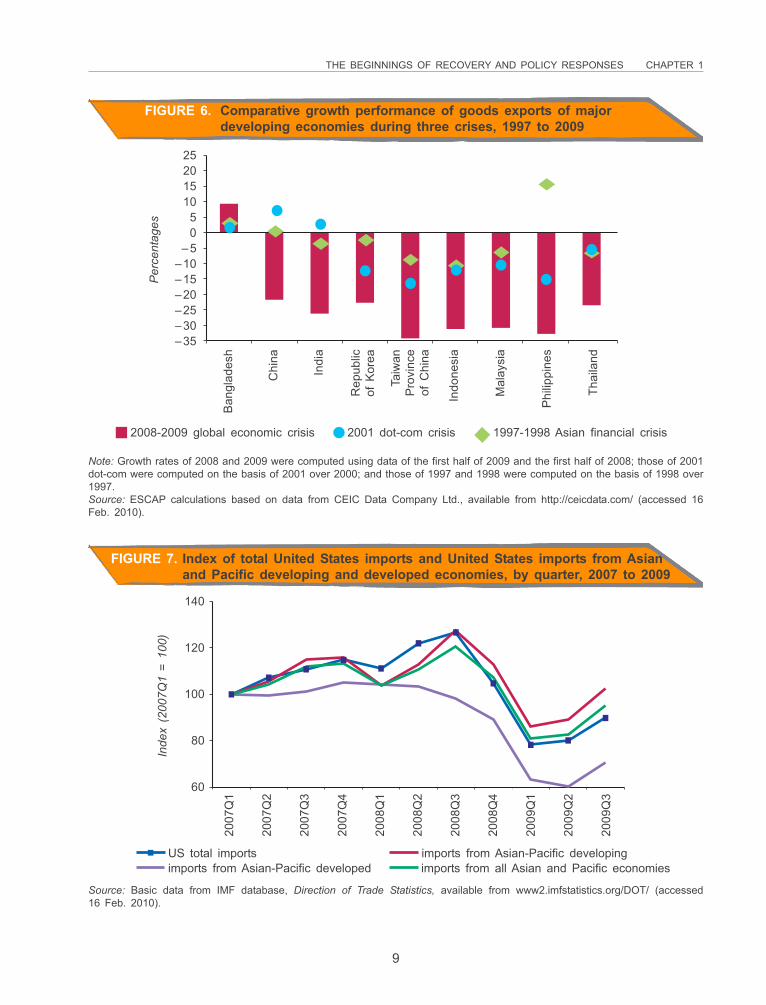
THE BEGINNINGS OF RECOVERY AND POLICY RESPONSES CHAPTER 1
9
FIGURE 6. Comparative growth performance of goods exports of majordeveloping economies during three crises, 1997 to 2009
25201510
50
–5–10–15–20–25–30–35
Per
cent
ages
Ban
glad
esh
Chi
na
Indi
a
Rep
ublic
of K
orea
Taiw
anP
rovi
nce
of C
hina
Indo
nesi
a
Mal
aysi
a
Phi
lippi
nes
Thai
land
2008-2009 global economic crisis 2001 dot-com crisis 1997-1998 Asian financial crisis
Note: Growth rates of 2008 and 2009 were computed using data of the first half of 2009 and the first half of 2008; those of 2001dot-com were computed on the basis of 2001 over 2000; and those of 1997 and 1998 were computed on the basis of 1998 over1997.Source: ESCAP calculations based on data from CEIC Data Company Ltd., available from http://ceicdata.com/ (accessed 16Feb. 2010).
FIGURE 7. Index of total United States imports and United States imports from Asianand Pacific developing and developed economies, by quarter, 2007 to 2009
140
120
100
80
60
Inde
x (2
007Q
1 =
100)
2007
Q1
2007
Q2
2007
Q3
2007
Q4
2008
Q1
2008
Q2
2008
Q3
2008
Q4
2009
Q1
2009
Q2
2009
Q3
US total importsimports from Asian-Pacific developed
imports from Asian-Pacific developingimports from all Asian and Pacific economies
Source: Basic data from IMF database, Direction of Trade Statistics, available from www2.imfstatistics.org/DOT/ (accessed16 Feb. 2010).
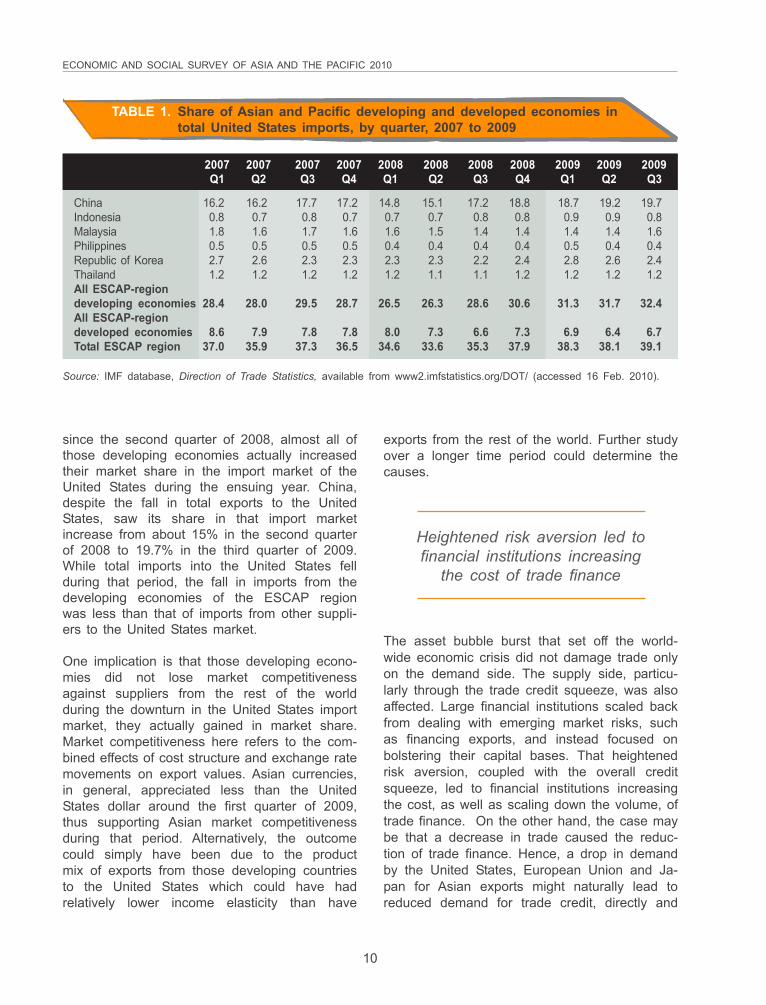
ECONOMIC AND SOCIAL SURVEY OF ASIA AND THE PACIFIC 2010
10
since the second quarter of 2008, almost all ofthose developing economies actually increasedtheir market share in the import market of theUnited States during the ensuing year. China,despite the fall in total exports to the UnitedStates, saw its share in that import marketincrease from about 15% in the second quarterof 2008 to 19.7% in the third quarter of 2009.While total imports into the United States fellduring that period, the fall in imports from thedeveloping economies of the ESCAP regionwas less than that of imports from other suppli-ers to the United States market.
One implication is that those developing econo-mies did not lose market competitivenessagainst suppliers from the rest of the worldduring the downturn in the United States importmarket, they actually gained in market share.Market competitiveness here refers to the com-bined effects of cost structure and exchange ratemovements on export values. Asian currencies,in general, appreciated less than the UnitedStates dollar around the first quarter of 2009,thus supporting Asian market competitivenessduring that period. Alternatively, the outcomecould simply have been due to the productmix of exports from those developing countriesto the United States which could have hadrelatively lower income elasticity than have
The asset bubble burst that set off the world-wide economic crisis did not damage trade onlyon the demand side. The supply side, particu-larly through the trade credit squeeze, was alsoaffected. Large financial institutions scaled backfrom dealing with emerging market risks, suchas financing exports, and instead focused onbolstering their capital bases. That heightenedrisk aversion, coupled with the overall creditsqueeze, led to financial institutions increasingthe cost, as well as scaling down the volume, oftrade finance. On the other hand, the case maybe that a decrease in trade caused the reduc-tion of trade finance. Hence, a drop in demandby the United States, European Union and Ja-pan for Asian exports might naturally lead toreduced demand for trade credit, directly and
TABLE 1. Share of Asian and Pacific developing and developed economies intotal United States imports, by quarter, 2007 to 2009
2007 2007 2007 2007 2008 2008 2008 2008 2009 2009 2009Q1 Q2 Q3 Q4 Q1 Q2 Q3 Q4 Q1 Q2 Q3
China 16.2 16.2 17.7 17.2 14.8 15.1 17.2 18.8 18.7 19.2 19.7Indonesia 0.8 0.7 0.8 0.7 0.7 0.7 0.8 0.8 0.9 0.9 0.8Malaysia 1.8 1.6 1.7 1.6 1.6 1.5 1.4 1.4 1.4 1.4 1.6Philippines 0.5 0.5 0.5 0.5 0.4 0.4 0.4 0.4 0.5 0.4 0.4Republic of Korea 2.7 2.6 2.3 2.3 2.3 2.3 2.2 2.4 2.8 2.6 2.4Thailand 1.2 1.2 1.2 1.2 1.2 1.1 1.1 1.2 1.2 1.2 1.2All ESCAP-regiondeveloping economies 28.4 28.0 29.5 28.7 26.5 26.3 28.6 30.6 31.3 31.7 32.4All ESCAP-regiondeveloped economies 8.6 7.9 7.8 7.8 8.0 7.3 6.6 7.3 6.9 6.4 6.7Total ESCAP region 37.0 35.9 37.3 36.5 34.6 33.6 35.3 37.9 38.3 38.1 39.1
Source: IMF database, Direction of Trade Statistics, available from www2.imfstatistics.org/DOT/ (accessed 16 Feb. 2010).
Heightened risk aversion led tofinancial institutions increasing
the cost of trade finance
exports from the rest of the world. Further studyover a longer time period could determine thecauses.
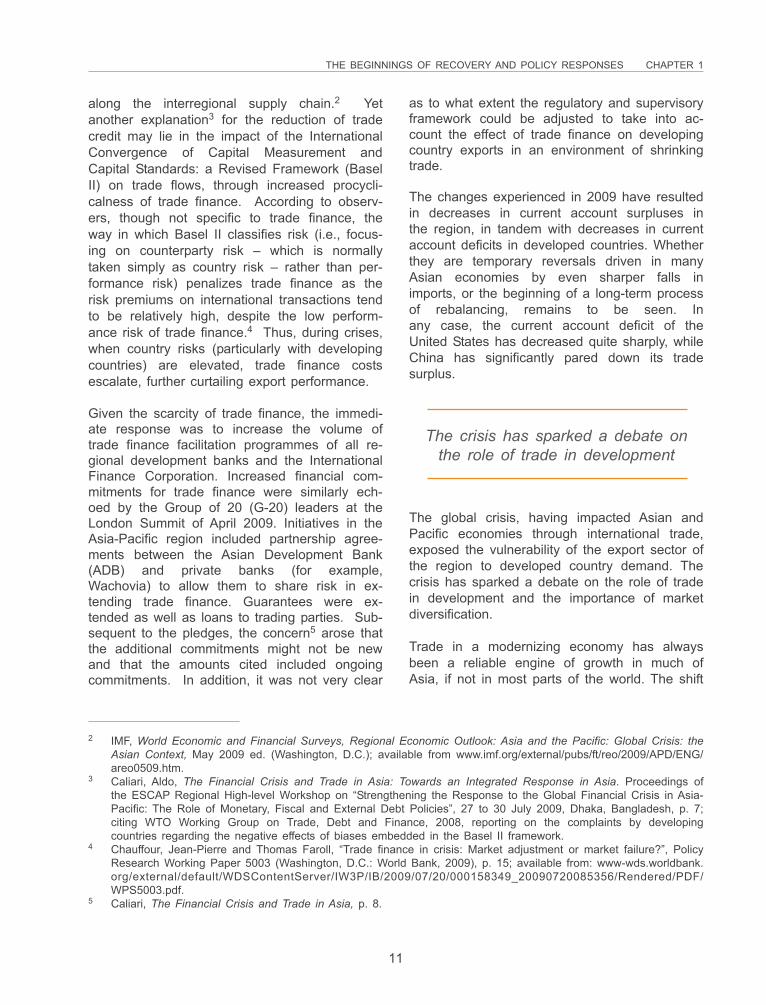
THE BEGINNINGS OF RECOVERY AND POLICY RESPONSES CHAPTER 1
11
along the interregional supply chain.2 Yetanother explanation3 for the reduction of tradecredit may lie in the impact of the InternationalConvergence of Capital Measurement andCapital Standards: a Revised Framework (BaselII) on trade flows, through increased procycli-calness of trade finance. According to observ-ers, though not specific to trade finance, theway in which Basel II classifies risk (i.e., focus-ing on counterparty risk – which is normallytaken simply as country risk – rather than per-formance risk) penalizes trade finance as therisk premiums on international transactions tendto be relatively high, despite the low perform-ance risk of trade finance.4 Thus, during crises,when country risks (particularly with developingcountries) are elevated, trade finance costsescalate, further curtailing export performance.
Given the scarcity of trade finance, the immedi-ate response was to increase the volume oftrade finance facilitation programmes of all re-gional development banks and the InternationalFinance Corporation. Increased financial com-mitments for trade finance were similarly ech-oed by the Group of 20 (G-20) leaders at theLondon Summit of April 2009. Initiatives in theAsia-Pacific region included partnership agree-ments between the Asian Development Bank(ADB) and private banks (for example,Wachovia) to allow them to share risk in ex-tending trade finance. Guarantees were ex-tended as well as loans to trading parties. Sub-sequent to the pledges, the concern5 arose thatthe additional commitments might not be newand that the amounts cited included ongoingcommitments. In addition, it was not very clear
as to what extent the regulatory and supervisoryframework could be adjusted to take into ac-count the effect of trade finance on developingcountry exports in an environment of shrinkingtrade.
The changes experienced in 2009 have resultedin decreases in current account surpluses inthe region, in tandem with decreases in currentaccount deficits in developed countries. Whetherthey are temporary reversals driven in manyAsian economies by even sharper falls inimports, or the beginning of a long-term processof rebalancing, remains to be seen. Inany case, the current account deficit of theUnited States has decreased quite sharply, whileChina has significantly pared down its tradesurplus.
2 IMF, World Economic and Financial Surveys, Regional Economic Outlook: Asia and the Pacific: Global Crisis: theAsian Context, May 2009 ed. (Washington, D.C.); available from www.imf.org/external/pubs/ft/reo/2009/APD/ENG/areo0509.htm.
3 Caliari, Aldo, The Financial Crisis and Trade in Asia: Towards an Integrated Response in Asia. Proceedings ofthe ESCAP Regional High-level Workshop on “Strengthening the Response to the Global Financial Crisis in Asia-Pacific: The Role of Monetary, Fiscal and External Debt Policies”, 27 to 30 July 2009, Dhaka, Bangladesh, p. 7;citing WTO Working Group on Trade, Debt and Finance, 2008, reporting on the complaints by developingcountries regarding the negative effects of biases embedded in the Basel II framework.
4 Chauffour, Jean-Pierre and Thomas Faroll, “Trade finance in crisis: Market adjustment or market failure?”, PolicyResearch Working Paper 5003 (Washington, D.C.: World Bank, 2009), p. 15; available from: www-wds.worldbank.org/external/default/WDSContentServer/IW3P/IB/2009/07/20/000158349_20090720085356/Rendered/PDF/WPS5003.pdf.
5 Caliari, The Financial Crisis and Trade in Asia, p. 8.
The global crisis, having impacted Asian andPacific economies through international trade,exposed the vulnerability of the export sector ofthe region to developed country demand. Thecrisis has sparked a debate on the role of tradein development and the importance of marketdiversification.
Trade in a modernizing economy has alwaysbeen a reliable engine of growth in much ofAsia, if not in most parts of the world. The shift
The crisis has sparked a debate onthe role of trade in development
ECONOMIC AND SOCIAL SURVEY OF ASIA AND THE PACIFIC 2010
12
to export-led industrialization, epitomized by the“Asian Tigers”, created a demonstration effect inmost of developing Asia. Over the 40 yearsfrom 1956 to 1996, the per capita incomes ofthe “rapidly integrating economies”6 of Asia grewby 5%, in comparison with the world average of1.9%.7
Furthermore, during the 1997 crisis, the affectedAsian economies managed to export their wayto recovery. Innovative production schemes likethe regional tie-in to global supply chains funda-mentally changed the composition of trade aswell as its direction. The strategy paid off be-cause the erstwhile growth engine of the world,the United States, maintained robust demand.Historically, growth in trade in goods has alwaysoutstripped global output growth.
Unfortunately, the reverse has also held true. Asglobal growth has moved into negative territory,trade has plummeted more sharply. For somesectors the downturn will be harder to overcomethan in the past. Since the global economy isinterlinked through trade more than ever before,the impact of a fall in output on trade hasbecome magnified. Empirical estimates8 put theelasticity of world trade to output at 3.35, fromunder 2 in the 1960s. East Asia has the largestelasticity for the 12 years from 1995 to 2007,as well as the largest increase in elasticitycompared to the 12-year period 1982 to 1994.With export elasticity to global growth at 4.45,the East Asian trading sector is indeed verysensitive to changes in global growth relative toother regions in the world.
What could account for the increasingly higherelasticity measures of the current decade incomparison with the earlier periods? Some ob-
servers9 say that the structure of the globalproduction chains exacerbates the decline inmerchandise trade during recessions. Trade fi-nance might be able to provide another, partialexplanation of why trade has contracted muchmore than global output.
6 The ADB characterization of “integrating Asia” comprises the 10 countries of ASEAN and China, India, Japan,the Republic of Korea, Taiwan Province of China and Hong Kong, China.
7 ADB, Emerging Asian Regionalism: A Partnership for Shared Prosperity (Manila, 2008), p. 27; available fromwww.aric.adb.org/emergingasianregionalism (accessed 12 Oct. 2009).
8 Freund, Caroline, “The trade response to global downturns: Historical evidence”, Policy Research Working Paper5015 (Washington, D.C.: The World Bank, 2009), p. 6; available from http://econ.worldbank.org.
9 Freund, “The trade response to global downturns”, p. 9.10 UNCTAD, Trade and Development Report 2003: Capital Accumulation, Growth and Structural Change, (United
Nations publication, Sales No. E.03.II.D.7), p. 49.
The responsiveness of trade toa global downturn depends
on the mix of products
Given the fragmentation in production systems,countries increasingly specialize in a particularprocess or component (that is, intermediateproducts) rather than a whole or final product.Countries that want to export such productsneed to import the parts and components. Forexample, China imports semiconductors fromMalaysia, hard disks from the Philippines andother components from elsewhere, and assem-bles them into computers that are shipped tothe United States. Chinese imports and exportsare thus higher than if China were to producethe computers wholly from within its borders. Sothe responsiveness of trade of a country to aglobal downturn depends, in part, on its mix ofproducts. The greater the proportion of productsdestined for exports that need imported inputs,the more sensitive the trading sector is tochanges in global incomes. Such trade amongcountries linked through international productionnetworks tends to be “double-counted” intrade statistics10 as corroborated by the rapidincreases in manufactured imports and exportsin countries, such as China and Malaysia, thatare heavily involved in international productionnetworks.
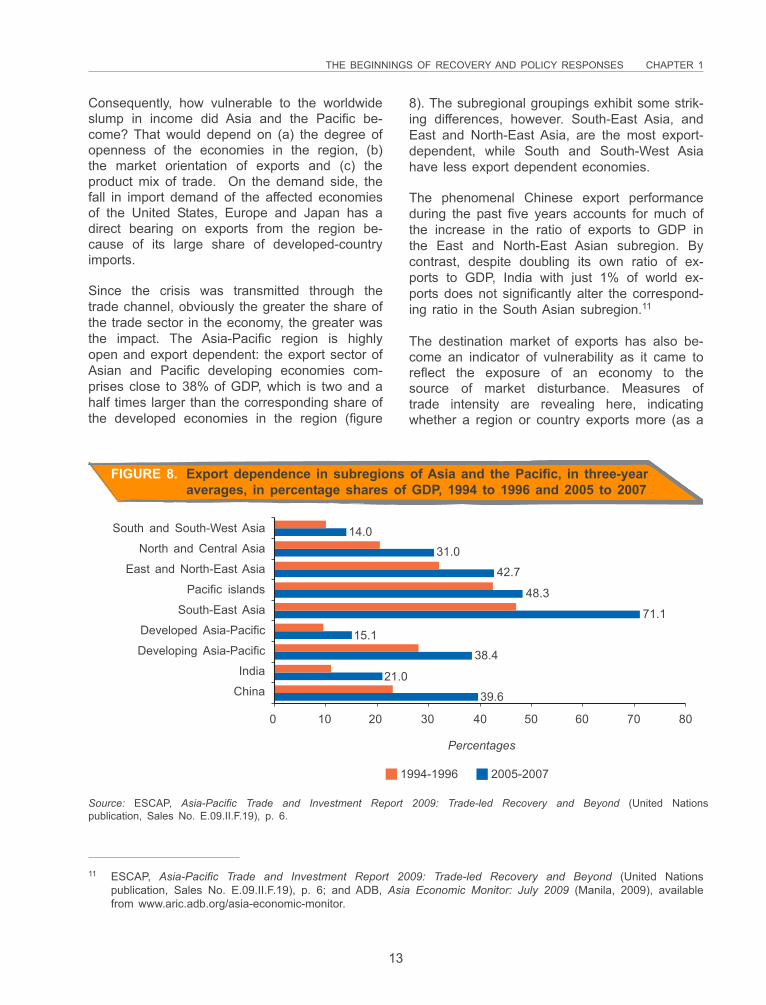
THE BEGINNINGS OF RECOVERY AND POLICY RESPONSES CHAPTER 1
13
Consequently, how vulnerable to the worldwideslump in income did Asia and the Pacific be-come? That would depend on (a) the degree ofopenness of the economies in the region, (b)the market orientation of exports and (c) theproduct mix of trade. On the demand side, thefall in import demand of the affected economiesof the United States, Europe and Japan has adirect bearing on exports from the region be-cause of its large share of developed-countryimports.
Since the crisis was transmitted through thetrade channel, obviously the greater the share ofthe trade sector in the economy, the greater wasthe impact. The Asia-Pacific region is highlyopen and export dependent: the export sector ofAsian and Pacific developing economies com-prises close to 38% of GDP, which is two and ahalf times larger than the corresponding share ofthe developed economies in the region (figure
8). The subregional groupings exhibit some strik-ing differences, however. South-East Asia, andEast and North-East Asia, are the most export-dependent, while South and South-West Asiahave less export dependent economies.
The phenomenal Chinese export performanceduring the past five years accounts for much ofthe increase in the ratio of exports to GDP inthe East and North-East Asian subregion. Bycontrast, despite doubling its own ratio of ex-ports to GDP, India with just 1% of world ex-ports does not significantly alter the correspond-ing ratio in the South Asian subregion.11
The destination market of exports has also be-come an indicator of vulnerability as it came toreflect the exposure of an economy to thesource of market disturbance. Measures oftrade intensity are revealing here, indicatingwhether a region or country exports more (as a
11 ESCAP, Asia-Pacific Trade and Investment Report 2009: Trade-led Recovery and Beyond (United Nationspublication, Sales No. E.09.II.F.19), p. 6; and ADB, Asia Economic Monitor: July 2009 (Manila, 2009), availablefrom www.aric.adb.org/asia-economic-monitor.
FIGURE 8. Export dependence in subregions of Asia and the Pacific, in three-yearaverages, in percentage shares of GDP, 1994 to 1996 and 2005 to 2007
South and South-West Asia
North and Central Asia
East and North-East Asia
Pacific islands
South-East Asia
Developed Asia-Pacific
Developing Asia-Pacific
India
China
0 10 20 30 40 50 60 70 80
Percentages
2005-20071994-1996
14.0
31.0
42.7
48.3
71.1
15.1
38.4
21.0
39.6
Source: ESCAP, Asia-Pacific Trade and Investment Report 2009: Trade-led Recovery and Beyond (United Nationspublication, Sales No. E.09.II.F.19), p. 6.
ECONOMIC AND SOCIAL SURVEY OF ASIA AND THE PACIFIC 2010
14
percentage) to a given destination than theworld does on average. More specifically, thetrade intensity index measures the ratio of thetrade share of a particular country to a partneror region and the world trade share to thesame country or region. An index value greaterthan 1.0 would indicate that the country’s exportvolume to a given destination is greater thanthe world average. The country would thus besaid to have a more intense export trade rela-tion with that partner than does the rest of theworld (table 2).
An increasing value in the index with Chinamight therefore indicate greater trade in compo-nents and parts with China whose final destina-tion is the United States, rather than increasedChinese dependency on itself as final consumer.Thus, one limitation of this measure is that itdoes not account for the trade pattern based onthe intermediate goods from global productionchains. For that reason, an index that dealswith the product mix could be used to comple-ment the analysis.
looms even larger in the region as its exportsand imports account for a growing proportion ofthe regional trade. With China emerging as theworld’s factory, particularly of manufactured ex-ports, Asian and Pacific economies that haveembarked on a similar export-based growthstrategy could feel threatened. At the same timeChina’s emergence, accentuated by its resil-ience to the global crisis, presents the opportu-nity of a growing market when growth in therest of the world is anaemic, as evinced bytrade deficits in 2008 with Japan, the Republicof Korea, South-East Asia and Australia.
Economies that trade intensivelywith the United States and Japanare more vulnerable than others
to the collapse in external demand
Given the outlook for 2010, economies that tendto trade intensively with the United States andJapan are rendered more vulnerable than othersto the collapse in external demand. In favourablecontrast, the Chinese and Indian economicgrowth rates during 2008 and much of 2009 arequite remarkable given the backdrop of the globalrecession. Will those two large economies be thenext engines of growth in Asia and the Pacific?
China recently surpassed Germany as the larg-est exporter in the world. The Chinese profile
If China imports from Asian sourcesfor its own consumption, its domesticspending would become an important
source of external demand
To what extent can China be expected to be anengine of growth in the post-crisis period forAsian and Pacific economies? Much dependson whether China imports from developing Asiafor consumption purposes or simply to sourceinputs for its assembly operations. If Chinawere to import from Asian sources for its ownconsumption, its domestic spending wouldbecome an important source of externaldemand. Here a few caveats should be consid-ered in using the trade intensity indicators. Firstof all, the trade intensity index also picks up thetrade with China in parts and components ofcountries but does not distinguish it from tradein goods for own consumption. Thus, exports ofintermediate goods from other countries toChina could well end up as part of Chineseexports to the affected economies, such asthe United States. Some estimate the foreigncontent of China’s aggregate merchandise ex-port at between 25 to 46% in 2002 dependingon the methodology used.12 Furthermore,
12 Dean, J., K.C. Fung and Z. Wang, “How vertically specialized is Chinese trade?”, Bank of Finland DiscussionPapers 31 (Helsinki: Bank of Finland Institute for Economies in Transition, 2008), available from www.bof.fi/NR/rdonlyres/0F367D7B-DA85-4D13-8788-9E2EF25DFBCB/0/dp3108.pdf.
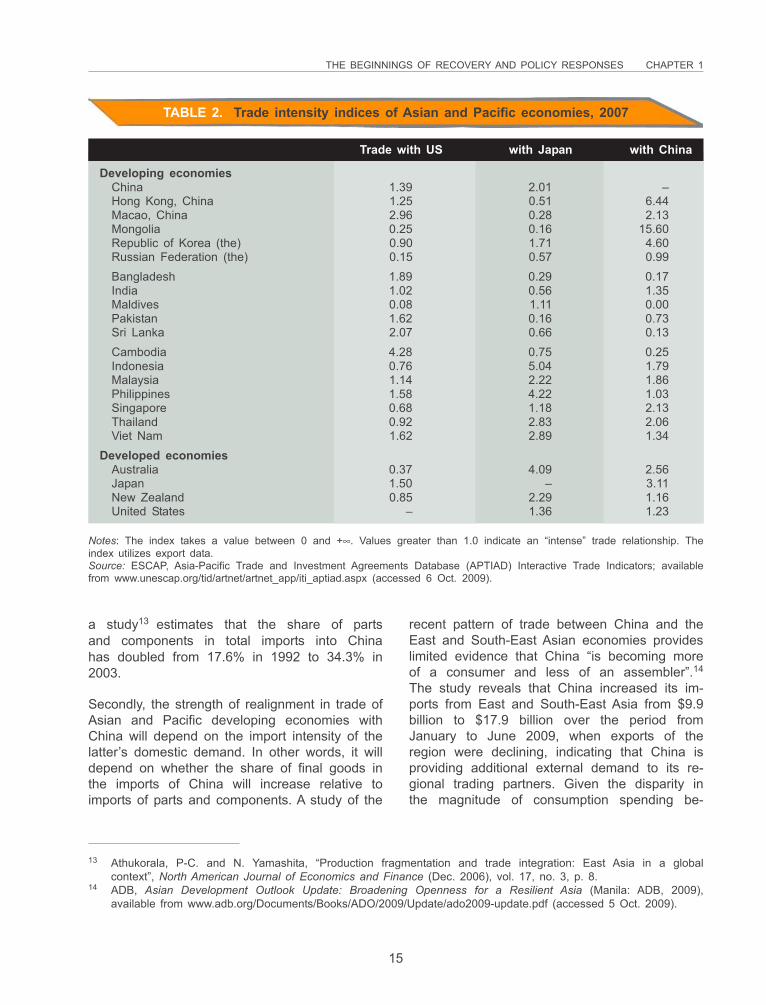
THE BEGINNINGS OF RECOVERY AND POLICY RESPONSES CHAPTER 1
15
a study13 estimates that the share of partsand components in total imports into Chinahas doubled from 17.6% in 1992 to 34.3% in2003.
Secondly, the strength of realignment in trade ofAsian and Pacific developing economies withChina will depend on the import intensity of thelatter’s domestic demand. In other words, it willdepend on whether the share of final goods inthe imports of China will increase relative toimports of parts and components. A study of the
recent pattern of trade between China and theEast and South-East Asian economies provideslimited evidence that China “is becoming moreof a consumer and less of an assembler”.14
The study reveals that China increased its im-ports from East and South-East Asia from $9.9billion to $17.9 billion over the period fromJanuary to June 2009, when exports of theregion were declining, indicating that China isproviding additional external demand to its re-gional trading partners. Given the disparity inthe magnitude of consumption spending be-
13 Athukorala, P-C. and N. Yamashita, “Production fragmentation and trade integration: East Asia in a globalcontext”, North American Journal of Economics and Finance (Dec. 2006), vol. 17, no. 3, p. 8.
14 ADB, Asian Development Outlook Update: Broadening Openness for a Resilient Asia (Manila: ADB, 2009),available from www.adb.org/Documents/Books/ADO/2009/Update/ado2009-update.pdf (accessed 5 Oct. 2009).
TABLE 2. Trade intensity indices of Asian and Pacific economies, 2007
Trade with US with Japan with China
Developing economiesChina 1.39 2.01 –Hong Kong, China 1.25 0.51 6.44Macao, China 2.96 0.28 2.13Mongolia 0.25 0.16 15.60Republic of Korea (the) 0.90 1.71 4.60Russian Federation (the) 0.15 0.57 0.99Bangladesh 1.89 0.29 0.17India 1.02 0.56 1.35Maldives 0.08 1.11 0.00Pakistan 1.62 0.16 0.73Sri Lanka 2.07 0.66 0.13Cambodia 4.28 0.75 0.25Indonesia 0.76 5.04 1.79Malaysia 1.14 2.22 1.86Philippines 1.58 4.22 1.03Singapore 0.68 1.18 2.13Thailand 0.92 2.83 2.06Viet Nam 1.62 2.89 1.34
Developed economiesAustralia 0.37 4.09 2.56Japan 1.50 – 3.11New Zealand 0.85 2.29 1.16United States – 1.36 1.23
Notes: The index takes a value between 0 and +∞. Values greater than 1.0 indicate an “intense” trade relationship. Theindex utilizes export data.Source: ESCAP, Asia-Pacific Trade and Investment Agreements Database (APTIAD) Interactive Trade Indicators; availablefrom www.unescap.org/tid/artnet/artnet_app/iti_aptiad.aspx (accessed 6 Oct. 2009).
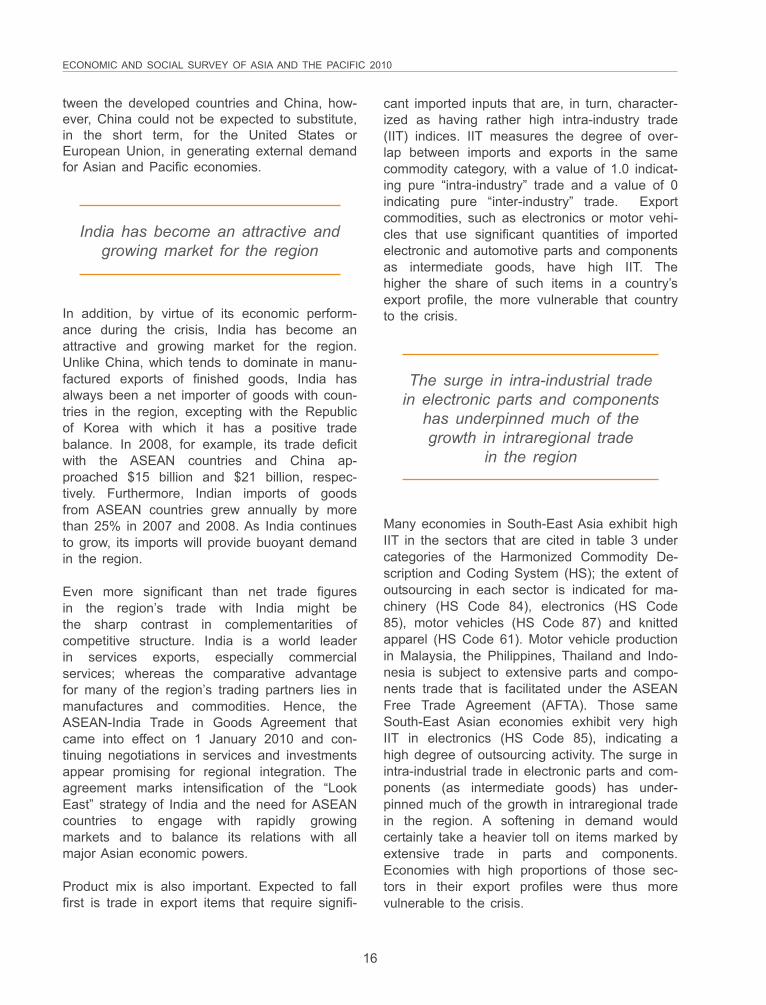
ECONOMIC AND SOCIAL SURVEY OF ASIA AND THE PACIFIC 2010
16
tween the developed countries and China, how-ever, China could not be expected to substitute,in the short term, for the United States orEuropean Union, in generating external demandfor Asian and Pacific economies.
cant imported inputs that are, in turn, character-ized as having rather high intra-industry trade(IIT) indices. IIT measures the degree of over-lap between imports and exports in the samecommodity category, with a value of 1.0 indicat-ing pure “intra-industry” trade and a value of 0indicating pure “inter-industry” trade. Exportcommodities, such as electronics or motor vehi-cles that use significant quantities of importedelectronic and automotive parts and componentsas intermediate goods, have high IIT. Thehigher the share of such items in a country’sexport profile, the more vulnerable that countryto the crisis.
India has become an attractive andgrowing market for the region
In addition, by virtue of its economic perform-ance during the crisis, India has become anattractive and growing market for the region.Unlike China, which tends to dominate in manu-factured exports of finished goods, India hasalways been a net importer of goods with coun-tries in the region, excepting with the Republicof Korea with which it has a positive tradebalance. In 2008, for example, its trade deficitwith the ASEAN countries and China ap-proached $15 billion and $21 billion, respec-tively. Furthermore, Indian imports of goodsfrom ASEAN countries grew annually by morethan 25% in 2007 and 2008. As India continuesto grow, its imports will provide buoyant demandin the region.
Even more significant than net trade figuresin the region’s trade with India might bethe sharp contrast in complementarities ofcompetitive structure. India is a world leaderin services exports, especially commercialservices; whereas the comparative advantagefor many of the region’s trading partners lies inmanufactures and commodities. Hence, theASEAN-India Trade in Goods Agreement thatcame into effect on 1 January 2010 and con-tinuing negotiations in services and investmentsappear promising for regional integration. Theagreement marks intensification of the “LookEast” strategy of India and the need for ASEANcountries to engage with rapidly growingmarkets and to balance its relations with allmajor Asian economic powers.
Product mix is also important. Expected to fallfirst is trade in export items that require signifi-
The surge in intra-industrial tradein electronic parts and components
has underpinned much of thegrowth in intraregional trade
in the region
Many economies in South-East Asia exhibit highIIT in the sectors that are cited in table 3 undercategories of the Harmonized Commodity De-scription and Coding System (HS); the extent ofoutsourcing in each sector is indicated for ma-chinery (HS Code 84), electronics (HS Code85), motor vehicles (HS Code 87) and knittedapparel (HS Code 61). Motor vehicle productionin Malaysia, the Philippines, Thailand and Indo-nesia is subject to extensive parts and compo-nents trade that is facilitated under the ASEANFree Trade Agreement (AFTA). Those sameSouth-East Asian economies exhibit very highIIT in electronics (HS Code 85), indicating ahigh degree of outsourcing activity. The surge inintra-industrial trade in electronic parts and com-ponents (as intermediate goods) has under-pinned much of the growth in intraregional tradein the region. A softening in demand wouldcertainly take a heavier toll on items marked byextensive trade in parts and components.Economies with high proportions of those sec-tors in their export profiles were thus morevulnerable to the crisis.
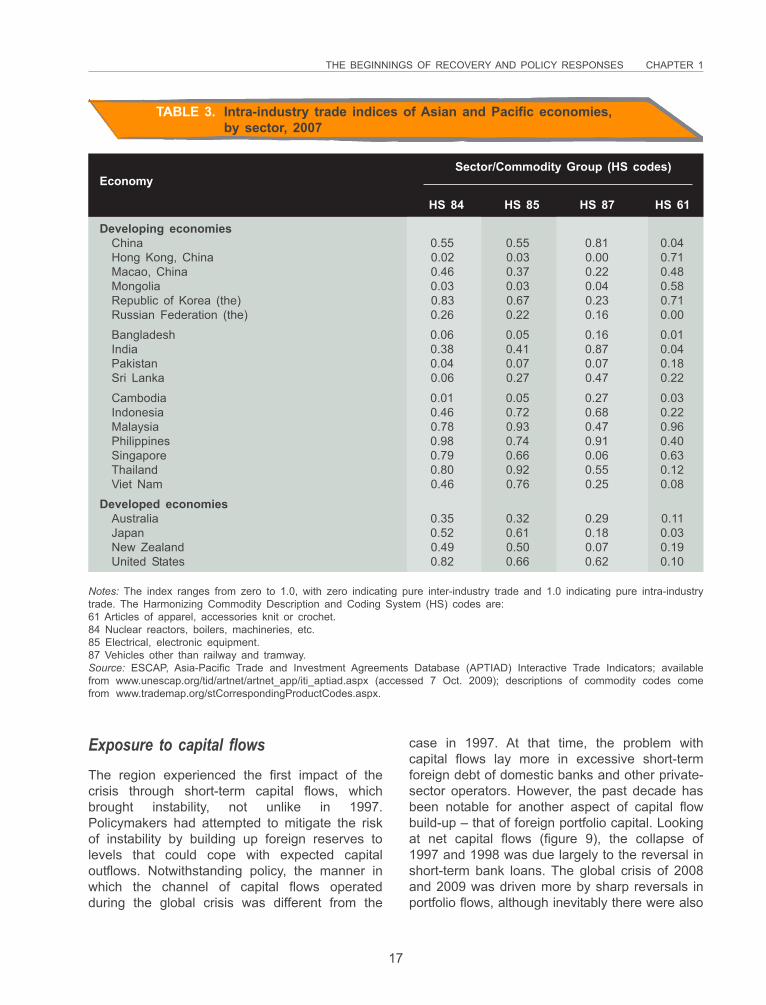
THE BEGINNINGS OF RECOVERY AND POLICY RESPONSES CHAPTER 1
17
Sector/Commodity Group (HS codes)Economy
HS 84 HS 85 HS 87 HS 61
Developing economiesChina 0.55 0.55 0.81 0.04Hong Kong, China 0.02 0.03 0.00 0.71Macao, China 0.46 0.37 0.22 0.48Mongolia 0.03 0.03 0.04 0.58Republic of Korea (the) 0.83 0.67 0.23 0.71Russian Federation (the) 0.26 0.22 0.16 0.00
Bangladesh 0.06 0.05 0.16 0.01India 0.38 0.41 0.87 0.04Pakistan 0.04 0.07 0.07 0.18Sri Lanka 0.06 0.27 0.47 0.22
Cambodia 0.01 0.05 0.27 0.03Indonesia 0.46 0.72 0.68 0.22Malaysia 0.78 0.93 0.47 0.96Philippines 0.98 0.74 0.91 0.40Singapore 0.79 0.66 0.06 0.63Thailand 0.80 0.92 0.55 0.12Viet Nam 0.46 0.76 0.25 0.08
Developed economiesAustralia 0.35 0.32 0.29 0.11Japan 0.52 0.61 0.18 0.03New Zealand 0.49 0.50 0.07 0.19United States 0.82 0.66 0.62 0.10
Notes: The index ranges from zero to 1.0, with zero indicating pure inter-industry trade and 1.0 indicating pure intra-industrytrade. The Harmonizing Commodity Description and Coding System (HS) codes are:61 Articles of apparel, accessories knit or crochet.84 Nuclear reactors, boilers, machineries, etc.85 Electrical, electronic equipment.87 Vehicles other than railway and tramway.Source: ESCAP, Asia-Pacific Trade and Investment Agreements Database (APTIAD) Interactive Trade Indicators; availablefrom www.unescap.org/tid/artnet/artnet_app/iti_aptiad.aspx (accessed 7 Oct. 2009); descriptions of commodity codes comefrom www.trademap.org/stCorrespondingProductCodes.aspx.
TABLE 3. Intra-industry trade indices of Asian and Pacific economies,by sector, 2007
Exposure to capital flowsThe region experienced the first impact of thecrisis through short-term capital flows, whichbrought instability, not unlike in 1997.Policymakers had attempted to mitigate the riskof instability by building up foreign reserves tolevels that could cope with expected capitaloutflows. Notwithstanding policy, the manner inwhich the channel of capital flows operatedduring the global crisis was different from the
case in 1997. At that time, the problem withcapital flows lay more in excessive short-termforeign debt of domestic banks and other private-sector operators. However, the past decade hasbeen notable for another aspect of capital flowbuild-up – that of foreign portfolio capital. Lookingat net capital flows (figure 9), the collapse of1997 and 1998 was due largely to the reversal inshort-term bank loans. The global crisis of 2008and 2009 was driven more by sharp reversals inportfolio flows, although inevitably there were also
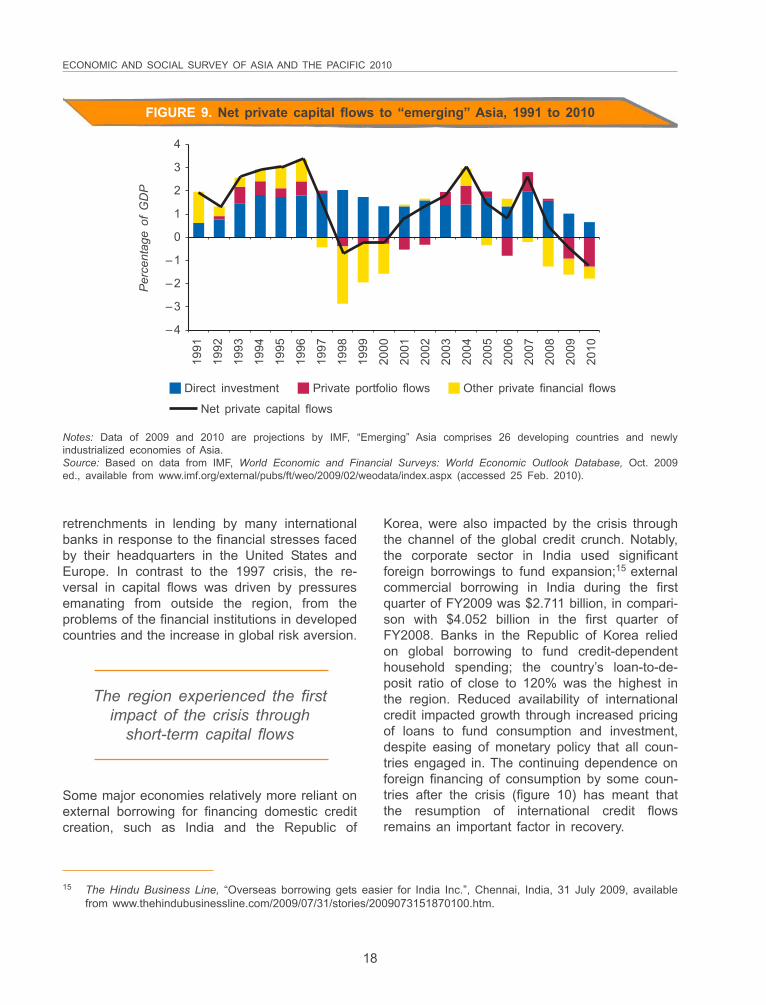
ECONOMIC AND SOCIAL SURVEY OF ASIA AND THE PACIFIC 2010
18
FIGURE 9. Net private capital flows to “emerging” Asia, 1991 to 2010
4
3
2
1
0
–1
–2
–3
–4
Per
cent
age
of G
DP
1991
1992
1993
1994
1995
1996
1997
1998
1999
2000
2001
2002
2003
2004
2005
2006
2007
2008
2009
2010
Direct investment Private portfolio flows Other private financial flows
Net private capital flows
Notes: Data of 2009 and 2010 are projections by IMF, “Emerging” Asia comprises 26 developing countries and newlyindustrialized economies of Asia.Source: Based on data from IMF, World Economic and Financial Surveys: World Economic Outlook Database, Oct. 2009ed., available from www.imf.org/external/pubs/ft/weo/2009/02/weodata/index.aspx (accessed 25 Feb. 2010).
15 The Hindu Business Line, “Overseas borrowing gets easier for India Inc.”, Chennai, India, 31 July 2009, availablefrom www.thehindubusinessline.com/2009/07/31/stories/2009073151870100.htm.
retrenchments in lending by many internationalbanks in response to the financial stresses facedby their headquarters in the United States andEurope. In contrast to the 1997 crisis, the re-versal in capital flows was driven by pressuresemanating from outside the region, from theproblems of the financial institutions in developedcountries and the increase in global risk aversion.
Korea, were also impacted by the crisis throughthe channel of the global credit crunch. Notably,the corporate sector in India used significantforeign borrowings to fund expansion;15 externalcommercial borrowing in India during the firstquarter of FY2009 was $2.711 billion, in compari-son with $4.052 billion in the first quarter ofFY2008. Banks in the Republic of Korea reliedon global borrowing to fund credit-dependenthousehold spending; the country’s loan-to-de-posit ratio of close to 120% was the highest inthe region. Reduced availability of internationalcredit impacted growth through increased pricingof loans to fund consumption and investment,despite easing of monetary policy that all coun-tries engaged in. The continuing dependence onforeign financing of consumption by some coun-tries after the crisis (figure 10) has meant thatthe resumption of international credit flowsremains an important factor in recovery.
The region experienced the firstimpact of the crisis through
short-term capital flows
Some major economies relatively more reliant onexternal borrowing for financing domestic creditcreation, such as India and the Republic of
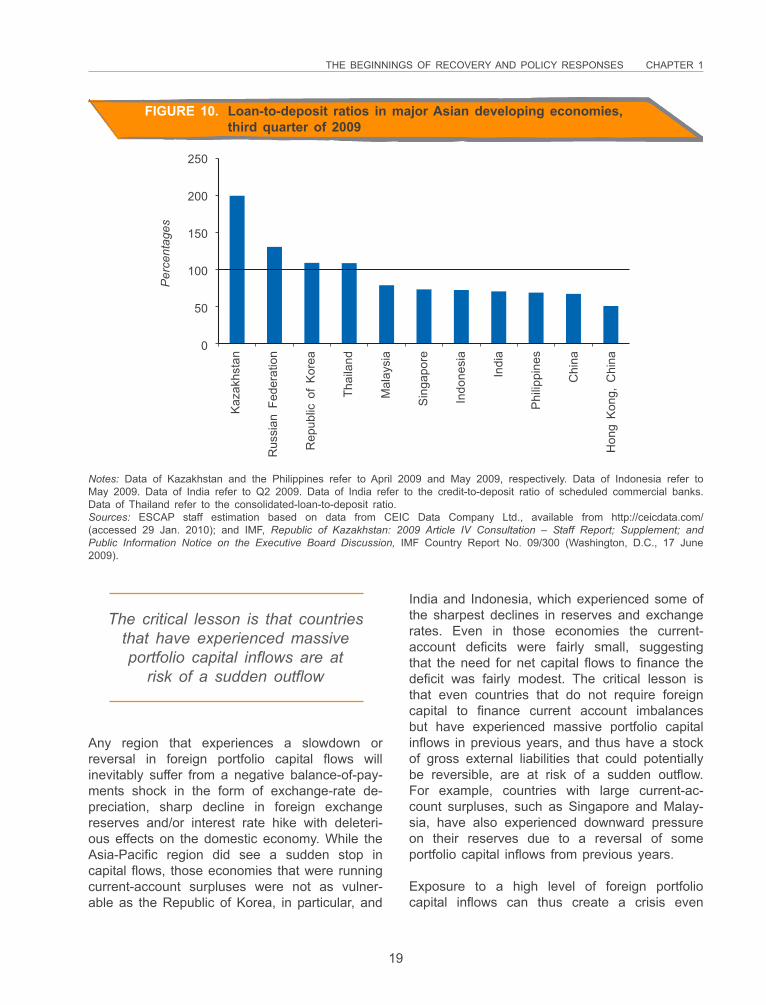
THE BEGINNINGS OF RECOVERY AND POLICY RESPONSES CHAPTER 1
19
FIGURE 10. Loan-to-deposit ratios in major Asian developing economies,third quarter of 2009
250
200
150
100
50
0
Per
cent
ages
Kaz
akhs
tan
Rus
sian
Fed
erat
ion
Rep
ublic
of
Kor
ea
Thai
land
Mal
aysi
a
Sin
gapo
re
Indo
nesi
a
Indi
a
Phi
lippi
nes
Chi
na
Hon
g K
ong,
Chi
na
Notes: Data of Kazakhstan and the Philippines refer to April 2009 and May 2009, respectively. Data of Indonesia refer toMay 2009. Data of India refer to Q2 2009. Data of India refer to the credit-to-deposit ratio of scheduled commercial banks.Data of Thailand refer to the consolidated-loan-to-deposit ratio.Sources: ESCAP staff estimation based on data from CEIC Data Company Ltd., available from http://ceicdata.com/(accessed 29 Jan. 2010); and IMF, Republic of Kazakhstan: 2009 Article IV Consultation – Staff Report; Supplement; andPublic Information Notice on the Executive Board Discussion, IMF Country Report No. 09/300 (Washington, D.C., 17 June2009).
Any region that experiences a slowdown orreversal in foreign portfolio capital flows willinevitably suffer from a negative balance-of-pay-ments shock in the form of exchange-rate de-preciation, sharp decline in foreign exchangereserves and/or interest rate hike with deleteri-ous effects on the domestic economy. While theAsia-Pacific region did see a sudden stop incapital flows, those economies that were runningcurrent-account surpluses were not as vulner-able as the Republic of Korea, in particular, and
India and Indonesia, which experienced some ofthe sharpest declines in reserves and exchangerates. Even in those economies the current-account deficits were fairly small, suggestingthat the need for net capital flows to finance thedeficit was fairly modest. The critical lesson isthat even countries that do not require foreigncapital to finance current account imbalancesbut have experienced massive portfolio capitalinflows in previous years, and thus have a stockof gross external liabilities that could potentiallybe reversible, are at risk of a sudden outflow.For example, countries with large current-ac-count surpluses, such as Singapore and Malay-sia, have also experienced downward pressureon their reserves due to a reversal of someportfolio capital inflows from previous years.
Exposure to a high level of foreign portfoliocapital inflows can thus create a crisis even
The critical lesson is that countriesthat have experienced massiveportfolio capital inflows are at
risk of a sudden outflow
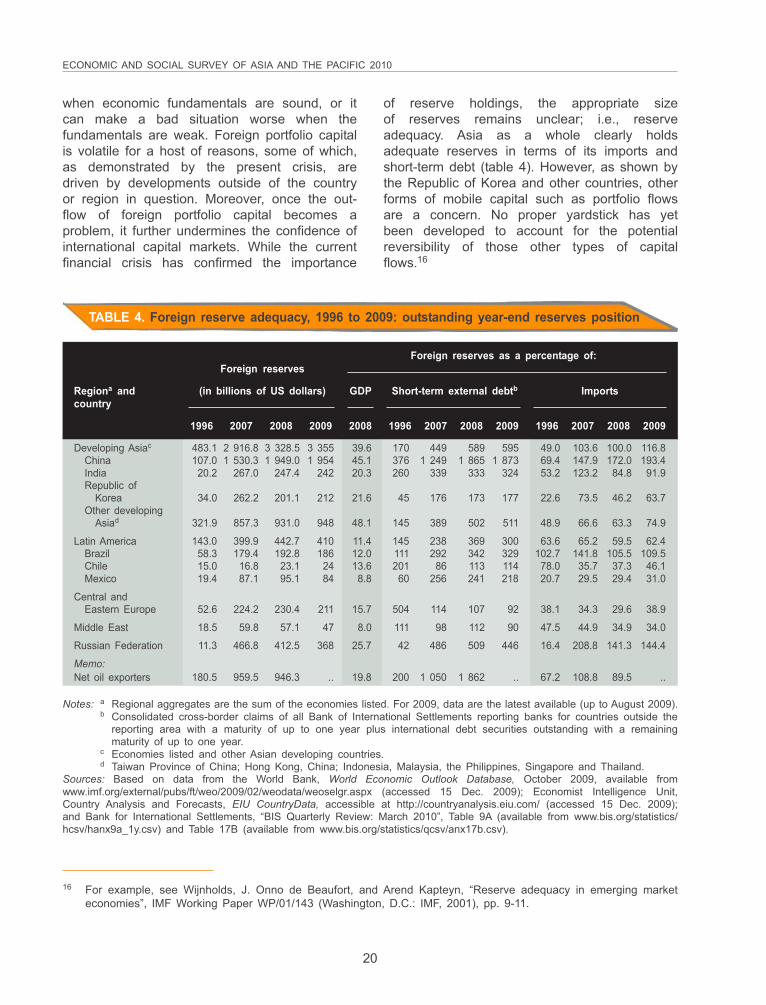
ECONOMIC AND SOCIAL SURVEY OF ASIA AND THE PACIFIC 2010
20
when economic fundamentals are sound, or itcan make a bad situation worse when thefundamentals are weak. Foreign portfolio capitalis volatile for a host of reasons, some of which,as demonstrated by the present crisis, aredriven by developments outside of the countryor region in question. Moreover, once the out-flow of foreign portfolio capital becomes aproblem, it further undermines the confidence ofinternational capital markets. While the currentfinancial crisis has confirmed the importance
of reserve holdings, the appropriate sizeof reserves remains unclear; i.e., reserveadequacy. Asia as a whole clearly holdsadequate reserves in terms of its imports andshort-term debt (table 4). However, as shown bythe Republic of Korea and other countries, otherforms of mobile capital such as portfolio flowsare a concern. No proper yardstick has yetbeen developed to account for the potentialreversibility of those other types of capitalflows.16
Foreign reserves as a percentage of:Foreign reserves
Regiona and (in billions of US dollars) GDP Short-term external debtb Importscountry
1996 2007 2008 2009 2008 1996 2007 2008 2009 1996 2007 2008 2009
Developing Asiac 483.1 2 916.8 3 328.5 3 355 39.6 170 449 589 595 49.0 103.6 100.0 116.8China 107.0 1 530.3 1 949.0 1 954 45.1 376 1 249 1 865 1 873 69.4 147.9 172.0 193.4India 20.2 267.0 247.4 242 20.3 260 339 333 324 53.2 123.2 84.8 91.9Republic of
Korea 34.0 262.2 201.1 212 21.6 45 176 173 177 22.6 73.5 46.2 63.7Other developing
Asiad 321.9 857.3 931.0 948 48.1 145 389 502 511 48.9 66.6 63.3 74.9
Latin America 143.0 399.9 442.7 410 11.4 145 238 369 300 63.6 65.2 59.5 62.4Brazil 58.3 179.4 192.8 186 12.0 111 292 342 329 102.7 141.8 105.5 109.5Chile 15.0 16.8 23.1 24 13.6 201 86 113 114 78.0 35.7 37.3 46.1Mexico 19.4 87.1 95.1 84 8.8 60 256 241 218 20.7 29.5 29.4 31.0
Central andEastern Europe 52.6 224.2 230.4 211 15.7 504 114 107 92 38.1 34.3 29.6 38.9
Middle East 18.5 59.8 57.1 47 8.0 111 98 112 90 47.5 44.9 34.9 34.0
Russian Federation 11.3 466.8 412.5 368 25.7 42 486 509 446 16.4 208.8 141.3 144.4
Memo:Net oil exporters 180.5 959.5 946.3 .. 19.8 200 1 050 1 862 .. 67.2 108.8 89.5 ..
Notes: a Regional aggregates are the sum of the economies listed. For 2009, data are the latest available (up to August 2009).b Consolidated cross-border claims of all Bank of International Settlements reporting banks for countries outside the
reporting area with a maturity of up to one year plus international debt securities outstanding with a remainingmaturity of up to one year.
c Economies listed and other Asian developing countries.d Taiwan Province of China; Hong Kong, China; Indonesia, Malaysia, the Philippines, Singapore and Thailand.
Sources: Based on data from the World Bank, World Economic Outlook Database, October 2009, available fromwww.imf.org/external/pubs/ft/weo/2009/02/weodata/weoselgr.aspx (accessed 15 Dec. 2009); Economist Intelligence Unit,Country Analysis and Forecasts, EIU CountryData, accessible at http://countryanalysis.eiu.com/ (accessed 15 Dec. 2009);and Bank for International Settlements, “BIS Quarterly Review: March 2010”, Table 9A (available from www.bis.org/statistics/hcsv/hanx9a_1y.csv) and Table 17B (available from www.bis.org/statistics/qcsv/anx17b.csv).
TABLE 4. Foreign reserve adequacy, 1996 to 2009: outstanding year-end reserves position
16 For example, see Wijnholds, J. Onno de Beaufort, and Arend Kapteyn, “Reserve adequacy in emerging marketeconomies”, IMF Working Paper WP/01/143 (Washington, D.C.: IMF, 2001), pp. 9-11.
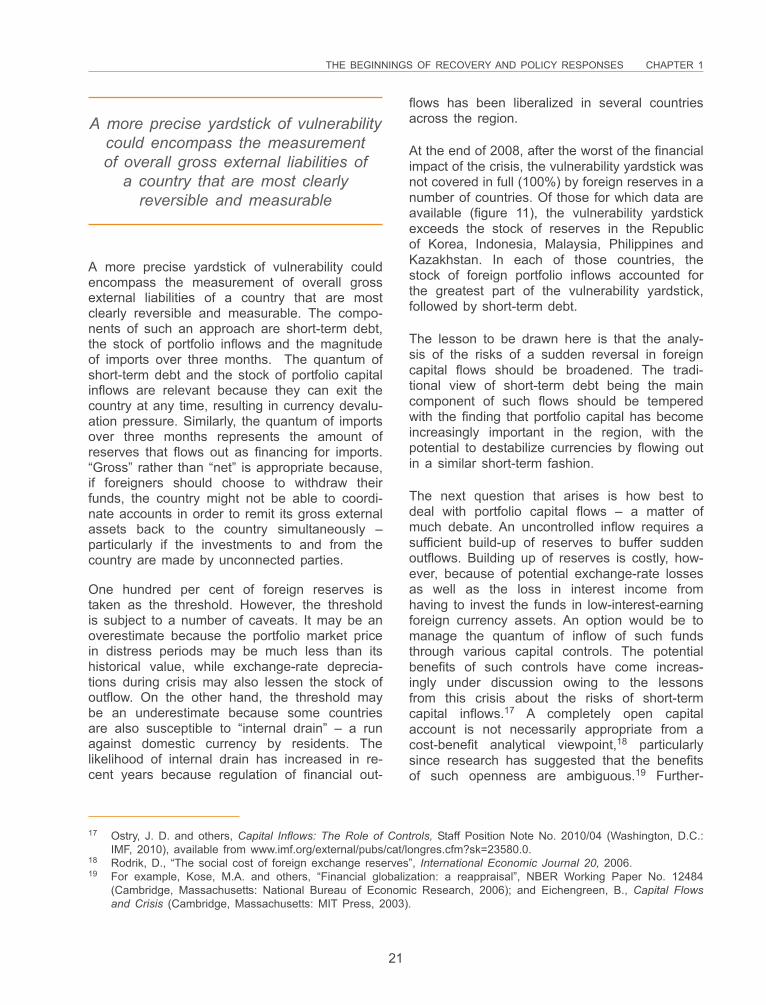
THE BEGINNINGS OF RECOVERY AND POLICY RESPONSES CHAPTER 1
21
A more precise yardstick of vulnerability couldencompass the measurement of overall grossexternal liabilities of a country that are mostclearly reversible and measurable. The compo-nents of such an approach are short-term debt,the stock of portfolio inflows and the magnitudeof imports over three months. The quantum ofshort-term debt and the stock of portfolio capitalinflows are relevant because they can exit thecountry at any time, resulting in currency devalu-ation pressure. Similarly, the quantum of importsover three months represents the amount ofreserves that flows out as financing for imports.“Gross” rather than “net” is appropriate because,if foreigners should choose to withdraw theirfunds, the country might not be able to coordi-nate accounts in order to remit its gross externalassets back to the country simultaneously –particularly if the investments to and from thecountry are made by unconnected parties.
One hundred per cent of foreign reserves istaken as the threshold. However, the thresholdis subject to a number of caveats. It may be anoverestimate because the portfolio market pricein distress periods may be much less than itshistorical value, while exchange-rate deprecia-tions during crisis may also lessen the stock ofoutflow. On the other hand, the threshold maybe an underestimate because some countriesare also susceptible to “internal drain” – a runagainst domestic currency by residents. Thelikelihood of internal drain has increased in re-cent years because regulation of financial out-
flows has been liberalized in several countriesacross the region.
At the end of 2008, after the worst of the financialimpact of the crisis, the vulnerability yardstick wasnot covered in full (100%) by foreign reserves in anumber of countries. Of those for which data areavailable (figure 11), the vulnerability yardstickexceeds the stock of reserves in the Republicof Korea, Indonesia, Malaysia, Philippines andKazakhstan. In each of those countries, thestock of foreign portfolio inflows accounted forthe greatest part of the vulnerability yardstick,followed by short-term debt.
The lesson to be drawn here is that the analy-sis of the risks of a sudden reversal in foreigncapital flows should be broadened. The tradi-tional view of short-term debt being the maincomponent of such flows should be temperedwith the finding that portfolio capital has becomeincreasingly important in the region, with thepotential to destabilize currencies by flowing outin a similar short-term fashion.
The next question that arises is how best todeal with portfolio capital flows – a matter ofmuch debate. An uncontrolled inflow requires asufficient build-up of reserves to buffer suddenoutflows. Building up of reserves is costly, how-ever, because of potential exchange-rate lossesas well as the loss in interest income fromhaving to invest the funds in low-interest-earningforeign currency assets. An option would be tomanage the quantum of inflow of such fundsthrough various capital controls. The potentialbenefits of such controls have come increas-ingly under discussion owing to the lessonsfrom this crisis about the risks of short-termcapital inflows.17 A completely open capitalaccount is not necessarily appropriate from acost-benefit analytical viewpoint,18 particularlysince research has suggested that the benefitsof such openness are ambiguous.19 Further-
A more precise yardstick of vulnerabilitycould encompass the measurementof overall gross external liabilities of
a country that are most clearlyreversible and measurable
17 Ostry, J. D. and others, Capital Inflows: The Role of Controls, Staff Position Note No. 2010/04 (Washington, D.C.:IMF, 2010), available from www.imf.org/external/pubs/cat/longres.cfm?sk=23580.0.
18 Rodrik, D., “The social cost of foreign exchange reserves”, International Economic Journal 20, 2006.19 For example, Kose, M.A. and others, “Financial globalization: a reappraisal”, NBER Working Paper No. 12484
(Cambridge, Massachusetts: National Bureau of Economic Research, 2006); and Eichengreen, B., Capital Flowsand Crisis (Cambridge, Massachusetts: MIT Press, 2003).
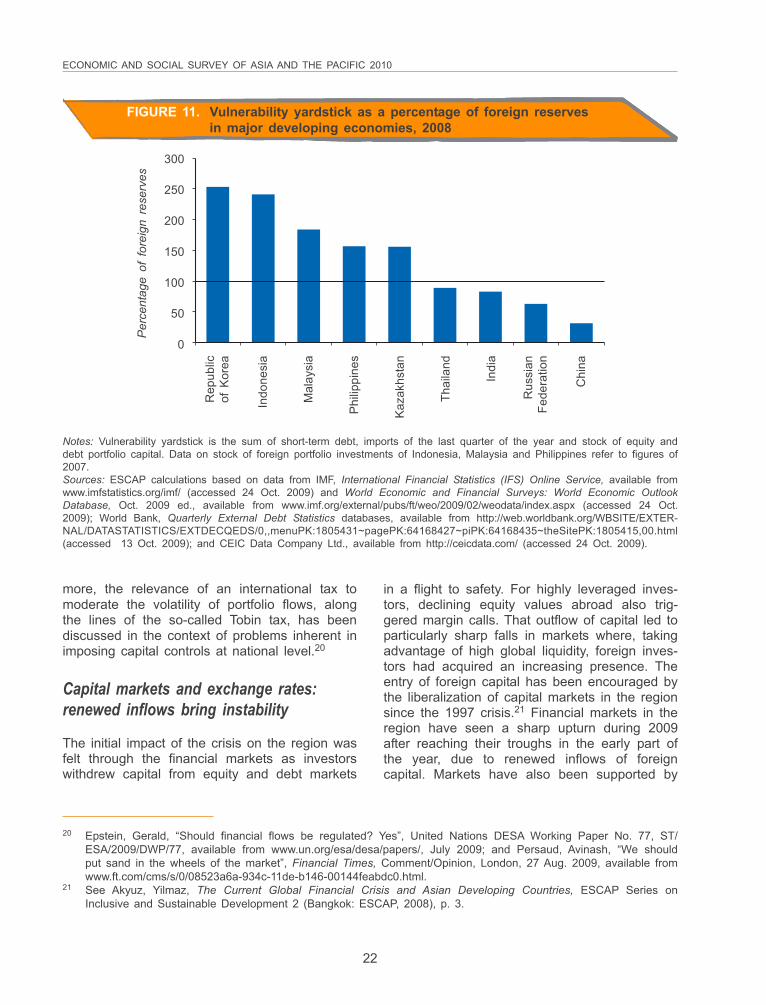
ECONOMIC AND SOCIAL SURVEY OF ASIA AND THE PACIFIC 2010
22
more, the relevance of an international tax tomoderate the volatility of portfolio flows, alongthe lines of the so-called Tobin tax, has beendiscussed in the context of problems inherent inimposing capital controls at national level.20
Capital markets and exchange rates:renewed inflows bring instability
The initial impact of the crisis on the region wasfelt through the financial markets as investorswithdrew capital from equity and debt markets
FIGURE 11. Vulnerability yardstick as a percentage of foreign reservesin major developing economies, 2008
300
250
200
150
100
50
0
Per
cent
age
of f
orei
gn r
eser
ves
Rep
ublic
of K
orea
Indo
nesi
a
Mal
aysi
a
Phi
lippi
nes
Kaz
akhs
tan
Thai
land
Indi
a
Rus
sian
Fede
ratio
n
Chi
na
Notes: Vulnerability yardstick is the sum of short-term debt, imports of the last quarter of the year and stock of equity anddebt portfolio capital. Data on stock of foreign portfolio investments of Indonesia, Malaysia and Philippines refer to figures of2007.Sources: ESCAP calculations based on data from IMF, International Financial Statistics (IFS) Online Service, available fromwww.imfstatistics.org/imf/ (accessed 24 Oct. 2009) and World Economic and Financial Surveys: World Economic OutlookDatabase, Oct. 2009 ed., available from www.imf.org/external/pubs/ft/weo/2009/02/weodata/index.aspx (accessed 24 Oct.2009); World Bank, Quarterly External Debt Statistics databases, available from http://web.worldbank.org/WBSITE/EXTER-NAL/DATASTATISTICS/EXTDECQEDS/0,,menuPK:1805431~pagePK:64168427~piPK:64168435~theSitePK:1805415,00.html(accessed 13 Oct. 2009); and CEIC Data Company Ltd., available from http://ceicdata.com/ (accessed 24 Oct. 2009).
in a flight to safety. For highly leveraged inves-tors, declining equity values abroad also trig-gered margin calls. That outflow of capital led toparticularly sharp falls in markets where, takingadvantage of high global liquidity, foreign inves-tors had acquired an increasing presence. Theentry of foreign capital has been encouraged bythe liberalization of capital markets in the regionsince the 1997 crisis.21 Financial markets in theregion have seen a sharp upturn during 2009after reaching their troughs in the early part ofthe year, due to renewed inflows of foreigncapital. Markets have also been supported by
20 Epstein, Gerald, “Should financial flows be regulated? Yes”, United Nations DESA Working Paper No. 77, ST/ESA/2009/DWP/77, available from www.un.org/esa/desa/papers/, July 2009; and Persaud, Avinash, “We shouldput sand in the wheels of the market”, Financial Times, Comment/Opinion, London, 27 Aug. 2009, available fromwww.ft.com/cms/s/0/08523a6a-934c-11de-b146-00144feabdc0.html.
21 See Akyuz, Yilmaz, The Current Global Financial Crisis and Asian Developing Countries, ESCAP Series onInclusive and Sustainable Development 2 (Bangkok: ESCAP, 2008), p. 3.
THE BEGINNINGS OF RECOVERY AND POLICY RESPONSES CHAPTER 1
23
Financial markets in the region haveseen a sharp upturn due to renewed
inflows of foreign capital
buoyant domestic buying spurred by borrowingin a number of countries such as China andIndia.
FIGURE 12. Exchange rate movements in major developing economies, 2007 to 2009
120
110
100
90
80
70
60
Inde
x (J
anua
ry 2
007
= 10
0)
Jan-
07
Jun-
07
Nov
-07
Apr
-08
Sep
-08
Feb-
09
Jul-0
9
Dec
-09
China Republic of Korea SingaporeIndia Indonesia MalaysiaPakistan Russian Federation Thailand
Note: A positive trend represents appreciation and vice versa.Source: Based on data from CEIC Data Company Ltd., available from http://ceicdata.com/ (accessed 15 Feb. 2010).
As capital inflows have returned to the region,exchange rates have come under upward pres-sure after substantial depreciation since the on-set of the crisis (figure 12). Notably, the Koreanwon appreciated around 8% over the periodbeginning in January 2009 to the time of thiswriting. Other currencies such as the Thai baht,Indian rupee and Singaporean dollar appreci-ated slightly. A number of currencies, particularlythose most affected by the crisis such as theKorean won and Russian rouble, still remainsubstantially below values seen in September2008. In any case, the fall in currency values to
their lowest point for countries in the region wasgenerally far less than in the 1997 crisis (figure13). One factor responsible in maintaining cur-rency values was the use by the central banksof foreign exchange reserves in supporting cur-rencies across the region (figure 14).
Exchange rates have come underupward pressure after substantial
depreciation since the onsetof the crisis
As recovery gains momentum in the region,concerns about the future strength and role ofthe United States dollar as a reserve currencygrow, given the build-up of governmental debtand lacklustre growth. The need to engage inpolicies in the coming months to manage ap-preciation of currencies in order to encouragenascent export recovery will require Asian and
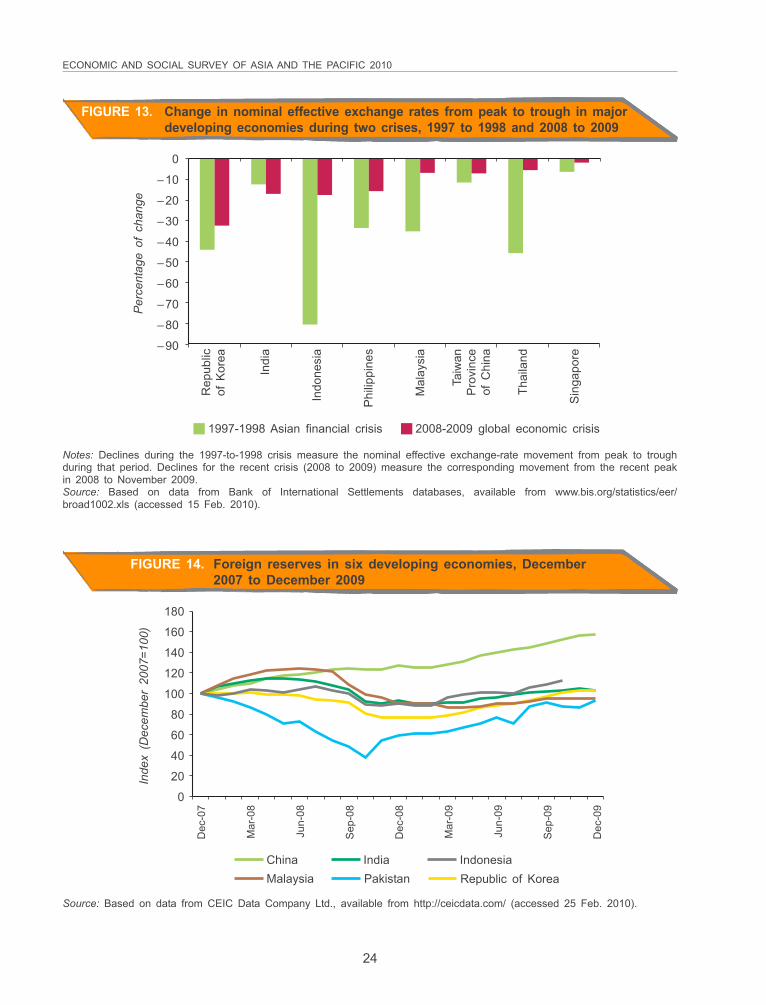
ECONOMIC AND SOCIAL SURVEY OF ASIA AND THE PACIFIC 2010
24
FIGURE 13. Change in nominal effective exchange rates from peak to trough in majordeveloping economies during two crises, 1997 to 1998 and 2008 to 2009
0
–10
–20
–30
–40
–50
–60
–70
–80
–90
Per
cent
age
of c
hang
e
1997-1998 Asian financial crisis 2008-2009 global economic crisis
Notes: Declines during the 1997-to-1998 crisis measure the nominal effective exchange-rate movement from peak to troughduring that period. Declines for the recent crisis (2008 to 2009) measure the corresponding movement from the recent peakin 2008 to November 2009.Source: Based on data from Bank of International Settlements databases, available from www.bis.org/statistics/eer/broad1002.xls (accessed 15 Feb. 2010).
FIGURE 14. Foreign reserves in six developing economies, December2007 to December 2009
180
160
140
120
100
80
60
40
20
0
Inde
x (D
ecem
ber
2007
=100
)
Dec
-07
Mar
-08
Jun-
08
Sep
-08
Dec
-08
Mar
-09
Jun-
09
Sep
-09
Dec
-09
China IndiaRepublic of KoreaMalaysia PakistanIndonesia
Source: Based on data from CEIC Data Company Ltd., available from http://ceicdata.com/ (accessed 25 Feb. 2010).
Rep
ublic
of K
orea
Indi
a
Indo
nesi
a
Phi
lippi
nes
Mal
aysi
a
Taiw
anP
rovi
nce
of C
hina
Thai
land
Sin
gapo
re
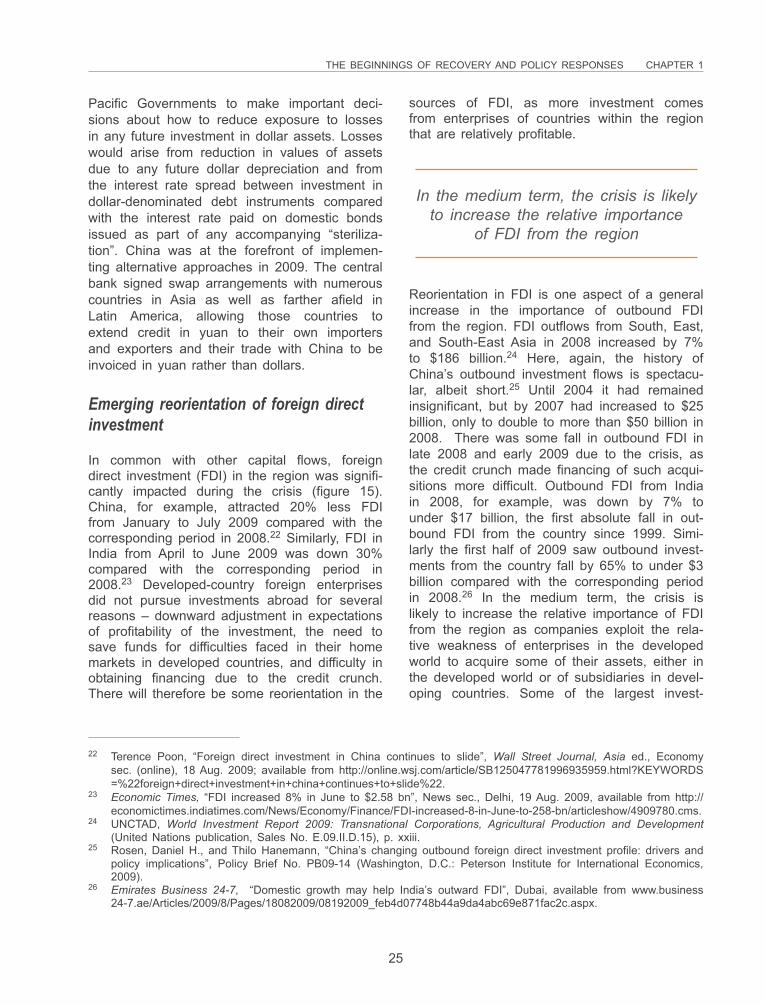
THE BEGINNINGS OF RECOVERY AND POLICY RESPONSES CHAPTER 1
25
Pacific Governments to make important deci-sions about how to reduce exposure to lossesin any future investment in dollar assets. Losseswould arise from reduction in values of assetsdue to any future dollar depreciation and fromthe interest rate spread between investment indollar-denominated debt instruments comparedwith the interest rate paid on domestic bondsissued as part of any accompanying “steriliza-tion”. China was at the forefront of implemen-ting alternative approaches in 2009. The centralbank signed swap arrangements with numerouscountries in Asia as well as farther afield inLatin America, allowing those countries toextend credit in yuan to their own importersand exporters and their trade with China to beinvoiced in yuan rather than dollars.
Emerging reorientation of foreign directinvestment
In common with other capital flows, foreigndirect investment (FDI) in the region was signifi-cantly impacted during the crisis (figure 15).China, for example, attracted 20% less FDIfrom January to July 2009 compared with thecorresponding period in 2008.22 Similarly, FDI inIndia from April to June 2009 was down 30%compared with the corresponding period in2008.23 Developed-country foreign enterprisesdid not pursue investments abroad for severalreasons – downward adjustment in expectationsof profitability of the investment, the need tosave funds for difficulties faced in their homemarkets in developed countries, and difficulty inobtaining financing due to the credit crunch.There will therefore be some reorientation in the
Reorientation in FDI is one aspect of a generalincrease in the importance of outbound FDIfrom the region. FDI outflows from South, East,and South-East Asia in 2008 increased by 7%to $186 billion.24 Here, again, the history ofChina’s outbound investment flows is spectacu-lar, albeit short.25 Until 2004 it had remainedinsignificant, but by 2007 had increased to $25billion, only to double to more than $50 billion in2008. There was some fall in outbound FDI inlate 2008 and early 2009 due to the crisis, asthe credit crunch made financing of such acqui-sitions more difficult. Outbound FDI from Indiain 2008, for example, was down by 7% tounder $17 billion, the first absolute fall in out-bound FDI from the country since 1999. Simi-larly the first half of 2009 saw outbound invest-ments from the country fall by 65% to under $3billion compared with the corresponding periodin 2008.26 In the medium term, the crisis islikely to increase the relative importance of FDIfrom the region as companies exploit the rela-tive weakness of enterprises in the developedworld to acquire some of their assets, either inthe developed world or of subsidiaries in devel-oping countries. Some of the largest invest-
22 Terence Poon, “Foreign direct investment in China continues to slide”, Wall Street Journal, Asia ed., Economysec. (online), 18 Aug. 2009; available from http://online.wsj.com/article/SB125047781996935959.html?KEYWORDS=%22foreign+direct+investment+in+china+continues+to+slide%22.
23 Economic Times, “FDI increased 8% in June to $2.58 bn”, News sec., Delhi, 19 Aug. 2009, available from http://economictimes.indiatimes.com/News/Economy/Finance/FDI-increased-8-in-June-to-258-bn/articleshow/4909780.cms.
24 UNCTAD, World Investment Report 2009: Transnational Corporations, Agricultural Production and Development(United Nations publication, Sales No. E.09.II.D.15), p. xxiii.
25 Rosen, Daniel H., and Thilo Hanemann, “China’s changing outbound foreign direct investment profile: drivers andpolicy implications”, Policy Brief No. PB09-14 (Washington, D.C.: Peterson Institute for International Economics,2009).
26 Emirates Business 24-7, “Domestic growth may help India’s outward FDI”, Dubai, available from www.business24-7.ae/Articles/2009/8/Pages/18082009/08192009_feb4d07748b44a9da4abc69e871fac2c.aspx.
In the medium term, the crisis is likelyto increase the relative importance
of FDI from the region
sources of FDI, as more investment comesfrom enterprises of countries within the regionthat are relatively profitable.
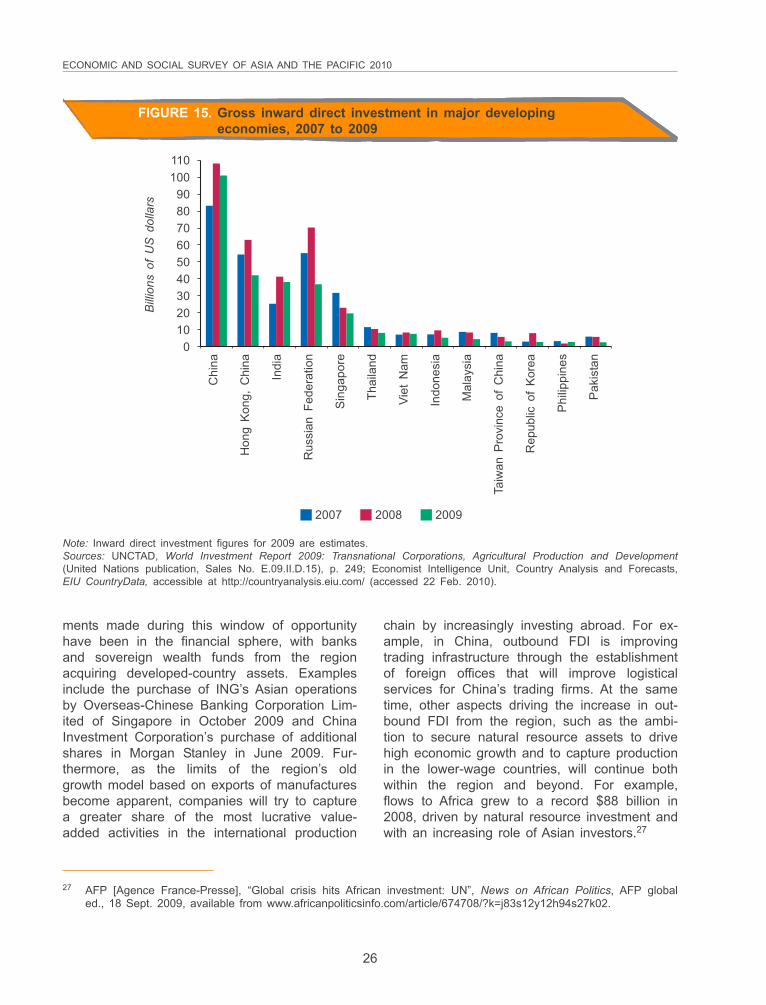
ECONOMIC AND SOCIAL SURVEY OF ASIA AND THE PACIFIC 2010
26
FIGURE 15. Gross inward direct investment in major developingeconomies, 2007 to 2009
110100
908070605040302010
0
Bill
ions
of
US
dol
lars
Chi
na
Hon
g K
ong,
Chi
na
Indi
a
Rus
sian
Fed
erat
ion
Sin
gapo
re
Thai
land
Viet
Nam
Indo
nesi
a
Mal
aysi
a
Taiw
an P
rovi
nce
of C
hina
Rep
ublic
of
Kor
ea
Phi
lippi
nes
Pak
ista
n
2007 2008 2009
Note: Inward direct investment figures for 2009 are estimates.Sources: UNCTAD, World Investment Report 2009: Transnational Corporations, Agricultural Production and Development(United Nations publication, Sales No. E.09.II.D.15), p. 249; Economist Intelligence Unit, Country Analysis and Forecasts,EIU CountryData, accessible at http://countryanalysis.eiu.com/ (accessed 22 Feb. 2010).
ments made during this window of opportunityhave been in the financial sphere, with banksand sovereign wealth funds from the regionacquiring developed-country assets. Examplesinclude the purchase of ING’s Asian operationsby Overseas-Chinese Banking Corporation Lim-ited of Singapore in October 2009 and ChinaInvestment Corporation’s purchase of additionalshares in Morgan Stanley in June 2009. Fur-thermore, as the limits of the region’s oldgrowth model based on exports of manufacturesbecome apparent, companies will try to capturea greater share of the most lucrative value-added activities in the international production
chain by increasingly investing abroad. For ex-ample, in China, outbound FDI is improvingtrading infrastructure through the establishmentof foreign offices that will improve logisticalservices for China’s trading firms. At the sametime, other aspects driving the increase in out-bound FDI from the region, such as the ambi-tion to secure natural resource assets to drivehigh economic growth and to capture productionin the lower-wage countries, will continue bothwithin the region and beyond. For example,flows to Africa grew to a record $88 billion in2008, driven by natural resource investment andwith an increasing role of Asian investors.27
27 AFP [Agence France-Presse], “Global crisis hits African investment: UN”, News on African Politics, AFP globaled., 18 Sept. 2009, available from www.africanpoliticsinfo.com/article/674708/?k=j83s12y12h94s27k02.
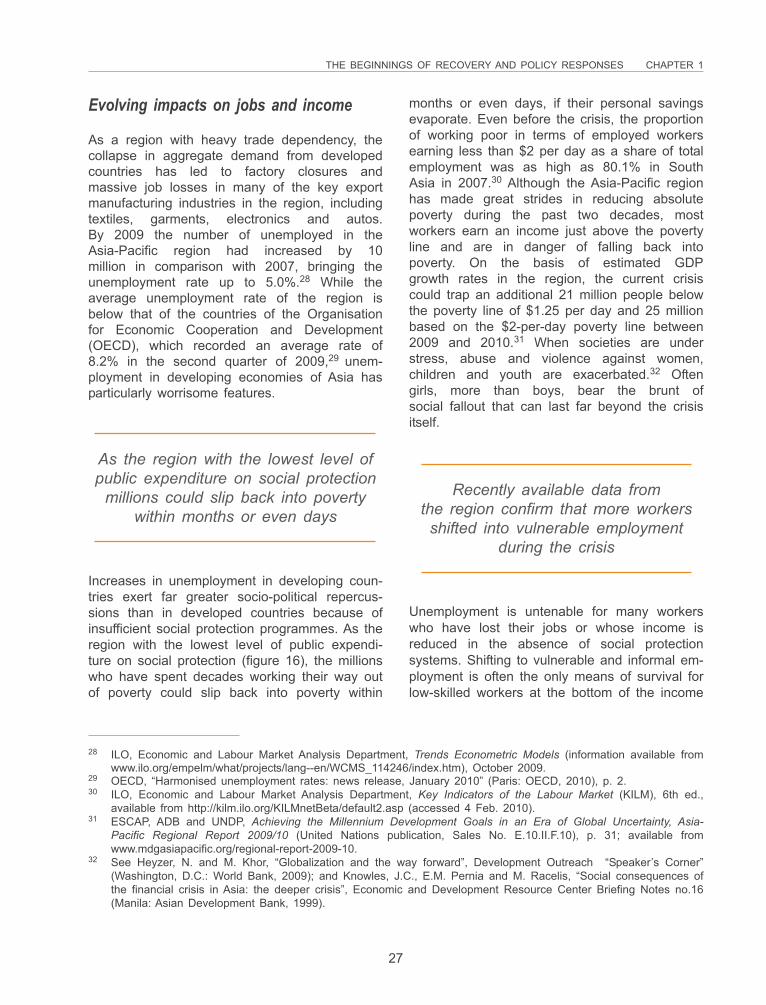
THE BEGINNINGS OF RECOVERY AND POLICY RESPONSES CHAPTER 1
27
Evolving impacts on jobs and income
As a region with heavy trade dependency, thecollapse in aggregate demand from developedcountries has led to factory closures andmassive job losses in many of the key exportmanufacturing industries in the region, includingtextiles, garments, electronics and autos.By 2009 the number of unemployed in theAsia-Pacific region had increased by 10million in comparison with 2007, bringing theunemployment rate up to 5.0%.28 While theaverage unemployment rate of the region isbelow that of the countries of the Organisationfor Economic Cooperation and Development(OECD), which recorded an average rate of8.2% in the second quarter of 2009,29 unem-ployment in developing economies of Asia hasparticularly worrisome features.
months or even days, if their personal savingsevaporate. Even before the crisis, the proportionof working poor in terms of employed workersearning less than $2 per day as a share of totalemployment was as high as 80.1% in SouthAsia in 2007.30 Although the Asia-Pacific regionhas made great strides in reducing absolutepoverty during the past two decades, mostworkers earn an income just above the povertyline and are in danger of falling back intopoverty. On the basis of estimated GDPgrowth rates in the region, the current crisiscould trap an additional 21 million people belowthe poverty line of $1.25 per day and 25 millionbased on the $2-per-day poverty line between2009 and 2010.31 When societies are understress, abuse and violence against women,children and youth are exacerbated.32 Oftengirls, more than boys, bear the brunt ofsocial fallout that can last far beyond the crisisitself.
As the region with the lowest level ofpublic expenditure on social protection
millions could slip back into povertywithin months or even days
28 ILO, Economic and Labour Market Analysis Department, Trends Econometric Models (information available fromwww.ilo.org/empelm/what/projects/lang--en/WCMS_114246/index.htm), October 2009.
29 OECD, “Harmonised unemployment rates: news release, January 2010” (Paris: OECD, 2010), p. 2.30 ILO, Economic and Labour Market Analysis Department, Key Indicators of the Labour Market (KILM), 6th ed.,
available from http://kilm.ilo.org/KILMnetBeta/default2.asp (accessed 4 Feb. 2010).31 ESCAP, ADB and UNDP, Achieving the Millennium Development Goals in an Era of Global Uncertainty, Asia-
Pacific Regional Report 2009/10 (United Nations publication, Sales No. E.10.II.F.10), p. 31; available fromwww.mdgasiapacific.org/regional-report-2009-10.
32 See Heyzer, N. and M. Khor, “Globalization and the way forward”, Development Outreach “Speaker’s Corner”(Washington, D.C.: World Bank, 2009); and Knowles, J.C., E.M. Pernia and M. Racelis, “Social consequences ofthe financial crisis in Asia: the deeper crisis”, Economic and Development Resource Center Briefing Notes no.16(Manila: Asian Development Bank, 1999).
Increases in unemployment in developing coun-tries exert far greater socio-political repercus-sions than in developed countries because ofinsufficient social protection programmes. As theregion with the lowest level of public expendi-ture on social protection (figure 16), the millionswho have spent decades working their way outof poverty could slip back into poverty within
Recently available data fromthe region confirm that more workers
shifted into vulnerable employmentduring the crisis
Unemployment is untenable for many workerswho have lost their jobs or whose income isreduced in the absence of social protectionsystems. Shifting to vulnerable and informal em-ployment is often the only means of survival forlow-skilled workers at the bottom of the income
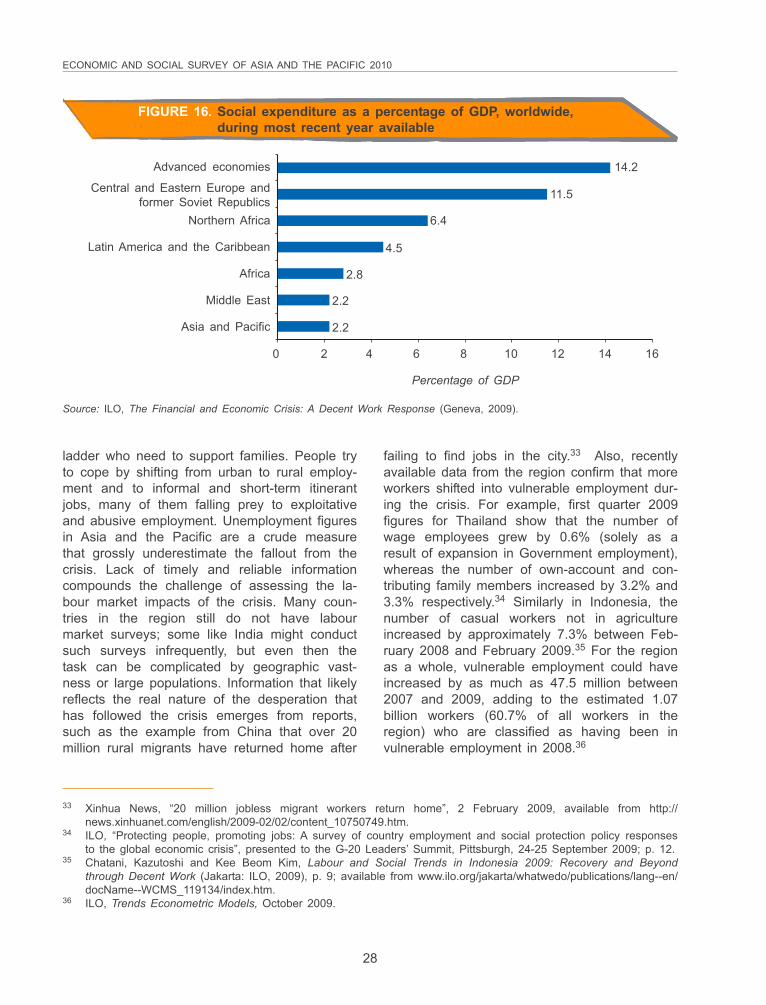
ECONOMIC AND SOCIAL SURVEY OF ASIA AND THE PACIFIC 2010
28
FIGURE 16. Social expenditure as a percentage of GDP, worldwide,during most recent year available
Advanced economies
Central and Eastern Europe andformer Soviet Republics
Northern Africa
Latin America and the Caribbean
Africa
Middle East
Asia and Pacific
0 2 4 6 8 10 12 14 16
Percentage of GDP
14.2
11.5
6.4
4.5
2.8
2.2
2.2
Source: ILO, The Financial and Economic Crisis: A Decent Work Response (Geneva, 2009).
ladder who need to support families. People tryto cope by shifting from urban to rural employ-ment and to informal and short-term itinerantjobs, many of them falling prey to exploitativeand abusive employment. Unemployment figuresin Asia and the Pacific are a crude measurethat grossly underestimate the fallout from thecrisis. Lack of timely and reliable informationcompounds the challenge of assessing the la-bour market impacts of the crisis. Many coun-tries in the region still do not have labourmarket surveys; some like India might conductsuch surveys infrequently, but even then thetask can be complicated by geographic vast-ness or large populations. Information that likelyreflects the real nature of the desperation thathas followed the crisis emerges from reports,such as the example from China that over 20million rural migrants have returned home after
failing to find jobs in the city.33 Also, recentlyavailable data from the region confirm that moreworkers shifted into vulnerable employment dur-ing the crisis. For example, first quarter 2009figures for Thailand show that the number ofwage employees grew by 0.6% (solely as aresult of expansion in Government employment),whereas the number of own-account and con-tributing family members increased by 3.2% and3.3% respectively.34 Similarly in Indonesia, thenumber of casual workers not in agricultureincreased by approximately 7.3% between Feb-ruary 2008 and February 2009.35 For the regionas a whole, vulnerable employment could haveincreased by as much as 47.5 million between2007 and 2009, adding to the estimated 1.07billion workers (60.7% of all workers in theregion) who are classified as having been invulnerable employment in 2008.36
33 Xinhua News, “20 million jobless migrant workers return home”, 2 February 2009, available from http://news.xinhuanet.com/english/2009-02/02/content_10750749.htm.
34 ILO, “Protecting people, promoting jobs: A survey of country employment and social protection policy responsesto the global economic crisis”, presented to the G-20 Leaders’ Summit, Pittsburgh, 24-25 September 2009; p. 12.
35 Chatani, Kazutoshi and Kee Beom Kim, Labour and Social Trends in Indonesia 2009: Recovery and Beyondthrough Decent Work (Jakarta: ILO, 2009), p. 9; available from www.ilo.org/jakarta/whatwedo/publications/lang--en/docName--WCMS_119134/index.htm.
36 ILO, Trends Econometric Models, October 2009.
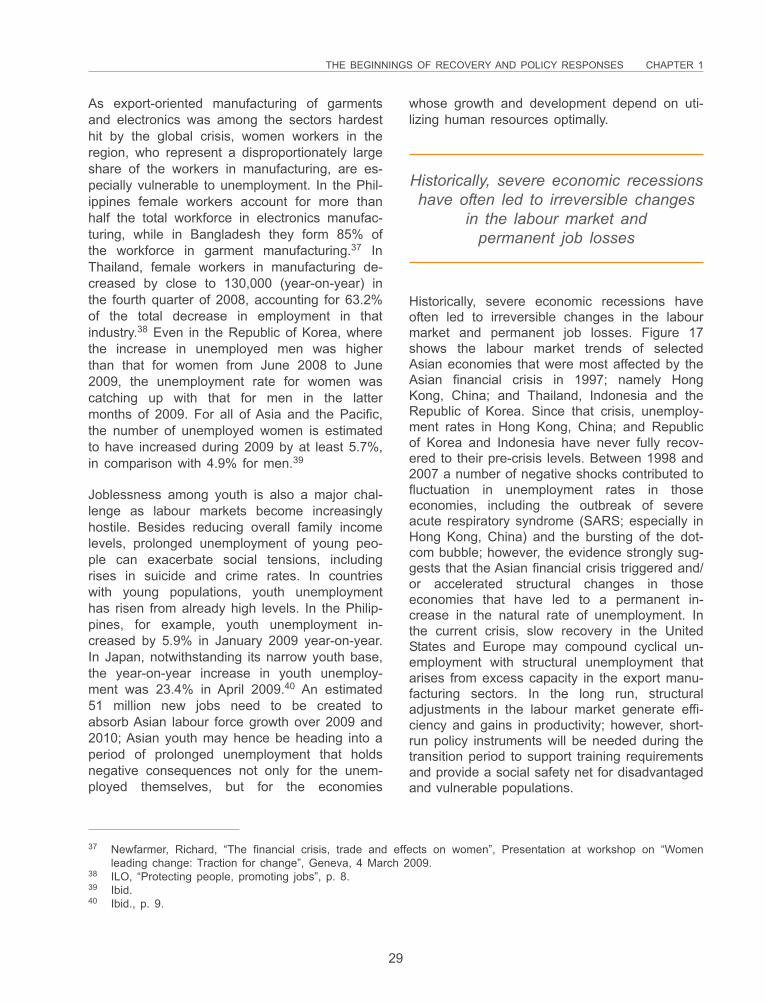
THE BEGINNINGS OF RECOVERY AND POLICY RESPONSES CHAPTER 1
29
As export-oriented manufacturing of garmentsand electronics was among the sectors hardesthit by the global crisis, women workers in theregion, who represent a disproportionately largeshare of the workers in manufacturing, are es-pecially vulnerable to unemployment. In the Phil-ippines female workers account for more thanhalf the total workforce in electronics manufac-turing, while in Bangladesh they form 85% ofthe workforce in garment manufacturing.37 InThailand, female workers in manufacturing de-creased by close to 130,000 (year-on-year) inthe fourth quarter of 2008, accounting for 63.2%of the total decrease in employment in thatindustry.38 Even in the Republic of Korea, wherethe increase in unemployed men was higherthan that for women from June 2008 to June2009, the unemployment rate for women wascatching up with that for men in the lattermonths of 2009. For all of Asia and the Pacific,the number of unemployed women is estimatedto have increased during 2009 by at least 5.7%,in comparison with 4.9% for men.39
Joblessness among youth is also a major chal-lenge as labour markets become increasinglyhostile. Besides reducing overall family incomelevels, prolonged unemployment of young peo-ple can exacerbate social tensions, includingrises in suicide and crime rates. In countrieswith young populations, youth unemploymenthas risen from already high levels. In the Philip-pines, for example, youth unemployment in-creased by 5.9% in January 2009 year-on-year.In Japan, notwithstanding its narrow youth base,the year-on-year increase in youth unemploy-ment was 23.4% in April 2009.40 An estimated51 million new jobs need to be created toabsorb Asian labour force growth over 2009 and2010; Asian youth may hence be heading into aperiod of prolonged unemployment that holdsnegative consequences not only for the unem-ployed themselves, but for the economies
Historically, severe economic recessions haveoften led to irreversible changes in the labourmarket and permanent job losses. Figure 17shows the labour market trends of selectedAsian economies that were most affected by theAsian financial crisis in 1997; namely HongKong, China; and Thailand, Indonesia and theRepublic of Korea. Since that crisis, unemploy-ment rates in Hong Kong, China; and Republicof Korea and Indonesia have never fully recov-ered to their pre-crisis levels. Between 1998 and2007 a number of negative shocks contributed tofluctuation in unemployment rates in thoseeconomies, including the outbreak of severeacute respiratory syndrome (SARS; especially inHong Kong, China) and the bursting of the dot-com bubble; however, the evidence strongly sug-gests that the Asian financial crisis triggered and/or accelerated structural changes in thoseeconomies that have led to a permanent in-crease in the natural rate of unemployment. Inthe current crisis, slow recovery in the UnitedStates and Europe may compound cyclical un-employment with structural unemployment thatarises from excess capacity in the export manu-facturing sectors. In the long run, structuraladjustments in the labour market generate effi-ciency and gains in productivity; however, short-run policy instruments will be needed during thetransition period to support training requirementsand provide a social safety net for disadvantagedand vulnerable populations.
37 Newfarmer, Richard, “The financial crisis, trade and effects on women”, Presentation at workshop on “Womenleading change: Traction for change”, Geneva, 4 March 2009.
38 ILO, “Protecting people, promoting jobs”, p. 8.39 Ibid.40 Ibid., p. 9.
Historically, severe economic recessionshave often led to irreversible changes
in the labour market andpermanent job losses
whose growth and development depend on uti-lizing human resources optimally.
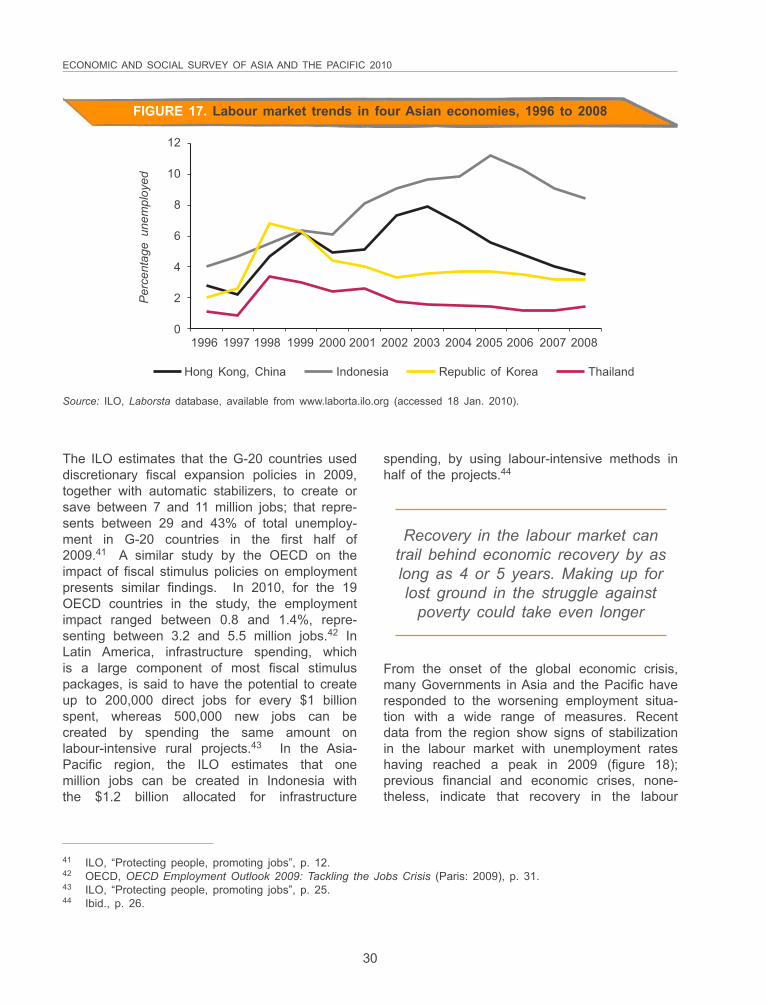
ECONOMIC AND SOCIAL SURVEY OF ASIA AND THE PACIFIC 2010
30
Source: ILO, Laborsta database, available from www.laborta.ilo.org (accessed 18 Jan. 2010).
FIGURE 17. Labour market trends in four Asian economies, 1996 to 2008
12
10
8
6
4
2
0
Per
cent
age
unem
ploy
ed
1996 1997 1998 1999 2000 2001 2002 2003 2004 2005 2006 2007 2008
Hong Kong, China Indonesia Republic of Korea Thailand
41 ILO, “Protecting people, promoting jobs”, p. 12.42 OECD, OECD Employment Outlook 2009: Tackling the Jobs Crisis (Paris: 2009), p. 31.43 ILO, “Protecting people, promoting jobs”, p. 25.44 Ibid., p. 26.
The ILO estimates that the G-20 countries useddiscretionary fiscal expansion policies in 2009,together with automatic stabilizers, to create orsave between 7 and 11 million jobs; that repre-sents between 29 and 43% of total unemploy-ment in G-20 countries in the first half of2009.41 A similar study by the OECD on theimpact of fiscal stimulus policies on employmentpresents similar findings. In 2010, for the 19OECD countries in the study, the employmentimpact ranged between 0.8 and 1.4%, repre-senting between 3.2 and 5.5 million jobs.42 InLatin America, infrastructure spending, whichis a large component of most fiscal stimuluspackages, is said to have the potential to createup to 200,000 direct jobs for every $1 billionspent, whereas 500,000 new jobs can becreated by spending the same amount onlabour-intensive rural projects.43 In the Asia-Pacific region, the ILO estimates that onemillion jobs can be created in Indonesia withthe $1.2 billion allocated for infrastructure
spending, by using labour-intensive methods inhalf of the projects.44
Recovery in the labour market cantrail behind economic recovery by aslong as 4 or 5 years. Making up forlost ground in the struggle against
poverty could take even longer
From the onset of the global economic crisis,many Governments in Asia and the Pacific haveresponded to the worsening employment situa-tion with a wide range of measures. Recentdata from the region show signs of stabilizationin the labour market with unemployment rateshaving reached a peak in 2009 (figure 18);previous financial and economic crises, none-theless, indicate that recovery in the labour
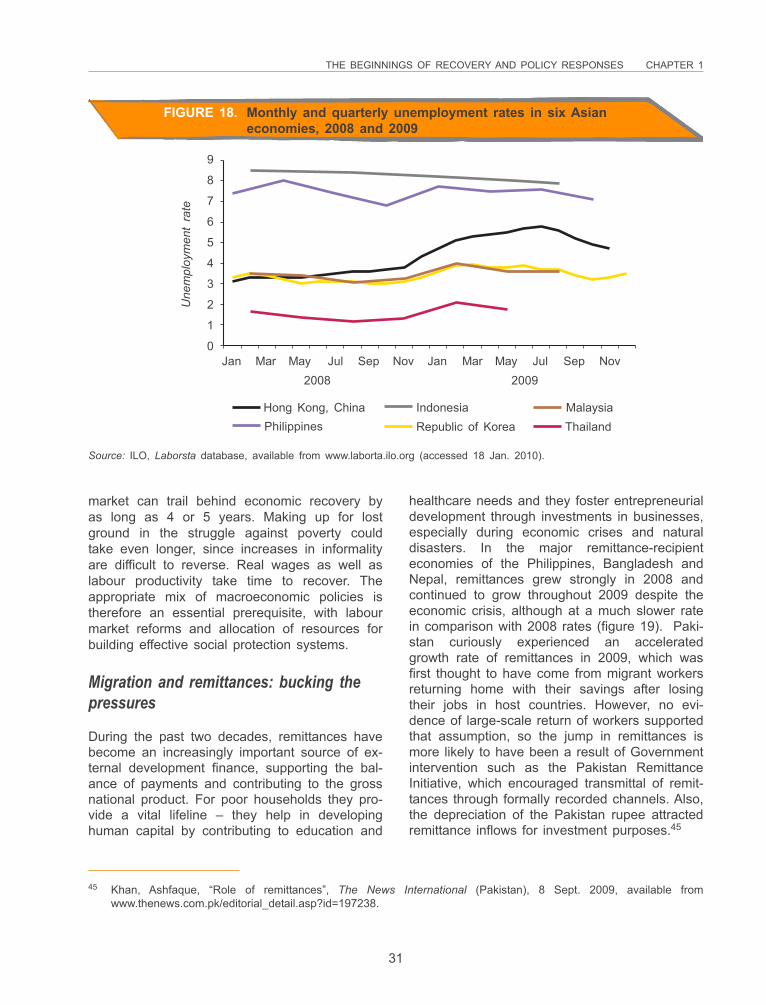
THE BEGINNINGS OF RECOVERY AND POLICY RESPONSES CHAPTER 1
31
FIGURE 18. Monthly and quarterly unemployment rates in six Asianeconomies, 2008 and 2009
9
8
7
6
5
4
3
2
1
0
Une
mpl
oym
ent
rate
Jan Mar May Jul Sep Nov Jan Mar May Jul Sep Nov
Hong Kong, ChinaRepublic of Korea
MalaysiaPhilippines Thailand
Indonesia
Source: ILO, Laborsta database, available from www.laborta.ilo.org (accessed 18 Jan. 2010).
market can trail behind economic recovery byas long as 4 or 5 years. Making up for lostground in the struggle against poverty couldtake even longer, since increases in informalityare difficult to reverse. Real wages as well aslabour productivity take time to recover. Theappropriate mix of macroeconomic policies istherefore an essential prerequisite, with labourmarket reforms and allocation of resources forbuilding effective social protection systems.
Migration and remittances: bucking thepressures
During the past two decades, remittances havebecome an increasingly important source of ex-ternal development finance, supporting the bal-ance of payments and contributing to the grossnational product. For poor households they pro-vide a vital lifeline – they help in developinghuman capital by contributing to education and
healthcare needs and they foster entrepreneurialdevelopment through investments in businesses,especially during economic crises and naturaldisasters. In the major remittance-recipienteconomies of the Philippines, Bangladesh andNepal, remittances grew strongly in 2008 andcontinued to grow throughout 2009 despite theeconomic crisis, although at a much slower ratein comparison with 2008 rates (figure 19). Paki-stan curiously experienced an acceleratedgrowth rate of remittances in 2009, which wasfirst thought to have come from migrant workersreturning home with their savings after losingtheir jobs in host countries. However, no evi-dence of large-scale return of workers supportedthat assumption, so the jump in remittances ismore likely to have been a result of Governmentintervention such as the Pakistan RemittanceInitiative, which encouraged transmittal of remit-tances through formally recorded channels. Also,the depreciation of the Pakistan rupee attractedremittance inflows for investment purposes.45
45 Khan, Ashfaque, “Role of remittances”, The News International (Pakistan), 8 Sept. 2009, available fromwww.thenews.com.pk/editorial_detail.asp?id=197238.
2008 2009
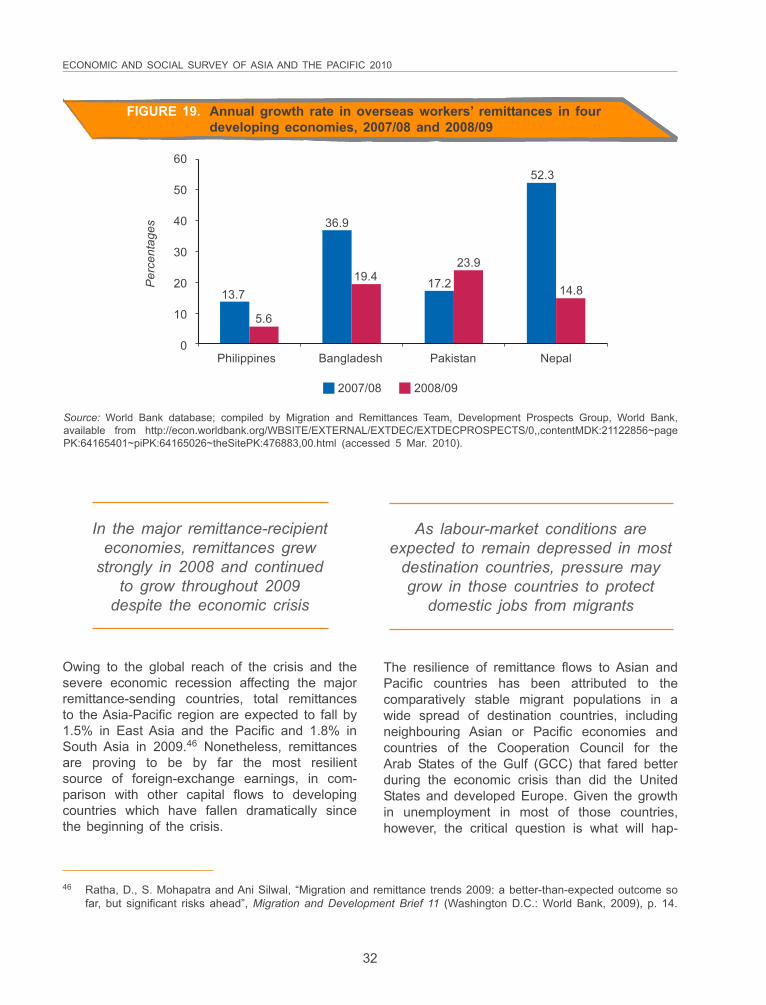
ECONOMIC AND SOCIAL SURVEY OF ASIA AND THE PACIFIC 2010
32
Owing to the global reach of the crisis and thesevere economic recession affecting the majorremittance-sending countries, total remittancesto the Asia-Pacific region are expected to fall by1.5% in East Asia and the Pacific and 1.8% inSouth Asia in 2009.46 Nonetheless, remittancesare proving to be by far the most resilientsource of foreign-exchange earnings, in com-parison with other capital flows to developingcountries which have fallen dramatically sincethe beginning of the crisis.
Source: World Bank database; compiled by Migration and Remittances Team, Development Prospects Group, World Bank,available from http://econ.worldbank.org/WBSITE/EXTERNAL/EXTDEC/EXTDECPROSPECTS/0,,contentMDK:21122856~pagePK:64165401~piPK:64165026~theSitePK:476883,00.html (accessed 5 Mar. 2010).
FIGURE 19. Annual growth rate in overseas workers’ remittances in fourdeveloping economies, 2007/08 and 2008/09
60
50
40
30
20
10
0
Per
cent
ages
Philippines Bangladesh Pakistan Nepal
13.7
5.6
36.9
19.4 17.2
23.9
52.3
14.8
2007/08 2008/09
In the major remittance-recipienteconomies, remittances grew
strongly in 2008 and continuedto grow throughout 2009
despite the economic crisis
46 Ratha, D., S. Mohapatra and Ani Silwal, “Migration and remittance trends 2009: a better-than-expected outcome sofar, but significant risks ahead”, Migration and Development Brief 11 (Washington D.C.: World Bank, 2009), p. 14.
The resilience of remittance flows to Asian andPacific countries has been attributed to thecomparatively stable migrant populations in awide spread of destination countries, includingneighbouring Asian or Pacific economies andcountries of the Cooperation Council for theArab States of the Gulf (GCC) that fared betterduring the economic crisis than did the UnitedStates and developed Europe. Given the growthin unemployment in most of those countries,however, the critical question is what will hap-
As labour-market conditions areexpected to remain depressed in most
destination countries, pressure maygrow in those countries to protect
domestic jobs from migrants
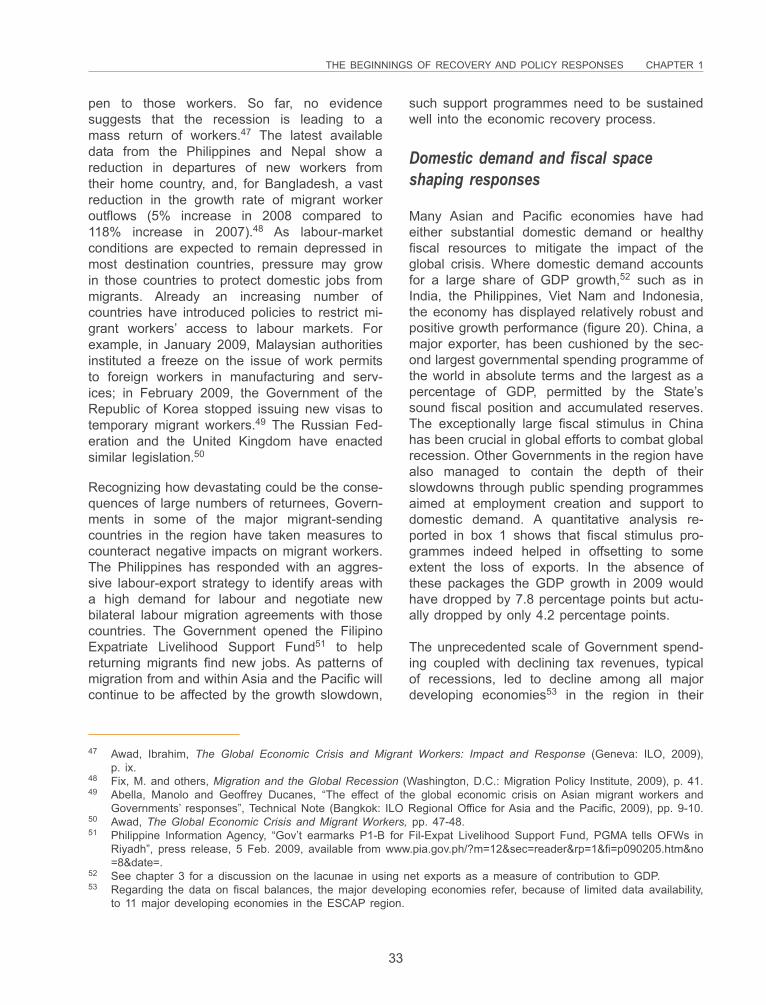
THE BEGINNINGS OF RECOVERY AND POLICY RESPONSES CHAPTER 1
33
pen to those workers. So far, no evidencesuggests that the recession is leading to amass return of workers.47 The latest availabledata from the Philippines and Nepal show areduction in departures of new workers fromtheir home country, and, for Bangladesh, a vastreduction in the growth rate of migrant workeroutflows (5% increase in 2008 compared to118% increase in 2007).48 As labour-marketconditions are expected to remain depressed inmost destination countries, pressure may growin those countries to protect domestic jobs frommigrants. Already an increasing number ofcountries have introduced policies to restrict mi-grant workers’ access to labour markets. Forexample, in January 2009, Malaysian authoritiesinstituted a freeze on the issue of work permitsto foreign workers in manufacturing and serv-ices; in February 2009, the Government of theRepublic of Korea stopped issuing new visas totemporary migrant workers.49 The Russian Fed-eration and the United Kingdom have enactedsimilar legislation.50
Recognizing how devastating could be the conse-quences of large numbers of returnees, Govern-ments in some of the major migrant-sendingcountries in the region have taken measures tocounteract negative impacts on migrant workers.The Philippines has responded with an aggres-sive labour-export strategy to identify areas witha high demand for labour and negotiate newbilateral labour migration agreements with thosecountries. The Government opened the FilipinoExpatriate Livelihood Support Fund51 to helpreturning migrants find new jobs. As patterns ofmigration from and within Asia and the Pacific willcontinue to be affected by the growth slowdown,
such support programmes need to be sustainedwell into the economic recovery process.
Domestic demand and fiscal spaceshaping responses
Many Asian and Pacific economies have hadeither substantial domestic demand or healthyfiscal resources to mitigate the impact of theglobal crisis. Where domestic demand accountsfor a large share of GDP growth,52 such as inIndia, the Philippines, Viet Nam and Indonesia,the economy has displayed relatively robust andpositive growth performance (figure 20). China, amajor exporter, has been cushioned by the sec-ond largest governmental spending programme ofthe world in absolute terms and the largest as apercentage of GDP, permitted by the State’ssound fiscal position and accumulated reserves.The exceptionally large fiscal stimulus in Chinahas been crucial in global efforts to combat globalrecession. Other Governments in the region havealso managed to contain the depth of theirslowdowns through public spending programmesaimed at employment creation and support todomestic demand. A quantitative analysis re-ported in box 1 shows that fiscal stimulus pro-grammes indeed helped in offsetting to someextent the loss of exports. In the absence ofthese packages the GDP growth in 2009 wouldhave dropped by 7.8 percentage points but actu-ally dropped by only 4.2 percentage points.
The unprecedented scale of Government spend-ing coupled with declining tax revenues, typicalof recessions, led to decline among all majordeveloping economies53 in the region in their
47 Awad, Ibrahim, The Global Economic Crisis and Migrant Workers: Impact and Response (Geneva: ILO, 2009),p. ix.
48 Fix, M. and others, Migration and the Global Recession (Washington, D.C.: Migration Policy Institute, 2009), p. 41.49 Abella, Manolo and Geoffrey Ducanes, “The effect of the global economic crisis on Asian migrant workers and
Governments’ responses”, Technical Note (Bangkok: ILO Regional Office for Asia and the Pacific, 2009), pp. 9-10.50 Awad, The Global Economic Crisis and Migrant Workers, pp. 47-48.51 Philippine Information Agency, “Gov’t earmarks P1-B for Fil-Expat Livelihood Support Fund, PGMA tells OFWs in
Riyadh”, press release, 5 Feb. 2009, available from www.pia.gov.ph/?m=12&sec=reader&rp=1&fi=p090205.htm&no=8&date=.
52 See chapter 3 for a discussion on the lacunae in using net exports as a measure of contribution to GDP.53 Regarding the data on fiscal balances, the major developing economies refer, because of limited data availability,
to 11 major developing economies in the ESCAP region.
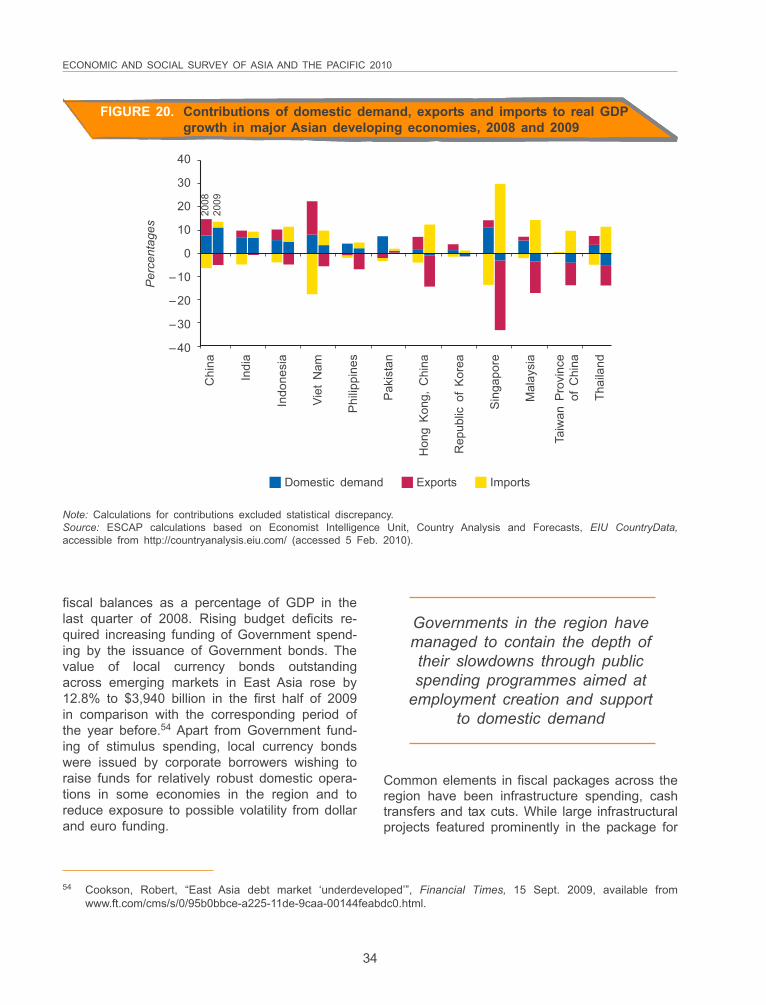
ECONOMIC AND SOCIAL SURVEY OF ASIA AND THE PACIFIC 2010
34
fiscal balances as a percentage of GDP in thelast quarter of 2008. Rising budget deficits re-quired increasing funding of Government spend-ing by the issuance of Government bonds. Thevalue of local currency bonds outstandingacross emerging markets in East Asia rose by12.8% to $3,940 billion in the first half of 2009in comparison with the corresponding period ofthe year before.54 Apart from Government fund-ing of stimulus spending, local currency bondswere issued by corporate borrowers wishing toraise funds for relatively robust domestic opera-tions in some economies in the region and toreduce exposure to possible volatility from dollarand euro funding.
Common elements in fiscal packages across theregion have been infrastructure spending, cashtransfers and tax cuts. While large infrastructuralprojects featured prominently in the package for
Governments in the region havemanaged to contain the depth oftheir slowdowns through publicspending programmes aimed at
employment creation and supportto domestic demand
54 Cookson, Robert, “East Asia debt market ‘underdeveloped’”, Financial Times, 15 Sept. 2009, available fromwww.ft.com/cms/s/0/95b0bbce-a225-11de-9caa-00144feabdc0.html.
Note: Calculations for contributions excluded statistical discrepancy.Source: ESCAP calculations based on Economist Intelligence Unit, Country Analysis and Forecasts, EIU CountryData,accessible from http://countryanalysis.eiu.com/ (accessed 5 Feb. 2010).
FIGURE 20. Contributions of domestic demand, exports and imports to real GDPgrowth in major Asian developing economies, 2008 and 2009
40
30
20
10
0
–10
–20
–30
–40
Per
cent
ages
Domestic demand Exports Imports
2008
2009
Chi
na
Indi
a
Indo
nesi
a
Viet
Nam
Phi
lippi
nes
Pak
ista
n
Hon
g K
ong,
Chi
na
Rep
ublic
of
Kor
ea
Sin
gapo
re
Mal
aysi
a
Taiw
an P
rovi
nce
of C
hina
Thai
land
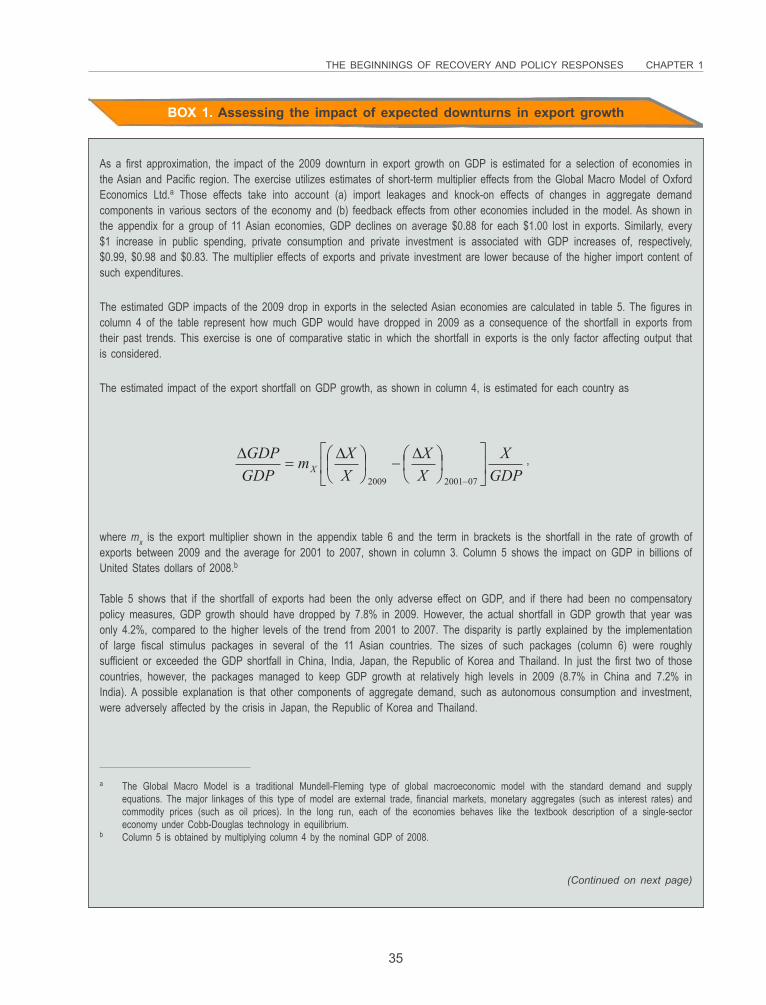
THE BEGINNINGS OF RECOVERY AND POLICY RESPONSES CHAPTER 1
35
As a first approximation, the impact of the 2009 downturn in export growth on GDP is estimated for a selection of economies inthe Asian and Pacific region. The exercise utilizes estimates of short-term multiplier effects from the Global Macro Model of OxfordEconomics Ltd.a Those effects take into account (a) import leakages and knock-on effects of changes in aggregate demandcomponents in various sectors of the economy and (b) feedback effects from other economies included in the model. As shown inthe appendix for a group of 11 Asian economies, GDP declines on average $0.88 for each $1.00 lost in exports. Similarly, every$1 increase in public spending, private consumption and private investment is associated with GDP increases of, respectively,$0.99, $0.98 and $0.83. The multiplier effects of exports and private investment are lower because of the higher import content ofsuch expenditures.
The estimated GDP impacts of the 2009 drop in exports in the selected Asian economies are calculated in table 5. The figures incolumn 4 of the table represent how much GDP would have dropped in 2009 as a consequence of the shortfall in exports fromtheir past trends. This exercise is one of comparative static in which the shortfall in exports is the only factor affecting output thatis considered.
The estimated impact of the export shortfall on GDP growth, as shown in column 4, is estimated for each country as
BOX 1. Assessing the impact of expected downturns in export growth
where mx is the export multiplier shown in the appendix table 6 and the term in brackets is the shortfall in the rate of growth ofexports between 2009 and the average for 2001 to 2007, shown in column 3. Column 5 shows the impact on GDP in billions ofUnited States dollars of 2008.b
Table 5 shows that if the shortfall of exports had been the only adverse effect on GDP, and if there had been no compensatorypolicy measures, GDP growth should have dropped by 7.8% in 2009. However, the actual shortfall in GDP growth that year wasonly 4.2%, compared to the higher levels of the trend from 2001 to 2007. The disparity is partly explained by the implementationof large fiscal stimulus packages in several of the 11 Asian countries. The sizes of such packages (column 6) were roughlysufficient or exceeded the GDP shortfall in China, India, Japan, the Republic of Korea and Thailand. In just the first two of thosecountries, however, the packages managed to keep GDP growth at relatively high levels in 2009 (8.7% in China and 7.2% inIndia). A possible explanation is that other components of aggregate demand, such as autonomous consumption and investment,were adversely affected by the crisis in Japan, the Republic of Korea and Thailand.
a The Global Macro Model is a traditional Mundell-Fleming type of global macroeconomic model with the standard demand and supplyequations. The major linkages of this type of model are external trade, financial markets, monetary aggregates (such as interest rates) andcommodity prices (such as oil prices). In the long run, each of the economies behaves like the textbook description of a single-sectoreconomy under Cobb-Douglas technology in equilibrium.
b Column 5 is obtained by multiplying column 4 by the nominal GDP of 2008.
(Continued on next page)
,GDP
X
X
X
X
Xm
GDP
GDP
X ��
���
��
��
���
��
��
�
�0720012009
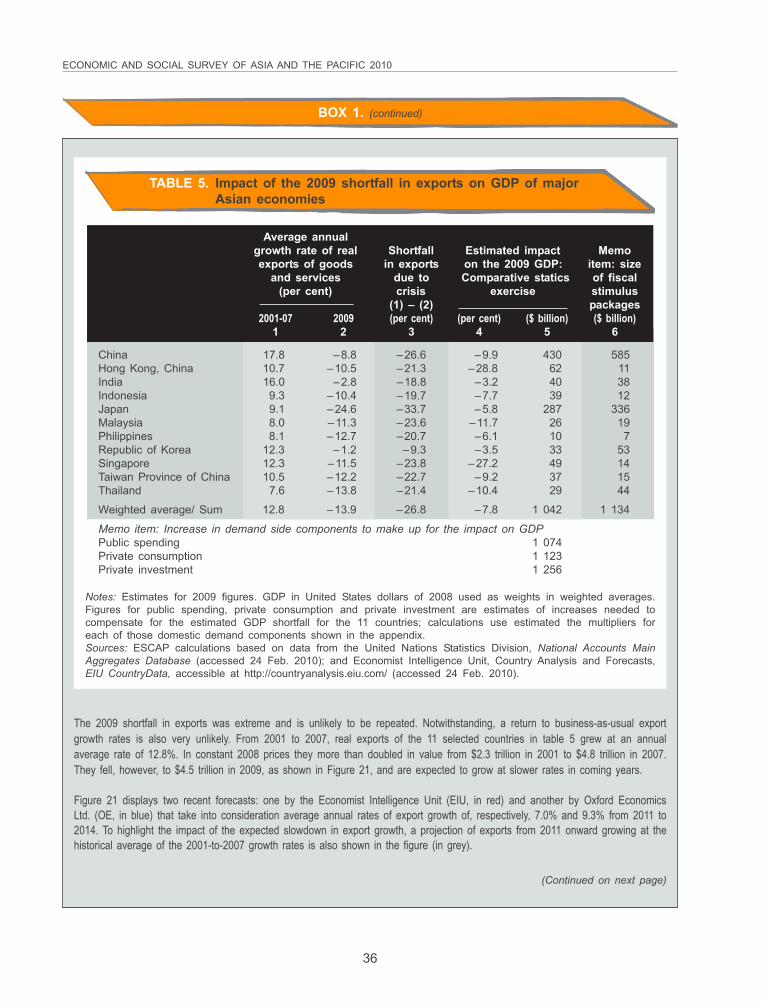
ECONOMIC AND SOCIAL SURVEY OF ASIA AND THE PACIFIC 2010
36
BOX 1. (continued)
Notes: Estimates for 2009 figures. GDP in United States dollars of 2008 used as weights in weighted averages.Figures for public spending, private consumption and private investment are estimates of increases needed tocompensate for the estimated GDP shortfall for the 11 countries; calculations use estimated the multipliers foreach of those domestic demand components shown in the appendix.Sources: ESCAP calculations based on data from the United Nations Statistics Division, National Accounts MainAggregates Database (accessed 24 Feb. 2010); and Economist Intelligence Unit, Country Analysis and Forecasts,EIU CountryData, accessible at http://countryanalysis.eiu.com/ (accessed 24 Feb. 2010).
The 2009 shortfall in exports was extreme and is unlikely to be repeated. Notwithstanding, a return to business-as-usual exportgrowth rates is also very unlikely. From 2001 to 2007, real exports of the 11 selected countries in table 5 grew at an annualaverage rate of 12.8%. In constant 2008 prices they more than doubled in value from $2.3 trillion in 2001 to $4.8 trillion in 2007.They fell, however, to $4.5 trillion in 2009, as shown in Figure 21, and are expected to grow at slower rates in coming years.
Figure 21 displays two recent forecasts: one by the Economist Intelligence Unit (EIU, in red) and another by Oxford EconomicsLtd. (OE, in blue) that take into consideration average annual rates of export growth of, respectively, 7.0% and 9.3% from 2011 to2014. To highlight the impact of the expected slowdown in export growth, a projection of exports from 2011 onward growing at thehistorical average of the 2001-to-2007 growth rates is also shown in the figure (in grey).
(Continued on next page)
Average annualgrowth rate of real Shortfall Estimated impact Memoexports of goods in exports on the 2009 GDP: item: size
and services due to Comparative statics of fiscal(per cent) crisis exercise stimulus
(1) – (2) packages2001-07 2009 (per cent) (per cent) ($ billion) ($ billion)
1 2 3 4 5 6
China 17.8 –8.8 –26.6 –9.9 430 585Hong Kong, China 10.7 –10.5 –21.3 –28.8 62 11India 16.0 –2.8 –18.8 –3.2 40 38Indonesia 9.3 –10.4 –19.7 –7.7 39 12Japan 9.1 –24.6 –33.7 –5.8 287 336Malaysia 8.0 –11.3 –23.6 –11.7 26 19Philippines 8.1 –12.7 –20.7 –6.1 10 7Republic of Korea 12.3 –1.2 –9.3 –3.5 33 53Singapore 12.3 –11.5 –23.8 –27.2 49 14Taiwan Province of China 10.5 –12.2 –22.7 –9.2 37 15Thailand 7.6 –13.8 –21.4 –10.4 29 44
Weighted average/ Sum 12.8 –13.9 –26.8 –7.8 1 042 1 134
Memo item: Increase in demand side components to make up for the impact on GDPPublic spending 1 074Private consumption 1 123Private investment 1 256
TABLE 5. Impact of the 2009 shortfall in exports on GDP of majorAsian economies
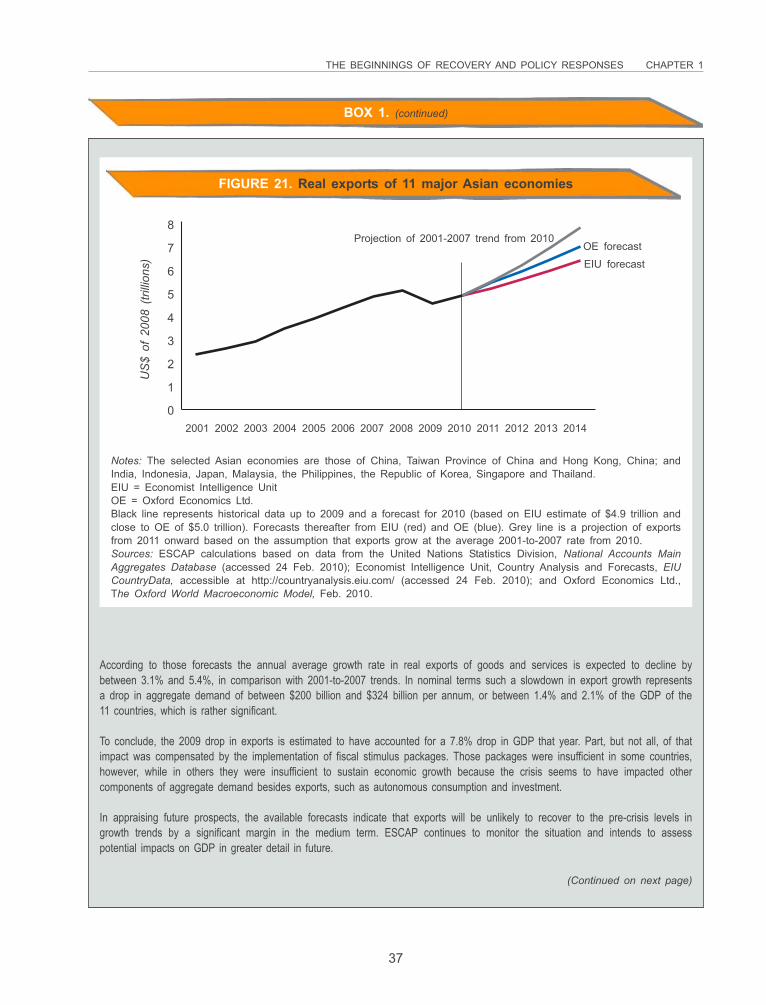
THE BEGINNINGS OF RECOVERY AND POLICY RESPONSES CHAPTER 1
37
8
7
6
5
4
3
2
1
0
US
$ of
200
8 (tr
illio
ns)
Projection of 2001-2007 trend from 2010
2001 2002 2003 2004 2005 2006 2007 2008 2009 2010 2011 2012 2013 2014
OE forecast
EIU forecast
Notes: The selected Asian economies are those of China, Taiwan Province of China and Hong Kong, China; andIndia, Indonesia, Japan, Malaysia, the Philippines, the Republic of Korea, Singapore and Thailand.EIU = Economist Intelligence UnitOE = Oxford Economics Ltd.Black line represents historical data up to 2009 and a forecast for 2010 (based on EIU estimate of $4.9 trillion andclose to OE of $5.0 trillion). Forecasts thereafter from EIU (red) and OE (blue). Grey line is a projection of exportsfrom 2011 onward based on the assumption that exports grow at the average 2001-to-2007 rate from 2010.Sources: ESCAP calculations based on data from the United Nations Statistics Division, National Accounts MainAggregates Database (accessed 24 Feb. 2010); Economist Intelligence Unit, Country Analysis and Forecasts, EIUCountryData, accessible at http://countryanalysis.eiu.com/ (accessed 24 Feb. 2010); and Oxford Economics Ltd.,The Oxford World Macroeconomic Model, Feb. 2010.
According to those forecasts the annual average growth rate in real exports of goods and services is expected to decline bybetween 3.1% and 5.4%, in comparison with 2001-to-2007 trends. In nominal terms such a slowdown in export growth representsa drop in aggregate demand of between $200 billion and $324 billion per annum, or between 1.4% and 2.1% of the GDP of the11 countries, which is rather significant.
To conclude, the 2009 drop in exports is estimated to have accounted for a 7.8% drop in GDP that year. Part, but not all, of thatimpact was compensated by the implementation of fiscal stimulus packages. Those packages were insufficient in some countries,however, while in others they were insufficient to sustain economic growth because the crisis seems to have impacted othercomponents of aggregate demand besides exports, such as autonomous consumption and investment.
In appraising future prospects, the available forecasts indicate that exports will be unlikely to recover to the pre-crisis levels ingrowth trends by a significant margin in the medium term. ESCAP continues to monitor the situation and intends to assesspotential impacts on GDP in greater detail in future.
BOX 1. (continued)
(Continued on next page)
FIGURE 21. Real exports of 11 major Asian economies
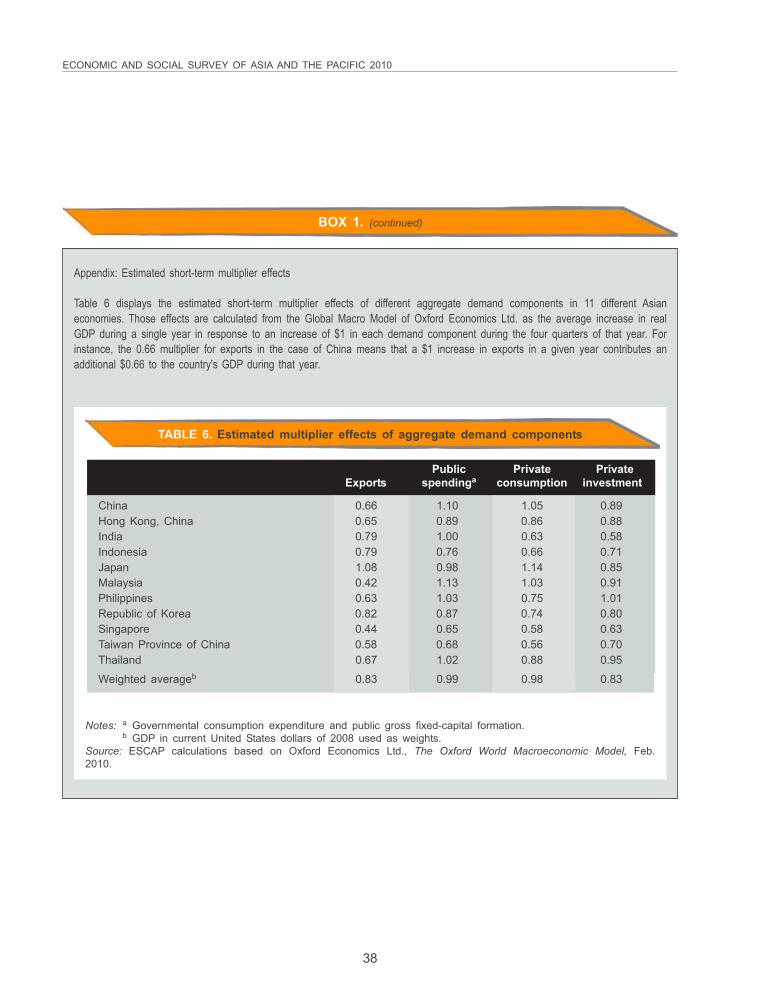
ECONOMIC AND SOCIAL SURVEY OF ASIA AND THE PACIFIC 2010
38
BOX 1. (continued)
Public Private PrivateExports spendinga consumption investment
China 0.66 1.10 1.05 0.89Hong Kong, China 0.65 0.89 0.86 0.88India 0.79 1.00 0.63 0.58Indonesia 0.79 0.76 0.66 0.71Japan 1.08 0.98 1.14 0.85Malaysia 0.42 1.13 1.03 0.91Philippines 0.63 1.03 0.75 1.01Republic of Korea 0.82 0.87 0.74 0.80Singapore 0.44 0.65 0.58 0.63Taiwan Province of China 0.58 0.68 0.56 0.70Thailand 0.67 1.02 0.88 0.95
Weighted averageb 0.83 0.99 0.98 0.83
Notes: a Governmental consumption expenditure and public gross fixed-capital formation.b GDP in current United States dollars of 2008 used as weights.
Source: ESCAP calculations based on Oxford Economics Ltd., The Oxford World Macroeconomic Model, Feb.2010.
TABLE 6. Estimated multiplier effects of aggregate demand components
Appendix: Estimated short-term multiplier effects
Table 6 displays the estimated short-term multiplier effects of different aggregate demand components in 11 different Asianeconomies. Those effects are calculated from the Global Macro Model of Oxford Economics Ltd. as the average increase in realGDP during a single year in response to an increase of $1 in each demand component during the four quarters of that year. Forinstance, the 0.66 multiplier for exports in the case of China means that a $1 increase in exports in a given year contributes anadditional $0.66 to the country's GDP during that year.
THE BEGINNINGS OF RECOVERY AND POLICY RESPONSES CHAPTER 1
39
China, as well as in subsequent packages intro-duced, by among others, Thailand, Malaysiaand Viet Nam, the focus so far has been onspending measures that can be deliveredquickly. China implemented significant spendingon social sectors and introduced measures thathelped sustain domestic private consumption ata level comparable to that in 2008, including taxbreaks and other forms of incentives for auto-mobile and electronics purchases, increases inpensions and introduction of a rural pensionprogramme. Income and business taxes werealso cut by, among others, Viet Nam, Indonesia,Malaysia, Thailand, India, Japan, the Republic ofKorea and Singapore. Cash transfer pro-grammes have been undertaken by the Philip-pines, Thailand, Japan, Singapore, and TaiwanProvince of China. Subsidies for transport, tech-nical innovation and the poor have increased, aswell as spending on education and healthcare.Measures to increase consumption have had thegreatest growth multiplier effect in consumption-led economies, as they are proportional to thesize of consumption as a portion of GDP in aneconomy. Thus, consumption-boosting measuresin such export-dependent economies as those ofChina and South-East Asia would not have asgreat an effect. Small, open trading economiesalso experience significant leakage of any stimu-lus spending through increased imports, implyingthat stimulus can play only a limited role inreviving growth until global demand recovers.
Other than the impact of reduced privateconsumption in developed countries on exports ofthe Asia-Pacific region, the choice of componentof fiscal spending in developed countries alsohas an impact on import demand as well asin comparison with direct measures to increaseprivate consumption spending. Governmentspending on public investment would have a lowerimpact on imports due to the import compositionof such spending, whereas spending on Govern-ment salaries would feed through to consumption,as would direct cash transfers to consumers.
To the extent that comparatively robust consump-tion in the region is directed to developed country
exports, developed economies can spur some oftheir own revival through the export channel.Such is the case particularly for commoditiesproducers like Australia. However, import de-mand from the region, most importantly fromChina and especially import demand for goodsused for infrastructure development in the coun-try supported by fiscal stimulus, is also sustainingexports of manufactured goods from developedcountries. For example, China overtook theUnited States as the leading export market forJapan during the first half of 2009,55 indicating anotable realignment in the relative importance toJapan of the Chinese and American markets.While Chinese demand for imports from Japanfell during the period, import demand from theUnited States for Japanese products fell evenmore. Recovery in Europe has also been aidedby demand from the region. Exports of the 16Euro Zone economies to East Asia rose by16.3% in the second quarter of 2009, in compari-son with a 14.4% drop during the first quarter.56
Monetary policies played a far smallerrole than fiscal policies in supporting
domestic demand
55 IMF, Direction of Trade Statistics, available from www2.imfstatistics.org/DOT/ (accessed 7 Jan. 2010).56 Ibid., East Asia refers to China; Hong Kong, China; Macao, China; Japan; Republic of Korea; and Mongolia.
Apart from wide-ranging fiscal measures, centralbanks have adopted very loose monetary poli-cies. Apart from interest rates set at near-zerolevels in many cases (figure 22), Governmentguarantees have been extended on bank depos-its and direct interventions to increase moneysupply have emerged in countries experiencingdeflationary pressures. While monetary policieshave been accommodative across most of theregion, they played a far smaller role than fiscalpolicies in supporting domestic demand, for thefollowing reasons. First, interest rates in manycountries were already low before the crisis,thus reducing policy leverage to stimulate theeconomy, while in some other countries rela-tively high inflationary pressures remained, de-
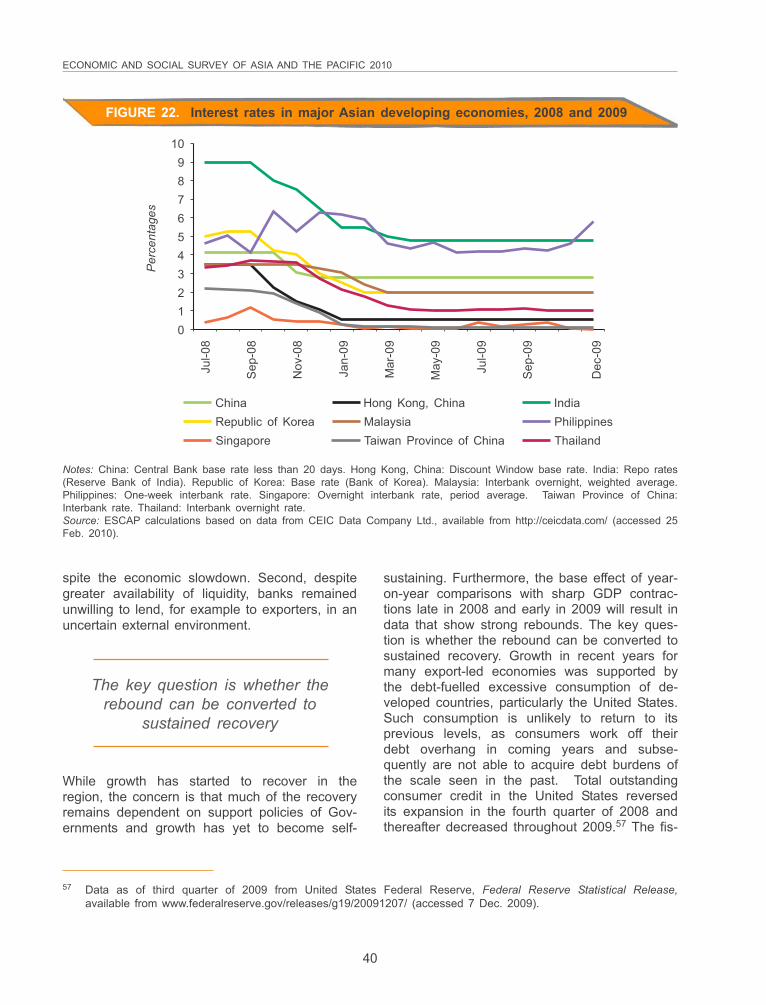
ECONOMIC AND SOCIAL SURVEY OF ASIA AND THE PACIFIC 2010
40
FIGURE 22. Interest rates in major Asian developing economies, 2008 and 2009
109876543210
Per
cent
ages
Jul-0
8
Sep
-08
Nov
-08
Jan-
09
Mar
-09
May
-09
Jul-0
9
Sep
-09
Dec
-09
China IndiaRepublic of Korea MalaysiaSingapore Taiwan Province of China
Hong Kong, ChinaPhilippinesThailand
Notes: China: Central Bank base rate less than 20 days. Hong Kong, China: Discount Window base rate. India: Repo rates(Reserve Bank of India). Republic of Korea: Base rate (Bank of Korea). Malaysia: Interbank overnight, weighted average.Philippines: One-week interbank rate. Singapore: Overnight interbank rate, period average. Taiwan Province of China:Interbank rate. Thailand: Interbank overnight rate.Source: ESCAP calculations based on data from CEIC Data Company Ltd., available from http://ceicdata.com/ (accessed 25Feb. 2010).
spite the economic slowdown. Second, despitegreater availability of liquidity, banks remainedunwilling to lend, for example to exporters, in anuncertain external environment.
sustaining. Furthermore, the base effect of year-on-year comparisons with sharp GDP contrac-tions late in 2008 and early in 2009 will result indata that show strong rebounds. The key ques-tion is whether the rebound can be converted tosustained recovery. Growth in recent years formany export-led economies was supported bythe debt-fuelled excessive consumption of de-veloped countries, particularly the United States.Such consumption is unlikely to return to itsprevious levels, as consumers work off theirdebt overhang in coming years and subse-quently are not able to acquire debt burdens ofthe scale seen in the past. Total outstandingconsumer credit in the United States reversedits expansion in the fourth quarter of 2008 andthereafter decreased throughout 2009.57 The fis-
The key question is whether therebound can be converted to
sustained recovery
57 Data as of third quarter of 2009 from United States Federal Reserve, Federal Reserve Statistical Release,available from www.federalreserve.gov/releases/g19/20091207/ (accessed 7 Dec. 2009).
While growth has started to recover in theregion, the concern is that much of the recoveryremains dependent on support policies of Gov-ernments and growth has yet to become self-
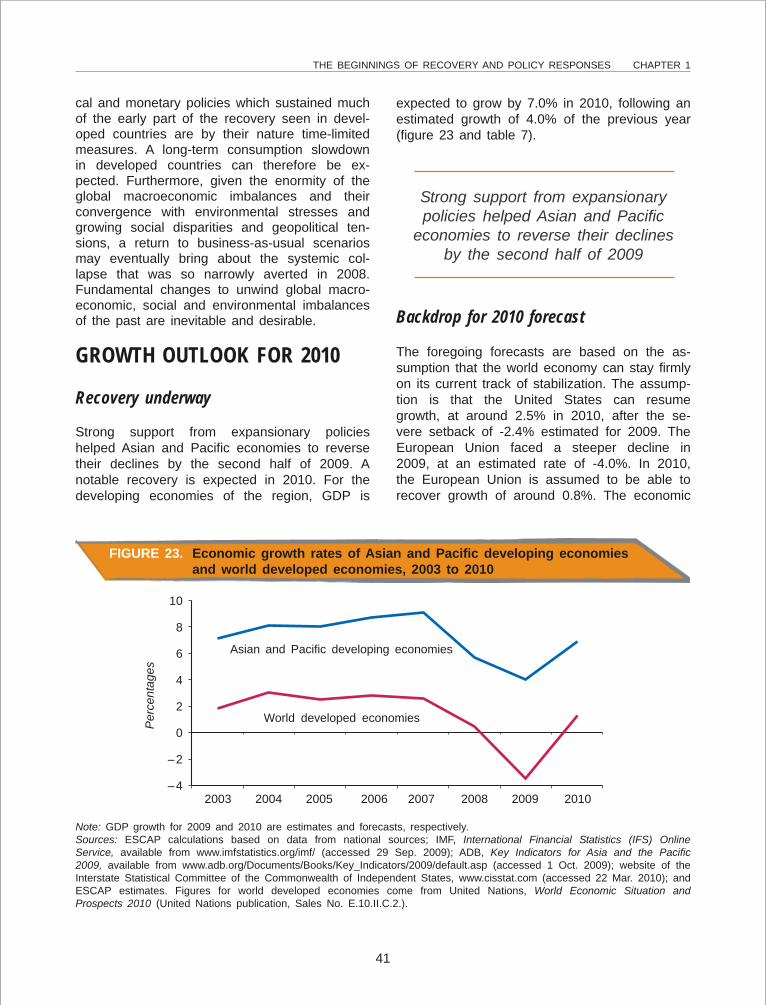
THE BEGINNINGS OF RECOVERY AND POLICY RESPONSES CHAPTER 1
41
cal and monetary policies which sustained muchof the early part of the recovery seen in devel-oped countries are by their nature time-limitedmeasures. A long-term consumption slowdownin developed countries can therefore be ex-pected. Furthermore, given the enormity of theglobal macroeconomic imbalances and theirconvergence with environmental stresses andgrowing social disparities and geopolitical ten-sions, a return to business-as-usual scenariosmay eventually bring about the systemic col-lapse that was so narrowly averted in 2008.Fundamental changes to unwind global macro-economic, social and environmental imbalancesof the past are inevitable and desirable.
GROWTH OUTLOOK FOR 2010
Recovery underway
Strong support from expansionary policieshelped Asian and Pacific economies to reversetheir declines by the second half of 2009. Anotable recovery is expected in 2010. For thedeveloping economies of the region, GDP is
expected to grow by 7.0% in 2010, following anestimated growth of 4.0% of the previous year(figure 23 and table 7).
Note: GDP growth for 2009 and 2010 are estimates and forecasts, respectively.Sources: ESCAP calculations based on data from national sources; IMF, International Financial Statistics (IFS) OnlineService, available from www.imfstatistics.org/imf/ (accessed 29 Sep. 2009); ADB, Key Indicators for Asia and the Pacific2009, available from www.adb.org/Documents/Books/Key_Indicators/2009/default.asp (accessed 1 Oct. 2009); website of theInterstate Statistical Committee of the Commonwealth of Independent States, www.cisstat.com (accessed 22 Mar. 2010); andESCAP estimates. Figures for world developed economies come from United Nations, World Economic Situation andProspects 2010 (United Nations publication, Sales No. E.10.II.C.2.).
FIGURE 23. Economic growth rates of Asian and Pacific developing economiesand world developed economies, 2003 to 2010
10
8
6
4
2
0
–2
–4
Per
cent
ages
2003 2004 2005 2006 2007 2008 2009 2010
Asian and Pacific developing economies
World developed economies
Strong support from expansionarypolicies helped Asian and Pacific
economies to reverse their declinesby the second half of 2009
Backdrop for 2010 forecast
The foregoing forecasts are based on the as-sumption that the world economy can stay firmlyon its current track of stabilization. The assump-tion is that the United States can resumegrowth, at around 2.5% in 2010, after the se-vere setback of -2.4% estimated for 2009. TheEuropean Union faced a steeper decline in2009, at an estimated rate of -4.0%. In 2010,the European Union is assumed to be able torecover growth of around 0.8%. The economic
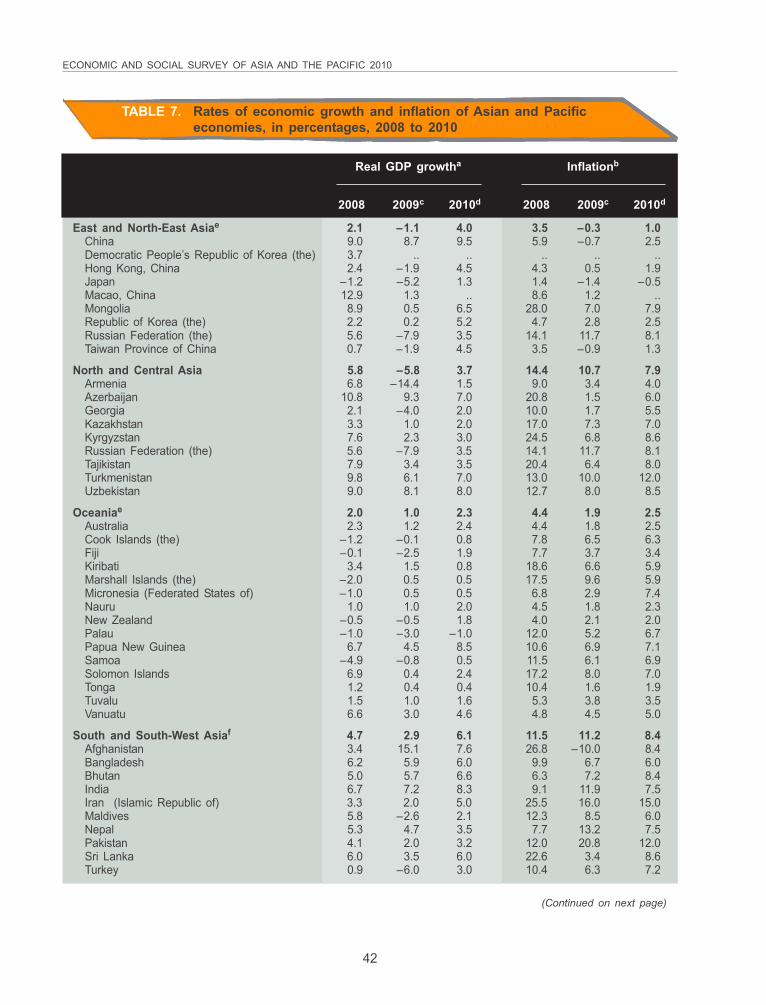
ECONOMIC AND SOCIAL SURVEY OF ASIA AND THE PACIFIC 2010
42
Real GDP growtha Inflationb
2008 2009c 2010d 2008 2009c 2010d
East and North-East Asiae 2.1 –1.1 4.0 3.5 –0.3 1.0China 9.0 8.7 9.5 5.9 –0.7 2.5Democratic People’s Republic of Korea (the) 3.7 .. .. .. .. ..Hong Kong, China 2.4 –1.9 4.5 4.3 0.5 1.9Japan –1.2 –5.2 1.3 1.4 –1.4 –0.5Macao, China 12.9 1.3 .. 8.6 1.2 ..Mongolia 8.9 0.5 6.5 28.0 7.0 7.9Republic of Korea (the) 2.2 0.2 5.2 4.7 2.8 2.5Russian Federation (the) 5.6 –7.9 3.5 14.1 11.7 8.1Taiwan Province of China 0.7 –1.9 4.5 3.5 –0.9 1.3
North and Central Asia 5.8 –5.8 3.7 14.4 10.7 7.9Armenia 6.8 –14.4 1.5 9.0 3.4 4.0Azerbaijan 10.8 9.3 7.0 20.8 1.5 6.0Georgia 2.1 –4.0 2.0 10.0 1.7 5.5Kazakhstan 3.3 1.0 2.0 17.0 7.3 7.0Kyrgyzstan 7.6 2.3 3.0 24.5 6.8 8.6Russian Federation (the) 5.6 –7.9 3.5 14.1 11.7 8.1Tajikistan 7.9 3.4 3.5 20.4 6.4 8.0Turkmenistan 9.8 6.1 7.0 13.0 10.0 12.0Uzbekistan 9.0 8.1 8.0 12.7 8.0 8.5
Oceaniae 2.0 1.0 2.3 4.4 1.9 2.5Australia 2.3 1.2 2.4 4.4 1.8 2.5Cook Islands (the) –1.2 –0.1 0.8 7.8 6.5 6.3Fiji –0.1 –2.5 1.9 7.7 3.7 3.4Kiribati 3.4 1.5 0.8 18.6 6.6 5.9Marshall Islands (the) –2.0 0.5 0.5 17.5 9.6 5.9Micronesia (Federated States of) –1.0 0.5 0.5 6.8 2.9 7.4Nauru 1.0 1.0 2.0 4.5 1.8 2.3New Zealand –0.5 –0.5 1.8 4.0 2.1 2.0Palau –1.0 –3.0 –1.0 12.0 5.2 6.7Papua New Guinea 6.7 4.5 8.5 10.6 6.9 7.1Samoa –4.9 –0.8 0.5 11.5 6.1 6.9Solomon Islands 6.9 0.4 2.4 17.2 8.0 7.0Tonga 1.2 0.4 0.4 10.4 1.6 1.9Tuvalu 1.5 1.0 1.6 5.3 3.8 3.5Vanuatu 6.6 3.0 4.6 4.8 4.5 5.0
South and South-West Asiaf 4.7 2.9 6.1 11.5 11.2 8.4Afghanistan 3.4 15.1 7.6 26.8 –10.0 8.4Bangladesh 6.2 5.9 6.0 9.9 6.7 6.0Bhutan 5.0 5.7 6.6 6.3 7.2 8.4India 6.7 7.2 8.3 9.1 11.9 7.5Iran (Islamic Republic of) 3.3 2.0 5.0 25.5 16.0 15.0Maldives 5.8 –2.6 2.1 12.3 8.5 6.0Nepal 5.3 4.7 3.5 7.7 13.2 7.5Pakistan 4.1 2.0 3.2 12.0 20.8 12.0Sri Lanka 6.0 3.5 6.0 22.6 3.4 8.6Turkey 0.9 –6.0 3.0 10.4 6.3 7.2
TABLE 7. Rates of economic growth and inflation of Asian and Pacificeconomies, in percentages, 2008 to 2010
(Continued on next page)
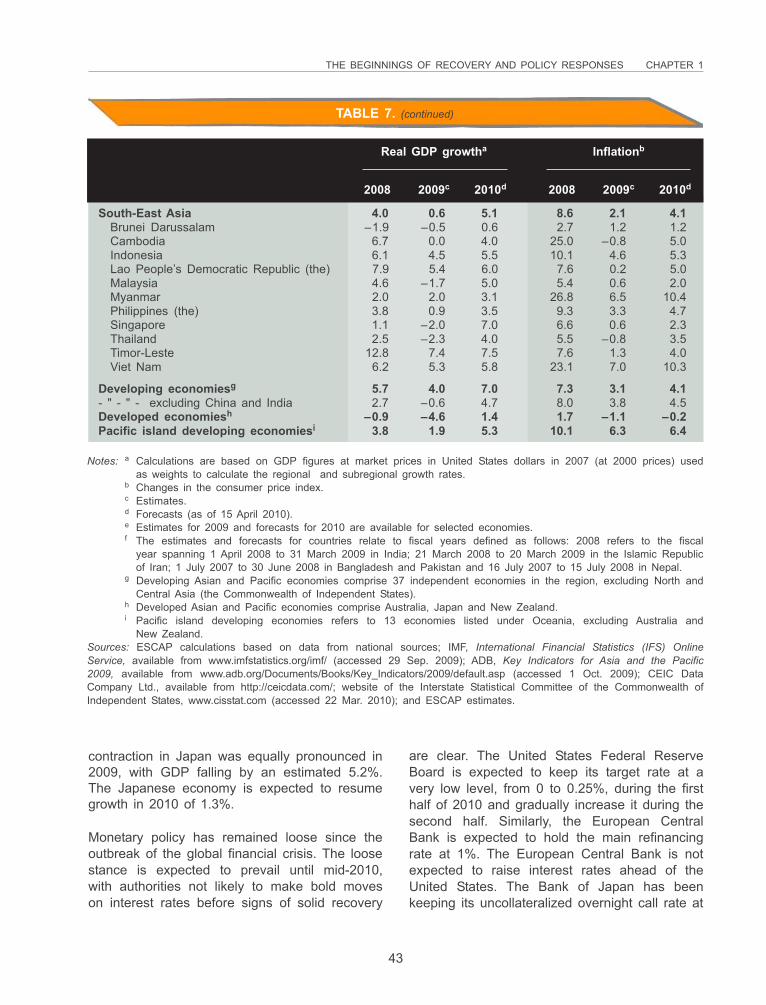
THE BEGINNINGS OF RECOVERY AND POLICY RESPONSES CHAPTER 1
43
Real GDP growtha Inflationb
2008 2009c 2010d 2008 2009c 2010d
South-East Asia 4.0 0.6 5.1 8.6 2.1 4.1Brunei Darussalam –1.9 –0.5 0.6 2.7 1.2 1.2Cambodia 6.7 0.0 4.0 25.0 –0.8 5.0Indonesia 6.1 4.5 5.5 10.1 4.6 5.3Lao People’s Democratic Republic (the) 7.9 5.4 6.0 7.6 0.2 5.0Malaysia 4.6 –1.7 5.0 5.4 0.6 2.0Myanmar 2.0 2.0 3.1 26.8 6.5 10.4Philippines (the) 3.8 0.9 3.5 9.3 3.3 4.7Singapore 1.1 –2.0 7.0 6.6 0.6 2.3Thailand 2.5 –2.3 4.0 5.5 –0.8 3.5Timor-Leste 12.8 7.4 7.5 7.6 1.3 4.0Viet Nam 6.2 5.3 5.8 23.1 7.0 10.3
Developing economiesg 5.7 4.0 7.0 7.3 3.1 4.1- " - " - excluding China and India 2.7 –0.6 4.7 8.0 3.8 4.5Developed economiesh –0.9 –4.6 1.4 1.7 –1.1 –0.2Pacific island developing economiesi 3.8 1.9 5.3 10.1 6.3 6.4
Notes: a Calculations are based on GDP figures at market prices in United States dollars in 2007 (at 2000 prices) usedas weights to calculate the regional and subregional growth rates.
b Changes in the consumer price index.c Estimates.d Forecasts (as of 15 April 2010).e Estimates for 2009 and forecasts for 2010 are available for selected economies.f The estimates and forecasts for countries relate to fiscal years defined as follows: 2008 refers to the fiscal
year spanning 1 April 2008 to 31 March 2009 in India; 21 March 2008 to 20 March 2009 in the Islamic Republicof Iran; 1 July 2007 to 30 June 2008 in Bangladesh and Pakistan and 16 July 2007 to 15 July 2008 in Nepal.
g Developing Asian and Pacific economies comprise 37 independent economies in the region, excluding North andCentral Asia (the Commonwealth of Independent States).
h Developed Asian and Pacific economies comprise Australia, Japan and New Zealand.i Pacific island developing economies refers to 13 economies listed under Oceania, excluding Australia and
New Zealand.Sources: ESCAP calculations based on data from national sources; IMF, International Financial Statistics (IFS) OnlineService, available from www.imfstatistics.org/imf/ (accessed 29 Sep. 2009); ADB, Key Indicators for Asia and the Pacific2009, available from www.adb.org/Documents/Books/Key_Indicators/2009/default.asp (accessed 1 Oct. 2009); CEIC DataCompany Ltd., available from http://ceicdata.com/; website of the Interstate Statistical Committee of the Commonwealth ofIndependent States, www.cisstat.com (accessed 22 Mar. 2010); and ESCAP estimates.
TABLE 7. (continued)
contraction in Japan was equally pronounced in2009, with GDP falling by an estimated 5.2%.The Japanese economy is expected to resumegrowth in 2010 of 1.3%.
Monetary policy has remained loose since theoutbreak of the global financial crisis. The loosestance is expected to prevail until mid-2010,with authorities not likely to make bold moveson interest rates before signs of solid recovery
are clear. The United States Federal ReserveBoard is expected to keep its target rate at avery low level, from 0 to 0.25%, during the firsthalf of 2010 and gradually increase it during thesecond half. Similarly, the European CentralBank is expected to hold the main refinancingrate at 1%. The European Central Bank is notexpected to raise interest rates ahead of theUnited States. The Bank of Japan has beenkeeping its uncollateralized overnight call rate at
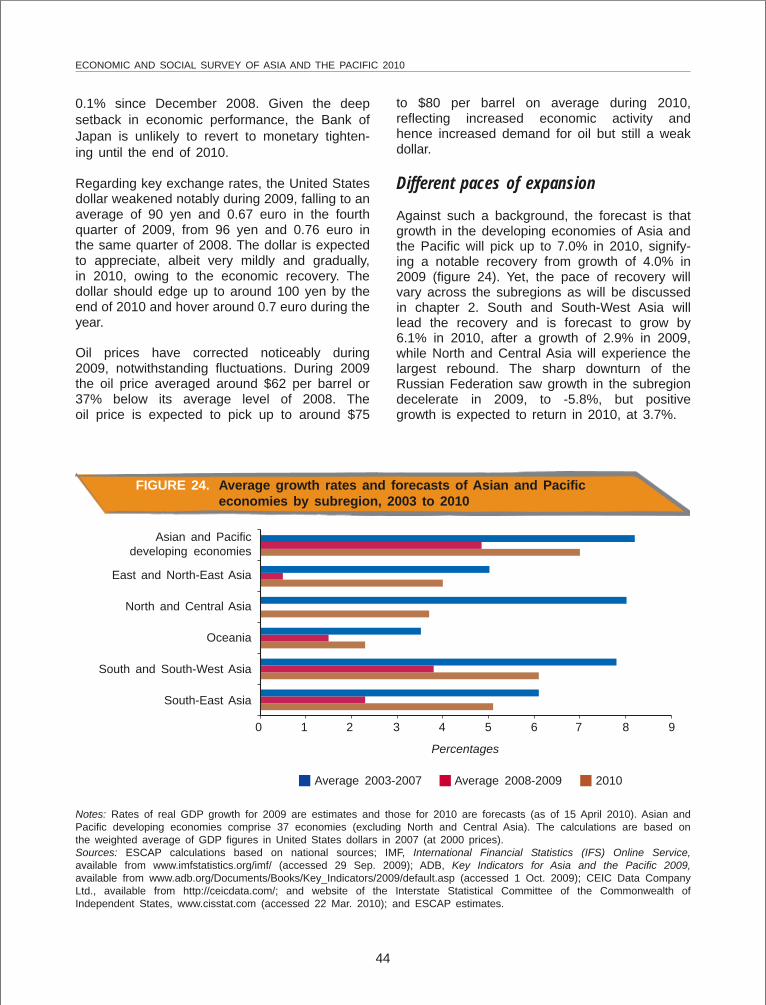
ECONOMIC AND SOCIAL SURVEY OF ASIA AND THE PACIFIC 2010
44
0.1% since December 2008. Given the deepsetback in economic performance, the Bank ofJapan is unlikely to revert to monetary tighten-ing until the end of 2010.
Regarding key exchange rates, the United Statesdollar weakened notably during 2009, falling to anaverage of 90 yen and 0.67 euro in the fourthquarter of 2009, from 96 yen and 0.76 euro inthe same quarter of 2008. The dollar is expectedto appreciate, albeit very mildly and gradually,in 2010, owing to the economic recovery. Thedollar should edge up to around 100 yen by theend of 2010 and hover around 0.7 euro during theyear.
Oil prices have corrected noticeably during2009, notwithstanding fluctuations. During 2009the oil price averaged around $62 per barrel or37% below its average level of 2008. Theoil price is expected to pick up to around $75
to $80 per barrel on average during 2010,reflecting increased economic activity andhence increased demand for oil but still a weakdollar.
Different paces of expansion
Against such a background, the forecast is thatgrowth in the developing economies of Asia andthe Pacific will pick up to 7.0% in 2010, signify-ing a notable recovery from growth of 4.0% in2009 (figure 24). Yet, the pace of recovery willvary across the subregions as will be discussedin chapter 2. South and South-West Asia willlead the recovery and is forecast to grow by6.1% in 2010, after a growth of 2.9% in 2009,while North and Central Asia will experience thelargest rebound. The sharp downturn of theRussian Federation saw growth in the subregiondecelerate in 2009, to -5.8%, but positivegrowth is expected to return in 2010, at 3.7%.
FIGURE 24. Average growth rates and forecasts of Asian and Pacificeconomies by subregion, 2003 to 2010
Asian and Pacificdeveloping economies
East and North-East Asia
North and Central Asia
Oceania
South and South-West Asia
South-East Asia
0 1 2 3 4 5 6 7 8 9
Percentages
Average 2003-2007 Average 2008-2009 2010
Notes: Rates of real GDP growth for 2009 are estimates and those for 2010 are forecasts (as of 15 April 2010). Asian andPacific developing economies comprise 37 economies (excluding North and Central Asia). The calculations are based onthe weighted average of GDP figures in United States dollars in 2007 (at 2000 prices).Sources: ESCAP calculations based on national sources; IMF, International Financial Statistics (IFS) Online Service,available from www.imfstatistics.org/imf/ (accessed 29 Sep. 2009); ADB, Key Indicators for Asia and the Pacific 2009,available from www.adb.org/Documents/Books/Key_Indicators/2009/default.asp (accessed 1 Oct. 2009); CEIC Data CompanyLtd., available from http://ceicdata.com/; and website of the Interstate Statistical Committee of the Commonwealth ofIndependent States, www.cisstat.com (accessed 22 Mar. 2010); and ESCAP estimates.
THE BEGINNINGS OF RECOVERY AND POLICY RESPONSES CHAPTER 1
45
Downside risks persist
While recovery in the developed world will likelybe well managed by policymakers, deep uncer-tainties persist about the pace of recovery in theUnited States. Economic activities continue topick up, but some indicators, notably rising un-employment, have increased the complexity ofmanaging macroeconomic policies. Continuedfiscal expansion will not be sustainable and hasbeen exerting pressure on fiscal balances. How-ever, as the Government turns off the fiscalthrottle, private-sector growth drivers may not bestrong enough and the economy could fall backquickly into a double-dip recession, therebysparking a new cycle of fiscal expansion.
additional reserves in case of bond defaults. Ifgrowth fails to recover in affected countries, debtpayments would swallow an increasing share ofGovernment budgets, resulting in a vicious down-ward growth cycle as Governments were left withfewer resources to stimulate their economies.
On the other hand, if expansionary policies inAsia and the Pacific turn out to be pro-cyclical,inflation will neutralize the incipient growthprocess, moving economies into recession asGovernments normalize exceptionally loose mon-etary policy and raise interest rates. Similarlywith the exit strategy needed for fiscal policy, thetiming and magnitude of monetary policy reversalwould also affect the prevailing forecast.
Countries across the Asia-Pacific region havebegun to reverse their monetary stance in re-cent months. The dilemma for the region is thatif they adopt a much tighter monetary policythan their major trading partners, in particularthe United States, it will attract capital inflowsand further fuel the appreciation of Asian cur-rencies against the United States dollar. As aresult, exports may experience renewed difficul-ties that would, given the importance of externaldemand in the region, negatively affect theoverall forecast of economic growth.
Pressure is growing for protectionist measuresin developed countries but also potentially indeveloping countries, which is of great concernfor recovery in Asia and the Pacific. The firstprotectionist initiative during the crisis was the“Buy American” clause in the stimulus packageof the United States. One novel aspect of pro-tectionism in the crisis has been the role ofsubsidies to financial institutions and manufac-turing companies, particularly the automotivesector, in the United States and Europe. Sub-sidy programmes and other forms of preferentialtreatment given as part of bailout packagescould significantly alter competitive conditions oftrade for some time to come by skewing theplaying field against Asian and Pacific enter-prises that do not benefit from such subsidies.58
58 Khor, Martin, Trade: Protectionism on the rise hits developing countries hardest, Third World Network Info Serviceon WTO and Trade Issues, Penang, Malaysia, 11 February 2009; available from www.twnside.org.sg/title2/wto.info/2009/twninfo20090208.htm.
Pressure is growing for protectionistmeasures in developed countries but
also potentially in developing countries,which is of great concern for recovery
in Asia and the Pacific
A growing concern is the impact of sharplyincreased Government borrowing in major devel-oped economies. Early in 2010 the perceiveddifficulties of Greece in repaying its Governmentdebt came to the fore; in coming years othereconomies in the European Union may be facingsimilar problems. The impact on Asian and Pa-cific countries would emerge through reducedimport demand from developed economies,because of curtailment of their GDP growth. Belt-tightening policies would be imposed as part ofmeasures to pare Government debt; that wouldbring on a slowdown and borrowing costs wouldlikely increase through fears of default. Further-more, growth would be impacted if financialinstitutions in Europe, which hold a substantialamount of Government debt, cut lending to thecorporate sector in Europe in order to retain
ECONOMIC AND SOCIAL SURVEY OF ASIA AND THE PACIFIC 2010
46
As the impact on developed countries has in-creased, a number of prominent trade disputeshave arisen, for example, one has been theimposition of duties on tyres from China by theUnited States in September 2009, which will beadjudicated at the World Trade Organization.
Another threat, albeit one that has receded morerecently, is the H1N1 influenza and the possibil-ity that it could become more virulent some timein the fufure. Following the outbreak of H1N1influenza, the World Health Organization raisedits pandemic flu alert to level 6, its highest level,in mid-2009. There is still no sign that the alertwill be lifted in the near future, signifying thecontinued presence of the risk of spread ofpandemic flu. Should the pandemic intensify, itwould inevitably destabilize economic recoveryby dampening consumer and investment behav-iour. Impacts on tourism and related industriesand services would also be detrimental.
BALANCING GROWTH WITHSTABILITY
Beyond the immediate risks to the speed andsustainability of recovery, fundamental concernsexist about the nature of the recovery processand whether it will resurrect old challenges aswell as create new obstacles for years to come.A complex set of policy challenges lie ahead.They are discussed below and in chapter 3 inthe context of inclusive and sustainable devel-opment.
Inflation threatens from demand andsupply sides
The main short-term threat to growth in Asiaand the Pacific is the return of inflationary pres-sures as recovery gathers steam. Countries willhave to balance the risks of setting off aninflationary spiral with long-term negative conse-quences and of halting the short-term growth
recovery trend prematurely. Critical decisions foreach economy will be when and how to turn offfiscal stimulus and accommodative monetarypolicy.
Critical decisions for each economywill be when and how to turn off
fiscal stimulus and accommodativemonetary policy
59 Food and Agriculture Organization of the United Nations, World Food Situation, available from www.fao.org/worldfoodsituation/FoodPricesIndex/en/ (accessed 20 Dec. 2009).
Inflationary pressure has fallen significantlysince the last quarter of 2008 in tandem withthe downturn in domestic economic activity (fig-ure 25). The level and degree of fall in inflationdiverged considerably across economies, de-pending on the degree to which they had beenexposed to the global slowdown. Export-orientedeconomies such as those of South-East Asiaexperienced the lowest levels of inflation,whereas more domestic-demand-led economiessuch as India and Indonesia continued to dis-play comparatively higher levels. Other thancountry-dependent, demand-side factors, reduc-tion in price growth across all countries wasattributable to lower imported inflation from de-clining global oil and food prices in the earlypart of 2009. The crude oil price averagedaround $52 per barrel in the first half of 2009,in comparison with an average of $97 in 2008.The continuing existence of fuel subsidies insuch economies as India, Indonesia, Malaysiaand China has, however, diminished the magni-tude of oil price falls for consumers. Interna-tional food prices also fell, by around 30%during the first half of 2009 in comparison withlevels of the preceding year.59 Nevertheless, asfood prices remain dependent on domesticfactors in many cases, countries such as Indiaexperienced food price rises even when foodwas falling in price elsewhere.
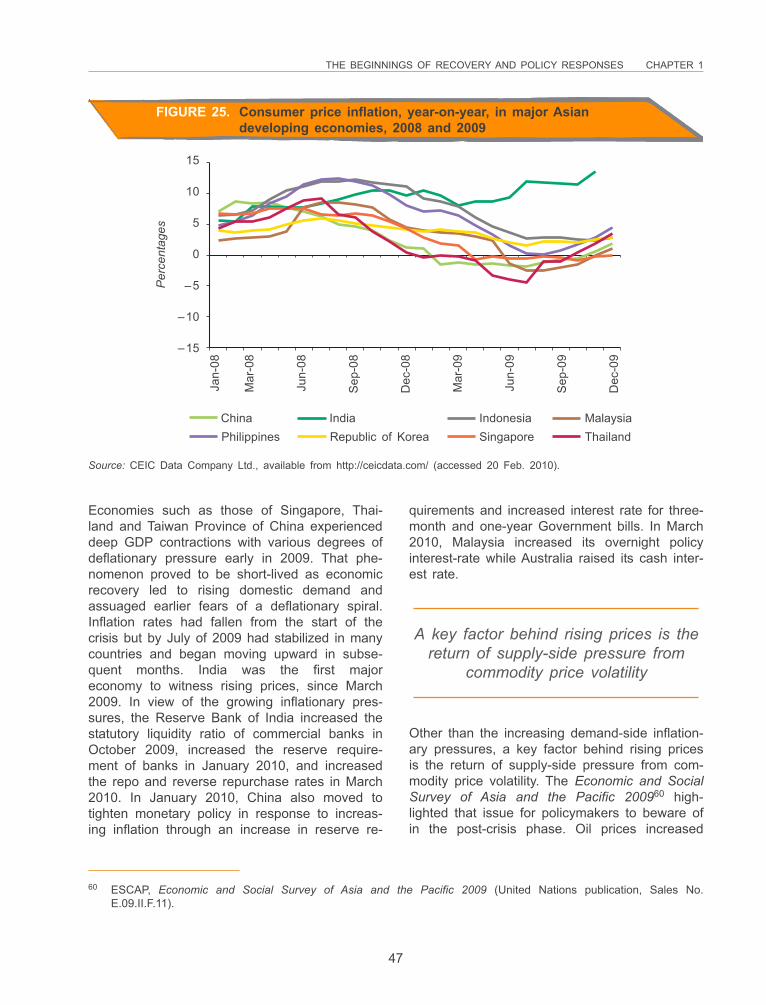
THE BEGINNINGS OF RECOVERY AND POLICY RESPONSES CHAPTER 1
47
Economies such as those of Singapore, Thai-land and Taiwan Province of China experienceddeep GDP contractions with various degrees ofdeflationary pressure early in 2009. That phe-nomenon proved to be short-lived as economicrecovery led to rising domestic demand andassuaged earlier fears of a deflationary spiral.Inflation rates had fallen from the start of thecrisis but by July of 2009 had stabilized in manycountries and began moving upward in subse-quent months. India was the first majoreconomy to witness rising prices, since March2009. In view of the growing inflationary pres-sures, the Reserve Bank of India increased thestatutory liquidity ratio of commercial banks inOctober 2009, increased the reserve require-ment of banks in January 2010, and increasedthe repo and reverse repurchase rates in March2010. In January 2010, China also moved totighten monetary policy in response to increas-ing inflation through an increase in reserve re-
quirements and increased interest rate for three-month and one-year Government bills. In March2010, Malaysia increased its overnight policyinterest-rate while Australia raised its cash inter-est rate.
60 ESCAP, Economic and Social Survey of Asia and the Pacific 2009 (United Nations publication, Sales No.E.09.II.F.11).
Source: CEIC Data Company Ltd., available from http://ceicdata.com/ (accessed 20 Feb. 2010).
FIGURE 25. Consumer price inflation, year-on-year, in major Asiandeveloping economies, 2008 and 2009
ChinaRepublic of Korea SingaporeIndia Indonesia Malaysia
Thailand
Jan-
08
Mar
-08
Jun-
08
Sep
-08
Dec
-08
Mar
-09
Jun-
09
Sep
-09
Dec
-09
15
10
5
0
–5
–10
–15
Per
cent
ages
Philippines
A key factor behind rising prices is thereturn of supply-side pressure from
commodity price volatility
Other than the increasing demand-side inflation-ary pressures, a key factor behind rising pricesis the return of supply-side pressure from com-modity price volatility. The Economic and SocialSurvey of Asia and the Pacific 200960 high-lighted that issue for policymakers to beware ofin the post-crisis phase. Oil prices increased
ECONOMIC AND SOCIAL SURVEY OF ASIA AND THE PACIFIC 2010
48
dramatically during 2009. Since its lowest pointat the end of December 2008, benchmark Brentcrude oil had more than doubled in price toover $70 by the end of August 2009. Conse-quently the food-fuel link could influence keyfood prices upwards. The reasons for the rise inoil prices are open to debate, especially whenrecessionary forces prevail. The increase has inpart been attributed to speculation in the oilmarket.61 The large amount of liquidity availableto financial investors, coupled with the beliefthat oil prices should be moving upwards onfundamental demand-supply factors, have alsoplayed their part. The absence of a clearendpoint in the current situation might feedspeculative forces further.
A return to high food prices would follow quickly,a possibility that merits close monitoring. Otherpossible influences to a return of high foodprices would include the weather – India,among other countries, has witnessed a disap-pointing monsoon season. Sugar prices haveclimbed to record highs in India owing to theshortfall in the sugar crop and to productiondecrease in Brazil, the world’s other leadingproducer. The impact on rice production couldbe even more significant – Asian and Pacificdemand for rice as a consequence of harvestshortfalls would be a key concern for prices.While governmental rice stocks exist in somecountries, they are finite; the impact onintraregional rice trade will depend on the im-pact of decreased rains on the crop.
Prices may also be affected by increased fooddemand in line with economic recovery. As therecovery may arrive at different times acrossthe region, early recovery in large economiesthat are not food-self-sufficient could stimulateincreases in food prices that, in combinationwith declining growth, would be especiallydamaging for the poorest and most vulnerable
sections of the population. Higher food priceswould have a far more direct impact on thepoorest people of the region, impacting poverty,exacerbating inequality and levels of malnutri-tion, illness, infant and maternal mortalitythat would extend the poverty trap for longperiods. The question will be how the regionwould respond to any situation of suddenand excessive food price rise. In the previousepisode immediately before the economic crisis,food producing countries suspended trade insome cases to safeguard domestic supply. Suchreactive responses do not solve fundamentaldemand and supply imbalances. They aggravatehoarding, rent-seeking and self-perpetuatingprice rises.
61 For example, see Paul Krugman, “Oil speculation”, New York Times, Opinion sec., 8 July 2009; and UNCTAD,Trade and Development Report 2009: Responding to the Global Crisis, Climate Change Mitigation andDevelopment (United Nations publication, Sales No. E.09.II.D.16).
62 Chairman’s statement at the 10th ASEAN Plus Three Foreign Ministers Meeting, 22 July 2009, held at Phuket,Thailand; available from www.aseansec.org/PR-42AMM-Chairman-Statement-ASEAN+3.pdf.
Increases in food prices would beespecially damaging for the poorestand most vulnerable in the region
One option to deal with such a risk is a re-gional rice bank. A permanent East Asian emer-gency rice reserve is being discussed byASEAN+3 as a follow-up to its ongoing EastAsia Emergency Rice Reserve Pilot Project.62
The pilot project, which has existed since 2004,is a system of mutual assistance for sharing ofrice stocks among the 13 countries ofASEAN+3 that aims as well to contribute to riceprice stability in the region. Another positiveinitiative is the agreement, since 2007, to estab-lish the South Asian Association for RegionalCooperation (SAARC) Food Bank. It wouldmaintain food reserves and support national aswell as regional food security through collectiveaction among member countries. The SAARCFood Bank would also foster intercountry part-nerships and regional integration.
THE BEGINNINGS OF RECOVERY AND POLICY RESPONSES CHAPTER 1
49
Nonetheless, as ESCAP has observed in aprevious edition of the Survey,63 the region hasyet to take adequate measures to encouragelong-term increase in food production. Risingpopulations and increased consumer wealth indeveloping countries will continue to advancethus raising the policy imperative of reversingthe long-term neglect of agriculture that wasclear immediately prior to the crisis in 2008.
Asset bubbles build up
Abundant foreign capital buoyed by liquidity sup-port provided to financial institutions in devel-oped countries has been attracted to the Asia-Pacific region in recent months because of itscomparatively strong growth prospects. Lookingforward, as the inflows grow in scale, the riskalso grows that unexpected change in interestrates, or a sudden appreciation of the dollar,could simultaneously cause capital to exit fromtarget countries and financial asset classes inthe region, precipitously bringing down assetprices and exchange rates. How to manage thebenefits from foreign portfolio investments andminimize the risks that they bring to macroeco-nomic stability remains a huge challenge for theregion. The risk remains of asset price bubblesforming in particular sectors with consequentrisks for domestic financial sectors and overallmacroeconomic stability.
Liquidity has been injected into the UnitedStates financial sector with the Federal Reservepurchases of mortgage-backed securities andother agency debt. The scale of such liquiditysupport is seen from the Government targetsfor such purchases, of $1.25 trillion and $175billion respectively by the first quarter of 2010.64
Foreign capital has been abundant as well dueto the rise of the dollar “carry trade”, with
borrowings at low dollar interest rates for invest-ment in economies where appreciation expecta-tions are strong and interest rates comparativelyhigher. The situation resembles that in Japanfrom mid-2005 onwards, where near-zero inter-est rates in support of domestic recovery led tothe use of the yen as the carry trade currencyof choice. Countries in this region have beenparticularly susceptible to the carry trade asexpectations of recovery earlier than in otherparts of the world have caused interest rate andexchange rate rises, thereby offering moreattractive differentials for carry trades than existin other regions.
63 ESCAP, Economic and Social Survey of Asia and the Pacific 2008 (United Nations publication, Sales No.E.08.II.F.7), chap. 3, “Unequal benefits of growth – agriculture left behind”; and ESCAP, Sustainable Agricultureand Food Security in Asia and the Pacific, Theme Study 2009 (Bangkok: 2009).
64 United States Federal Reserve, “Minutes of the Federal Open Market Committee”, 3-4 November 2009(Washington, D.C.: Board of Governors of the Federal Reserve System), available from www.federalreserve.gov/monetarypolicy/files/fomcminutes20091104.pdf.
65 China Daily, “Real estate prices rise at record pace”, Beijing, 11 Mar. 2010, available from www.chinadaily.com.cn/china/2010-03/11/content_9570137.htm.
Asset price bubbles are bringingrisks for domestic financial sectorsand overall macroeconomic stability
Domestic capital has also been attracted toregional asset markets by liquidity addition atthe national level in a number of developingcountries in the region as part of monetarystimulus policies during the crisis. Credit provi-sion (figure 26) and asset prices in a numberof economies have increased substantially fol-lowing declines early in the crisis, notably inChina, India and the Russian Federation (figure27). For example, during February 2010 thevalue of property sales in 70 major cities inChina surged 10.7% year-on-year.65 In compari-son with the figures at the year’s end in 2008,the Chinese Shanghai Composite Index andIndian BSE30 had jumped by 67.6% and70.3%, respectively, by the end of February2010.
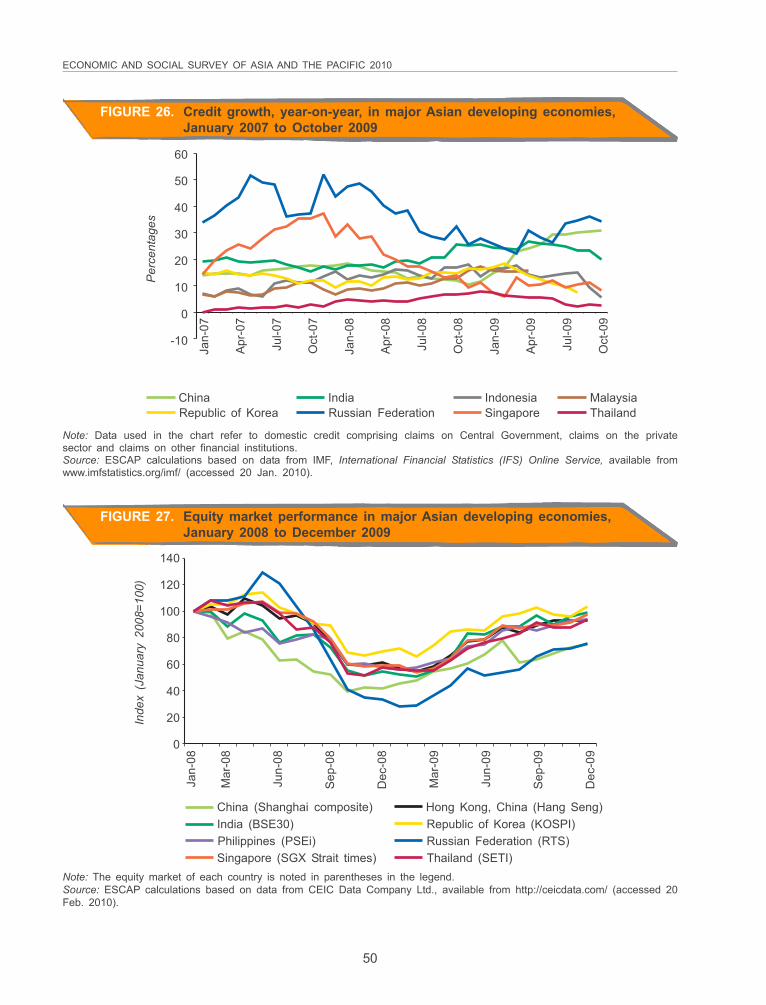
ECONOMIC AND SOCIAL SURVEY OF ASIA AND THE PACIFIC 2010
50
FIGURE 26. Credit growth, year-on-year, in major Asian developing economies,January 2007 to October 2009
60
50
40
30
20
10
0
-10
Per
cent
ages
Jan-
07
Apr
-07
Jul-0
7
Oct
-07
Jan-
08
Apr
-08
Jul-0
8
Oct
-08
Jan-
09
Apr
-09
Jul-0
9
Oct
-09
ChinaRepublic of Korea Singapore
India Indonesia MalaysiaRussian Federation Thailand
Note: Data used in the chart refer to domestic credit comprising claims on Central Government, claims on the privatesector and claims on other financial institutions.Source: ESCAP calculations based on data from IMF, International Financial Statistics (IFS) Online Service, available fromwww.imfstatistics.org/imf/ (accessed 20 Jan. 2010).
Note: The equity market of each country is noted in parentheses in the legend.Source: ESCAP calculations based on data from CEIC Data Company Ltd., available from http://ceicdata.com/ (accessed 20Feb. 2010).
FIGURE 27. Equity market performance in major Asian developing economies,January 2008 to December 2009
140
120
100
80
60
40
20
0
Inde
x (J
anua
ry 2
008=
100)
Jan-
08
Mar
-08
Jun-
08
Sep
-08
Dec
-08
Mar
-09
Jun-
09
Sep
-09
Dec
-09
China (Shanghai composite) Hong Kong, China (Hang Seng)Republic of Korea (KOSPI)India (BSE30)Russian Federation (RTS)Philippines (PSEi)
Singapore (SGX Strait times) Thailand (SETI)
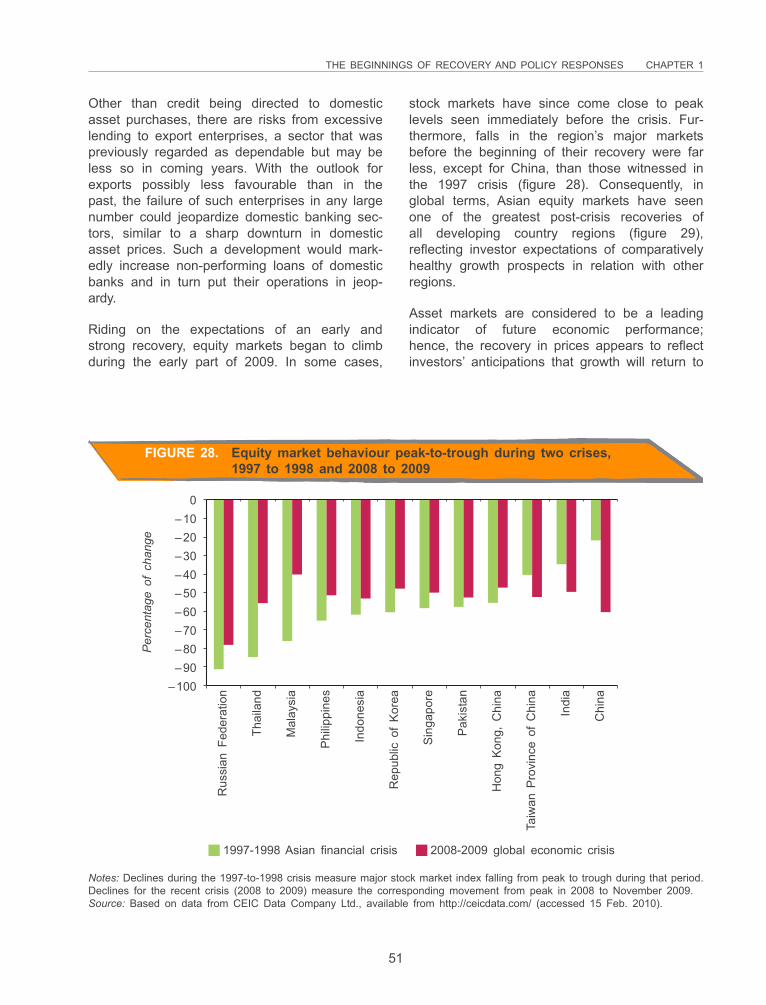
THE BEGINNINGS OF RECOVERY AND POLICY RESPONSES CHAPTER 1
51
Other than credit being directed to domesticasset purchases, there are risks from excessivelending to export enterprises, a sector that waspreviously regarded as dependable but may beless so in coming years. With the outlook forexports possibly less favourable than in thepast, the failure of such enterprises in any largenumber could jeopardize domestic banking sec-tors, similar to a sharp downturn in domesticasset prices. Such a development would mark-edly increase non-performing loans of domesticbanks and in turn put their operations in jeop-ardy.
Riding on the expectations of an early andstrong recovery, equity markets began to climbduring the early part of 2009. In some cases,
stock markets have since come close to peaklevels seen immediately before the crisis. Fur-thermore, falls in the region’s major marketsbefore the beginning of their recovery were farless, except for China, than those witnessed inthe 1997 crisis (figure 28). Consequently, inglobal terms, Asian equity markets have seenone of the greatest post-crisis recoveries ofall developing country regions (figure 29),reflecting investor expectations of comparativelyhealthy growth prospects in relation with otherregions.
Asset markets are considered to be a leadingindicator of future economic performance;hence, the recovery in prices appears to reflectinvestors’ anticipations that growth will return to
FIGURE 28. Equity market behaviour peak-to-trough during two crises,1997 to 1998 and 2008 to 2009
0–10–20–30–40–50–60–70–80–90
–100
Rus
sian
Fed
erat
ion
Thai
land
Mal
aysi
a
Phi
lippi
nes
Indo
nesi
a
Rep
ublic
of
Kor
ea
Sin
gapo
re
Pak
ista
n
Hon
g K
ong,
Chi
na
Taiw
an P
rovi
nce
of C
hina
Indi
a
Chi
na
1997-1998 Asian financial crisis 2008-2009 global economic crisis
Notes: Declines during the 1997-to-1998 crisis measure major stock market index falling from peak to trough during that period.Declines for the recent crisis (2008 to 2009) measure the corresponding movement from peak in 2008 to November 2009.Source: Based on data from CEIC Data Company Ltd., available from http://ceicdata.com/ (accessed 15 Feb. 2010).
Per
cent
age
of c
hang
e
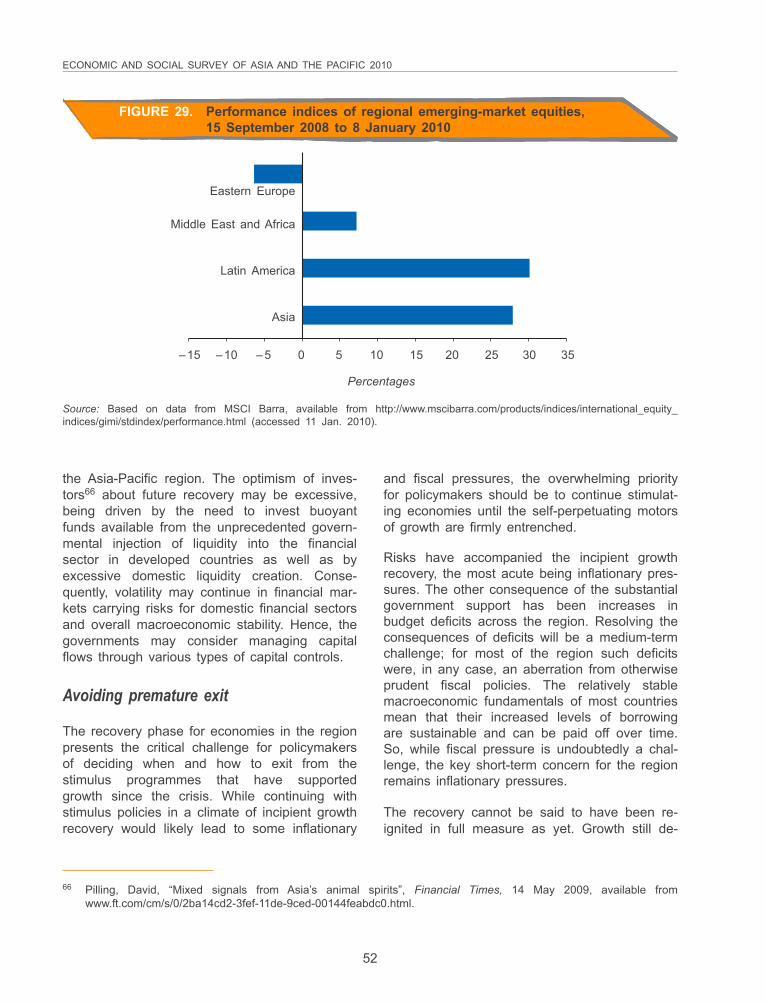
ECONOMIC AND SOCIAL SURVEY OF ASIA AND THE PACIFIC 2010
52
FIGURE 29. Performance indices of regional emerging-market equities,15 September 2008 to 8 January 2010
Eastern Europe
Middle East and Africa
Latin America
Asia
–15 –10 –5 0 5 10 15 20 25 30 35
Percentages
Source: Based on data from MSCI Barra, available from http://www.mscibarra.com/products/indices/international_equity_indices/gimi/stdindex/performance.html (accessed 11 Jan. 2010).
the Asia-Pacific region. The optimism of inves-tors66 about future recovery may be excessive,being driven by the need to invest buoyantfunds available from the unprecedented govern-mental injection of liquidity into the financialsector in developed countries as well as byexcessive domestic liquidity creation. Conse-quently, volatility may continue in financial mar-kets carrying risks for domestic financial sectorsand overall macroeconomic stability. Hence, thegovernments may consider managing capitalflows through various types of capital controls.
Avoiding premature exit
The recovery phase for economies in the regionpresents the critical challenge for policymakersof deciding when and how to exit from thestimulus programmes that have supportedgrowth since the crisis. While continuing withstimulus policies in a climate of incipient growthrecovery would likely lead to some inflationary
and fiscal pressures, the overwhelming priorityfor policymakers should be to continue stimulat-ing economies until the self-perpetuating motorsof growth are firmly entrenched.
Risks have accompanied the incipient growthrecovery, the most acute being inflationary pres-sures. The other consequence of the substantialgovernment support has been increases inbudget deficits across the region. Resolving theconsequences of deficits will be a medium-termchallenge; for most of the region such deficitswere, in any case, an aberration from otherwiseprudent fiscal policies. The relatively stablemacroeconomic fundamentals of most countriesmean that their increased levels of borrowingare sustainable and can be paid off over time.So, while fiscal pressure is undoubtedly a chal-lenge, the key short-term concern for the regionremains inflationary pressures.
The recovery cannot be said to have been re-ignited in full measure as yet. Growth still de-
66 Pilling, David, “Mixed signals from Asia’s animal spirits”, Financial Times, 14 May 2009, available fromwww.ft.com/cm/s/0/2ba14cd2-3fef-11de-9ced-00144feabdc0.html.
THE BEGINNINGS OF RECOVERY AND POLICY RESPONSES CHAPTER 1
53
pends largely on government spending and in-vestment from stimulus policies. With continuedweakness in developed-country markets, theprevious growth engine of exports remains sub-dued for many economies. In such a climate, apremature withdrawal of fiscal stimulus couldhave severe consequences for the growth ofeconomies in the region, and therefore for thelivelihoods of their poorest and most vulnerablecitizens.
serve to increase inflationary pressures. Foreignportfolio inflows would also lead to exchange-rate pressure that would endanger the recoveryof exports.
Sustaining Asia’s dynamism
The fundamental long-term challenge formaintaining growth in the Asia-Pacific regionis to complement the engine of exports todeveloped countries, especially the UnitedStates. Under current projections, the importdemand of the United States is unlikely toresume its pre-crisis growth trajectory, as itsdebt-driven consumption is constrained (see box1). The effects in the region will vary accordingto the degree of export-dependence of eachcountry and its exposure to the United Statesmarket.
Countries that can boost their domestic demandto significant levels may use that channel toreplace the loss in the export contribution togrowth. For smaller export-dependent econo-mies in the region, a clear route for mitigatingthe decline in the role of exports to developedcountries is to increase their share ofintraregional trade to benefit from the domesticdemand of their larger neighbours. Stimulusmeasures have temporarily increased govern-mental investment and consumption in anumber of countries. Fiscal stimulus in somehas also increased private consumption throughthe provision of funds directly to consumers.However, for domestic and regional demand toincrease its contribution beyond such temporaryfillips, policy measures are needed that caninduce long-term structural rebalancing ofeconomies. Such a strategy would address anumber of critical global and regional imbal-ances and begin to chart the way forward, asdiscussed in Chapter 4.
The overwhelming priority forpolicymakers should be to continue
stimulating economies until theself-perpetuating motors of
growth are firmly entrenched
In the balance of risks, Asian and Pacificeconomies should aim to sustain growth ratherthan manage inflation. Policymakers shouldguard against premature exit from stimuluspolicies until growth becomes more self-sustaining. When exit policies are enacted, themix between fiscal and monetary policies will beimportant for the twin tasks of sustaining growthwhile managing inflation. In that pursuit, mon-etary tightening could play the most effectiverole in controlling price pressures because itcould act directly on credit build-up.
While decisions on timing the exit from stimuluspolicies depend on national circumstances, akey role remains for regional coordination: toprevent negative macroeconomic repercussionsdue to regional diversity in policies. For exam-ple, monetary tightening through an increase ininterest rates in the absence of such a rise inother economies will attract portfolio flows and

Pho
to: S
tock
xper
t
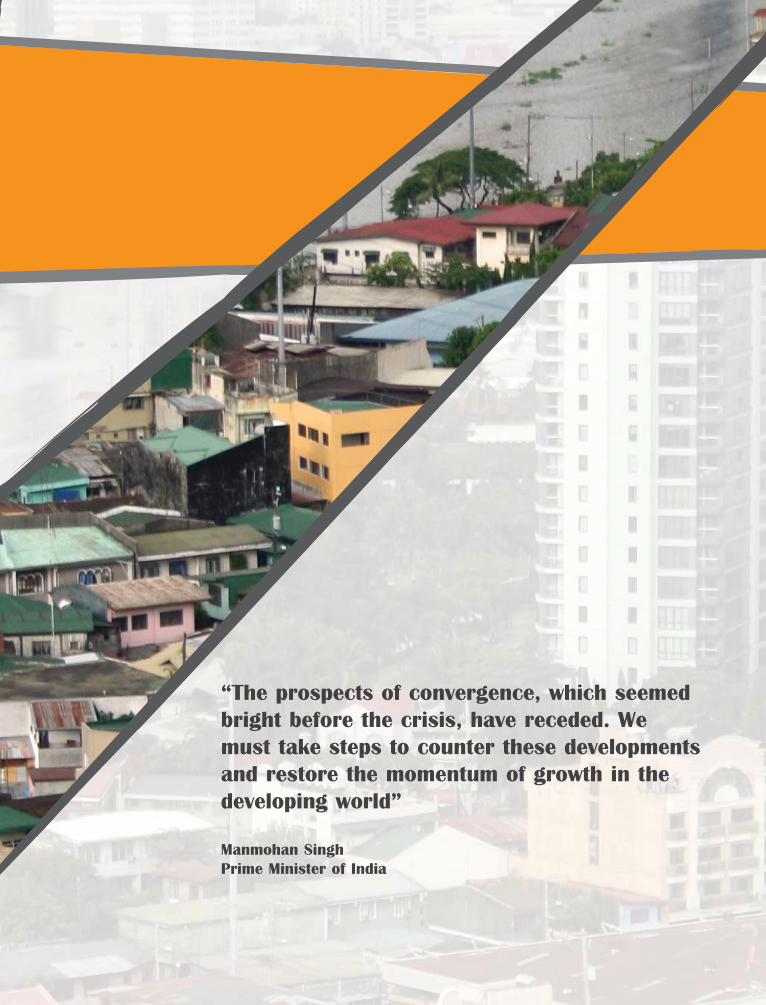
“The prospects of convergence, which seemed bright before the crisis, have receded. We must take steps to counter these developments and restore the momentum of growth in the developing world”
Manmohan SinghPrime Minister of India

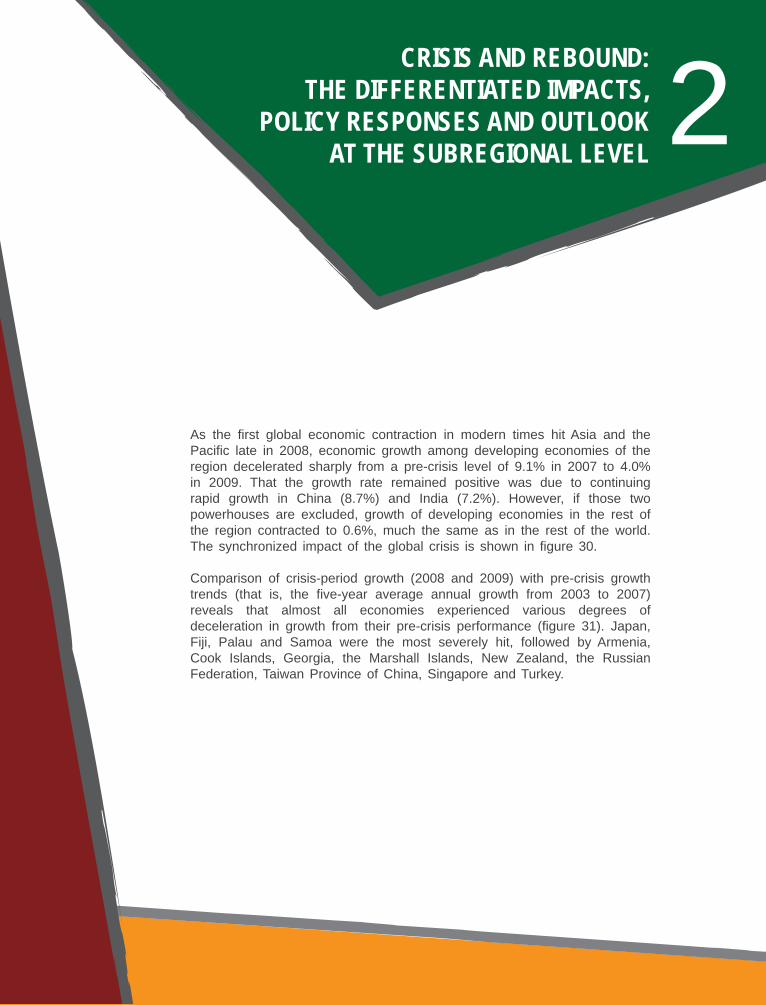
CRISIS AND REBOUND:THE DIFFERENTIATED IMPACTS,
POLICY RESPONSES AND OUTLOOKAT THE SUBREGIONAL LEVEL 2
As the first global economic contraction in modern times hit Asia and the Pacific late in 2008, economic growth among developing economies of the region decelerated sharply from a pre-crisis level of 9.1% in 2007 to 4.0% in 2009. That the growth rate remained positive was due to continuing rapid growth in China (8.7%) and India (7.2%). However, if those two powerhouses are excluded, growth of developing economies in the rest of the region contracted to 0.6%, much the same as in the rest of the world. The synchronized impact of the global crisis is shown in figure 30.
Comparison of crisis-period growth (2008 and 2009) with pre-crisis growth trends (that is, the five-year average annual growth from 2003 to 2007) reveals that almost all economies experienced various degrees of deceleration in growth from their pre-crisis performance (figure 31). Japan, Fiji, Palau and Samoa were the most severely hit, followed by Armenia, Cook Islands, Georgia, the Marshall Islands, New Zealand, the Russian Federation, Taiwan Province of China, Singapore and Turkey.
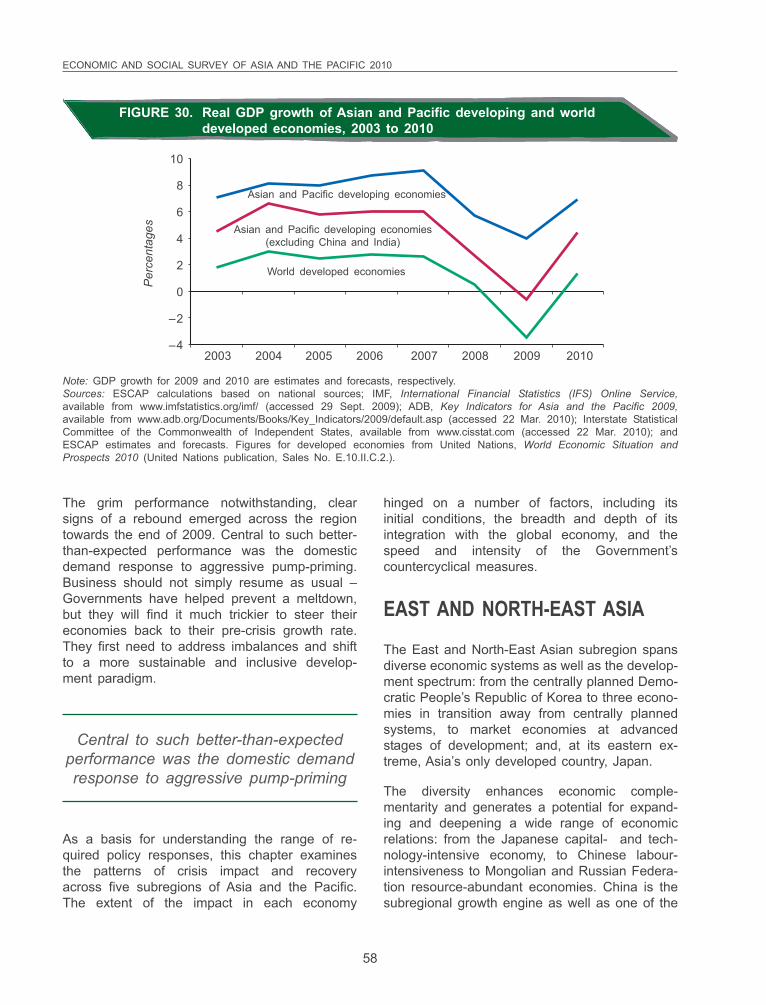
ECONOMIC AND SOCIAL SURVEY OF ASIA AND THE PACIFIC 2010
58
FIGURE 30. Real GDP growth of Asian and Pacific developing and worlddeveloped economies, 2003 to 2010
10
8
6
4
2
0
–2
–4
Per
cent
ages
2003 2004 2005 2006 2007 2008 2009 2010
Asian and Pacific developing economies
Asian and Pacific developing economies(excluding China and India)
World developed economies
Note: GDP growth for 2009 and 2010 are estimates and forecasts, respectively.Sources: ESCAP calculations based on national sources; IMF, International Financial Statistics (IFS) Online Service,available from www.imfstatistics.org/imf/ (accessed 29 Sept. 2009); ADB, Key Indicators for Asia and the Pacific 2009,available from www.adb.org/Documents/Books/Key_Indicators/2009/default.asp (accessed 22 Mar. 2010); Interstate StatisticalCommittee of the Commonwealth of Independent States, available from www.cisstat.com (accessed 22 Mar. 2010); andESCAP estimates and forecasts. Figures for developed economies from United Nations, World Economic Situation andProspects 2010 (United Nations publication, Sales No. E.10.II.C.2.).
The grim performance notwithstanding, clearsigns of a rebound emerged across the regiontowards the end of 2009. Central to such better-than-expected performance was the domesticdemand response to aggressive pump-priming.Business should not simply resume as usual –Governments have helped prevent a meltdown,but they will find it much trickier to steer theireconomies back to their pre-crisis growth rate.They first need to address imbalances and shiftto a more sustainable and inclusive develop-ment paradigm.
hinged on a number of factors, including itsinitial conditions, the breadth and depth of itsintegration with the global economy, and thespeed and intensity of the Government’scountercyclical measures.
EAST AND NORTH-EAST ASIA
The East and North-East Asian subregion spansdiverse economic systems as well as the develop-ment spectrum: from the centrally planned Demo-cratic People’s Republic of Korea to three econo-mies in transition away from centrally plannedsystems, to market economies at advancedstages of development; and, at its eastern ex-treme, Asia’s only developed country, Japan.
The diversity enhances economic comple-mentarity and generates a potential for expand-ing and deepening a wide range of economicrelations: from the Japanese capital- and tech-nology-intensive economy, to Chinese labour-intensiveness to Mongolian and Russian Federa-tion resource-abundant economies. China is thesubregional growth engine as well as one of the
Central to such better-than-expectedperformance was the domestic demandresponse to aggressive pump-priming
As a basis for understanding the range of re-quired policy responses, this chapter examinesthe patterns of crisis impact and recoveryacross five subregions of Asia and the Pacific.The extent of the impact in each economy
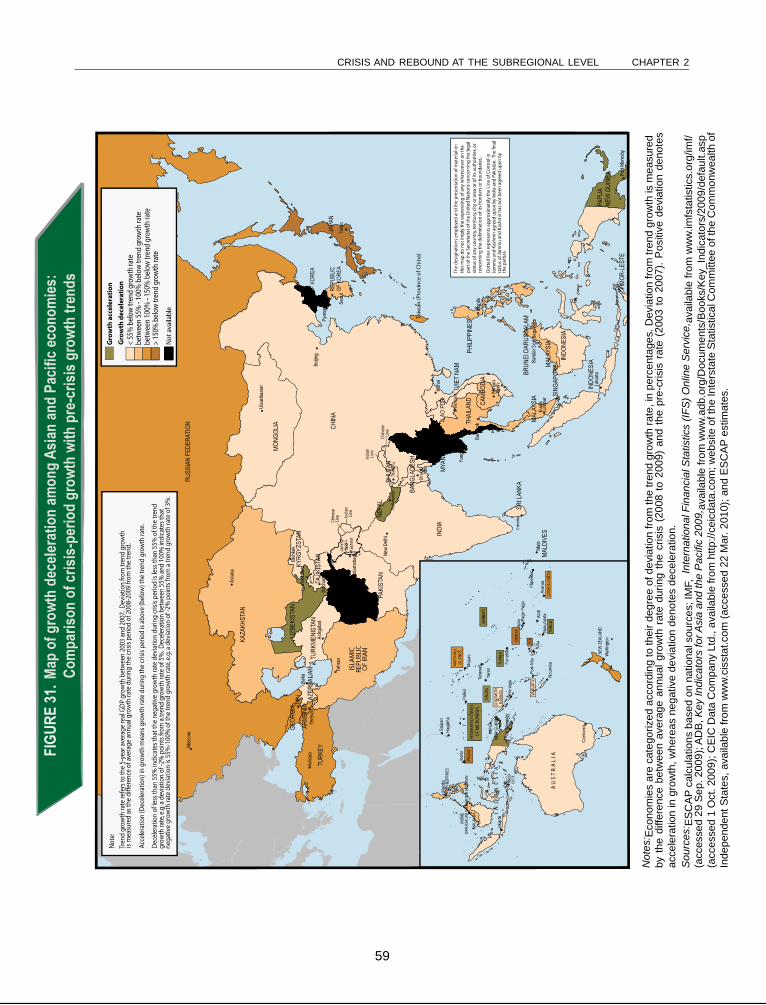
Not
es: E
cono
mie
s ar
e ca
tego
rized
acc
ordi
ng to
thei
r deg
ree
of d
evia
tion
from
the
trend
gro
wth
rate
, in
perc
enta
ges.
Dev
iatio
n fro
m tr
end
grow
th is
mea
sure
dby
the
diffe
renc
e be
twee
n av
erag
e an
nual
gro
wth
rat
e du
ring
the
cris
is (
2008
to 2
009)
and
the
pre-
cris
is r
ate
(200
3 to
200
7). P
ositi
ve d
evia
tion
deno
tes
acce
lera
tion
in g
row
th, w
here
as n
egat
ive
devi
atio
n de
note
s de
cele
ratio
n.S
ourc
es: E
SC
AP
calc
ulat
ions
bas
ed o
n na
tiona
l sou
rces
; IM
F,In
tern
atio
nal F
inan
cial
Sta
tistic
s (IF
S) O
nlin
e S
ervi
ce, a
vaila
ble
from
ww
w.im
fsta
tistic
s.or
g/im
f/(a
cces
sed
29 S
ep. 2
009)
; AD
B,K
ey In
dica
tors
for A
sia
and
the
Pac
ific
2009
, ava
ilabl
e fro
m w
ww
.adb
.org
/Doc
umen
ts/B
ooks
/Key
_Ind
icat
ors/
2009
/def
ault.
asp
(acc
esse
d 1
Oct
. 200
9); C
EIC
Dat
a C
ompa
ny L
td.,
avai
labl
e fro
m h
ttp://
ceic
data
.com
; web
site
of t
he In
ters
tate
Sta
tistic
al C
omm
ittee
of t
he C
omm
onw
ealth
of
Inde
pend
ent S
tate
s, a
vaila
ble
from
ww
w.c
isst
at.c
om (a
cces
sed
22 M
ar. 2
010)
; and
ES
CA
P es
timat
es.
New
Delhi
Islam
abad
Kabu
lTe
hran
Anka
raYe
reva
n
Tbilis
iBa
ku
Ashg
abat
Colom
bo
Yang
on
Bang
kok
Phno
m Jaka
rta
Hano
i
Kuala
Lump
ur
Band
ar S
eri B
egaw
an
Penh
Manil
a
Toky
o
Bish
kek
Beijin
g
Ulaa
nbaa
tar
Astan
a
Mosc
ow
Male
Pyon
gyan
g
Dili
Port
Mor
esby
Tash
kent
Dush
anbe
59
CRISIS AND REBOUND AT THE SUBREGIONAL LEVEL CHAPTER 2
ECONOMIC AND SOCIAL SURVEY OF ASIA AND THE PACIFIC 2010
60
world’s fastest-growing economies – consistentlyso. While vertically and horizontally integratedproduction networks have deepened economicrelations among China, Japan and the Republicof Korea, linkages with the other economies ofthe subregion are much less developed andharbour a huge potential for future growth. Im-portantly, perhaps as a sign of more to come, inOctober 2009 China and the Russian Federationsigned a $4 billion trade and investment agree-ment that included oil, gas, raw materials andengineering. The two Governments envisage ex-panding Russian oil and gas exports to Chinaand cooperation between them in extracting andprocessing raw materials. The Russian Federa-tion is one of the main suppliers of hydrocar-bons to China, while its technology and invest-ment agreement with China will help modernizeits own Far East region.
Monetary authorities have also enjoyed greaterflexibility, since lower food and energy priceshave helped reduce inflation. Japan, however,remained under greater pressure because itsprevious decade of recession has left it withhigh levels of accumulated debt.
Rebound under way. Between 2008 and 2009,growth in the subregion decelerated into nega-tive territory, from 2.1% to -1.1% (table 8 andfigure 32). Much of the slowdown took place inthe first half of 2009, at the peak of the globalfinancial crisis. A further dampener, in the sec-ond quarter of 2009, was the outbreak of H1N1influenza, whose severity at that time was un-known. Figure 32 reveals the scale of the de-celeration, with GDP growth declining rapidlyduring the first and second quarters of 2009.
In China, the deceleration brought the slowestgrowth since records of quarterly growth beganin the 1990s. However, urban fixed-asset invest-ment, which had increased by 26% during both2007 and 2008, rose even more quickly – by31% in 2009 – after the Government respondedwith its fiscal stimulus package. Household con-sumption also continued to grow, though retailsales growth decelerated from 22% in 2008 to16% in 2009. The pronounced rebound of 80%in the stock market brought recovery of all theground it had lost due to the crisis, spurringgrowth to reach 8.7% in 2009.
After being hit by the global financialcrisis, the developing economiesin East and North-East Asia, led
by China, recovered swiftly inthe latter part of 2009
Other economies are likewise extending theirlinks outside the subregion; for example, theMongolian Government has agreed with theIvanhoe Mines/Rio Tinto consortium a develop-ment scheme for the giant Oyu Tolgoi copper-gold deposit. The 2009 ASEAN-China Invest-ment Agreement aims to promote investmentflows and create a liberal, facilitative, transpar-ent and competitive investment regime.
Impact of the crisis
After being hit by the global financial crisis, thedeveloping economies in East and North-EastAsia, led by China, recovered swiftly in thelatter part of 2009. Their inherent resilience andtheir unprecedented expansionary macroeco-nomic policies are key. Although the export sec-tor has continued to struggle, the downturn haslargely been cushioned by domestic demand.
In China, the deceleration broughtthe slowest growth since records ofquarterly growth began in the 1990s
The four economies of Taiwan Province ofChina; Hong Kong, China; Macao, China; andthe Republic of Korea also experienced theirworst contraction since the Asian financial tur-moil of 1998 (table 8). Nevertheless, by thesecond half of 2009, a rebound was clearlyunder way in their subregion. By the end of2009, the Korea Composite Stock Price Indexwas 50% higher than a year earlier and 56%above its trough of November 2008, while muchsmaller declines were recorded than during the
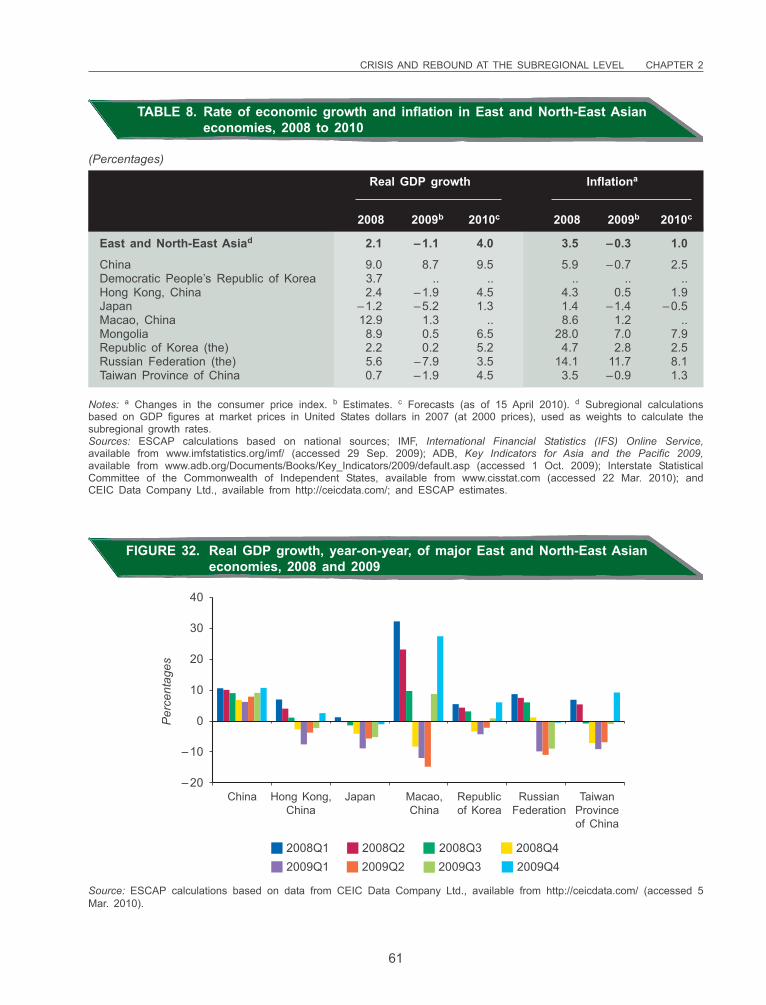
CRISIS AND REBOUND AT THE SUBREGIONAL LEVEL CHAPTER 2
61
TABLE 8. Rate of economic growth and inflation in East and North-East Asianeconomies, 2008 to 2010
Real GDP growth Inflationa
2008 2009b 2010c 2008 2009b 2010c
East and North-East Asiad 2.1 –1.1 4.0 3.5 –0.3 1.0
China 9.0 8.7 9.5 5.9 –0.7 2.5Democratic People’s Republic of Korea 3.7 .. .. .. .. ..Hong Kong, China 2.4 –1.9 4.5 4.3 0.5 1.9Japan –1.2 –5.2 1.3 1.4 –1.4 –0.5Macao, China 12.9 1.3 .. 8.6 1.2 ..Mongolia 8.9 0.5 6.5 28.0 7.0 7.9Republic of Korea (the) 2.2 0.2 5.2 4.7 2.8 2.5Russian Federation (the) 5.6 –7.9 3.5 14.1 11.7 8.1Taiwan Province of China 0.7 –1.9 4.5 3.5 –0.9 1.3
Notes: a Changes in the consumer price index. b Estimates. c Forecasts (as of 15 April 2010). d Subregional calculationsbased on GDP figures at market prices in United States dollars in 2007 (at 2000 prices), used as weights to calculate thesubregional growth rates.Sources: ESCAP calculations based on national sources; IMF, International Financial Statistics (IFS) Online Service,available from www.imfstatistics.org/imf/ (accessed 29 Sep. 2009); ADB, Key Indicators for Asia and the Pacific 2009,available from www.adb.org/Documents/Books/Key_Indicators/2009/default.asp (accessed 1 Oct. 2009); Interstate StatisticalCommittee of the Commonwealth of Independent States, available from www.cisstat.com (accessed 22 Mar. 2010); andCEIC Data Company Ltd., available from http://ceicdata.com/; and ESCAP estimates.
40
30
20
10
0
–10
–20
Per
cent
ages
FIGURE 32. Real GDP growth, year-on-year, of major East and North-East Asianeconomies, 2008 and 2009
China Hong Kong, Japan Macao, Republic Russian TaiwanChina China of Korea Federation Province
of China
2008Q1 2008Q3 2008Q42008Q22009Q32009Q1 2009Q42009Q2
Source: ESCAP calculations based on data from CEIC Data Company Ltd., available from http://ceicdata.com/ (accessed 5Mar. 2010).
(Percentages)
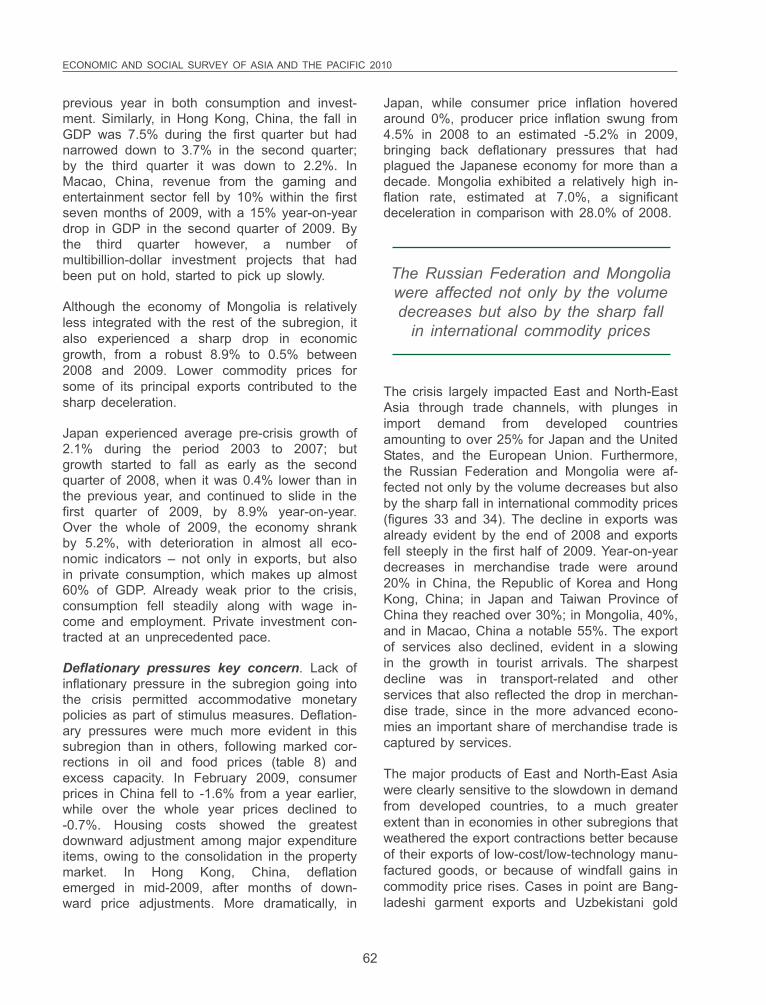
ECONOMIC AND SOCIAL SURVEY OF ASIA AND THE PACIFIC 2010
62
previous year in both consumption and invest-ment. Similarly, in Hong Kong, China, the fall inGDP was 7.5% during the first quarter but hadnarrowed down to 3.7% in the second quarter;by the third quarter it was down to 2.2%. InMacao, China, revenue from the gaming andentertainment sector fell by 10% within the firstseven months of 2009, with a 15% year-on-yeardrop in GDP in the second quarter of 2009. Bythe third quarter however, a number ofmultibillion-dollar investment projects that hadbeen put on hold, started to pick up slowly.
Although the economy of Mongolia is relativelyless integrated with the rest of the subregion, italso experienced a sharp drop in economicgrowth, from a robust 8.9% to 0.5% between2008 and 2009. Lower commodity prices forsome of its principal exports contributed to thesharp deceleration.
Japan experienced average pre-crisis growth of2.1% during the period 2003 to 2007; butgrowth started to fall as early as the secondquarter of 2008, when it was 0.4% lower than inthe previous year, and continued to slide in thefirst quarter of 2009, by 8.9% year-on-year.Over the whole of 2009, the economy shrankby 5.2%, with deterioration in almost all eco-nomic indicators – not only in exports, but alsoin private consumption, which makes up almost60% of GDP. Already weak prior to the crisis,consumption fell steadily along with wage in-come and employment. Private investment con-tracted at an unprecedented pace.
Deflationary pressures key concern. Lack ofinflationary pressure in the subregion going intothe crisis permitted accommodative monetarypolicies as part of stimulus measures. Deflation-ary pressures were much more evident in thissubregion than in others, following marked cor-rections in oil and food prices (table 8) andexcess capacity. In February 2009, consumerprices in China fell to -1.6% from a year earlier,while over the whole year prices declined to-0.7%. Housing costs showed the greatestdownward adjustment among major expenditureitems, owing to the consolidation in the propertymarket. In Hong Kong, China, deflationemerged in mid-2009, after months of down-ward price adjustments. More dramatically, in
Japan, while consumer price inflation hoveredaround 0%, producer price inflation swung from4.5% in 2008 to an estimated -5.2% in 2009,bringing back deflationary pressures that hadplagued the Japanese economy for more than adecade. Mongolia exhibited a relatively high in-flation rate, estimated at 7.0%, a significantdeceleration in comparison with 28.0% of 2008.
The Russian Federation and Mongoliawere affected not only by the volumedecreases but also by the sharp fall
in international commodity prices
The crisis largely impacted East and North-EastAsia through trade channels, with plunges inimport demand from developed countriesamounting to over 25% for Japan and the UnitedStates, and the European Union. Furthermore,the Russian Federation and Mongolia were af-fected not only by the volume decreases but alsoby the sharp fall in international commodity prices(figures 33 and 34). The decline in exports wasalready evident by the end of 2008 and exportsfell steeply in the first half of 2009. Year-on-yeardecreases in merchandise trade were around20% in China, the Republic of Korea and HongKong, China; in Japan and Taiwan Province ofChina they reached over 30%; in Mongolia, 40%,and in Macao, China a notable 55%. The exportof services also declined, evident in a slowingin the growth in tourist arrivals. The sharpestdecline was in transport-related and otherservices that also reflected the drop in merchan-dise trade, since in the more advanced econo-mies an important share of merchandise trade iscaptured by services.
The major products of East and North-East Asiawere clearly sensitive to the slowdown in demandfrom developed countries, to a much greaterextent than in economies in other subregions thatweathered the export contractions better becauseof their exports of low-cost/low-technology manu-factured goods, or because of windfall gains incommodity price rises. Cases in point are Bang-ladeshi garment exports and Uzbekistani gold
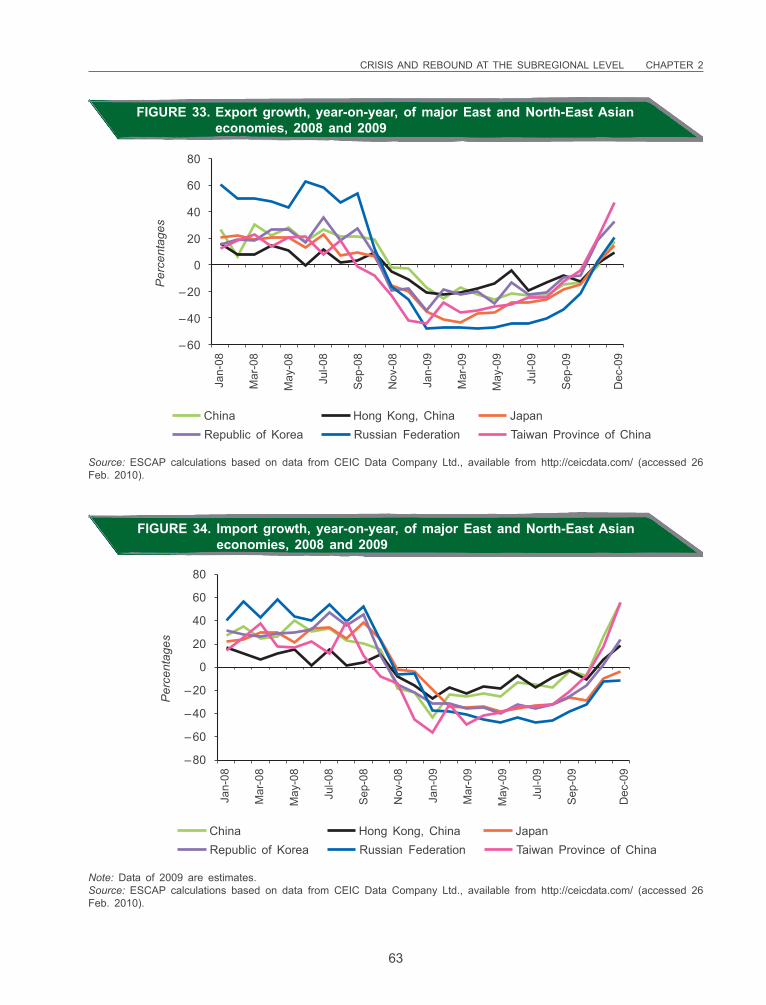
CRISIS AND REBOUND AT THE SUBREGIONAL LEVEL CHAPTER 2
63
80
60
40
20
0
–20
–40
–60
Per
cent
ages
Jan-
08
Mar
-08
May
-08
Jul-0
8
Sep
-08
Nov
-08
Jan-
09
Mar
-09
May
-09
Jul-0
9
Sep
-09
Dec
-09
China JapanRepublic of Korea
Hong Kong, ChinaRussian Federation Taiwan Province of China
FIGURE 33. Export growth, year-on-year, of major East and North-East Asianeconomies, 2008 and 2009
Source: ESCAP calculations based on data from CEIC Data Company Ltd., available from http://ceicdata.com/ (accessed 26Feb. 2010).
80
60
40
20
0
–20
–40
–60
–80
Per
cent
ages
Jan-
08
Mar
-08
May
-08
Jul-0
8
Sep
-08
Nov
-08
Jan-
09
Mar
-09
May
-09
Jul-0
9
Sep
-09
Dec
-09
China JapanRepublic of Korea
Hong Kong, ChinaRussian Federation Taiwan Province of China
FIGURE 34. Import growth, year-on-year, of major East and North-East Asianeconomies, 2008 and 2009
Note: Data of 2009 are estimates.Source: ESCAP calculations based on data from CEIC Data Company Ltd., available from http://ceicdata.com/ (accessed 26Feb. 2010).
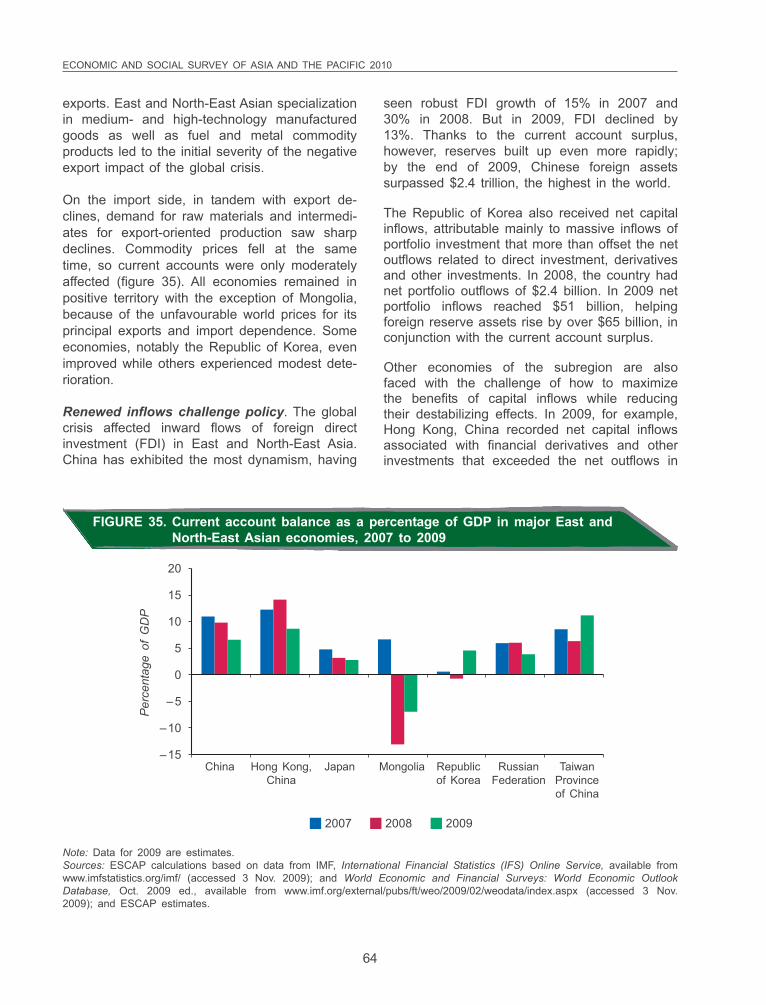
ECONOMIC AND SOCIAL SURVEY OF ASIA AND THE PACIFIC 2010
64
exports. East and North-East Asian specializationin medium- and high-technology manufacturedgoods as well as fuel and metal commodityproducts led to the initial severity of the negativeexport impact of the global crisis.
On the import side, in tandem with export de-clines, demand for raw materials and intermedi-ates for export-oriented production saw sharpdeclines. Commodity prices fell at the sametime, so current accounts were only moderatelyaffected (figure 35). All economies remained inpositive territory with the exception of Mongolia,because of the unfavourable world prices for itsprincipal exports and import dependence. Someeconomies, notably the Republic of Korea, evenimproved while others experienced modest dete-rioration.
Renewed inflows challenge policy. The globalcrisis affected inward flows of foreign directinvestment (FDI) in East and North-East Asia.China has exhibited the most dynamism, having
seen robust FDI growth of 15% in 2007 and30% in 2008. But in 2009, FDI declined by13%. Thanks to the current account surplus,however, reserves built up even more rapidly;by the end of 2009, Chinese foreign assetssurpassed $2.4 trillion, the highest in the world.
The Republic of Korea also received net capitalinflows, attributable mainly to massive inflows ofportfolio investment that more than offset the netoutflows related to direct investment, derivativesand other investments. In 2008, the country hadnet portfolio outflows of $2.4 billion. In 2009 netportfolio inflows reached $51 billion, helpingforeign reserve assets rise by over $65 billion, inconjunction with the current account surplus.
Other economies of the subregion are alsofaced with the challenge of how to maximizethe benefits of capital inflows while reducingtheir destabilizing effects. In 2009, for example,Hong Kong, China recorded net capital inflowsassociated with financial derivatives and otherinvestments that exceeded the net outflows in
20
15
10
5
0
–5
–10
–15
Per
cent
age
of G
DP
China Hong Kong, Japan Mongolia Republic Russian TaiwanChina of Korea Federation Province
of China
2007 2008 2009
FIGURE 35. Current account balance as a percentage of GDP in major East andNorth-East Asian economies, 2007 to 2009
Note: Data for 2009 are estimates.Sources: ESCAP calculations based on data from IMF, International Financial Statistics (IFS) Online Service, available fromwww.imfstatistics.org/imf/ (accessed 3 Nov. 2009); and World Economic and Financial Surveys: World Economic OutlookDatabase, Oct. 2009 ed., available from www.imf.org/external/pubs/ft/weo/2009/02/weodata/index.aspx (accessed 3 Nov.2009); and ESCAP estimates.
CRISIS AND REBOUND AT THE SUBREGIONAL LEVEL CHAPTER 2
65
direct and portfolio investment. Combined withits current account surplus, by 2009 foreignreserve assets had exceeded $250 billion.
dampened intraregional trade in 2009. The NewTaiwan dollar experienced mild appreciation of3% over 2009 against the United States dollar.Under the Linked Exchange Rate system, theHong Kong dollar remained stable. The largestappreciation – almost 20% during 2009 – wasthat of the Russian rouble, reflecting the Gov-ernment’s monetary policy which helped avoiduncontrolled currency depreciation.
On the other hand, towards the end of 2008,the Mongolian tugrik lost over 25% of its valueagainst the United States dollar. The Bank ofMongolia responded with a rise in interest rates.By end-2009 the tugrik was 8% higher than itsMarch trough.
Policy responses
Low inflation levels enabled Governments tosupport aggressive fiscal spending with accom-modative monetary policies. At the end of 2008,Japan, for example, lowered the policy interestrate by 0.5% to a token 0.1%. From October2008, the Bank of Korea cut its policy rate sixtimes in a row, reducing it by 325 basis pointsto a record low of 2%. Similarly, Hong Kong,China and Taiwan Province of China keptinterest rates at rock-bottom levels – at 0.5%and 0.1%, respectively (figure 36).
Mongolia also witnessed capitalinflows that enabled it to offset a
current account deficit in the secondquarter of 2009. By mid-2009, foreignreserves stood at about $650 million
In the case of Taiwan Province of China, netcapital inflows in the first half of 2009 camemainly from the net inflows of other investmentand financial derivatives. They offset the netoutflows of direct and portfolio investment thathad resulted from increased investment over-seas. Coupled with current account surplus,foreign reserve assets continued to accumulateto over $300 billion by mid-2009.
Mongolia also witnessed capital inflows thatenabled it to offset a current account deficit inthe second quarter of 2009. By mid-2009, for-eign reserves stood at about $650 million.
Appreciating currencies. In China, in the firsthalf of 2008, the Central Bank ceased floating theyuan within a band, that had led to notableappreciation. During 2009, however, despite theincrease in capital inflows, the yuan remainedlargely stable at around 6.8 per United Statesdollar. Stability in the exchange rate, as the USdollar weakened, helped maintain export competi-tiveness in third markets. However, with continuingsurpluses in capital and current accounts, Chinacontinues to face pressures for appreciation.
The Korean won, by contrast, regained valueduring 2009, rising by 18% – a consequence ofsurplus in the current account, inflows of portfo-lio capital and improved access to foreign creditmarkets. The Japanese yen appreciated by over20% from its low in mid-2008. Both Japan andthe Republic of Korea, however, became lesscompetitive in the Chinese market and else-where because of the stability of the yuan.China takes a major share of exports of both ofthose countries, so exchange rate movements
Low inflation levels enabledGovernments to support aggressivefiscal spending with accommodative
monetary policies
At such rates, little room remains for furthercuts to support private lending. China is a spe-cial case – the Government could direct in-creases in bank lending. In general each coun-try’s capacity to undertake effective stimuluswas due to the considerable fiscal space avail-able before the crisis for Government spending.The subregion displayed some of the largestfiscal spending programmes in the world as apercentage of GDP, particularly those of China,the Republic of Korea and Japan.
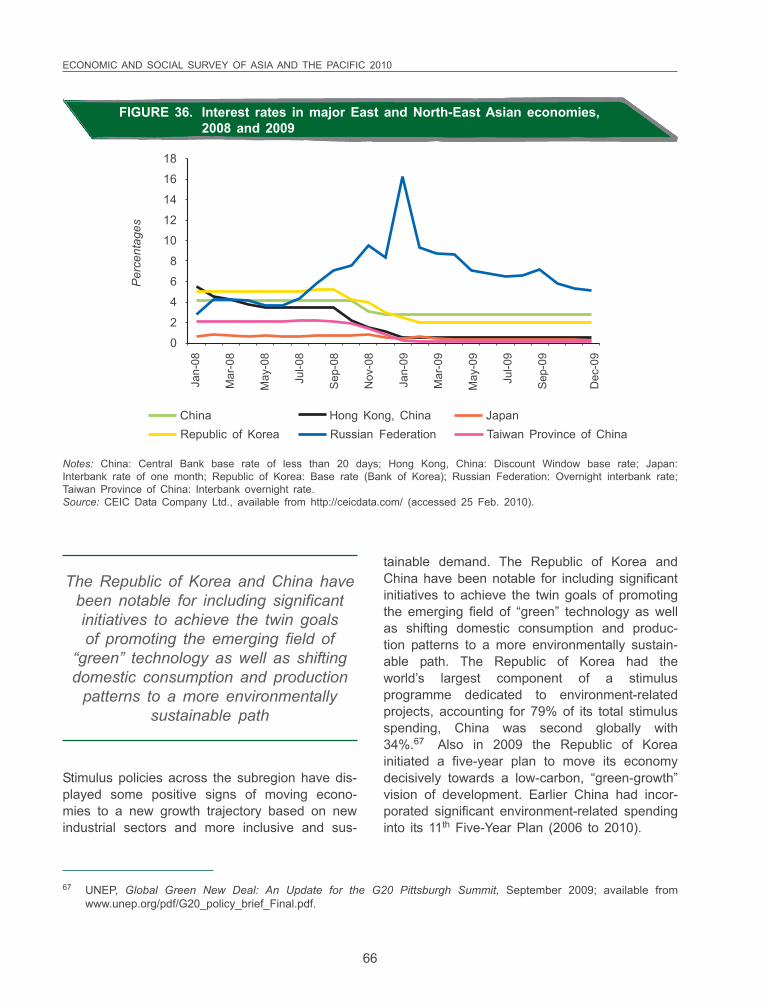
ECONOMIC AND SOCIAL SURVEY OF ASIA AND THE PACIFIC 2010
66
18
16
14
12
10
8
6
4
2
0
Per
cent
ages
Jan-
08
Mar
-08
May
-08
Jul-0
8
Sep
-08
Nov
-08
Jan-
09
Mar
-09
May
-09
Jul-0
9
Sep
-09
Dec
-09
China JapanRepublic of Korea
Hong Kong, ChinaRussian Federation Taiwan Province of China
FIGURE 36. Interest rates in major East and North-East Asian economies,2008 and 2009
Notes: China: Central Bank base rate of less than 20 days; Hong Kong, China: Discount Window base rate; Japan:Interbank rate of one month; Republic of Korea: Base rate (Bank of Korea); Russian Federation: Overnight interbank rate;Taiwan Province of China: Interbank overnight rate.Source: CEIC Data Company Ltd., available from http://ceicdata.com/ (accessed 25 Feb. 2010).
67 UNEP, Global Green New Deal: An Update for the G20 Pittsburgh Summit, September 2009; available fromwww.unep.org/pdf/G20_policy_brief_Final.pdf.
tainable demand. The Republic of Korea andChina have been notable for including significantinitiatives to achieve the twin goals of promotingthe emerging field of “green” technology as wellas shifting domestic consumption and produc-tion patterns to a more environmentally sustain-able path. The Republic of Korea had theworld’s largest component of a stimulusprogramme dedicated to environment-relatedprojects, accounting for 79% of its total stimulusspending, China was second globally with34%.67 Also in 2009 the Republic of Koreainitiated a five-year plan to move its economydecisively towards a low-carbon, “green-growth”vision of development. Earlier China had incor-porated significant environment-related spendinginto its 11th Five-Year Plan (2006 to 2010).
The Republic of Korea and China havebeen notable for including significantinitiatives to achieve the twin goalsof promoting the emerging field of
“green” technology as well as shiftingdomestic consumption and production
patterns to a more environmentallysustainable path
Stimulus policies across the subregion have dis-played some positive signs of moving econo-mies to a new growth trajectory based on newindustrial sectors and more inclusive and sus-
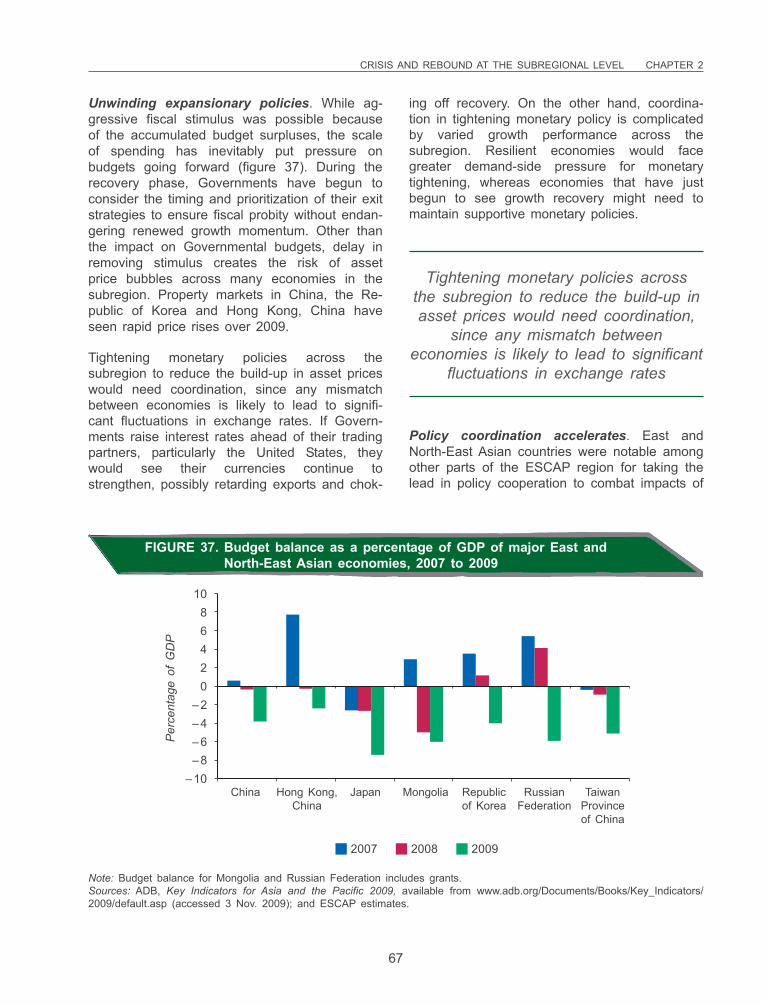
CRISIS AND REBOUND AT THE SUBREGIONAL LEVEL CHAPTER 2
67
Unwinding expansionary policies. While ag-gressive fiscal stimulus was possible becauseof the accumulated budget surpluses, the scaleof spending has inevitably put pressure onbudgets going forward (figure 37). During therecovery phase, Governments have begun toconsider the timing and prioritization of their exitstrategies to ensure fiscal probity without endan-gering renewed growth momentum. Other thanthe impact on Governmental budgets, delay inremoving stimulus creates the risk of assetprice bubbles across many economies in thesubregion. Property markets in China, the Re-public of Korea and Hong Kong, China haveseen rapid price rises over 2009.
Tightening monetary policies across thesubregion to reduce the build-up in asset priceswould need coordination, since any mismatchbetween economies is likely to lead to signifi-cant fluctuations in exchange rates. If Govern-ments raise interest rates ahead of their tradingpartners, particularly the United States, theywould see their currencies continue tostrengthen, possibly retarding exports and chok-
ing off recovery. On the other hand, coordina-tion in tightening monetary policy is complicatedby varied growth performance across thesubregion. Resilient economies would facegreater demand-side pressure for monetarytightening, whereas economies that have justbegun to see growth recovery might need tomaintain supportive monetary policies.
1086420
–2–4–6–8
–10
Per
cent
age
of G
DP
China Hong Kong, Japan Mongolia Republic Russian TaiwanChina of Korea Federation Province
of China
2007 2008 2009
FIGURE 37. Budget balance as a percentage of GDP of major East andNorth-East Asian economies, 2007 to 2009
Note: Budget balance for Mongolia and Russian Federation includes grants.Sources: ADB, Key Indicators for Asia and the Pacific 2009, available from www.adb.org/Documents/Books/Key_Indicators/2009/default.asp (accessed 3 Nov. 2009); and ESCAP estimates.
Tightening monetary policies acrossthe subregion to reduce the build-up inasset prices would need coordination,
since any mismatch betweeneconomies is likely to lead to significant
fluctuations in exchange rates
Policy coordination accelerates. East andNorth-East Asian countries were notable amongother parts of the ESCAP region for taking thelead in policy cooperation to combat impacts of
ECONOMIC AND SOCIAL SURVEY OF ASIA AND THE PACIFIC 2010
68
the crisis. Cooperation moved to new heightsamong the major economies of Japan, China,the Republic of Korea and the Russian Federa-tion. The three first-named played a leading rolein 2009 in the financial response of Asia andthe Pacific to the crisis through themultilateralization of the ASEAN+3 Chiang MaiInitiative, as well as the expansion of bilateralcurrency swap arrangements between the Re-public of Korea and the other two East Asianeconomies in late 2008.68 The Russian Federa-tion and China have deepened their cooperationthrough the Shanghai Cooperation Organisationframework as well as on a bilateral basis. InOctober 2009, the two economies moved to-wards deeper integration in trade and invest-ment related to the supply of energy from theRussian Federation to China, an area of enor-mous future potential in subregional coopera-tion. The two economies have also been at theforefront of proposals to expand the system ofworld reserve currencies and increase the useof IMF special drawing rights (SDRs).69
Outlook and policy challenges
By mid-2009 all economies were showing signsof a rebound. Growth is forecast to rise from thesetback of -1.1% in 2009 to 4.0% in 2010 (table8). Yet risks remain – the recent rebound couldquickly turn into a second dip if global financialweakness returns, or if Governments exit prema-turely from expansionary macroeconomic poli-cies, and the private sector does not fill theinvestment gap. The key question is how to turnthe recent rebound into a sustained recovery.
From rebound to sustainable recovery.Developments in the East and North-Eastsubregion remain strongly influenced by China.If China is taken out of the equation, the growthrate for the rest of the subregion is below that
of other Asia-Pacific subregions. Stimulusspending by China has increased domestic in-vestment and consumption and therefore in-creased the demand for imports from thesubregion. For example, China in 2009 becamethe most important Japanese trading partner,overtaking the United States. Similarly, the in-crease in exports of the Republic of Korea toChina in 2009 served to replace much of theloss in exports to developed countries.70 Suchdevelopments point to a possible trend in themedium term among neighbouring economies –that of supplying goods destined for final de-mand in China rather than for processing andexport by China to supply final demand in de-veloped countries.
China is expected to continue to lead growth,expanding by 9.5% in 2010, with investment ininfrastructure helping to remove supply-sideconstraints and spur even faster growth beyond2010. A brighter economic outlook should alsoencourage further investment by the private sec-tor. China is likely to emerge in 2010 as theworld’s second-largest economy.
Much depends on what happens in Japan. Eventhough Japan should benefit from a revival inexternal demand and achieve positive growth of1.3% in 2010, domestic demand remains weakand business investment has yet to sustainrecovery. Consequently, Japan and other devel-oped countries appear to be converging in anequilibrium of slower growth. That would hinderthe return of East and North-East Asian econo-mies to high growth unless they can consumemore, save less and integrate more quicklyamong themselves and with other rapidly grow-ing Asian and Pacific economies, notably that ofIndia. Much remains to be done in liberalizingtrade and investment and removing regulatorybottlenecks while improving employment condi-tions in order to help boost private consumption.
68 Sim, William and Nipa Piboontanasawat, “South Korea, China, Japan agree on currency swaps for stability”,Bloomberg, 12 December 2009; available from www.bloomberg.com/apps/news?pid=20601089&sid=aMtclSyeEF8E.
69 Xinhua, “Russia, China hold similar positions on financial reform”, China Daily, 31 March 2009; available fromwww.chinadaily.com.cn/china/g20/2009-03/31/content_7633245.htm.
70 Chang-mock, Shin, “Korea focus: retrospect on Korean economy in 2009”, CEO Information No. 736 (Seoul:Samsung Economic Research Institute, 23 December 2009); available from www.koreafocus.or.kr/design2/layout/content_print.asp?group_id=102863.
CRISIS AND REBOUND AT THE SUBREGIONAL LEVEL CHAPTER 2
69
BOX 2. Potential for economic cooperation: the Democratic People’sRepublic of Korea
After two years of recession, the Democratic People’s Republic of Koreaa showed positive economic growth in 2008; yet growthremains constrained. The global financial crisis appears to have had limited, if any, impact on the economy, given the limitedintegration of the economy with the external world. The country has suffered its own financial difficulties: the complications arisingfrom a revaluation of its currency in November 2009. Inflation has followed, causing severe difficulties for poorer sections of thepopulation in purchasing necessary goods.
Trade flows remain small. It is estimated that imports continue to outpace exports resulting in a trade deficit of around $1.5 billionin 2008. Investment is hampered by foreign exchange constraints that limit the import of capital goods needed for technologicalupgrading. Other constraints such as outdated trade laws and the lack of comprehensive and coherent foreign investments policyremain to be addressed.
Insufficient availability of energy has been a major constraint for sustainable economic growth and social welfare. Considerableunexploited resources remain; only 30% of hydropower resources have been developed, representing nearly half of the electricityused by industry. No oil or natural gas is produced, requiring that they or their refined products be imported.
Difficulties in the agricultural sector and their impact on food security for the population have been of great concern. Foodproduction fell sharply over the past decade. In addition to geographical and climatic constraints, production during both theagricultural seasons has been severely limited by input shortages of mechanized equipment; quality seeds, fertilizer, pesticides,fuel and plastic sheeting, as well as labour. In recent years food imports have been reduced in a disturbing trend to offset thecereal shortfall, presenting further challenges for vulnerable groups within the country. Safety-net programmes that improve accessto basic food and other essentials are critical for households unable to meet their essential needs through their own production,purchase or traditional coping mechanisms.
On a more positive note, the major trading partners of Democratic People’s Republic of Korea are its neighbouring economies,namely those of the Republic of Korea, China and the Russian Federation. Being located between the well-established transportsystems of those trading partners, the potential for transit of goods by rail and road is big, as is broader economic cooperationbetween Democratic People’s Republic of Korea and North-East Asia. It was also reported recently that the country has upgradedthe status of a free trade zone near its border with China and Russian Federation, that potentially will boost foreign investment.
a Despite the paucity of reliable information for some economies, the current survey endeavours to cover all members of ESCAP, including theDemocratic People’s Republic of Korea. However, in the absence of comprehensive economic and social data, it is very difficult to present acomplete and accurate macroeconomic picture. The information here was obtained from secondary sources.
Benefiting from strong growth in China, theRepublic of Korea is expected to resume posi-tive growth in 2010, at a rate of around 5.2%.Taiwan Province of China should also be ableto take advantage of economic growth in theregion and grow by around 4.5% in 2010,though this will depend on the performance ofthe all-important export sector. Hong Kong,China, given its closer integration with the Chi-nese economy, should benefit from a strongperformance in China and be able to grow by4.5% in 2010. Mongolia should benefit from theOyu Tolgoi investment. Its economy should ex-pand by 6.5% in 2010.
NORTH AND CENTRAL ASIA
North and Central Asia is the subregion worstaffected by the global economic crisis. In 2008its economy had grown by 5.8%; in 2009, follow-ing the crisis, its economy shrank by 5.8% (table9). Millions of people who had recently movedout of poverty saw themselves slide quickly backwhile unemployment rose, real wages declinedand prices of basic necessities shot up. Coun-tries that depended on foreign-exchange remit-tances also came under pressure as a result ofthe shrinking economy in the two main migrant
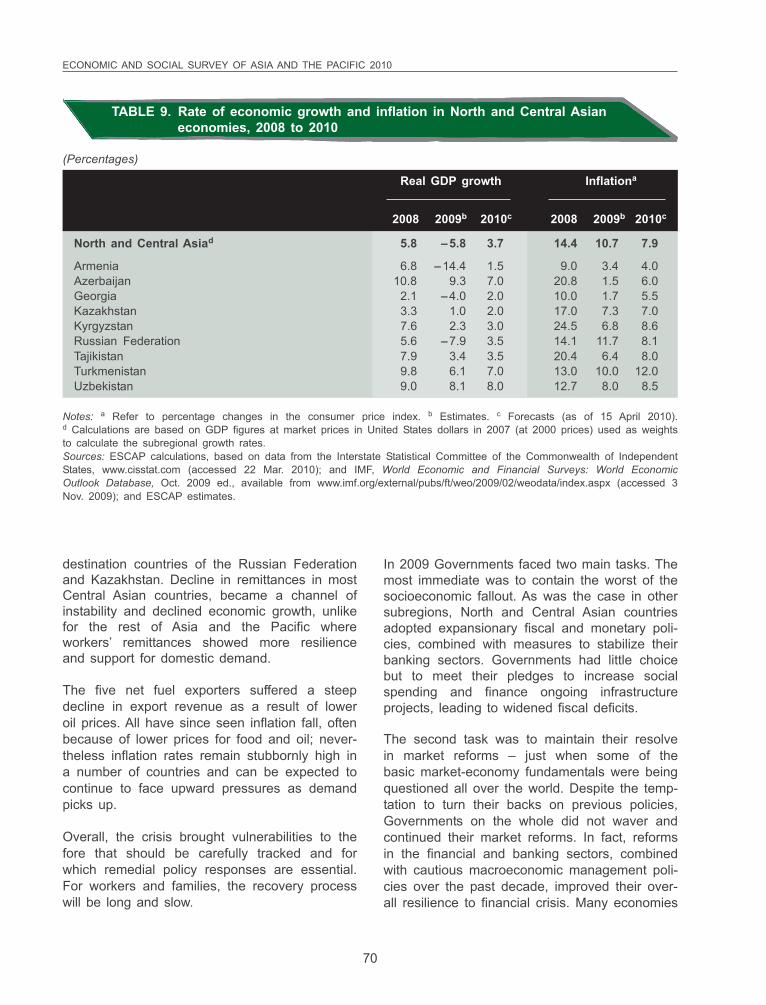
ECONOMIC AND SOCIAL SURVEY OF ASIA AND THE PACIFIC 2010
70
destination countries of the Russian Federationand Kazakhstan. Decline in remittances in mostCentral Asian countries, became a channel ofinstability and declined economic growth, unlikefor the rest of Asia and the Pacific whereworkers’ remittances showed more resilienceand support for domestic demand.
The five net fuel exporters suffered a steepdecline in export revenue as a result of loweroil prices. All have since seen inflation fall, oftenbecause of lower prices for food and oil; never-theless inflation rates remain stubbornly high ina number of countries and can be expected tocontinue to face upward pressures as demandpicks up.
Overall, the crisis brought vulnerabilities to thefore that should be carefully tracked and forwhich remedial policy responses are essential.For workers and families, the recovery processwill be long and slow.
TABLE 9. Rate of economic growth and inflation in North and Central Asianeconomies, 2008 to 2010
Real GDP growth Inflationa
2008 2009b 2010c 2008 2009b 2010c
North and Central Asiad 5.8 –5.8 3.7 14.4 10.7 7.9
Armenia 6.8 –14.4 1.5 9.0 3.4 4.0Azerbaijan 10.8 9.3 7.0 20.8 1.5 6.0Georgia 2.1 –4.0 2.0 10.0 1.7 5.5Kazakhstan 3.3 1.0 2.0 17.0 7.3 7.0Kyrgyzstan 7.6 2.3 3.0 24.5 6.8 8.6Russian Federation 5.6 –7.9 3.5 14.1 11.7 8.1Tajikistan 7.9 3.4 3.5 20.4 6.4 8.0Turkmenistan 9.8 6.1 7.0 13.0 10.0 12.0Uzbekistan 9.0 8.1 8.0 12.7 8.0 8.5
Notes: a Refer to percentage changes in the consumer price index. b Estimates. c Forecasts (as of 15 April 2010).d Calculations are based on GDP figures at market prices in United States dollars in 2007 (at 2000 prices) used as weightsto calculate the subregional growth rates.Sources: ESCAP calculations, based on data from the Interstate Statistical Committee of the Commonwealth of IndependentStates, www.cisstat.com (accessed 22 Mar. 2010); and IMF, World Economic and Financial Surveys: World EconomicOutlook Database, Oct. 2009 ed., available from www.imf.org/external/pubs/ft/weo/2009/02/weodata/index.aspx (accessed 3Nov. 2009); and ESCAP estimates.
In 2009 Governments faced two main tasks. Themost immediate was to contain the worst of thesocioeconomic fallout. As was the case in othersubregions, North and Central Asian countriesadopted expansionary fiscal and monetary poli-cies, combined with measures to stabilize theirbanking sectors. Governments had little choicebut to meet their pledges to increase socialspending and finance ongoing infrastructureprojects, leading to widened fiscal deficits.
The second task was to maintain their resolvein market reforms – just when some of thebasic market-economy fundamentals were beingquestioned all over the world. Despite the temp-tation to turn their backs on previous policies,Governments on the whole did not waver andcontinued their market reforms. In fact, reformsin the financial and banking sectors, combinedwith cautious macroeconomic management poli-cies over the past decade, improved their over-all resilience to financial crisis. Many economies
(Percentages)
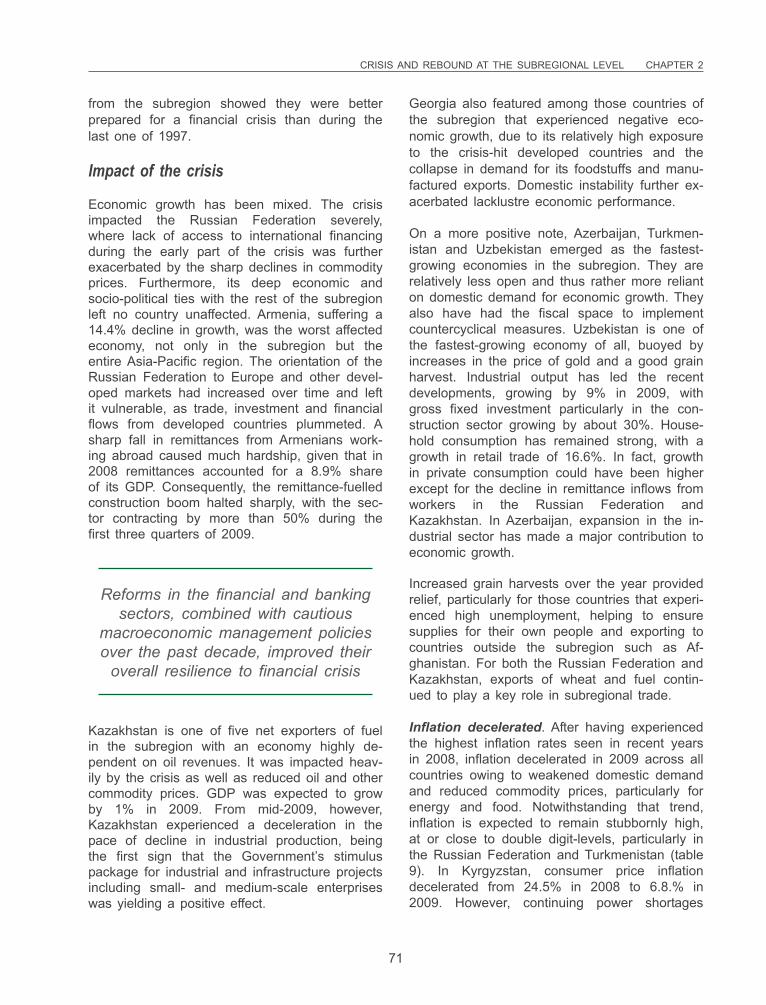
CRISIS AND REBOUND AT THE SUBREGIONAL LEVEL CHAPTER 2
71
from the subregion showed they were betterprepared for a financial crisis than during thelast one of 1997.
Impact of the crisis
Economic growth has been mixed. The crisisimpacted the Russian Federation severely,where lack of access to international financingduring the early part of the crisis was furtherexacerbated by the sharp declines in commodityprices. Furthermore, its deep economic andsocio-political ties with the rest of the subregionleft no country unaffected. Armenia, suffering a14.4% decline in growth, was the worst affectedeconomy, not only in the subregion but theentire Asia-Pacific region. The orientation of theRussian Federation to Europe and other devel-oped markets had increased over time and leftit vulnerable, as trade, investment and financialflows from developed countries plummeted. Asharp fall in remittances from Armenians work-ing abroad caused much hardship, given that in2008 remittances accounted for a 8.9% shareof its GDP. Consequently, the remittance-fuelledconstruction boom halted sharply, with the sec-tor contracting by more than 50% during thefirst three quarters of 2009.
Georgia also featured among those countries ofthe subregion that experienced negative eco-nomic growth, due to its relatively high exposureto the crisis-hit developed countries and thecollapse in demand for its foodstuffs and manu-factured exports. Domestic instability further ex-acerbated lacklustre economic performance.
On a more positive note, Azerbaijan, Turkmen-istan and Uzbekistan emerged as the fastest-growing economies in the subregion. They arerelatively less open and thus rather more relianton domestic demand for economic growth. Theyalso have had the fiscal space to implementcountercyclical measures. Uzbekistan is one ofthe fastest-growing economy of all, buoyed byincreases in the price of gold and a good grainharvest. Industrial output has led the recentdevelopments, growing by 9% in 2009, withgross fixed investment particularly in the con-struction sector growing by about 30%. House-hold consumption has remained strong, with agrowth in retail trade of 16.6%. In fact, growthin private consumption could have been higherexcept for the decline in remittance inflows fromworkers in the Russian Federation andKazakhstan. In Azerbaijan, expansion in the in-dustrial sector has made a major contribution toeconomic growth.
Increased grain harvests over the year providedrelief, particularly for those countries that experi-enced high unemployment, helping to ensuresupplies for their own people and exporting tocountries outside the subregion such as Af-ghanistan. For both the Russian Federation andKazakhstan, exports of wheat and fuel contin-ued to play a key role in subregional trade.
Inflation decelerated. After having experiencedthe highest inflation rates seen in recent yearsin 2008, inflation decelerated in 2009 across allcountries owing to weakened domestic demandand reduced commodity prices, particularly forenergy and food. Notwithstanding that trend,inflation is expected to remain stubbornly high,at or close to double digit-levels, particularly inthe Russian Federation and Turkmenistan (table9). In Kyrgyzstan, consumer price inflationdecelerated from 24.5% in 2008 to 6.8.% in2009. However, continuing power shortages
Reforms in the financial and bankingsectors, combined with cautious
macroeconomic management policiesover the past decade, improved their
overall resilience to financial crisis
Kazakhstan is one of five net exporters of fuelin the subregion with an economy highly de-pendent on oil revenues. It was impacted heav-ily by the crisis as well as reduced oil and othercommodity prices. GDP was expected to growby 1% in 2009. From mid-2009, however,Kazakhstan experienced a deceleration in thepace of decline in industrial production, beingthe first sign that the Government’s stimuluspackage for industrial and infrastructure projectsincluding small- and medium-scale enterpriseswas yielding a positive effect.
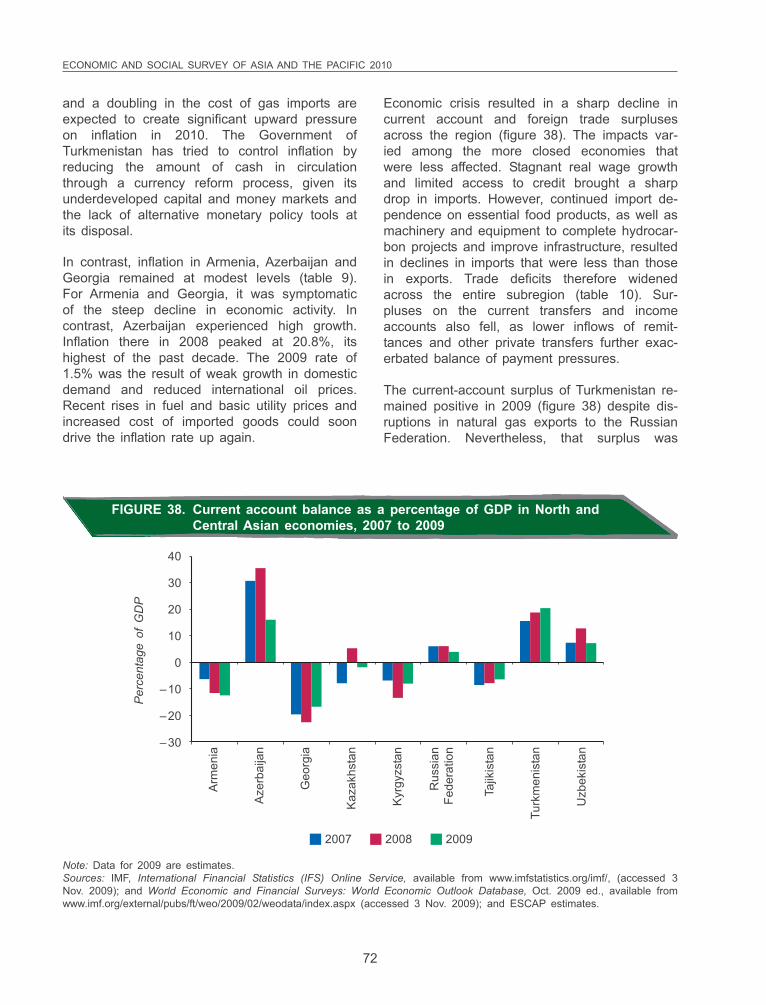
ECONOMIC AND SOCIAL SURVEY OF ASIA AND THE PACIFIC 2010
72
and a doubling in the cost of gas imports areexpected to create significant upward pressureon inflation in 2010. The Government ofTurkmenistan has tried to control inflation byreducing the amount of cash in circulationthrough a currency reform process, given itsunderdeveloped capital and money markets andthe lack of alternative monetary policy tools atits disposal.
In contrast, inflation in Armenia, Azerbaijan andGeorgia remained at modest levels (table 9).For Armenia and Georgia, it was symptomaticof the steep decline in economic activity. Incontrast, Azerbaijan experienced high growth.Inflation there in 2008 peaked at 20.8%, itshighest of the past decade. The 2009 rate of1.5% was the result of weak growth in domesticdemand and reduced international oil prices.Recent rises in fuel and basic utility prices andincreased cost of imported goods could soondrive the inflation rate up again.
40
30
20
10
0
–10
–20
–30
Per
cent
age
of G
DP
2007 2008 2009
Arm
enia
Aze
rbai
jan
Geo
rgia
Kaz
akhs
tan
Kyr
gyzs
tan
Rus
sian
Fede
ratio
n
Tajik
ista
n
Turk
men
ista
n
Uzb
ekis
tan
FIGURE 38. Current account balance as a percentage of GDP in North andCentral Asian economies, 2007 to 2009
Note: Data for 2009 are estimates.Sources: IMF, International Financial Statistics (IFS) Online Service, available from www.imfstatistics.org/imf/, (accessed 3Nov. 2009); and World Economic and Financial Surveys: World Economic Outlook Database, Oct. 2009 ed., available fromwww.imf.org/external/pubs/ft/weo/2009/02/weodata/index.aspx (accessed 3 Nov. 2009); and ESCAP estimates.
Economic crisis resulted in a sharp decline incurrent account and foreign trade surplusesacross the region (figure 38). The impacts var-ied among the more closed economies thatwere less affected. Stagnant real wage growthand limited access to credit brought a sharpdrop in imports. However, continued import de-pendence on essential food products, as well asmachinery and equipment to complete hydrocar-bon projects and improve infrastructure, resultedin declines in imports that were less than thosein exports. Trade deficits therefore widenedacross the entire subregion (table 10). Sur-pluses on the current transfers and incomeaccounts also fell, as lower inflows of remit-tances and other private transfers further exac-erbated balance of payment pressures.
The current-account surplus of Turkmenistan re-mained positive in 2009 (figure 38) despite dis-ruptions in natural gas exports to the RussianFederation. Nevertheless, that surplus was
CRISIS AND REBOUND AT THE SUBREGIONAL LEVEL CHAPTER 2
73
expected to account for 20.4% of GDP as gasexports resumed and tensions eased by year-end. Exports to China and the Islamic Republicof Iran increased. Similarly, in Uzbekistan, ris-ing global prices on its principal exports of gold,gas, and cotton were expected to sustain theexport revenues in 2009. Hydrocarbons alsobecame a more important source of incomethan in the past. Uzbekistan benefited from arenegotiated agreement with the RussianFederation regarding natural gas exports, withthe result that it was the only country thatexperienced slower declines in exports in 2009.
FDI inflows remained a key priority and contin-ued to play a key role in developing and mod-ernizing the economies of North and CentralAsia in 2009. However, a more difficult interna-tional economic environment limited new FDI intothe subregion. Tight credit conditions and theeconomic downturn adversely impacted FDIflows into the Russian Federation. FDI in non-financial sectors fell by more than 50% to $17.3billion in the first half of 2009, compared with
$39.6 billion received in the first six months of2008. Similarly in Georgia, FDI declined from$1.5 billion in the first four months of 2008 to$972 million in the corresponding period of 2009.
Remittances made a major socio-economiccontribution in low-income countries accountingfor one third and one quarter of GDP inTajikistan and Kyrgyzstan, respectively in 2008(table 11).
Up to one third of Tajikistan migrants are esti-mated to have returned home in 2009 andremittance inflows could have fallen by 60%. A30% fall in remittance inflows was expected inKyrgyzstan in 2009.
Policy responses
Governments reacted quickly to the crisis byimplementing expansionary monetary and fiscalpolicies, in line with expansionary policies imple-mented at the global level. As the crisis evolvedand Governments assumed more active man-
TABLE 10. Trade performance of North and Central Asian economies, inpercentages, 2007 to 2009
Growth rates
Exports Imports
2007 2008 2009 2007 2008 2009
Armenia 17.0 –8.3 –34.0 49.1 35.4 –25.3Azerbaijan 63.4 43.8 –69.2 14.7 25.3 –14.6Georgiaa 31.6 21.4 –35.3 41.8 20.9 –37.7Kazakhstan 24.8 49.1 –39.3 38.3 15.7 –25.0Kyrgyzstan 45.8 24.3 –22.4 55.6 46.1 –25.3Russian Federation 16.8 32.9 –35.5 45.0 33.7 –37.3Tajikistan 4.9 –4.2 –28.3 42.5 33.2 –21.5Turkmenistanb,c 12.9 52.7 –46.6 41.5 54.8 –28.8Uzbekistanb,c 42.9 29.2 –3.8 49.2 23.4 19.5
Notes: a 2009 data refer to first 2 quarters.b Import value in f.o.b.c Figures for 2008 and 2009 are EIU estimates for whole year.
Sources: Interstate Statistical Committee of the Commonwealth of Independent States, www.cisstat.com (accessed 29 Mar.2010); and Economist Intelligence Unit, Country Analysis and Forecasts, Country Analysis Services, Country Reports,accessible at http://countryanalysis.eiu.com/, various issues, 2010.
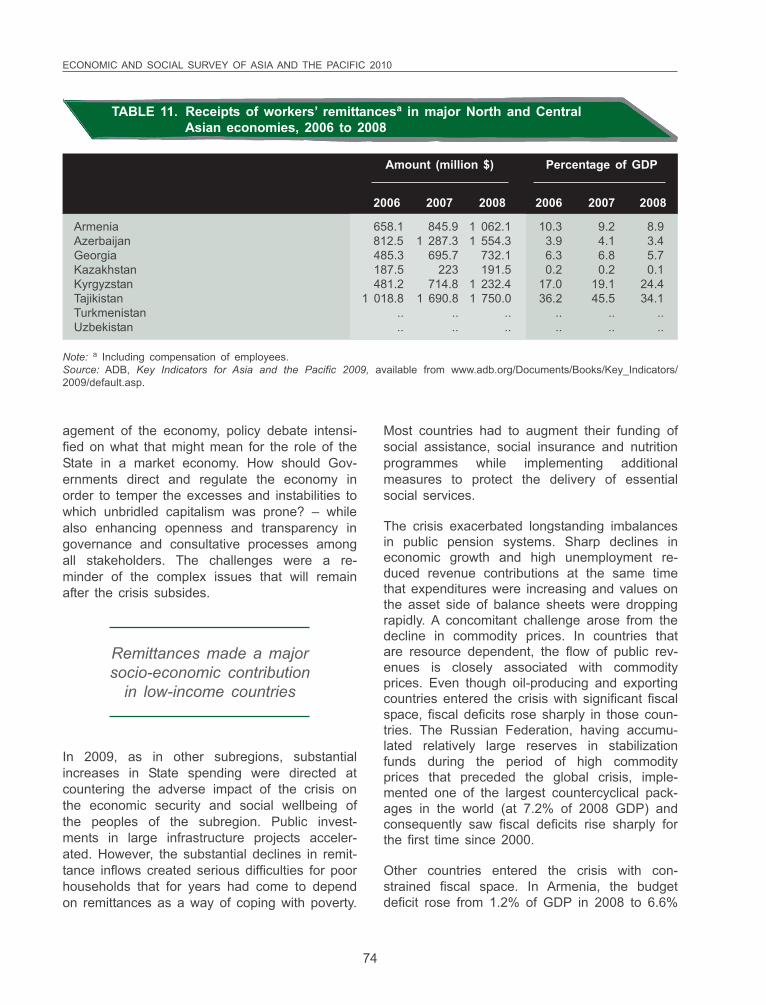
ECONOMIC AND SOCIAL SURVEY OF ASIA AND THE PACIFIC 2010
74
agement of the economy, policy debate intensi-fied on what that might mean for the role of theState in a market economy. How should Gov-ernments direct and regulate the economy inorder to temper the excesses and instabilities towhich unbridled capitalism was prone? – whilealso enhancing openness and transparency ingovernance and consultative processes amongall stakeholders. The challenges were a re-minder of the complex issues that will remainafter the crisis subsides.
Most countries had to augment their funding ofsocial assistance, social insurance and nutritionprogrammes while implementing additionalmeasures to protect the delivery of essentialsocial services.
The crisis exacerbated longstanding imbalancesin public pension systems. Sharp declines ineconomic growth and high unemployment re-duced revenue contributions at the same timethat expenditures were increasing and values onthe asset side of balance sheets were droppingrapidly. A concomitant challenge arose from thedecline in commodity prices. In countries thatare resource dependent, the flow of public rev-enues is closely associated with commodityprices. Even though oil-producing and exportingcountries entered the crisis with significant fiscalspace, fiscal deficits rose sharply in those coun-tries. The Russian Federation, having accumu-lated relatively large reserves in stabilizationfunds during the period of high commodityprices that preceded the global crisis, imple-mented one of the largest countercyclical pack-ages in the world (at 7.2% of 2008 GDP) andconsequently saw fiscal deficits rise sharply forthe first time since 2000.
Other countries entered the crisis with con-strained fiscal space. In Armenia, the budgetdeficit rose from 1.2% of GDP in 2008 to 6.6%
TABLE 11. Receipts of workers’ remittancesa in major North and CentralAsian economies, 2006 to 2008
Amount (million $) Percentage of GDP
2006 2007 2008 2006 2007 2008
Armenia 658.1 845.9 1 062.1 10.3 9.2 8.9Azerbaijan 812.5 1 287.3 1 554.3 3.9 4.1 3.4Georgia 485.3 695.7 732.1 6.3 6.8 5.7Kazakhstan 187.5 223 191.5 0.2 0.2 0.1Kyrgyzstan 481.2 714.8 1 232.4 17.0 19.1 24.4Tajikistan 1 018.8 1 690.8 1 750.0 36.2 45.5 34.1Turkmenistan .. .. .. .. .. ..Uzbekistan .. .. .. .. .. ..
Note: a Including compensation of employees.Source: ADB, Key Indicators for Asia and the Pacific 2009, available from www.adb.org/Documents/Books/Key_Indicators/2009/default.asp.
Remittances made a majorsocio-economic contribution
in low-income countries
In 2009, as in other subregions, substantialincreases in State spending were directed atcountering the adverse impact of the crisis onthe economic security and social wellbeing ofthe peoples of the subregion. Public invest-ments in large infrastructure projects acceler-ated. However, the substantial declines in remit-tance inflows created serious difficulties for poorhouseholds that for years had come to dependon remittances as a way of coping with poverty.
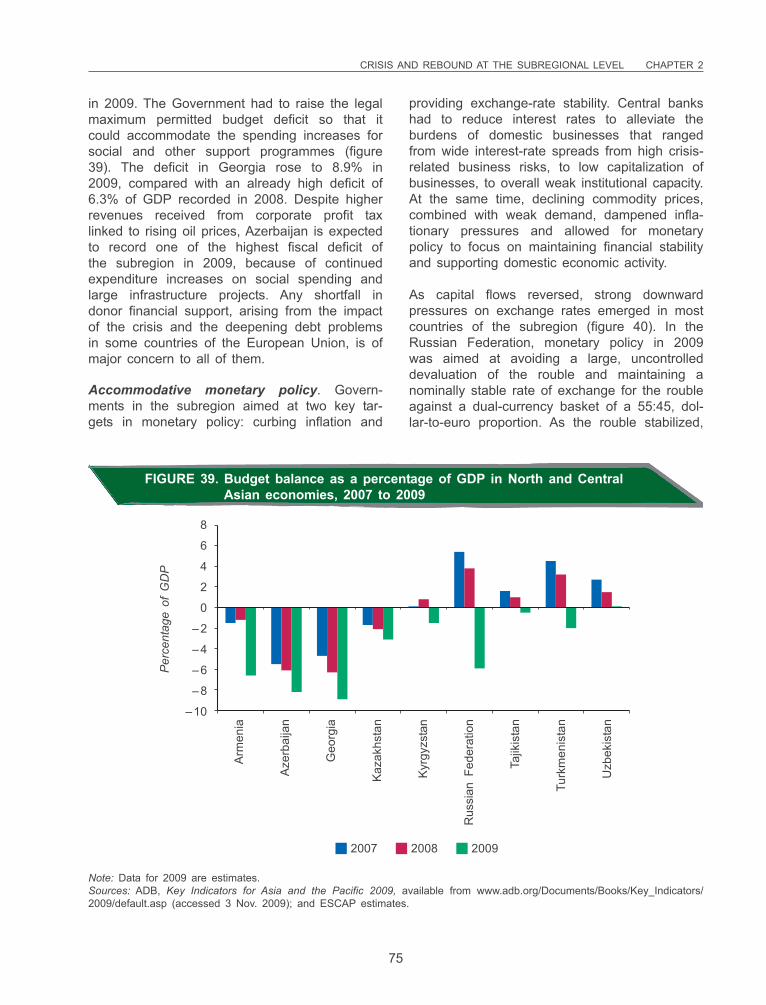
CRISIS AND REBOUND AT THE SUBREGIONAL LEVEL CHAPTER 2
75
in 2009. The Government had to raise the legalmaximum permitted budget deficit so that itcould accommodate the spending increases forsocial and other support programmes (figure39). The deficit in Georgia rose to 8.9% in2009, compared with an already high deficit of6.3% of GDP recorded in 2008. Despite higherrevenues received from corporate profit taxlinked to rising oil prices, Azerbaijan is expectedto record one of the highest fiscal deficit ofthe subregion in 2009, because of continuedexpenditure increases on social spending andlarge infrastructure projects. Any shortfall indonor financial support, arising from the impactof the crisis and the deepening debt problemsin some countries of the European Union, is ofmajor concern to all of them.
Accommodative monetary policy. Govern-ments in the subregion aimed at two key tar-gets in monetary policy: curbing inflation and
providing exchange-rate stability. Central bankshad to reduce interest rates to alleviate theburdens of domestic businesses that rangedfrom wide interest-rate spreads from high crisis-related business risks, to low capitalization ofbusinesses, to overall weak institutional capacity.At the same time, declining commodity prices,combined with weak demand, dampened infla-tionary pressures and allowed for monetarypolicy to focus on maintaining financial stabilityand supporting domestic economic activity.
As capital flows reversed, strong downwardpressures on exchange rates emerged in mostcountries of the subregion (figure 40). In theRussian Federation, monetary policy in 2009was aimed at avoiding a large, uncontrolleddevaluation of the rouble and maintaining anominally stable rate of exchange for the roubleagainst a dual-currency basket of a 55:45, dol-lar-to-euro proportion. As the rouble stabilized,
8
6
4
2
0
–2
–4
–6
–8
–10
Per
cent
age
of G
DP
2007 2008 2009
Arm
enia
Aze
rbai
jan
Geo
rgia
Kaz
akhs
tan
Kyr
gyzs
tan
Rus
sian
Fed
erat
ion
Tajik
ista
n
Turk
men
ista
n
Uzb
ekis
tan
FIGURE 39. Budget balance as a percentage of GDP in North and CentralAsian economies, 2007 to 2009
Note: Data for 2009 are estimates.Sources: ADB, Key Indicators for Asia and the Pacific 2009, available from www.adb.org/Documents/Books/Key_Indicators/2009/default.asp (accessed 3 Nov. 2009); and ESCAP estimates.
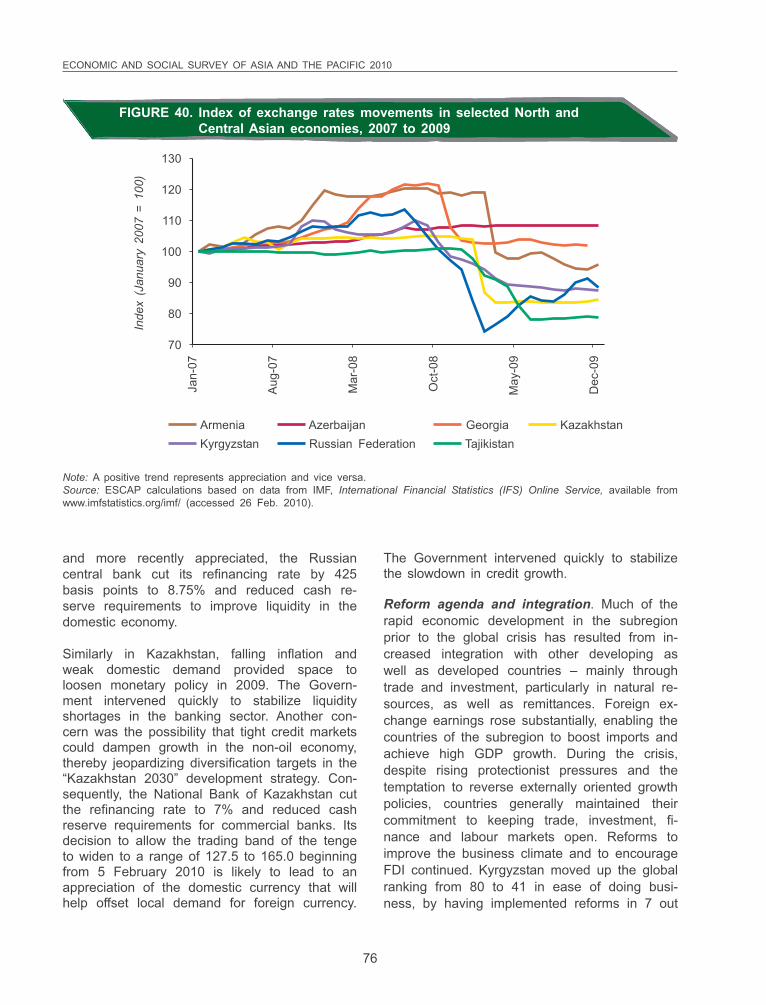
ECONOMIC AND SOCIAL SURVEY OF ASIA AND THE PACIFIC 2010
76
and more recently appreciated, the Russiancentral bank cut its refinancing rate by 425basis points to 8.75% and reduced cash re-serve requirements to improve liquidity in thedomestic economy.
Similarly in Kazakhstan, falling inflation andweak domestic demand provided space toloosen monetary policy in 2009. The Govern-ment intervened quickly to stabilize liquidityshortages in the banking sector. Another con-cern was the possibility that tight credit marketscould dampen growth in the non-oil economy,thereby jeopardizing diversification targets in the“Kazakhstan 2030” development strategy. Con-sequently, the National Bank of Kazakhstan cutthe refinancing rate to 7% and reduced cashreserve requirements for commercial banks. Itsdecision to allow the trading band of the tengeto widen to a range of 127.5 to 165.0 beginningfrom 5 February 2010 is likely to lead to anappreciation of the domestic currency that willhelp offset local demand for foreign currency.
The Government intervened quickly to stabilizethe slowdown in credit growth.
Reform agenda and integration. Much of therapid economic development in the subregionprior to the global crisis has resulted from in-creased integration with other developing aswell as developed countries – mainly throughtrade and investment, particularly in natural re-sources, as well as remittances. Foreign ex-change earnings rose substantially, enabling thecountries of the subregion to boost imports andachieve high GDP growth. During the crisis,despite rising protectionist pressures and thetemptation to reverse externally oriented growthpolicies, countries generally maintained theircommitment to keeping trade, investment, fi-nance and labour markets open. Reforms toimprove the business climate and to encourageFDI continued. Kyrgyzstan moved up the globalranking from 80 to 41 in ease of doing busi-ness, by having implemented reforms in 7 out
130
120
110
100
90
80
70
Inde
x (J
anua
ry 2
007
= 10
0)
Jan-
07
Aug
-07
Mar
-08
Oct
-08
May
-09
Dec
-09
ArmeniaKyrgyzstan
Azerbaijan Georgia KazakhstanRussian Federation Tajikistan
FIGURE 40. Index of exchange rates movements in selected North andCentral Asian economies, 2007 to 2009
Note: A positive trend represents appreciation and vice versa.Source: ESCAP calculations based on data from IMF, International Financial Statistics (IFS) Online Service, available fromwww.imfstatistics.org/imf/ (accessed 26 Feb. 2010).
CRISIS AND REBOUND AT THE SUBREGIONAL LEVEL CHAPTER 2
77
of the 10 areas measured in the report “DoingBusiness 2010”.71 Furthermore, countries in theprocess of accession to WTO continued theirefforts, despite the complexities. The RussianFederation, notwithstanding an accession proc-ess almost 20 years long, remains committed tojoin, at the same time pursuing other tradeagreements – for example, the Customs Unionwith Kazakhstan and Belarus (box 3). Attentionhas already focused on economies in Asiaand the Pacific because of growing comple-mentarities. In December 2009, the RussianFederation opened its Siberian oil export routewhich is expected to carry annually 80 milliontons of oil eastwards. The Russian Federationhas also emerged as an important supplier ofliquefied natural gas to Asia.
Outlook and policy challenges
The growth prospects of the economies inNorth and Central Asia in 2010 depend ontrends in global commodity prices and the per-formance of the Russian Federation andKazakhstan, which are the largest trading part-ners, important investors and major sources ofremittances for other economies in thesubregion. A return to positive growth is ex-pected in all countries and, for the subregion asa whole, the growth rate for 2010 is forecast at3.7%.
Strong domestic demand and increased oil andgas production should enable the economy ofthe Russian Federation to continue its expan-
71 World Bank, Doing Business 2010: Reforming through Difficult Times (Washington, D.C.: World Bank, 2009);available from www.doingbusiness.org/documents/fullreport/2010/DB10-full-report.pdf.
Subregional economic cooperation and trade in North and Central Asia broadened in 2009 when the Russian Federation andKazakhstan together with Belarus, another member of the Eurasian Economic Community (EurAsEC; but not an ESCAP membercountry), agreed to create a Customs Union to facilitate trade among the three of them, improve the competitiveness of theirproducts in world and Asian markets, and open new joint investment opportunities.a The Customs Union started functioning on 1January 2010 with common external tariffs, common principles in macroeconomic management and competition policies, andcommon approaches in subsidizing industrial and agricultural products. The Union is ready to admit other EurAsEC countries.Kyrgyzstan and Tajikistan are expected to join. The Union aims to become part of the agreed Single Economic Space (SES)b by2012, that in turn aims to merge within a “Eurasian Union” of the three economies thereafter.
The Customs Union aims to exploit mutual complementarities that could help create economies of scale and increase the region’sattractiveness as an investment area. Consequently the Union’s GDP is expected to rise 15% by 2015. The Russian Federationplays a leading role in bilateral trade with other members of the Union. It accounts for about one tenth of Kazakh exports andmore than one third of Belarusian exports. It provides more than 35% of Kazakh imports and more than 60% of Belarusianimports. Kazakhstan and the Russian Federation have substantial hydrocarbon deposits that form their principal export prospects.
The three Customs Union members possess rich deposits of ferrous, non-ferrous and precious metals, and hydropower resources.They share comparative advantages in the production of grains, meat and dairy products and could be self-sufficient in food. Theirwheat exports account for 17% of global wheat exports. Their combined human-resource base includes high levels of educationand scientific and technical potential. The Customs Union has a combined market of 170 million people.
Notes: a Eurasian Economic Community, “About EurAsEC”, available from www.evrazes.com/en/about/ (accessed 1 Apr. 2010).b Resolution No. 374 of the EurAsEC Interstate Council, Concept of Establishment of the Common Transport Space of the Eurasian
Economic Community, 25 February 2008, available from www.evrazes.com/docs/view/156 (accessed 1 Apr. 2010).
BOX 3. Creating a “Eurasian Union”: the Russian Federation, Kazakhstan, and Belarus
ECONOMIC AND SOCIAL SURVEY OF ASIA AND THE PACIFIC 2010
78
sion at 3.5% in 2010. However, inflationarypressures could persist, however, because ofmarked deterioration in fiscal deficits, risingcapital inflows and stronger domestic demand.In Kazakhstan, positive economic growth of 2%is forecast in 2010 owing to continued stronginvestment in oil-sector projects and risingprices for hydrocarbons and metals. The fastestgrowing economies are expected to be thoseof Turkmenistan and Azerbaijan at 7%, andUzbekistan at 8%. Kyrgyzstan and Tajikistan areexpected to develop their energy resourcesand infrastructure and to increase energy self-sufficiency with technical and financial assist-ance from the Russian Federation. They willneed additional international assistance tosustain economic development and solveproblems of poverty, infrastructure repair andcapacity-building. GDP growth of both econo-mies is expected to accelerate to about 3.0% ormore in 2010.
The growth prospects of the economiesin North and Central Asia in 2010
depend on trends in global commodityprices and the performance of the
Russian Federation and Kazakhstan
Looking beyond 2010, the subregion is ex-pected to expand trade and investment coop-eration with the rest of Asia and the Pacific.Complementarities between countries rich innatural resources and energy, and those experi-encing a rapid demand for such resources, willdrive the process. Cooperative agreements areexpected to increase and could include scienceand technology aspects, with a particular focuson drawing from experience and expertise avail-able in East Asia regarding adapting to andmitigating climate-change challenges. Improvingenvironmental management in water, agricultureand energy resources, and building up a low-carbon infrastructure that is less resource-inten-sive are promising new growth areas of thefuture that should deepen relations with the restof Asia and the Pacific.
OCEANIA
Many of the characteristics of Pacific islandeconomies have always impeded their develop-ment: their geography, narrow resource bases,frequent natural disasters and fragile ecosys-tems that are vulnerable to rising sea levels.Those characteristics cannot be changed. Yet,signs are emerging that some of the givens arebeing reshaped to enable the subregion to sus-tain and diversify its pattern of growth.
The crisis was transmitted to Oceaniathrough declining demand forexports, falls in tourism and
remittance earnings, etc
Pacific countries have benefited increasinglyfrom development of tourism and related trans-port services as well as remittances that provideresource for business investment and support topoor households. Some have benefited fromwindfall gains in high, albeit sharply fluctuating,commodity prices. But as they grow more de-pendent on those income sources, they becomemore vulnerable to global economic shocks.
In this crisis, the major economic and tradepartners were the hardest hit. From within thesubregion Australia and New Zealand which arekey economic partners of Pacific economies,also experienced marked slowdowns. Not sur-prisingly, the crisis was transmitted to Oceaniathrough declining demand for exports, falls intourism and remittance earnings, and thechanges in oil prices, since they have hightransportation costs. For some Pacific islandcountries, incomes from off-shore trust fundswere reduced as well. The challenge ahead isto find ways to continue diversifying their econo-mies while managing any resulting instabilities.
Impact of the crisis
GDP growth in the subregion was 2.0% in2008, but slowed to 1.0% in 2009 (table 12).
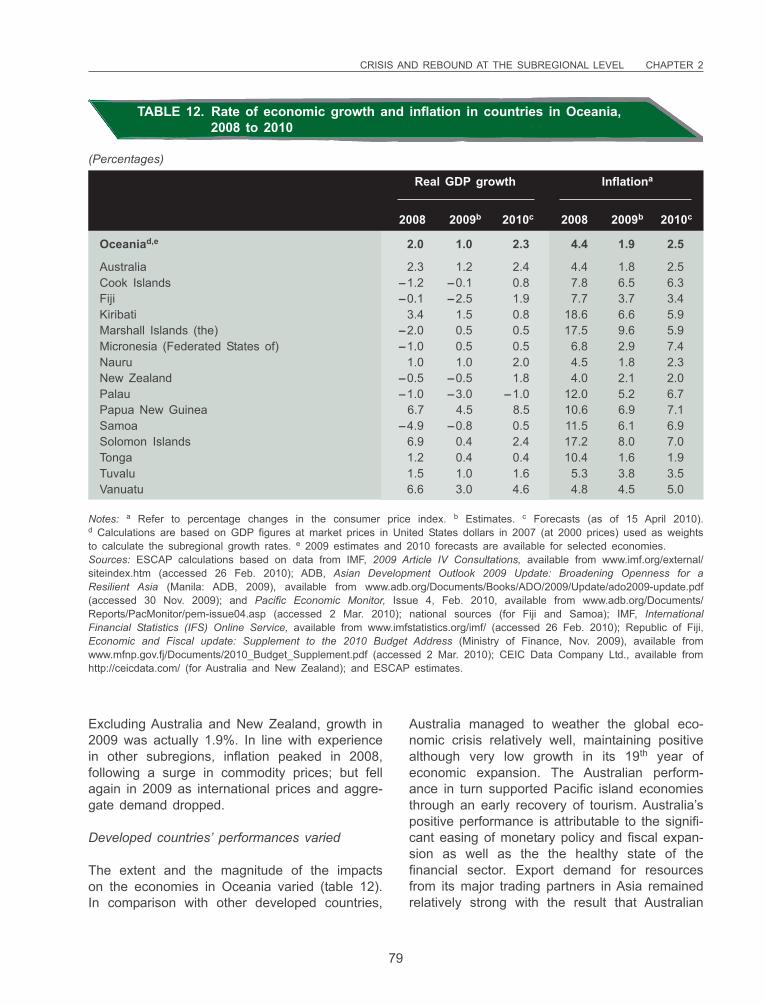
CRISIS AND REBOUND AT THE SUBREGIONAL LEVEL CHAPTER 2
79
Excluding Australia and New Zealand, growth in2009 was actually 1.9%. In line with experiencein other subregions, inflation peaked in 2008,following a surge in commodity prices; but fellagain in 2009 as international prices and aggre-gate demand dropped.
Developed countries’ performances varied
The extent and the magnitude of the impactson the economies in Oceania varied (table 12).In comparison with other developed countries,
Australia managed to weather the global eco-nomic crisis relatively well, maintaining positivealthough very low growth in its 19th year ofeconomic expansion. The Australian perform-ance in turn supported Pacific island economiesthrough an early recovery of tourism. Australia’spositive performance is attributable to the signifi-cant easing of monetary policy and fiscal expan-sion as well as the the healthy state of thefinancial sector. Export demand for resourcesfrom its major trading partners in Asia remainedrelatively strong with the result that Australian
TABLE 12. Rate of economic growth and inflation in countries in Oceania,2008 to 2010
Real GDP growth Inflationa
2008 2009b 2010c 2008 2009b 2010c
Oceaniad,e 2.0 1.0 2.3 4.4 1.9 2.5
Australia 2.3 1.2 2.4 4.4 1.8 2.5Cook Islands –1.2 –0.1 0.8 7.8 6.5 6.3Fiji –0.1 –2.5 1.9 7.7 3.7 3.4Kiribati 3.4 1.5 0.8 18.6 6.6 5.9Marshall Islands (the) –2.0 0.5 0.5 17.5 9.6 5.9Micronesia (Federated States of) –1.0 0.5 0.5 6.8 2.9 7.4Nauru 1.0 1.0 2.0 4.5 1.8 2.3New Zealand –0.5 –0.5 1.8 4.0 2.1 2.0Palau –1.0 –3.0 –1.0 12.0 5.2 6.7Papua New Guinea 6.7 4.5 8.5 10.6 6.9 7.1Samoa –4.9 –0.8 0.5 11.5 6.1 6.9Solomon Islands 6.9 0.4 2.4 17.2 8.0 7.0Tonga 1.2 0.4 0.4 10.4 1.6 1.9Tuvalu 1.5 1.0 1.6 5.3 3.8 3.5Vanuatu 6.6 3.0 4.6 4.8 4.5 5.0
Notes: a Refer to percentage changes in the consumer price index. b Estimates. c Forecasts (as of 15 April 2010).d Calculations are based on GDP figures at market prices in United States dollars in 2007 (at 2000 prices) used as weightsto calculate the subregional growth rates. e 2009 estimates and 2010 forecasts are available for selected economies.Sources: ESCAP calculations based on data from IMF, 2009 Article IV Consultations, available from www.imf.org/external/siteindex.htm (accessed 26 Feb. 2010); ADB, Asian Development Outlook 2009 Update: Broadening Openness for aResilient Asia (Manila: ADB, 2009), available from www.adb.org/Documents/Books/ADO/2009/Update/ado2009-update.pdf(accessed 30 Nov. 2009); and Pacific Economic Monitor, Issue 4, Feb. 2010, available from www.adb.org/Documents/Reports/PacMonitor/pem-issue04.asp (accessed 2 Mar. 2010); national sources (for Fiji and Samoa); IMF, InternationalFinancial Statistics (IFS) Online Service, available from www.imfstatistics.org/imf/ (accessed 26 Feb. 2010); Republic of Fiji,Economic and Fiscal update: Supplement to the 2010 Budget Address (Ministry of Finance, Nov. 2009), available fromwww.mfnp.gov.fj/Documents/2010_Budget_Supplement.pdf (accessed 2 Mar. 2010); CEIC Data Company Ltd., available fromhttp://ceicdata.com/ (for Australia and New Zealand); and ESCAP estimates.
(Percentages)
ECONOMIC AND SOCIAL SURVEY OF ASIA AND THE PACIFIC 2010
80
exports remained unchanged in volume termsdespite the sharp contraction of global trade.72
Domestic demand was buoyed by growth inpublic consumption and moderate growth in pri-vate consumption, offsetting the decline of fixedinvestment in the first half of 2009. Householdconsumption regained strength, helped by Gov-ernment transfer payments as part of the stimu-lus package, and lower interest rates that re-duced the burden of mortgages. As housing andequity prices strengthened, the increase inhousehold wealth further encouraged privateconsumption.
The New Zealand performance was more dis-mal. The country experienced five consecutivequarters of contraction with marked deteriorationin business investment and subdued wagegrowth, combined with marked reduction inworking hours, resulting in a sharp decline inhousehold earnings growth. The sharp fall inimports since the beginning of 2009 exceededexport declines, resulting in trade surplus for thefirst two quarters in 2009. Nevertheless, by thesecond quarter of 2009, the acute phase of thecrisis appeared over as business and consumersentiments started to improve. Other contribut-ing factors were positive disposable incomegrowth following a tax cut in April 2009, mod-eration of oil prices, a housing-market recoverysupported by lower interest rates, and a long-term demand for housing in response to migra-tion inflows.
Varied growth among commodity exporters
While the crisis affected all the Pacific islandeconomies, Papua New Guinea suffered lessthan others, mainly owing to its healthy foreignexchange reserves and domestic bank liquidityresulting from the commodity boom years. Par-allels can be drawn with other oil-exportingcountries of Central Asia and South-East Asia.Even though growth decelerated to a moremodest rate of 4.5% in 2009, Papua New Guin-
ea’s economy was supported by Governmentspending on infrastructure as well as lending tothe private sector, which rose by 41% in 2008and 21.3% in 2009. The resulting increase inbudget deficit was financed by trust funds theGovernment had accumulated during the com-modity boom. Further support came from gold,which has remained at a record high in reactionto economic uncertainty. Another positive out-come of the commodity boom has been thegains in formal employment in recent years:8.4% growth from March 2007 to March 2008and 3.8% to June 2009.
72 Reserve Bank of Australia, Statement of Monetary Policy (Sydney: RBA, 6 November 2009), available fromwww.rba.gov.au/publications/smp/2009/nov/html/index.html.
73 IMF, World Economic and Financial Surveys: World Economic Outlook Database, October 2009 ed. (Washington,D.C.); available from http://www.imf.org/external/pubs/ft/weo/2009/02/weodata/index.aspx.
While the crisis affected all the Pacificisland economies, Papua New Guinea
suffered less than others
After enjoying strong growth over the past threeyears and reaching a peak of 10.7% in 2007,economic growth in the Solomon Islands islikely to decelerate to 0.4%73 in 2009. Logexports accounting for 60% of exports, the maincontributor to recent economic growth, plungedby about 40% in the first half of 2009 asdemand from China collapsed. More worrisomeis the estimate that logging at pre-2009 rateswas five times the sustainable rate, with theresult that exports could continue to declinefrom 2010 onwards and would virtually cease by2014. The economy is also suffering from avisible slowdown in tourism, its second impor-tant contributor to strong economic growth inrecent years.
In Nauru, strong growth in phosphate exports inboth volume and prices was offset by the clo-sure of an Australian refugee-processing centrein February 2008 which had been an importantsource of employment. GDP growth of 1% wasachieved in 2008. In 2009, a sharp decline in
CRISIS AND REBOUND AT THE SUBREGIONAL LEVEL CHAPTER 2
81
prices for phosphate and physical damage to itsport halted sales of phosphate from Nauru toAustralia. In 2010 the economy is expected toexpand by 2%.
Hit hard: tourism- and remittance-dependenteconomies
In 2009, a combination of severe flooding at thebeginning of the year, declining tourism arrivalsand reduced earnings from sugar exports re-sulted in a contraction in economic growth of2.5% in Fiji. The decline in the European Union(EU) preferential price for sugar and the con-tinuing poor performance of the sugar mills,despite extensive refurbishment exacerbated thesituation further. Under the terms of the new EUsugar policy agreed with the WTO, the EUsugar price declined by 36% over the past 3years to October 2009. While it is true that theEU sugar price is still higher than the worldmarket price, which is already at historicalhighs, those price changes contributed to thesizeable reduction of export earnings. The 20%devaluation of the Fijian dollar in April 2009partly offset the decline in the EU sugar price,while the adoption of the new Cane QualityPayment system to replace payment on tonnageis expected to result in quality improvements.
The economy of Palau contracted by 1%, dueto a 10.1% fall in tourist arrivals in 2008. Theclosure of a charter-flight operator from TaiwanProvince of China, and the declining number ofvisitors from crisis-struck countries, notably Ja-pan and the Republic of Korea, saw touristarrivals contract by 11.3% in 2009, while GDPis expected to have contracted by 3%.
In contrast, Vanuatu grew at 3% in 2009 andhas become one of the few countries that re-sisted the global economic downturn with stronggrowth in tourism. The services sector contrib-uted approximately 77% of total GDP in 200774
and is estimated to have grown by 6.6% in2008. This is partly attributable to the reform ofits international air transport sector and more
recently its telecommunications sector, which in-creased both fly-in tourists and visits by cruiseliners. It is also believed that visitors to Vanuatuincreased owing to security worries emanatingfrom political conflict in other Pacific islandcountries.
74 ADB, Key Indicators for Asia and the Pacific 2009 (Manila, 2009), available from www.adb.org/Documents/Books/Key_Indicators/2009/default.asp (accessed 29 Sept. 2009).
75 IMF, World Economic Outlook Database, October 2009 ed.
Vanuatu weathered the globaleconomic downturn thanks to
strong growth in tourism
Samoa and Tonga, the countries that rely mostheavily on remittances among Pacific islandcountries (table 15), were struck by a devastat-ing tsunami in September 2009 that decimatedtheir income-earning capabilities.
While the real GDP of Samoa improved to-0.8% in 2009 after a 4.9% contraction in2008,75 recovery of production will take muchlonger. Losses by the tsunami are estimated ataround 20% of 2008 GDP. Reconstruction costsmay rise to $154 million. Substantial aid will beneeded for rehabilitation of the economic sec-tors and villages. Samoa was also affected byjob losses due to the ongoing restructuring ofthe operation of a firm which assembles wireharnesses for automobile plants in Australia.About one third of workers of the firm werereported to have been laid off.
In Tonga, the economy grew at 0.4% in 2009,still struggling to recover from the sharp fall incommerce and tourism in 2006 as well as thetsunami which caused extensive damage andwiped out two remote villages. The difficulty inreaching those villages will make their rehabilita-tion very difficult, even though the reconstructionof Nuku’alofa is expected to stimulate theeconomy, with loans from China, Australia andNew Zealand amounting to about 120 millionpa’anga.
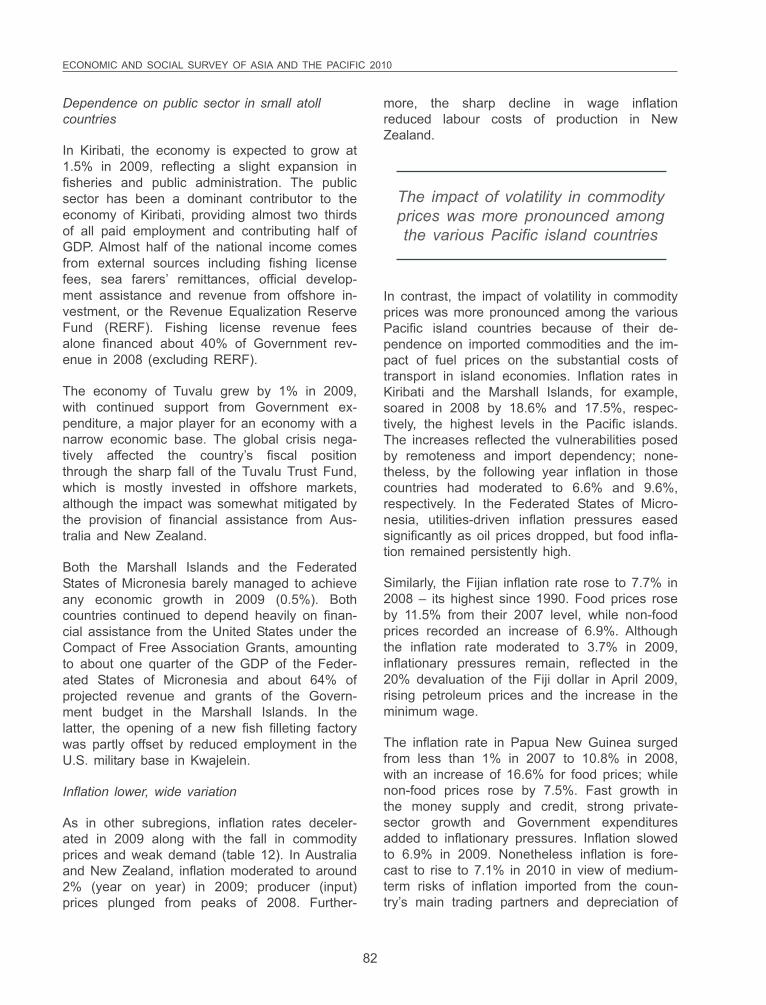
ECONOMIC AND SOCIAL SURVEY OF ASIA AND THE PACIFIC 2010
82
Dependence on public sector in small atollcountries
In Kiribati, the economy is expected to grow at1.5% in 2009, reflecting a slight expansion infisheries and public administration. The publicsector has been a dominant contributor to theeconomy of Kiribati, providing almost two thirdsof all paid employment and contributing half ofGDP. Almost half of the national income comesfrom external sources including fishing licensefees, sea farers’ remittances, official develop-ment assistance and revenue from offshore in-vestment, or the Revenue Equalization ReserveFund (RERF). Fishing license revenue feesalone financed about 40% of Government rev-enue in 2008 (excluding RERF).
The economy of Tuvalu grew by 1% in 2009,with continued support from Government ex-penditure, a major player for an economy with anarrow economic base. The global crisis nega-tively affected the country’s fiscal positionthrough the sharp fall of the Tuvalu Trust Fund,which is mostly invested in offshore markets,although the impact was somewhat mitigated bythe provision of financial assistance from Aus-tralia and New Zealand.
Both the Marshall Islands and the FederatedStates of Micronesia barely managed to achieveany economic growth in 2009 (0.5%). Bothcountries continued to depend heavily on finan-cial assistance from the United States under theCompact of Free Association Grants, amountingto about one quarter of the GDP of the Feder-ated States of Micronesia and about 64% ofprojected revenue and grants of the Govern-ment budget in the Marshall Islands. In thelatter, the opening of a new fish filleting factorywas partly offset by reduced employment in theU.S. military base in Kwajelein.
Inflation lower, wide variation
As in other subregions, inflation rates deceler-ated in 2009 along with the fall in commodityprices and weak demand (table 12). In Australiaand New Zealand, inflation moderated to around2% (year on year) in 2009; producer (input)prices plunged from peaks of 2008. Further-
more, the sharp decline in wage inflationreduced labour costs of production in NewZealand.
The impact of volatility in commodityprices was more pronounced amongthe various Pacific island countries
In contrast, the impact of volatility in commodityprices was more pronounced among the variousPacific island countries because of their de-pendence on imported commodities and the im-pact of fuel prices on the substantial costs oftransport in island economies. Inflation rates inKiribati and the Marshall Islands, for example,soared in 2008 by 18.6% and 17.5%, respec-tively, the highest levels in the Pacific islands.The increases reflected the vulnerabilities posedby remoteness and import dependency; none-theless, by the following year inflation in thosecountries had moderated to 6.6% and 9.6%,respectively. In the Federated States of Micro-nesia, utilities-driven inflation pressures easedsignificantly as oil prices dropped, but food infla-tion remained persistently high.
Similarly, the Fijian inflation rate rose to 7.7% in2008 – its highest since 1990. Food prices roseby 11.5% from their 2007 level, while non-foodprices recorded an increase of 6.9%. Althoughthe inflation rate moderated to 3.7% in 2009,inflationary pressures remain, reflected in the20% devaluation of the Fiji dollar in April 2009,rising petroleum prices and the increase in theminimum wage.
The inflation rate in Papua New Guinea surgedfrom less than 1% in 2007 to 10.8% in 2008,with an increase of 16.6% for food prices; whilenon-food prices rose by 7.5%. Fast growth inthe money supply and credit, strong private-sector growth and Government expendituresadded to inflationary pressures. Inflation slowedto 6.9% in 2009. Nonetheless inflation is fore-cast to rise to 7.1% in 2010 in view of medium-term risks of inflation imported from the coun-try’s main trading partners and depreciation of
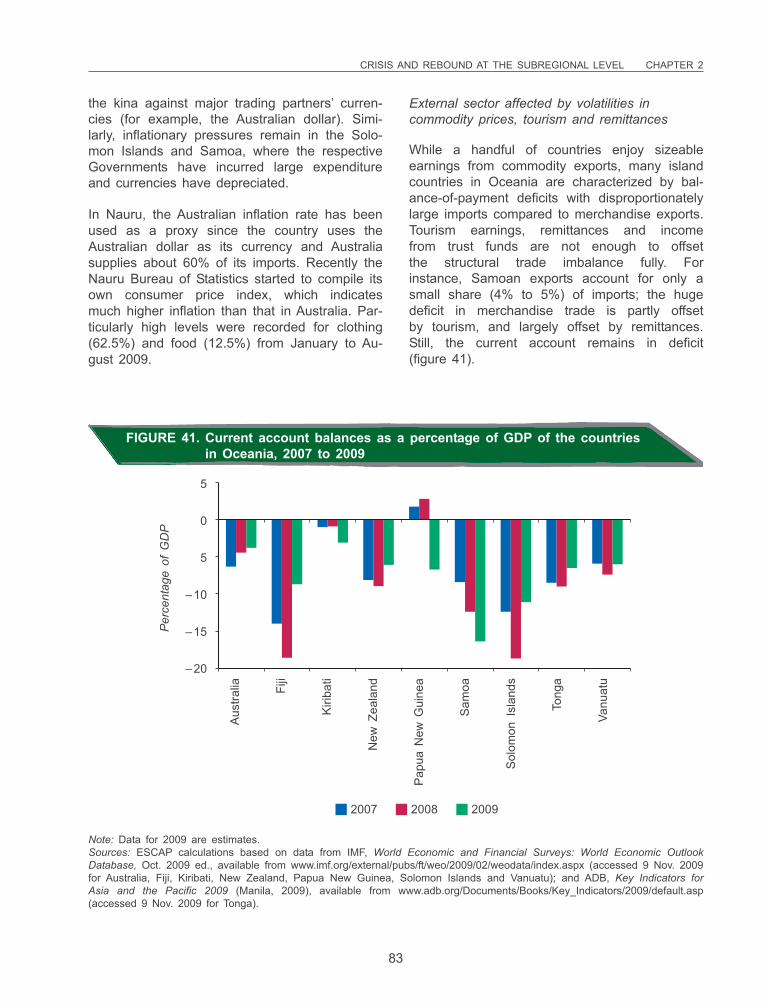
CRISIS AND REBOUND AT THE SUBREGIONAL LEVEL CHAPTER 2
83
5
0
5
–10
–15
–20
Per
cent
age
of G
DP
2007 2008 2009
Aus
tralia Fi
ji
Kiri
bati
New
Zea
land
Pap
ua N
ew G
uine
a
Sam
oa
Sol
omon
Isl
ands
Tong
a
Vanu
atu
FIGURE 41. Current account balances as a percentage of GDP of the countriesin Oceania, 2007 to 2009
Note: Data for 2009 are estimates.Sources: ESCAP calculations based on data from IMF, World Economic and Financial Surveys: World Economic OutlookDatabase, Oct. 2009 ed., available from www.imf.org/external/pubs/ft/weo/2009/02/weodata/index.aspx (accessed 9 Nov. 2009for Australia, Fiji, Kiribati, New Zealand, Papua New Guinea, Solomon Islands and Vanuatu); and ADB, Key Indicators forAsia and the Pacific 2009 (Manila, 2009), available from www.adb.org/Documents/Books/Key_Indicators/2009/default.asp(accessed 9 Nov. 2009 for Tonga).
the kina against major trading partners’ curren-cies (for example, the Australian dollar). Simi-larly, inflationary pressures remain in the Solo-mon Islands and Samoa, where the respectiveGovernments have incurred large expenditureand currencies have depreciated.
In Nauru, the Australian inflation rate has beenused as a proxy since the country uses theAustralian dollar as its currency and Australiasupplies about 60% of its imports. Recently theNauru Bureau of Statistics started to compile itsown consumer price index, which indicatesmuch higher inflation than that in Australia. Par-ticularly high levels were recorded for clothing(62.5%) and food (12.5%) from January to Au-gust 2009.
External sector affected by volatilities incommodity prices, tourism and remittances
While a handful of countries enjoy sizeableearnings from commodity exports, many islandcountries in Oceania are characterized by bal-ance-of-payment deficits with disproportionatelylarge imports compared to merchandise exports.Tourism earnings, remittances and incomefrom trust funds are not enough to offsetthe structural trade imbalance fully. Forinstance, Samoan exports account for only asmall share (4% to 5%) of imports; the hugedeficit in merchandise trade is partly offsetby tourism, and largely offset by remittances.Still, the current account remains in deficit(figure 41).
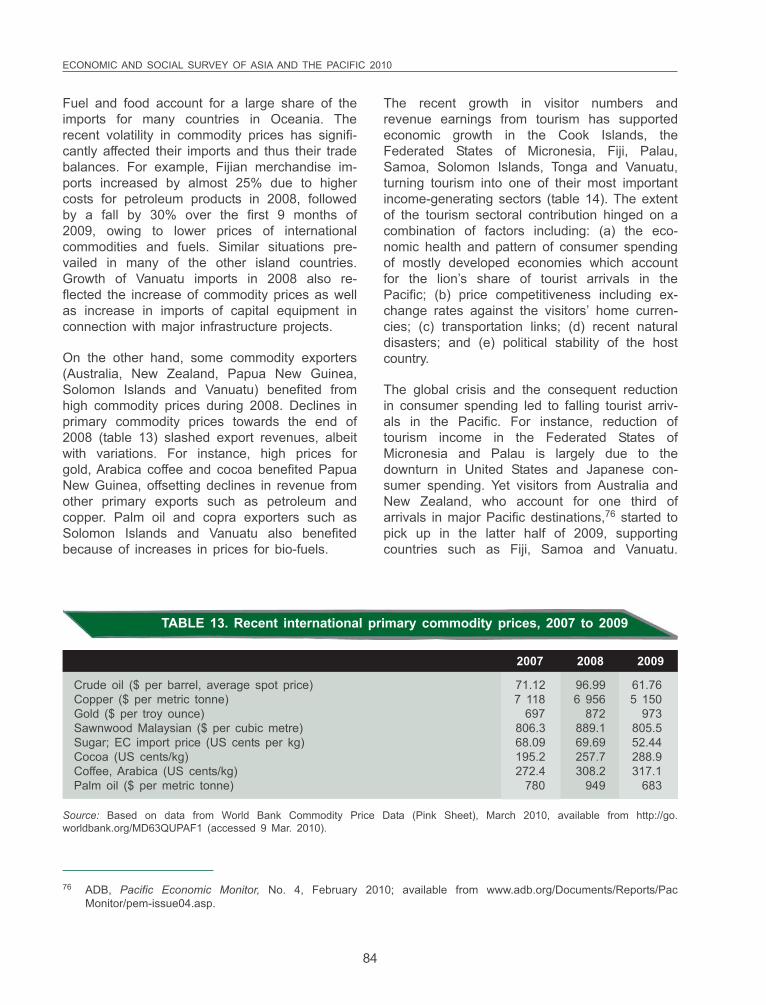
ECONOMIC AND SOCIAL SURVEY OF ASIA AND THE PACIFIC 2010
84
Fuel and food account for a large share of theimports for many countries in Oceania. Therecent volatility in commodity prices has signifi-cantly affected their imports and thus their tradebalances. For example, Fijian merchandise im-ports increased by almost 25% due to highercosts for petroleum products in 2008, followedby a fall by 30% over the first 9 months of2009, owing to lower prices of internationalcommodities and fuels. Similar situations pre-vailed in many of the other island countries.Growth of Vanuatu imports in 2008 also re-flected the increase of commodity prices as wellas increase in imports of capital equipment inconnection with major infrastructure projects.
On the other hand, some commodity exporters(Australia, New Zealand, Papua New Guinea,Solomon Islands and Vanuatu) benefited fromhigh commodity prices during 2008. Declines inprimary commodity prices towards the end of2008 (table 13) slashed export revenues, albeitwith variations. For instance, high prices forgold, Arabica coffee and cocoa benefited PapuaNew Guinea, offsetting declines in revenue fromother primary exports such as petroleum andcopper. Palm oil and copra exporters such asSolomon Islands and Vanuatu also benefitedbecause of increases in prices for bio-fuels.
The recent growth in visitor numbers andrevenue earnings from tourism has supportedeconomic growth in the Cook Islands, theFederated States of Micronesia, Fiji, Palau,Samoa, Solomon Islands, Tonga and Vanuatu,turning tourism into one of their most importantincome-generating sectors (table 14). The extentof the tourism sectoral contribution hinged on acombination of factors including: (a) the eco-nomic health and pattern of consumer spendingof mostly developed economies which accountfor the lion’s share of tourist arrivals in thePacific; (b) price competitiveness including ex-change rates against the visitors’ home curren-cies; (c) transportation links; (d) recent naturaldisasters; and (e) political stability of the hostcountry.
The global crisis and the consequent reductionin consumer spending led to falling tourist arriv-als in the Pacific. For instance, reduction oftourism income in the Federated States ofMicronesia and Palau is largely due to thedownturn in United States and Japanese con-sumer spending. Yet visitors from Australia andNew Zealand, who account for one third ofarrivals in major Pacific destinations,76 started topick up in the latter half of 2009, supportingcountries such as Fiji, Samoa and Vanuatu.
TABLE 13. Recent international primary commodity prices, 2007 to 2009
2007 2008 2009
Crude oil ($ per barrel, average spot price) 71.12 96.99 61.76Copper ($ per metric tonne) 7 118 6 956 5 150Gold ($ per troy ounce) 697 872 973Sawnwood Malaysian ($ per cubic metre) 806.3 889.1 805.5Sugar; EC import price (US cents per kg) 68.09 69.69 52.44Cocoa (US cents/kg) 195.2 257.7 288.9Coffee, Arabica (US cents/kg) 272.4 308.2 317.1Palm oil ($ per metric tonne) 780 949 683
Source: Based on data from World Bank Commodity Price Data (Pink Sheet), March 2010, available from http://go.worldbank.org/MD63QUPAF1 (accessed 9 Mar. 2010).
76 ADB, Pacific Economic Monitor, No. 4, February 2010; available from www.adb.org/Documents/Reports/PacMonitor/pem-issue04.asp.
CRISIS AND REBOUND AT THE SUBREGIONAL LEVEL CHAPTER 2
85
Australia is also the main source of visitors forPapua New Guinea, Kiribati and Solomon is-lands although the extent of the contribution oftourism to the economy is still limited.
Exchange rate movements have also had adifferentiated impact on the tourism in the Pa-cific subregion. For instance, the 25% decline intourist arrivals in Fiji at the start of 2009 wasmainly due to a sharp appreciation of the Fijiandollar against the Australian dollar (14%) be-tween June 2008 and the first quarter of 2009.A 20% devaluation of the Fijian dollar in April2009 led to a rebound in tourist arrivals. Thehigher tourist arrivals in Samoa during the firstseven months of 2009 likely reflect the depre-ciation of the Samoan Tala relative to the Aus-tralian and New Zealand dollars in the first halfof 2009.
Restructuring of the Pacific airline industry andincreased connections to major tourist sourcecountries, accompanied by competitive airfares,have encouraged tourism in Samoa andVanuatu in recent years. Papua New Guineaalso followed suit by partly opening up its inter-national airline services. The closure of a char-ter-flight operator from Taiwan Province of
China to Palau led, however, to a significantreduction in visitors from the second largestsource of visitors to Palau.
Similar to tourism, in recent years remittanceshave become a major source of income inPacific island countries (table 15) with Australia,New Zealand and the United States absorbingthe largest share of workers. For Tuvalu andKiribati, remittances depend heavily on seafar-ers’ employment in merchant shipping; thesharp downturn in global trade flows in the firstquarter of 2009 have adversely affected them.Although the Australian economy was less badlyaffected, higher unemployment may have de-pressed prospects for new migrant workers.
Samoa and Tonga, with GDP ratios of remit-tance inflows of 25.8 and 37.7% in 2008, re-spectively, are particularly exposed. The NationalReserve Bank of Tonga estimates that remit-tances fell by 14% and tourist receipts by 5.9%in the year to June 2009. Tuvalu, Kiribati and Fijiare relatively less reliant on remittances. Sa-moan remittances continued to grow in the firsthalf of 2009 and expected to continue further,with a considerable increase in funds sent hometo families in the aftermath of the tsunami.
TABLE 14. Total visitor arrivals in selected Pacific island economies, inthousands of people, 2004 to 2009
2004 2005 2006 2007 2008 2009
Fiji 504.1 545.2 548.6 539.9 585.0 140.1a
Papua New Guinea 58.0 68.0 77.7 104.1 120.1Samoa 98.2 101.8 115.9 122.3 121.5 71.1b
Solomon Islands 5.6 9.4 11.5 15.2 22.0 4.4c
Tonga 51.9 53.3 52.8 67.1 61.5 30.6d,e
Vanuatu 98.5 125.6 154.1 167.1 196.7 65.6c
Notes: Includes day visitors.a January-April b January-Julyc January-March d Estimatee January-JuneSources: Based on data from Samoa Ministry of Finance, Quarterly Economic Review, Issue No 45: Apr-Jun 2009, October2009, available from www.mof.gov.ws/uploads/quarterly_economic_review_iss_45.pdf; Fiji Island Bureau of Statistics, accessi-ble from www.statsfiji.gov.fj/, and visitors arrivals, accessible from www.statsfiji.gov.fj/Tourism/Visitor_Arrivals.htm; Papua NewGuinea National Statistics Office, available from www.nso.gov.pg/, and visitors arrival (up to 2005) www.nso.gov.pg/Tourism/tourism.htm; Solomon Island Statistic office, accessible from www.spc.int/prism/Country/SB/Stats/; migration and tourism,available from www.spc.int/prism/Country/SB/Stats/Migration%20and%20Tourism/Tour-Index.htm; Tonga Department of Statis-tics, available from www.spc.int/prism/Country/TO/stats/; and Vanuatu National Statistics Office, tourism statistics, availablefrom www.spc.int/prism/country/vu/stats/TOURISM/tourism-index.htm.
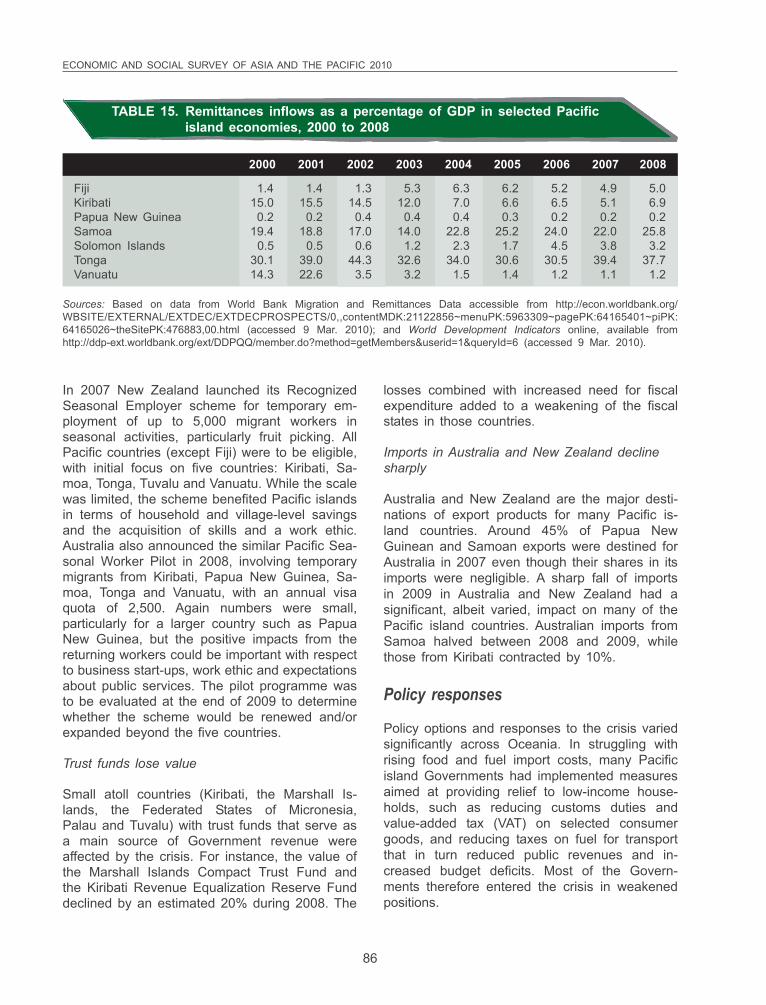
ECONOMIC AND SOCIAL SURVEY OF ASIA AND THE PACIFIC 2010
86
In 2007 New Zealand launched its RecognizedSeasonal Employer scheme for temporary em-ployment of up to 5,000 migrant workers inseasonal activities, particularly fruit picking. AllPacific countries (except Fiji) were to be eligible,with initial focus on five countries: Kiribati, Sa-moa, Tonga, Tuvalu and Vanuatu. While the scalewas limited, the scheme benefited Pacific islandsin terms of household and village-level savingsand the acquisition of skills and a work ethic.Australia also announced the similar Pacific Sea-sonal Worker Pilot in 2008, involving temporarymigrants from Kiribati, Papua New Guinea, Sa-moa, Tonga and Vanuatu, with an annual visaquota of 2,500. Again numbers were small,particularly for a larger country such as PapuaNew Guinea, but the positive impacts from thereturning workers could be important with respectto business start-ups, work ethic and expectationsabout public services. The pilot programme wasto be evaluated at the end of 2009 to determinewhether the scheme would be renewed and/orexpanded beyond the five countries.
Trust funds lose value
Small atoll countries (Kiribati, the Marshall Is-lands, the Federated States of Micronesia,Palau and Tuvalu) with trust funds that serve asa main source of Government revenue wereaffected by the crisis. For instance, the value ofthe Marshall Islands Compact Trust Fund andthe Kiribati Revenue Equalization Reserve Funddeclined by an estimated 20% during 2008. The
losses combined with increased need for fiscalexpenditure added to a weakening of the fiscalstates in those countries.
Imports in Australia and New Zealand declinesharply
Australia and New Zealand are the major desti-nations of export products for many Pacific is-land countries. Around 45% of Papua NewGuinean and Samoan exports were destined forAustralia in 2007 even though their shares in itsimports were negligible. A sharp fall of importsin 2009 in Australia and New Zealand had asignificant, albeit varied, impact on many of thePacific island countries. Australian imports fromSamoa halved between 2008 and 2009, whilethose from Kiribati contracted by 10%.
Policy responses
Policy options and responses to the crisis variedsignificantly across Oceania. In struggling withrising food and fuel import costs, many Pacificisland Governments had implemented measuresaimed at providing relief to low-income house-holds, such as reducing customs duties andvalue-added tax (VAT) on selected consumergoods, and reducing taxes on fuel for transportthat in turn reduced public revenues and in-creased budget deficits. Most of the Govern-ments therefore entered the crisis in weakenedpositions.
TABLE 15. Remittances inflows as a percentage of GDP in selected Pacificisland economies, 2000 to 2008
2000 2001 2002 2003 2004 2005 2006 2007 2008
Fiji 1.4 1.4 1.3 5.3 6.3 6.2 5.2 4.9 5.0Kiribati 15.0 15.5 14.5 12.0 7.0 6.6 6.5 5.1 6.9Papua New Guinea 0.2 0.2 0.4 0.4 0.4 0.3 0.2 0.2 0.2Samoa 19.4 18.8 17.0 14.0 22.8 25.2 24.0 22.0 25.8Solomon Islands 0.5 0.5 0.6 1.2 2.3 1.7 4.5 3.8 3.2Tonga 30.1 39.0 44.3 32.6 34.0 30.6 30.5 39.4 37.7Vanuatu 14.3 22.6 3.5 3.2 1.5 1.4 1.2 1.1 1.2
Sources: Based on data from World Bank Migration and Remittances Data accessible from http://econ.worldbank.org/WBSITE/EXTERNAL/EXTDEC/EXTDECPROSPECTS/0,,contentMDK:21122856~menuPK:5963309~pagePK:64165401~piPK:64165026~theSitePK:476883,00.html (accessed 9 Mar. 2010); and World Development Indicators online, available fromhttp://ddp-ext.worldbank.org/ext/DDPQQ/member.do?method=getMembers&userid=1&queryId=6 (accessed 9 Mar. 2010).
CRISIS AND REBOUND AT THE SUBREGIONAL LEVEL CHAPTER 2
87
In contrast, the developed economies of Aus-tralia and New Zealand had room for largefiscal stimulus packages. Having enjoyed fiscalsurpluses in the recent past, their fiscal posi-tions were much better than those of manyOECD countries. That in turn brought benefitsto Pacific island economies as deep recessionwas pre-empted in their key trading and eco-nomic partners. Australia launched a large fiscalstimulus package that included a $21 billioncash handout to households and public invest-ments in school buildings and public housing.Similarly, in New Zealand a large fiscal stimuluspackage brought a decade-long record of fiscalsurplus to an end in 2009: tax revenues fellbecause of falling corporate profits as well aspersonal income tax cuts, while expendituresjumped because of fiscal stimulus and in-creases in payment of unemployment benefits.
most vulnerable population groups; and (d)competitive devaluations in countries that hadtheir own currencies (Fiji, Papua New Guinea,Samoa, Solomon Islands, Tonga and Vanuatu).Pacific island economies were in unique situa-tions, especially as regards the policy space toadopt any of the above options, either alone orin combination as crisis-mitigating packages.Complexities arose that consequently are uniqueas well.
Some countries employed fiscal stimulus toboost aggregate demand. For example, Samoaprepared for sharp increases in fiscal deficits inFY2008/09 and FY2009/10 with increases incapital expenditure, a stimulus package focusedon infrastructure, relying on Asian DevelopmentBank concessional lending and donor grants.However, as the need for financial resources forpost-tsunami rehabilitation increased, prioritieschanged rapidly.
The ability to finance a fiscal stimulus dependson a country’s capacity to borrow, which in turndepends on the size of the existing public debtand its creditworthiness. Pacific island Govern-ments, apart from Papua New Guinea andVanuatu, are not in a very good position toborrow; hence their need to rely heavily onconcessional lending from international develop-ment agencies and donor grants. Vanuatu hadpaid down its public debt through the period ofstrong economic growth and managed to be inbudget balance in 2009. Fiji, by contrast, in-creased its budget deficit from a target level of2% to 3%. Fiji had been trying to create roomfor more infrastructural spending by reducingthe size of its public service. However, thereduction of revenue in the first half of 2009had led to a cutback in expenditure. TheGovernment’s ability to finance a stimuluspackage was limited because of the constraintson its ability to borrow and to access donorgrant monies. Tonga was also in a poor positionto fund a stimulus package, although to someextent its rehabilitation of the commercialarea of Niku’alofa, which is funded byconcessional loans from China and donorfunding, has functioned as an infrastructuralstimulus package.
Australia and New Zealand had roomfor large fiscal stimulus packages
Australia and New Zealand also responded tothe economic downturn by easing monetarypolicy. The Reserve Bank of New Zealand dras-tically cut the official cash rate from the peak of8.25% in June 2008 to 2.5% by April 2009.Similarly, the Reserve Bank of Australia (RBA)cut the cash rate from 7.25% in March 2008 to3% by April 2009. However, as economic con-traction started to recede, the RBA turned tomonetary tightening in October to pre-empt ex-cessive inflation, in the first example of mon-etary tightening among developed economies.
Unique developments and constraints
Following policy responses in the rest of theworld, Pacific island Governments had four op-tions for tackling the effects of the global crisisand its myriad ramifications, although not all ofthem were available for some countries: (a)fiscal stimulus to boost domestic demand; (b)monetary expansion to boost aggregate domes-tic demand as a substitute for the reduction inexternal demand; (c) targeted assistance to the
ECONOMIC AND SOCIAL SURVEY OF ASIA AND THE PACIFIC 2010
88
As for the second policy option, several deve-loping States in Oceania effectively do not havean independent monetary or exchange-ratepolicy, since they use the United States dollar(Palau, the Marshall Islands and the FederatedStates of Micronesia) or Australian dollar(Kiribati, Nauru and Tuvalu) as legal tender. Incountries with their own currencies, some formof monetary policy action was taken to boostaggregate demand (except Papua New Guinea).Money markets are underdeveloped, however,so demand for credit is not very responsive tochanges in interest rates. Consequently, centralbanks in the Pacific do not emphasize interestrates as a monetary policy instrument. Expan-sion of the money supply is used instead as themajor instrument in, for example, Fiji, Samoa,the Solomon Islands and Vanuatu. Commercialbanks are also encouraged to lend, as was thecase with Fiji and Solomon Islands. Effective-ness of the latter instrument is limited, inas-much as few profitable investment opportunitiesare on offer. Tonga in particular has not beenable to engage in credit expansion, as it hasbeen trying to bring under control a credit “bub-ble” that developed over recent years throughrapid expansion of the money supply.
Oceania – particularly the exchange rate of theAustralian and New Zealand currencies againstthe United States dollar. Their depreciation inthe latter half of 2008 led to a loss in pricecompetitiveness for some Pacific countries,even though it alleviated pressure on importbills.
Devaluation of Fiji in April 2009 increased com-petitiveness and helped to offset the decline inthe EU price paid for its sugar exports, while itincreased the value of remittances in domesticcurrency and foreign reserves as well. Devalua-tion, however, increases the cost of imports inlocal currency terms and it stimulates inflation,as well as the local currency size of the exter-nal debt, and debt servicing costs. Consequentlyany increase in budget expenditure is eventuallysqueezed out.
Outlook and policy challenges
In 2010 economic growth of 2.4% and 1.8% isanticipated in Australia and New Zealand, re-spectively, that will in turn improve the growthprospects of many Pacific island economiesthrough greater tourism receipts and remittanceearnings. Strong growth is also expected inPapua New Guinea from rising commodityprices and growth in domestic demand. Alto-gether the economies of the Oceania region areexpected to grow by 2.3% in 2010, up from1.0% in 2009.
Risks nonetheless hover in the near term: risingcommodity prices put upward pressure on infla-tion, while rising import bills run down foreignexchange reserves. Any slippage in the globaleconomy would hit the region hard. Hence,considering the risks in tandem with thevulnerabilities unique to this subregion, not theleast of which are the increasingly frequent,severe natural disasters, forecasting remains ahighly inexact enterprise.
Looking beyond 2010, developments in informa-tion and communication technology are generat-ing new sources of economic growth that willhelp bridge the geographical isolation that hasfor so long kept Oceania apart from the rest ofAsia and the Pacific (Box 4).
Pacific island Governments hadlimited options for tackling the
effects of the global crisis
As far as targeted assistance for the vulnerableis concerned, Fiji provided relief through re-moval of customs duties and VAT on key con-sumer goods while the income tax thresholdwas increased. Subsidies were provided to busoperators while bus fares for school childrenwere paid by the Government. Tonga removedimport duties on some food items and on fuelfor domestic shipping and air transport. PapuaNew Guinea also reduced the tax on petroleumto provide relief from higher fuel prices.
Movements in exchange rates have played animportant, though not well-recognized role in theperformance of the developing States in
CRISIS AND REBOUND AT THE SUBREGIONAL LEVEL CHAPTER 2
89
SOUTH AND SOUTH-WEST ASIA
The global crisis affected South and South-WestAsia less than other subregions. GDP growthremained generally positive although exportsdeclined substantially and capital inflows werereduced (table 16). The national economies de-pend much more on domestic than on externaldemand. They rely for employment mostly onagriculture which has held up well overall andthus dampened the worst of the crisis fallout.
Of greater concern is the sharp increase in foodand fuel prices in 2008 which created numeroushardships for the peoples of the subregion. Asinflation impacts the poor disproportionately, it isa serious problem for countries with a highincidence of poverty. Even though inflation rates
decelerated in 2009, food prices remained highand upward pressures are re-emerging.
Controlling inflation is and will remain the keymacroeconomic challenge for the subregion. An-other key challenge is the adverse impact ofsecurity problems ranging from internal conflictsto terrorist attacks linked with geopolitical ten-sions, all of which impinge on macroeconomicperformance and poverty reduction.
Impact of the crisis
Both the global crisis and deteriorating securitysituation in some countries saw economic growthcome under pressure in 2009, decelerating to2.9% as compared to 4.7% in 2008 (table 16).Barring Afghanistan, a country highly dependenton foreign aid, India achieved the highest growth
Pacific island economies have had basic international telecommunication connectivity since the 1970s. However, the Pacific hasrecorded the slowest growth in mobile telephone expansion in the Asian and Pacific region, with 4 users per 100 persons,compared to 39 per 100 for the Asian-Pacific region. Information and communication technology (ICT) penetration is concentratedmainly around major population centres, limited by the high costs of international and domestic bandwidth.
For small economies, cable was considered unaffordable. Only a few countries, namely Fiji, Guam, New Caledonia, Papua NewGuinea, and recently American Samoa and Samoa, have access to the global backbone through submarine fibre cables.
However, as investments are being undertaken to redeploy underused cable networks, more Pacific island developing economieswill get connections. Papua New Guinea, for example, has been using retired cables to redeploy part of the Pacific Rim Westcable to Port Moresby. Similar initiatives include the Pacific Rim East cable which runs from New Zealand to Hawaii and is usedto connect American Samoa and Samoa to the global telecommunications infrastructure networks. Another project is the SouthPacific Island Network, an eastbound submarine cable running from New Caledonia to French Polynesia and New Zealand, withlanding points in Vanuatu, Wallis, Samoa and American Samoa. With the completion of all the intra-regional ICT infrastructureinitiatives, Pacific countries will in future be able to capitalize on more available bandwidth.
For small islands where the cost of cable connectivity remains unjustifiable economically, satellite and wireless with their scalabilityand flexible rollout are providing additional choice. The University of the South Pacific, for example, has a satellite-based distancelearning network which connects its main campus in Suva, Fiji to extension centres in 12 Pacific island countries. In manybusiness and community centres, satellite services with low-cost, very-small-aperture terminals are being complemented bywireless mobile and internet services. T. Digicel South Pacific claims to be the fastest-growing mobile operator in the Pacific,expanding services in Samoa, Papua New Guinea, Tonga, Fiji and Vanuatu. Other islands connectivity is under way.
The Pacific can continue to expand connectivity in future by blending cable, satellite and wireless technologies. For this purpose itwill be important to foster cooperation among Pacific island developing economies to bring about synergies between cable andsatellite linkages. By harmonizing the mix of national policies, the subregional market can grow and enable telecommunicationservice providers to reach larger numbers of users through their investments. For that purpose the Pacific Plan includes a digitalstrategy for exploiting ICT for sustainable socio-economic development.
BOX 4. Connectivity in the Pacific
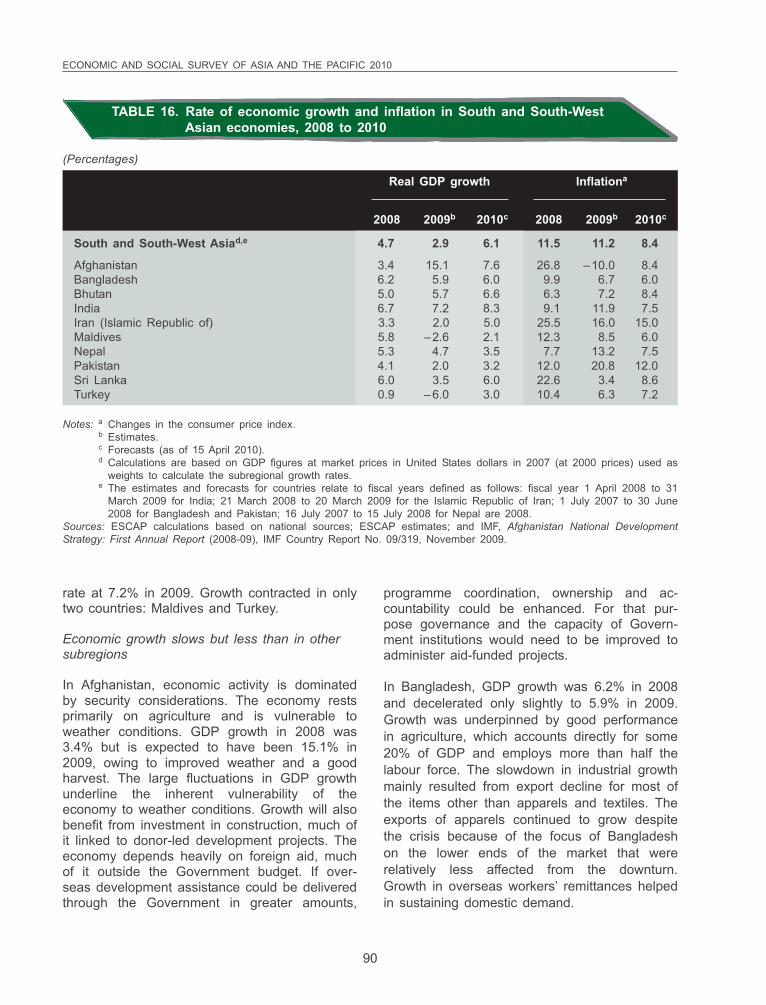
ECONOMIC AND SOCIAL SURVEY OF ASIA AND THE PACIFIC 2010
90
rate at 7.2% in 2009. Growth contracted in onlytwo countries: Maldives and Turkey.
Economic growth slows but less than in othersubregions
In Afghanistan, economic activity is dominatedby security considerations. The economy restsprimarily on agriculture and is vulnerable toweather conditions. GDP growth in 2008 was3.4% but is expected to have been 15.1% in2009, owing to improved weather and a goodharvest. The large fluctuations in GDP growthunderline the inherent vulnerability of theeconomy to weather conditions. Growth will alsobenefit from investment in construction, much ofit linked to donor-led development projects. Theeconomy depends heavily on foreign aid, muchof it outside the Government budget. If over-seas development assistance could be deliveredthrough the Government in greater amounts,
programme coordination, ownership and ac-countability could be enhanced. For that pur-pose governance and the capacity of Govern-ment institutions would need to be improved toadminister aid-funded projects.
In Bangladesh, GDP growth was 6.2% in 2008and decelerated only slightly to 5.9% in 2009.Growth was underpinned by good performancein agriculture, which accounts directly for some20% of GDP and employs more than half thelabour force. The slowdown in industrial growthmainly resulted from export decline for most ofthe items other than apparels and textiles. Theexports of apparels continued to grow despitethe crisis because of the focus of Bangladeshon the lower ends of the market that wererelatively less affected from the downturn.Growth in overseas workers’ remittances helpedin sustaining domestic demand.
TABLE 16. Rate of economic growth and inflation in South and South-WestAsian economies, 2008 to 2010
Real GDP growth Inflationa
2008 2009b 2010c 2008 2009b 2010c
South and South-West Asiad,e 4.7 2.9 6.1 11.5 11.2 8.4
Afghanistan 3.4 15.1 7.6 26.8 –10.0 8.4Bangladesh 6.2 5.9 6.0 9.9 6.7 6.0Bhutan 5.0 5.7 6.6 6.3 7.2 8.4India 6.7 7.2 8.3 9.1 11.9 7.5Iran (Islamic Republic of) 3.3 2.0 5.0 25.5 16.0 15.0Maldives 5.8 –2.6 2.1 12.3 8.5 6.0Nepal 5.3 4.7 3.5 7.7 13.2 7.5Pakistan 4.1 2.0 3.2 12.0 20.8 12.0Sri Lanka 6.0 3.5 6.0 22.6 3.4 8.6Turkey 0.9 –6.0 3.0 10.4 6.3 7.2
Notes: a Changes in the consumer price index.b Estimates.c Forecasts (as of 15 April 2010).d Calculations are based on GDP figures at market prices in United States dollars in 2007 (at 2000 prices) used as
weights to calculate the subregional growth rates.e The estimates and forecasts for countries relate to fiscal years defined as follows: fiscal year 1 April 2008 to 31
March 2009 for India; 21 March 2008 to 20 March 2009 for the Islamic Republic of Iran; 1 July 2007 to 30 June2008 for Bangladesh and Pakistan; 16 July 2007 to 15 July 2008 for Nepal are 2008.
Sources: ESCAP calculations based on national sources; ESCAP estimates; and IMF, Afghanistan National DevelopmentStrategy: First Annual Report (2008-09), IMF Country Report No. 09/319, November 2009.
(Percentages)
CRISIS AND REBOUND AT THE SUBREGIONAL LEVEL CHAPTER 2
91
GDP growth in Bhutan peaked at nearly 21.4%in 2007 with the completion of the Talahydropower project in 2007, but returned to amore normal level of 5.0% in 2008 and 5.7% in2009. In the coming years growth in theeconomy will be underpinned by three morehydropower projects.
oil prices and declining output, GDP growthplummeted from 3.3% in 2008 to 2.0% in 2009.That will impede the Government’s plans for anexpansionary fiscal policy, which in turn willaffect the rate of private consumption and in-vestment. The hydrocarbons industry will con-tinue to suffer from a lack of foreign investment,and as refining capacity remains underdevel-oped, despite petrol rationing, the country willrely increasingly on fuel imports. A drought inearly 2009 was expected to lead to a rise inimports of wheat and other agricultural produce.The new five-year development plan (2010 to2015) sets an ambitious 8% target for annualGDP growth that will not be easy to achieve.
Having grown by 7.2% in 2007 and 5.8% in2008, the economy of Maldives is expected tohave contracted by 2.6% in 2009, largely be-cause of a significant decline in tourist arrivals.In addition, problems with external financinghave held up capital projects for resort develop-ment and other major projects, causing a sharpdecline in construction.
Despite the recent political fragility in Nepal ontop of the global economic crisis, the macroeco-nomic situation remains broadly stable. GDPgrowth was 5.3% in 2008 and fell only slightlyin 2009 to 4.7%. Some of the fall reflectsadverse weather, since agricultural output, whichaccounts for around one third of GDP andwhich had grown by 4.7% in 2008, grew by only2.2% in 2009. The non-agricultural sector wasconstrained by severe electricity shortages anddifficult industrial relations and strikes that de-layed the movement of goods and preventedpeople from getting to work. In recent years theservices sector has, however, grown steadilyand accounts for around half of GDP.
In Pakistan, GDP growth fell from 4.1% in 2008to 2.0% in 2009. The economy has been af-fected not just by the global economic crisis butalso by the declining security situation and in-tensification of conflict linked to terrorism. Indus-try, especially large-scale manufacturing, suf-fered the worst of all sectors from the drop ininternational demand, while also having to copewith acute shortages of electricity. Improved per-formance of the service sector offset it to some
India achieved one of theworld’s highest growth rates
India felt the crisis after a period of high growthmomentum that had reached an annual averageof 8.8% over the previous five years. In 2008,growth was 7.7% during the first half of thefiscal year, but fell to 5.8% in the second half(October 2008 to March 2009). Even so, at6.7% India achieved one of the world’s highestgrowth rates in 2008. While the economylargely sustained the momentum of the previousfive years, both external and domestic demandwere affected by the crisis. There was aslowdown in the services sector, in domesticprivate consumption, in investment demand andin manufacturing output.
By the beginning of the third quarter of 2009,despite the uncertain global macroeconomicscenario, domestic and external financing condi-tions showed signs of improving and the busi-ness outlook turned positive, signalling a revivalof industrial activity. From August to November2009 industrial output grew in double digits,while GDP growth during the second quarter ofthe fiscal year 2009 (July to September 2009)was 7.9%. According to the preliminary esti-mates, GDP grew by 7.2% for the full fiscal year2009. This recovery is remarkable given the factthat the agriculture output declined by 0.2% dueto poor weather conditions as a result ofdelayed and sub-normal monsoon. Both theindustrial and services sectors grew by over 8%.
The Islamic Republic of Iran is the net oilexporter and the country remains highly de-pendent on oil revenues that provide over 80%of Government revenue. As a result of reduced
ECONOMIC AND SOCIAL SURVEY OF ASIA AND THE PACIFIC 2010
92
extent, growing 3.6% in 2009, as well as arebound in agriculture which benefited from abumper wheat crop. While consumer spendingremained strong, gross fixed capital formation,which had expanded by 3.8% in 2008, con-tracted by 6.9% in 2009.
In India, consumer prices, particularly of food,remain stubbornly high and the consumer priceindex (for industrial workers) rose to about 9.0%in 2008 (table 16). Inflationary pressures contin-ued into 2009, largely resulting from the poormonsoon with adverse impact on food supplies,firming up of global commodity prices and theGovernment expansionary fiscal stance. Inflationas measured by the consumer price index wasaround 12.0% in 2009. A faster increase in foodprices has become a cause of concern.
In Pakistan, inflation rose sharply from 12% in2008 to 20.8% in 2009 mainly because of foodprice increases. The Government increased thewheat support price by more than 50%, whichpushed up retail prices of wheat and wheatflour across the country. It also phased outsubsidies on petroleum products. To contain in-flation, the Government has been cutting spend-ing and attempting to improve the supply anddistribution of essential commodities. Inflation isprojected to decline in 2010 although it willremain in double digits. Upward pressures willremain high, particularly if higher oil prices,electricity tariff increases, higher wages, andfiscal expansion come to bear. A more activemonetary policy might be needed to manageinflationary pressures.
The end of the internal conflict inSri Lanka should raise confidenceamong consumers and businesses
GDP growth in Sri Lanka fell from 6.0% in 2008to 3.5% in 2009, corresponding to slowergrowth in the industrial and services sectorsand falling exports. The end of the internalconflict in May 2009 should raise confidenceamong consumers and businesses. Much of theeconomic impetus will come from developingareas affected by conflict and resettling inter-nally displaced persons. A boost in agriculturaloutput in the north and east of the country,higher rural incomes and increased private con-sumption can be expected.
Turkey is strongly linked with the crisis-hiteconomies of the developed world and thus feltthe full force of the crisis as it contracted by6.0% in 2009. GDP growth started to contract inthe last quarter of 2008, which dampenedgrowth at barely 0.9% in 2008. That reflected asharp decline in exports which affected domes-tic production, as well as much greater difficul-ties in foreign financing. However, imports felleven more, owing to low energy prices and theslowdown in economic activity. As a result, thecurrent account deficit shrank from around 6.0%of GDP in 2007 and 2008 to 2.1% in 2009 –which will help ease external financing pressure.
Inflation is key policy concern
High inflation continues to be a serious problemin several countries of the subregion, risingrapidly to double digits or close to that in 2008(table 16). Despite the deceleration in 2009,rates remained high compared with othersubregions.
A more active monetary policy mightbe needed to manage inflationary
pressures
Faster reduction in inflation occurred in Bangla-desh and Sri Lanka. In Bangladesh, lower worldfood and fuel prices drove inflation down to6.7% in 2009 from 9.9% in 2008. Food inflationdecelerated even more sharply from 12.3% in2008 to 7.2% in 2009 supported by higher riceand wheat harvests. Non-food inflation has beencomparatively lower and remained relatively sta-ble. Inflation in Sri Lanka, after reaching a highof 28% on a year-on-year basis in June 2008,decelerated sharply to less than 1.0% in Sep-tember 2009, owing to restrictive monetarypolicy efforts, favourable domestic supply condi-tions and significantly lower global commodity
CRISIS AND REBOUND AT THE SUBREGIONAL LEVEL CHAPTER 2
93
prices. On average inflation in 2009 was esti-mated at 3.4%.
Inflation in Bhutan and Nepal is linked to infla-tion in India due to the fixed rates of exchangeof their currencies with the Indian rupee. Infla-tion in Nepal reached 13.2% in 2009. It wasdriven by a 16.5% spike in the cost of food andbeverages, which account for a 53.2% weight inthe consumer price index.
In the Islamic Republic of Iran, annual inflationdeclined from 25.5% in 2008 to 16.0% in 2009,owing to a sharp drop in international oil andnon-oil commodity prices. With fiscal policylikely to remain expansionary, albeit not to theextent it was in previous years, concerns overinflation will persist in the coming years. Theadoption of a tighter financial policies stance,which has been expansionary and procyclical,will be needed. Even though expansionary fiscaland monetary policies have brought about someshort-term gains in production and employment,the high and persistent inflation that they gener-ate can undermine long-term growth and ad-versely affect the poor.
Given the sharp economic slowdown in Turkeyand much lower international commodity prices,consumer price inflation decreased to 6.3% in2009 from 10.4% in 2008. The decreasing infla-tionary pressure enabled the central bank toimplement growth-supporting monetary policywithout deviating from the main objective ofprice stability.
Trade declines sharply but workers’ remittancesstay strong
Before the onset of global economic crisis, highoil prices had created severe problems for thebalance of payments position of some countries.However, during the global crisis, both exportsand imports slowed down and helped containtrade and current account deficits. Furthermore,workers’ remittances have been rising sharply.They account for a substantial share of GDP,particularly in least developed countries, andprovide current account support. A major part ofremittances inflows originates from oil-rich GulfCooperation Countries. While there were some
concerns that large-scale layoffs could happen ifthe recent financial problems experienced inDubai spread, past experience shows that re-mittances from those countries are resilient,even during volatile oil price periods. Many ofthose countries have heavily invested in devel-oping their infrastructure as a long-term devel-opment strategy, for which funding is availablefrom large reserves accumulated over theyears. Therefore, large-scale lay off of migrantworkers seems unlikely even though rate ofgrowth of remittances has declined.
In India, the balance of payments came underpressure in 2008, when the current accountdeficit widened to 2.4% of GDP in 2008. Fur-thermore, net capital inflows fell to $9.1 billionin 2008 as compared with net capital inflows of$108 billion in 2007, reflecting the unstable na-ture of those flows. Both exports and importsfell in 2009 but workers remittances remainedstrong. The current account deficit further wid-ened to 3.3% of GDP for the first nine monthsof fiscal year 2009.
Similarly, Pakistan endured a decline in exportsof 6.0% in 2009, while imports contracted at amuch faster rate of 11%. Combined with astrong growth momentum in workers’ remit-tances of 20%, reaching a total of $7.8 billion,the current account deficit in 2008 of 8.4% ofGDP was reduced to 5.3% of GDP in 2009.The global economic slowdown and political andsecurity uncertainties resulted, however, inslackening of capital inflows with reduced FDIinflows, higher portfolio outflows, lower disburse-ments of loan and higher amortization pay-ments.
In Bangladesh, the balance of paymentsstrengthened considerably in 2009 with a cur-rent account surplus of 1.0% of GDP. Importsgrowth decelerated markedly from 26.1% in2008 to 4.1% in 2009 after the onset of theglobal financial crisis and lower demand forcapital and intermediate goods. Lower food andfuel import prices and a good harvest alsoplayed a role. The apparel and textile industriescontinued to expand because Bangladeshlargely produces for the lower end of the mar-ket which was less affected by the downturn.
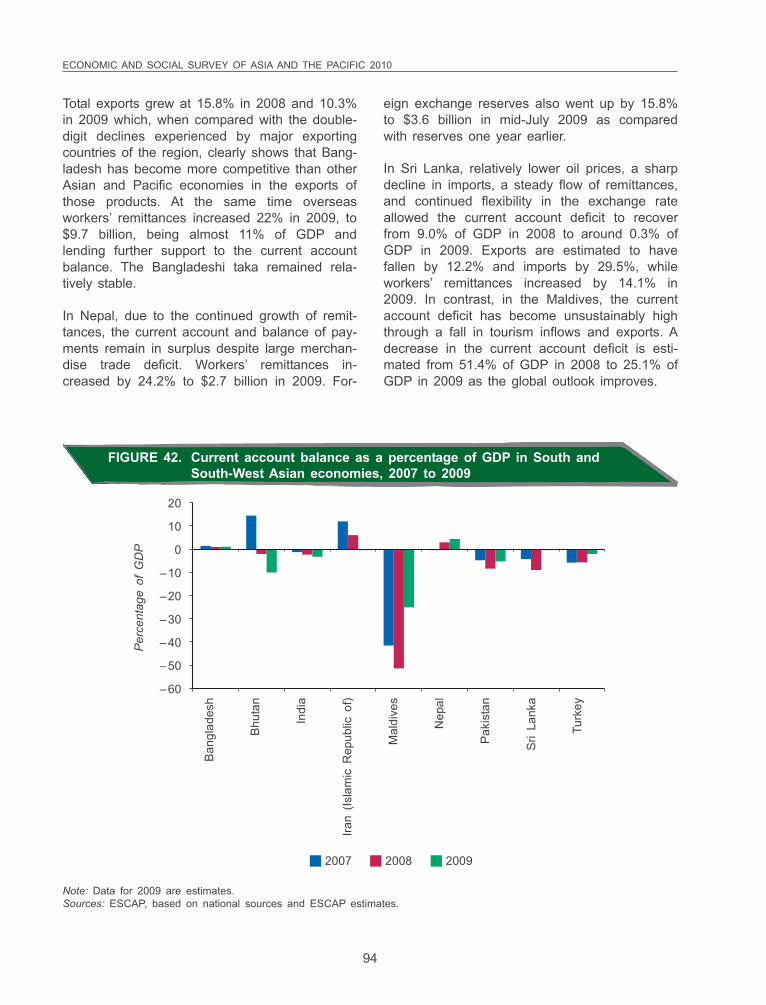
ECONOMIC AND SOCIAL SURVEY OF ASIA AND THE PACIFIC 2010
94
Total exports grew at 15.8% in 2008 and 10.3%in 2009 which, when compared with the double-digit declines experienced by major exportingcountries of the region, clearly shows that Bang-ladesh has become more competitive than otherAsian and Pacific economies in the exports ofthose products. At the same time overseasworkers’ remittances increased 22% in 2009, to$9.7 billion, being almost 11% of GDP andlending further support to the current accountbalance. The Bangladeshi taka remained rela-tively stable.
In Nepal, due to the continued growth of remit-tances, the current account and balance of pay-ments remain in surplus despite large merchan-dise trade deficit. Workers’ remittances in-creased by 24.2% to $2.7 billion in 2009. For-
eign exchange reserves also went up by 15.8%to $3.6 billion in mid-July 2009 as comparedwith reserves one year earlier.
In Sri Lanka, relatively lower oil prices, a sharpdecline in imports, a steady flow of remittances,and continued flexibility in the exchange rateallowed the current account deficit to recoverfrom 9.0% of GDP in 2008 to around 0.3% ofGDP in 2009. Exports are estimated to havefallen by 12.2% and imports by 29.5%, whileworkers’ remittances increased by 14.1% in2009. In contrast, in the Maldives, the currentaccount deficit has become unsustainably highthrough a fall in tourism inflows and exports. Adecrease in the current account deficit is esti-mated from 51.4% of GDP in 2008 to 25.1% ofGDP in 2009 as the global outlook improves.
20
10
0
–10
–20
–30
–40
–50
–60
Per
cent
age
of G
DP
2007 2008 2009
Ban
glad
esh
Bhu
tan
Indi
a
Iran
(Isla
mic
Rep
ublic
of)
Mal
dive
s
Nep
al
Pak
ista
n
Sri
Lank
a
Turk
ey
FIGURE 42. Current account balance as a percentage of GDP in South andSouth-West Asian economies, 2007 to 2009
Note: Data for 2009 are estimates.Sources: ESCAP, based on national sources and ESCAP estimates.
CRISIS AND REBOUND AT THE SUBREGIONAL LEVEL CHAPTER 2
95
The Islamic Republic of Iran, being a net ex-porter of oil, suffered sharp contraction in itsexports in 2009 owing to lower oil prices anddemand. Imports also fell but at a slower rateas economic activity moderated in the country.As a result, the trade surplus fell in 2009 andthe current account registered a small deficit,after a large surplus in the previous year.
In Turkey, imports declined more rapidly thanexports. The contraction in imports stemmedpartly from decline in energy prices and partlyfrom the slowdown in economic activity. Thecurrent account deficit is expected to shrink to2.1% of GDP in 2009 from just under 6.0% ofGDP in 2007 and 2008. The smaller deficit willhelp to ease external financing pressure as theglobal credit squeeze has made internationalfinancing more difficult and more costly than inthe recent past.
With regard to the exchange rate againstthe United States dollar in 2009, the Indianrupee depreciated in the beginning of theyear but in subsequent months appreciated.The Sri Lankan rupee followed a similar coursebut could not regain lost ground and endedthe year slightly lower. The Pakistani rupeeconsistently depreciated over the year. TheBangladeshi taka showed the greatest stabilityover the year.
Policy responses
As for all other subregions of Asia and thePacific, Governments in this subregion usedexpansionary fiscal and monetary policies tocounter the negative fallout of the globalslowdown and moderate the decline in growth.On the fiscal side, although budget deficits werealready high prior to the global crisis, Govern-ments had little choice but to run up higherdeficits as a means of countercyclicalstabilization. Moving forward, it is important thatgovernments in the subregion prepare a clearroadmap of fiscal consolidation to be imple-mented at the earliest. This is important toanchor long run expectations about interestrates and private sector investments.
Central banks showed much more willingness toimplement a range of monetary-easing and li-quidity-enhancing measures including reductionin the cash reserve ratio, the statutory liquidityratio and key policy rates in support of expan-sionary fiscal policies. Looking ahead, and asinflationary pressures increase, there are signsthat monetary policy has started to tighten. TheReserve Bank of India in January 2010 raisedthe cash reserve ratio by 0.75% to 5.75% andin March 2010 policy interest rates were raisedby 25 basis points, pushing the repo rate up to5%. It was part of a fine balancing act betweencontaining inflationary pressures and supportingthe domestic economy as the global recoveryprocess remains weak.
Acceleration in expansionary fiscal policy
The Government of India introduced a largefiscal stimulus package to boost domestic de-mand and contain the adverse impact of theglobal economic crisis. Fiscal stimulus was inthe form of tax relief to boost demand, andincreased expenditure on public projects to cre-ate employment and public assets. The Govern-ment renewed its efforts to increase infrastruc-ture investments in telecommunications, powergeneration, airports, ports, roads and railways,besides expansion of the National Rural Em-ployment Guarantee Scheme (box 5) as a partof fiscal stimulus in 2009 budget. The fiscalstimulus also included write-off of agriculturalloans, revision of salaries of Government staff(undertaken in 2008 and 2009). Fiscal stimulusspending over 2008 and 2009 is estimated atthe equivalent of 7.1% of GDP. As a result, thebudget deficit increased from 2.6% GDP in2007 to 5.9% of GDP in 2008 and is estimatedto rise to 6.5% of GDP in 2009 (figure 43). Thebudget for the fiscal year 2010 attempted toaddress the challenge of fiscal consolidation inthe face of growing public debt by raising rev-enues and containing unproductive expenditure.As a result, budget deficit is expected to comedown to 5.5% of GDP in 2010.
A clear roadmap of fiscalconsolidation needed
ECONOMIC AND SOCIAL SURVEY OF ASIA AND THE PACIFIC 2010
96
In 2005, through the National Rural Employment Act, the Government of India launched a bold, innovative scheme to provideemployment to the rural poor: the National Rural Employment Guarantee Scheme. It provides guaranteed employment at minimumwage for 100 days each year to every rural household whose adult members volunteer to do unskilled manual work.a At least onethird of the beneficiaries must be women.
In any poverty reduction programme the most difficult task is to identify the poor. In this case the programme is self targetingsince the non-poor are not usually attracted by hard manual work at minimum wages. People interested in the scheme are issuedregistration cards and can apply for a minimum of 14 days’ continuous work either to the local Government or the programmeofficer. They will be offered work, if possible within a 5-kilometre radius or, if farther away, are entitled to a transport allowanceand some extra living expenses. If applicants are not offered work within 15 days they are paid an unemployment allowance.
The scheme operates on a huge scale. During fiscal year 2008/2009 it provided more than 1 billion person-days of employmentfor 45 million people.b For fiscal year 2009/2010 the Government has allocated 391 billion rupees, being more than $8 billion.Most of the financial resources are provided by central Government, but implementation and management are largely throughState and local Governments that identify public works projects. The Government has been providing training to all thefunctionaries involved. This decentralized participatory management system helps improve delivery and public accountability. It canalso be monitored centrally since details on the progress and outcomes of the scheme are available on the Internet, allowinghigher-level Government officials, if necessary, to take remedial action.
The scheme has many advantages. Besides providing employment to the rural poor, it also helps address the causes of chronicpoverty like drought, deforestation and soil erosion, through public works projects in water conservation and harvesting,afforestation, rural connectivity, and construction and repair of embankments for flood control. It promotes an inclusive form offinancial development since, in order to protect poor workers from being cheated, payments are made through bank or post officeaccounts. Long distance to available banks and post offices in some rural areas can be a serious problem; in such cases mobilecounters of banks/post offices can be provided.c
Initial evidence suggests that the programme is achieving its objectives in providing income security for the poor, achieving highparticipation of women and marginalized groups, stemming distress migration, increasing access to markets and services andregenerating national resources. Such a scheme could be replicated in many developing countries.
Notes:a Government of India, National Rural Employment Guarantee Act, available from http://india.gov.in/sectors/rural/national_rural.php (accessed 11
Jan. 2010).b Government of India, The Mahatma Gandhi National Rural Employment Guarantee Act, “Employment generated during the year 2008-2009”,
available from http://164.100.12.7/netnrega/writereaddata/citizen_out/DemRegister_0809.html (accessed 11 Jan. 2010).c Mehrotra, Santosh, “NREG two years on: where do we go from here?”, Economic and Political Weekly, Vol. 43, No. 31, Mumbai, India, 2 Aug. 2008.
BOX 5. Indian National Rural Employment Guarantee Scheme
Yet another challenge for the economy is tomanage portfolio capital inflows, mainly foreigninstitutional investments that contribute to bub-bles in capital markets and put upward pressureon exchange rates. The Bombay Stock Ex-change Sensitive Index (SENSEX) appreciatedby more than 100% between early in March2009 and the end of 2009 as foreign institu-tional investment flows returned to the capitalmarkets. The Indian rupee appreciated byaround 6% in 2009.
In Pakistan, fiscal deficit has been rising inrecent years, standing at 7.6% of GDP in 2008.In November 2008, the Government of Pakistansigned a $7.6 billion, 23-month Stand-By Ar-rangement with the IMF to support the country’sstabilization programme and help the countryremedy balance of payments difficulties. Fiscalperformance improved substantially in 2009 dueto more stringent fiscal policy. The budget deficitcame down to 5.2% of GDP. While performanceon the revenue side was not very encouraging,
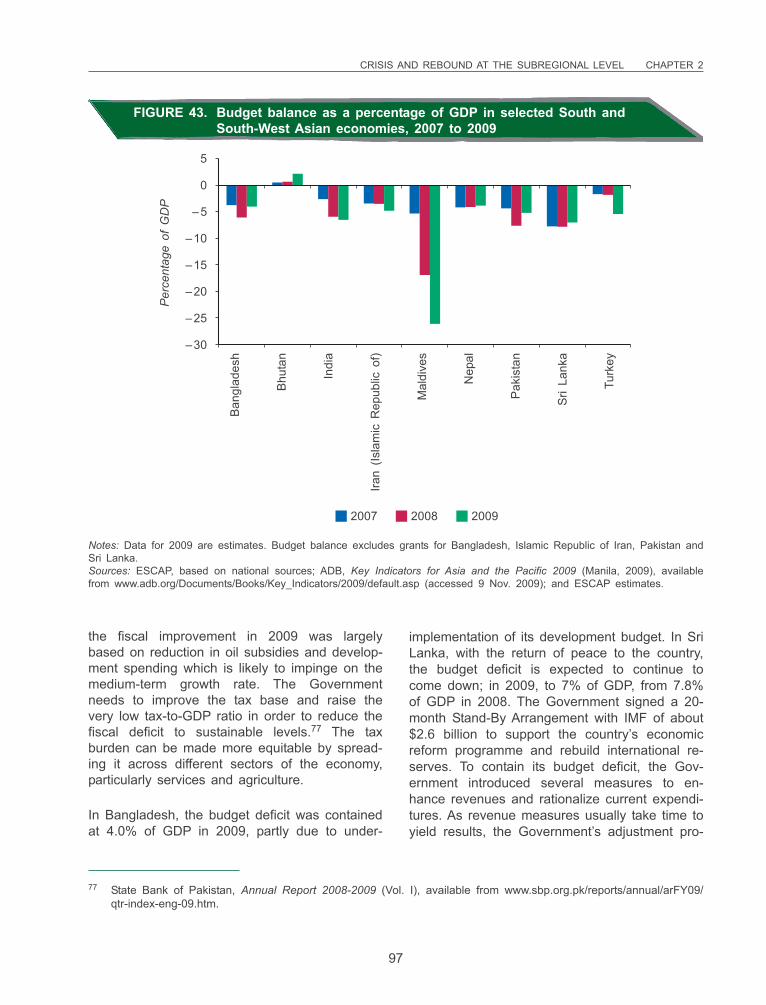
CRISIS AND REBOUND AT THE SUBREGIONAL LEVEL CHAPTER 2
97
the fiscal improvement in 2009 was largelybased on reduction in oil subsidies and develop-ment spending which is likely to impinge on themedium-term growth rate. The Governmentneeds to improve the tax base and raise thevery low tax-to-GDP ratio in order to reduce thefiscal deficit to sustainable levels.77 The taxburden can be made more equitable by spread-ing it across different sectors of the economy,particularly services and agriculture.
In Bangladesh, the budget deficit was containedat 4.0% of GDP in 2009, partly due to under-
implementation of its development budget. In SriLanka, with the return of peace to the country,the budget deficit is expected to continue tocome down; in 2009, to 7% of GDP, from 7.8%of GDP in 2008. The Government signed a 20-month Stand-By Arrangement with IMF of about$2.6 billion to support the country’s economicreform programme and rebuild international re-serves. To contain its budget deficit, the Gov-ernment introduced several measures to en-hance revenues and rationalize current expendi-tures. As revenue measures usually take time toyield results, the Government’s adjustment pro-
5
0
–5
–10
–15
–20
–25
–30
Per
cent
age
of G
DP
2007 2008 2009
Ban
glad
esh
Bhu
tan
Indi
a
Iran
(Isla
mic
Rep
ublic
of)
Mal
dive
s
Nep
al
Pak
ista
n
Sri
Lank
a
Turk
ey
FIGURE 43. Budget balance as a percentage of GDP in selected South andSouth-West Asian economies, 2007 to 2009
Notes: Data for 2009 are estimates. Budget balance excludes grants for Bangladesh, Islamic Republic of Iran, Pakistan andSri Lanka.Sources: ESCAP, based on national sources; ADB, Key Indicators for Asia and the Pacific 2009 (Manila, 2009), availablefrom www.adb.org/Documents/Books/Key_Indicators/2009/default.asp (accessed 9 Nov. 2009); and ESCAP estimates.
77 State Bank of Pakistan, Annual Report 2008-2009 (Vol. I), available from www.sbp.org.pk/reports/annual/arFY09/qtr-index-eng-09.htm.
ECONOMIC AND SOCIAL SURVEY OF ASIA AND THE PACIFIC 2010
98
gramme in 2009 relied more on expenditurerestraint, while ensuring protection of vulnerablegroups. The highest priority is being given tothe reconstruction and development of the previ-ously war-torn areas and resettlement of inter-nally displaced persons. Economic stimulusmeasures could lead to sustained long-termgrowth through appropriate economic reforms,including restructuring of public-sector enter-prises.78
The budget deficit in Maldives has remainedhigh in recent years, rising to 26.l% of GDP in2009 from 16.9% of GDP in 2008. In December2009, IMF approved blended financing arrange-ments amounting to about $92.5 million spreadover 3 years. The financing is designed tosupport the Government’s policy programmeaimed at addressing the adverse impact of theglobal economic crisis and restoring macroeco-nomic stability and fiscal sustainability.
In Nepal, the budget deficit fell to 3.8% of GDPin 2009 from 4.1% in 2008 owing to strongrevenue growth and below-target spending. Theratio of revenue mobilization to GDP grew to14.8% in 2009 in comparison with the ratio of13.2% in 2008 because of encouraging growthin revenue collection.
Due to large oil revenues, the Government ofthe Islamic Republic of Iran has been followingan expansionary fiscal policy. For sharing thebenefits of oil revenues with the people, thefiscal system incorporates huge explicit and im-plicit subsidies. Energy prices including prices ofpetroleum products and electricity remain highlysubsidized. The agricultural sector and food im-ports are also subsidized. Government is in theprocess of reforming and overhauling the sub-sidy system by gradually phasing it out in favourof a new targeted welfare system. Poor familiesare to receive cash grants and basic servicessuch as healthcare.
In response to the crisis, the Government inTurkey cut some taxes and boosted certain
expenditures, equivalent to 0.8% of GDP in2008 and 1.6% in 2009. It also relaxed mon-etary policy to make credit cheaper and moreavailable. As a consequence and with the lossof revenue from economic contraction, thebudget deficit widened from 1.8% of GDP in2008 to 5.4% of GDP in 2009. The financialsector remained relatively stable, having bene-fited from major restructuring and improvedregulation and supervision following the 2001financial crisis. Consumer price inflation fell in2009, which enabled the central bank to imple-ment a growth-supporting monetary policy whilemaintaining price stability. As aggregate demandrecovers, however, inflation could rise.
Outlook and policy challenges
As the global outlook improves, the subregionshould resume rapid economic growth. It isforecast to grow at 6.1% in 2010 with strongerlinkages with other fast-growing Asian and Pa-cific developing economies supporting itsgrowth. Some countries are already developingnew partnerships for trade and investment rela-tions that will combine into an Asian communityof trading nations and a node of economicgrowth.
Growth improves but downside risks persist
Most countries are projecting stronger growth in2010: for example, 8.3% in India and 6.0% inSri Lanka and Bangladesh. In India, the struc-tural growth impulses of the economy remainstrong, given the high domestic savings rate,sound financial system and a macroeconomicpolicy environment supportive of growth. With arevival in investment and private consumption,growth in exports and strong expansion in in-dustrial production in recent months, growth inGDP is projected to accelerate in 2010. Theimproved security situation in Sri Lanka shouldbenefit all major sectors of the economy, par-ticularly tourism and agriculture, while invest-ment is likely to expand strongly in 2010 ascompanies prepare for a period of accelerated
78 Institute of Policy Studies of Sri Lanka, Sri Lanka State of the Economy 2009, Colombo, 2009.
CRISIS AND REBOUND AT THE SUBREGIONAL LEVEL CHAPTER 2
99
growth in domestic demand. Renewed foreigninvestor interest in the tourism sector holdspromise.
Higher growth in Pakistan is also projected, onthe assumption of improved security situation,relaxation of fiscal policy and some respite fromelectricity shortages. The anticipated recovery isexpected to be supported by the restocking ofinventories and a small recovery in exports asthe incipient recovery in major economiesgather pace. Large-scale manufacturing sectorwhich contracted in 2009 is projected to registerpositive growth in 2010.
In Bangladesh, as external demand picks up,growth in crisis-hit sectors of manufacturing mayfollow, while remittances will continue to supportthe economy and domestic demand.
In Nepal, the Government target of 5.5% GDPgrowth in 2010 will be supported by strongprivate consumption and an expansionary fiscalbudget, but may be constrained due to delayedmonsoon and poor weather conditions. GDPgrowth in 2010 is expected to be around 3.5%.
For Maldives, a positive GDP growth is forecastin 2010 along with some recovery in the worldeconomy.
With projected increase in oil prices, theeconomy of Islamic Republic of Iran should alsoexperience higher growth.
For Turkey, moderate growth of 3.0% is pro-jected in 2010, driven by improved domesticdemand as the main European export marketsare expected to remain weak and no majorboost from external demand is expected.
This growth outlook is subject to downside riskslinked to uncertainties that the global economyfaces. Rising oil prices could also push upinflation and lead to higher budget and current-account deficits. Bad weather could damage
79 Research and Information System for Developing Countries (RIS), South Asia Development and CooperationReport 2008 (Oxford University Press, New Delhi, 2008).
harvests; the subregion will always be prone tofloods, earthquakes and other natural disasters.There are also security risks: internal conflictsand terrorist attacks can undermine consumerand investor confidence. Across the subregion,in the face of rising international food and fuelprices and the return of capital flows, Govern-ments may struggle to manage price and ex-change rate stability without compromising eco-nomic growth.
Accelerating economic growth iscrucial to bring down poverty levels
Looking beyond 2010, accelerating economicgrowth is crucial to bring down poverty levels.The challenge will be how to make growth moreinclusive by spreading its benefits to larger seg-ments of the population. More resources shouldbe devoted to provision of basic services suchas education, health, sanitation and housingparticularly for those belonging to lower incomegroups. Targeted programmes for the benefit ofthe poor in the broader framework of socialprotection should also be a priority.
Finally, the inadequacies of physical infrastruc-ture remain a key constraint holding back thepotential of economic growth. Of particularconcern is electricity shortage in Pakistan andNepal, where disruptions in the supply of elec-tricity are compromising growth. Huge invest-ments are needed to enhance capacity of elec-tricity generation. At the same time, renovationof transmission and distribution lines is neces-sary to minimize electricity losses. Potentials oftrade in electricity among countries of thesubregion should be explored and subregionalcooperation in electricity generation and distribu-tion should be promoted to overcome electricityshortages.79
ECONOMIC AND SOCIAL SURVEY OF ASIA AND THE PACIFIC 2010
100
Generally, the year 2010 presents complex is-sues for policymakers as they seek to manageprice and exchange rate stability without com-promising growth momentum, in the face ofrising international food and fuel prices andreturn of capital flows.
SOUTH-EAST ASIA
In South-East Asia the global crisis overturnedprevailing economic logic. Previously, the largeexport-driven industrial base had been seen al-most entirely as a source of strength. But asthe financial crisis cut export demand from ma-jor markets, the dependence on trade was re-vealed also as a source of vulnerability. Exportdependence (defined as the ratio of exports toGDP) rose from less than 50% in the mid-1990s to over 70% by 2007. Openness (definedas the ratio of imports and exports to GDP) isalso high with ratios for Singapore, Thailand,Malaysia, and Viet Nam reaching 362%, 161%,130% and 160%, respectively. Those ratios aresignificantly higher than those for the two larg-est Asian developing economies: China at 60%and India at 40%.
Moreover, that trade is still highly concentrated.While the subregion has to some extent diversi-fied its export destinations, its biggest marketsare still the developed economies. And evenwhen there has been a rise in intraregionaltrade, it is largely based on interlocking produc-tion networks whose output, channelled throughChina as a production hub, is ultimately des-tined for the developed countries.
The fall in external demand notwithstanding, theeconomies in the subregion have enough policylevers to weather the crisis. As the followingsection will point out, many economies in theregion are poised for a faster recovery, thanwhat was initially expected.
Impact of the crisis
In contrast to the 1997 Asian financial crisis, thegenesis of the current global economic crisisoccurred outside of South-East Asia. The
subregion was largely spared the institutionalfailures that saddled the United States andEuropean financial systems. Clearly, the lessonsfrom the Asian crisis were not lost onpolicymakers as bank lending practices, regula-tions and supervision have been tightened overthe years. Rather, the shock this time aroundwas transmitted via the trade channel. South-East Asian economic growth thus slowed downsignificantly from 4% in 2008 to 0.6% in 2009,although there were differences among coun-tries.
Economic contraction
The national economies of Malaysia, Singaporeand Thailand all contracted in 2009. The Philip-pines managed to keep growth positive, butexperienced a dramatic deceleration. Theeconomies of Indonesia and Viet Nam, on theother hand, though also undergoing aslowdown, did not contract to the same extent.Two least developed countries, Timor-Leste andLao People’s Democratic Republic, grew thefastest in the subregion (table 17).
The variations are due to many factors, includ-ing domestic problems of varying intensity.Nevertheless, overall, some patterns acrosscountries emerge. The worst-affected countriesall had shares of exports to GDP that exceeded60%, with the European Union and UnitedStates accounting for relatively large shares ofexports. The country most exposed to tradeshock is Cambodia, with close to 80% oftotal exports bound for the United States orEurope. Singapore and Malaysia, with exportsaccounting for more than 100% of GDP,are quite exposed to trade shock as well(figure 44).
Another factor that played a role was the com-position of exports. Countries with a high shareof export products based on regional productionnetworking and outsourcing arrangements, suchas apparel, machinery, electronics and motorvehicles, were more exposed to perturbations inglobal trade. The extent of exposure is illus-trated in figure 45. The highest concentration forthose sectors is in the Philippines at around70%; the proportions are also high in Singa-
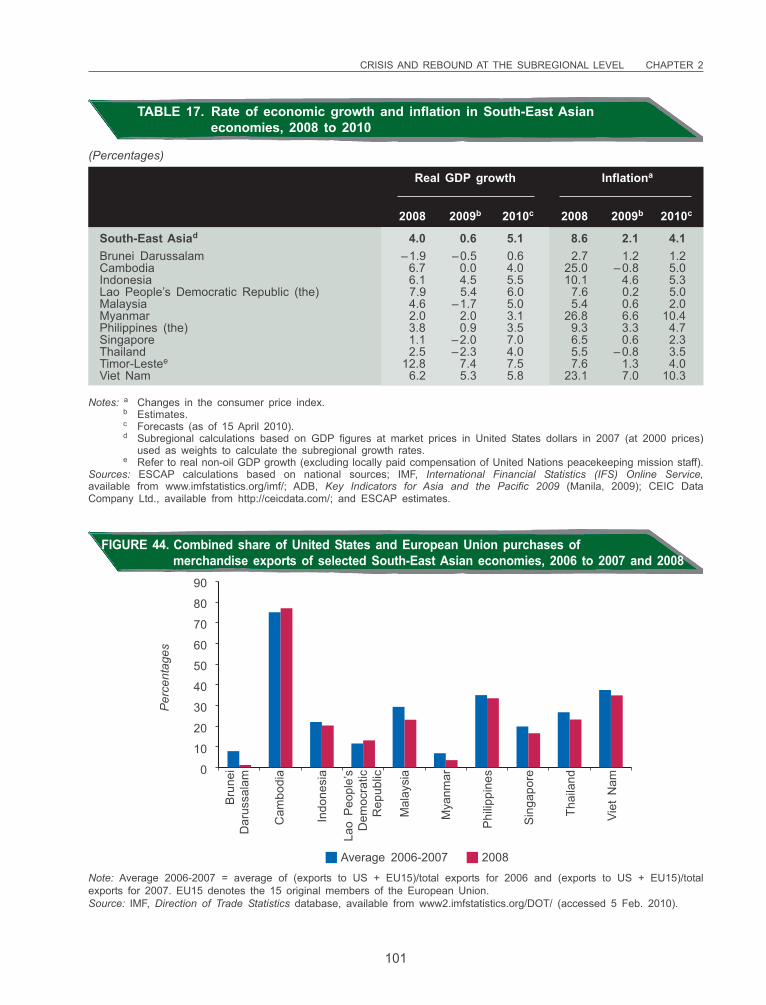
CRISIS AND REBOUND AT THE SUBREGIONAL LEVEL CHAPTER 2
101
90
80
70
60
50
40
30
20
10
0
Per
cent
ages
Average 2006-2007 2008
Bru
nei
Dar
ussa
lam
Cam
bodi
a
Indo
nesi
a
Lao
Peo
ple’
sD
emoc
ratic
Rep
ublic
Mal
aysi
a
Mya
nmar
Phi
lippi
nes
Sin
gapo
re
Thai
land
Viet
Nam
FIGURE 44. Combined share of United States and European Union purchases ofmerchandise exports of selected South-East Asian economies, 2006 to 2007 and 2008
Note: Average 2006-2007 = average of (exports to US + EU15)/total exports for 2006 and (exports to US + EU15)/totalexports for 2007. EU15 denotes the 15 original members of the European Union.Source: IMF, Direction of Trade Statistics database, available from www2.imfstatistics.org/DOT/ (accessed 5 Feb. 2010).
TABLE 17. Rate of economic growth and inflation in South-East Asianeconomies, 2008 to 2010
Real GDP growth Inflationa
2008 2009b 2010c 2008 2009b 2010c
South-East Asiad 4.0 0.6 5.1 8.6 2.1 4.1Brunei Darussalam –1.9 –0.5 0.6 2.7 1.2 1.2Cambodia 6.7 0.0 4.0 25.0 –0.8 5.0Indonesia 6.1 4.5 5.5 10.1 4.6 5.3Lao People’s Democratic Republic (the) 7.9 5.4 6.0 7.6 0.2 5.0Malaysia 4.6 –1.7 5.0 5.4 0.6 2.0Myanmar 2.0 2.0 3.1 26.8 6.6 10.4Philippines (the) 3.8 0.9 3.5 9.3 3.3 4.7Singapore 1.1 –2.0 7.0 6.5 0.6 2.3Thailand 2.5 –2.3 4.0 5.5 –0.8 3.5Timor-Lestee 12.8 7.4 7.5 7.6 1.3 4.0Viet Nam 6.2 5.3 5.8 23.1 7.0 10.3
Notes: a Changes in the consumer price index.b Estimates.c Forecasts (as of 15 April 2010).d Subregional calculations based on GDP figures at market prices in United States dollars in 2007 (at 2000 prices)
used as weights to calculate the subregional growth rates.e Refer to real non-oil GDP growth (excluding locally paid compensation of United Nations peacekeeping mission staff).
Sources: ESCAP calculations based on national sources; IMF, International Financial Statistics (IFS) Online Service,available from www.imfstatistics.org/imf/; ADB, Key Indicators for Asia and the Pacific 2009 (Manila, 2009); CEIC DataCompany Ltd., available from http://ceicdata.com/; and ESCAP estimates.
(Percentages)
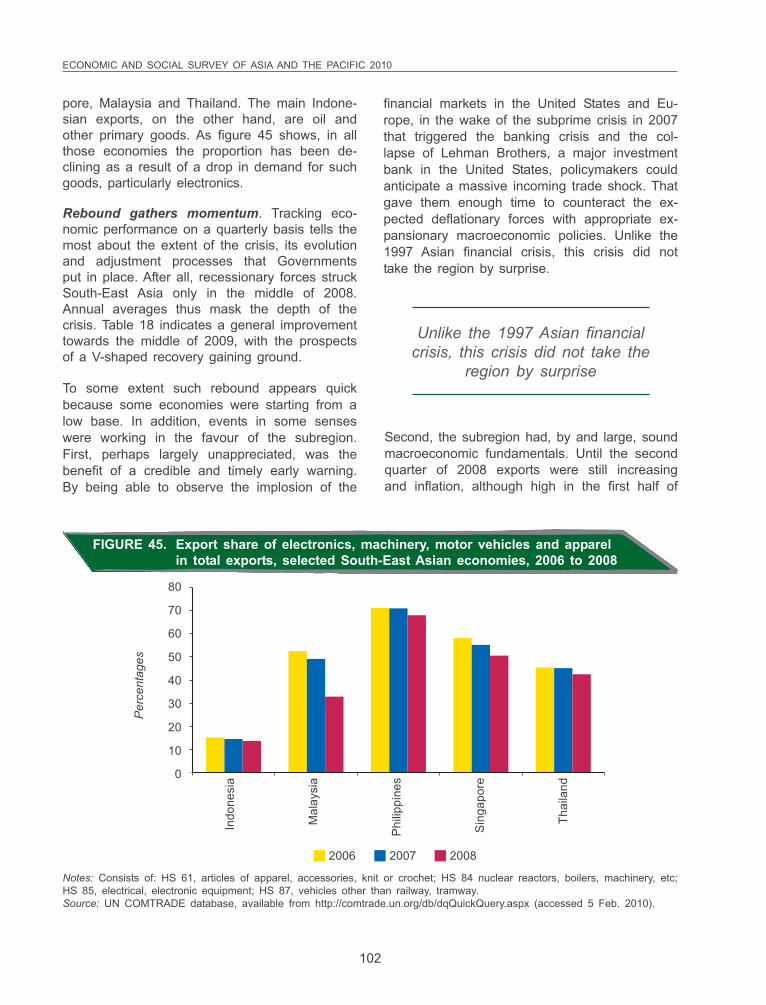
ECONOMIC AND SOCIAL SURVEY OF ASIA AND THE PACIFIC 2010
102
pore, Malaysia and Thailand. The main Indone-sian exports, on the other hand, are oil andother primary goods. As figure 45 shows, in allthose economies the proportion has been de-clining as a result of a drop in demand for suchgoods, particularly electronics.
Rebound gathers momentum. Tracking eco-nomic performance on a quarterly basis tells themost about the extent of the crisis, its evolutionand adjustment processes that Governmentsput in place. After all, recessionary forces struckSouth-East Asia only in the middle of 2008.Annual averages thus mask the depth of thecrisis. Table 18 indicates a general improvementtowards the middle of 2009, with the prospectsof a V-shaped recovery gaining ground.
To some extent such rebound appears quickbecause some economies were starting from alow base. In addition, events in some senseswere working in the favour of the subregion.First, perhaps largely unappreciated, was thebenefit of a credible and timely early warning.By being able to observe the implosion of the
financial markets in the United States and Eu-rope, in the wake of the subprime crisis in 2007that triggered the banking crisis and the col-lapse of Lehman Brothers, a major investmentbank in the United States, policymakers couldanticipate a massive incoming trade shock. Thatgave them enough time to counteract the ex-pected deflationary forces with appropriate ex-pansionary macroeconomic policies. Unlike the1997 Asian financial crisis, this crisis did nottake the region by surprise.
80
70
60
50
40
30
20
10
0
Per
cent
ages
2007 20082006
Indo
nesi
a
Mal
aysi
a
Phi
lippi
nes
Sin
gapo
re
Thai
land
FIGURE 45. Export share of electronics, machinery, motor vehicles and apparelin total exports, selected South-East Asian economies, 2006 to 2008
Notes: Consists of: HS 61, articles of apparel, accessories, knit or crochet; HS 84 nuclear reactors, boilers, machinery, etc;HS 85, electrical, electronic equipment; HS 87, vehicles other than railway, tramway.Source: UN COMTRADE database, available from http://comtrade.un.org/db/dqQuickQuery.aspx (accessed 5 Feb. 2010).
Unlike the 1997 Asian financialcrisis, this crisis did not take the
region by surprise
Second, the subregion had, by and large, soundmacroeconomic fundamentals. Until the secondquarter of 2008 exports were still increasingand inflation, although high in the first half of
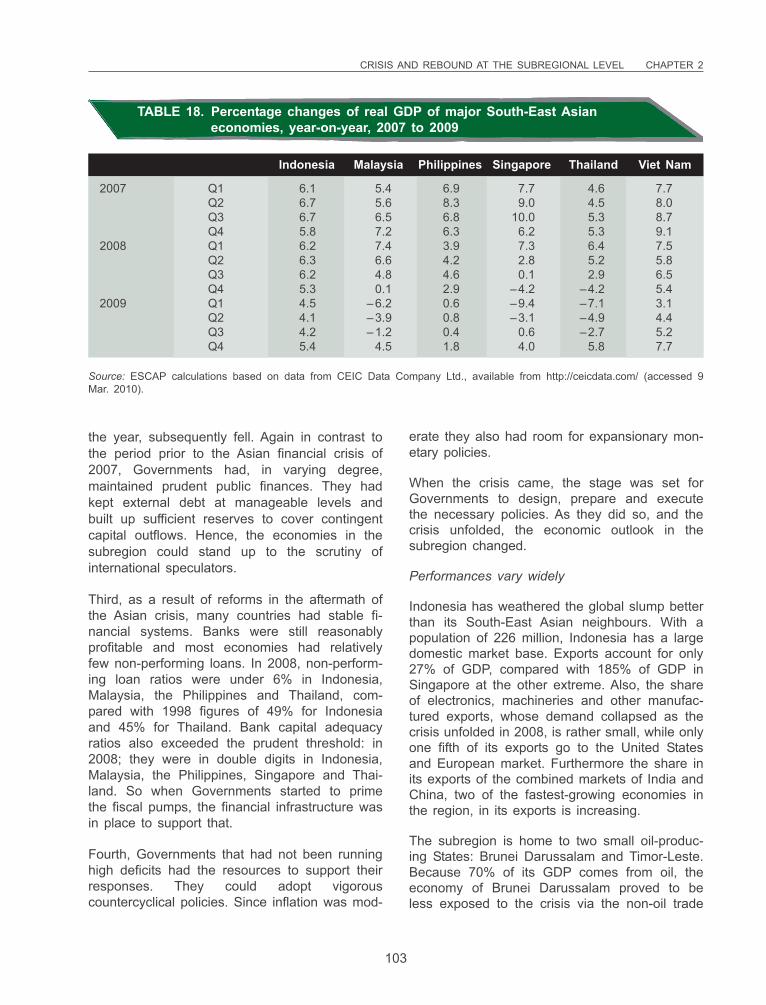
CRISIS AND REBOUND AT THE SUBREGIONAL LEVEL CHAPTER 2
103
the year, subsequently fell. Again in contrast tothe period prior to the Asian financial crisis of2007, Governments had, in varying degree,maintained prudent public finances. They hadkept external debt at manageable levels andbuilt up sufficient reserves to cover contingentcapital outflows. Hence, the economies in thesubregion could stand up to the scrutiny ofinternational speculators.
Third, as a result of reforms in the aftermath ofthe Asian crisis, many countries had stable fi-nancial systems. Banks were still reasonablyprofitable and most economies had relativelyfew non-performing loans. In 2008, non-perform-ing loan ratios were under 6% in Indonesia,Malaysia, the Philippines and Thailand, com-pared with 1998 figures of 49% for Indonesiaand 45% for Thailand. Bank capital adequacyratios also exceeded the prudent threshold: in2008; they were in double digits in Indonesia,Malaysia, the Philippines, Singapore and Thai-land. So when Governments started to primethe fiscal pumps, the financial infrastructure wasin place to support that.
Fourth, Governments that had not been runninghigh deficits had the resources to support theirresponses. They could adopt vigorouscountercyclical policies. Since inflation was mod-
erate they also had room for expansionary mon-etary policies.
When the crisis came, the stage was set forGovernments to design, prepare and executethe necessary policies. As they did so, and thecrisis unfolded, the economic outlook in thesubregion changed.
Performances vary widely
Indonesia has weathered the global slump betterthan its South-East Asian neighbours. With apopulation of 226 million, Indonesia has a largedomestic market base. Exports account for only27% of GDP, compared with 185% of GDP inSingapore at the other extreme. Also, the shareof electronics, machineries and other manufac-tured exports, whose demand collapsed as thecrisis unfolded in 2008, is rather small, while onlyone fifth of its exports go to the United Statesand European market. Furthermore the share inits exports of the combined markets of India andChina, two of the fastest-growing economies inthe region, in its exports is increasing.
The subregion is home to two small oil-produc-ing States: Brunei Darussalam and Timor-Leste.Because 70% of its GDP comes from oil, theeconomy of Brunei Darussalam proved to beless exposed to the crisis via the non-oil trade
TABLE 18. Percentage changes of real GDP of major South-East Asianeconomies, year-on-year, 2007 to 2009
Indonesia Malaysia Philippines Singapore Thailand Viet Nam
2007 Q1 6.1 5.4 6.9 7.7 4.6 7.7Q2 6.7 5.6 8.3 9.0 4.5 8.0Q3 6.7 6.5 6.8 10.0 5.3 8.7Q4 5.8 7.2 6.3 6.2 5.3 9.1
2008 Q1 6.2 7.4 3.9 7.3 6.4 7.5Q2 6.3 6.6 4.2 2.8 5.2 5.8Q3 6.2 4.8 4.6 0.1 2.9 6.5Q4 5.3 0.1 2.9 –4.2 –4.2 5.4
2009 Q1 4.5 –6.2 0.6 –9.4 –7.1 3.1Q2 4.1 –3.9 0.8 –3.1 –4.9 4.4Q3 4.2 –1.2 0.4 0.6 –2.7 5.2Q4 5.4 4.5 1.8 4.0 5.8 7.7
Source: ESCAP calculations based on data from CEIC Data Company Ltd., available from http://ceicdata.com/ (accessed 9Mar. 2010).
ECONOMIC AND SOCIAL SURVEY OF ASIA AND THE PACIFIC 2010
104
and investment channels. Nevertheless, exportincome fell with the global oil price late in 2008.Investment income from overseas assets is alsolikely to have declined. As a result the GDPcontracted in 2008.
than 20%. The Government responded with anaggressive fiscal and monetary policy, andgrowth in 2009 reached 5.3% year-on-year. TheState Bank of Viet Nam devalued the dong byaround 5% in late November 2009, and a fur-ther 3% in February 2010, given the strains inthe balance of payment deficits.
Growth in 2009 in Lao People’s DemocraticRepublic proved brisk. This is partly as a resultof higher metal prices, especially gold, whichhas attracted investment from China, Thailandand Viet Nam. The economy also received aboost as a result of pay increases for publicservants as well as increased public investmenton infrastructure for the 2009 South-East AsianGames. Lao People’s Democratic Republicshould also expect a rise in exports to China,but the prospects for other major markets areless sanguine: demand from Thailand, for ex-ample, may fall, especially since some of this isfor goods re-exported to third countries.
At the onset of the global crisis, Malaysia suffereda deep contraction in its export-oriented manufac-turing sector combined with a significant outflowin portfolio capital. Confidence was underminedand weakened investment spending leading to anegative growth rate in 2009. To counteract thefall in external demand, the authorities mountedtwo fiscal stimulus packages, while monetaryauthorities supported pump-priming activities byeasing the cash reserve requirement and lower-ing policy interest rates. As a result, consumptionincreased and stabilized a decelerating economytowards the second half of 2009.
Thai exports have a large share of crisis-sensi-tive manufactures like electronics andmachineries. Its service sector depends signifi-cantly on tourism which is very income elasticand was hit hard by the global recession andcontinuing political tensions. In the first half of2009, the Thai GDP fell by 6%, the largest dropin the subregion. To boost the anaemic de-mand, the Government delivered two stimuluspackages supported by expansionary monetarypolicy. However, they were insufficient to offsetthe severe contraction in the first half of 2009,as GDP fell by 2.3% for the whole of 2009although a turnaround in the fourth quarter of2009 was observed.
When Governments started to primethe fiscal pumps, the financial
infrastructure was in placeto support that
Similarly, most of the Timorese GDP is related tooil: its oil GDP is five times greater than its non-oil GDP, so much will depend on the oil priceoutlook for 2010. In 2008, the non-oil GDP grewby 13%, partly because it started from a low base.
The Philippines, despite a trade profile that isheavily vulnerable to shocks, has just barelybeen able to withstand the global downturn, partlyas a result of services exports, such as businessprocess outsourcing, and more importantly thelarge flows of foreign exchange through remit-tances, which in 2008 were $16.4 billion or 13%of GDP. Remittances grew by 5% in 2009,contrary to expectations. They account for around10% of GDP and have reached a record level of$17 billion. Among the mitigating factors is thewide geographical dispersion of overseas Filipinoworkers, and the mix of skills and positions heldin overseas jobs market, many of which are inhealth care, a crisis-neutral sector.
The large stimulus package introduced in Singa-pore, which includes a sizeable constructioncomponent, should contribute to future growth.Trade is also likely to resume faster than initiallyanticipated, given the recovery in the electronicstrade, and estimates of growth have thereforebeen revised sharply upwards.
In Viet Nam, growth has exhibited a sharp V-shape. In 2008, it grew at a brisk 6.2%, withinflation hitting 23%; combined with a currentaccount deficit running at 11.9% of GDP, fearsof overheating were raised. In January of 2009,as a result of the crisis, exports fell by more
CRISIS AND REBOUND AT THE SUBREGIONAL LEVEL CHAPTER 2
105
Cambodia is the only least-developed country inthe region whose economy is not expected toexperience any economic growth in 2009. Tradeaccounts for around half of GDP and is heavilyoriented to crisis-affected developed countries.In the first half of 2008, exports of garmentsdropped by as much as 25% and tourism re-ceipts also fell. The authorities responded withfiscal loosening. The country could be facedwith a fiscal deficit along with an upsurge ininflation. On the other hand, Cambodia tends toexport garments to niche markets so if demandin these revives quicker than anticipated therecould be a rapid turnaround in growth.
The GDP growth of Myanmar weakened in2008 owing to feeble external demand and tothe destruction caused by cyclone Nargis. Theagricultural sector still felt the lingering effects ofthe cyclone in 2009, dampening domestic de-mand. The largest export item is natural gaswhose price has fallen and, given the drop inboth internal and external demand, growth in2009 was likely to be flat. Myanmar was alsoaffected by the downturn in its biggest exportmarket, Thailand, although that was partially off-set by the robust growth of its second biggestmarket, India.
Policy responses
With sufficient warning, the Governments of thesubregion were able to proceed with timely andaggressive fiscal policies to boost domesticspending. The packages varied considerably –in terms of size, elements, targeted sectors andcriteria – depending on national priorities, fiscalspace and institutional structures of decision-making and disbursement. Indonesia, for exam-ple, utilized income tax cuts in its fiscal pack-age. Singapore offered some support for con-sumption, but opted for spending more on in-vestment and on training as well as offeringguarantees on loans for working capital. VietNam also offered support for credit but did sothrough a temporary interest rate subsidy ofaround 4% on certain bank loans.
Some patterns can be discerned across coun-tries. First, the more aggressive responsescame from the countries hardest hit by the
trade shock. Thailand introduced a packageworth 17% of GDP. Malaysia offered one worth9% of GDP. Both cases involved two tranches.The Singaporean package was also large: 8%of GDP. Indonesia and the Philippines, on theother hand, being less affected, had pro-grammes worth less than 5% of GDP.
The more aggressive responsescame from the countries hardest
hit by the trade shock
Second, a number of Governments based theirstimulus package on pragmatic considerationssuch as speed of disbursement. They oftenfrontloaded budget items in the first half of thefiscal year while also producing supplementalbudgets in order to disburse funds quickly. ThePhilippines, for instance, prioritized such easilyimplemented projects as road repairs, irrigationfacilities and hospitals, while also planning morecomplex infrastructure programmes that wouldrequire longer lead times. Thailand, similarly,first embarked on a short-term stimulus pack-age to support consumption spending withtransfer payments and cash handouts, particu-larly to the poor and senior citizens, beforeunveiling a second package which involved ma-jor public investment.
Third, nearly every stimulus package involvedsome expenditure on infrastructure. Malaysia,for example, under its first, $2-billion package,combined small-scale infrastructure projects,such as upgrading roads, hospitals and schoolswith investment in strategic industries includingbroadband. The “Stronger Thailand for 2012”package, which spans 2010 to 2012, aims tobolster competitiveness and encourage privateinvestment by investing in mass transit, energy,water resources, healthcare and housing. In theLao People’s Democratic Republic, the Govern-ment spent on infrastructure in preparation ofthe South-East Asian Games, which helpedstoke demand. Viet Nam and Indonesia alsoannounced programmes that combined spend-ing on infrastructure with programmes for pov-
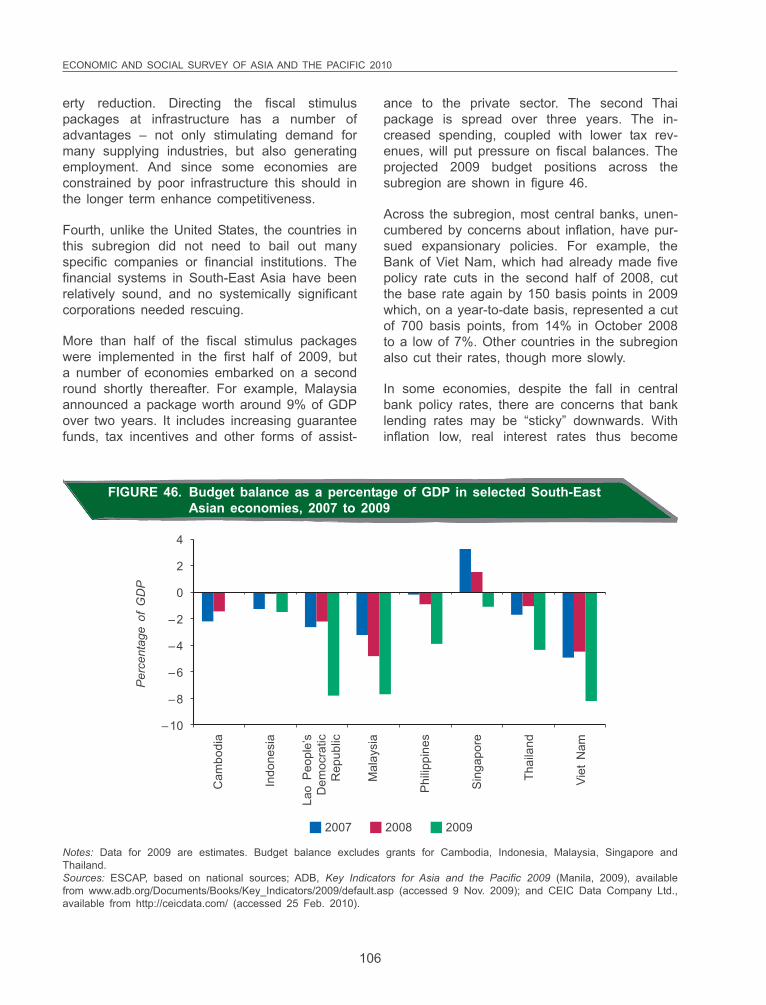
ECONOMIC AND SOCIAL SURVEY OF ASIA AND THE PACIFIC 2010
106
erty reduction. Directing the fiscal stimuluspackages at infrastructure has a number ofadvantages – not only stimulating demand formany supplying industries, but also generatingemployment. And since some economies areconstrained by poor infrastructure this should inthe longer term enhance competitiveness.
Fourth, unlike the United States, the countries inthis subregion did not need to bail out manyspecific companies or financial institutions. Thefinancial systems in South-East Asia have beenrelatively sound, and no systemically significantcorporations needed rescuing.
More than half of the fiscal stimulus packageswere implemented in the first half of 2009, buta number of economies embarked on a secondround shortly thereafter. For example, Malaysiaannounced a package worth around 9% of GDPover two years. It includes increasing guaranteefunds, tax incentives and other forms of assist-
ance to the private sector. The second Thaipackage is spread over three years. The in-creased spending, coupled with lower tax rev-enues, will put pressure on fiscal balances. Theprojected 2009 budget positions across thesubregion are shown in figure 46.
Across the subregion, most central banks, unen-cumbered by concerns about inflation, have pur-sued expansionary policies. For example, theBank of Viet Nam, which had already made fivepolicy rate cuts in the second half of 2008, cutthe base rate again by 150 basis points in 2009which, on a year-to-date basis, represented a cutof 700 basis points, from 14% in October 2008to a low of 7%. Other countries in the subregionalso cut their rates, though more slowly.
In some economies, despite the fall in centralbank policy rates, there are concerns that banklending rates may be “sticky” downwards. Withinflation low, real interest rates thus become
4
2
0
–2
–4
–6
–8
–10
Per
cent
age
of G
DP
Cam
bodi
a
Indo
nesi
a
Lao
Peo
ple’
sD
emoc
ratic
Rep
ublic
Mal
aysi
a
Phi
lippi
nes
Sin
gapo
re
Thai
land
Viet
Nam
FIGURE 46. Budget balance as a percentage of GDP in selected South-EastAsian economies, 2007 to 2009
2007 2008 2009
Notes: Data for 2009 are estimates. Budget balance excludes grants for Cambodia, Indonesia, Malaysia, Singapore andThailand.Sources: ESCAP, based on national sources; ADB, Key Indicators for Asia and the Pacific 2009 (Manila, 2009), availablefrom www.adb.org/Documents/Books/Key_Indicators/2009/default.asp (accessed 9 Nov. 2009); and CEIC Data Company Ltd.,available from http://ceicdata.com/ (accessed 25 Feb. 2010).
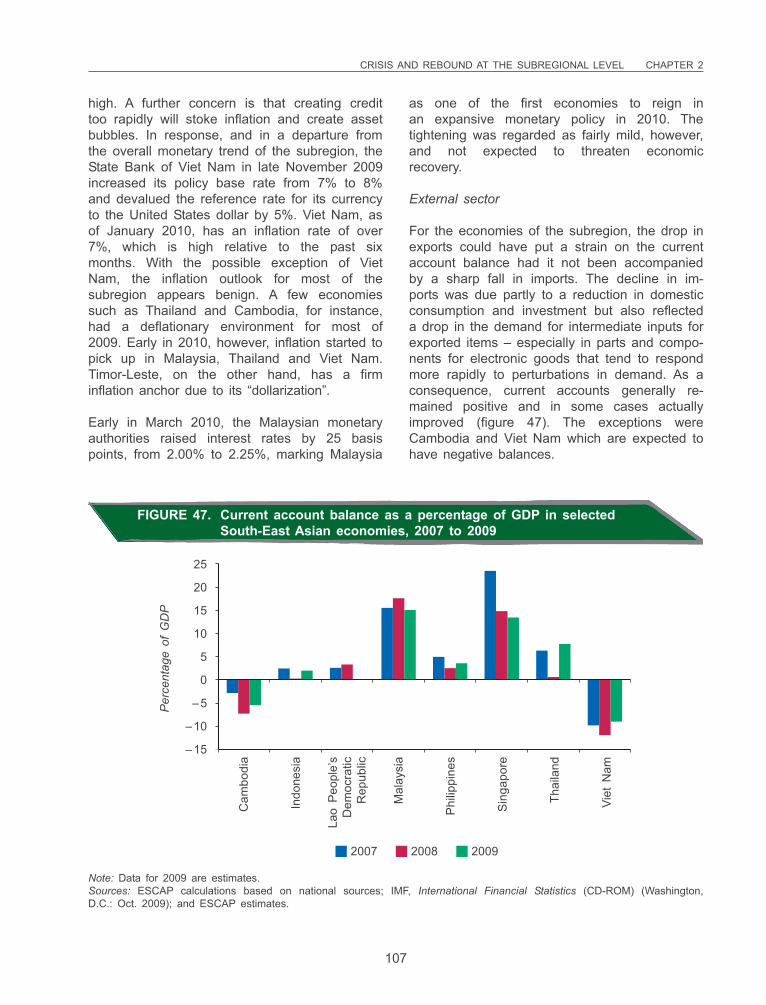
CRISIS AND REBOUND AT THE SUBREGIONAL LEVEL CHAPTER 2
107
high. A further concern is that creating credittoo rapidly will stoke inflation and create assetbubbles. In response, and in a departure fromthe overall monetary trend of the subregion, theState Bank of Viet Nam in late November 2009increased its policy base rate from 7% to 8%and devalued the reference rate for its currencyto the United States dollar by 5%. Viet Nam, asof January 2010, has an inflation rate of over7%, which is high relative to the past sixmonths. With the possible exception of VietNam, the inflation outlook for most of thesubregion appears benign. A few economiessuch as Thailand and Cambodia, for instance,had a deflationary environment for most of2009. Early in 2010, however, inflation started topick up in Malaysia, Thailand and Viet Nam.Timor-Leste, on the other hand, has a firminflation anchor due to its “dollarization”.
Early in March 2010, the Malaysian monetaryauthorities raised interest rates by 25 basispoints, from 2.00% to 2.25%, marking Malaysia
as one of the first economies to reign inan expansive monetary policy in 2010. Thetightening was regarded as fairly mild, however,and not expected to threaten economicrecovery.
External sector
For the economies of the subregion, the drop inexports could have put a strain on the currentaccount balance had it not been accompaniedby a sharp fall in imports. The decline in im-ports was due partly to a reduction in domesticconsumption and investment but also reflecteda drop in the demand for intermediate inputs forexported items – especially in parts and compo-nents for electronic goods that tend to respondmore rapidly to perturbations in demand. As aconsequence, current accounts generally re-mained positive and in some cases actuallyimproved (figure 47). The exceptions wereCambodia and Viet Nam which are expected tohave negative balances.
25
20
15
10
5
0
–5
–10
–15
Per
cent
age
of G
DP
2007 2008 2009
Cam
bodi
a
Indo
nesi
a
Lao
Peo
ple’
sD
emoc
ratic
Rep
ublic
Mal
aysi
a
Phi
lippi
nes
Sin
gapo
re
Thai
land
Viet
Nam
FIGURE 47. Current account balance as a percentage of GDP in selectedSouth-East Asian economies, 2007 to 2009
Note: Data for 2009 are estimates.Sources: ESCAP calculations based on national sources; IMF, International Financial Statistics (CD-ROM) (Washington,D.C.: Oct. 2009); and ESCAP estimates.
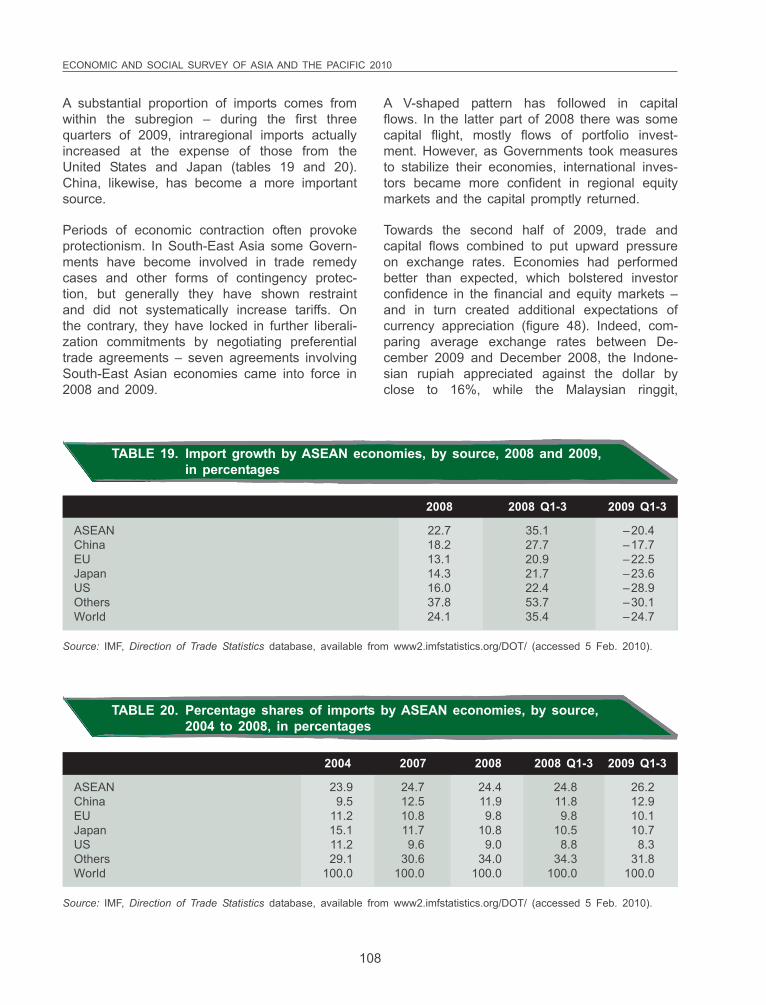
ECONOMIC AND SOCIAL SURVEY OF ASIA AND THE PACIFIC 2010
108
A substantial proportion of imports comes fromwithin the subregion – during the first threequarters of 2009, intraregional imports actuallyincreased at the expense of those from theUnited States and Japan (tables 19 and 20).China, likewise, has become a more importantsource.
Periods of economic contraction often provokeprotectionism. In South-East Asia some Govern-ments have become involved in trade remedycases and other forms of contingency protec-tion, but generally they have shown restraintand did not systematically increase tariffs. Onthe contrary, they have locked in further liberali-zation commitments by negotiating preferentialtrade agreements – seven agreements involvingSouth-East Asian economies came into force in2008 and 2009.
A V-shaped pattern has followed in capitalflows. In the latter part of 2008 there was somecapital flight, mostly flows of portfolio invest-ment. However, as Governments took measuresto stabilize their economies, international inves-tors became more confident in regional equitymarkets and the capital promptly returned.
Towards the second half of 2009, trade andcapital flows combined to put upward pressureon exchange rates. Economies had performedbetter than expected, which bolstered investorconfidence in the financial and equity markets –and in turn created additional expectations ofcurrency appreciation (figure 48). Indeed, com-paring average exchange rates between De-cember 2009 and December 2008, the Indone-sian rupiah appreciated against the dollar byclose to 16%, while the Malaysian ringgit,
TABLE 19. Import growth by ASEAN economies, by source, 2008 and 2009,in percentages
2008 2008 Q1-3 2009 Q1-3
ASEAN 22.7 35.1 –20.4China 18.2 27.7 –17.7EU 13.1 20.9 –22.5Japan 14.3 21.7 –23.6US 16.0 22.4 –28.9Others 37.8 53.7 –30.1World 24.1 35.4 –24.7
Source: IMF, Direction of Trade Statistics database, available from www2.imfstatistics.org/DOT/ (accessed 5 Feb. 2010).
TABLE 20. Percentage shares of imports by ASEAN economies, by source,2004 to 2008, in percentages
2004 2007 2008 2008 Q1-3 2009 Q1-3
ASEAN 23.9 24.7 24.4 24.8 26.2China 9.5 12.5 11.9 11.8 12.9EU 11.2 10.8 9.8 9.8 10.1Japan 15.1 11.7 10.8 10.5 10.7US 11.2 9.6 9.0 8.8 8.3Others 29.1 30.6 34.0 34.3 31.8World 100.0 100.0 100.0 100.0 100.0
Source: IMF, Direction of Trade Statistics database, available from www2.imfstatistics.org/DOT/ (accessed 5 Feb. 2010).
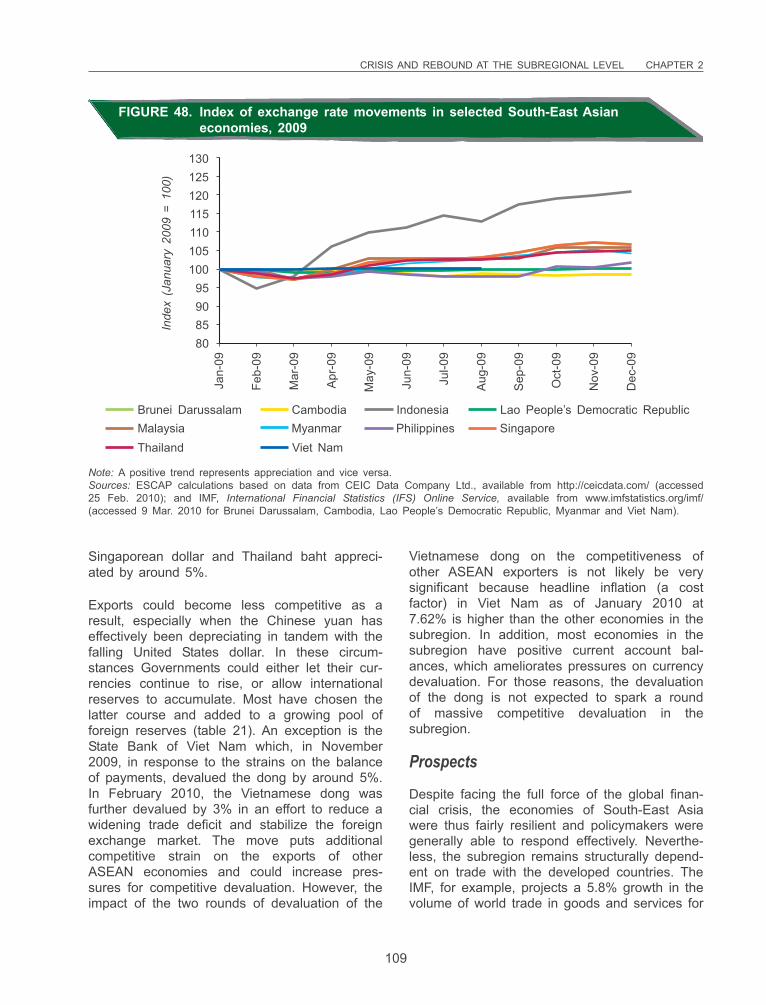
CRISIS AND REBOUND AT THE SUBREGIONAL LEVEL CHAPTER 2
109
130125120115110105100
95908580
Inde
x (J
anua
ry 2
009
= 10
0)
Jan-
09
Feb-
09
Mar
-09
Apr
-09
May
-09
Jun-
09
Jul-0
9
Aug
-09
Sep
-09
Oct
-09
Nov
-09
Dec
-09
IndonesiaMalaysia PhilippinesThailand
SingaporeBrunei Darussalam Cambodia Lao People’s Democratic Republic
MyanmarViet Nam
FIGURE 48. Index of exchange rate movements in selected South-East Asianeconomies, 2009
Note: A positive trend represents appreciation and vice versa.Sources: ESCAP calculations based on data from CEIC Data Company Ltd., available from http://ceicdata.com/ (accessed25 Feb. 2010); and IMF, International Financial Statistics (IFS) Online Service, available from www.imfstatistics.org/imf/(accessed 9 Mar. 2010 for Brunei Darussalam, Cambodia, Lao People’s Democratic Republic, Myanmar and Viet Nam).
Singaporean dollar and Thailand baht appreci-ated by around 5%.
Exports could become less competitive as aresult, especially when the Chinese yuan haseffectively been depreciating in tandem with thefalling United States dollar. In these circum-stances Governments could either let their cur-rencies continue to rise, or allow internationalreserves to accumulate. Most have chosen thelatter course and added to a growing pool offoreign reserves (table 21). An exception is theState Bank of Viet Nam which, in November2009, in response to the strains on the balanceof payments, devalued the dong by around 5%.In February 2010, the Vietnamese dong wasfurther devalued by 3% in an effort to reduce awidening trade deficit and stabilize the foreignexchange market. The move puts additionalcompetitive strain on the exports of otherASEAN economies and could increase pres-sures for competitive devaluation. However, theimpact of the two rounds of devaluation of the
Vietnamese dong on the competitiveness ofother ASEAN exporters is not likely be verysignificant because headline inflation (a costfactor) in Viet Nam as of January 2010 at7.62% is higher than the other economies in thesubregion. In addition, most economies in thesubregion have positive current account bal-ances, which ameliorates pressures on currencydevaluation. For those reasons, the devaluationof the dong is not expected to spark a roundof massive competitive devaluation in thesubregion.
Prospects
Despite facing the full force of the global finan-cial crisis, the economies of South-East Asiawere thus fairly resilient and policymakers weregenerally able to respond effectively. Neverthe-less, the subregion remains structurally depend-ent on trade with the developed countries. TheIMF, for example, projects a 5.8% growth in thevolume of world trade in goods and services for
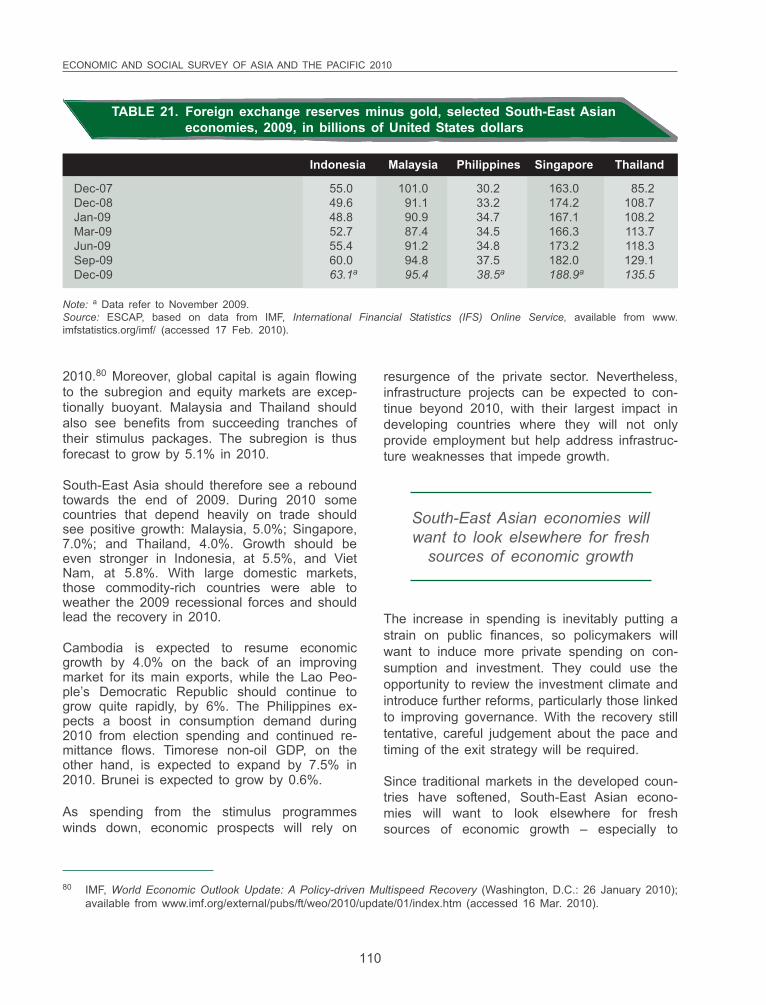
ECONOMIC AND SOCIAL SURVEY OF ASIA AND THE PACIFIC 2010
110
TABLE 21. Foreign exchange reserves minus gold, selected South-East Asianeconomies, 2009, in billions of United States dollars
Indonesia Malaysia Philippines Singapore Thailand
Dec-07 55.0 101.0 30.2 163.0 85.2Dec-08 49.6 91.1 33.2 174.2 108.7Jan-09 48.8 90.9 34.7 167.1 108.2Mar-09 52.7 87.4 34.5 166.3 113.7Jun-09 55.4 91.2 34.8 173.2 118.3Sep-09 60.0 94.8 37.5 182.0 129.1Dec-09 63.1a 95.4 38.5a 188.9a 135.5
Note: a Data refer to November 2009.Source: ESCAP, based on data from IMF, International Financial Statistics (IFS) Online Service, available from www.imfstatistics.org/imf/ (accessed 17 Feb. 2010).
2010.80 Moreover, global capital is again flowingto the subregion and equity markets are excep-tionally buoyant. Malaysia and Thailand shouldalso see benefits from succeeding tranches oftheir stimulus packages. The subregion is thusforecast to grow by 5.1% in 2010.
South-East Asia should therefore see a reboundtowards the end of 2009. During 2010 somecountries that depend heavily on trade shouldsee positive growth: Malaysia, 5.0%; Singapore,7.0%; and Thailand, 4.0%. Growth should beeven stronger in Indonesia, at 5.5%, and VietNam, at 5.8%. With large domestic markets,those commodity-rich countries were able toweather the 2009 recessional forces and shouldlead the recovery in 2010.
Cambodia is expected to resume economicgrowth by 4.0% on the back of an improvingmarket for its main exports, while the Lao Peo-ple’s Democratic Republic should continue togrow quite rapidly, by 6%. The Philippines ex-pects a boost in consumption demand during2010 from election spending and continued re-mittance flows. Timorese non-oil GDP, on theother hand, is expected to expand by 7.5% in2010. Brunei is expected to grow by 0.6%.
As spending from the stimulus programmeswinds down, economic prospects will rely on
resurgence of the private sector. Nevertheless,infrastructure projects can be expected to con-tinue beyond 2010, with their largest impact indeveloping countries where they will not onlyprovide employment but help address infrastruc-ture weaknesses that impede growth.
80 IMF, World Economic Outlook Update: A Policy-driven Multispeed Recovery (Washington, D.C.: 26 January 2010);available from www.imf.org/external/pubs/ft/weo/2010/update/01/index.htm (accessed 16 Mar. 2010).
South-East Asian economies willwant to look elsewhere for fresh
sources of economic growth
The increase in spending is inevitably putting astrain on public finances, so policymakers willwant to induce more private spending on con-sumption and investment. They could use theopportunity to review the investment climate andintroduce further reforms, particularly those linkedto improving governance. With the recovery stilltentative, careful judgement about the pace andtiming of the exit strategy will be required.
Since traditional markets in the developed coun-tries have softened, South-East Asian econo-mies will want to look elsewhere for freshsources of economic growth – especially to
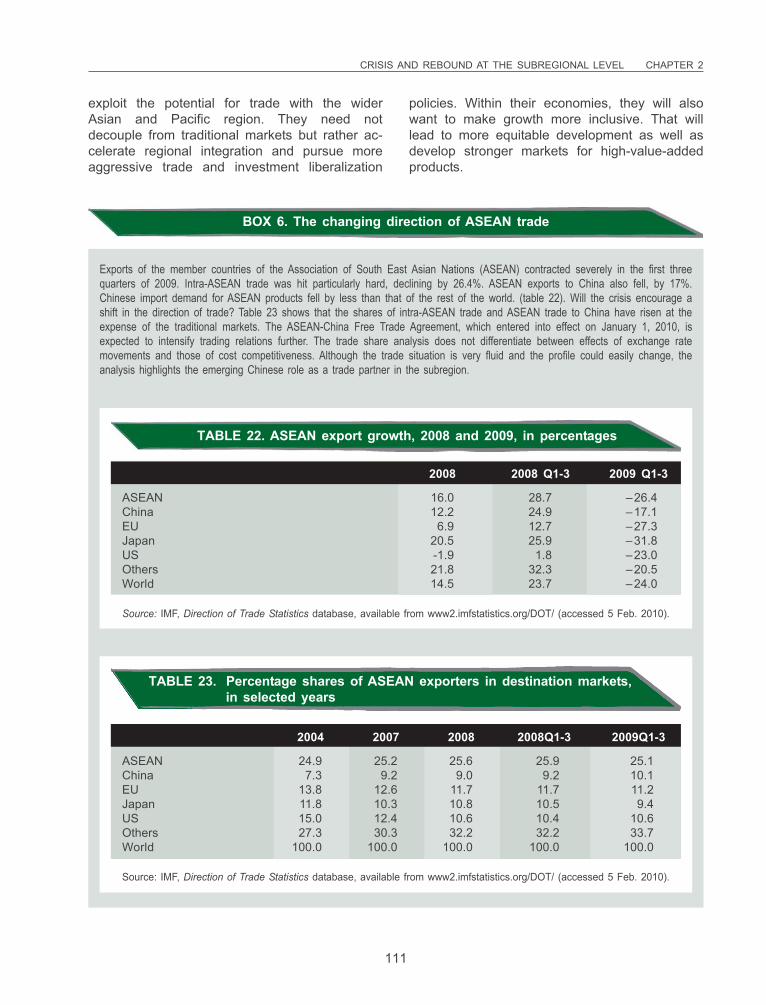
CRISIS AND REBOUND AT THE SUBREGIONAL LEVEL CHAPTER 2
111
BOX 6. The changing direction of ASEAN trade
Exports of the member countries of the Association of South East Asian Nations (ASEAN) contracted severely in the first threequarters of 2009. Intra-ASEAN trade was hit particularly hard, declining by 26.4%. ASEAN exports to China also fell, by 17%.Chinese import demand for ASEAN products fell by less than that of the rest of the world. (table 22). Will the crisis encourage ashift in the direction of trade? Table 23 shows that the shares of intra-ASEAN trade and ASEAN trade to China have risen at theexpense of the traditional markets. The ASEAN-China Free Trade Agreement, which entered into effect on January 1, 2010, isexpected to intensify trading relations further. The trade share analysis does not differentiate between effects of exchange ratemovements and those of cost competitiveness. Although the trade situation is very fluid and the profile could easily change, theanalysis highlights the emerging Chinese role as a trade partner in the subregion.
2008 2008 Q1-3 2009 Q1-3
ASEAN 16.0 28.7 –26.4China 12.2 24.9 –17.1EU 6.9 12.7 –27.3Japan 20.5 25.9 –31.8US -1.9 1.8 –23.0Others 21.8 32.3 –20.5World 14.5 23.7 –24.0
Source: IMF, Direction of Trade Statistics database, available from www2.imfstatistics.org/DOT/ (accessed 5 Feb. 2010).
2004 2007 2008 2008Q1-3 2009Q1-3
ASEAN 24.9 25.2 25.6 25.9 25.1China 7.3 9.2 9.0 9.2 10.1EU 13.8 12.6 11.7 11.7 11.2Japan 11.8 10.3 10.8 10.5 9.4US 15.0 12.4 10.6 10.4 10.6Others 27.3 30.3 32.2 32.2 33.7World 100.0 100.0 100.0 100.0 100.0
Source: IMF, Direction of Trade Statistics database, available from www2.imfstatistics.org/DOT/ (accessed 5 Feb. 2010).
TABLE 22. ASEAN export growth, 2008 and 2009, in percentages
TABLE 23. Percentage shares of ASEAN exporters in destination markets,in selected years
exploit the potential for trade with the widerAsian and Pacific region. They need notdecouple from traditional markets but rather ac-celerate regional integration and pursue moreaggressive trade and investment liberalization
policies. Within their economies, they will alsowant to make growth more inclusive. That willlead to more equitable development as well asdevelop stronger markets for high-value-addedproducts.

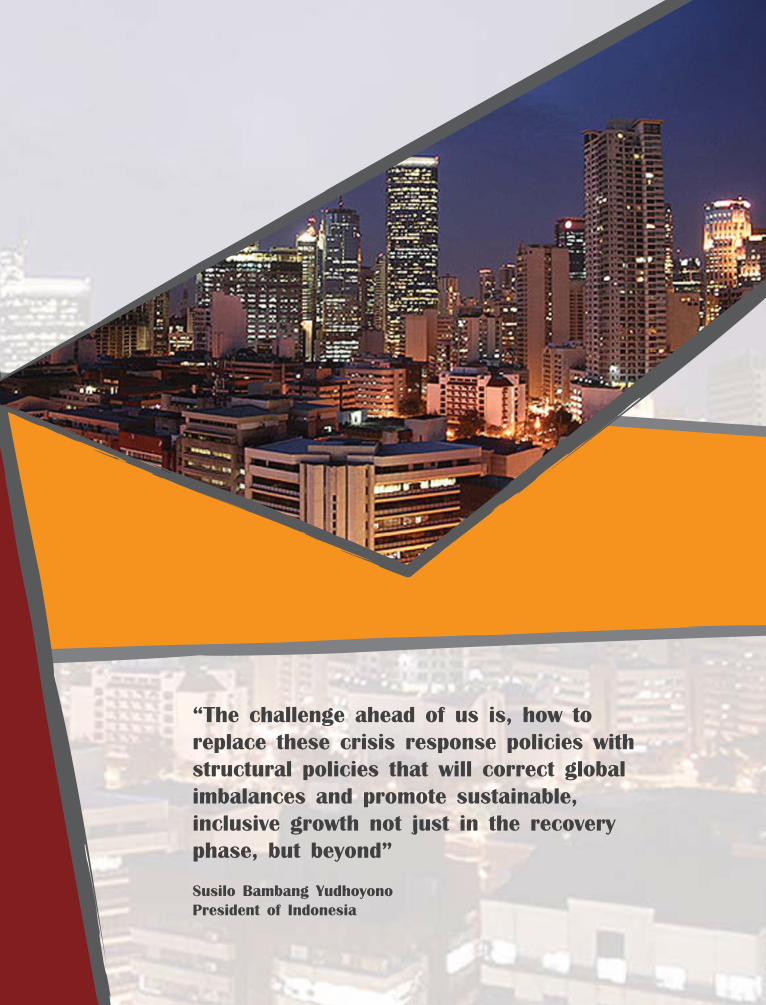
“The challenge ahead of us is, how to replace these crisis response policies with structural policies that will correct global imbalances and promote sustainable, inclusive growth not just in the recovery phase, but beyond”
Susilo Bambang YudhoyonoPresident of Indonesia

3MULTIPLE IMBALANCESAND DEVELOPMENT GAPS
AS NEW ENGINES OF GROWTH
The analysis in previous chapters has shown how national Governments have responded with timely, unprecedented fiscal stimulus packages and expansionary monetary policy that have helped in reviving growth in most Asian and Pacific economies. However, those packages must be seen essentially as short-term responses to an external shock. They cannot continue forever to sustain the growth momentum because of constraints of fiscal space and their potential to stoke inflationary tendencies. Consen-sus is growing on the need for a new growth paradigm. As argued by the APEC leaders at their November 2009 Summit in Singapore, the advanced economies are unlikely to go back to “growth as usual” and “trade as usual” scenarios.81 As seen in chapter 1, even with a recovery, the import demand in the advanced countries is unlikely to revive to pre-crisis levels because of the compulsions to restrain debt-fuelled consumption and reduce levels of public debt in order to unwind global imbalances. Asian and Pacific countries need to find new sources of demand to sustain their dynamism beyond the stimulus packages to make up for the considerable loss of demand in the advanced countries. They will need to “rebalance” their economies in favour of greater domestic and regional consumption. In the search for new impulses for growth, this chapter investigates the differ-ent imbalances and development gaps, for the effort to close them could help in generating additional aggregate demand.
Asia and the Pacific, home to 4.1 billion people who comprise more than 60% of the world’s population, has distinguished itself as the fastest-growing region in the world, especially since 1990. In particular, the region’s developing economies82 grew at an average annual rate of 5.3% between 1970 and 2008, which largely exceeds the growth rates of other developing and developed regions (figure 49). As a result of its dynamism, the region has made remarkable progress on a number of fronts, including poverty reduction and technological advances that will see people living longer, healthier and more interconnected lives than ever before.
81 See the 2009 Leaders’ Declaration of the 17th APEC Economic Leaders’ Meeting, “Sustaining growth, connecting the region”, Singapore, 14-15 November 2009. Available from www.apec.org/apec/leaders__declarations/2009.html (accessed 14 Apr. 2010).
82 The developing economies of Asia and the Pacific are all the economies in the region with the exceptions of Australia, Japan and New Zealand.
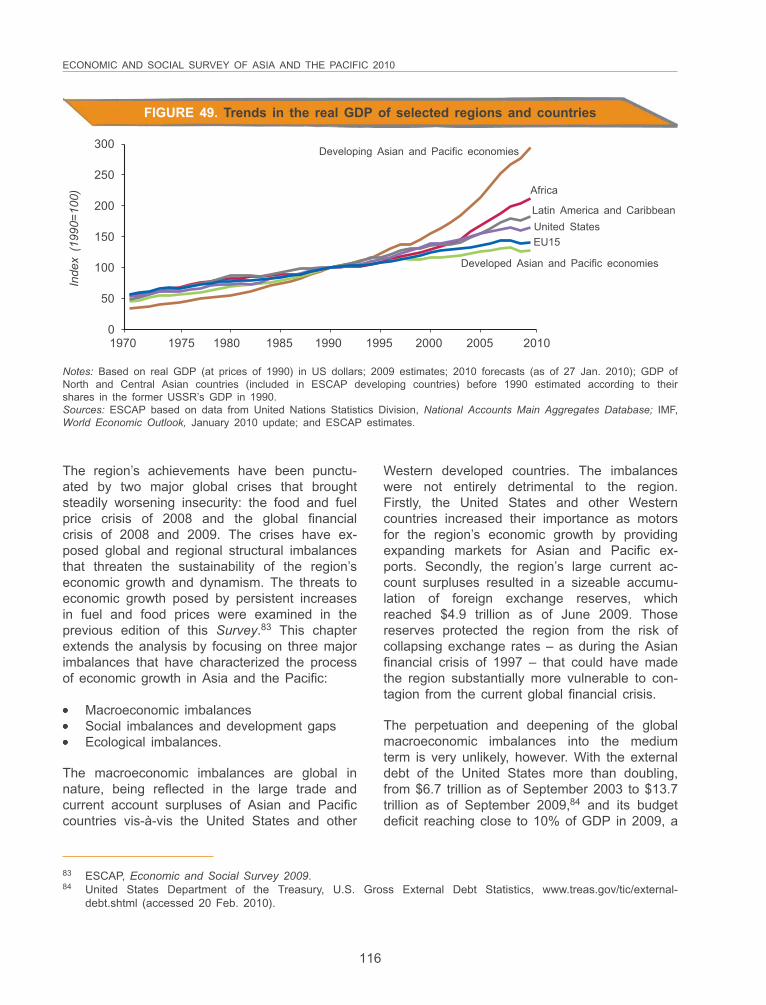
ECONOMIC AND SOCIAL SURVEY OF ASIA AND THE PACIFIC 2010
116
FIGURE 49. Trends in the real GDP of selected regions and countries
300
250
200
150
100
50
0
Inde
x (1
990=
100)
1970 1975 1980 1985 1990 1995 2000 2005 2010
Developing Asian and Pacific economies
Africa
Latin America and CaribbeanUnited StatesEU15
Developed Asian and Pacific economies
Notes: Based on real GDP (at prices of 1990) in US dollars; 2009 estimates; 2010 forecasts (as of 27 Jan. 2010); GDP ofNorth and Central Asian countries (included in ESCAP developing countries) before 1990 estimated according to theirshares in the former USSR’s GDP in 1990.Sources: ESCAP based on data from United Nations Statistics Division, National Accounts Main Aggregates Database; IMF,World Economic Outlook, January 2010 update; and ESCAP estimates.
83 ESCAP, Economic and Social Survey 2009.84 United States Department of the Treasury, U.S. Gross External Debt Statistics, www.treas.gov/tic/external-
debt.shtml (accessed 20 Feb. 2010).
The region’s achievements have been punctu-ated by two major global crises that broughtsteadily worsening insecurity: the food and fuelprice crisis of 2008 and the global financialcrisis of 2008 and 2009. The crises have ex-posed global and regional structural imbalancesthat threaten the sustainability of the region’seconomic growth and dynamism. The threats toeconomic growth posed by persistent increasesin fuel and food prices were examined in theprevious edition of this Survey.83 This chapterextends the analysis by focusing on three majorimbalances that have characterized the processof economic growth in Asia and the Pacific:
••••• Macroeconomic imbalances••••• Social imbalances and development gaps••••• Ecological imbalances.
The macroeconomic imbalances are global innature, being reflected in the large trade andcurrent account surpluses of Asian and Pacificcountries vis-à-vis the United States and other
Western developed countries. The imbalanceswere not entirely detrimental to the region.Firstly, the United States and other Westerncountries increased their importance as motorsfor the region’s economic growth by providingexpanding markets for Asian and Pacific ex-ports. Secondly, the region’s large current ac-count surpluses resulted in a sizeable accumu-lation of foreign exchange reserves, whichreached $4.9 trillion as of June 2009. Thosereserves protected the region from the risk ofcollapsing exchange rates – as during the Asianfinancial crisis of 1997 – that could have madethe region substantially more vulnerable to con-tagion from the current global financial crisis.
The perpetuation and deepening of the globalmacroeconomic imbalances into the mediumterm is very unlikely, however. With the externaldebt of the United States more than doubling,from $6.7 trillion as of September 2003 to $13.7trillion as of September 2009,84 and its budgetdeficit reaching close to 10% of GDP in 2009, a
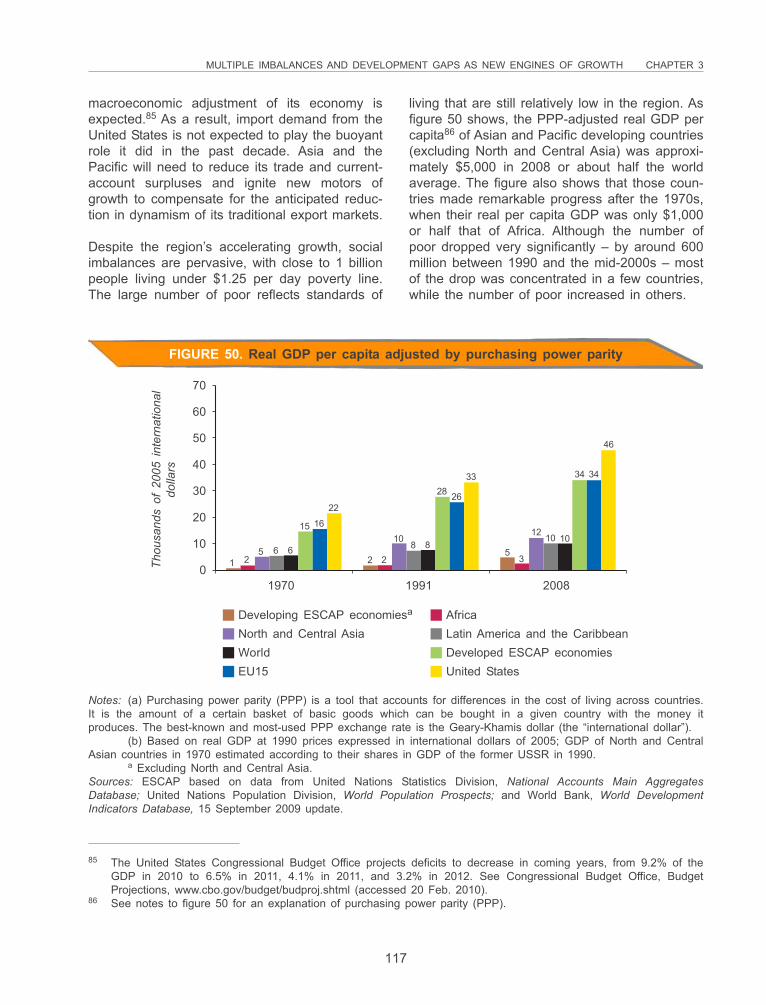
MULTIPLE IMBALANCES AND DEVELOPMENT GAPS AS NEW ENGINES OF GROWTH CHAPTER 3
117
85 The United States Congressional Budget Office projects deficits to decrease in coming years, from 9.2% of theGDP in 2010 to 6.5% in 2011, 4.1% in 2011, and 3.2% in 2012. See Congressional Budget Office, BudgetProjections, www.cbo.gov/budget/budproj.shtml (accessed 20 Feb. 2010).
86 See notes to figure 50 for an explanation of purchasing power parity (PPP).
70
60
50
40
30
20
10
0Thou
sand
s of
200
5 in
tern
atio
nal
dolla
rs
1970 1991 2008
1 25 6 6
15 16
22
2 2
108 8
28 26
33
53
12 10 10
34 34
46
Developing ESCAP economiesa
North and Central AsiaWorldEU15
AfricaLatin America and the CaribbeanDeveloped ESCAP economiesUnited States
Notes: (a) Purchasing power parity (PPP) is a tool that accounts for differences in the cost of living across countries.It is the amount of a certain basket of basic goods which can be bought in a given country with the money itproduces. The best-known and most-used PPP exchange rate is the Geary-Khamis dollar (the “international dollar”).
(b) Based on real GDP at 1990 prices expressed in international dollars of 2005; GDP of North and CentralAsian countries in 1970 estimated according to their shares in GDP of the former USSR in 1990.
a Excluding North and Central Asia.Sources: ESCAP based on data from United Nations Statistics Division, National Accounts Main AggregatesDatabase; United Nations Population Division, World Population Prospects; and World Bank, World DevelopmentIndicators Database, 15 September 2009 update.
FIGURE 50. Real GDP per capita adjusted by purchasing power parity
macroeconomic adjustment of its economy isexpected.85 As a result, import demand from theUnited States is not expected to play the buoyantrole it did in the past decade. Asia and thePacific will need to reduce its trade and current-account surpluses and ignite new motors ofgrowth to compensate for the anticipated reduc-tion in dynamism of its traditional export markets.
Despite the region’s accelerating growth, socialimbalances are pervasive, with close to 1 billionpeople living under $1.25 per day poverty line.The large number of poor reflects standards of
living that are still relatively low in the region. Asfigure 50 shows, the PPP-adjusted real GDP percapita86 of Asian and Pacific developing countries(excluding North and Central Asia) was approxi-mately $5,000 in 2008 or about half the worldaverage. The figure also shows that those coun-tries made remarkable progress after the 1970s,when their real per capita GDP was only $1,000or half that of Africa. Although the number ofpoor dropped very significantly – by around 600million between 1990 and the mid-2000s – mostof the drop was concentrated in a few countries,while the number of poor increased in others.
ECONOMIC AND SOCIAL SURVEY OF ASIA AND THE PACIFIC 2010
118
Reducing poverty and making the fruits of eco-nomic prosperity available for the population atlarge is not only a moral imperative but is theultimate purpose of economic development. Inthe case of the Asia-Pacific region, the sheernumber of poor represents a potential marketlarger than the European Union and the UnitedStates combined. If social and infrastructuralinvestments in the region contribute to providingemployment and business opportunities for thepoor, their additional demand has the potentialfor not only preserving the dynamism of theregion’s growth but also providing a growthengine for the global economy.
nesses and employment in promising “neweconomy” industries. The preservation of naturalresources could lead to the generation of “greenjobs”. Moreover, because the poor are morelikely to live in ecologically vulnerable areas anddepend on the availability of natural resourcesto make a living, addressing the ecological im-balances of growth in Asia and the Pacificwould make a substantial contribution to theobjective of reducing poverty.
Import demand from the United Statesis not expected to play the buoyant
role it did in the past decade
The ecological imbalances are reflected in thedegradation of key natural resources such asforests and freshwater, in unsustainable uses ofenergy and in fast growth of carbon emissions.Although the impacts of those imbalances arenot immediately apparent, they pose formidablechallenges to the sustainability of economicgrowth into the long run. Forests, for instance,offer a natural protection from landslides, floodsand soil depletion which lead to desertificationand lower agricultural yields. Agricultural yieldsare also suffering as a result of the increasedfrequency of droughts and other extremeweather events associated with climate change.Thus, as the demand for food grows in tandemwith the population, measures need to be takento protect the natural capital. Investing in R&Dand rural infrastructure is also necessary inorder to increase agricultural yields.
Besides its critical role in supporting the long-run sustainability of economic growth of theregion, addressing the ecological imbalancescould also provide an additional motor forgrowth and help alleviate poverty. For instance,promoting investments in renewable energy andin technologies to improve energy efficiencycould create opportunities for innovations, busi-
Asia-Pacific’s poor constitute a potentialmarket larger than the European Union
and the United States. If social andinfrastructural investments in the region
create employment and businessopportunities for them, their demand
for goods and services can notonly preserve the region’s dynamism
but also provide a growthengine to the world
In sum, sustaining economic growth in the Asia-Pacific region beyond the current recovery callsfor addressing fundamental macroeconomic, so-cial and ecological imbalances. As anticipatedabove and explained in greater detail in the restof the chapter, there are important synergiesacross policies that address each of the imbal-ances. The best option for the region would bean integrated approach that takes into accountthe impacts of policy measures on the threeimbalances and gives the highest priority tothose policies that simultaneously address morethan one imbalance.
MACROECONOMIC IMBALANCES
Prior to the global financial crisis that began in2008, the world economy was characterized byrecord large trade and current account imbal-ances among major trading partners. TheUnited States current account deficit increasedmoderately from 1991 to 1997, reaching 1.7%of the GDP in 1997; after that year it soared to
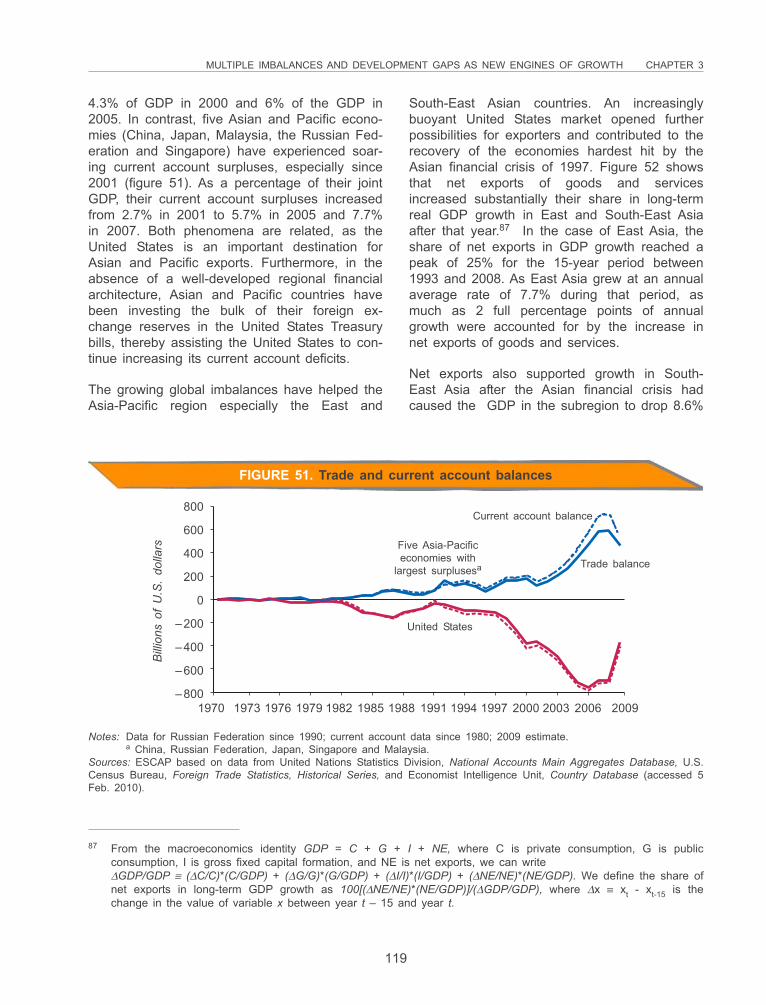
MULTIPLE IMBALANCES AND DEVELOPMENT GAPS AS NEW ENGINES OF GROWTH CHAPTER 3
119
87 From the macroeconomics identity GDP = C + G + I + NE, where C is private consumption, G is publicconsumption, I is gross fixed capital formation, and NE is net exports, we can writeΔGDP/GDP ≡ (ΔC/C)*(C/GDP) + (ΔG/G)*(G/GDP) + (ΔI/I)*(I/GDP) + (ΔNE/NE)*(NE/GDP). We define the share ofnet exports in long-term GDP growth as 100[(ΔNE/NE)*(NE/GDP)]/(ΔGDP/GDP), where Δx ≡ xt - xt-15 is thechange in the value of variable x between year t – 15 and year t.
4.3% of GDP in 2000 and 6% of the GDP in2005. In contrast, five Asian and Pacific econo-mies (China, Japan, Malaysia, the Russian Fed-eration and Singapore) have experienced soar-ing current account surpluses, especially since2001 (figure 51). As a percentage of their jointGDP, their current account surpluses increasedfrom 2.7% in 2001 to 5.7% in 2005 and 7.7%in 2007. Both phenomena are related, as theUnited States is an important destination forAsian and Pacific exports. Furthermore, in theabsence of a well-developed regional financialarchitecture, Asian and Pacific countries havebeen investing the bulk of their foreign ex-change reserves in the United States Treasurybills, thereby assisting the United States to con-tinue increasing its current account deficits.
The growing global imbalances have helped theAsia-Pacific region especially the East and
South-East Asian countries. An increasinglybuoyant United States market opened furtherpossibilities for exporters and contributed to therecovery of the economies hardest hit by theAsian financial crisis of 1997. Figure 52 showsthat net exports of goods and servicesincreased substantially their share in long-termreal GDP growth in East and South-East Asiaafter that year.87 In the case of East Asia, theshare of net exports in GDP growth reached apeak of 25% for the 15-year period between1993 and 2008. As East Asia grew at an annualaverage rate of 7.7% during that period, asmuch as 2 full percentage points of annualgrowth were accounted for by the increase innet exports of goods and services.
Net exports also supported growth in South-East Asia after the Asian financial crisis hadcaused the GDP in the subregion to drop 8.6%
800
600
400
200
0
–200
–400
–600
–800
Bill
ions
of
U.S
. do
llars
Current account balance
Trade balance
Five Asia-Pacificeconomies with
largest surplusesa
United States
1970 1973 1976 1979 1982 1985 1988 1991 1994 1997 2000 2003 2006 2009
FIGURE 51. Trade and current account balances
Notes: Data for Russian Federation since 1990; current account data since 1980; 2009 estimate.a China, Russian Federation, Japan, Singapore and Malaysia.
Sources: ESCAP based on data from United Nations Statistics Division, National Accounts Main Aggregates Database, U.S.Census Bureau, Foreign Trade Statistics, Historical Series, and Economist Intelligence Unit, Country Database (accessed 5Feb. 2010).
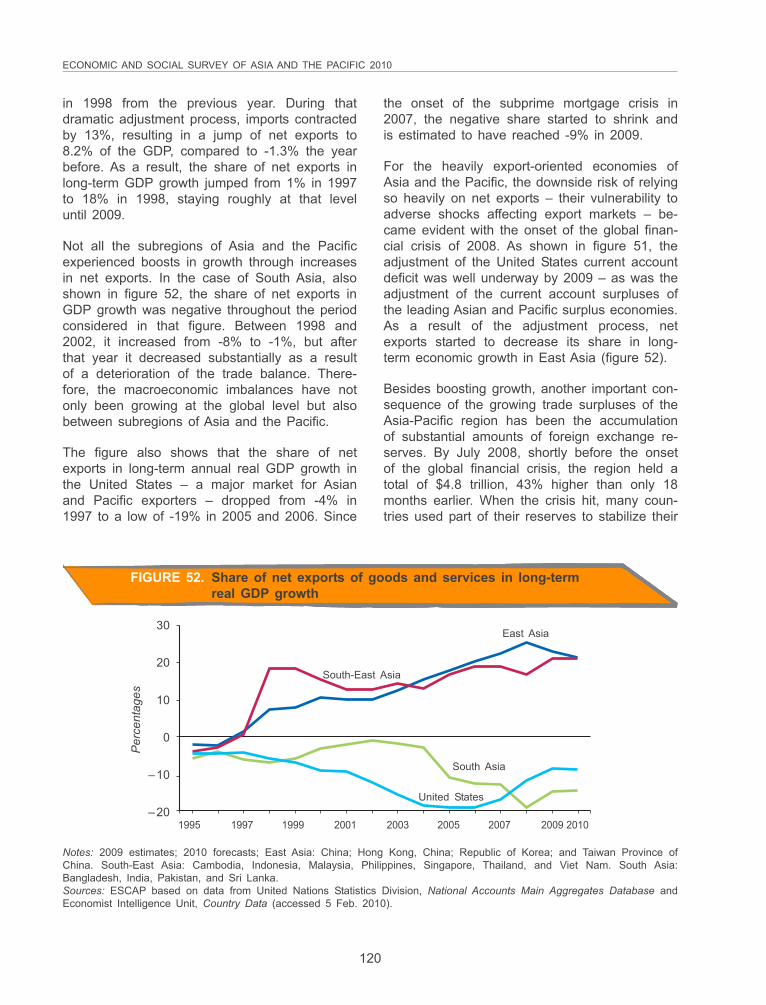
ECONOMIC AND SOCIAL SURVEY OF ASIA AND THE PACIFIC 2010
120
30
20
10
0
–10
–20
Per
cent
ages
South-East Asia
East Asia
United States
South Asia
1995 1997 1999 2001 2003 2005 2007 2009 2010
FIGURE 52. Share of net exports of goods and services in long-termreal GDP growth
Notes: 2009 estimates; 2010 forecasts; East Asia: China; Hong Kong, China; Republic of Korea; and Taiwan Province ofChina. South-East Asia: Cambodia, Indonesia, Malaysia, Philippines, Singapore, Thailand, and Viet Nam. South Asia:Bangladesh, India, Pakistan, and Sri Lanka.Sources: ESCAP based on data from United Nations Statistics Division, National Accounts Main Aggregates Database andEconomist Intelligence Unit, Country Data (accessed 5 Feb. 2010).
in 1998 from the previous year. During thatdramatic adjustment process, imports contractedby 13%, resulting in a jump of net exports to8.2% of the GDP, compared to -1.3% the yearbefore. As a result, the share of net exports inlong-term GDP growth jumped from 1% in 1997to 18% in 1998, staying roughly at that leveluntil 2009.
Not all the subregions of Asia and the Pacificexperienced boosts in growth through increasesin net exports. In the case of South Asia, alsoshown in figure 52, the share of net exports inGDP growth was negative throughout the periodconsidered in that figure. Between 1998 and2002, it increased from -8% to -1%, but afterthat year it decreased substantially as a resultof a deterioration of the trade balance. There-fore, the macroeconomic imbalances have notonly been growing at the global level but alsobetween subregions of Asia and the Pacific.
The figure also shows that the share of netexports in long-term annual real GDP growth inthe United States – a major market for Asianand Pacific exporters – dropped from -4% in1997 to a low of -19% in 2005 and 2006. Since
the onset of the subprime mortgage crisis in2007, the negative share started to shrink andis estimated to have reached -9% in 2009.
For the heavily export-oriented economies ofAsia and the Pacific, the downside risk of relyingso heavily on net exports – their vulnerability toadverse shocks affecting export markets – be-came evident with the onset of the global finan-cial crisis of 2008. As shown in figure 51, theadjustment of the United States current accountdeficit was well underway by 2009 – as was theadjustment of the current account surpluses ofthe leading Asian and Pacific surplus economies.As a result of the adjustment process, netexports started to decrease its share in long-term economic growth in East Asia (figure 52).
Besides boosting growth, another important con-sequence of the growing trade surpluses of theAsia-Pacific region has been the accumulationof substantial amounts of foreign exchange re-serves. By July 2008, shortly before the onsetof the global financial crisis, the region held atotal of $4.8 trillion, 43% higher than only 18months earlier. When the crisis hit, many coun-tries used part of their reserves to stabilize their
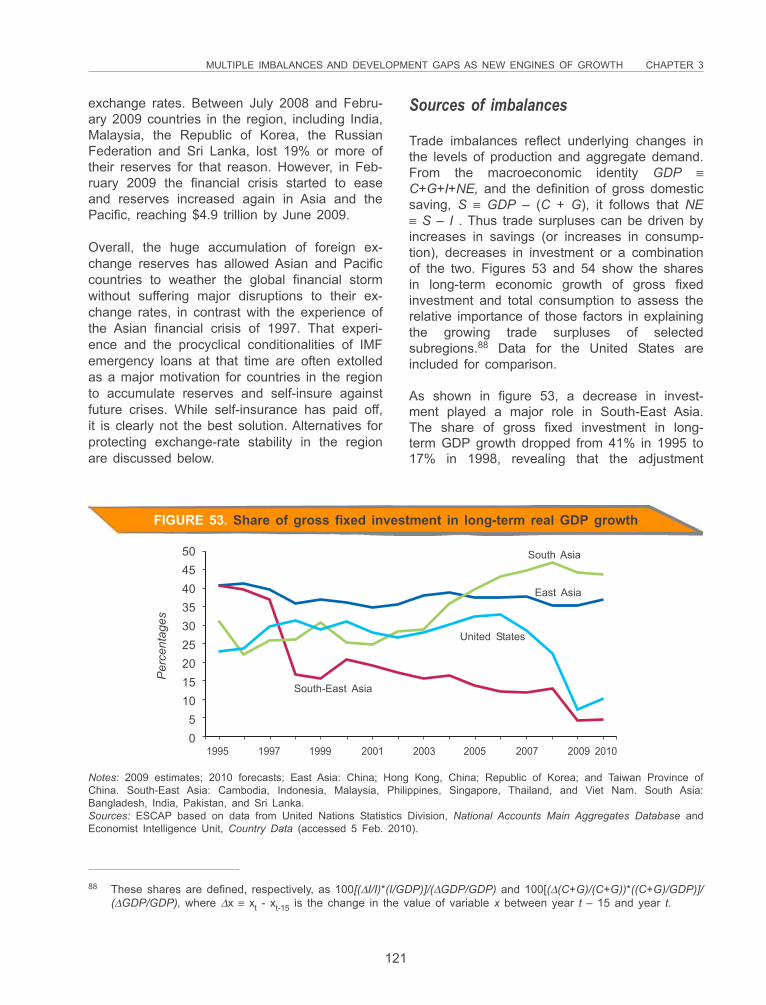
MULTIPLE IMBALANCES AND DEVELOPMENT GAPS AS NEW ENGINES OF GROWTH CHAPTER 3
121
504540353025201510
50
Per
cent
ages
South-East Asia
East Asia
United States
South Asia
1995 1997 1999 2001 2003 2005 2007 2009 2010
FIGURE 53. Share of gross fixed investment in long-term real GDP growth
Notes: 2009 estimates; 2010 forecasts; East Asia: China; Hong Kong, China; Republic of Korea; and Taiwan Province ofChina. South-East Asia: Cambodia, Indonesia, Malaysia, Philippines, Singapore, Thailand, and Viet Nam. South Asia:Bangladesh, India, Pakistan, and Sri Lanka.Sources: ESCAP based on data from United Nations Statistics Division, National Accounts Main Aggregates Database andEconomist Intelligence Unit, Country Data (accessed 5 Feb. 2010).
88 These shares are defined, respectively, as 100[(ΔI/I)*(I/GDP)]/(ΔGDP/GDP) and 100[(Δ(C+G)/(C+G))*((C+G)/GDP)]/(ΔGDP/GDP), where Δx ≡ xt - xt-15 is the change in the value of variable x between year t – 15 and year t.
exchange rates. Between July 2008 and Febru-ary 2009 countries in the region, including India,Malaysia, the Republic of Korea, the RussianFederation and Sri Lanka, lost 19% or more oftheir reserves for that reason. However, in Feb-ruary 2009 the financial crisis started to easeand reserves increased again in Asia and thePacific, reaching $4.9 trillion by June 2009.
Overall, the huge accumulation of foreign ex-change reserves has allowed Asian and Pacificcountries to weather the global financial stormwithout suffering major disruptions to their ex-change rates, in contrast with the experience ofthe Asian financial crisis of 1997. That experi-ence and the procyclical conditionalities of IMFemergency loans at that time are often extolledas a major motivation for countries in the regionto accumulate reserves and self-insure againstfuture crises. While self-insurance has paid off,it is clearly not the best solution. Alternatives forprotecting exchange-rate stability in the regionare discussed below.
Sources of imbalances
Trade imbalances reflect underlying changes inthe levels of production and aggregate demand.From the macroeconomic identity GDP ≡C+G+I+NE, and the definition of gross domesticsaving, S ≡ GDP – (C + G), it follows that NE≡ S – I . Thus trade surpluses can be driven byincreases in savings (or increases in consump-tion), decreases in investment or a combinationof the two. Figures 53 and 54 show the sharesin long-term economic growth of gross fixedinvestment and total consumption to assess therelative importance of those factors in explainingthe growing trade surpluses of selectedsubregions.88 Data for the United States areincluded for comparison.
As shown in figure 53, a decrease in invest-ment played a major role in South-East Asia.The share of gross fixed investment in long-term GDP growth dropped from 41% in 1995 to17% in 1998, revealing that the adjustment
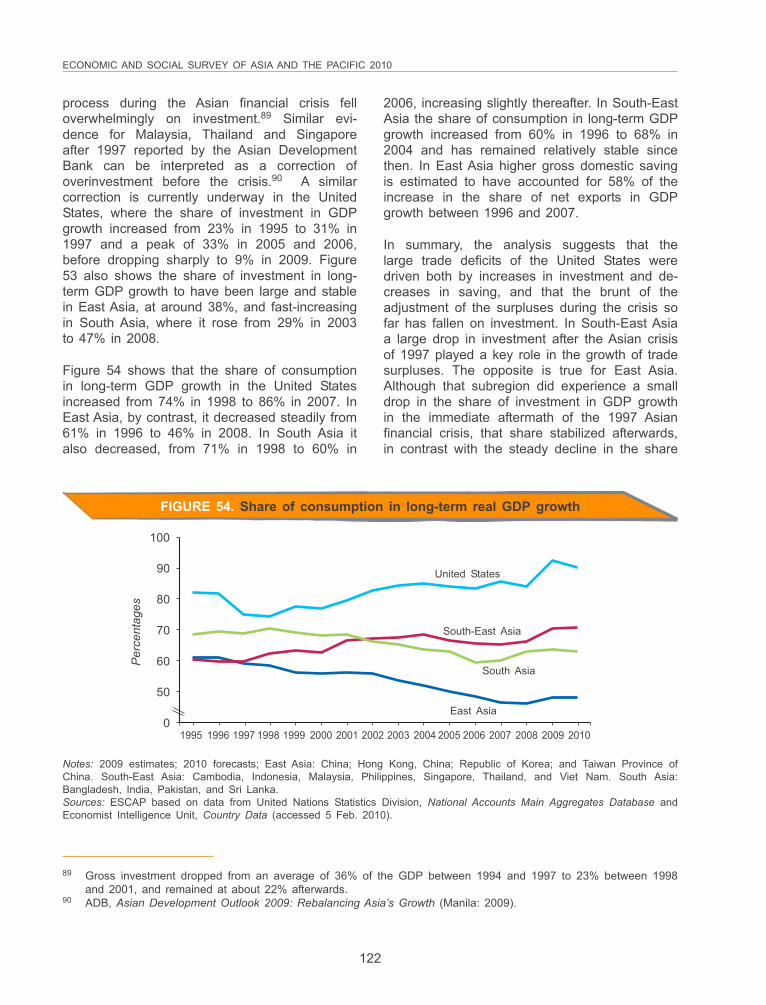
ECONOMIC AND SOCIAL SURVEY OF ASIA AND THE PACIFIC 2010
122
process during the Asian financial crisis felloverwhelmingly on investment.89 Similar evi-dence for Malaysia, Thailand and Singaporeafter 1997 reported by the Asian DevelopmentBank can be interpreted as a correction ofoverinvestment before the crisis.90 A similarcorrection is currently underway in the UnitedStates, where the share of investment in GDPgrowth increased from 23% in 1995 to 31% in1997 and a peak of 33% in 2005 and 2006,before dropping sharply to 9% in 2009. Figure53 also shows the share of investment in long-term GDP growth to have been large and stablein East Asia, at around 38%, and fast-increasingin South Asia, where it rose from 29% in 2003to 47% in 2008.
Figure 54 shows that the share of consumptionin long-term GDP growth in the United Statesincreased from 74% in 1998 to 86% in 2007. InEast Asia, by contrast, it decreased steadily from61% in 1996 to 46% in 2008. In South Asia italso decreased, from 71% in 1998 to 60% in
2006, increasing slightly thereafter. In South-EastAsia the share of consumption in long-term GDPgrowth increased from 60% in 1996 to 68% in2004 and has remained relatively stable sincethen. In East Asia higher gross domestic savingis estimated to have accounted for 58% of theincrease in the share of net exports in GDPgrowth between 1996 and 2007.
In summary, the analysis suggests that thelarge trade deficits of the United States weredriven both by increases in investment and de-creases in saving, and that the brunt of theadjustment of the surpluses during the crisis sofar has fallen on investment. In South-East Asiaa large drop in investment after the Asian crisisof 1997 played a key role in the growth of tradesurpluses. The opposite is true for East Asia.Although that subregion did experience a smalldrop in the share of investment in GDP growthin the immediate aftermath of the 1997 Asianfinancial crisis, that share stabilized afterwards,in contrast with the steady decline in the share
100
90
80
70
60
50
0
Per
cent
ages
South-East Asia
East Asia
United States
South Asia
1995 1996 1997 1998 1999 2000 2001 2002 2003 2004 2005 2006 2007 2008 2009 2010
Notes: 2009 estimates; 2010 forecasts; East Asia: China; Hong Kong, China; Republic of Korea; and Taiwan Province ofChina. South-East Asia: Cambodia, Indonesia, Malaysia, Philippines, Singapore, Thailand, and Viet Nam. South Asia:Bangladesh, India, Pakistan, and Sri Lanka.Sources: ESCAP based on data from United Nations Statistics Division, National Accounts Main Aggregates Database andEconomist Intelligence Unit, Country Data (accessed 5 Feb. 2010).
FIGURE 54. Share of consumption in long-term real GDP growth
89 Gross investment dropped from an average of 36% of the GDP between 1994 and 1997 to 23% between 1998and 2001, and remained at about 22% afterwards.
90 ADB, Asian Development Outlook 2009: Rebalancing Asia’s Growth (Manila: 2009).
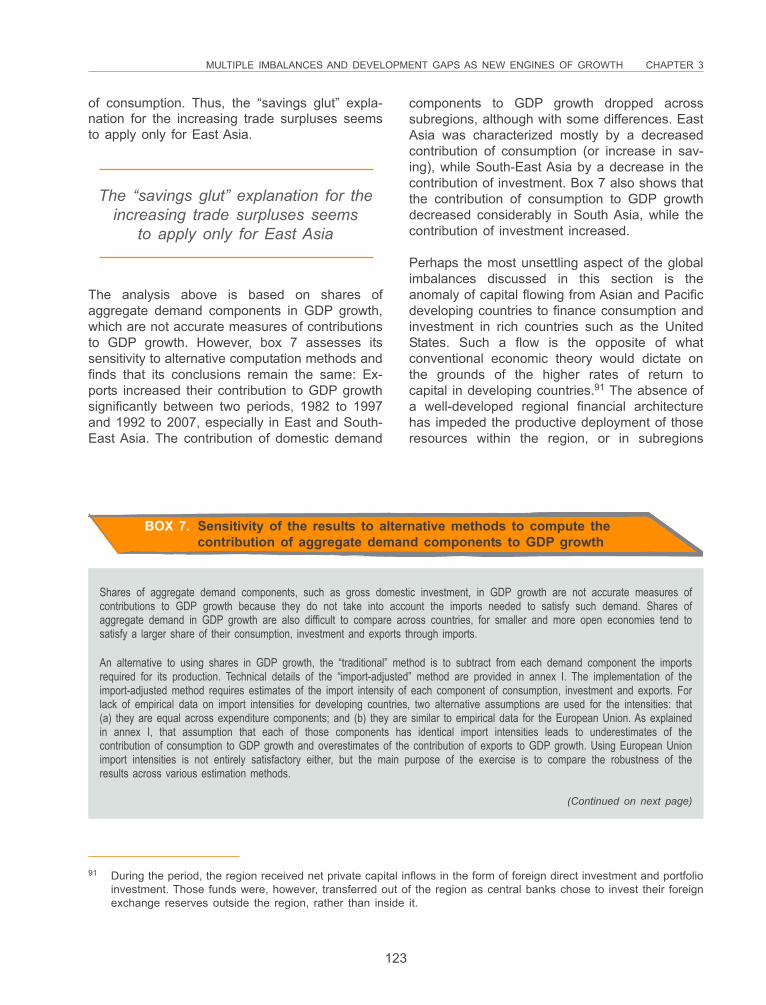
MULTIPLE IMBALANCES AND DEVELOPMENT GAPS AS NEW ENGINES OF GROWTH CHAPTER 3
123
of consumption. Thus, the “savings glut” expla-nation for the increasing trade surpluses seemsto apply only for East Asia.
components to GDP growth dropped acrosssubregions, although with some differences. EastAsia was characterized mostly by a decreasedcontribution of consumption (or increase in sav-ing), while South-East Asia by a decrease in thecontribution of investment. Box 7 also shows thatthe contribution of consumption to GDP growthdecreased considerably in South Asia, while thecontribution of investment increased.
Perhaps the most unsettling aspect of the globalimbalances discussed in this section is theanomaly of capital flowing from Asian and Pacificdeveloping countries to finance consumption andinvestment in rich countries such as the UnitedStates. Such a flow is the opposite of whatconventional economic theory would dictate onthe grounds of the higher rates of return tocapital in developing countries.91 The absence ofa well-developed regional financial architecturehas impeded the productive deployment of thoseresources within the region, or in subregions
The “savings glut” explanation for theincreasing trade surpluses seems
to apply only for East Asia
The analysis above is based on shares ofaggregate demand components in GDP growth,which are not accurate measures of contributionsto GDP growth. However, box 7 assesses itssensitivity to alternative computation methods andfinds that its conclusions remain the same: Ex-ports increased their contribution to GDP growthsignificantly between two periods, 1982 to 1997and 1992 to 2007, especially in East and South-East Asia. The contribution of domestic demand
BOX 7. Sensitivity of the results to alternative methods to compute thecontribution of aggregate demand components to GDP growth
Shares of aggregate demand components, such as gross domestic investment, in GDP growth are not accurate measures ofcontributions to GDP growth because they do not take into account the imports needed to satisfy such demand. Shares ofaggregate demand in GDP growth are also difficult to compare across countries, for smaller and more open economies tend tosatisfy a larger share of their consumption, investment and exports through imports.
An alternative to using shares in GDP growth, the “traditional” method is to subtract from each demand component the importsrequired for its production. Technical details of the “import-adjusted” method are provided in annex I. The implementation of theimport-adjusted method requires estimates of the import intensity of each component of consumption, investment and exports. Forlack of empirical data on import intensities for developing countries, two alternative assumptions are used for the intensities: that(a) they are equal across expenditure components; and (b) they are similar to empirical data for the European Union. As explainedin annex I, that assumption that each of those components has identical import intensities leads to underestimates of thecontribution of consumption to GDP growth and overestimates of the contribution of exports to GDP growth. Using European Unionimport intensities is not entirely satisfactory either, but the main purpose of the exercise is to compare the robustness of theresults across various estimation methods.
(Continued on next page)
91 During the period, the region received net private capital inflows in the form of foreign direct investment and portfolioinvestment. Those funds were, however, transferred out of the region as central banks chose to invest their foreignexchange reserves outside the region, rather than inside it.
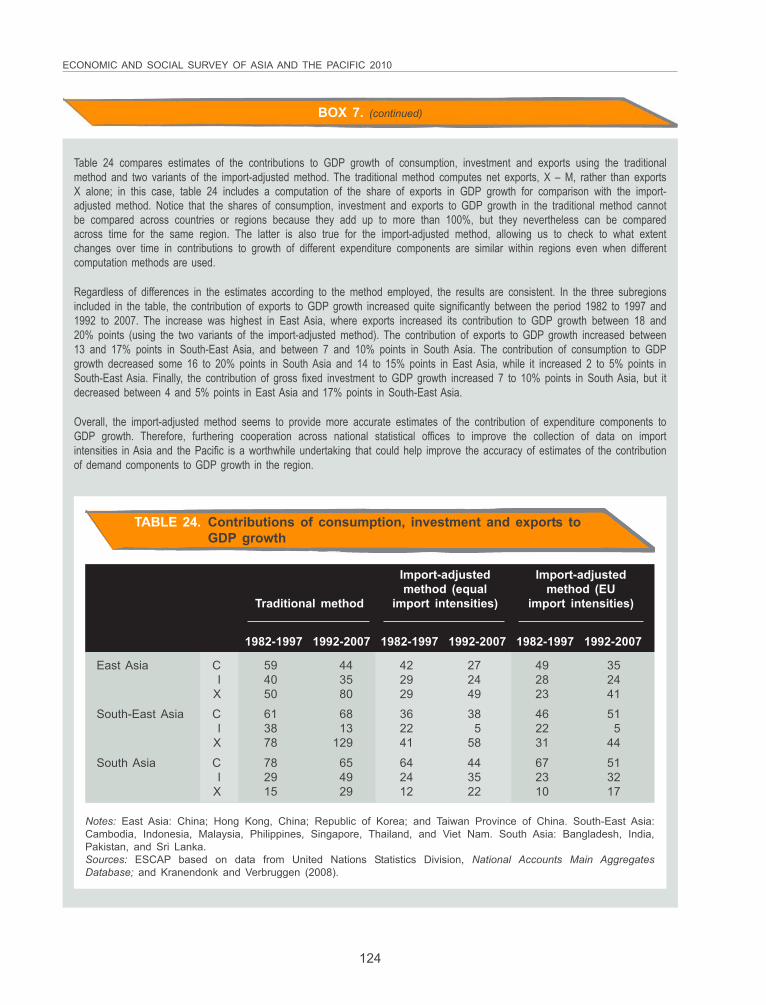
ECONOMIC AND SOCIAL SURVEY OF ASIA AND THE PACIFIC 2010
124
BOX 7. (continued)
Table 24 compares estimates of the contributions to GDP growth of consumption, investment and exports using the traditionalmethod and two variants of the import-adjusted method. The traditional method computes net exports, X – M, rather than exportsX alone; in this case, table 24 includes a computation of the share of exports in GDP growth for comparison with the import-adjusted method. Notice that the shares of consumption, investment and exports to GDP growth in the traditional method cannotbe compared across countries or regions because they add up to more than 100%, but they nevertheless can be comparedacross time for the same region. The latter is also true for the import-adjusted method, allowing us to check to what extentchanges over time in contributions to growth of different expenditure components are similar within regions even when differentcomputation methods are used.
Regardless of differences in the estimates according to the method employed, the results are consistent. In the three subregionsincluded in the table, the contribution of exports to GDP growth increased quite significantly between the period 1982 to 1997 and1992 to 2007. The increase was highest in East Asia, where exports increased its contribution to GDP growth between 18 and20% points (using the two variants of the import-adjusted method). The contribution of exports to GDP growth increased between13 and 17% points in South-East Asia, and between 7 and 10% points in South Asia. The contribution of consumption to GDPgrowth decreased some 16 to 20% points in South Asia and 14 to 15% points in East Asia, while it increased 2 to 5% points inSouth-East Asia. Finally, the contribution of gross fixed investment to GDP growth increased 7 to 10% points in South Asia, but itdecreased between 4 and 5% points in East Asia and 17% points in South-East Asia.
Overall, the import-adjusted method seems to provide more accurate estimates of the contribution of expenditure components toGDP growth. Therefore, furthering cooperation across national statistical offices to improve the collection of data on importintensities in Asia and the Pacific is a worthwhile undertaking that could help improve the accuracy of estimates of the contributionof demand components to GDP growth in the region.
TABLE 24. Contributions of consumption, investment and exports toGDP growth
Import-adjusted Import-adjustedmethod (equal method (EU
Traditional method import intensities) import intensities)
1982-1997 1992-2007 1982-1997 1992-2007 1982-1997 1992-2007
East Asia C 59 44 42 27 49 35I 40 35 29 24 28 24
X 50 80 29 49 23 41
South-East Asia C 61 68 36 38 46 51I 38 13 22 5 22 5
X 78 129 41 58 31 44
South Asia C 78 65 64 44 67 51I 29 49 24 35 23 32
X 15 29 12 22 10 17
Notes: East Asia: China; Hong Kong, China; Republic of Korea; and Taiwan Province of China. South-East Asia:Cambodia, Indonesia, Malaysia, Philippines, Singapore, Thailand, and Viet Nam. South Asia: Bangladesh, India,Pakistan, and Sri Lanka.Sources: ESCAP based on data from United Nations Statistics Division, National Accounts Main AggregatesDatabase; and Kranendonk and Verbruggen (2008).
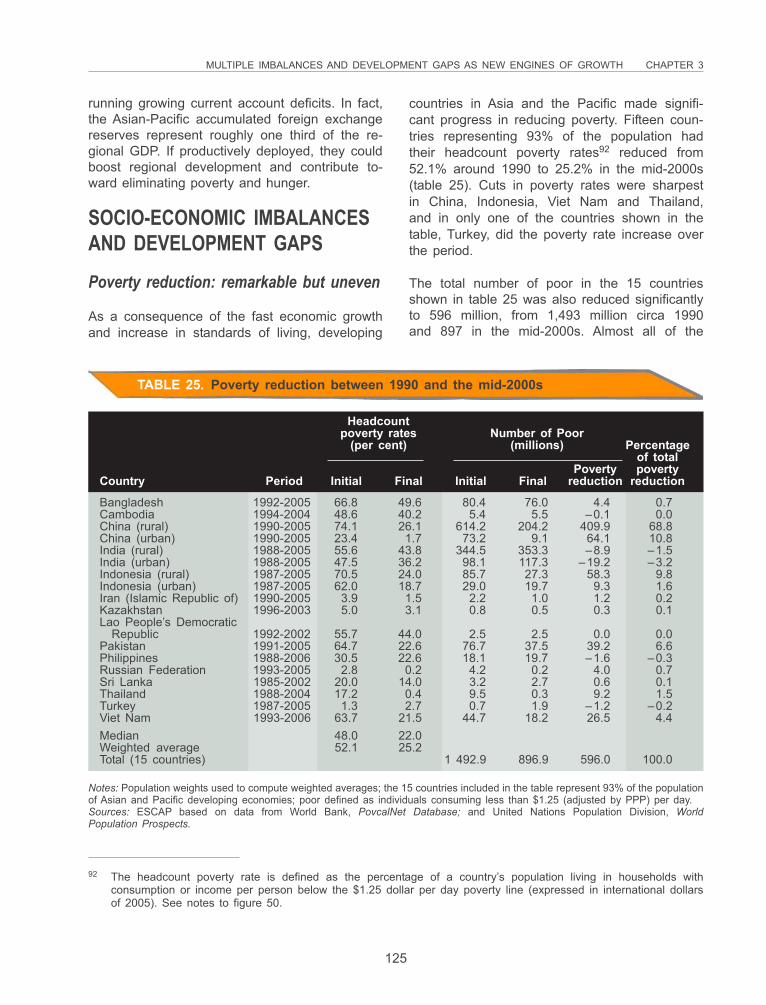
MULTIPLE IMBALANCES AND DEVELOPMENT GAPS AS NEW ENGINES OF GROWTH CHAPTER 3
125
running growing current account deficits. In fact,the Asian-Pacific accumulated foreign exchangereserves represent roughly one third of the re-gional GDP. If productively deployed, they couldboost regional development and contribute to-ward eliminating poverty and hunger.
SOCIO-ECONOMIC IMBALANCESAND DEVELOPMENT GAPSPoverty reduction: remarkable but uneven
As a consequence of the fast economic growthand increase in standards of living, developing
countries in Asia and the Pacific made signifi-cant progress in reducing poverty. Fifteen coun-tries representing 93% of the population hadtheir headcount poverty rates92 reduced from52.1% around 1990 to 25.2% in the mid-2000s(table 25). Cuts in poverty rates were sharpestin China, Indonesia, Viet Nam and Thailand,and in only one of the countries shown in thetable, Turkey, did the poverty rate increase overthe period.
The total number of poor in the 15 countriesshown in table 25 was also reduced significantlyto 596 million, from 1,493 million circa 1990and 897 in the mid-2000s. Almost all of the
TABLE 25. Poverty reduction between 1990 and the mid-2000s
Headcountpoverty rates Number of Poor
(per cent) (millions) Percentageof total
Poverty povertyCountry Period Initial Final Initial Final reduction reduction
Bangladesh 1992-2005 66.8 49.6 80.4 76.0 4.4 0.7Cambodia 1994-2004 48.6 40.2 5.4 5.5 –0.1 0.0China (rural) 1990-2005 74.1 26.1 614.2 204.2 409.9 68.8China (urban) 1990-2005 23.4 1.7 73.2 9.1 64.1 10.8India (rural) 1988-2005 55.6 43.8 344.5 353.3 –8.9 –1.5India (urban) 1988-2005 47.5 36.2 98.1 117.3 –19.2 –3.2Indonesia (rural) 1987-2005 70.5 24.0 85.7 27.3 58.3 9.8Indonesia (urban) 1987-2005 62.0 18.7 29.0 19.7 9.3 1.6Iran (Islamic Republic of) 1990-2005 3.9 1.5 2.2 1.0 1.2 0.2Kazakhstan 1996-2003 5.0 3.1 0.8 0.5 0.3 0.1Lao People’s Democratic
Republic 1992-2002 55.7 44.0 2.5 2.5 0.0 0.0Pakistan 1991-2005 64.7 22.6 76.7 37.5 39.2 6.6Philippines 1988-2006 30.5 22.6 18.1 19.7 –1.6 –0.3Russian Federation 1993-2005 2.8 0.2 4.2 0.2 4.0 0.7Sri Lanka 1985-2002 20.0 14.0 3.2 2.7 0.6 0.1Thailand 1988-2004 17.2 0.4 9.5 0.3 9.2 1.5Turkey 1987-2005 1.3 2.7 0.7 1.9 –1.2 –0.2Viet Nam 1993-2006 63.7 21.5 44.7 18.2 26.5 4.4Median 48.0 22.0Weighted average 52.1 25.2Total (15 countries) 1 492.9 896.9 596.0 100.0
Notes: Population weights used to compute weighted averages; the 15 countries included in the table represent 93% of the populationof Asian and Pacific developing economies; poor defined as individuals consuming less than $1.25 (adjusted by PPP) per day.Sources: ESCAP based on data from World Bank, PovcalNet Database; and United Nations Population Division, WorldPopulation Prospects.
92 The headcount poverty rate is defined as the percentage of a country’s population living in households withconsumption or income per person below the $1.25 dollar per day poverty line (expressed in international dollarsof 2005). See notes to figure 50.
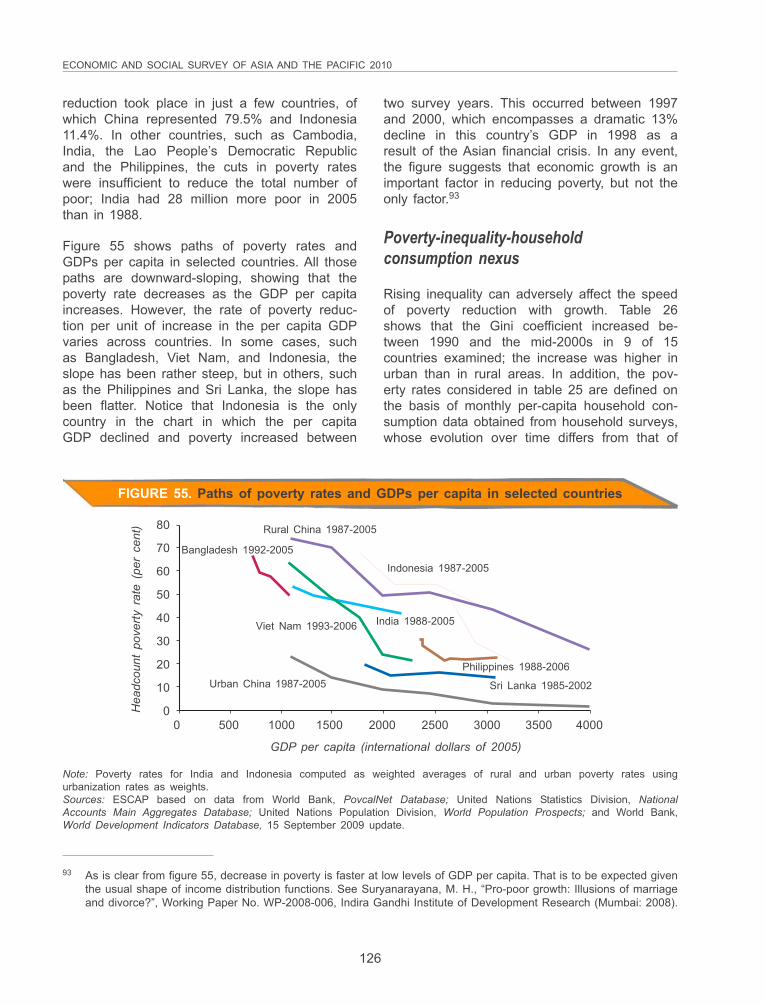
ECONOMIC AND SOCIAL SURVEY OF ASIA AND THE PACIFIC 2010
126
93 As is clear from figure 55, decrease in poverty is faster at low levels of GDP per capita. That is to be expected giventhe usual shape of income distribution functions. See Suryanarayana, M. H., “Pro-poor growth: Illusions of marriageand divorce?”, Working Paper No. WP-2008-006, Indira Gandhi Institute of Development Research (Mumbai: 2008).
reduction took place in just a few countries, ofwhich China represented 79.5% and Indonesia11.4%. In other countries, such as Cambodia,India, the Lao People’s Democratic Republicand the Philippines, the cuts in poverty rateswere insufficient to reduce the total number ofpoor; India had 28 million more poor in 2005than in 1988.
Figure 55 shows paths of poverty rates andGDPs per capita in selected countries. All thosepaths are downward-sloping, showing that thepoverty rate decreases as the GDP per capitaincreases. However, the rate of poverty reduc-tion per unit of increase in the per capita GDPvaries across countries. In some cases, suchas Bangladesh, Viet Nam, and Indonesia, theslope has been rather steep, but in others, suchas the Philippines and Sri Lanka, the slope hasbeen flatter. Notice that Indonesia is the onlycountry in the chart in which the per capitaGDP declined and poverty increased between
two survey years. This occurred between 1997and 2000, which encompasses a dramatic 13%decline in this country’s GDP in 1998 as aresult of the Asian financial crisis. In any event,the figure suggests that economic growth is animportant factor in reducing poverty, but not theonly factor.93
Poverty-inequality-householdconsumption nexus
Rising inequality can adversely affect the speedof poverty reduction with growth. Table 26shows that the Gini coefficient increased be-tween 1990 and the mid-2000s in 9 of 15countries examined; the increase was higher inurban than in rural areas. In addition, the pov-erty rates considered in table 25 are defined onthe basis of monthly per-capita household con-sumption data obtained from household surveys,whose evolution over time differs from that of
80
70
60
50
40
30
20
10
0Hea
dcou
nt p
over
ty r
ate
(per
cen
t) Rural China 1987-2005
0 500 1000 1500 2000 2500 3000 3500 4000
GDP per capita (international dollars of 2005)
Bangladesh 1992-2005
Indonesia 1987-2005
India 1988-2005Viet Nam 1993-2006
Urban China 1987-2005 Sri Lanka 1985-2002
Philippines 1988-2006
FIGURE 55. Paths of poverty rates and GDPs per capita in selected countries
Note: Poverty rates for India and Indonesia computed as weighted averages of rural and urban poverty rates usingurbanization rates as weights.Sources: ESCAP based on data from World Bank, PovcalNet Database; United Nations Statistics Division, NationalAccounts Main Aggregates Database; United Nations Population Division, World Population Prospects; and World Bank,World Development Indicators Database, 15 September 2009 update.
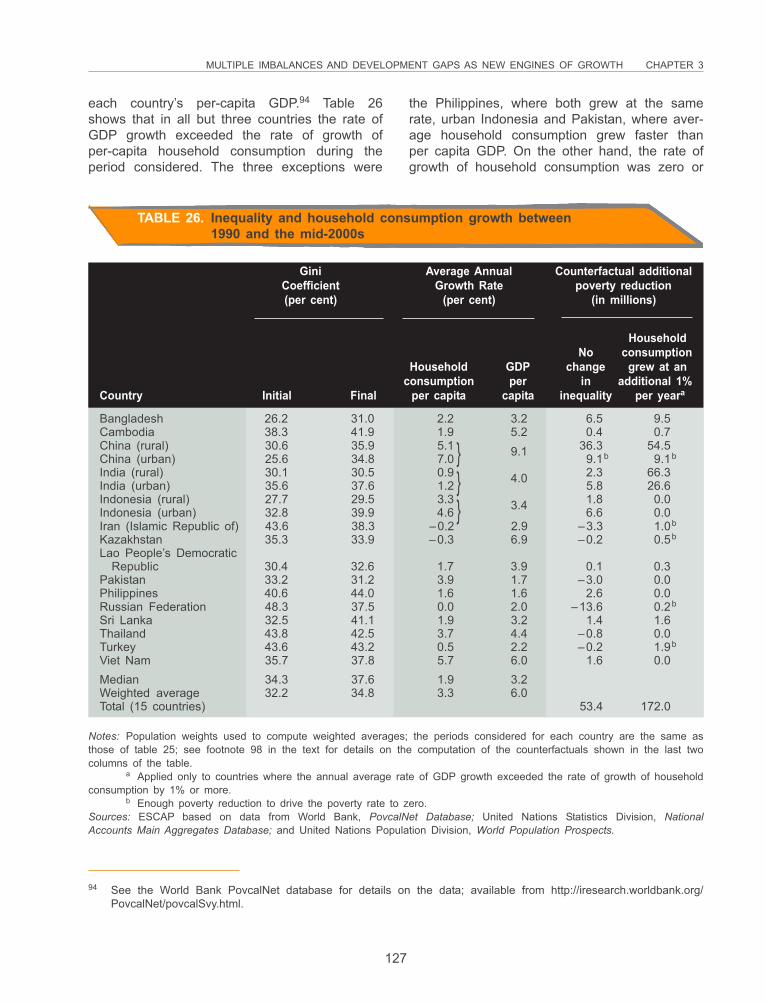
MULTIPLE IMBALANCES AND DEVELOPMENT GAPS AS NEW ENGINES OF GROWTH CHAPTER 3
127
TABLE 26. Inequality and household consumption growth between1990 and the mid-2000s
Gini Average Annual Counterfactual additionalCoefficient Growth Rate poverty reduction(per cent) (per cent) (in millions)
HouseholdNo consumption
Household GDP change grew at anconsumption per in additional 1%
Country Initial Final per capita capita inequality per yeara
Bangladesh 26.2 31.0 2.2 3.2 6.5 9.5Cambodia 38.3 41.9 1.9 5.2 0.4 0.7China (rural) 30.6 35.9 5.1 9.1 36.3 54.5China (urban) 25.6 34.8 7.0 9.1b 9.1b
India (rural) 30.1 30.5 0.9 4.0 2.3 66.3India (urban) 35.6 37.6 1.2 5.8 26.6Indonesia (rural) 27.7 29.5 3.3 3.4 1.8 0.0Indonesia (urban) 32.8 39.9 4.6 6.6 0.0Iran (Islamic Republic of) 43.6 38.3 –0.2 2.9 –3.3 1.0b
Kazakhstan 35.3 33.9 –0.3 6.9 –0.2 0.5b
Lao People’s DemocraticRepublic 30.4 32.6 1.7 3.9 0.1 0.3
Pakistan 33.2 31.2 3.9 1.7 –3.0 0.0Philippines 40.6 44.0 1.6 1.6 2.6 0.0Russian Federation 48.3 37.5 0.0 2.0 –13.6 0.2b
Sri Lanka 32.5 41.1 1.9 3.2 1.4 1.6Thailand 43.8 42.5 3.7 4.4 –0.8 0.0Turkey 43.6 43.2 0.5 2.2 –0.2 1.9b
Viet Nam 35.7 37.8 5.7 6.0 1.6 0.0Median 34.3 37.6 1.9 3.2Weighted average 32.2 34.8 3.3 6.0Total (15 countries) 53.4 172.0
Notes: Population weights used to compute weighted averages; the periods considered for each country are the same asthose of table 25; see footnote 98 in the text for details on the computation of the counterfactuals shown in the last twocolumns of the table.
a Applied only to countries where the annual average rate of GDP growth exceeded the rate of growth of householdconsumption by 1% or more.
b Enough poverty reduction to drive the poverty rate to zero.Sources: ESCAP based on data from World Bank, PovcalNet Database; United Nations Statistics Division, NationalAccounts Main Aggregates Database; and United Nations Population Division, World Population Prospects.
}}}
94 See the World Bank PovcalNet database for details on the data; available from http://iresearch.worldbank.org/PovcalNet/povcalSvy.html.
each country’s per-capita GDP.94 Table 26shows that in all but three countries the rate ofGDP growth exceeded the rate of growth ofper-capita household consumption during theperiod considered. The three exceptions were
the Philippines, where both grew at the samerate, urban Indonesia and Pakistan, where aver-age household consumption grew faster thanper capita GDP. On the other hand, the rate ofgrowth of household consumption was zero or
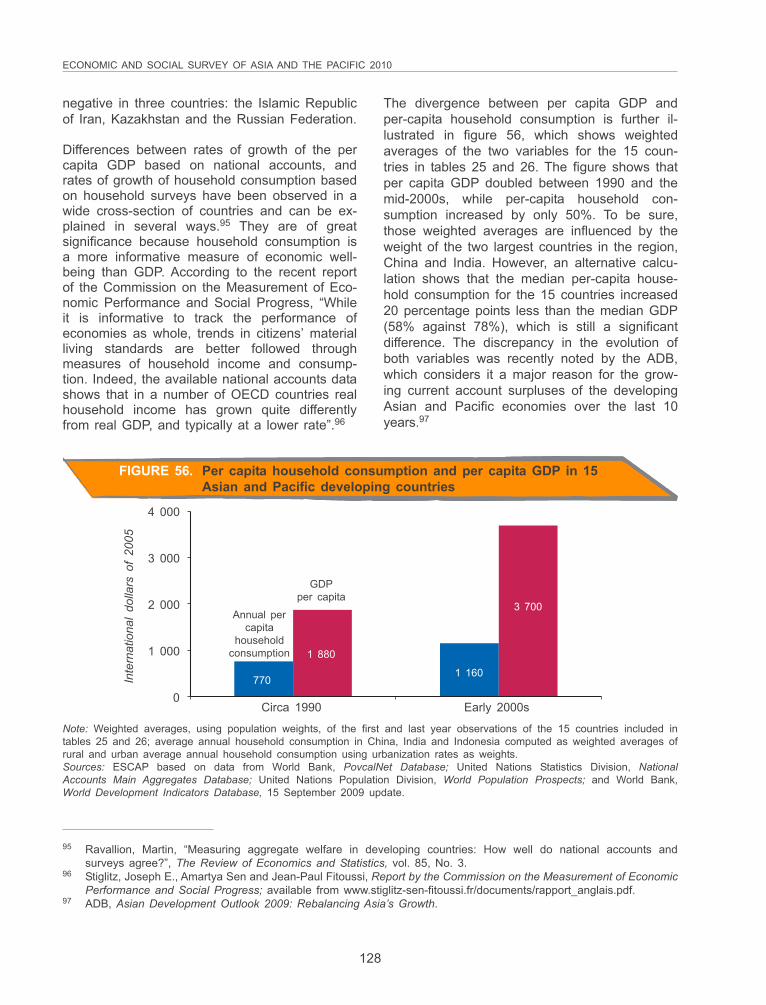
ECONOMIC AND SOCIAL SURVEY OF ASIA AND THE PACIFIC 2010
128
4 000
3 000
2 000
1 000
0
Inte
rnat
iona
l do
llars
of
2005
Annual percapita
householdconsumption
GDPper capita
770
1 880
1 160
3 700
Circa 1990 Early 2000s
FIGURE 56. Per capita household consumption and per capita GDP in 15Asian and Pacific developing countries
Note: Weighted averages, using population weights, of the first and last year observations of the 15 countries included intables 25 and 26; average annual household consumption in China, India and Indonesia computed as weighted averages ofrural and urban average annual household consumption using urbanization rates as weights.Sources: ESCAP based on data from World Bank, PovcalNet Database; United Nations Statistics Division, NationalAccounts Main Aggregates Database; United Nations Population Division, World Population Prospects; and World Bank,World Development Indicators Database, 15 September 2009 update.
negative in three countries: the Islamic Republicof Iran, Kazakhstan and the Russian Federation.
Differences between rates of growth of the percapita GDP based on national accounts, andrates of growth of household consumption basedon household surveys have been observed in awide cross-section of countries and can be ex-plained in several ways.95 They are of greatsignificance because household consumption isa more informative measure of economic well-being than GDP. According to the recent reportof the Commission on the Measurement of Eco-nomic Performance and Social Progress, “Whileit is informative to track the performance ofeconomies as whole, trends in citizens’ materialliving standards are better followed throughmeasures of household income and consump-tion. Indeed, the available national accounts datashows that in a number of OECD countries realhousehold income has grown quite differentlyfrom real GDP, and typically at a lower rate”.96
The divergence between per capita GDP andper-capita household consumption is further il-lustrated in figure 56, which shows weightedaverages of the two variables for the 15 coun-tries in tables 25 and 26. The figure shows thatper capita GDP doubled between 1990 and themid-2000s, while per-capita household con-sumption increased by only 50%. To be sure,those weighted averages are influenced by theweight of the two largest countries in the region,China and India. However, an alternative calcu-lation shows that the median per-capita house-hold consumption for the 15 countries increased20 percentage points less than the median GDP(58% against 78%), which is still a significantdifference. The discrepancy in the evolution ofboth variables was recently noted by the ADB,which considers it a major reason for the grow-ing current account surpluses of the developingAsian and Pacific economies over the last 10years.97
95 Ravallion, Martin, “Measuring aggregate welfare in developing countries: How well do national accounts andsurveys agree?”, The Review of Economics and Statistics, vol. 85, No. 3.
96 Stiglitz, Joseph E., Amartya Sen and Jean-Paul Fitoussi, Report by the Commission on the Measurement of EconomicPerformance and Social Progress; available from www.stiglitz-sen-fitoussi.fr/documents/rapport_anglais.pdf.
97 ADB, Asian Development Outlook 2009: Rebalancing Asia’s Growth.
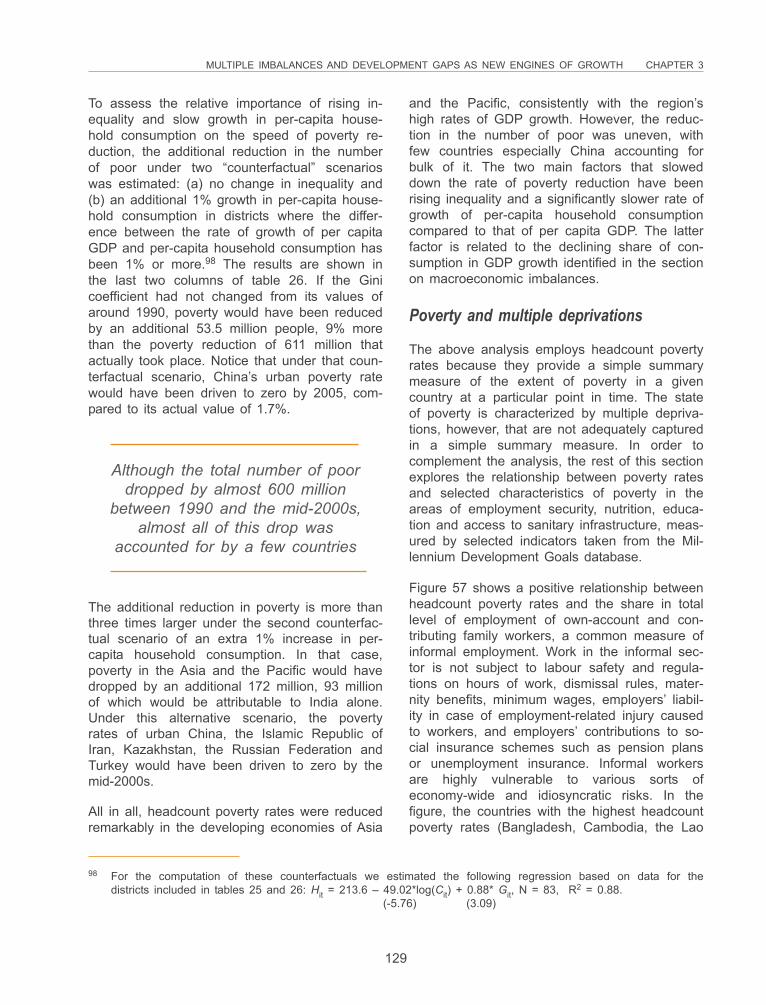
MULTIPLE IMBALANCES AND DEVELOPMENT GAPS AS NEW ENGINES OF GROWTH CHAPTER 3
129
To assess the relative importance of rising in-equality and slow growth in per-capita house-hold consumption on the speed of poverty re-duction, the additional reduction in the numberof poor under two “counterfactual” scenarioswas estimated: (a) no change in inequality and(b) an additional 1% growth in per-capita house-hold consumption in districts where the differ-ence between the rate of growth of per capitaGDP and per-capita household consumption hasbeen 1% or more.98 The results are shown inthe last two columns of table 26. If the Ginicoefficient had not changed from its values ofaround 1990, poverty would have been reducedby an additional 53.5 million people, 9% morethan the poverty reduction of 611 million thatactually took place. Notice that under that coun-terfactual scenario, China’s urban poverty ratewould have been driven to zero by 2005, com-pared to its actual value of 1.7%.
and the Pacific, consistently with the region’shigh rates of GDP growth. However, the reduc-tion in the number of poor was uneven, withfew countries especially China accounting forbulk of it. The two main factors that sloweddown the rate of poverty reduction have beenrising inequality and a significantly slower rate ofgrowth of per-capita household consumptioncompared to that of per capita GDP. The latterfactor is related to the declining share of con-sumption in GDP growth identified in the sectionon macroeconomic imbalances.
Poverty and multiple deprivations
The above analysis employs headcount povertyrates because they provide a simple summarymeasure of the extent of poverty in a givencountry at a particular point in time. The stateof poverty is characterized by multiple depriva-tions, however, that are not adequately capturedin a simple summary measure. In order tocomplement the analysis, the rest of this sectionexplores the relationship between poverty ratesand selected characteristics of poverty in theareas of employment security, nutrition, educa-tion and access to sanitary infrastructure, meas-ured by selected indicators taken from the Mil-lennium Development Goals database.
Figure 57 shows a positive relationship betweenheadcount poverty rates and the share in totallevel of employment of own-account and con-tributing family workers, a common measure ofinformal employment. Work in the informal sec-tor is not subject to labour safety and regula-tions on hours of work, dismissal rules, mater-nity benefits, minimum wages, employers’ liabil-ity in case of employment-related injury causedto workers, and employers’ contributions to so-cial insurance schemes such as pension plansor unemployment insurance. Informal workersare highly vulnerable to various sorts ofeconomy-wide and idiosyncratic risks. In thefigure, the countries with the highest headcountpoverty rates (Bangladesh, Cambodia, the Lao
98 For the computation of these counterfactuals we estimated the following regression based on data for thedistricts included in tables 25 and 26: Hit = 213.6 – 49.02*log(Cit) + 0.88* Git, N = 83, R2 = 0.88.
(-5.76) (3.09)
Although the total number of poordropped by almost 600 million
between 1990 and the mid-2000s,almost all of this drop was
accounted for by a few countries
The additional reduction in poverty is more thanthree times larger under the second counterfac-tual scenario of an extra 1% increase in per-capita household consumption. In that case,poverty in the Asia and the Pacific would havedropped by an additional 172 million, 93 millionof which would be attributable to India alone.Under this alternative scenario, the povertyrates of urban China, the Islamic Republic ofIran, Kazakhstan, the Russian Federation andTurkey would have been driven to zero by themid-2000s.
All in all, headcount poverty rates were reducedremarkably in the developing economies of Asia
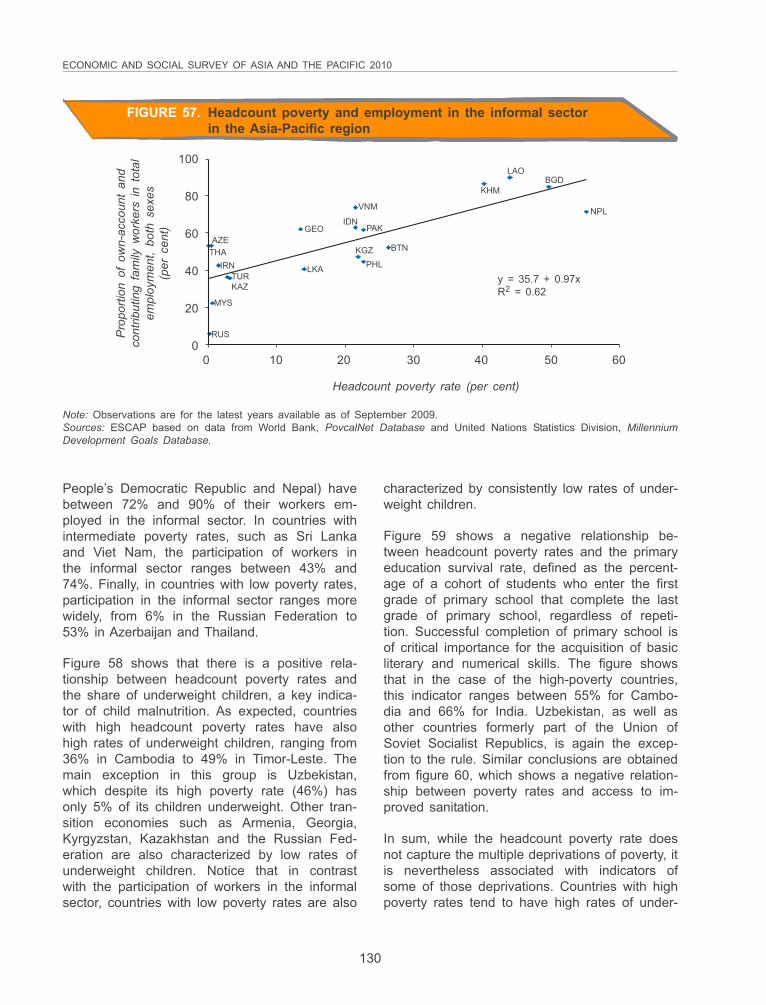
ECONOMIC AND SOCIAL SURVEY OF ASIA AND THE PACIFIC 2010
130
100
80
60
40
20
0
Pro
porti
on o
f ow
n-ac
coun
t an
dco
ntrib
utin
g fa
mily
wor
kers
in
tota
lem
ploy
men
t, bo
th s
exes
(per
cen
t)
0 10 20 30 40 50 60
Headcount poverty rate (per cent)
AZETHA
IRNTURKAZ
MYS
RUS
LKA
GEO
VNM
IDNPAK
BTNKGZPHL
KHM
LAOBGD
NPL
y = 35.7 + 0.97xR2 = 0.62
FIGURE 57. Headcount poverty and employment in the informal sectorin the Asia-Pacific region
Note: Observations are for the latest years available as of September 2009.Sources: ESCAP based on data from World Bank, PovcalNet Database and United Nations Statistics Division, MillenniumDevelopment Goals Database.
People’s Democratic Republic and Nepal) havebetween 72% and 90% of their workers em-ployed in the informal sector. In countries withintermediate poverty rates, such as Sri Lankaand Viet Nam, the participation of workers inthe informal sector ranges between 43% and74%. Finally, in countries with low poverty rates,participation in the informal sector ranges morewidely, from 6% in the Russian Federation to53% in Azerbaijan and Thailand.
Figure 58 shows that there is a positive rela-tionship between headcount poverty rates andthe share of underweight children, a key indica-tor of child malnutrition. As expected, countrieswith high headcount poverty rates have alsohigh rates of underweight children, ranging from36% in Cambodia to 49% in Timor-Leste. Themain exception in this group is Uzbekistan,which despite its high poverty rate (46%) hasonly 5% of its children underweight. Other tran-sition economies such as Armenia, Georgia,Kyrgyzstan, Kazakhstan and the Russian Fed-eration are also characterized by low rates ofunderweight children. Notice that in contrastwith the participation of workers in the informalsector, countries with low poverty rates are also
characterized by consistently low rates of under-weight children.
Figure 59 shows a negative relationship be-tween headcount poverty rates and the primaryeducation survival rate, defined as the percent-age of a cohort of students who enter the firstgrade of primary school that complete the lastgrade of primary school, regardless of repeti-tion. Successful completion of primary school isof critical importance for the acquisition of basicliterary and numerical skills. The figure showsthat in the case of the high-poverty countries,this indicator ranges between 55% for Cambo-dia and 66% for India. Uzbekistan, as well asother countries formerly part of the Union ofSoviet Socialist Republics, is again the excep-tion to the rule. Similar conclusions are obtainedfrom figure 60, which shows a negative relation-ship between poverty rates and access to im-proved sanitation.
In sum, while the headcount poverty rate doesnot capture the multiple deprivations of poverty, itis nevertheless associated with indicators ofsome of those deprivations. Countries with highpoverty rates tend to have high rates of under-

MULTIPLE IMBALANCES AND DEVELOPMENT GAPS AS NEW ENGINES OF GROWTH CHAPTER 3
131
60
50
40
30
20
10
0
Chi
ldre
n un
der
5 m
oder
atel
y of
seve
rely
und
erw
eigh
t (p
er c
ent)
0 10 20 30 40 50 60
Headcount poverty rate (per cent)
AZE
y = 4.8 + 0.69xR2 = 0.58
IRNTHA
MYS KAZRUS TUR
ARMGEO
CHNKGZ
TKMTJK
BTNVNM
PHLIDNLKA
PAK
UZB
KHMLAO
INDBGD
TLSNPL
FIGURE 58. Headcount poverty and underweight children in the Asia-Pacific region
Note: Observations are for the latest years available as of September 2009.Sources: ESCAP based on data from World Bank, PovcalNet Database and United Nations Statistics Division, MillenniumDevelopment Goals Database.
100
80
60
40
20
0
Per
cent
age
of s
tude
nts
star
ting
grad
e 1
who
rea
ch la
st g
rade
of
prim
ary,
bot
h se
xes
0 10 20 30 40 50 60
Headcount poverty rate (per cent)
y = 99 – 0.65xR2 = 0.50
KAZAZERUS
TURMYSIRN
ARM GEOLKA
TJKKGZIDNVNM
BTN
PHLPAK
UZB
INDLAO
KHM BGDNPL
Note: Observations are for the latest years available as of September 2009.Sources: ESCAP based on data from World Bank, PovcalNet Database; and United Nations Statistics Division, MillenniumDevelopment Goals Database.
FIGURE 59. Headcount poverty and primary education survival rate in theAsia-Pacific region
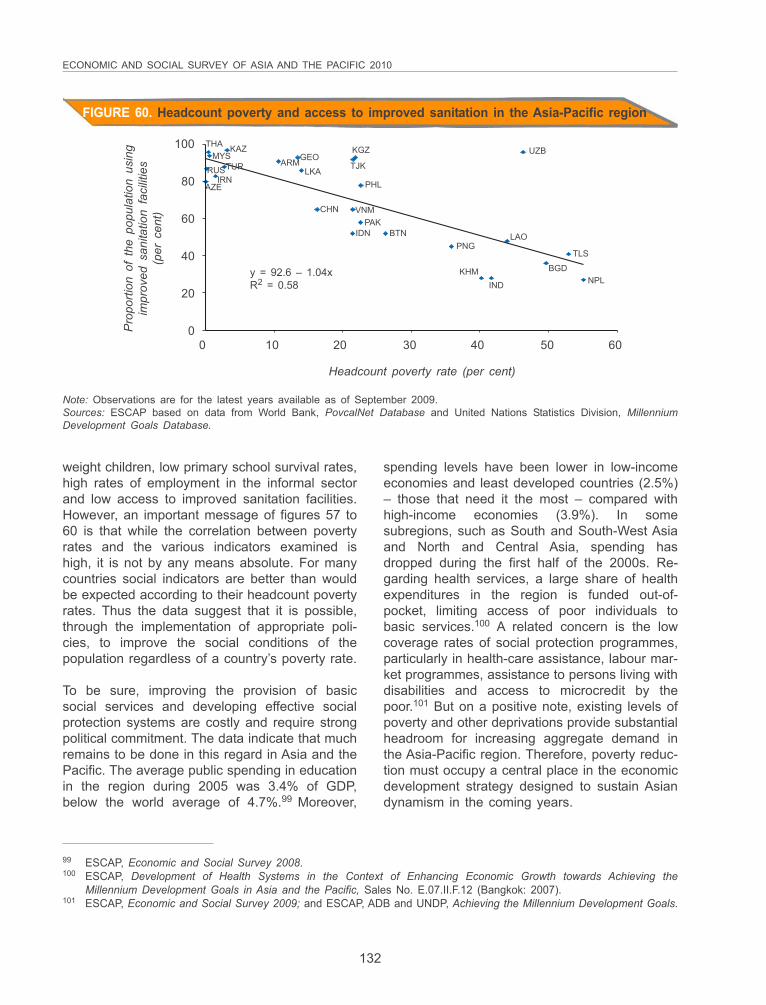
ECONOMIC AND SOCIAL SURVEY OF ASIA AND THE PACIFIC 2010
132
100
80
60
40
20
0Pro
porti
on o
f th
e po
pula
tion
usin
gim
prov
ed s
anita
tion
faci
litie
s(p
er c
ent)
0 10 20 30 40 50 60
Headcount poverty rate (per cent)
y = 92.6 – 1.04xR2 = 0.58
THA KAZMYS
TURRUSIRN
AZE
GEOARMLKA
KGZ
TJK
PHL
CHN VNMPAK
IDN BTNPNG
LAO
UZB
KHMIND
TLS
BGDNPL
FIGURE 60. Headcount poverty and access to improved sanitation in the Asia-Pacific region
Note: Observations are for the latest years available as of September 2009.Sources: ESCAP based on data from World Bank, PovcalNet Database and United Nations Statistics Division, MillenniumDevelopment Goals Database.
weight children, low primary school survival rates,high rates of employment in the informal sectorand low access to improved sanitation facilities.However, an important message of figures 57 to60 is that while the correlation between povertyrates and the various indicators examined ishigh, it is not by any means absolute. For manycountries social indicators are better than wouldbe expected according to their headcount povertyrates. Thus the data suggest that it is possible,through the implementation of appropriate poli-cies, to improve the social conditions of thepopulation regardless of a country’s poverty rate.
To be sure, improving the provision of basicsocial services and developing effective socialprotection systems are costly and require strongpolitical commitment. The data indicate that muchremains to be done in this regard in Asia and thePacific. The average public spending in educationin the region during 2005 was 3.4% of GDP,below the world average of 4.7%.99 Moreover,
spending levels have been lower in low-incomeeconomies and least developed countries (2.5%)– those that need it the most – compared withhigh-income economies (3.9%). In somesubregions, such as South and South-West Asiaand North and Central Asia, spending hasdropped during the first half of the 2000s. Re-garding health services, a large share of healthexpenditures in the region is funded out-of-pocket, limiting access of poor individuals tobasic services.100 A related concern is the lowcoverage rates of social protection programmes,particularly in health-care assistance, labour mar-ket programmes, assistance to persons living withdisabilities and access to microcredit by thepoor.101 But on a positive note, existing levels ofpoverty and other deprivations provide substantialheadroom for increasing aggregate demand inthe Asia-Pacific region. Therefore, poverty reduc-tion must occupy a central place in the economicdevelopment strategy designed to sustain Asiandynamism in the coming years.
99 ESCAP, Economic and Social Survey 2008.100 ESCAP, Development of Health Systems in the Context of Enhancing Economic Growth towards Achieving the
Millennium Development Goals in Asia and the Pacific, Sales No. E.07.II.F.12 (Bangkok: 2007).101 ESCAP, Economic and Social Survey 2009; and ESCAP, ADB and UNDP, Achieving the Millennium Development Goals.
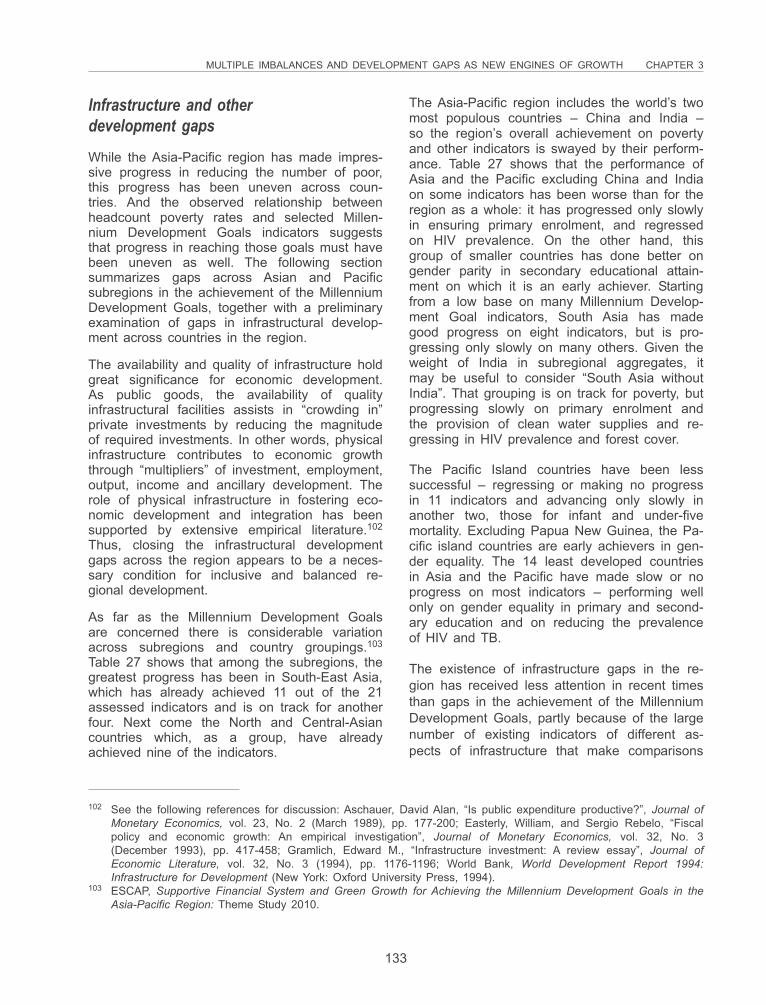
MULTIPLE IMBALANCES AND DEVELOPMENT GAPS AS NEW ENGINES OF GROWTH CHAPTER 3
133
Infrastructure and otherdevelopment gapsWhile the Asia-Pacific region has made impres-sive progress in reducing the number of poor,this progress has been uneven across coun-tries. And the observed relationship betweenheadcount poverty rates and selected Millen-nium Development Goals indicators suggeststhat progress in reaching those goals must havebeen uneven as well. The following sectionsummarizes gaps across Asian and Pacificsubregions in the achievement of the MillenniumDevelopment Goals, together with a preliminaryexamination of gaps in infrastructural develop-ment across countries in the region.
The availability and quality of infrastructure holdgreat significance for economic development.As public goods, the availability of qualityinfrastructural facilities assists in “crowding in”private investments by reducing the magnitudeof required investments. In other words, physicalinfrastructure contributes to economic growththrough “multipliers” of investment, employment,output, income and ancillary development. Therole of physical infrastructure in fostering eco-nomic development and integration has beensupported by extensive empirical literature.102
Thus, closing the infrastructural developmentgaps across the region appears to be a neces-sary condition for inclusive and balanced re-gional development.
As far as the Millennium Development Goalsare concerned there is considerable variationacross subregions and country groupings.103
Table 27 shows that among the subregions, thegreatest progress has been in South-East Asia,which has already achieved 11 out of the 21assessed indicators and is on track for anotherfour. Next come the North and Central-Asiancountries which, as a group, have alreadyachieved nine of the indicators.
The Asia-Pacific region includes the world’s twomost populous countries – China and India –so the region’s overall achievement on povertyand other indicators is swayed by their perform-ance. Table 27 shows that the performance ofAsia and the Pacific excluding China and Indiaon some indicators has been worse than for theregion as a whole: it has progressed only slowlyin ensuring primary enrolment, and regressedon HIV prevalence. On the other hand, thisgroup of smaller countries has done better ongender parity in secondary educational attain-ment on which it is an early achiever. Startingfrom a low base on many Millennium Develop-ment Goal indicators, South Asia has madegood progress on eight indicators, but is pro-gressing only slowly on many others. Given theweight of India in subregional aggregates, itmay be useful to consider “South Asia withoutIndia”. That grouping is on track for poverty, butprogressing slowly on primary enrolment andthe provision of clean water supplies and re-gressing in HIV prevalence and forest cover.
The Pacific Island countries have been lesssuccessful – regressing or making no progressin 11 indicators and advancing only slowly inanother two, those for infant and under-fivemortality. Excluding Papua New Guinea, the Pa-cific island countries are early achievers in gen-der equality. The 14 least developed countriesin Asia and the Pacific have made slow or noprogress on most indicators – performing wellonly on gender equality in primary and second-ary education and on reducing the prevalenceof HIV and TB.
The existence of infrastructure gaps in the re-gion has received less attention in recent timesthan gaps in the achievement of the MillenniumDevelopment Goals, partly because of the largenumber of existing indicators of different as-pects of infrastructure that make comparisons
102 See the following references for discussion: Aschauer, David Alan, “Is public expenditure productive?”, Journal ofMonetary Economics, vol. 23, No. 2 (March 1989), pp. 177-200; Easterly, William, and Sergio Rebelo, “Fiscalpolicy and economic growth: An empirical investigation”, Journal of Monetary Economics, vol. 32, No. 3(December 1993), pp. 417-458; Gramlich, Edward M., “Infrastructure investment: A review essay”, Journal ofEconomic Literature, vol. 32, No. 3 (1994), pp. 1176-1196; World Bank, World Development Report 1994:Infrastructure for Development (New York: Oxford University Press, 1994).
103 ESCAP, Supportive Financial System and Green Growth for Achieving the Millennium Development Goals in theAsia-Pacific Region: Theme Study 2010.
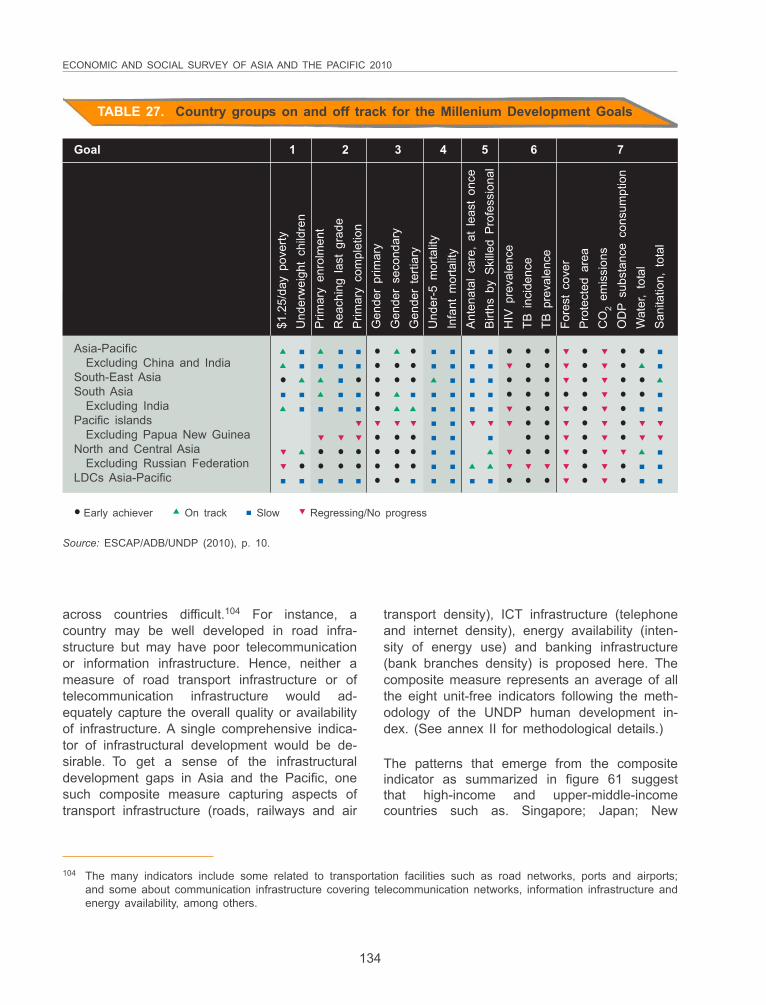
ECONOMIC AND SOCIAL SURVEY OF ASIA AND THE PACIFIC 2010
134
Source: ESCAP/ADB/UNDP (2010), p. 10.
Early achiever On track Slow Regressing/No progress
TABLE 27. Country groups on and off track for the Millenium Development Goals
Goal 1 2 3 4 5 6 7
$1.2
5/da
y po
verty
Und
erw
eigh
t ch
ildre
nP
rimar
y en
rolm
ent
Rea
chin
g la
st g
rade
Prim
ary
com
plet
ion
Gen
der
prim
ary
Gen
der
seco
ndar
yG
ende
r te
rtiar
yU
nder
-5 m
orta
lity
Infa
nt m
orta
lity
Ant
enat
al c
are,
at
leas
t on
ceB
irths
by
Ski
lled
Pro
fess
iona
lH
IV p
reva
lenc
eTB
inc
iden
ceTB
pre
vale
nce
Fore
st c
over
Pro
tect
ed a
rea
CO
2 em
issi
ons
OD
P su
bsta
nce
cons
umpt
ion
Wat
er,
tota
lS
anita
tion,
tot
al
Asia-PacificExcluding China and India
South-East AsiaSouth Asia
Excluding IndiaPacific islands
Excluding Papua New GuineaNorth and Central Asia
Excluding Russian FederationLDCs Asia-Pacific
across countries difficult.104 For instance, acountry may be well developed in road infra-structure but may have poor telecommunicationor information infrastructure. Hence, neither ameasure of road transport infrastructure or oftelecommunication infrastructure would ad-equately capture the overall quality or availabilityof infrastructure. A single comprehensive indica-tor of infrastructural development would be de-sirable. To get a sense of the infrastructuraldevelopment gaps in Asia and the Pacific, onesuch composite measure capturing aspects oftransport infrastructure (roads, railways and air
transport density), ICT infrastructure (telephoneand internet density), energy availability (inten-sity of energy use) and banking infrastructure(bank branches density) is proposed here. Thecomposite measure represents an average of allthe eight unit-free indicators following the meth-odology of the UNDP human development in-dex. (See annex II for methodological details.)
The patterns that emerge from the compositeindicator as summarized in figure 61 suggestthat high-income and upper-middle-incomecountries such as. Singapore; Japan; New
104 The many indicators include some related to transportation facilities such as road networks, ports and airports;and some about communication infrastructure covering telecommunication networks, information infrastructure andenergy availability, among others.
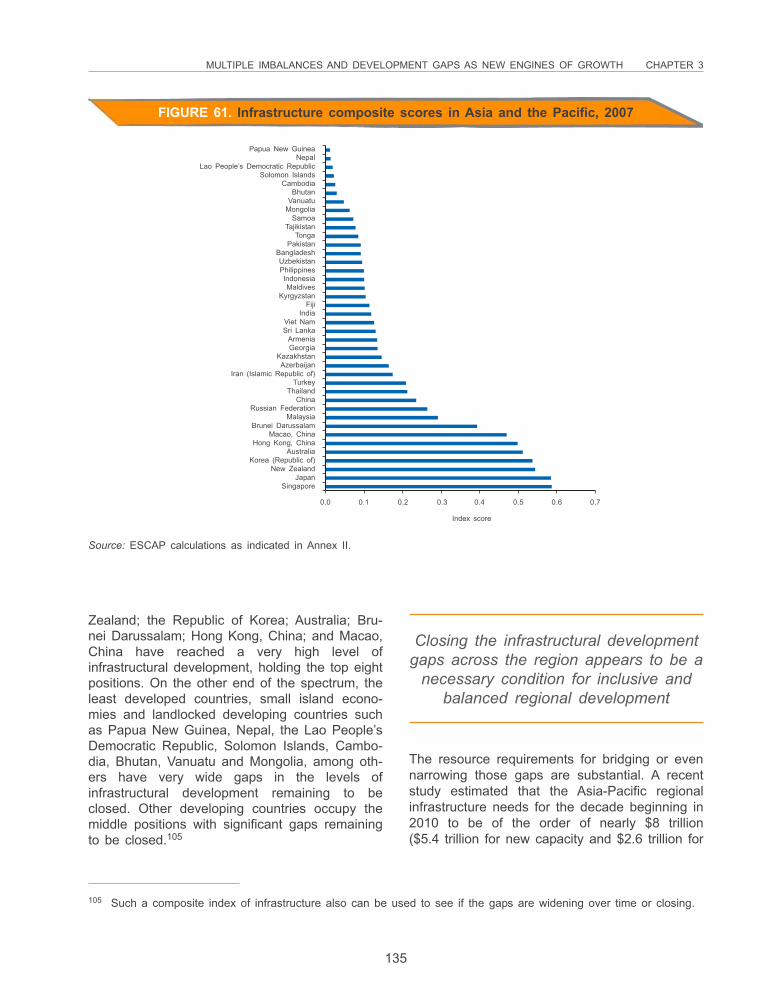
MULTIPLE IMBALANCES AND DEVELOPMENT GAPS AS NEW ENGINES OF GROWTH CHAPTER 3
135
Source: ESCAP calculations as indicated in Annex II.
FIGURE 61. Infrastructure composite scores in Asia and the Pacific, 2007
Papua New GuineaNepal
Lao People’s Democratic RepublicSolomon Islands
CambodiaBhutan
VanuatuMongolia
SamoaTajikistan
TongaPakistan
BangladeshUzbekistanPhilippinesIndonesiaMaldives
KyrgyzstanFiji
IndiaViet NamSri Lanka
ArmeniaGeorgia
KazakhstanAzerbaijan
Iran (Islamic Republic of)Turkey
ThailandChina
Russian FederationMalaysia
Brunei DarussalamMacao, China
Hong Kong, ChinaAustralia
Korea (Republic of)New Zealand
JapanSingapore
0.0 0.1 0.2 0.3 0.4 0.5 0.6 0.7
Index score
Zealand; the Republic of Korea; Australia; Bru-nei Darussalam; Hong Kong, China; and Macao,China have reached a very high level ofinfrastructural development, holding the top eightpositions. On the other end of the spectrum, theleast developed countries, small island econo-mies and landlocked developing countries suchas Papua New Guinea, Nepal, the Lao People’sDemocratic Republic, Solomon Islands, Cambo-dia, Bhutan, Vanuatu and Mongolia, among oth-ers have very wide gaps in the levels ofinfrastructural development remaining to beclosed. Other developing countries occupy themiddle positions with significant gaps remainingto be closed.105
Closing the infrastructural developmentgaps across the region appears to be a
necessary condition for inclusive andbalanced regional development
The resource requirements for bridging or evennarrowing those gaps are substantial. A recentstudy estimated that the Asia-Pacific regionalinfrastructure needs for the decade beginning in2010 to be of the order of nearly $8 trillion($5.4 trillion for new capacity and $2.6 trillion for
105 Such a composite index of infrastructure also can be used to see if the gaps are widening over time or closing.
ECONOMIC AND SOCIAL SURVEY OF ASIA AND THE PACIFIC 2010
136
Viet NamChina
UzbekistanNew Zealand
IndiaBhutanTurkey
KyrgyzstanFiji
Net increase in forest area
JapanBangladesh
Republic of KoreaAustralia
MalaysiaPapua New Guinea
Lao People’s Democratic RepublicKazakhstan
ThailandMongolia
Timor-LesteSri LankaArmenia
CambodiaSolomon Islands
IndonesiaPakistan
NepalPhilippines
Net decrease in forest area
Loss (-) or increase (+) in the areacovered by forest, as percentage of the
1990 forest area
–40 –30 –20 –10 0 10 20 30 40 50
FIGURE 62. Net loss or increase in forest area between 1990 and 2005
Notes: Forest is determined both by the presence of trees and the absence of other predominant land uses. The treesshould reach a minimum height of 5 metres (m) in situ. Areas under reforestation that have not yet reached but areexpected to reach a canopy cover of 10% and a tree height of 5 m are included, as are temporarily unstocked areas,resulting from human intervention or natural causes, which are expected to regenerate.Source: ESCAP, based on data from United Nations Statistical Division, Millennium Development Goals Database.
106 ADB and Asian Development Bank Institute, Infrastructure for a Seamless Asia (Tokyo: 2009), p. 167; available fromwww.adbi.org/intal/intalcdi/PE/2009/03979.pdf.
replacement of old infrastructure).106 The invest-ment needs are on the order of $800 billion peryear of which much remains unfunded undercurrent arrangements.
Narrowing the development gaps in Asia andthe Pacific including poverty reduction andachievement of other Millennium DevelopmentGoals and infrastructural gaps provides valuableopportunities for augmenting aggregate demandwhile making the pattern of development morebalanced and inclusive.
GROWING ECOLOGICALIMBALANCESRapid economic growth and modernization hasput huge pressure on the natural capital ofmany countries in the region, depleting key
natural resources such as freshwater and for-ests. Market failures are largely to blame, re-flected in imperfect information on the value ofgoods and services provided by the naturalenvironment, a misalignment between the socialand private costs involved, and shortcomings inthe governance of natural resources.
The decline in the natural resource base isparticularly worrisome in Asia and the Pacificbecause of the region’s high population densityand low per-capita access to critical resourcessuch as water and energy. Furthermore, theeconomic impacts of the declining natural capi-tal base are likely to fall disproportionately onthe poor, many of whom live on ecologicallyvulnerable areas and depend on the availabilityof natural resources to make a living.
Figure 62 shows the net increase or loss in forestarea between 1990 and 2005 for 28 Asian and
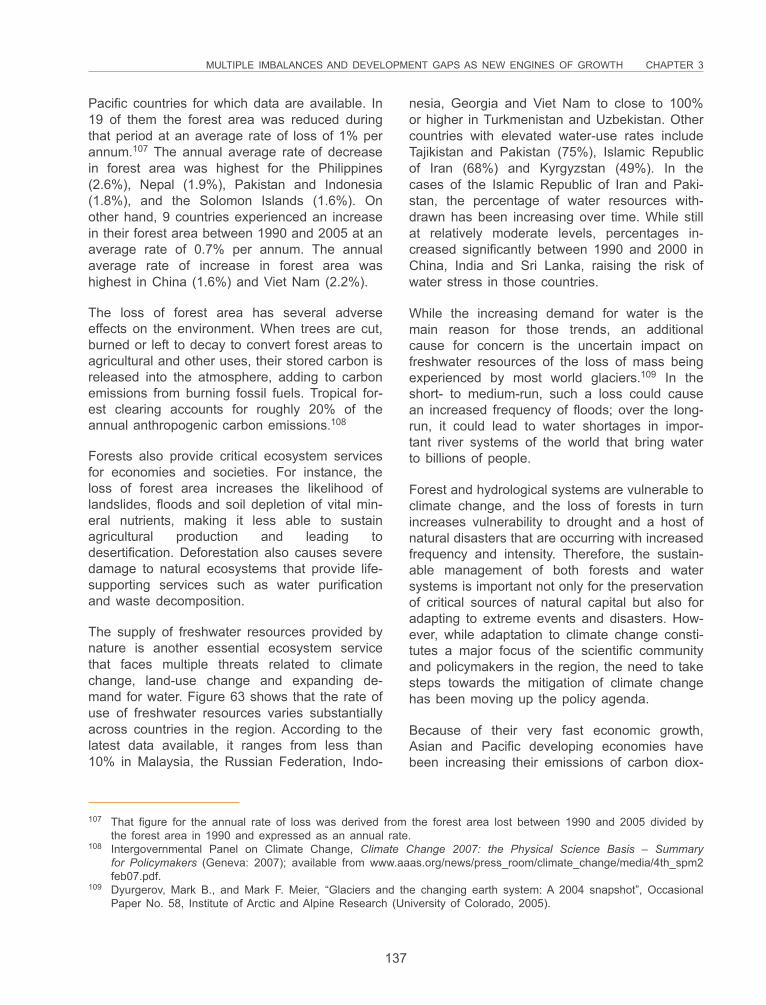
MULTIPLE IMBALANCES AND DEVELOPMENT GAPS AS NEW ENGINES OF GROWTH CHAPTER 3
137
Pacific countries for which data are available. In19 of them the forest area was reduced duringthat period at an average rate of loss of 1% perannum.107 The annual average rate of decreasein forest area was highest for the Philippines(2.6%), Nepal (1.9%), Pakistan and Indonesia(1.8%), and the Solomon Islands (1.6%). Onother hand, 9 countries experienced an increasein their forest area between 1990 and 2005 at anaverage rate of 0.7% per annum. The annualaverage rate of increase in forest area washighest in China (1.6%) and Viet Nam (2.2%).
The loss of forest area has several adverseeffects on the environment. When trees are cut,burned or left to decay to convert forest areas toagricultural and other uses, their stored carbon isreleased into the atmosphere, adding to carbonemissions from burning fossil fuels. Tropical for-est clearing accounts for roughly 20% of theannual anthropogenic carbon emissions.108
Forests also provide critical ecosystem servicesfor economies and societies. For instance, theloss of forest area increases the likelihood oflandslides, floods and soil depletion of vital min-eral nutrients, making it less able to sustainagricultural production and leading todesertification. Deforestation also causes severedamage to natural ecosystems that provide life-supporting services such as water purificationand waste decomposition.
The supply of freshwater resources provided bynature is another essential ecosystem servicethat faces multiple threats related to climatechange, land-use change and expanding de-mand for water. Figure 63 shows that the rate ofuse of freshwater resources varies substantiallyacross countries in the region. According to thelatest data available, it ranges from less than10% in Malaysia, the Russian Federation, Indo-
nesia, Georgia and Viet Nam to close to 100%or higher in Turkmenistan and Uzbekistan. Othercountries with elevated water-use rates includeTajikistan and Pakistan (75%), Islamic Republicof Iran (68%) and Kyrgyzstan (49%). In thecases of the Islamic Republic of Iran and Paki-stan, the percentage of water resources with-drawn has been increasing over time. While stillat relatively moderate levels, percentages in-creased significantly between 1990 and 2000 inChina, India and Sri Lanka, raising the risk ofwater stress in those countries.
While the increasing demand for water is themain reason for those trends, an additionalcause for concern is the uncertain impact onfreshwater resources of the loss of mass beingexperienced by most world glaciers.109 In theshort- to medium-run, such a loss could causean increased frequency of floods; over the long-run, it could lead to water shortages in impor-tant river systems of the world that bring waterto billions of people.
Forest and hydrological systems are vulnerable toclimate change, and the loss of forests in turnincreases vulnerability to drought and a host ofnatural disasters that are occurring with increasedfrequency and intensity. Therefore, the sustain-able management of both forests and watersystems is important not only for the preservationof critical sources of natural capital but also foradapting to extreme events and disasters. How-ever, while adaptation to climate change consti-tutes a major focus of the scientific communityand policymakers in the region, the need to takesteps towards the mitigation of climate changehas been moving up the policy agenda.
Because of their very fast economic growth,Asian and Pacific developing economies havebeen increasing their emissions of carbon diox-
107 That figure for the annual rate of loss was derived from the forest area lost between 1990 and 2005 divided bythe forest area in 1990 and expressed as an annual rate.
108 Intergovernmental Panel on Climate Change, Climate Change 2007: the Physical Science Basis – Summaryfor Policymakers (Geneva: 2007); available from www.aaas.org/news/press_room/climate_change/media/4th_spm2feb07.pdf.
109 Dyurgerov, Mark B., and Mark F. Meier, “Glaciers and the changing earth system: A 2004 snapshot”, OccasionalPaper No. 58, Institute of Arctic and Alpine Research (University of Colorado, 2005).
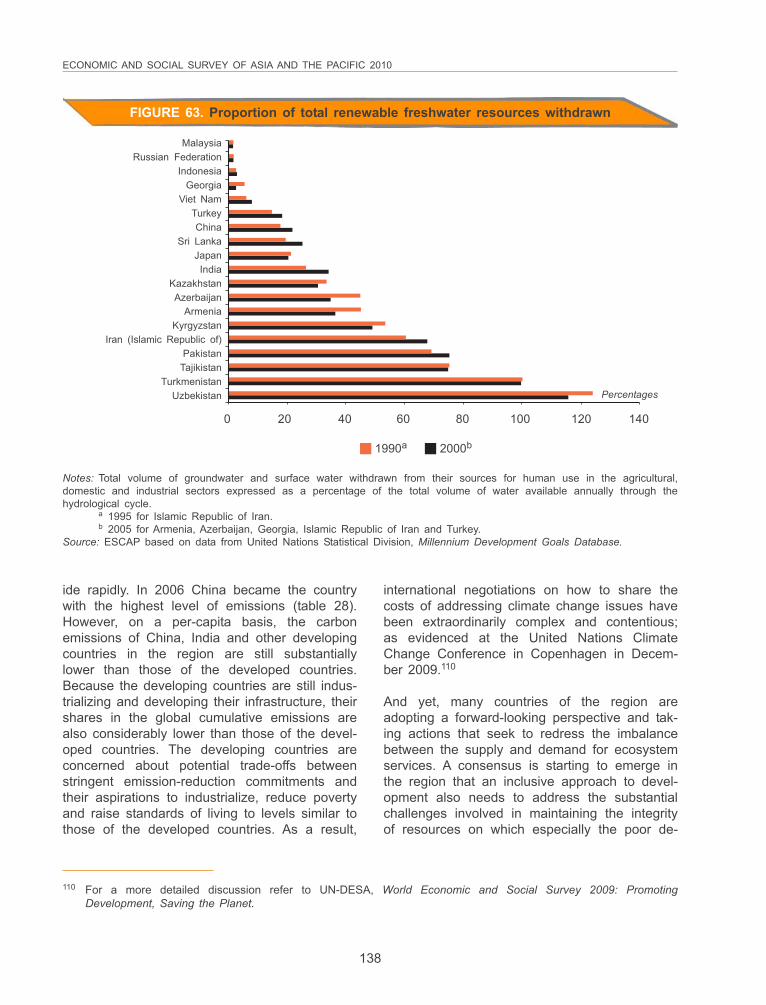
ECONOMIC AND SOCIAL SURVEY OF ASIA AND THE PACIFIC 2010
138
MalaysiaRussian Federation
IndonesiaGeorgia
Viet NamTurkeyChina
Sri LankaJapanIndia
KazakhstanAzerbaijan
ArmeniaKyrgyzstan
Iran (Islamic Republic of)Pakistan
TajikistanTurkmenistan
Uzbekistan Percentages
0 20 40 60 80 100 120 140
Notes: Total volume of groundwater and surface water withdrawn from their sources for human use in the agricultural,domestic and industrial sectors expressed as a percentage of the total volume of water available annually through thehydrological cycle.
a 1995 for Islamic Republic of Iran.b 2005 for Armenia, Azerbaijan, Georgia, Islamic Republic of Iran and Turkey.
Source: ESCAP based on data from United Nations Statistical Division, Millennium Development Goals Database.
FIGURE 63. Proportion of total renewable freshwater resources withdrawn
1990a 2000b
ide rapidly. In 2006 China became the countrywith the highest level of emissions (table 28).However, on a per-capita basis, the carbonemissions of China, India and other developingcountries in the region are still substantiallylower than those of the developed countries.Because the developing countries are still indus-trializing and developing their infrastructure, theirshares in the global cumulative emissions arealso considerably lower than those of the devel-oped countries. The developing countries areconcerned about potential trade-offs betweenstringent emission-reduction commitments andtheir aspirations to industrialize, reduce povertyand raise standards of living to levels similar tothose of the developed countries. As a result,
international negotiations on how to share thecosts of addressing climate change issues havebeen extraordinarily complex and contentious;as evidenced at the United Nations ClimateChange Conference in Copenhagen in Decem-ber 2009.110
And yet, many countries of the region areadopting a forward-looking perspective and tak-ing actions that seek to redress the imbalancebetween the supply and demand for ecosystemservices. A consensus is starting to emerge inthe region that an inclusive approach to devel-opment also needs to address the substantialchallenges involved in maintaining the integrityof resources on which especially the poor de-
110 For a more detailed discussion refer to UN-DESA, World Economic and Social Survey 2009: PromotingDevelopment, Saving the Planet.
MULTIPLE IMBALANCES AND DEVELOPMENT GAPS AS NEW ENGINES OF GROWTH CHAPTER 3
139
TABLE 28. Carbon dioxide emissions from selected major economies
Share of Annual Per capita Share ofglobal CO2 average CO2 globalemissions growth rate of emissions cumulative CO2
in 2006 CO2 emissions in 2006 emissions1992-2006 1840-2006
Per cent Rank Per cent Mta Rank Per cent
1) Asia-Pacific economiesAustralia 1.4 (13) 1.6 19.3 (8) 1.1China 21.8 (1) 6.2 4.7 (65) 8.1India 4.7 (4) 4.8 1.2 (120) 2.4Indonesia 1.3 (15) 3.6 1.6 (109) 0.6Iran (Islamic Republic of) 1.7 (10) 4.6 6.7 (47) 0.8Japan 4.4 (5) 0.5 9.8 (27) 3.6Republic of Korea 1.8 (9) 3.7 10.8 (23) 0.8Russian Federation 5.7 (3) –2.0 11.3 (19) 8.0
2) Other economiesCanada 1.9 (7) 1.1 16.8 (9) 2.0Germany 3.0 (6) –1.0 10.2 (27) 6.7United Kingdom 1.9 (8) –0.2 9.0 (32) 5.9United States 20.3 (2) 1.2 19.3 (7) 27.8
Note: a Metric tons of CO2.Sources: ESCAP, based on United Nations (2009, table 1.3, p. 9) and data from United Nations Statistics Division,Millennium Development Goals Database; Marland, Boden and Andres (2008); and World Resources Institute, ClimateAnalysis Indicators Tool (CAIT) Version 7.0, http://cait.wri.org/.
pend, for example by keeping freshwater usewithin sustainable levels, restoring water qualityin rivers, protecting the ecological services offorests and adapting to climate change. Conse-quently, in response to the global financial cri-sis, some ESCAP member countries have allo-cated a high proportion of green investments intheir fiscal stimulus packages.111 In addition,countries such as China, the Republic of Korea,and India have made high-level commitments tobuilding environmental sustainability into eco-nomic growth and to promote international coop-eration mechanisms to fight climate change.The Chinese Premier, Wen Jiabao, has stated:“All nations should continue to find common
ground, bridge differences and strengthen coop-eration to crack the hard issues facing humanexistence and development, and benefit thegenerations to come.”112
A key to addressing the region’s ecological im-balances will be the implementation of broadlyunderstood technological innovations that will re-duce the adverse impacts of production andconsumption activities on the environment, aswell as unsustainable pressures on natural re-sources. The promotion and adoption of suchinnovations is possible, but requires a societalconsensus about their benefits, as well asstrong Government support and international co-
111 Bernard, Steve, and others, “The greenest bail-out?”, Financial Times, 2 Mar. 2009; available from www.ft.com/cms/s/0/cc207678-0738-11de-9294-000077b07658.html?nclick_check=1.
112 Xinhua News Agency, “Chinese premier, UN chief discuss climate change”, China View, Window on China sec.,30 Dec. 2009; available from http://news.xinhuanet.com/english/2009-12/30/content_12730059.htm.
ECONOMIC AND SOCIAL SURVEY OF ASIA AND THE PACIFIC 2010
140
operation. Past experience suggests that eco-nomic incentives have encouraged the emer-gence of such societal consensus and Govern-ment support.
It should be pointed out that least developedcountries, landlocked developing countries andsmall island developing States – which are dis-proportionately vulnerable to the consequencesof climate change – do not have the financialresources and expertise to develop new tech-nologies. A number of international agreements,notably the United Nations Framework Conven-tion on Climate Change (UNFCCC), recognizethose constraints by stressing that developedcountries need to support developing countriesaccording to the principle of common but differ-entiated responsibilities. Developed countriesare thereby committed to supporting developingcountries financially and through transfer oftechnology so that they can diversify their pro-duction into higher value-added and less pollu-tion-intensive manufacturing and service indus-tries, through the use of environmentally soundtechnologies and know-how. To date, much re-mains to be done, not only in terms of providingfinancing to developing countries on preferableterms, but also in enhancing “green” marketaccess opportunities for developing countries.
nological innovations, the prospects for South-South technical and financial cooperation in thatarea appear promising.
LINKAGES BETWEEN THE THREEIMBALANCES
Figure 64 presents a schematic view of theproduction process. It shows three uses of GDP-investments, net exports and consumption, andfour production inputs: capital, including that de-rived from natural resources, technology, andlabour. The figure also shows an externalityrelated to environmental degradation. Finally, thefigure makes clear that production alone is in-sufficient to achieve the objective of povertyreduction, which is shown as linked to employ-ment and availability of consumption goods andservices. This figure illustrates the macroeco-nomic imbalances of the growth process in Asiaand the Pacific discussed in this chapter.
A consensus is starting to emerge inthe region about the need to keep
freshwater use within sustainable levels,restore water quality in rivers, protectthe ecological services of forests, and
adapt to climate change
In their search for new sources of growth in theaftermath of the crisis, Asian and Pacific coun-tries might pay attention to opportunities thatmay exist in environmentally sound processesand technologies through appropriate public in-terventions, international support and regionalcooperation. Concurrently, as key developingcountries move ahead in their development as-pirations and in their capacity to generate tech-
To sustain economic growth over thelong run, the Asia-Pacific region
needs to address its macroeconomic,social and ecological imbalancesin an integrated manner: policies
that address simultaneouslymore than one imbalance should
be given the highest priority
The links between elements in the figure aredepicted as colour-coded arrows to highlight thethree imbalances, as well as elements of thecurrent growth strategy that have delivered, onaverage, positive development results. The bluearrows highlight key elements of Asian and Pa-cific growth strategy that have contributed to theregion’s high rates of economic growth over thepast 40 years. They include high investmentrates leading to a fast accumulation of capitalwhich, combined with an abundant supply of
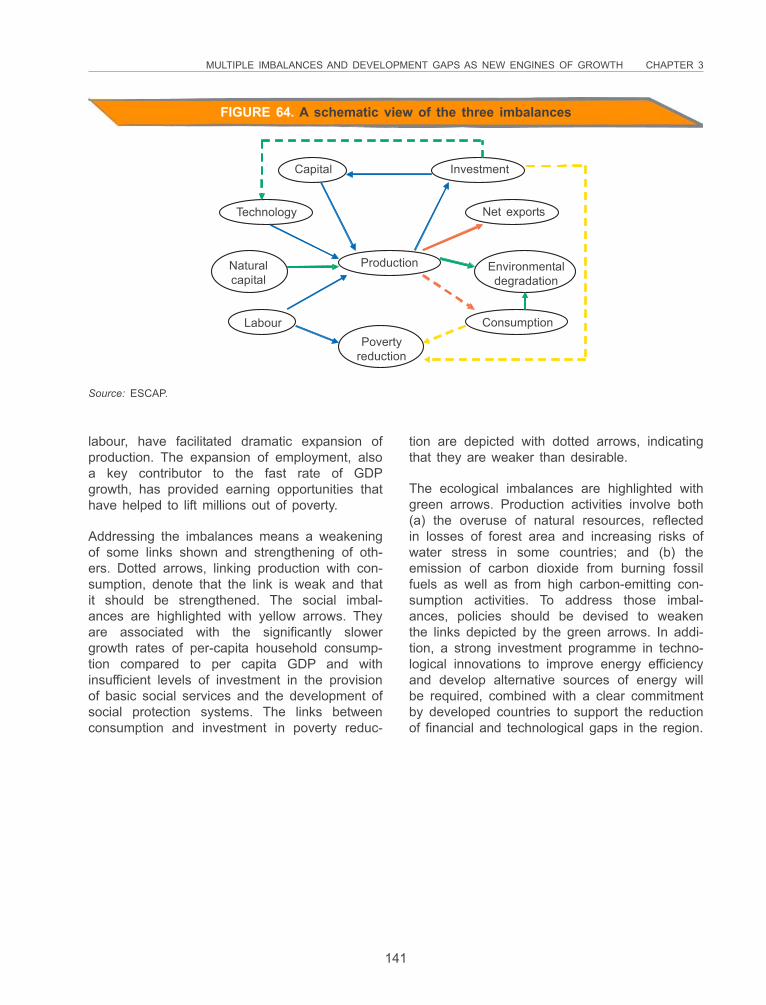
MULTIPLE IMBALANCES AND DEVELOPMENT GAPS AS NEW ENGINES OF GROWTH CHAPTER 3
141
FIGURE 64. A schematic view of the three imbalances
Capital Investment
Net exports
Environmentaldegradation
ConsumptionPoverty
reduction
Labour
Naturalcapital
Technology
Source: ESCAP.
Production
labour, have facilitated dramatic expansion ofproduction. The expansion of employment, alsoa key contributor to the fast rate of GDPgrowth, has provided earning opportunities thathave helped to lift millions out of poverty.
Addressing the imbalances means a weakeningof some links shown and strengthening of oth-ers. Dotted arrows, linking production with con-sumption, denote that the link is weak and thatit should be strengthened. The social imbal-ances are highlighted with yellow arrows. Theyare associated with the significantly slowergrowth rates of per-capita household consump-tion compared to per capita GDP and withinsufficient levels of investment in the provisionof basic social services and the development ofsocial protection systems. The links betweenconsumption and investment in poverty reduc-
tion are depicted with dotted arrows, indicatingthat they are weaker than desirable.
The ecological imbalances are highlighted withgreen arrows. Production activities involve both(a) the overuse of natural resources, reflectedin losses of forest area and increasing risks ofwater stress in some countries; and (b) theemission of carbon dioxide from burning fossilfuels as well as from high carbon-emitting con-sumption activities. To address those imbal-ances, policies should be devised to weakenthe links depicted by the green arrows. In addi-tion, a strong investment programme in techno-logical innovations to improve energy efficiencyand develop alternative sources of energy willbe required, combined with a clear commitmentby developed countries to support the reductionof financial and technological gaps in the region.
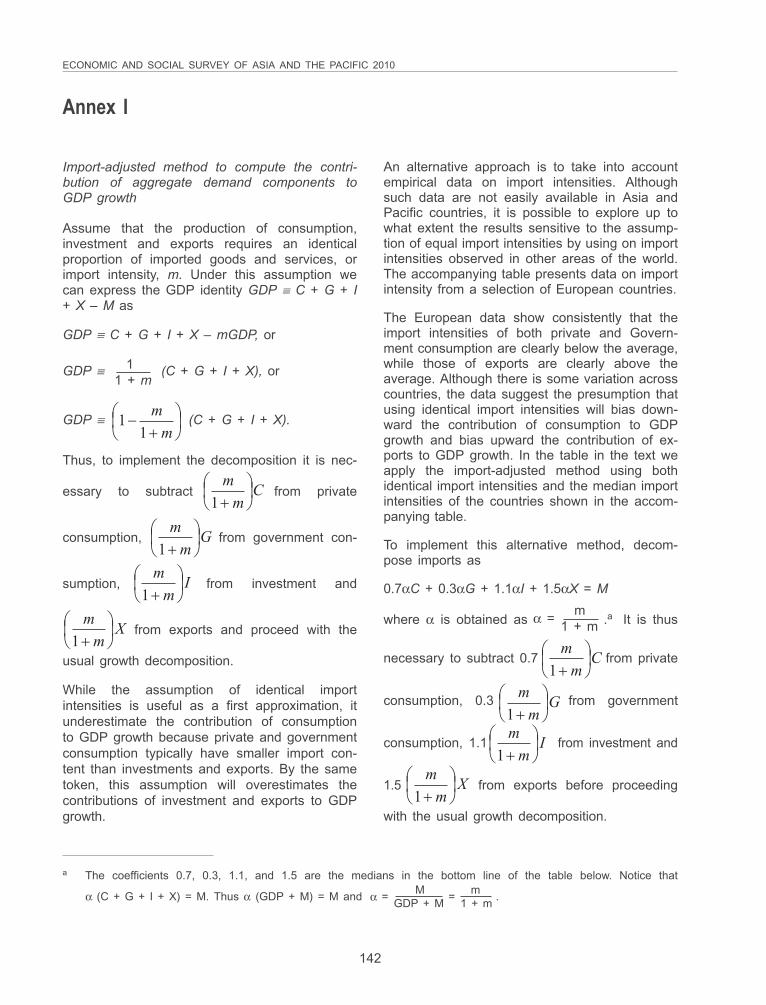
ECONOMIC AND SOCIAL SURVEY OF ASIA AND THE PACIFIC 2010
142
Import-adjusted method to compute the contri-bution of aggregate demand components toGDP growth
Assume that the production of consumption,investment and exports requires an identicalproportion of imported goods and services, orimport intensity, m. Under this assumption wecan express the GDP identity GDP ≡ C + G + I+ X – M as
GDP ≡ C + G + I + X – mGDP, or
GDP ≡ 1 (C + G + I + X), or 1 + m
GDP ≡ (C + G + I + X).
Thus, to implement the decomposition it is nec-
essary to subtract from private
consumption, from government con-
sumption, from investment and
from exports and proceed with the
usual growth decomposition.
While the assumption of identical importintensities is useful as a first approximation, itunderestimate the contribution of consumptionto GDP growth because private and governmentconsumption typically have smaller import con-tent than investments and exports. By the sametoken, this assumption will overestimates thecontributions of investment and exports to GDPgrowth.
An alternative approach is to take into accountempirical data on import intensities. Althoughsuch data are not easily available in Asia andPacific countries, it is possible to explore up towhat extent the results sensitive to the assump-tion of equal import intensities by using on importintensities observed in other areas of the world.The accompanying table presents data on importintensity from a selection of European countries.
The European data show consistently that theimport intensities of both private and Govern-ment consumption are clearly below the average,while those of exports are clearly above theaverage. Although there is some variation acrosscountries, the data suggest the presumption thatusing identical import intensities will bias down-ward the contribution of consumption to GDPgrowth and bias upward the contribution of ex-ports to GDP growth. In the table in the text weapply the import-adjusted method using bothidentical import intensities and the median importintensities of the countries shown in the accom-panying table.
To implement this alternative method, decom-pose imports as
0.7αC + 0.3αG + 1.1αI + 1.5αX = M
where α is obtained as .a It is thus
necessary to subtract 0.7 from private
consumption, 0.3 from government
consumption, 1.1 from investment and
1.5 from exports before proceeding
with the usual growth decomposition.
Annex I
Cm
m����
��
1
Gm
m����
��
1
Im
m����
��
1
Xm
m����
��
1
m
m����
��
11
Cm
m����
��
1
Gm
m����
��
1
Im
m����
��
1
Xm
m����
��
1
α = m 1 + m
a The coefficients 0.7, 0.3, 1.1, and 1.5 are the medians in the bottom line of the table below. Notice that
α (C + G + I + X) = M. Thus α (GDP + M) = M and .α = M = m GDP + M 1 + m
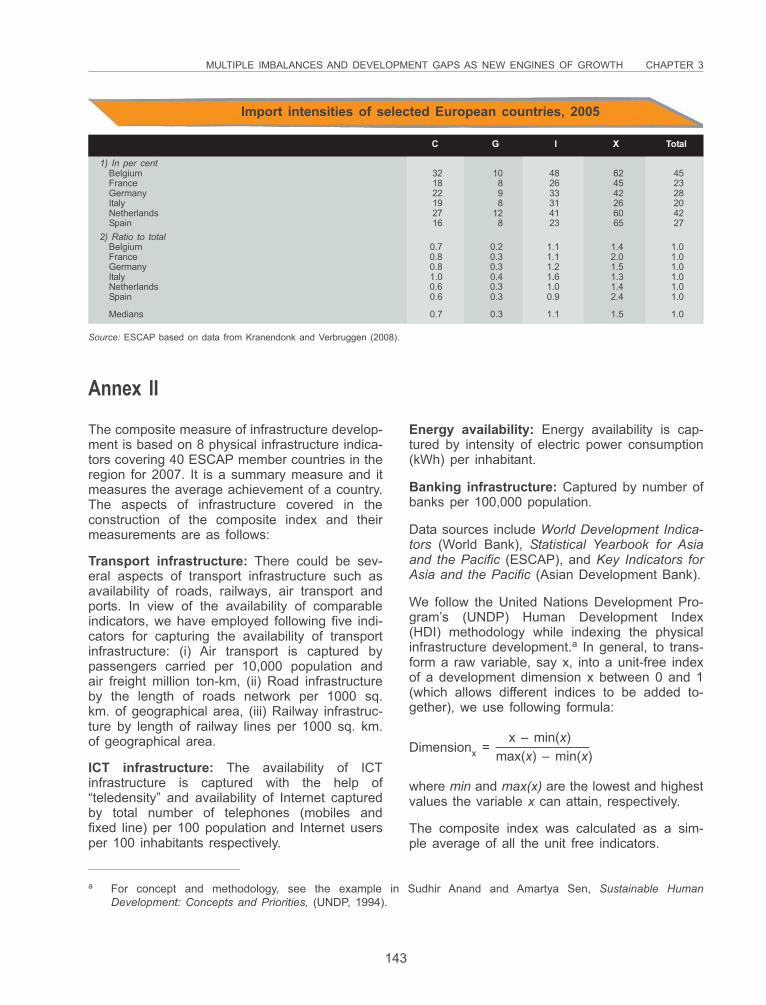
MULTIPLE IMBALANCES AND DEVELOPMENT GAPS AS NEW ENGINES OF GROWTH CHAPTER 3
143
The composite measure of infrastructure develop-ment is based on 8 physical infrastructure indica-tors covering 40 ESCAP member countries in theregion for 2007. It is a summary measure and itmeasures the average achievement of a country.The aspects of infrastructure covered in theconstruction of the composite index and theirmeasurements are as follows:
Transport infrastructure: There could be sev-eral aspects of transport infrastructure such asavailability of roads, railways, air transport andports. In view of the availability of comparableindicators, we have employed following five indi-cators for capturing the availability of transportinfrastructure: (i) Air transport is captured bypassengers carried per 10,000 population andair freight million ton-km, (ii) Road infrastructureby the length of roads network per 1000 sq.km. of geographical area, (iii) Railway infrastruc-ture by length of railway lines per 1000 sq. km.of geographical area.
ICT infrastructure: The availability of ICTinfrastructure is captured with the help of“teledensity” and availability of Internet capturedby total number of telephones (mobiles andfixed line) per 100 population and Internet usersper 100 inhabitants respectively.
Energy availability: Energy availability is cap-tured by intensity of electric power consumption(kWh) per inhabitant.
Banking infrastructure: Captured by number ofbanks per 100,000 population.
Data sources include World Development Indica-tors (World Bank), Statistical Yearbook for Asiaand the Pacific (ESCAP), and Key Indicators forAsia and the Pacific (Asian Development Bank).
We follow the United Nations Development Pro-gram’s (UNDP) Human Development Index(HDI) methodology while indexing the physicalinfrastructure development.a In general, to trans-form a raw variable, say x, into a unit-free indexof a development dimension x between 0 and 1(which allows different indices to be added to-gether), we use following formula:
Dimensionx = x – min(x)max(x) – min(x)
where min and max(x) are the lowest and highestvalues the variable x can attain, respectively.
The composite index was calculated as a sim-ple average of all the unit free indicators.
Annex II
a For concept and methodology, see the example in Sudhir Anand and Amartya Sen, Sustainable HumanDevelopment: Concepts and Priorities, (UNDP, 1994).
Import intensities of selected European countries, 2005
C G I X Total
1) In per centBelgium 32 10 48 62 45France 18 8 26 45 23Germany 22 9 33 42 28Italy 19 8 31 26 20Netherlands 27 12 41 60 42Spain 16 8 23 65 27
2) Ratio to totalBelgium 0.7 0.2 1.1 1.4 1.0France 0.8 0.3 1.1 2.0 1.0Germany 0.8 0.3 1.2 1.5 1.0Italy 1.0 0.4 1.6 1.3 1.0Netherlands 0.6 0.3 1.0 1.4 1.0Spain 0.6 0.3 0.9 2.4 1.0
Medians 0.7 0.3 1.1 1.5 1.0
Source: ESCAP based on data from Kranendonk and Verbruggen (2008).

Pho
to: K
eren
Su/
Cor
bis
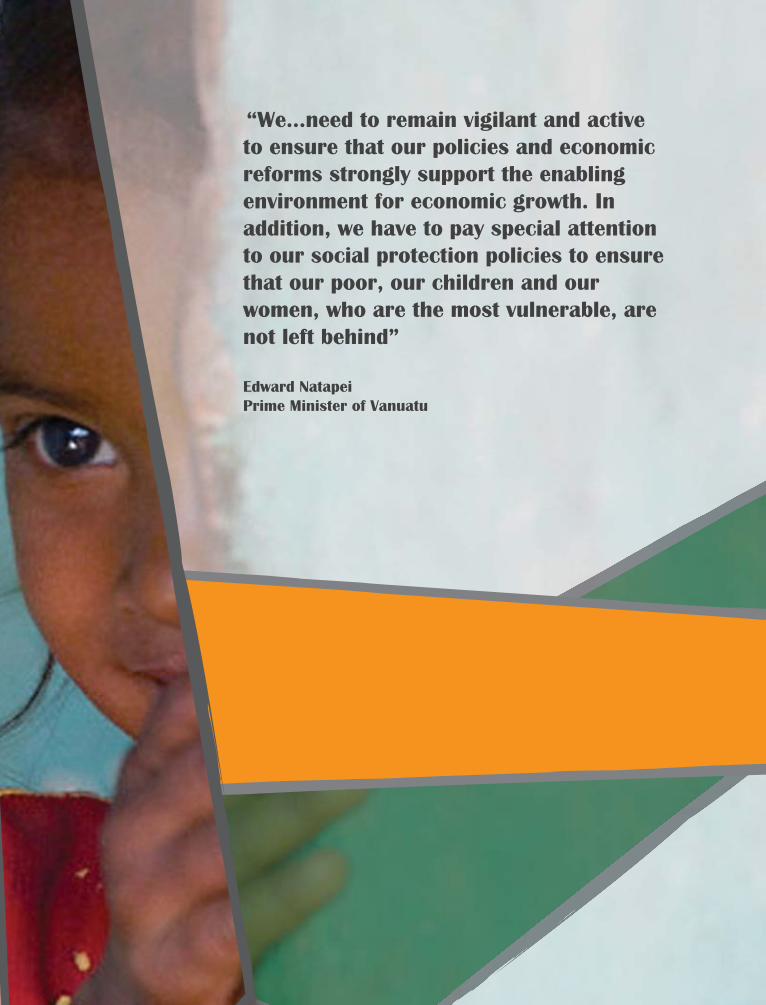
“We...need to remain vigilant and active to ensure that our policies and economic reforms strongly support the enabling environment for economic growth. In addition, we have to pay special attention to our social protection policies to ensure that our poor, our children and our women, who are the most vulnerable, are not left behind”
Edward NatapeiPrime Minister of Vanuatu

4A REGIONAL
POLICY AGENDAFOR REGAININGTHE DYNAMISM
Trillions of dollars accumulated in foreign exchange reserves during the decade that preceded the global crisis, as net exports, became a key element supporting GDP growth in Asia and the Pacific.113 As this Survey describes in the previous chapter, those reserves were mostly invested in treasury bonds issued by developed countries outside the region, which in turn fed debt-driven consumption abroad. With the advent of the first worldwide recession since the 1930s and the enormous debt burden accumulated by developed-country Governments, a return to business as usual seems unlikely. There is little likelihood that even a recovery in major developed economies could rekindle the pre-crisis, export-led growth trend for the region.114
Asian and Pacific countries therefore need to find new sources of domestic and regional demand to make up for weakened Western demand for their exports, to help sustain their dynamism and allow for a gradual unwinding of global imbalances. Part of the solution could be to develop a more consumer-centric economy in the region — one in which rising consumption is increasingly fed by production from within the region. By allocating financial capital more efficiently within the region, more jobs could be generated and the benefits of economic growth could be spread more equitably, in turn stimulating increases in private consumption.
113 While not all subregions of Asia and the Pacific experienced a disproportionately large contribution of net exports to economic growth over the past decade, private consumption has generally diminished, at least up to the onset of the global financial crisis of 2008.
114 The President of the United States Mr. Barack Obama stated on 9 May 2009: “The long-term deficit and debt that we have accumulated is unsustainable. We can't keep on just borrowing from China or borrowing from other countries… [A]t some point they're just going to get tired of buying our debt. And when that happens, we will really have to raise interest rates to be able to borrow…” [Reuters, “Obama says U.S. can’t keep borrowing from China”, 14 May 2009, available from www.reuters.com/article/politicsNews/idUSTRE54D58Q20090514.
ECONOMIC AND SOCIAL SURVEY OF ASIA AND THE PACIFIC 2010
148
Corrections in the large socio-economic andecological imbalances in the region could pro-vide much headroom for generating new aggre-gate demand, as this Survey discusses in thepreceding chapter. With nearly 1 billion peoplein poverty and wide gaps in infrastructure andlifestyles, opportunities could be developed toaugment aggregate demand through privateconsumption and investment. Critical for regain-ing the region’s dynamism are policy measurestaken at national and regional levels that canreduce poverty and facilitate more inclusive eco-nomic growth. Similarly, greener “new-economy”industries and businesses based on energy-and material-saving innovations could also besources of growth, providing more affordableproducts for consumption by the poor whilepromoting environmental sustainability. There-fore, inclusive and sustainable growth is notonly desirable but also a necessary condition forregaining the dynamism of the Asia-Pacific re-gion in the aftermath of the global economiccrisis.
REDRESSING SOCIO-ECONOMICAND ENVIRONMENTALIMBALANCES FOR EXPANDINGDOMESTIC CONSUMPTION
With over 950 million poor as of 2005, thechallenge of reducing poverty in Asian and Pa-cific countries remains formidable and should beassigned the highest policy priority. Poverty re-duction also has the potential to enhance do-mestic consumption by adding hundreds of mil-lions of new consumers to the mainstream. Theskyrocketing food and fuel prices of 2008 andsubsequent global financial crisis were starkreminders that poverty can suddenly increaseduring turbulent times, wiping out hard-wongains. In the context of poverty reduction,measures such as strengthening social protec-tion, focusing on agriculture and rural develop-ment and enhancing financial inclusivenesscould help in expanding the domestic base ofdemand while addressing socio-economic imbal-ances.
Strengthening social protection
Addressing the social imbalances of the regioncalls for two different, but equally important,policy goals: (a) to redouble efforts to reduceentrenched poverty and deprivation; and (b) toprotect the population at large from the risk offalling into poverty as a result of various haz-ards, including adverse economic shocks, natu-ral disasters, illness, disability and other circum-stances. Both goals can be addressed throughbroadly understood policies that provide socialprotection in times of adversity and reduce un-acceptable levels of deprivation.115 Such socialprotection policies should be concerned withdeveloping short-term safety nets, preventingincreases in deprivation, and promoting betterchances of individual development.116
Asia-Pacific needs to find newsources of domestic and regional
demand to help sustain itsdynamism and contribute to
the gradual unwinding ofglobal imbalances
The present chapter outlines a policy agendafor the region at the national and regional levelsthat could help unleash latent domesticand regional demand and address the macr-oeconomic, social and ecological imbala-nces described in chapter 3 in an integratedmanner.
115 Kannan, K. P., “Social security in a globalizing world”, International Social Security Review, Vol. 60, Nos. 2-3,2007, pp. 19-37.
116 Guhan, S., “Social security options for developing countries”, International Labour Review, Vol. 133, No. 1, 1994,pp. 35-54.
A REGIONAL POLICY AGENDA FOR REGAINING THE DYNAMISM CHAPTER 4
149
Social protection systems are key to attaining amore inclusive development process. They canserve as automatic stabilizers during periods ofcrisis by providing additional income to the poorand helping maintain their food intake and ac-cess to education and health services. In non-crisis times they can help support domesticdemand by reducing the need for precautionarysaving against catastrophic out-of-pocket ex-penses in coping with medical or other emergen-cies. Some types of social protection measuresare particularly relevant for tackling crisis situa-tions as they can provide quick relief to the poorin the short-term.117 Among them are (a) employ-ment generation measures; (b) cash transfersprogrammes – conditional or unconditional; (c)targeted social services, such as feeding pro-grammes and health and education programmesthat focus on benefits for women and girls;and (d) expansion of microcredit schemes toimpoverished groups and localities.
Many of those programmes have the nature ofsocial assistance and social services. The stimu-lus packages in the region contain many suchmeasures for crisis relief. For example, thestimulus package in India includes an expansionof the National Rural Employment GuaranteeScheme. The Indonesian package emphasizeslabour-intensive infrastructure projects. Stimuluspackages in the Philippines and Thailand includesocial security benefits and cash transfers to thepoor, while subsidies for health, education andsocial services in general find a major place inthe stimulus packages of China, Singapore,Thailand and Hong Kong, China. Easing theavailability of financing for affected groups suchas women and small entrepreneurs has been afeature of the Indian and Thai packages. To beeffective in relieving crises, social protectionmeasures should be able to target the affectedpeople and provide enough benefits to overcomecrisis impacts.
Despite their usefulness in attaining an inclusivedevelopment process and in minimizing adverseimpacts of economic crises, the coverage ofsocial protection programmes in the Asian andPacific region is among the lowest in the world.Most of the poorer developing countries lackinstitutionalized welfare systems. They may havea variety of social protection measures but theirprogrammes may not be sufficiently funded, co-herent or extensive to protect vulnerablepopulations. The fragmented social safety netsthat do exist are generally biased towards theformal sector, leaving many people without ba-sic services and rights. For instance, socialinsurance tends to reach only a small proportionof the workforce – generally government work-ers and some of those employed in the formalsector – which in India, for example, representsless than one tenth of the total workforce.
The coverage of social protectionprogrammes in the Asian andPacific region is among the
lowest in the world
Across the region, people working in the infor-mal economy do not generally benefit fromsocial safety nets. ESCAP has estimated thatacross Asia and the Pacific only 20% of theunemployed and underemployed have access tolabour market programmes for unemploymentbenefits, training or public welfare, includingwork-for-food programmes.118 Only 30% of theelderly receive pensions and only 20% of theregional population has access to health-careassistance – making out-of-pocket medicalexpenses in Asia and the Pacific among thehighest in the world.119 Even in China socialinsurance has been largely restricted to urban
117 This discussion draws on ESCAP, ADB and UNDP, Achieving the Millennium Development Goals, pp. 60-66.118 ESCAP, Economic and Social Survey 2009, p. 64.119 “In some countries in the region, more than 60% of money spent on health care comes from the patient’s
pocket. By contrast, in Germany an average of just 13% of all medical expenses are borne by the patient, withthe rest covered by social health insurance or by the Government”. (WHO, Regional Office for the WesternPacific, “Governments not spending enough on health”, press release, 3 Mar. 2010; available fromwww.wpro.who.int/media_centre/press_releases/pr20100303.htm).
ECONOMIC AND SOCIAL SURVEY OF ASIA AND THE PACIFIC 2010
150
populations, although the Government hasmade a concerted effort to extend it to migrantsand the rural population. In South Asian coun-tries only 8% of the population is covered byhealthcare programmes, compared to 20% forthe Asia-Pacific region in general.
Social protection systems can be strengthened inseveral ways. While systems vary across coun-tries for many reasons, a minimum floor of socialsecurity benefits for all citizens should include (a)guaranteed universal access to essential healthservices; (b) guaranteed income security for allchildren through family and/or child benefits; (c)guaranteed access to basic means-tested or self-targeted social assistance for the poor and theunemployed; and (d) guaranteed income securitythrough basic pensions for people in old age andpeople living with disabilities.120
Several Asian and Pacific countries provide ex-amples of ambitious social security pro-grammes. In 2001 Thailand took the historicstep of legislating full population coverage inhealth care by introducing a universal health-care scheme, popularly referred to as the “30-baht Scheme” from the amount initially stipu-lated as a co-payment. Any Thai citizen notalready covered by the social security healthinsurance scheme or the Civil Servants’ MedicalBenefit Scheme enjoy full access to health serv-ices provided by designated district-based net-works of providers -health centres, district hos-pitals and cooperating provincial hospitals. Theeligible population must register with the net-works to obtain a free insurance card. Theinitial 30 baht co-payment – a little less than $1– for each outpatient visit or hospital admissionhas been abolished and medications on pre-scription are also free of charge.121 Evaluationssuggest that the Scheme has succeeded inmaking the coverage of health-care servicesnear-universal and in significantly reducing
household out-of-pocket medical expenditures,thus demonstrating that universal health-care isachievable in a lower middle-income country.122
Another important type of social protection inAsia and the Pacific consists of public worksprogrammes aimed at reducing poverty. TheNational Rural Employment Guarantee Act(NREGA) of India provides a legal guarantee of100 days of employment every year for adultmembers of any rural household willing to dounskilled manual work at the statutory minimumwage, as discussed in chapter 2. The centralGovernment funds the cost of wages, 75% ofthe cost of materials, and part of the adminis-trative expenses; the remaining costs arefunded by State Governments. Participants inNREGA work in projects such as water conser-vation, flood control, irrigation and land develop-ment. The programme has many benefits, in-cluding the reduction of distress migration, em-ployment generation in the most distressed ar-eas, and improvements in the natural resourcebase for poor communities. Acknowledging thepotential of gender discrimination, the Act man-dates equality in wage payments of men andwomen and the availability of childcare at thework site. At least one third of NREGA benefici-aries must be women and women must berepresented in the management and monitoringof the programme as well as in its social audit.Where work is to be performed beyond 5 km oftheir residences, women should be given prefer-ence to work nearer to their residence andmembers of the same household should beallowed to work at the same work site. Finally,by recognizing a single person as a household,NREGA enables widows and other singlewomen to access the programme. Recent datashows an average female participation ratein the programme of 49.7%, with 22 of 32states exceeding the mandated rate of onethird.123
120 ESCAP, Economic and Social Survey 2009, p. 65.121 ESCAP, ADB and UNDP, Achieving the Millennium Development Goals, p. 61.122 Damrongplasit, Kannika, “Thailand’s universal coverage system and preliminary evaluation of its success”,
presentation at Freeman Spogli Institute for International Studies, Stanford University, 15 Oct. 2009; availablefrom http://iis-db.stanford.edu/evnts/5747/presentation_Kannika.pdf.
123 Data were obtained for fiscal year 2008/09 from the NREGA website, http://nrega.nic.in/writereaddata/mpr_out/nregampr_0809.html (accessed 17 Mar. 2010). (See also India, Ministry of Rural Development, 2008a).
A REGIONAL POLICY AGENDA FOR REGAINING THE DYNAMISM CHAPTER 4
151
A novel approach to social protection is the useof conditional cash transfers. An example isgiven by Pantawid Pamilyang Pilipino Program(“4Ps”) of the Philippines, which provides poorhouseholds with 500 pesos a month for theirhealth needs and a 300-peso educational sub-sidy for each child up to age 14. Poor familiescan get the educational subsidy for a maximumof three children. In return, beneficiaries arerequired to comply with the following conditions:(a) pregnant women must receive prenatal care,childbirth must be attended by a skilled ortrained person, and mothers must receive post-natal care; (b) children 0 to 5 years of age musthave regular health check-ups and vaccinations;and (c) children 6 to 14 must attend school atleast 85% of the time. Failure to comply withthose conditions could mean losing the subsidy.School principals and the municipal health offic-ers are tasked to monitor compliance. The ra-tionale for the conditions is to create incentivesfor the recipients to invest in their own humancapital. Such investments should give them, es-pecially the children, a better chance to exitpoverty permanently in the long term.
A promising policy framework for the implemen-tation of broad social protection policies in theregion is given by the 2004 Social Charter ofthe South Asia Association for Regional Coop-eration (SAARC). The charter emphasizes theimportance of the objective of reducing povertyin South Asia to (a) ensure that “every memberof society is enabled to satisfy basic humanneeds and to realize his or her personal dignity,safety and creativity” and (b) support economicgrowth. In order to achieve the goal, the Char-ter highlights the need for enshrining rights ofaccess to basic social services in national laws:
States Parties agree that access tobasic education, adequate housing,safe drinking water and sanitation,and primary health-care should beguaranteed in legislation, executiveand administrative provisions…124
To be sure, guaranteeing universal access to allthose basic services is expensive. A key concernof many low-income developing countries is theimplications for fiscal balances, especially be-cause of current budgetary strains. But given thelow coverage of social safety net programmes,public expenditures should be reprioritized so thatsuch programmes can be adequately financed.The reallocation of spending can be an importantsource of financing for an enhanced safety netpackage. Moreover, significant efficiency gainswithin the existing safety net system can berealized, under the right set of reforms, allowingcountries to consolidate small programmes,which might be unable to reach satisfactoryeconomies of scale individually.
Policies that generate incomeopportunities and improve access
to basic social services in rural areasare essential in reducing poverty
and rural-urban imbalances
A “green revolution” for food securityand poverty reduction
Poverty in Asia and the Pacific remains pre-dominantly a rural phenomenon. Up to 80% ofthe poor in China, India and Indonesia – 585million out of 731 million – lived in rural areasin 2005 (table 25, chapter 3). Policies thatpromote the generation of jobs, increase incomeopportunities in rural areas, and improve accessto basic social services are essential in reduc-ing poverty and rural-urban imbalances. Be-cause the rural poor derive most of their in-come from agricultural activities,125 policies tofacilitate the access of smallholder producers toland, agricultural inputs, extension services, fi-
124 SAARC, Social charter, available from http://www.saarc-sec.org/main.php?id=13.125 Davis, Benjamin, and others, “Rural income generating activities: a cross country comparison”, ESA Working
Paper No. 07-16 (Rome: FAO, 2007); available from ftp://ftp.fao.org/docrep/fao/010/ah853e/ah853e.pdf.
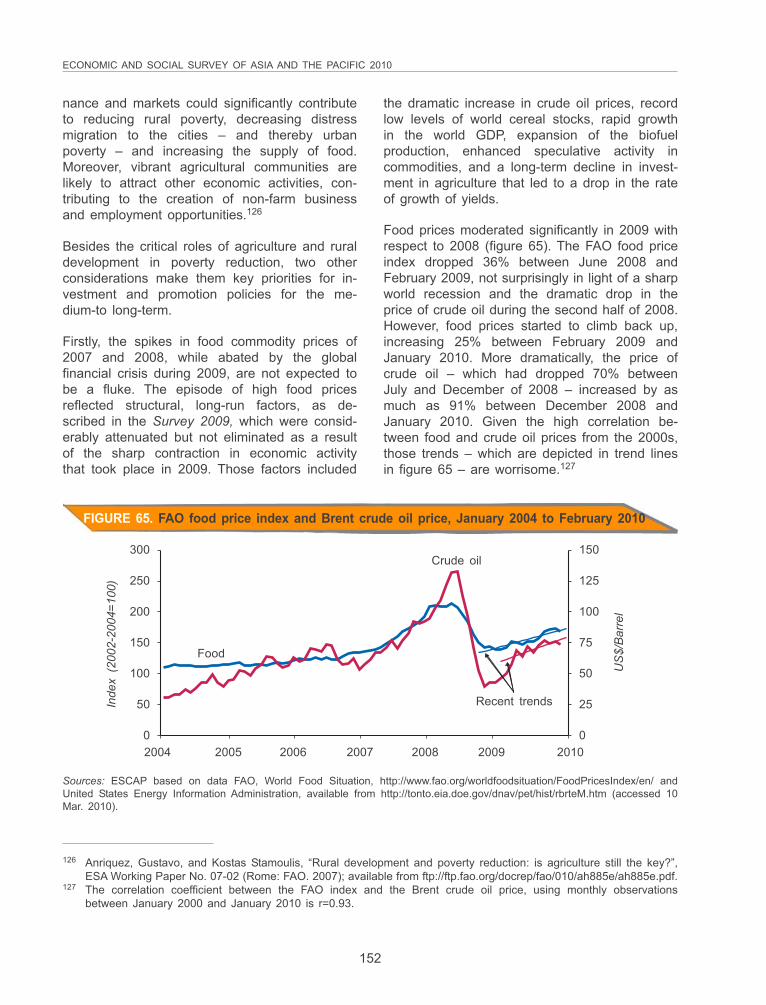
ECONOMIC AND SOCIAL SURVEY OF ASIA AND THE PACIFIC 2010
152
FIGURE 65. FAO food price index and Brent crude oil price, January 2004 to February 2010
300
250
200
150
100
50
0
Inde
x (2
002-
2004
=100
)
2004 2005 2006 2007 2008 2009 2010
150
125
100
75
50
25
0
US
$/B
arre
l
Food
Crude oil
Sources: ESCAP based on data FAO, World Food Situation, http://www.fao.org/worldfoodsituation/FoodPricesIndex/en/ andUnited States Energy Information Administration, available from http://tonto.eia.doe.gov/dnav/pet/hist/rbrteM.htm (accessed 10Mar. 2010).
Recent trends
nance and markets could significantly contributeto reducing rural poverty, decreasing distressmigration to the cities – and thereby urbanpoverty – and increasing the supply of food.Moreover, vibrant agricultural communities arelikely to attract other economic activities, con-tributing to the creation of non-farm businessand employment opportunities.126
Besides the critical roles of agriculture and ruraldevelopment in poverty reduction, two otherconsiderations make them key priorities for in-vestment and promotion policies for the me-dium-to long-term.
Firstly, the spikes in food commodity prices of2007 and 2008, while abated by the globalfinancial crisis during 2009, are not expected tobe a fluke. The episode of high food pricesreflected structural, long-run factors, as de-scribed in the Survey 2009, which were consid-erably attenuated but not eliminated as a resultof the sharp contraction in economic activitythat took place in 2009. Those factors included
the dramatic increase in crude oil prices, recordlow levels of world cereal stocks, rapid growthin the world GDP, expansion of the biofuelproduction, enhanced speculative activity incommodities, and a long-term decline in invest-ment in agriculture that led to a drop in the rateof growth of yields.
Food prices moderated significantly in 2009 withrespect to 2008 (figure 65). The FAO food priceindex dropped 36% between June 2008 andFebruary 2009, not surprisingly in light of a sharpworld recession and the dramatic drop in theprice of crude oil during the second half of 2008.However, food prices started to climb back up,increasing 25% between February 2009 andJanuary 2010. More dramatically, the price ofcrude oil – which had dropped 70% betweenJuly and December of 2008 – increased by asmuch as 91% between December 2008 andJanuary 2010. Given the high correlation be-tween food and crude oil prices from the 2000s,those trends – which are depicted in trend linesin figure 65 – are worrisome.127
126 Anriquez, Gustavo, and Kostas Stamoulis, “Rural development and poverty reduction: is agriculture still the key?”,ESA Working Paper No. 07-02 (Rome: FAO. 2007); available from ftp://ftp.fao.org/docrep/fao/010/ah885e/ah885e.pdf.
127 The correlation coefficient between the FAO index and the Brent crude oil price, using monthly observationsbetween January 2000 and January 2010 is r=0.93.
A REGIONAL POLICY AGENDA FOR REGAINING THE DYNAMISM CHAPTER 4
153
Secondly, by 2050 the population of Asia and thePacific is expected to increase by one and a halfbillion people and the demand for food and feedis expected to double from current levels. How-ever, according to current trends in yields, it isprojected that the region’s supply of grains by2050 will fall considerably short of matching thatincrease in demand.128 Therefore, investing inagriculture with the objective of increasing itsyields must be a top priority for the region.Achieving that objective is even more critical inthe face of unpredictable, but increasingly morecommon, extreme weather events such as pro-longed dry periods or heavy rainfall spells thatare known to reduce crop yields and causeextensive crop losses.129 Moreover, by someaccounts, if current warming trends continue, theyields of major food crops in tropical countriescould decrease by 20% to 30%.130
In past publications ESCAP has suggested spe-cific policy recommendations to achieve thosegoals.131 Here we highlight the need for the“second green revolution”. While the GreenRevolution of the last century achieved signifi-cant yield increases in the Asia-Pacific region, itbrought concomitant problems from its high in-puts of irrigation, chemical fertilizers, pesticidesand insecticides, and its excessive energy use.As Asian and Pacific economies rebalance, asecond green revolution is needed that canmove agriculture from high chemical and waterinputs to knowledge-intensive and sustainableagriculture. The second green revolution shouldintegrate the region’s unique traditional knowl-edge with advances in science and agriculturalengineering, including plant genetics, plant pa-thology and information and communicationtechnology. The approach should emphasizeecological sustainability with integrated pest andsoil fertility management, minimum tillage anddrip irrigation. A knowledge-intensive agriculturecommends itself also on the grounds of envi-
ronmental resilience and social inclusiveness asit attempts to return power to the producer –the farmer, especially women farmers.
To foster the second green revolution, Govern-ments should focus on the right factor inputs;namely,
assets such as land, tools, machinery andrenewable water and energy resources.efficient credit allocation through the promo-tion of financial inclusiveness.knowledge generation through publiclyfunded agricultural research and develop-ment together with agricultural extensionservices, to rapidly transfer and diffuseknowledge from the laboratory to the field.information and communication technologyapplicable to farming.
Furthermore, risk management and social pro-tection systems, such as crop insurance andimproved crop transport and storage systems,besides efficient rural infrastructure, need to beprovided.
The institutions that could provide critical helpfor farmers include those supporting extensioneducation, post-harvest processing, credit andmarketing, and communication connectivity in-cluding mobile phones. Farmers need them forhelp in meeting international standards, espe-cially in food safety. One reason why the ben-efits of higher food prices have not accrued tofarmers in many Asian and Pacific developingcountries is that institutions that allow farmers totake advantage of the higher food prices in theinternational market were not in place. Wher-ever institutions existed, farmers have reapedbenefit; Viet Nam is a case in point where smallfarmers have benefited from high internationalprices of rice by accessing export markets.
128 International Water Management Institute and FAO, Revitalizing Asia’s Irrigation: To Sustainably Meet Tomorrow’sFood Needs (Colombo: 2009); available from www.fao.org/nr/water/docs/Revitalizing_Asias_Irrigation.pdf.
129 Lansigan, Felino P., “Coping with climate variability and change in rice production systems in the Philippines” inRice is Life: Scientific Perspectives for the 21st Century, K. Toriyama, K.L. Heong and B. Hardy, eds. (Manila:International Rice Research Institute, 2009), pp. 542-545.
130 Science Daily, “Dramatic changes in agriculture needed as the world warms and grows”, 12 Feb. 2010; availablefrom http://www. sciencedaily.com/releases/2010/02/100211141140.htm.
131 ESCAP, Economic and Social Survey 2008; and ESCAP, Sustainable Agriculture and Food Security.
ECONOMIC AND SOCIAL SURVEY OF ASIA AND THE PACIFIC 2010
154
A key element here would be a system thatcould help small farms benefit from economiesof scale in marketing and assist them in meet-ing international standards. That role used to beplayed by parastatals, howsoever inefficiently,many of which were dismantled as a part ofliberalization, privatization and deregulation poli-cies under structural adjustment programmes.To provide for such needs, community-basedorganizations such as the self-help groups inIndia, the grass-roots non-governmental organi-zations (NGOs) and farmers’ organizations inthe Philippines such as the Indigenous Multi-Purpose Cooperative (IMPCI), Namitpitan BuloFarmers Associations Inc. (NBFAI), BadoDangwa Federation of Association and Coopera-tives (BDFCO) and Pide Aguid Fidilisan Multi-Purpose Cooperative (PAFMPCI) are showingthat they can do better than the erstwhile quasi-government agencies, if promoted and nurturedin an enabling environment.
The system of institutes of the ConsultativeGroup on International Agricultural Research(CGIAR) have a key role in generating newknowledge and technology in agriculture andputting it in the public domain, where it isavailable to national agricultural research sys-tems for adaptation to their geoclimatic condi-tions. Those institutes include the InternationalRice Research Institute (IRRI) in Los Baños,Philippines and the International Crop ResearchInstitute for Semi-Arid Tropics (ICRISAT) inHyderabad, India, among others. They shouldbe enabled by the international community toplay a similar role along with such institutionsas the Centre for Alleviation of Poverty throughSecondary Crops’ Development in Asia and thePacific (CAPSA) and Asian and Pacific Centrefor Agricultural Engineering and Machinery(APCAEM) of ESCAP.
One recent success story in agricultural trans-formation based on knowledge through interna-tional cooperation is the New Rice for Africa(NERICA) programme of the West African RiceDevelopment Association (WARDA; renamed
the Africa Rice Center). In 1994 NERICA devel-oped a new rice variety combining the besttraits of African and Asian rice varieties. As amajor collaborative project, it involved institu-tions in 17 African countries and the CGIARwith support from the Japanese Governmentand other multilateral donors. As a result of thegrowing demand for NERICA rice, cultivatedareas are being extended to 210,000 hectaresin West and Central Africa, exposing more than1.7 million African farmers to the new crop andassociated technologies. African rice productionhas increased to 744,000 tons per year withsavings of $88 million in rice imports.132 South-South and “triangular” cooperation are ought toplay an equally important role in fostering thesecond green revolution in Asia and the Pacific.
“Green growth”: new green industriesas engines of growth
Today’s challenges of combining developmentalaspirations with sustainability are even starkerthan before. Widespread environmental degra-dation and extreme weather events such asmore frequent and stronger tropical storms inthe Pacific and Indian oceans, record droughtsand more frequent flash floods, have made theAsia-Pacific region particularly crisis-prone. Thepoor bear a disproportionate burden of the ad-aptation costs. The new weather patterns arethe result of divergent global growth and risinginequality that has built up over many decades,as the quest for development and prosperityparticularly of the advanced economies has pro-duced the bulk of greenhouse gases. Develop-ing countries are deeply concerned that theirs isan environmentally constrained world, wheretheir efforts to catch up in growth and economicconvergence may be seriously limited.
ESCAP promotes the “Green Growth” approachthat emphasizes environmentally sustainable eco-nomic progress to foster low-carbon, sociallyinclusive development. Among the pillars of
132 Kumar, Nagesh, “South-South and triangular cooperation in Asia-Pacific: towards a new paradigm in developmentcooperation”, UNESCAP Working Paper WP/09/05 (Bangkok: ESCAP, 2009); available from www.unescap.org/pdd/publications/workingpaper/wp_09_05.pdf.
A REGIONAL POLICY AGENDA FOR REGAINING THE DYNAMISM CHAPTER 4
155
Green Growth are sustainable consumption andproduction, greening of businesses and markets,sustainable infrastructure, green tax and budgetreforms and investment in natural capital, asendorsed by the Fifth Ministerial Conference onEnvironment and Development in 2005.133 Eventhough no one size may fit all, the movement ofdeveloping countries towards environmentallysustainable consumption and production could befacilitated by the following policy measures.
the adaptation of existing technologies to localcontexts – have a critical role to play. Therationale for public intervention here is that actionto promote innovation has great social value butis poorly remunerated.134 Action for innovationmight not take place at all without Governmentsupport. Moreover, in the case of environmentallyfriendly technologies, innovation is critical as localconditions differ from one region to another andfrom one country to another. Government supportthat permits experimentation and knowledge-sharing could bring substantial sharing of benefitsand saving of resources, at the same timenurturing new frontiers of economic growth withinthe region. Government support for innovation indeveloping countries may be all the more criticalin view of barriers to entry in relevant fields fromcompetitive corporations that are themselves pro-tected by intellectual patent regimes and otherrestrictive practices.
Government support should cover the develop-ment and commercialization of environmentallyfriendly technologies that lead to affordableproducts and improve the wellbeing of the poorand rural populations. Rural solar electric sys-tems for homes, popularized by GrameenShakti in Bangladesh (box 8), is one suchtechnology.135 The Governments of Japan,China, India and the Republic of Korea, amongothers, have adopted measures to support de-velopment of such innovations as a part of theirnational action plans on climate change.136
China has become a top investor in clean en-ergy, with investments soaring by more than50% in 2009 to reach $34.6 billion; far ahead ofthe second largest investor, the United States,at $18.6 billion. The Chinese Government hasset some of the world’s most ambitious targets
Industrial policies – strategiccollaborations between the private
sector and the Government to uncoverand remove obstacles to the adoptionof new technologies or the adaptation
of existing technologies to localcontexts – have a critical role to play
in the promotion of investments inenvironmentally friendly technologies
First is the case for gearing industrial policy topromote investment in environmentally friendlytechnologies and products. Such investments arecritical, particularly during the early phases ofdevelopment and deployment of new technolo-gies. Green technologies need to be sustaineduntil they take root. They also need complemen-tary investments along the entire supply chain.Industrial policies – understood as strategic col-laboration between the private sector and theGovernment, aimed at uncovering and removingobstacles to the adoption of new technologies or
133 See ESCAP, Greening Growth in Asia and the Pacific, Sales No. E.09.II.F.6, available from www.unescap.org/esd/environment/publications/gg_asia_pacific/GreeningGrowth.pdf; and Navigating Out of the Crisis, ST/ESCAP/2538,available from www.unescap.org/tid/publication/tipub2538.pdf.
134 “If the entrepreneur fails in his venture, he bears the full cost of his failure. If he is successful, he has to sharethe value of his discovery with other producers who can follow his example and flock into the new activity”.(Rodrik, Dani, “Industrial policy for the twenty-first century”, CEPR Discussion Paper DP4767, Centre forEconomic Policy Research; available from www.cepr.org/pubs/dps/DP4767.asp).
135 “Grameen Shakti to launch solar power system in Dhaka, cities”, Bangladesh Economic News, 26 June 2009;http://bangladesheconomy.wordpress.com/2009/06/26/grameen-shakti-to-launch-solar-power-system-in-dhaka-cities/;“Bangladesh decides to use solar power to save energy”, Bermana, 5 Nov. 2009, http://www.bernama.com/bernama /v5/newsworld.php?id=452797.
136 ESCAP, Economic and Social Survey 2009, p. 80.
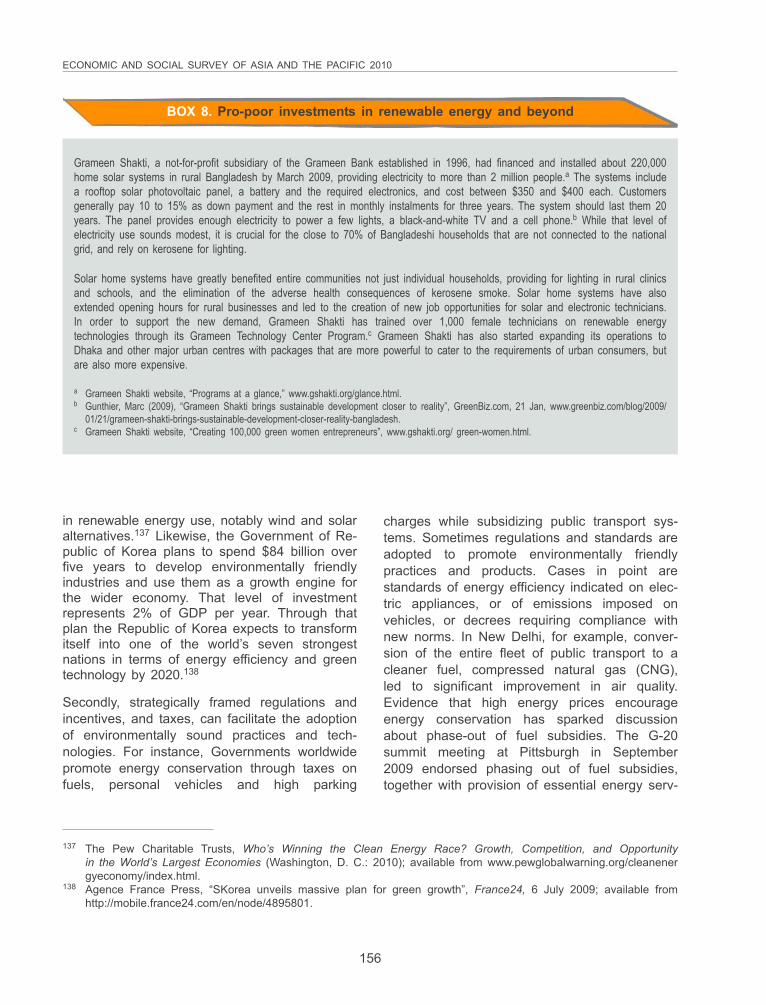
ECONOMIC AND SOCIAL SURVEY OF ASIA AND THE PACIFIC 2010
156
Grameen Shakti, a not-for-profit subsidiary of the Grameen Bank established in 1996, had financed and installed about 220,000home solar systems in rural Bangladesh by March 2009, providing electricity to more than 2 million people.a The systems includea rooftop solar photovoltaic panel, a battery and the required electronics, and cost between $350 and $400 each. Customersgenerally pay 10 to 15% as down payment and the rest in monthly instalments for three years. The system should last them 20years. The panel provides enough electricity to power a few lights, a black-and-white TV and a cell phone.b While that level ofelectricity use sounds modest, it is crucial for the close to 70% of Bangladeshi households that are not connected to the nationalgrid, and rely on kerosene for lighting.
Solar home systems have greatly benefited entire communities not just individual households, providing for lighting in rural clinicsand schools, and the elimination of the adverse health consequences of kerosene smoke. Solar home systems have alsoextended opening hours for rural businesses and led to the creation of new job opportunities for solar and electronic technicians.In order to support the new demand, Grameen Shakti has trained over 1,000 female technicians on renewable energytechnologies through its Grameen Technology Center Program.c Grameen Shakti has also started expanding its operations toDhaka and other major urban centres with packages that are more powerful to cater to the requirements of urban consumers, butare also more expensive.
a Grameen Shakti website, “Programs at a glance,” www.gshakti.org/glance.html.b Gunthier, Marc (2009), “Grameen Shakti brings sustainable development closer to reality”, GreenBiz.com, 21 Jan, www.greenbiz.com/blog/2009/
01/21/grameen-shakti-brings-sustainable-development-closer-reality-bangladesh.c Grameen Shakti website, “Creating 100,000 green women entrepreneurs”, www.gshakti.org/ green-women.html.
BOX 8. Pro-poor investments in renewable energy and beyond
in renewable energy use, notably wind and solaralternatives.137 Likewise, the Government of Re-public of Korea plans to spend $84 billion overfive years to develop environmentally friendlyindustries and use them as a growth engine forthe wider economy. That level of investmentrepresents 2% of GDP per year. Through thatplan the Republic of Korea expects to transformitself into one of the world’s seven strongestnations in terms of energy efficiency and greentechnology by 2020.138
Secondly, strategically framed regulations andincentives, and taxes, can facilitate the adoptionof environmentally sound practices and tech-nologies. For instance, Governments worldwidepromote energy conservation through taxes onfuels, personal vehicles and high parking
charges while subsidizing public transport sys-tems. Sometimes regulations and standards areadopted to promote environmentally friendlypractices and products. Cases in point arestandards of energy efficiency indicated on elec-tric appliances, or of emissions imposed onvehicles, or decrees requiring compliance withnew norms. In New Delhi, for example, conver-sion of the entire fleet of public transport to acleaner fuel, compressed natural gas (CNG),led to significant improvement in air quality.Evidence that high energy prices encourageenergy conservation has sparked discussionabout phase-out of fuel subsidies. The G-20summit meeting at Pittsburgh in September2009 endorsed phasing out of fuel subsidies,together with provision of essential energy serv-
137 The Pew Charitable Trusts, Who’s Winning the Clean Energy Race? Growth, Competition, and Opportunityin the World’s Largest Economies (Washington, D. C.: 2010); available from www.pewglobalwarning.org/cleanenergyeconomy/index.html.
138 Agence France Press, “SKorea unveils massive plan for green growth”, France24, 6 July 2009; available fromhttp://mobile.france24.com/en/node/4895801.
A REGIONAL POLICY AGENDA FOR REGAINING THE DYNAMISM CHAPTER 4
157
ices for those in need through the use oftargeted cash transfers, among other appropri-ate mechanisms.139
Thirdly, an important condition for ensuring envi-ronmental sustainability in developing countriesis to the availability of environmentally soundtechnologies. The United Nations FrameworkConvention on Climate Change (UNFCCC) pro-vides for the commitment of developed countriesto support developing countries, through transferof technology according to the principle of com-mon but differentiated responsibilities.140 Thebulk of the technology in the field is protected byintellectual property rights, such as patents thattend to be dominated by corporations based indeveloped countries. For instance, four fifths ofall renewable energy patents granted from 2000to 2004 are owned by the European Union, theUnited States and Japan (the “Group of 3”, orG-3); moreover, their share in motor-vehicleabatement technologies is as high as 95%.141
Such a high concentration of patent ownershipby private corporations based in a few devel-oped countries affects the access of developingcountries to relevant technologies.
Although transfer and dissemination of technol-ogy is an explicit objective of the Agreement onTrade-Related Aspects of Intellectual PropertyRights (TRIPs Agreement),142 which provides formeasures to prevent practices that adverselyaffect international transfer of technology,143 the
Agreement leaves the provisions for transfer oftechnology quite vague. The conditions, normsand practices for facilitating transfers of environ-mentally friendly technologies need to be de-fined. A review of the Agreement could addressthe important issue of transfer of technologyand conditions under which technologically lessadvanced countries could seek transfer of tech-nology from patent owners. Developing coun-tries can fully use the flexibilities provided in theTRIPs Agreement, including provisions for com-pulsory licensing in their own patent legislationin order to safeguard themselves from possibleabuses of monopoly power by patent owners asprovided by TRIPs.144 Discussions leading tothe recognition of public health related excep-tions showed some flexibility in interpreting whatconstitutes ‘exigent circumstances’ opening thedoor to potential use of these exceptions in theclimate change context.145
Alternative mechanisms to facilitate access ofdeveloping countries to new technologies havebeen suggested, such as technology pools inthe public domain, dedicated multilateral fundingmechanisms for supporting innovative activity indeveloping countries, and formation of R&D alli-ances involving developing country enter-prises.146
Fourthly, the UNFCCC also provides for finan-cial support from developed countries to aidadaptation efforts of developing countries. Multi-
139 The leaders of the Group of 20 endorsed the objective of phasing out fuel subsidies in September 2009. Theyalso recognized “the importance of providing those in need with essential energy services, including through theuse of targeted cash transfers and other appropriate mechanisms”. See Juliet Eilperin, “G20 leaders agree tophase out fossil fuel subsidies”, Washington Post, 25 Sept. 2009.
140 UNFCCC, “Draft Decision -/CP.15”, 18 Dec. 2009, available from http://unfccc.int/resource/docs/2009/cop15/eng/l07.pdf. [old 143].
141 United Nations, DESA, World Economic and Social Survey 2009: Promoting Development, Saving the Planet,Sales No. E.09.II.C.1, p. 128; available from www.un.org/esa/policy/wess/wess2009files/wess09/wess2009.pdf.
142 Article 7 of the TRIPs Agreement; see Annex 1C of the Marrakesh Agreement Establishing the World TradeOrganization, signed in Marrakesh, Morocco on 15 Apr. 1994; available from www.wto.org/english/tratop_e/trips_e/t_agm0_e.htm.
143 Ibid., Article 8.144 Ibid., Article 31.145 United Nations, DESA, World Survey 2009, p. 131.146 Ibid., chapter V.
ECONOMIC AND SOCIAL SURVEY OF ASIA AND THE PACIFIC 2010
158
lateral agencies such as the World Bank group,the Global Environment Facility (GEF) and indi-vidual Governments have initiated action in thatregard. Despite their efforts there is a stagger-ing difference between the sheer size of re-sources necessary for adaptation, which hasbeen estimated in the range of $50 billion to$100 billion per year (and of which about halfwould be needed in developing countries), andthe amount actually mobilized and available,which is about $154 million.147 The United Na-tions Climate Change Conference in Copenha-gen in December 2009 recognized that scaled-up, additional and adequate funding, as well asimproved access, should be provided to devel-oping countries to support enhanced action onmitigation. The collective commitment by devel-oped countries to provide new resources ap-proached $30 billion for the years from 2010 to2012. Developed countries also committedthemselves to jointly mobilizing $100 billiona year by 2020 to address the needs ofdeveloping countries.148
Finally, valuable opportunities present them-selves for sharing development experiences andbest practices among the developing countriesin the area of sustainable consumption andproduction. Developing countries in the regionhave demonstrated their capability in work onbiofuels, solar and wind power and waste man-agement, among others, that could be valuablefor others and could be fruitfully shared.ESCAP, for example, has helped cities in Bang-ladesh, Pakistan, Sri Lanka and Viet Nam inmanaging solid waste by replicating an initiativeof Waste Concern, a Bangladeshi NGO, usingdecentralized treatment plants.149
Enhancing financial inclusiveness
Patently, a well-functioning financial system iscrucial to economic growth. Inclusive financial
systems could likewise assist in poverty allevia-tion. From the perspective of the poor, an inclu-sive financial system would offer options foraccessing financial products and services. Thiscould include obtaining savings, credit and in-surance on favourable terms and conditions andaccessing payments services for undertakingtransactions and remittances in a secure andcost-effective manner. Robust evidence fromseveral ESCAP member countries shows thatpoor households with access to financial serv-ices can improve their economic well-being,while they invest in children’s education, andenjoy better nutrition and health status, thansimilar households without such access. Fur-thermore, women of such households havebeen found to increase their role in decision-making, contributing to improve the welfare ofchildren.
147 Ibid., pp. 93 onward; see also Khor, Martin, “Copenhagen: key issues facing developing countries”, South CentreClimate Policy Brief; available from www.southcentre.org/index.php?option=com_content&task=view&id=1130&Itemid=1.
148 Copenhagen Accord, paragraph 8: UNFCCC, “Draft Decision”.149 ESCAP, Economic and Social Survey 2009, p. 83.
The poor are typically excluded fromaccessing core services offered by theformal financial sector such as savings,
credit, insurance and payments
Unfortunately, across most developing countriesof Asia and the Pacific, financial services areused by only a small proportion of the popula-tion. Only in a handful of countries do morethan half the households have access to formalfinancial services. The vast majority of thepopulation in most of those countries, especiallythe poor and those slightly above the povertyline, are typically excluded from accessing thecore services offered by the formal financialsector, such as savings, credit, insurance andpayments. Most countries have far to go inorder to achieve financial inclusiveness.
A REGIONAL POLICY AGENDA FOR REGAINING THE DYNAMISM CHAPTER 4
159
Barriers to financial access exist on both thedemand side and supply side. The demand-sidefactors are primarily the capacity of potentialclients to deal with banks, including their literacylevels, income, occupation and the appropriate-ness of the services and products on offer.On the supply side the factors include theperception of banks about the profitability andrisks involved in dealing with poor customersand the cost of dealing with a large numberof clients carrying out very small transactions.Moreover, the banking system is fraught withseveral built-in biases such as the locationand business hours of banks, costs, andcultural prejudices of banking staff that preventthe poor and women from accessing bankingservices.
Most countries typically have a range of finan-cial institutions, among which commercial banksare central to the financial system. Commercialbanks have historically had only limited successin reaching out to the poor. Capital markets(equity and bond markets) by their nature havea very limited role in achieving financialinclusiveness as they cater to investment needsof relatively larger enterprises. Others suchas development finance institutions andmicrofinance institutions have had relativelymore success at reaching out to the poor andto the small and microenterprises. Furthermore,public and technology-enabled networks such aspost offices, telecommunications companiesand the Internet also hold potential for bringingforth financial inclusiveness.
To promote inclusive banking, Governmentsshould foster efficient and fair banking withsafety features such as a well-defined lender oflast resort, a deposit insurance agency, safecash remittance and transit facilities, and aninstitutional mechanism to deal with distressedbanks. An inclusive banking policy shouldgo hand in hand with development projectsand provision of other services to the poorsuch as health and education, so that they can
equip themselves to make use of bankingservices.
The regulatory environment should aim to en-courage a diversity of financial service providerswho can increase the options available to thepoor. Policymakers should ensure that fewerentry barriers exist for new institutions, as in atiered system of banking, while allowing soundexisting institutions to develop appropriate bank-ing services. Flexibility in terms of ownershipregulations and reduced capital requirementsshould be the norm for service providers thatreach out to the poor. Tax incentives could alsobe provided to encourage more inclusivemicrofinance-type lending, by commercial banks.Concurrently, the Government might also encour-age widespread use of information and commu-nications technologies to provide “branchlessbanking” services to the poor in villages and inremote areas through innovative partnershipswith NGOs, microfinance institutions, post of-fices, telecommunications companies and otherlocal entities such as village shopkeepers. Anew range of products and services to help thepoor improve their livelihood can be providedsuch as mobile banking services, microsavings,microcredit, microrepayment, microremittancesand microinsurance.150.
Governments could aim to improve the bankingarchitecture by establishing institutions thatfacilitate financial inclusiveness such as creditbureaus and credit guarantee funds formicrofinance activities. The regulatory environ-ment could be improved with accounting andaudit standards for microfinance institutions andother potential new entrants for financialinclusiveness. Governments might also under-take large-scale financial literacy campaigns toequip the poor to benefit from financial inclu-siveness. Banks could be encouraged to offerconvenient branches along transportation routesand provide mobile banks, on vans, boats orother appropriate vehicles, to extend their reachto the poor and in remote areas.
150 ESCAP, “Theme Study” for the Sixty-sixth Commission Session (forthcoming).
ECONOMIC AND SOCIAL SURVEY OF ASIA AND THE PACIFIC 2010
160
Enhanced access of the excluded poor throughmicrofinance and microinsurance, among othermeans, may protect them against thevulnerabilities that they face and assist them inexploiting opportunities for self-employment.Many successful experiments in Asia and thePacific are enhancing financial inclusiveness.The scope is wide for sharing the best practicesfor everyone’s benefit.
EXPANDING DEMAND THROUGHCOOPERATION
Some might say that the policy recommenda-tions discussed above would be more feasiblein certain countries than in others because ofthe heterogeneity of the Asia-Pacific region.Larger countries, especially those with high sav-ings and overall prudent macroeconomic objec-tives, are much more likely to be able torebalance growth strategies to enhance the do-mestic consumption of the poor than aresmaller countries. Similarly, countries with moredeveloped and technically advanced economieshave a higher potential for innovating andadapting green technologies that are likely to bein high demand in future. Smaller and lessdeveloped countries are less likely to be able toimplement such policies on their own. Thosecountries did not exhibit the same resilienceduring the crisis and went into recession. At thesame time, vast opportunities remain untappedin those countries. Benefits could be garneredfrom the markets and dynamism of their largerand more advanced counterparts. In turn, theircomparative advantages to bring enhancedefficiencies to regional supply chains would ben-efit the larger and more advanced countries ina mutually supportive manner. Action needs tobe taken to unlock those potential develop-ments.
The case has been made for Asian and Pacificcountries to embark on a new developmentparadigm whose strategic goal is to become amore integrated and competitive matrix whichcan generate its own rapid growth that is inclu-sive and sustainable.
Boosting regional economic integration has be-come an imperative: the region needs to findnew sources of economic growth from within. Todate the connections with Europe and NorthAmerica have been better than with each other.Until the global recession hit, that pattern servedthe region well. Historical, political and topo-graphical reasons have played their part – theorientation of maritime transport networks, forexample, has been directed towards the majorseaports which in turn provided connections on-ward to Europe, North America and elsewhere.Furthermore, the emergence of new countriessince the Second World War has engenderednon-physical barriers, such as regulatory con-trols, at new borders where previously transportnetworks had been relatively well connected.The physical and non-physical barriers to tradeand transport have significantly increased thecosts of moving goods across borders, which inturn has induced reductions in the volumes ofintra- and inter-regional overland trade. In thefinancial sphere the case is no different: mas-sive savings in the region had to be invested inlow-interest debt of the United States and otherdeveloped countries (albeit to a lesser extent inthe latter) because of the relatively less devel-oped state of regional financial architecture, de-spite the huge investment needs of the region.There are serious institutional, market and policyobstacles to channelling those savings to moreprofitable and socially desirable investmentswithin the region. Large investment opportunitieswith higher returns are available in the region,but first the issues of availability of finance, itscosts, overall risk perceptions and enabling con-ditions for wider public-private partnerships mustbe addressed.
In sum, obstacles at the regional level persist.The deficiencies are part of existing develop-ment gaps. They cover a wide spectrum of
Boosting regional economic integrationhas become an imperative: the region
needs to find new sources ofeconomic growth from within
A REGIONAL POLICY AGENDA FOR REGAINING THE DYNAMISM CHAPTER 4
161
constraints in the institutional and physical infra-structure as well as existing policy obstacles.Addressing the deficiencies should be delayedno longer because the benefits of economicintegration need to be spread among low-in-come economies and the vast swathes of poorpeople who remain far behind – living on lessthan $1.25 per day. The future of the regiondepends on narrowing those gaps.
The remaining pages of this Survey focus onidentifying opportunities and proposing the re-gional actions that Governments, regional or-ganizations such as the Association of South-east Asian Nations (ASEAN) and SAARC, andinstitutions such as ESCAP and ADB couldfacilitate in reforming the policy agenda. Fourelements are presented here that could lever-age complementarities across the region andlay the foundations for an inclusive and sustain-able path for development.
Evolving a broader framework foreconomic integration
Asia and the Pacific have lagged behind otherregions in exploiting the potential of regionaleconomic integration – Europe, North America,South America and Africa have all establishedsome form of customs unions and even mon-etary unions.
Cooperation in the Asia-Pacific region is fos-tered by such groups as ASEAN in South-EastAsia, SAARC in South Asia and the Bay ofBengal Initiative for Multi-Sectoral Technical andEconomic Cooperation (BIMSTEC) in South andSouth-East Asia that promote regional tradingand investment arrangements. Among themASEAN is the most advanced in economic co-operation with plans of forming an ASEAN Eco-nomic Community by 2015. Besides deepeningeconomic integration between member coun-tries, ASEAN is bringing together six large Asianand Pacific economies as partners (Japan,China, the Republic of Korea, India, Australiaand New Zealand) and negotiating “ASEAN+1”free-trade agreements with them. The interac-tion has also encouraged many other bilateralfree-trade agreements among ASEAN and its
partners or among the partners themselves, re-sulting is an Asian “noodle bowl” phenomenon.Other trade arrangements are developing, suchas the Asia-Pacific Trade Agreement (APTA)under ESCAP auspices, that brings togetherBangladesh, India, Sri Lanka, China, the Repub-lic of Korea and the Lao People’s DemocraticRepublic, with Mongolia among others, showinginterest. Functional groupings such as the AsianCooperation Dialogue (ACD) promote regionalcooperation in specific sectors.
Despite the complex network of political group-ings, Asian and Pacific leaders have articulateda vision through various fora, of a unified eco-nomic space that would evolve over time. Mov-ing from vision to action requires identifying anapproach whereby all perceive that the eco-nomic and social benefits override geopoliticalsensitivities.
With growth poles such as China andIndia along with economic powerhouseslike Japan, a unified Asia-Pacific markethas the potential to emerge as a centre
of gravity in the world economy
With growth poles such as China and Indiaalong with economic powerhouses like Japan, aunified Asia-Pacific market has the potential toemerge as a centre of gravity in the worldeconomy. Two proposals are helping to broadenthe regional arrangements driven by ASEAN: (1)an East Asia free-trade agreement (EAFTA) thatwould ally ASEAN+3 countries and is beingconsidered in the ASEAN+3 summit framework;and (2) a comprehensive economic partnershipof East Asia (CEPEA) that would cover a free-trade agreement, trade facilitation and economiccooperation and would combine ASEAN with itspartners Australia, China, Japan, India, NewZealand and the Republic of Korea in the EastAsia Summit (EAS) framework. At their lastmeeting in Hua Hin, Thailand, in October 2009,the EAS leaders examined the EAFTA and
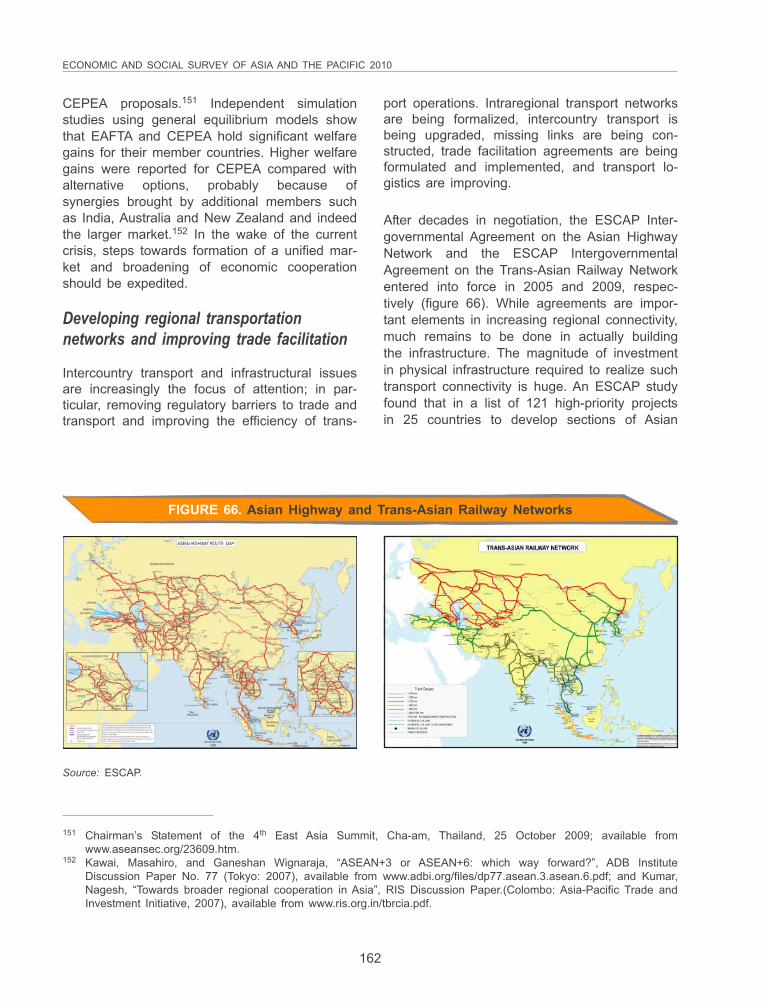
ECONOMIC AND SOCIAL SURVEY OF ASIA AND THE PACIFIC 2010
162
CEPEA proposals.151 Independent simulationstudies using general equilibrium models showthat EAFTA and CEPEA hold significant welfaregains for their member countries. Higher welfaregains were reported for CEPEA compared withalternative options, probably because ofsynergies brought by additional members suchas India, Australia and New Zealand and indeedthe larger market.152 In the wake of the currentcrisis, steps towards formation of a unified mar-ket and broadening of economic cooperationshould be expedited.
Developing regional transportationnetworks and improving trade facilitation
Intercountry transport and infrastructural issuesare increasingly the focus of attention; in par-ticular, removing regulatory barriers to trade andtransport and improving the efficiency of trans-
port operations. Intraregional transport networksare being formalized, intercountry transport isbeing upgraded, missing links are being con-structed, trade facilitation agreements are beingformulated and implemented, and transport lo-gistics are improving.
After decades in negotiation, the ESCAP Inter-governmental Agreement on the Asian HighwayNetwork and the ESCAP IntergovernmentalAgreement on the Trans-Asian Railway Networkentered into force in 2005 and 2009, respec-tively (figure 66). While agreements are impor-tant elements in increasing regional connectivity,much remains to be done in actually buildingthe infrastructure. The magnitude of investmentin physical infrastructure required to realize suchtransport connectivity is huge. An ESCAP studyfound that in a list of 121 high-priority projectsin 25 countries to develop sections of Asian
151 Chairman’s Statement of the 4th East Asia Summit, Cha-am, Thailand, 25 October 2009; available fromwww.aseansec.org/23609.htm.
152 Kawai, Masahiro, and Ganeshan Wignaraja, “ASEAN+3 or ASEAN+6: which way forward?”, ADB InstituteDiscussion Paper No. 77 (Tokyo: 2007), available from www.adbi.org/files/dp77.asean.3.asean.6.pdf; and Kumar,Nagesh, “Towards broader regional cooperation in Asia”, RIS Discussion Paper.(Colombo: Asia-Pacific Trade andInvestment Initiative, 2007), available from www.ris.org.in/tbrcia.pdf.
FIGURE 66. Asian Highway and Trans-Asian Railway Networks
Source: ESCAP.
A REGIONAL POLICY AGENDA FOR REGAINING THE DYNAMISM CHAPTER 4
163
Highway routes, member States were alreadyinvesting or had committed to invest $25 billion.However, the study found that an additional $18billion was necessary in upgrading and improv-ing 26,000 km of the existing Highway. For theTrans-Asian Railway, similar levels of investmentneed to be budgeted to build the missing links,upgrade existing routes and, most significantly,ensure interoperability across borders.
Even before the entry into force of the networkAgreements, member countries have considered“essential that Governments take a leading rolein more effectively integrating the different formsof transport in order to develop sustainableintermodal transport systems that deliver effi-cient domestic transport services and at thesame time provide access to international mar-kets and wider hinterlands”.153 The value ofsetting a long-term vision for an international,integrated, intermodal transport system in Asiaand the Pacific has been recognized by succes-sive Ministerial Conferences. The developmentof such an integrated system requiresintermodal transfer points where goods, contain-ers or vehicles can be trans-shipped onto themost economical and energy-efficient mode oftransport for specific segments of their move-ment from origin to destination. The transferpoints connecting different inland transportationmodes like highways, railways or waterways areknown as “dry ports”.
Dry ports are equipped to transfer goods, con-tainers and vehicles between modes. They havecustoms clearance facilities that give them asimilar status to seaports or international airports.They may also provide facilities for product grad-ing, sorting and packaging. The areas surround-ing dry ports may develop into special economiczones that provide opportunities to act as growthpoles in the deeper hinterland. In a number ofcountries and country groups in the region, theconcept of the transport corridor is beingadopted. Examples include the domesticMumbai-New Delhi corridor in India; the North-South, East-West and other corridors of theGreater Mekong Subregion (GMS);154 and the sixCentral Asia Regional Economic CooperationCorridors (CAREC).155 Economic corridors linkingdry ports can become valuable means of inclu-sive growth that spread economic activity to thehinterland and bring new investment and employ-ment opportunities to impoverished regions, whilereducing pressure on the coastal areas.
Trade procedures involved in movinggoods from the factory to the closestseaport take an average of over 60
days in landlocked countries
Without sound legal and regulatory bases forvehicles, goods and people to cross bordersand transit countries, no international traffic canmove along the infrastructure. Decades of policyfocus in many countries on trade with devel-oped countries that transits seaports and air-ports has resulted in neglect of trade issueswith land borders. Slow and costly processes,formalities and procedures hinder movement ofgoods. That translates into a big disadvantage,particularly for landlocked countries where tradeprocedures involved in moving goods from thefactory to the closest seaport take an averageof over 60 days, nearly twice the average forAsian and Pacific developing countries and 10times more than in Singapore. The complexprocedures increase transactional costs andcreate opportunities for rent-seeking that dis-courage cross-border trade. Ultimately, the con-siderable welfare loss on account of trade trans-action costs and time delays may wipe out thebenefits of trade liberalization in the region. Inaddition, physical and regulatory barriers totrade are an obstacle for the development ofborder areas.
153 Seoul Declaration on Infrastructure Development in Asia And The Pacific, adopted at the Ministerial Conferenceon Infrastructure held at Seoul from 12 to 17 November 2001, E/ESCAP/MCI(2)/Rep., 6 December 2001.
154 GMS comprises Cambodia, China (Yunnan Province and Guangxi Zhuang Autonomous Region), the Lao People’sDemocratic Republic, Myanmar, Thailand, and Viet Nam.
155 CAREC comprises Afghanistan, Azerbaijan, China, Kazakhstan, Kyrgyzstan, Mongolia, Tajikistan and Uzbekistan.
ECONOMIC AND SOCIAL SURVEY OF ASIA AND THE PACIFIC 2010
164
Trade and transport facilitation is the other sideof the connectivity coin. Facilitation at land bor-ders has taken second priority to issues oftrade with developed countries that transits sea-ports and airports. The problems usually resultfrom complicated, lengthy and frequently chang-ing procedures and documentation, different re-quirements in different countries, duplicated in-spections, and high charges. In some countries,traded goods have to be trans-loaded near bor-der crossings because trucks of some countriesare not permitted to cross borders or only per-mitted to travel a short distance in other coun-tries.
Too often has trade facilitation been narrowlyinterpreted as the modernization of customsclearance and technical controls at the border.Actually such procedures account for less thanone fifth of the time needed to move goodsfrom factory to ship. The most time is taken inpreparation of documents required for importsand exports, because of the large number ofagencies and organizations involved156 that dealwith trade, transport, customs, immigration, se-curity, health, veterinary and phytosanitary is-sues, and produce quality, as well as the privatesector. Its very multiplicity increases the difficultyin identifying and addressing bottlenecks indocumentation processes across entire interna-tional trade and transport chains. A morecomprehensive approach to trade facilitationadopted in many countries focuses on enhanc-ing coordination and collaboration between theofficial agencies involved as well as betweenthose agencies and the providers of transporta-tion, logistics, conformity assessment andfinancial services. The Republic of Korea, forexample, has implemented an electronic “single-window” system that links users with morethan 60 Government and private-sector organi-zations.
Efficiency levels vary greatly in the mix of tradeand transport facilitation in the region. Singa-
pore and Hong Kong, China rank among thebest performers in the world where export proce-dures take 6 days or less to complete and costless than $650 per container on average; incomparison, the same job in the G-7 countriesmight take 10 days and cost $1,124. However,the region is also home to some of the worstperformers whose export procedures consumemore than 75 days on average and cost over$3,000. On average, export procedures in Asianand Pacific developing countries take more than3 times longer to complete than in G-7 countries.The huge difference stems partly from the vol-ume of documents required in completing importand export procedures. Asian and Pacific firmsalso face trading costs that are on average 17%higher than those in the G-7 countries.
ASEAN leaders recognize the region’s potentialto flourish as a hub, at the crossroads of aneconomically vibrant region bounded by India tothe west, China, Japan and the Republic ofKorea in the northeast; and Australia and NewZealand in the south. At its Summit in October2009, ASEAN established the High-Level TaskForce together with ADB, ESCAP and the Eco-nomic Research Institute for ASEAN and EastAsia (ERIA) to study ASEAN’s internal and ex-ternal connectivity and to develop an ASEANmaster plan on regional connectivity.157
The imperative to strengthen regional connectiv-ity assumes new relevance as the value ofregional synergies and sources of demandemerges in the aftermath of the global crisis.Streamlining the flow of goods and servicesacross the region, as well as exploiting thepotential of investments in developing physicalinfrastructure, serves one of the key strategiesfor recovery: augmenting the aggregate de-mand. Governments need to identify the gaps inthe Asian Highway and TransAsian Railway net-works, prioritize them and act to develop them,besides strengthening the trade and transportfacilitation at the borders.
156 Examples include health authorities, agencies and service providers involved in ensuring conformity with productstandards prevailing in the destination country, port authorities, banks and immigration services.
157 See ASEAN Leaders’ Statement on ASEAN Connectivity, Cha-am, Hua Hin, Thailand, 24 October 2009.
A REGIONAL POLICY AGENDA FOR REGAINING THE DYNAMISM CHAPTER 4
165
Strengthening connectivity throughinformation and communicationstechnology (ICT)
Although the world had reached unprecedentedlevels of ICT penetration by the end of 2008,with over 4 billion mobile cellular subscriptions,1.3 billion fixed telephone lines and close toone quarter of the world’s population using theInternet, major imbalances across and withincountries remained.158 In all economies mobilephone use has increased tremendously, facilitat-ing the expansion of markets, business andpublic services. On average, the Asia-Pacificregion has over 50 mobile subscribers per 100persons, but access to mobile communicationranges widely in the region from as low as 0.8subscribers per 100 persons in Myanmar andKiribati to 177 in Macao, China. The digitaldivide is even starker regarding access toInternet services. In 2008, there were 78Internet users per 100 persons in the Republicof Korea, 69 in Japan, 67 in Singapore and 63in Malaysia, compared with only 0.5 in Cambo-dia, 0.3 in Bangladesh and 0.1 in Myanmar andTimor-Leste. Broadband subscribers in the re-gion are still few: about 4 subscribers per 100persons and an average of only 0.02 for least-developed countries.
The extent to which a country connects with theregion and the rest of the world can be gaugedby its available international bandwidth, whichvaries enormously by country. Low bandwidthfurther limits the extension of Internet use sincemany developing countries rely on content andapplications from overseas. A number of initia-
tives are under way to increase bandwidth capac-ity available to Asian and Pacific countries, suchas the recently concluded Asia-America GatewayCable System which links the United States withseveral South-East Asian countries,159 and initia-tives to reutilize underused cables, especiallyfirst-generation fibre-optic cables that connectunderserved Pacific islands developing countrieswith global telecommunications networks.160
In parallel with increasing external connectivityis a push by Governments to share or expandbackbone infrastructure, in many cases throughregional ICT cooperation. One such example isthe Greater Mekong Subregion InformationSuperhighway project; it reached an importantmilestone recently in inaugurating a fibre-opticnetwork with a transmission speed of 620 Mbpsand construction and upgrades of stations alongthe route, linking Cambodia, the Lao People’sDemocratic Republic, Myanmar, Viet Nam, Thai-land and Yunnan Province of China.161
Besides facilitating the expansion of marketsand business opportunities, ICT connectivity canplay a role in bringing social and economicbenefits and in poverty reduction. For instance,the South Asia Subregion Economic Coopera-tion (SASEC) Information Highway project forIndia, Bangladesh, Nepal and Bhutan aims toset up village networks that are expected toexpand broadband wireless connectivity to ruralcommunities and improve their access to serv-ices such as telemedicine, distance learning,and e-government services.162
ICT connectivity can also play a key role inconnecting remote communities and providing
158 International Telecommunications Union, Trends in Telecommunication Reform 2009: Hands-on or Hands-off?Stimulating Growth through Effective ICT Regulation, 10th ed. (Geneva: 2009); available from www.itu.int/publ/D-REG-TTR.11-2009/en.
159 Othman, Azlan, “Tests completed on Asia-America gateway”, Brudirect.com, 11 Nov. 2009; available from www.brudirect.com/index.php/2009111110259/Local-News/tests-completed-on-asia-america-gateway.html.
160 ESCAP, Enhancing Pacific Connectivity: the Current Situation, Opportunities for Progress, Sales No. E.08.II.F.14(Bangkok: 2008); available from www.unescap.org/idd/Pubs/st_escap_2472.pdf.
161 Xinhua News Agency, “Cambodia, China complete phase 1 of GMS Information Highway Project”, People’s DailyOnline, 15 July 2009; available from http://english.people.com.cn/90001/90776/90883/6701499.html.
162 iGovernment, “Four South Asian countries to set up info-highway”, New Delhi, 16 October 2007; available fromwww.igovernment.in/site/four-south-asian-countries-to-set-up-info-highway/.
ECONOMIC AND SOCIAL SURVEY OF ASIA AND THE PACIFIC 2010
166
them with access to educational services. Forinstance, the University of the South Pacificnetwork links 14 campuses in 12 countries(Cook Islands, Fiji, Kiribati, the Marshall Islands,Nauru, Niue, Solomon Islands, Tokelau, Tonga,Tuvalu, Vanuatu and Samoa) through satellite-based ICT, providing audio- and video-conferencing, e-curricula, e-learning materialsand Internet services.163
Countries are committed to intraregional connec-tivity to enhance regional integration and eco-nomic growth in the near future. For instance, theASEAN ICT Master Plan 2010-2015 will reinforcethe role of ICT for ASEAN integration. Theirinitiatives will also lead into still undevelopedpotential for ICT: supporting early-warning sys-tems for disaster-preparedness with emergencyprocedures and response activities (box 9).
163 The University of the South Pacific, “USP – an introduction”; available from www.usp.ac.fj/index.php?id=usp_introduction.
In the first half of 2009, Asia and the Pacific saw 40 disasters that killed more than 1,000 people and affected 5.9 million otherlives. The economic damages were estimated at more than $1,500 million.a In September 2009, the region experienced multipledisasters over a brief time. Typhoon Ketsana hit the Philippines, Viet Nam, Cambodia and the Lao People’s Democratic Republic.A tsunami struck Samoa, American Samoa and Tonga. Two massive earthquakes rocked Sumatra, followed by devastatingtyphoons the next month that affected South-East Asian countries. All those disasters eroded social and economic developmentefforts leading toward achieving the Millennium Development Goals.
Despite rapid expansion in telecommunication connectivity, ICT tools have not been fully used to reduce the impact of disasters.Capacity is insufficient for analysing and interpreting data for evidence-based policymaking and decision-making. Access totelecommunication networks is limited during disasters. The challenges underline the need for Asian and Pacific countries toenhance regional connectivity and jointly address disaster preparedness, response and management that builds on the strengths ofeach country.
The ASEAN Agreement on Disaster Management and Emergency Response (AADMER) is an exemplary mechanism. The first ofits kind in the world, AADMER is a regional agreement that legally binds ASEAN member States together to promote regionalcooperation and collaboration in reducing disaster losses and intensifying joint emergency response to disasters in the ASEANregion. AADMER provides for disaster risk identification, monitoring and early warning, prevention and mitigation, preparednessand response, rehabilitation, technical cooperation and research, mechanisms for coordination, and simplified customs andimmigration procedures. AADMER also supports the establishment of the ASEAN Coordinating Centre for Humanitarian Assistancefor operational coordination of disaster management activities under the ASEAN Agreement. AADMER entered into force at theend of 2009.
Asian and Pacific countries could also leverage ICT resources and services that are available regionally and globally by joiningcooperative mechanisms and capacity-building programmes for disaster risk management being promoted by ESCAP, such as theRegional Space Applications Programme for Sustainable Development and the Sentinel Asia project, as well as the United NationsPlatform for Space-based Information for Disaster Management and Emergency Response being executed by the United NationsOffice for Outer Space Affairs. Tsunami-prone countries can seek support from sources such as the ESCAP Trust Fund forTsunami, Disaster and Climate Preparedness in strengthening their multi-hazard capacities and creating a regional early warningsystem for tsunami and other hazards.
a CRED, November 2009.
BOX 9. Connectivity for improved disaster preparedness, response and management
A REGIONAL POLICY AGENDA FOR REGAINING THE DYNAMISM CHAPTER 4
167
Developing financial architecture for crisisprevention and narrowing the gaps
The crisis has revealed the glaring lack offinancial tools available at regional level, beyondthose in the hands of Governments. While somecountries had built up sufficient reserves toprotect their balance of payments, less fortunatecountries had no recourse to regional sources ofassistance given the dearth of monetary andfinancial cooperation. The Asian Clearing Union,for example, has few members, remains fo-cused on the settlement of payments on tradetransactions among members, and does notdeal with exchange-rate stability. The AsianBond Fund, another regional initiative, remainssmall in scale and cannot yet serve as a cred-ible and cost-effective source of financing. TheChiang Mai Initiative (CMI) of ASEAN+3 (APT),the clearest example of a regional financialcooperation scheme, remains insufficiently devel-oped as a first source of assistance; somemembers found alternative sources of supportas discussed in chapter 1. The crisis also high-lighted how the lack of well-developed regionalfinancial architecture prevented efficient interme-diation between the region’s expanding foreignexchange reserves and its substantial unmetinvestment needs, thus leaving the central banksno option but to invest their reserves in UnitedStates Treasury bills and equivalent securities inthe West that earn poor, if not negative, returnsin real terms. In the aftermath of the crisis andneed for augmenting aggregate demand in theregion, the function of regional intermediationacquires a degree of criticality. Besides crisisprevention and intermediation between savingsand investment in the region, a regional financialarchitecture could also be instrumental in ex-change-rate coordination and in evolving a re-gional perspective and coordinated voice forreform of international financial architecture.
Enhanced regional cooperation should not beregarded as an alternative to full participation inglobal economic relations, but rather a comple-
ment, for filling in the gaps and putting in placebuilding blocks for multilateral cooperation at theglobal level. That was clearly recognized in theOutcome Document of the United Nations Con-ference on World Financial and Economic Crisisand Its Impact (2009):164
Given the sensitivity of regional andsubregional institutions to the spe-cific needs of their constituencies,we note the value of regional andsubregional cooperation efforts inmeeting the challenges of the globaleconomic crisis and we encourageenhanced regional and subregionalcooperation, for example, throughregional and subregional develop-ment banks, commercial and re-serve currency arrangements, andother regional initiatives, as contribu-tions to the multilateral response tothe current crisis and to improvedresilience to potential future crises.
Some of the elements needed for policy reformaction are discussed below.
Crisis prevention and management
For effective prevention of systemic crises, aregional crisis fund should include as manycountries of the region as possible. The quan-tum of funds should be sufficient for the fund toact as the lender of first recourse in the eventof macroeconomic or balance-of-payment diffi-culty. The fund should ideally include support fordomestic financial sectors in its remit, in addi-tion to balance-of-payments support to Govern-ments, to enable assistance to banks as wasundertaken by Governments in the UnitedStates and Europe during the current crisis. Thefund would require a physical infrastructure withwell-qualified staff to engage in monitoring ofemerging trends prior to and during crises, aswell as design of the terms associated with thesupport provided to Governments in the region.Availability of a well-endowed regional crisis-
164 United Nations Conference on the World Financial and Economic Crisis and Its Impact on Development, “Theworld financial and economic crisis and its impact on development: Report of the Secretary-General”, A/CONF.214/4, 24-26 June 2009.
ECONOMIC AND SOCIAL SURVEY OF ASIA AND THE PACIFIC 2010
168
response facility could reduce pressure on Gov-ernments to build large foreign-exchange re-serves for protecting their economies againstspeculative attacks and liquidity crises.
The crisis has provided a window of opportunityfor creating an effective regional crisis-responsefund. Although the opportunity became availableright after the 1997 crisis, the relatively rapidreturn of economic growth resulted in a loss ofpolicy urgency. The multilateralization of the APTCMI reserves pool in its present form couldevolve into a truly effective first line of defencefor the region, if its geographical coverage, sizeand functions were expanded. As long ago asthe eighth APT Finance Ministers’ Meeting inIstanbul in May 2005, there was an agreementto re-evaluate the process, including the possi-bility of regionalizing the arrangements.165 Therewas agreement on looking into developing acollective mechanism to activate the swaps. Theneed to improve on the extent of regional dia-logue and surveillance was also recognized, andto link them more closely and effectively withthe CMI. Progress on those issues was slightuntil recently. At the APT Finance Ministers’Meeting in Bali, Indonesia in May 2009, theAPT countries reached an agreement to trans-form the existing bilateral arrangements into aregional foreign reserve pool of $120 billion to“address short-term liquidity difficulties in theregion and to supplement the existing interna-tional financial arrangements”.166 The CMImultilateralization (CMIM) came into effect on 24March 2010.
The “Plus-Three” countries of China, Japan andthe Republic of Korea are committed to funding80%, to the pool while the 10 ASEAN memberswill share the remaining 20%. Of that amount,Japan will contribute $38.4 billion to the pool, aswill China (in conjunction with Hong Kong,China). Japan has also extended $60 billion
worth of yen-denominated swap facilities sepa-rately. The Republic of Korea will contribute$19.2 billion. Within ASEAN, Indonesia, Malay-sia, Thailand and Singapore will each contribute$4.77 billion and the Philippines will give $3.68billion. Other details remain unclear, though thesame conditions as with the CMI remain (i. e.,20% unrestricted borrowing and 80% balanceonly with IMF conditionalities). Importantly, theregional economies have agreed to create astronger regional surveillance system in con-junction with the ADB and the ASEAN Secre-tariat “to monitor and analyze regional econo-mies and support CMIM decision-making”.167
Presumably if and when this surveillance sys-tem is effectively established, the 20% of re-serve that can be tapped without IMFconditionality will be increased.
165 ASEAN, Joint Ministerial Statement of the 8th ASEAN+3 Finance Ministers’ Meeting, Istanbul, Turkey, 4 May2005, available at http://www.aseansec.org/17448.htm.
166 ASEAN, Joint Media Statement of the 12th ASEAN+3 Finance Ministers’ Meeting, Bali, Indonesia, 3 May 2009;available from: http://www.aseansec.org/22536.htm.
167 Ibid., paragraph 9.
Availability of a well-endowed regionalcrisis-response facility could reducepressure on Governments to buildlarge foreign-exchange reserves
Since the region holds reserves of almost $5trillion, the proposed reserve fund has the po-tential for significant expansion over time. Ex-pansion of membership to include key countriessuch as India also needs to be resolved if theCMIM is to evolve into a truly regional reservepool. The pool could involve three tiers of liquid-ity. The first tier would be CMIM-owned re-serves, which offer the highest degree of liquid-ity and have zero conditionality; however, thatwould be costly. The second tier would consistof all the countries’ own reserves placed withthe regional pool. The third tier would be con-
A REGIONAL POLICY AGENDA FOR REGAINING THE DYNAMISM CHAPTER 4
169
ventional IMF lending via its various facilities.168
With such a structure the degree of liquiditycould be inversely related to the degree ofconditionality. Such a regional reserve or insur-ance pool would help supplement the ongoingrestructured/new IMF lending facilities to fortifythe regional economies against future financialcrises.
Effective deepening of regional monetary inte-gration will not happen until there is consider-able strengthening of the regional surveillancemechanism with well-worked-out surveillanceand policy conditionality. The announcement ofstrengthening of surveillance alongside the crea-tion of the CMIM is therefore an important step.Nonetheless, surveillance in itself is insufficientif it lacks enforcement capacity that would en-able implementation of remedial action formember countries that might be running unsus-tainable policies.
There is the equally hard issue of what such aregional liquidity arrangement implies for ex-change-rate coordination. Countries with rela-tively stable fixed exchange rates would requiresomewhat greater reserves in managing theircurrencies and/or pursue much more disciplineddomestic economic policies, while countries run-ning more flexible regimes could potentiallycause or be faced with competitiveness pres-sures in the near term vis-à-vis the others, iftheir currencies were to appreciate or depreciatesharply.
Regional funding of development gaps
The crisis has exposed the need for regionalcooperation in funding action to close develop-ment gaps in an effort to augment aggregatedemand while fostering balanced and sustain-able development. The region’s stock of foreign
exchange reserves becomes particularly impor-tant if funding from foreign sources, throughofficial assistance and the private sector, islikely to be curtailed by resource constraints inthe developed world in the aftermath of thecrisis. To exploit the full potential of financialcooperation, financing regional integration anddevelopment, countries need to strike a collec-tive balance between, on the one hand, emerg-ing investment opportunities especially in re-gional public goods and, on the other, risingforeign-exchange reserves.
Until the crisis struck, the lack of depth inregional capital markets, and resulting percep-tions of risks and costs, drove regional funds toinvestments in developed countries. Far greateremphasis must be given to integrating regionalequity markets and fostering the development oflocal-currency bond markets at the regionallevel. Intraregional investment in local currencybonds has remained small because of exces-sive legal and institutional impediments, as wellas the lack of investment information.169 TheAsian Bond Market Initiative (ABMI),170 intendedto foster growth of local currency bond markets,has moved slowly as countries have remainedpreoccupied with addressing issues of harmoni-zation of rules and regulations. The ABMI hasnot spurred private investment as much ashoped because transparency in its investmenttargets and fund performance is lacking. Never-theless an excessive emphasis on growing capi-tal markets in the region may increase the riskof financial instability for economies by openingthemselves more to speculation. In sum, thecrisis makes a persuasive case for a return tofundamentals to ensure stability through greateruse of the banking system, combined with ef-fective regulations, to recycle regional savingsinto regional investments.
168 Rajan, R., and R. Siregar, “Centralized reserve pooling for the ASEAN+3 (APT) countries”, in Monetary andFinancial Integration in East Asia, vol. 1, The Way Ahead (Manila: ADB; United Kingdom: Palgrave McMillan;2004), pp. 33-34.
169 Arner, Douglas, Paul Lejot, and S. Ghon Rhee, Impediments to Cross-border Investments in Asian Bonds(Singapore: Institute of Southeast Asian Studies, 2005), chap. 4, pp. 21-50.
170 For general information, see ADB presentation, available from www.adbi.org/conf-seminar-papers/2005/06/17/1167.asean.abmi.presentation/.
ECONOMIC AND SOCIAL SURVEY OF ASIA AND THE PACIFIC 2010
170
One of the clearest alternative uses for someportion of these assets, both for domestic de-velopment and for increasing regional integra-tion, lies in funding for the massiveinfrastructural needs across Asia and the Pa-cific. ESCAP has been at the forefront of analy-sis regarding that issue for some years.171 Re-cent estimates indicate that the region needs anannual investment of more than $800 billion intransport, energy, water and telecommunica-tions, with an annual shortfall of more than$200 billion.172 A regional financial architecturecan develop the capacity to facilitate intermedia-tion between the region’s foreign exchange re-serves and the growing unmet investment re-quirements. The objective is to narrow the de-velopment gaps in the region while augmentingthe aggregate demand. The architecture couldinclude an infrastructure development fund man-aged by a regional institution. Mobilizing just 5%of the region’s reserves – currently at nearly $5trillion – would provide start-up capital of nearly$250 billion for the fund. It would be able tomobilize additional funds, as and when required,by issue of bonds to the central banks of theregion to enable them to park their foreign-exchange reserves. By co-financing viableprojects along with other sources, such anarchitecture could expedite investments ininfrastructural development, especially in cross-border connectivity linking poorer parts of theAsia-Pacific region with regional growth centres.
In sum, reserve pooling may be directed to-wards the twin goals of crisis management anddevelopment finance, to enhance managementof both roles in an integrated manner.
Trade finance
Another area in crisis management that lendsitself to regional cooperation is trade finance. Inthe 1997 crisis, trade finance to the regionseized up, although that was linked to percep-
tions of increased riskiness of domestic banks.Seizing up of trade finance in the current crisis,however, was not due to shortcomings of do-mestic banks but to generalized global unwilling-ness to lend between banks. The perceivedrisks involved in financing trade during the crisiscould be considered a form of market failure.Hence, Governments could have a role to playin mitigating the harm in a future crisis from thepaucity of trade finance. For instance, theycould provide export credit insurance and guar-antees as a way of lowering the commercialrisk in financing trade.173 Such countries asIndia, Indonesia and Thailand have alreadytaken such actions. Since trade finance risksare shared among partners in different coun-tries, regional collaboration has a role to play inthis area. Asia and the Pacific remains the onlydeveloping region in the world without its owntrade finance institution.
A new regional financial architecturecould facilitate the intermediation
between the region’s foreignexchange reserves and unmet
investment requirements tonarrow development gaps
171 ESCAP, Enhancing Regional Cooperation in Infrastructure Development Including That Related to DisasterManagement, Sales No. E.06.II.F.13, ST/ESCAP/2408 (New York: United Nations; Bangkok: 2006).
172 ADB and ADBI, Infrastructure for a Seamless Asia (Tokyo: 2009).173 ESCAP, Economic and Social Survey 2009, p. 35.
Regional exchange rate stability
Another pressing policy gap at the regional levelwhich has been brought into relief by the crisisis the lack of mechanisms for exchange ratecooperation. During the economic recoveryphase the pressure on countries to maintainexchange rate competitiveness in order not toimpair the revival of exports will increase. With-out cooperation the risk is that competitive de-valuation may be instigated which may not yield
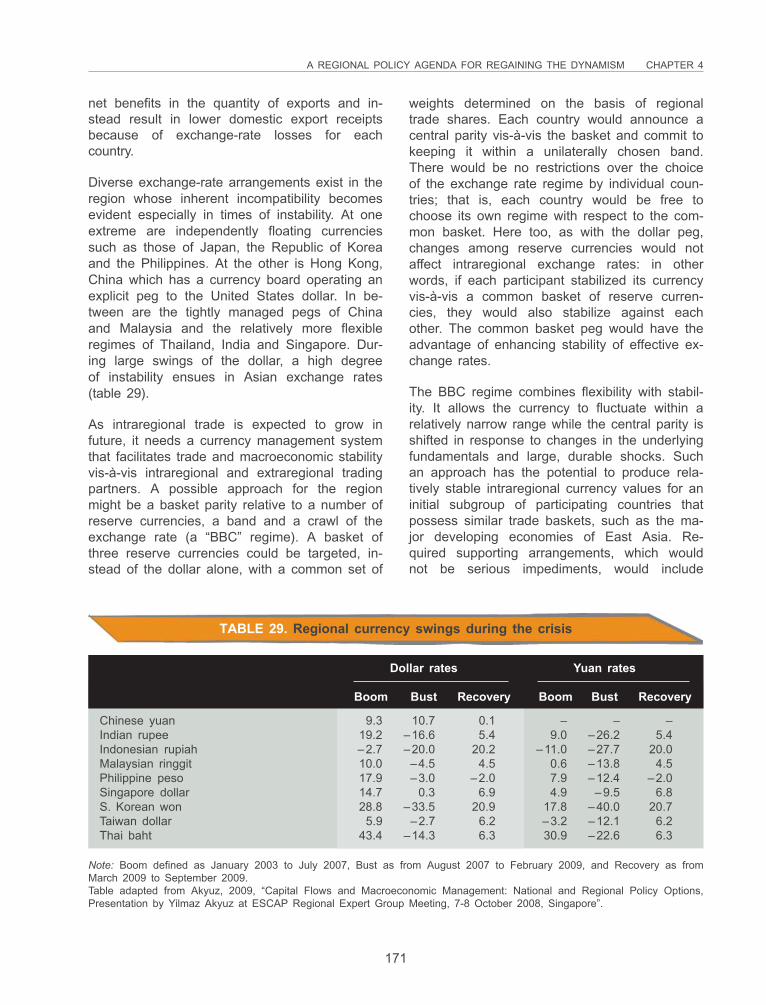
A REGIONAL POLICY AGENDA FOR REGAINING THE DYNAMISM CHAPTER 4
171
net benefits in the quantity of exports and in-stead result in lower domestic export receiptsbecause of exchange-rate losses for eachcountry.
Diverse exchange-rate arrangements exist in theregion whose inherent incompatibility becomesevident especially in times of instability. At oneextreme are independently floating currenciessuch as those of Japan, the Republic of Koreaand the Philippines. At the other is Hong Kong,China which has a currency board operating anexplicit peg to the United States dollar. In be-tween are the tightly managed pegs of Chinaand Malaysia and the relatively more flexibleregimes of Thailand, India and Singapore. Dur-ing large swings of the dollar, a high degreeof instability ensues in Asian exchange rates(table 29).
As intraregional trade is expected to grow infuture, it needs a currency management systemthat facilitates trade and macroeconomic stabilityvis-à-vis intraregional and extraregional tradingpartners. A possible approach for the regionmight be a basket parity relative to a number ofreserve currencies, a band and a crawl of theexchange rate (a “BBC” regime). A basket ofthree reserve currencies could be targeted, in-stead of the dollar alone, with a common set of
weights determined on the basis of regionaltrade shares. Each country would announce acentral parity vis-à-vis the basket and commit tokeeping it within a unilaterally chosen band.There would be no restrictions over the choiceof the exchange rate regime by individual coun-tries; that is, each country would be free tochoose its own regime with respect to the com-mon basket. Here too, as with the dollar peg,changes among reserve currencies would notaffect intraregional exchange rates: in otherwords, if each participant stabilized its currencyvis-à-vis a common basket of reserve curren-cies, they would also stabilize against eachother. The common basket peg would have theadvantage of enhancing stability of effective ex-change rates.
The BBC regime combines flexibility with stabil-ity. It allows the currency to fluctuate within arelatively narrow range while the central parity isshifted in response to changes in the underlyingfundamentals and large, durable shocks. Suchan approach has the potential to produce rela-tively stable intraregional currency values for aninitial subgroup of participating countries thatpossess similar trade baskets, such as the ma-jor developing economies of East Asia. Re-quired supporting arrangements, which wouldnot be serious impediments, would include
TABLE 29. Regional currency swings during the crisis
Dollar rates Yuan rates
Boom Bust Recovery Boom Bust Recovery
Chinese yuan 9.3 10.7 0.1 – – –Indian rupee 19.2 –16.6 5.4 9.0 –26.2 5.4Indonesian rupiah –2.7 –20.0 20.2 –11.0 –27.7 20.0Malaysian ringgit 10.0 –4.5 4.5 0.6 –13.8 4.5Philippine peso 17.9 –3.0 –2.0 7.9 –12.4 –2.0Singapore dollar 14.7 0.3 6.9 4.9 –9.5 6.8S. Korean won 28.8 –33.5 20.9 17.8 –40.0 20.7Taiwan dollar 5.9 –2.7 6.2 –3.2 –12.1 6.2Thai baht 43.4 –14.3 6.3 30.9 –22.6 6.3
Note: Boom defined as January 2003 to July 2007, Bust as from August 2007 to February 2009, and Recovery as fromMarch 2009 to September 2009.Table adapted from Akyuz, 2009, “Capital Flows and Macroeconomic Management: National and Regional Policy Options,Presentation by Yilmaz Akyuz at ESCAP Regional Expert Group Meeting, 7-8 October 2008, Singapore”.
ECONOMIC AND SOCIAL SURVEY OF ASIA AND THE PACIFIC 2010
172
greater intraregional capital-account opennessand access to intraregional reserves by thebasket of reserve currencies.174
change-rate vulnerability to short-term capital in-flows. The frequency and magnitude of financialcrises have given renewed and unprecedentedvigour to proponents of restraining cross-bordercapital movements. The discussion of capitalcontrols is highly complex with no definitivepolicy conclusion to date.
Restraints on capital movement may be dividedinto controls on capital account transactionsper se (“capital controls”) and controls onforeign currency transactions (“exchange con-trols”). Four key features of curbs on capitalmovement are whether they are (a) comprehen-sive or selective; (b) meant to be temporaryor permanent; (c) imposed on outflows orinflows; and (d) direct/administrative or price-based.
In view of relatively robust recovery in Asia andthe Pacific, the concern is that the huge volumeof liquidity in developed countries from loosemonetary policy will flow to the region in theform of short-term capital seeking good returns.Besides being highly volatile, such flows tend toput pressure on exchange rates of the hosteconomies, as discussed in Chapter 1. Hence,debate on the relevance of measures to moder-ate such inflows is increasing. Numerousmechanisms for managing capital inflows couldbe considered, ranging from administrativemeasures such as introducing deposit require-ments on capital inflows, to market-based in-struments such as levying financial transactiontaxes on inflows, including taxes that vary withthe maturity period of the capital inflow or whichare countercyclical; to “throw some sand in thewell-greased wheels” of international markets, inthe words of economist James Tobin who firstproposed it.175 Attention is being renewed toarrangements such as the Chilean unremuner-ated reserve requirements (URR) or Encaje,which appears to have been helpful in manag-
174 Reference regarding the proposal and analysis in the preceding paragraphs is made to Akyuz, Yilmaz, “Exchangerate management, growth and stability: national and regional policy options in Asia”, Policy Paper Series(Colombo: UNDP Regional Centre for Asia Pacific, 2009); available from www2.undprcc.lk/resource_centre/pub_pdfs/P1115.pdf.
175 Tobin, James, “A proposal for international monetary reform”, Eastern Economic Journal, vol. 4, Nos. 3-4, pp.153-159.
For regional cooperation in exchangerates to be effective in supporting
exports, all major exportingeconomies of the region
would need to be included
For regional cooperation in exchange rates tobe effective in supporting exports, all majorexporting economies of the region would needto be included. China’s return in the post-crisisperiod to its earlier managed-float system,would be a great help in supporting the recov-ery of Asia-Pacific exporting economies. Duringthe crisis China maintained a relatively fixedexchange rate to ensure stability for itseconomy when capital flows were excessivelyvolatile. Furthermore, China’s return to the bandsystem would help in promoting intraregionaltrade by further encouraging the economy’s shiftto a more consumption-led economy. Such adevelopment would boost China as a source offinal goods demand for exporting economies,besides assisting in macroeconomic manage-ment. It would also help the yuan graduallyemerge as a regional and eventually globalreserve currency. Such a trend could be criti-cally important for the region in coming yearsas it looks within itself for sources of finaldemand to replace the curtailed post-crisisspending power of developed economies.
Management of capital flows
The potential for exchange-rate cooperation ex-tends to the critical issue of managing ex-
A REGIONAL POLICY AGENDA FOR REGAINING THE DYNAMISM CHAPTER 4
173
ing capital surges when it was in place in the1990s,176 as well as Malaysian adoption of capi-tal controls following the 1997 crisis.
Notwithstanding the merits and demerits of vari-ous options, the appropriate level at which toenact such controls must be considered. Sincethe first entrant tends to be affected adverselyin a “prisoner’s dilemma” type of situation, suchmeasures yield optimal results when appliedglobally. Following an extensive debate on therelevance of such a tax to moderating the vola-tility of capital flows internationally,177 the IMFwas asked by the G-20 to examine the pro-posal. Besides moderating the volatility of flows,it has been argued that such taxes can gener-ate valuable revenue for funding global publicgoods such as poverty reduction and other Mil-lennium Development Goals. Given the scale ofdaily financial transactions, it has been esti-mated that even a very small tax can yieldsubstantial revenue. In case a global consensusfails to emerge, Asian and Pacific countries canconsider imposing such taxes regionally or evenindividually to moderate the instability caused byshort-term capital flows, as Brazil has donerecently. The IMF now acknowledges that con-trols on foreign capital in emerging economiescan be part of the policy options available toGovernments to counter the potentially negativeeconomic and financial effects of sudden surgesin capital.178
Evolving a regional perspective on reformof international financial architecture
The international community has addressed thereform agenda through a number of fora. Per-haps the most visible has been the emergenceof G-20 as the premier forum on global eco-nomic policy coordination, including global finan-cial and regulatory issues. The G-20 super-
sedes the G-8 and signals the systemic impor-tance of major emerging countries in the Asia-Pacific region, with the accession of China,India, Turkey, Indonesia, the Republic of Koreaand Australia to membership; besides Japanand the Russian Federation, already part of theG-8. Furthermore, the G-20 established the Fi-nancial Stability Board at the London Summit inApril 2009 with members from the central banksand other financial regulatory agencies of all G-20 member Governments of the Asia-Pacificregion. Notably, the membership of its pred-ecessor the Financial Stability Forum included asingle Asian country, Japan.
The Pittsburgh G-20 meeting held in September2009 made further progress in strengtheningcooperation in macroeconomic policies and giv-ing a more influential agenda-setting role tomajor developing economies of Asia and thePacific. An important reform undertaken therewas establishment of a peer review mechanismof the economic policy framework of G-20 coun-tries; for the first time, developing country mem-bers had the opportunity to review developedcountries’ policies and thus contribute to thetransparency of regulatory policies and account-ability of systemically important countries. Lead-ers also committed to a shift in the IMF quotashare to emerging market and developing coun-tries of at least 7%, although that has not yetcome into force. Finally, in the short term, lead-ers pledged that fiscal stimulus of developedcountries should not end prematurely as such anaction would hurt developing nations the most.
In general, the region has acquired an increas-ingly important voice through the representationof its major economies at the globalpolicymaking table. The enhanced role alsoplaces increased responsibility on those majoreconomies. Regulatory regimes, financial and
176 Bird, Graham, and Ramkishen S. Rajan, “Does FDI guarantee stability of international capital flows? Evidencefrom Malaysia”, Centre for International Economic Studies Discussion Paper No. 0044 (South Australia: AdelaideUniversity, 2000); available from www.adelaide.edu.au/cies/papers/0044.pdf.
177 Heaney, Vince, “Tobin tax talk not without merit”, Financial Times, 21 Dec. 2009, p. 24; available fromwww.ft.com/cms/s/0/06a8cade-ecc6-11de-8070-00144feab49a.html.
178 Ostry, Jonathan D., and others, “Capital inflows: the role of controls”, IMF Staff Position Note SPN/10/04, 19 Feb.2010, p. 15; available from www.imf.org/external/pubs/ft/spn/2010/spn1004.pdf.
ECONOMIC AND SOCIAL SURVEY OF ASIA AND THE PACIFIC 2010
174
non-financial institutions and policymaking or-gans will all be subjected to more stringentperformance and reporting requirements. Fur-thermore, those economies must deal with theexpectations of other developing countries thatare not part of the G-20 but expect progress inresolving shortcomings that continue to persist.
For example, reform of IMF conditionalities andother policies have not been tackled in sufficientscope. Some developing countries are askingfor a new approach in removing conditionalitiesthat could have procyclical effects.179 In theirview it would be more helpful for the IMF tofocus on providing sufficient funds to supportexchange rates while countries pursue expan-sionary policies to restart growth. Likewise, foreconomic crises a framework for debt standstillsand cancellations should be worked out, to obvi-ate the need for simultaneously dealing withdebt repayments. Progress remains sketchy onother fronts, including the issue of how best toreduce the scale of financial trading, possiblythrough a global tax on financial transactions (a“Tobin” tax) to moderate the volatility asdiscussed above and the design of a newglobal reserve currency system. Overall, underthe G-20 process, the structure of the currentfinancial system has remained fundamentallyunchanged. But at the same time the level ofrisk in the global financial system has grown, asthe concentration of systemically importantbanks engaged in unregulated activities in-creased along with the bailouts given to them.
The list of drawbacks emphasizes that no oneprocess can bring lasting change. Major draw-backs of the G-20 process include its limitationon membership and lack of a legal institutionalstructure, raising questions about its enforce-ment capacity.
Global cooperation on the future financial archi-tecture needs to proceed in parallel tracks, sothat countries that have been left out of the
G-20 process can voice their views. Themajority of the world’s people who have beenleft out are from developing countries that aremost dependent on globalization and yet aremost at risk from its deficiencies. For that rea-son, in providing analysis and technical supportand in building consensus through policydialogues, the United Nations has an importantcomplementary role. The United Nations Confer-ence on the World Financial and EconomicCrisis and Its Impact on Development was heldin New York from 23-24 June 2009, precededby the Commission of Experts of the Presidentof the General Assembly on the Reform ofInternational Monetary and Financial System;nearly all United Nations members could thusgather and devise a uniquely inclusive and com-prehensive agenda for action.
The Conference was able to highlight the chal-lenges faced by developing countries, especiallythe poorer ones. The meeting emphasized theplight of developing countries with the suddenreversal of private capital flows, large and vola-tile movements in exchange rates, falling rev-enues and reduced fiscal space for taking cor-rective measures. It called for a coordinatedand comprehensive global response to focus onrestoration of the flow of development financewithout unwarranted conditionalities and on debtrelief to developing countries for “fostering aninclusive, green and sustainable recovery”;among many other measures.
The Asia-Pacific region needs to formulate aposition on the issues emerging around reformof the international monetary and financial archi-tecture to promote stability and minimize therisk of future financial crisis. Debate continueson the relevance of a “Tobin tax” to moderatevolatility and on curbing excessive risk-taking offinancial institutions by restricting bank bonusesand introducing bank taxes. Debate also contin-ues on diversifying currency reserves from theUnited States dollar to other currencies or to a
179 A recent study has found that 31 of 41 IMF loan agreements with developing countries involved procyclicalmacroeconomic policies (Weisbrot, Mark, and others, IMF-supported Macroeconomic Policies and the WorldRecession: a Look at Forty-One Borrowing Countries [Washington, D. C.: Center for Economic and PolicyResearch, 2009], p. 4; available from www.cepr.net/documents/publications/imf-2009-10.pdf).
A REGIONAL POLICY AGENDA FOR REGAINING THE DYNAMISM CHAPTER 4
175
basket of currencies along the lines of the IMFSpecial Drawing Rights (SDRs). China has pro-posed the development of a transnational re-serve currency system, based on a basket ofthe world’s major currencies, similar to the cur-rent SDR scheme but with the basket of SDRcurrencies being expanded from the dollar,pound, euro and yen to include other Asiancurrencies.180 The Russian Federation has alsosupported the idea of using an expanded bas-ket of currencies as the basis for a globalreserve system, with a similar expansion in themix to include other currencies.181 The RussianFederation and China have taken practicalmeasures to support the increased use ofSDRs as an additional reserve currency. Forexample, in the IMF sale of $150 billion of SDRbonds in July, China purchased $50 billion andthe Russian Federation $10 billion, in effectdiversifying their reserves from dollars to thebasket of SDR currencies.
With 53 member States and 9 associate mem-bers, ESCAP could coordinate a common and
180 Zhao Xiaochuan, “Reform the international monetary system” speech by the Governor of the People’s Bank ofChina, 23 Mar. 2009; available from www.gov.cn/english/detail.asp?col=6500&id=178.
181 Embassy of the Russian Federation in the Kingdom of Norway, President of Russia Dmitry Medvedev’s addressto St. Petersburg International Economic Forum, plenary session, 5 Jun. 2009; available from www.norway.mid.ru/news_fp/news_fp_124_eng.html.
inclusive Asian and Pacific voice that could con-tribute in building reform in the global financialarchitecture. ESCAP has provided a forum forthe purpose: at its high-level policy dialogue inDhaka from 18 to 20 January 2010, financeministers and other senior officials of Asian andPacific least developed countries produced aregional review of the Brussels Programme ofAction on Least Developed Countries in whichthey raised their concerns about financing fordevelopment and sought representation at thenewly established Financial Stability Board es-tablished by the G-20.
The development of regional financial architec-ture may help Asian and the Pacific countries incoordinating their views for a position in thediscussion on international monetary reform andfinancial architecture. It may also help the re-gion avoid disruptions in the flow of develop-ment finance and preserve macroeconomic sta-bility. The aim is to resume the pre-crisis trajec-tory of regional growth and pursue the agendaof inclusive and sustainable development.

Pho
to: M
arie
Ang
e H
olm
gren
-Syl
vain

“As a region, we must build upon our collective strengths if we are not only to recover from the present crisis, but build the foundations for a more inclusive and sustainable society for all peoples of Asia-Pacific”
Noeleen HeyzerUnder-Secretary-General of the United Nations andExecutive Secretary of the United Nations Economic and Social Commission for Asia and the Pacific

ECONOMIC AND SOCIAL SURVEY OF ASIA AND THE PACIFIC 2010
178
REFERENCES AND FURTHER READINGS
179
Abella, Manolo and Geoffrey Ducanes (2009). The effect of the global economic crisis on Asian migrantworkers and Governments’ responses. Technical Note. Bangkok: ILO Regional Office for Asiaand the Pacific. Available from www.ilo.org/wcmsp5/groups/public/---asia/---ro-bangkok/documents/meetingdocument/wcms_101731.pdf.
Agence France Press (2009a). SKorea unveils massive plan for green growth. France24, 6 July. Available fromhttp://mobile.france24.com/en/node/4895801.
(2009b). Global crisis hits African investment: UN. News on African Politics, 18 September. Availablefrom www.africanpoliticsinfo.com/article/674708/?k=j83s12y12h94s27k02.
Ahmed, Mushir (2009). Grameen Shakti to launch solar power system in Dhaka, cities. Bangladesh EconomicNews, 26 June. Available from http://bangladesheconomy.wordpress.com/2009/06/26/grameen-shakti-to-launch-solar-power-system-in-dhaka-cities/.
Akyüz, Yilmaz (2008). The Current Global Financial Crisis and Asian Developing Countries. ESCAP Series onInclusive and Sustainable Development No. 2. Bangkok. Available from www.unescap.org/pdd/publica-tions/escap_series/ESCAP_ISD2_Akyuz_full.pdf.
(2009). Exchange Rate Management, Growth, and Stability: National and Regional Policy Options inAsia. Colombo: UNDP Regional Centre for Asia Pacific. Available from www2.undprcc.lk/resource_centre/pub_pdfs/P1115.pdf.
(2010). Global economic prospects: the recession may be over but where next? South Centre ResearchPaper 26. Available from www.southcentre.org/index.php?option=com_content&view=article&id=1250:global-economic-prospects-the-recession-may-be-over-but-where-next&catid=142:global-financial-and-eco-nomic-crisis&Itemid=67&lang=en.
Anand, Sudhir, and Amartya K. Sen (1994a). Human development index: methodology and measurement.Human Development Report Office Occasional Papers. New York: UNDP. Available from http://economics.ouls.ox.ac.uk/12469/1/HDI_methodology.pdf.
(1994b). Sustainable human development: concepts and priorities. UNDP Human Development ReportOffice. Available from http://hdr.undp.org/docs/publications/ocational_papers/Oc8a.htm.
Anriquez, Gustavo, and Kostas Stamoulis (2007). Rural development and poverty reduction: is agriculture stillthe key? ESA Working Paper No. 07-02. Rome: FAO. Available from ftp://ftp.fao.org/docrep/fao/010/ah885e/ah885e.pdf.
Arner, Douglas, Paul Lejot and S. Ghon Rhee (2005). Impediments to Cross-border Investments in AsianBonds. Singapore: Institute of Southeast Asian Studies.
Aschauer, David Alan (1989). Is public expenditure productive? Journal of Monetary Economics, vol. 23, No. 2(March), pp. 177-200.
Asia-Pacific Economic Cooperation (2009). 2009 Leaders’ Declaration: A new growth paradigm for a connectedAsia-Pacific in the 21st century. Statement by APEC Leaders. Singapore, 14-15 Nov. Available fromwww.apec.org/apec/leaders__declarations/2009/aelm_growthparadigm.html.
Asia-Pacific Research and Training Network on Trade (ARTNeT; 2009). APTIAD Interactive Trade Indicators.Available from www.unescap.org/tid/artnet/artnet_app/iti_aptiad.aspx.
REFERENCES AND FURTHER READINGS
ECONOMIC AND SOCIAL SURVEY OF ASIA AND THE PACIFIC 2010
180
Asian Development Bank (2008a). The US financial crisis, global financial turmoil, and developing Asia: is theera of high growth at an end? ADB Economics Working Paper Series, No. 139. Manila.
(2008b). Emerging Asia Regionalism: a Partnership for Shared Prosperity. Manila. Available fromwww.aric.adb.org/emergingasianregionalism.
(2009a). Asian Development Outlook 2009: Rebalancing Asia's Growth. Manila. Available fromwww.adb.org/Documents/Books/ADO/2009/.
(2009b). Asian Development Outlook 2009 Update: Broadening Openness for a Resilient Asia. Manila.Available from www.adb.org/Documents/Books/ADO/2009/update/default.asp.
(2009c). Key Indicators for Asia and the Pacific 2009. Manila. Available from www.adb.org/Documents/Books/Key_Indicators/2009/default.asp.
(2009d). Pacific Economic Monitor, No. 3 (November). Available from www.adb.org/Documents/Reports/PacMonitor/pem-issue03.asp.
(2010a). Central Asia Regional Economic Cooperation (CAREC). Available from www.adb.org/carec/about.asp.
(2010b). Pacific Economic Monitor, No. 4 (February). Available from www.adb.org/Documents/Reports/PacMonitor/pem-issue04.asp.
, Asia Regional Integration Center (2009a). Asia Economic Monitor (July). Available from http://aric.adb.org/pdf/aem/jul09/Jul_AEM_complete.pdf.
, Asia Regional Integration Center (2009b). Asia Economic Monitor (December). Available from http://aric.adb.org/pdf/aem/dec09/Dec_AEM_complete.pdf.
and Asian Development Bank Institute (2009). Infrastructure for a Seamless Asia. Tokyo: ADBI. Availablefrom www.iadb.org/intal/intalcdi/PE/2009/03979.pdf.
Association of Southeast Asian Nations (2005). The Joint Ministerial Statement of the 8th ASEAN+3 FinanceMinisters’ Meeting, Istanbul, Turkey, 4 May. Available from www.aseansec.org/17448.htm.
(2009a). The Joint Media Statement of the 12th ASEAN+3 Finance Ministers’ Meeting, Bali, Indonesia, 3May. Available from www.aseansec.org/22536.htm.
(2009b). Chairman’s statement, the 10th ASEAN Plus Three Foreign Ministers Meeting, 22 July 2009,Phuket, Thailand. Available from www.aseansec.org/PR-42AMM-Chairman-Statement-ASEAN+3.pdf.
(2009c). ASEAN Leaders’ Statement on ASEAN Connectivity, Cha-am, Hua Hin, Thailand, 24 October.Available from www.aseansec.org/23573.htm.
(2009d). Chairman’s Statement of the 4th East Asia Summit, Cha-am, Hua Hin, Thailand, 25 October.Available from www.aseansec.org/23609.htm.
(2009e). The Establishment of the Chiang Mai Initiative Multilateralization. Joint press release, 28December. Available from www.mof.go.jp/english/if/091228press_release.pdf.
Athukorala, P-C., and N. Yamashita (2006). Production fragmentation and trade integration: East Asia in aglobal context. North American Journal of Economics and Finance, vol. 17, No. 3 (December).
Awad, Ibrahim (2009). The Global Economic Crisis and Migration Workers: Impact and Response. Geneva:ILO. Available from www.ilo.org/wcmsp5/groups/public/---ed_dialogue/---actrav/documents/publication/wcms_112967.pdf.
REFERENCES AND FURTHER READINGS
181
Ban Ki-Moon (2009). If not now, when? Daily News (Egypt), 4 July. Available from www.un.org/sg/articleFull.asp?TID=103&Type=Op-Ed.
Bergsten, C. Fred, and Yung Chul Park (2002). Toward creating a regional monetary arrangement in East Asia.Research Paper 50. Tokyo: ADB Institute. Available from www.adbi.org/files/2002.12.rps50.regional.monetary.pdf.
BERNAMA (2009). Bangladesh decides to use solar power to save electricity. BERNAMA.com, MalaysianNational News Agency, 5 November. Available from www.bernama.com/bernama/v5/newsworld.php?id=452797.
Bernard, Steve, and others (2009). The greenest bail-out? Financial Times, 2 March. Available fromwww.ft.com/cms/s/0/cc207678-0738-11de-9294-000077b07658.html?nclick_check=1.
Bird, Graham, and Ramkishen S. Rajan (2000). Financial crises and the composition of international capitalflows: does FDI guarantee stability? CIES Discussion Paper No. 0044. South Australia: Centre forInternational Economic Studies, Adelaide University. Available from www.adelaide.edu.au/cies/papers/0044.pdf.
(2002). The evolving Asian financial architecture. Essays in International Economics No. 226. Princeton:International Economics Section, Princeton University.
Caliari, Aldo (2009). The financial crisis and trade in Asia: towards an integrated response in Asia.Proceedings from the ESCAP Regional High-Level Workshop on Strengthening the Response to theGlobal Financial Crisis in Asia-Pacific: The Role of Monetary, Fiscal and External Debt Policies. Dhaka,Bangladesh, 27-30 July.
Canning, David (1998). A database of world stocks of infrastructure. World Bank Economic Review, vol. 12,No. 3, pp. 529-547. Available from http://wber.oxfordjournals.org/cgi/issue_pdf/frontmatter_pdf/12/3.pdf.
CEIC Data Company Ltd. (2010). Global Database. Available from www.ceicdata.com/.
Chang-mock, Shin (2009). Korea focus: retrospect on Korean economy in 2009. CEO Information No. 736.Seoul: Samsung Economic Research Institute. Available from www.koreafocus.or.kr/design2/layout/content_print.asp?group_id=102863.
Chatani, Kazutoshi, and Kee Beom Kim (2009). Labour and social trends in Indonesia 2009: recovery andbeyond through decent work. Jakarta: ILO. Available from www.ilo.org/jakarta/whatwedo/publications/lang--en/docName--WCMS_119134/index.htm.
Chauffour, Jean-Pierre, and Thomas Farole (2009). Trade finance in crisis: market adjustment or marketfailure? Policy Research Working Paper 5003. Washington, D.C.: World Bank. Available from www-wds.worldbank.org/external/default/WDSContentServer/IW3P/IB/2009/07/20/000158349_20090720085356/Ren-dered/PDF/WPS5003.pdf.
China Daily (2009). Russia, China hold similar positions on financial reform. 31 March. Available fromwww.chinadaily.com.cn/china/g20/2009-03/31/content_7633245.htm.
(2010). Real estate prices rise at record pace. China sect., Economy, Beijing, 11 March. Available fromwww.chinadaily.com.cn/china/2010-03/11/content_9570137.htm.
Coady, David, and others (2006). The magnitude and distribution of fuel subsidies: evidence from Bolivia,Ghana, Jordan, Mali, and Sri Lanka. IMF Working Paper No. WP/06/247. Available from www.imf.org/external/pubs/ft/wp/2006/wp06247.pdf.
Cookson, Robert (2009). East Asia debt market ‘underdeveloped’. Financial Times, 15 September. Availablefrom www.ft.com/cms/s/0/95b0bbce-a225-11de-9caa-00144feabdc0.html.
ECONOMIC AND SOCIAL SURVEY OF ASIA AND THE PACIFIC 2010
182
Damrongplasit, Kannika (2009). Thailand’s universal coverage system and preliminary evaluation of itssuccess. Presentation at Freeman Spogli Institute for International Studies, Stanford University, 15October. Available from http://iis-db.stanford.edu/evnts/5747/presentation_ Kannika.pdf.
Davis, Benjamin, and others (2007). Rural income-generating activities: a cross-country comparison. ESAWorking Paper No. 07-16. Rome: FAO. Available from ftp://ftp.fao.org/docrep/fao/010/ah853e/ah853e.pdf.
Dean, J., K.C. Fung and Z. Wang (2008). How vertically specialized is Chinese trade? BOFIT DiscussionPapers 31/2008. Bank of Finland, Institute for Economies in Transition. Available from www.bof.fi/NR/rdonlyres/0F367D7B-DA85-4D13-8788-9E2EF25DFBCB/0/dp3108.pdf.
Dyurgerov, Mark B., and Mark F. Meier (2005). Glaciers and the changing earth system: a 2004 snapshot.Occasional Paper No. 58. Institute of Arctic and Alpine Research, University of Colorado. Available fromhttp://instaar.colorado.edu/other/download/OP58_dyurgerov_meier.pdf.
Easterly, William, and Rebelo, Sergio (1993). Fiscal policy and economic growth: an empirical investigation.Journal of Monetary Economics, vol. 32, No. 3 (December), pp. 417-58.
Economic Times (2009). India's June FDI up 8% in June at $2.58 billion. 20 August. Available from http://economictimes.indiatimes.com/news/economy/indicators/Indias-June-FDI-up-8-at-258-billion/articleshow/4913044.cms.
Economist Intelligence Unit, Country Analysis and Forecasts (2009, 2010). EIU CountryData. Accessible athttp://countryanalysis.eiu.com/.
Eichengreen, B. (2003). Capital flows and crisis. Cambridge, MA: MIT Press.
(2006). The parallel-currency approach to Asian monetary integration. American Economic Review, vol.96, No. 2.
Eilperin, Juliet (2009). G20 leaders agree to phase out fossil fuel subsidies. Washington Post, 25 Sept.Available from www.washingtonpost.com/wp-dyn/content/article/2009/09/25/AR200909250 2453.html.
Emirates Business 24-7 (2009). Domestic growth may help India's outward FDI. Available fromwww.business24-7.ae/opinion/analysis/domestic-growth-may-help-india-s-outward-fdi-2009-08-19-1.30387.
Epstein, Gerald (2009). Should financial flows be regulated? Yes. DESA Working Paper No. 77, ST/ESA/2009/DWP/77. New York: United Nations. Available from www.un.org/esa/desa/papers/2009/wp77_2009.pdf.
Fitoussi, Jean-Paul, and Joseph Stiglitz (2009). The ways out of the crisis and the building of a more cohesiveworld. Documents de Travail No 2009-17. Observatoire Francais des Conjonctures Economiques(OFCE). Available from http://econpapers.repec.org/RePEc:fce:doctra:0917.
Fix, M., and others (2009). Migration and the global recession. Policy Research Working Paper 5015.Washington, D.C.: Migration Policy Institute. Available from www.migrationpolicy.org/pubs/MPI-BBCreport-Sept09.pdf.
Food and Agriculture Organization of the United Nations (2009, 2010). World Food Situation: Food PriceIndices. Available from www.fao.org/worldfoodsituation/FoodPricesIndex/en.
Freund, Caroline (2009). The trade response to global downturns: historical evidence. Policy Research WorkingPaper 5015. Washington, D.C.: World Bank. Available from www-wds.worldbank.org/external/default/WDSContentServer/IW3P/IB/2009/08/06/000158349_20090806152233/Rendered/PDF/WPS5015.pdf.
Goldstein, Morris, and Daniel Xie (2009). The impact of the financial crisis on emerging Asia. PetersonInstitute Working Paper Series WP09-11. Washington, D.C.: Peterson Institute for International Econo-mics. Available from http://ideas.repec.org/s/iie/wpaper.html.
REFERENCES AND FURTHER READINGS
183
Grameen Shakti (2009a). Creating 100000 (one hundred thousands) green women entrepreneurs. In SolarEnergy Development Programme by Grameen Shakti. Renewable Energy & Environmental InformationNetwork. Available from www.reein.org/solar/gs/index.htm.
(2009b). Programs at a glance. Available from www.gshakti.org/index.php/programs-at-a-glance.html.
Greater Mekong Subregion (2010). Available from www.adb.org/GMS/.
, Environment Operations Center (2010). GMS Core Environment Programme. Available fromwww.gms-eoc.org/CEP/CEP.aspx.
Griffith-Jones, S., and J. A. Ocampo (2009). The financial crisis and its impact on developing countries.Working Paper No.53. Brasilia: International Policy Centre for Inclusive Growth. Available from www.ipc-undp.org/pub/IPCWorkingPaper53.pdf.
Gubert, Flore, and Christophe J. Nordman (2009). The Future of International Migration to OECD Countries.Paris: OECD.
Guhan, S. (1994). Social security options for developing countries. International Labour Review, vol. 133, No. 1.
Gunther, Marc (2009). Grameen Shakti brings sustainable development closer to reality in Bangladesh.GreenBiz.com, 21 January. Available from www.greenbiz.com/blog/2009/01/21/grameen-shakti-brings-sustainable-development-closer-reality-bangladesh.
Hausmann, Ricardo, Jason Hwang and Dani Rodrik (2005). What you export matters. NBER Working PaperNo. 11905. Cambridge, MA: National Bureau of Economic Research. Available from www.nber.org/papers/w11905.
Heaney, Vince (2009). Tobin tax talk not without merit. Financial Times, 21 December, p.24. Availableat www.ft.com/cms/s/0/06a8cade-ecc6-11de-8070-00144feab49a.html; and from www.offshoreannouncements.com/LatestNews/ArticleInformation/tabid/129/articleid/YpNQ6EmPbCUcV2Hwwrm-ow/Default.aspx.
Heyzer, Noeleen (2009). Keynote speech: Innovative government, innovation on the road to economicrecovery. Singapore, 3 December. Available from www.unescap.org/oes/statements/ST20091203-Innova-tive-Government.pdf.
and M. Khor (1999). Globalization and the way forward. Development Outreach “Speaker’s Corner”.Washington, D.C.: World Bank. http://devoutreach.com/summer99/Globalizationandthe WayForward/tabid/819/Default.aspx.
Hong Kong Special Administrative Region Government (2009). The 2009-10 Policy Address: Breaking newground together. October.
Huynh, P., S. Kapsos, K. B. Kim and G. Sziraczki (forthcoming). Impacts of the current global economic crisison Asia’s labour market. ADBI Discussion Paper. Tokyo: Asian Development Bank Institute.
iGovernment (2007). Four South Asian countries to set up info-highway. New Delhi, 16 October. Available fromwww.igovernment.in/site/four-south-asian-countries-to-set-up-info-highway/.
India (2008). NREGA Implementation Status Report for the Financial Year 2008-2009. Available from http://nrega.nic.in/writereaddata/mpr_out/nregampr_0809.html.
, Ministry of Finance (2010). Economic Survey 2009-2010. Available from http://indiabudget.nic.in/es2009-10/esmain.htm.
ECONOMIC AND SOCIAL SURVEY OF ASIA AND THE PACIFIC 2010
184
, Ministry of Rural Development (2008). The National Rural Employment Guarantee Act 2005 (NREGA):Operational Guidelines 2008. 3rd ed. New Delhi: Department of Rural Development. Available fromhttp://nrega.nic.in/Nrega_guidelinesEng.pdf.
Institute of Policy Studies of Sri Lanka (2009). Sri Lanka: State of the Economy 2009. Colombo: IPS.
Intergovernmental Panel on Climate Change (2007). Climate change 2007: the physical science basis –summary for policymakers. Geneva: IPCC. Available from www.aaas.org/news/press_room/climate_change/media/4th_spm2feb07.pdf.
International Labour Organization (2009a). Key Indicators of the Labour Market (KILM), 6th ed. Economic andLabour Market Analysis Department. Available at http://kilm.ilo.org/KILMnetBeta/default2.asp.
(2009b). Protecting People, Promoting Jobs: A Survey of Country Employment and Social ProtectionPolicy Responses to the Global Economic Crisis. ILO Report to the G20 Leaders’ Summit. Pittsburgh,24-25 September.
, Economic and Labour Market Analysis Department (2009). Trends Econometric Models. (Seewww.ilo.org/empelm/what/projects/lang--en/WCMS_114246/index.htm.)
International Monetary Fund (2009a). Regional Economic Outlook: Asia and the Pacific – Global Crisis: theAsian Context. World Economic and Financial Surveys. Washington, D.C. Available from www.imf.org/external/pubs/ft/reo/2009/APD/ENG/areo0509.htm.
(2009b). Asia and the Pacific: Building a Sustained Recovery. World Economic and Financial Surveys:Regional Economic Outlook (October). Washington, D.C. Available from www.imf.org/external/pubs/ft/reo/2009/apd/eng/areo1009.pdf.
(2009c). Bangladesh: 2009 Article IV Consultation – Preliminary conclusions of the IMF Mission.Available from www.imf.org/external/np/ms/2009/102909.htm.
(2009d). Bhutan: 2009 Article IV Consultation – Staff report; Staff supplement; and Public informationnotice on the Executive Board discussion. IMF Country Report No. 09/334. Washington, D.C.
(2009e). Democratic Republic of Timor-Leste: 2009 Article IV Consultation – Staff report; Publicinformation notice on the Executive Board discussion; and Statement by the Executive Director for theDemocratic Republic of Timor-Leste. IMF Country Report No. 09/219. Washington, D.C.
(2009f). Georgia: 2009 Article IV Consultation and Second Review under the Stand-by Arrangement –Staff report; Press release and public information notice on the Executive Board discussion; andStatement by the Executive Director for Georgia. IMF Country Report No. 09/127. Washington, D.C.
(2009g). International Financial Statistics. IFS Database and Browser on CD-ROM. Washington, D.C.
(2009h). Kyrgyz Republic: 2009 Article IV Consultation and First Review under the 18-month Arrange-ment under the Exogenous Shocks Facility – Staff report; Staff supplement; Public information noticeand press release on the Executive Board discussion; and Statement by the Executive director for theKyrgyz Republic. IMF Country Report No. 09/209. Washington, D.C.: IMF.
(2009i). Mongolia: First Review under the Stand-by Arrangement – Staff report; Press release on theExecutive Board discussion; and Statement by the Executive Director for Mongolia. IMF Country ReportNo. 09/254. Washington, D.C.: IMF.
(2009j). Public information notice: IMF Executive Board concludes 2009 Article IV Consultations. IMFNews. Available from www.imf.org/external/news/default.aspx?pn.
REFERENCES AND FURTHER READINGS
185
(2009k). Republic of Kazakhstan: 2009 Article IV Consultation – Staff report; Staff statement; Publicinformation notice on the Executive Board discussion. IMF Country Report No. 09/300. Washington,D.C.
(2009l). Russian Federation: 2009 Article IV Consultation – Staff report; Staff statement; Publicinformation notice on the Executive Board discussion. IMF Country Report No. 09/246. Washington,D.C.
(2009m). World Economic and Financial Surveys: World Economic Outlook Database (October 2009).Washington, D.C. Available from www.imf.org/external/pubs/ft/weo/2009/02/weodata/index.aspx.
(2009n). World Economic Outlook: Sustaining the Recovery (October 2009). World Economic andFinancial Surveys. Washington, D.C. Available from www.imf.org/external/pubs/ft/weo/2009/02/pdf/text.pdf.
(2010a). International Financial Statistics (IFS) Online Service. Available from www.imfstatistics.org/imf/.
(2010b). Direction of Trade Statistics database. Available from www2.imfstatistics.org/DOT/.
(2010c). World Economic Outlook Update: A Policy-driven, Multispeed Recovery, 26 January. Availablefrom www.imf.org/external/pubs/ft/weo/2010/update/01/index.htm.
International Organization for Migration (2009). The impact of the global economic crisis on migrants andmigration. IOM Policy Brief. Available from www.egypt.iom.int/Doc/IOM%20Policy%20Brief%20Financial%20Crisis.pdf.
International Telecommunications Union (2009). Trends in Telecommunication Reform 2009: Hands-on orHands-off? – Stimulating Growth through Effective ICT Regulation. 10th ed. Geneva. Available fromwww.itu.int/publ/D-REG-TTR.11-2009/en.
International Water Management Institute and Food and Agriculture Organization of the United Nations (2009).Revitalizing Asia's irrigation: to sustainably meet tomorrow's food needs. Colombo: IWMI-FAO. Availablefrom www.fao.org/nr/water/docs/Revitalizing_Asias_Irrigation.pdf.
Interstate Statistical Committee of the Commonwealth of Independent States (2009). Statistics. Available fromwww.cisstat.com/eng/index.htm.
Ito, Takatoshi (2006). A case for a coordinated basket for Asian countries. In A Basket Currency for Asia.Takatoshi Ito, ed. Ch. 6, pp. 124-141. London: Routledge.
Jomo, Kwame Sundaram (2010). Financing for Development and the MDGs, presentation at the Fourth High-Level Dialogue of the UNGA on Financing for Development, 24 March, available at www.un.org/esa/ffd/hld/HLD2010/presentation_jomo.pdf.
Kabeer, Naila (2009). Social protection in South Asia: a review. Brighton: Centre for Social Protection, Instituteof Development Studies. Available from www.ids.ac.uk/index.cfm?objectid=4A452CF9-E522-F732-EEF7B977C1F90545.
Kannan, K. P. (2007). Social security in a globalizing world. International Social Security Review, vol. 60, No.2-3. Available from http://papers.ssrn.com/sol3/papers.cfm?abstract_id=996144##.
Kawai, Masahiro, and Ganeshan Wignaraja (2007). ASEAN+3 or ASEAN+6: which way forward? ADB InstituteDiscussion Paper No. 77. Tokyo: Asian Development Bank Institute. Available from www.adbi.org/files/dp77.asean.3.asean.6.pdf.
Khan, Ashfaque H. (2009). Role of remittances. The News International, Pakistan, 8 September. Available fromwww.thenews.com.pk/editorial_detail.asp?id=197238.
ECONOMIC AND SOCIAL SURVEY OF ASIA AND THE PACIFIC 2010
186
Khor, Martin (2009a). Trade: protectionism on the rise hits developing countries hardest. TWN Info Service onWTO and Trade Issues (Feb09/09), 11 February. Available from www.twnside.org.sg/title2/wto.info/2009/twninfo20090208.htm.
, (2009b). Copenhagen: key issues facing developing countries. South Centre Climate Policy Brief.Available from www.southcentre.org/index.php?option=com_content&task=view&id=1130& Itemid=1.
Kim, Kee Beom, and others (2009). Impacts of the current global economic crisis on Asia’s labour markets.Presentation at the Labour Market in the People’s Republic of China and Its Adjustment to GlobalFinancial Crisis, Tokyo, 18-19 June. Available from www.adbi.org/conf-seminar-papers/2009/07/17/3221.impact.gec.asia.labour.markets/.
Knowles, J.C., E. M. Pernia and M. Racelis (1999). Social consequences of the financial crisis in Asia: thedeeper crisis. EDRC Briefing Notes No.16. Manila: ADB. Available from http://aric.adb.org/pdf/edrcbn/edrcbn17.pdf.
Kose, M. A., and others (2006). Financial globalization: a reappraisal. NBER Working Paper No.12484.Cambridge, MA: National Bureau of Economic Research. Available from www.brookings.edu/~/media/Files/rc/papers/2006/08globaleconomics_rogoff/20060823.pdf.
Kranendonk, Henk, and Johan Verbruggen (2008). Decomposition of GDP growth in European countries:different methods tell different stories. CPB Document No. 158. The Hague: CPB Netherlands Bureau ofEconomic Policy Analysis. Available from www.cpb.nl/eng/pub/cpbreeksen/document/158/doc158.pdf.
Krugman, Paul (2009). Oil speculation. The New York Times, Opinion sect., 8 July. Available from http://krugman.blogs.nytimes.com/2009/07/08/oil-speculation/.
Kumar, Nagesh (2007). Towards broader regional cooperation in Asia. UNDP/RCC Discussion Paper. Colombo:Asia-Pacific Trade and Investment Initiative. Available from www2.undprcc.lk/resource_centre/pub_pdfs/P1059.pdf.
(2009). South-South and triangular cooperation in Asia-Pacific: towards a new paradigm in developmentcooperation. UNESCAP Working Paper WP/09/05. Available from www.unescap.org/pdd/publications/workingpaper/wp_09_05.pdf.
and Prabir De (2008). East Asian infrastructure development in a comparative global perspective: ananalysis of RIS infrastructure index. RIS Discussion Papers RIS-DP # 135. New Delhi: RIS. Availablefrom http://www.ris.org.in/dp135_pap.pdf.
Kwon, Huck-Ju (2007). Transforming the developmental welfare states in East Asia. DESA Working Paper No.40. ST/ESA/2007/DWP/40. New York: United Nations. Available from www.un.org/esa/desa/papers/2007/wp40_2007.pdf.
Lansigan, Felino P. (2005). Coping with climate variability and change in rice production systems in thePhilippines. In Rice is Life: Scientific Perspectives for the 21st Century. K. Toriyama, K. L. Heong andB. Hardy, eds. Pp.542-545. Manila: International Rice Research Institute.
Macao Special Administrative Region Government (2009). Monthly Bulletin of Statistics, August. Available fromwww.dsec.gov.mo/Statistic/General/MonthlyBulletinOfStatistics.aspx?lang=en-US.
Marland, G., T. A. Boden and R. J. Andres (2008). Global, regional, and national CO2 emission estimates fromfossil fuel burning, cement production, and gas flaring, 1751-2002. Carbon Dioxide Information AnalysisCenter, Numeric Data Package. CDIAC_NDP-030. Available from http://cdiac.ornl.gov/ndps/ndp030.html.
Mukherjee, Amitava (2009). Securing Food Security in the Asia-Pacific Region: A Partial Analysis. Availablefrom www.unapcaem.org/publication/FoodInsecurity09.pdf.
Najib Tun Razak (2009). Sixth Annual Kuala Lumpur Islamic Finance Forum, speech. Kuala Lumpur: Office ofthe Prime Minister of Malaysia, 3 November. Available from www.pmo.gov.my/?menu=speech&news_id=173&page=1676&speech_cat=2.
REFERENCES AND FURTHER READINGS
187
Newfarmer, Richard (2009). The financial crisis, trade and effects on women. Presentation made at WomenLeading Change: Traction for Change, Geneva, 4 March. Available from www.intracen.org/womenandtrade/documents/Newfarmer_Women_and_Trade_March_4_ 2009.pdf.
Obstfeld, M., J. C. Shambaugh and A. M. Taylor (2008). Financial stability, the trilemma, and internationalreserves. NBER Working Paper 14217. Cambridge, MA: National Bureau of Economic Research.
Ocampo, José Antonio (2007). The instability and inequities of the global reserve system. DESA WorkingPaper No. 59. New York: United Nations. Available from www.un.org/esa/desa/papers/2007/wp59_2007.pdf.
Organisation for Economic Co-operation and Development (2008). OECD Economic Surveys: Korea. Paris.
(2009a). OECD Economic Outlook, No.86 (November 2009). Paris.
(2009b). OECD Economic Surveys: Japan. Paris.
(2009c). OECD Employment Outlook 2009: Tackling the Jobs Crisis. Paris.
(2009d). OECD in Figures 2009. Paris.
(2009e). OECD Regions at a Glance 2009. Paris.
(2010). Harmonised unemployment rates. News release, January. Paris.
Ostry, Jonathan D., and others (2010). Capital inflows: the role of controls. IMF Staff Position Note SPN/10/04.Available from www.imf.org/external/pubs/ft/spn/2010/spn1004.pdf.
Othman, Azlan (2009). Tests completed on Asia-America gateway. Brudirect.com, 11 November. Available fromwww.brudirect.com/index.php/2009111110259/Local-News/tests-completed-on-asia-america-gateway.html.
Panetta, F., and others (2009). An assesment of financial sector rescue programmes. BIS Paper No. 48.Basel: Bank for International Settlements. Available from www.bis.org/publ/bppdf/bispap48.pdf.
Papua New Guinea (2009, 2010). National Budget. Vol. 1, November.
, National Statistical Office (2009). Arrival and departure historical releases archive. Available fromwww.nso.gov.pg/Tourism/tourism.htm.
Persaud, Avinash (2009). We should put sand in the wheels of the market. Financial Times, Opinion sect., 27August. Available from www.ft.com/cms/s/0/08523a6a-934c-11de-b146-00144feabdc0.html.
Pew Charitable Trusts (2010). Who’s Winning the Clean Energy Race? Growth, Competition and Opportunity inthe World’s Largest Economies. G-20 Clean Energy Factbook. Washington, D.C.: The Pew CharitableTrusts. Available from www.pewglobalwarming.org/cleanenergyeconomy/pdf/PewG-20Report.pdf.
Philippine Information Agency (2009). Gov’t earmarks P1-B for Fil-Expat Livelihood Support Fund, PGMA tellsOFWs in Riyadh. Press release, 5 February. Available from www.pia.gov.ph/?m=12&sec=reader&rp=1&fi=p090205.htm&no=8&date=.
Pilling, David (2009). Mixed signals from Asia's animal spirits. Financial Times, 14 May. Available fromwww.ft.com/cms/s/0/2ba14cd2-3fef-11de-9ced-00144feabdc0.html.
ECONOMIC AND SOCIAL SURVEY OF ASIA AND THE PACIFIC 2010
188
Poon, Terence (2009). Foreign direct investment in China continues to slide. Wall Street Journal, Asia ed.,Economy sect. (online), 18 August. Available from http://online.wsj.com/article/SB125047781996935959.html?KEYWORDS=%22foreign+direct+investment+in+china+continues+to+slide%22.
Rajan, Ramkishen, and Reza Siregar (2004). Centralized reserve pooling for the ASEAN+3 (APT) countries. InMonetary and Financial Integration in East Asia; vol. 1: The Way Ahead. Manila: Asian DevelopmentBank; United Kingdom: Palgrave Macmillan.
Ratha, Dilip, Sanket Mohapatra and Ani Silwal (2009). Migration and remittance trends 2009: a better-than-expected outcome so far, but significant risks ahead. Migration and Development Brief 11. Washington,D.C.: World Bank.
Ravallion, Martin (2003). Measuring aggregate welfare in developing countries: how well do national accountsand surveys agree? The Review of Economics and Statistics, vol. 85, No. 3.
Reinhart, Carmen M., and Kenneth S. Rogoff (2009). The aftermath of financial crises. American EconomicReview, vol. 99, No. 2. Also publ. as NBER Working Paper No. 14656. Available from www.nber.org/papers/w14656.
, and Vincent R. Reinhart (2009). Capital flow bonanzas: an encompassing view of the past andpresent. In NBER International Seminar in Macroeconomics 2008. Jeffrey Frankel and ChristopherPissarides, eds. Chicago: National Bureau of Economic Research.
Republic of the Fiji Islands (2009). Economic and fiscal update: supplement to the 2010 budget address –Strengthening the foundations for economic growth and prosperity. Suva: Ministry of Finance andNational Planning. Available from www.mfnp.gov.fj/Documents/2010_Budget_Supplement.pdf.
, Fiji Island Bureau of Statistics (2009a). Visitor arrivals April 2009. Available from www.statsfiji.gov.fj/.
, (2009b). Visitor arrivals statistics. Available from www.statsfiji.gov.fj/Tourism/Visitor_Arrivals.htm.
Republic of Korea, Ministry of Foreign Affairs and Trade (2009). Joint Statement of the ASEAN-Republic ofKorea Commemorative Summit. Available from http://asean.korea.net/News/NewsView.asp?board_no=20876.
Research and Information System for Developing Countries (2008). South Asia Development and CooperationReport 2008. New Delhi: Oxford University Press.
Reserve Bank of Australia (2009). Statement of Monetary Policy. 6 November. Sydney: RBA. Available fromwww.rba.gov.au/publications/smp/2009/nov/html/index.html.
Reuters (2009). “Obama says U.S. can’t keep borrowing from China”, 14 May. Available from www.reuters.com/article/politicsNews/idUSTRE54D58Q20090514.
Rodrik, Dani (2004). Industrial policy for the twenty-first century. CEPR Discussion Paper DP4767. London:Centre for Economic Policy Research. Available from www.cepr.org/pubs/dps/DP4767.asp.
(2006). The social cost of foreign exchange reserves. International Economic Journal, vol. 20, No. 3(September). Also publ. as NBER Working Paper No. 11952, January. Available from www.nber.org/papers/w11952.
(2009). Growth after the Crisis. Cambridge, MA: Commission on Growth and Development. Availablefrom www.growthcommission.org/storage/cgdev/documents/financial_crisis/rodrikafterthecrisis.pdf.
and Arvind Subramanian (2009). Why did financial globalization disappoint? IMF Staff Papers 56,pp.112-138. Washington, D.C.: IMF. Available from www.fringer.org/wp-content/writings/rodrik-paper.pdf.
REFERENCES AND FURTHER READINGS
189
Rosen, Daniel H., and Thilo Hanemann (2009). China’s changing outbound foreign direct investment profile:drivers and policy implications. Policy Brief No. PB09-14. Washington, D.C.: Peterson Institute forInternational Economics. Available from www.iie.com/publications/pb/pb09-14.pdf.
Russian Federation, Embassy of the Russian Federation in the Kingdom of Norway (2009). President ofRussia Dmitry Medvedev’s Address to St. Petersburg International Economic Forum, Plenary Session, 5June. Available from www.norway.mid.ru/news_fp/news_fp_124_eng.html.
Sakakibara, Eisuke (2003). Asian cooperation and the end of Pax Americana. In Financial Stability and Growthin Emerging Economies: The Role of the Financial Sector. Jan Joost Teunissen and Mark Teunissen,eds., pp:227-240. The Hague: FONDAD. Available from www.fondad.org/product_books/pdf_download/8/Fondad-Stability-BookComplete.pdf.
Samoa, Ministry of Finance (2009). Quarterly Economic Review, No. 45 (April-June). Available fromwww.mof.gov.ws/uploads/quarterly_economic_review_iss_45.pdf.
Scrase, Ivan, and others (2009). Climate policy is energy policy. In Energy for the future: A new agenda. IvanScrase and Gordon MacKerron, eds. United Kingdom: Palgrave.
Shanghai Daily (2009). Concern over property prices. China.org.cn, 29 September. Available fromwww.china.org.cn/business/2009-09/29/content_18627727.htm.
Sim, William, and Nipa Piboontanasawat (2009). South Korea, China, Japan agree on currency swaps forstability. Bloomberg.com, 12 December. Available from www.bloomberg.com/apps/news?pid=20601089&sid=aMtclSyeEF8E.
Singh, Manmohan (2009). PM’s remarks at the G-20 meeting at Pittsburgh: Plenary Session. Pittsburgh, 25September. India: Prime Minister’s Office. Available from http://pmindia.nic.in/speech/content.asp?id=823.
Solomon Islands, National Statistics Office (2009a). Migration and tourism. Available from www.spc.int/prism/Country/SB/Stats/Migration%20and%20Tourism/Tour-Index.htm.
, (2009b). Visitor arrival – June Quarter 2007. Available from www.spc.int/prism/Country/SB/Stats.
Soubbotina, Tatyana P. (2004). Beyond Economic Growth: an Introduction to Sustainable Development. 2nd ed.Washington, D.C.: World Bank/IBRD.
South Asian Association for Regional Cooperation (2004). Social Charter. Kathmandu: SAARC. Available fromwww.saarc-sec.org/main.php?id=13.
Speck, Stefan (2008). Possibilities of environmental fiscal reform in developing countries. Paper for presenta-tion at Bank Indonesia Annual International Seminar, Macroeconomic Impact of Climate Change:Opportunities and Challenges, Bali, 1-2 August. Available from www.bi.go.id/NR/rdonlyres/57BF6537-1BEA-4D42-B476-209DC56F11DA/14255/StefanSpeckdoc.pdf.
State Bank of Pakistan. Annual Report 2008-2009 (Vol. I). Karachi. Available from www.sbp.org.pk/reports/annual/arFY09/qtr-index-eng-09.htm.
Stiglitz, Joseph E. (2010). Risk and global economic architecture: why full financial integration may beundesirable. NBER Working Papers No 15718. Cambridge, MA: National Bureau of Economic Re-search. Available from www.nber.org/papers/w15718.pdf.
, Amartya Sen and Jean-Paul Fitoussi (2009). Report by the Commission on the Measurement ofEconomic Performance and Social Progress. Available from www.stiglitz-sen-fitoussi.fr/documents/rapport_anglais.pdf.
ECONOMIC AND SOCIAL SURVEY OF ASIA AND THE PACIFIC 2010
190
Sudarshan, Ratna M. (2009). Examining India’s National Regional Employment Guarantee Act: its impact andwomen's participation. Social Protection in Asia Working Paper. New Delhi: Institute of Social StudiesTrust. Available from www.socialprotectionasia.org/pdf/ISST-SPA-WP05.pdf.
Suryanarayana, M. H. (2008). Pro-poor growth: illusions of marriage and divorce? Working Paper No. WP-2008-006. Mumbai: Indira Gandhi Institute of Development Research. Available from www.igidr.ac.in/pdf/publication/WP-2008-006.pdf.
Sziraczki, Gyorgy, Phu Huynh and Steven Kapsos (2009). The global economic crisis: labour market impactsand policies for recovery in Asia. ILO Asia-Pacific Working Paper Series. Geneva: ILO. Available fromwww.ilo.org/wcmsp5/groups/public/---asia/---ro-bangkok/documents/publication/wcms_110095.pdf.
Tang, Anne (2009). Hu expounds China’s views on sustainable development. GOV.cn, 15 November. Availablefrom http://english.gov.cn/2009-11/15/content_1465068.htm.
Thailand, National Economic and Social Development Board (2009). Economic outlook: Thai economicperformance in Q2 and outlook for 2009. Press release, 24 August. Available from www.nesdb.go.th/Portals/0/eco_datas/economic/eco_state/2_52/Press%20Eng%20Q2-2009.pdf.
The Hindu Business Line (2009). Overseas borrowing gets easier for India Inc. Chennai, India, 31 July.Available from www.thehindubusinessline.com/2009/07/31/stories/2009073151870100.htm.
Tobin, James (1978). A proposal for international monetary reform. Eastern Economic Journal, vol. 4, Nos. 3-4,pp. 153-159. Available from http://econpapers.repec.org/article/eejeeconj/v_3a4_3ay_3a1978_3ai_3a3-4_3ap_3a153-159.htm.
Tong, Beretitenti Anote (2010). Closing of Pacific High-Level Dialogue to Review Progress with Implementationof the Mauritius Strategy Statement; by the President of Kiribati, 9 February.
Tonga, Department of Statistics (2009). Key statistics. Available from www.spc.int/prism/Country/TO/stats/.
United Kingdom, The Financial Services Authority (2009). The Turner Review: a Regulatory Response to theGlobal Banking Crisis. London. Available from www.fsa.gov.uk/pubs/other/turner_review.pdf.
United Nations (2009a). Report of the Commission of Experts of the President of the United Nations GeneralAssembly on Reforms of the International Monetary and Financial System. New York. Available fromwww.un.org/ga/econcrisissummit/docs/FinalReport_CoE.pdf.
(2009b). World Economic and Social Survey 2009: Promoting Development, Saving the Planet. SalesNo. E.09.II.C.1. Available from www.un.org/esa/policy/wess/wess2009files/wess09/wess2009.pdf.
(2009c). Draft outcome document of the Conference on the World Financial and Economic Crisis andIts Impact on Development. A/CONF.214/3. Available from www.unglobalcompact.org/docs/about_the_gc/government_support/A-CONF-214-3.pdf.
(2009d). Forests: the green and REDD of climate change. UN-DESA Policy Brief No. 16, April.Department of Economic and Social Affairs. Available from www.un.org/esa/policy/policybriefs/policybrief16.pdf.
(2010). World Economic Situation and Prospects 2010. Sales No. E.10.II.C.2. Available from www.un.org/esa/policy/wess/wesp.html.
, Statistics Division (2009). United Nations Commodity Trade Statistics Database. Available from http://comtrade.un.org/db/dqQuickQuery.aspx.
, (2010a). National Accounts Main Aggregates Database. Available from http://unstats.un.org/unsd/snaama/Introduction.asp.
REFERENCES AND FURTHER READINGS
191
, (2010b). Millennium Development Goals Indicators. Available from http://mdgs.un.org/unsd/mdg/Data.aspx.
United Nations Conference on Trade and Development (2003). Trade and Development Report 2003: CapitalAccumulation, Growth and Structural Change. Sales No. E.03.II.D.7.
(2009a). Trade and Development Report, 2009: Responding to the Global Crisis Climate ChangeMitigation and Development. Sales No. E.09.II.D.16.
(2009b). World Investment Report 2009: Transnational Corporations, Agricultural Production and Devel-opment. Sales No. E.09.II.D.15. Available from www.unctad.org/en/docs/wir2009_en.pdf.
United Nations Conference on the World Financial and Economic Crisis and Its Impact on Development(2009). The world financial and economic crisis and its impact on development: Report of the Secretary-General. New York, 24-26 June. A/CONF.214/4.
United Nations, Economic and Social Commission for Asia and the Pacific (2002). Seoul Declaration onInfrastructure Development in Asia and the Pacific: Regional Action Programme Phase II (2002-2006).Ministerial Conference on Infrastructure, Seoul, 12-17 November 2001. Available from www.unescap.org/TTDW/Publications/TPTS_pubs/Seoul_Declaration.pdf.
(2007a). Development of Health Systems in the Context of Enhancing Economic Growth towardsAchieving the Millennium Development Goals in Asia and the Pacific. Sales No. E.07.II.F.12. Availablefrom www.unescap.org/publications/detail.asp?id=1209.
(2007b). Trade Statistics in Policymaking: A Handbook of Commonly Used Trade Indices and Indicators.Sales No. E.07.II.F.21.
(2008a). Economic and Social Survey of Asia and the Pacific 2008: Sustaining Growth and SharingProsperity. Sales No. E.08.II.F.7. Available from www.unescap.org/survey2008/download/01_Survey_2008.pdf.
(2008b). Enhancing Pacific Connectivity: the Current Situation, Opportunities for Progress. Sales No.E.08.II.F.14. Available from www.unescap.org/idd/Pubs/st_escap_2472.pdf.
(2008c). Greening Growth in Asia and the Pacific. Sales No. E.09.II.F.6. Available from www.unescap.org/esd/environment/publications/gg_asia_pacific/GreeningGrowth.pdf.
(2009a). Asia-Pacific Trade and Investment Report: Trade-led Recovery and Beyond. Sales No.E.09.II.F.19.
(2009b). Economic and Social Survey of Asia and the Pacific 2009: Addressing Triple Threats toDevelopment. Sales No. E.09.II.F.11. Available from www.unescap.org/pdd/publications/survey2009/download/Survey2009.pdf.
(2009c). Green growth capacity development programme: Map to green growth in Asia and the Pacific.Brochure. Available from www.greengrowth.org/capacity_building/Download/GG_capacity_development/Green_Growth_Capacity_Development_Brochure-resized.pdf.
(2009d). Economic and Social Survey of Asia and the Pacific 2009: Year-end Update. Available fromwww.unescap.org/pdd/publications/yearend2009/yearend2009.pdf.
(2009e). Navigating Out of the Crisis: A Trade-led Recovery – A practical guide for trade policymakersin Asia and the Pacific. ST/ESCAP/2538. Available from www.unescap.org/tid/publication/tipub2538.pdf.
(2009f). Statistical Yearbook for Asia and the Pacific 2008. Sales No. E.09.II.F.1. Available fromwww.unescap.org/stat/data/syb2008/ESCAP-SYB2008.pdf.
ECONOMIC AND SOCIAL SURVEY OF ASIA AND THE PACIFIC 2010
192
(2009g). Strengthening social protection systems in Asia and the Pacific in the aftermath of the globalfinancial crisis. Macroeconomic Policy Brief, No. 3. Available from www.unescap.org/pdd/publications/me_brief/mepb_3.pdf.
(2009h). Sustainable Agriculture and Food Security in Asia and the Pacific. Sales No. E.09.II.F.12.Available from www.unhcr.org/refworld/pdfid/49f589db2.pdf.
(forthcoming). Supportive financial system and green growth for achieving the Millennium DevelopmentGoals in the Asia-Pacific region. Preliminary document available from www.unescap.org/pdd/calendar/EGM_themestudy_2010/outline.pdf.
, Asian Development Bank and the United Nations Development Programme (2010). Asia PacificRegional Report 2009/10: Achieving the Millennium Development Goals in an Era of Global Uncertainty.Sales No. E.10.II.F.10. Available from www.mdgasiapacific.org/regional-report-2009-10.
United Nations Environment Programme (2009). Global green New Deal – an update for the G20 PittsburghSummit. Available from www.unep.org/pdf/G20_policy_brief_Final.pdf.
United Nations Framework Convention on Climate Change (2009). Copenhagen Accord. Draft Decision -/15, 18Dec. 2009. Draft document available from http://unfccc.int/files/meetings/cop_15/application/pdf/cop15_cph_auv.pdf.
United Nations Population Fund (2009). Asia and the Pacific at a glance. Available from http://asiapacific.unfpa.org/public/cache/offonce/pid/3948;jsessionid=FACFF872B3A5C9C7E10AC03E32E3FB8F.
United States (2010). Economic Report of the President. Washington, D.C.: United States Government PrintingOffice. Available from www.gpoaccess.gov/eop/2010/2010_erp.pdf.
, Bureau of Economic Affairs (2009). Gross domestic product: third quarter 2009 (advance estimate).Press release, 29 Oct. Available from www.bea.gov/newsreleases/national/gdp/gdpnewsrelease.htm.
, Census Bureau (2010). Foreign Trade: Historical Series. Available from www.census.gov/foreign-trade/statistics/historical/.
, Congressional Budget Office (2010). Budget Projections. Available from www.cbo.gov/budget/budproj.shtml.
, Department of the Treasury (2010). Treasury International Capital System: U.S. Gross External DebtStatistics. Available from www.treas.gov/tic/external-debt.shtml.
, Energy Information Administration. Petroleum Navigator. Available from http://tonto.eia.doe.gov/dnav/pet/hist/LeafHandler.ashx?n=PET&s=rbrte&f=M.
, Federal Reserve (2009). Federal Reserve Statistical Release, 7 December. Available from www.federalreserve.gov/releases/g19/20091207/.
, (2009). Minutes of the Federal Open Market Committee, 3-4 November. Available from www.federalreserve.gov/monetarypolicy/files/fomcminutes20091104.pdf.
The University of the South Pacific (2009). USP – an introduction. Available from www.usp.ac.fj/index.php?id=usp_introduction.
Vanuatu, National Statistics Office (2009). Tourism statistics. Available from www.spc.int/prism/country/vu/stats/TOURISM/tourism-index.htm.
REFERENCES AND FURTHER READINGS
193
Viet Nam, General Department of Vietnam Customs (2009). February exports up 25.1%. Vietnam Customs,News and Events. Available from www.customs.gov.vn/English/Lists/News/ViewDetails.aspx?ID=31.
Weisbrot, Mark, and others (2009). IMF-supported macroeconomic policies and the world recession: a look atforty-one borrowing countries. Washington, D.C.: Center for Economic and Policy Research. Availablefrom www.cepr.net/documents/publications/imf-2009-10.pdf.
Wijnholds, J. Onno de Beaufort, and Arend Kapteyn (2001). Reserve Adequacy in Emerging MarketEconomies. IMF Working Paper WP/01/143. Washington, D.C.: IMF. Available from www.imf.org/external/pubs/ft/wp/2001/wp01143.pdf.
Williamson, John (2005). A currency basket for East Asia, not just China. Policy Briefs in InternationalEconomics, No. PB05-1 (August). Washington, D.C.: Peterson Institute for International Economics.Available from www.iie.com/publications/pb/pb05-1.pdf.
World Bank (1994). World Development Report 1994: Infrastructure for Development. New York: OxfordUniversity Press.
(2008). World Development Report 2009: Reshaping Economic Geography. Washington, D.C. Availa-ble from http://econ.worldbank.org/WBSITE/EXTERNAL/EXTDEC/EXTRESEARCH/EXTWDRS/EXTWDR20090,,contentMDK:21955654~pagePK:64167689~piPK:64167673~theSitePK:4231059,00.html.
(2009a). Doing Business 2010: Reforming through Difficult Times – Comparing Regulation in 183 Coun-tries. Washington, D. C.: World Bank and International Finance Corporation; United Kingdom: PalgraveMacmillan. Available from www.doingbusiness.org/documents/fullreport/2010/DB10-full-report.pdf.
(2009b). East Asia update November 2009 – video interview with Ivailo Izvorski. Available from http://web.worldbank.org/WBSITE/EXTERNAL/COUNTRIES/EASTASIAPACIFICEXT/0,,contentMDK:22375721~pagePK:146736~piPK:146830~theSitePK:226301,00.html.
(2009c). Transforming the rebound into recovery, East Asia and Pacific update. Cityscape Intelligence:Breaking News, 4 November. Washington D. C. Available from www.cityscapeintelligence.com/world-bank-online-east-asia.
(2010a). PovcalNet. Available from http://iresearch.worldbank.org/PovcalNet/povcalSvy.html.
(2010b). World Development Indicators Online. Available from http://ddp-ext.worldbank.org/ext/DDPQQ/member.do?method=getMembers&userid=1&queryId=6.
World Health Organization, Regional Office for the Western Pacific (2010). Governments not spending enoughon health. Press releases, 3 March. Available from www.wpro.who.int/media_centre/press_releases/pr20100303.htm.
World Resources Institute. Climate Analysis Indicators Tool (CAIT) Version 7.0. Available from http://cait.wri.org/.
World Trade Organization (1994). Agreement on Trade-Related Aspects of Intellectual Property Rights.Available from http://www.wto.org/english/tratop_e/trips_e/t_agm0_e.htm.
(2009). Report to the TPRB from the Director-General on the financial and economic crisis and trade-related developments. WT/TPR/OV/W/2. Available from www.wto.org/english/news_e/news09_e/tpr_13jul09_dg_report_e.doc.
Xinhua News Agency (2009a). 20 million jobless migrant workers return home. China View, Window on Chinasect., 2 February. Available from http://news.xinhuanet.com/english/2009-02/02/content_10750749.htm.
ECONOMIC AND SOCIAL SURVEY OF ASIA AND THE PACIFIC 2010
194
(2009b). Cambodia, China complete phase 1 of GMS Information Highway Project. People’s DailyOnline, 15 July. Available from http://english.people.com.cn/90001/90776/90883/6701499.html.
(2009c). Chinese premier, UN chief discuss climate change. China View, Window on China sect., 30December. Available from http://news.xinhuanet.com/english/2009-12/30/content_12730059.htm.
Yap, Josef T. (2009). Impact of the global financial and economic crisis on the Philippines: a rapidassessment. Bangkok and Geneva: International Labour Organization. Available from www.ilo.org/wcmsp5/groups/public/---asia/---ro-bangkok/documents/meetingdocument/wcms_101595.pdf.
Zhou, Xiaochuan (2009). Reform the international monetary system. Speech by the Governor, 23 March.People’s Bank of China. Available from www.pbc.gov.cn/english/detail.asp?col=6500&id=178.
195
STATISTICAL ANNEX
STATISTICAL ANNEX
List of tables
Page
1. Real gross domestic product growth rates ........................................................................... 196
2. Gross domestic savings rates ............................................................................................... 197
3. Gross domestic investment rates .......................................................................................... 198
4. Inflation rates ......................................................................................................................... 199
5. Budget balance ...................................................................................................................... 200
6. Current account balance ....................................................................................................... 201
7. Change in money supply ....................................................................................................... 202
8. Merchandise export growth rates .......................................................................................... 203
9. Merchandise import growth rates .......................................................................................... 204
10. Inward foreign direct investment ........................................................................................... 205
11. Official development assistance and workers’ remittances .................................................. 206
12. International migration............................................................................................................ 207
13. Primary, secondary and tertiary education ............................................................................ 208
14. Poverty and malnutrition ........................................................................................................ 209
15. Unemployment rate by gender and age group ..................................................................... 210
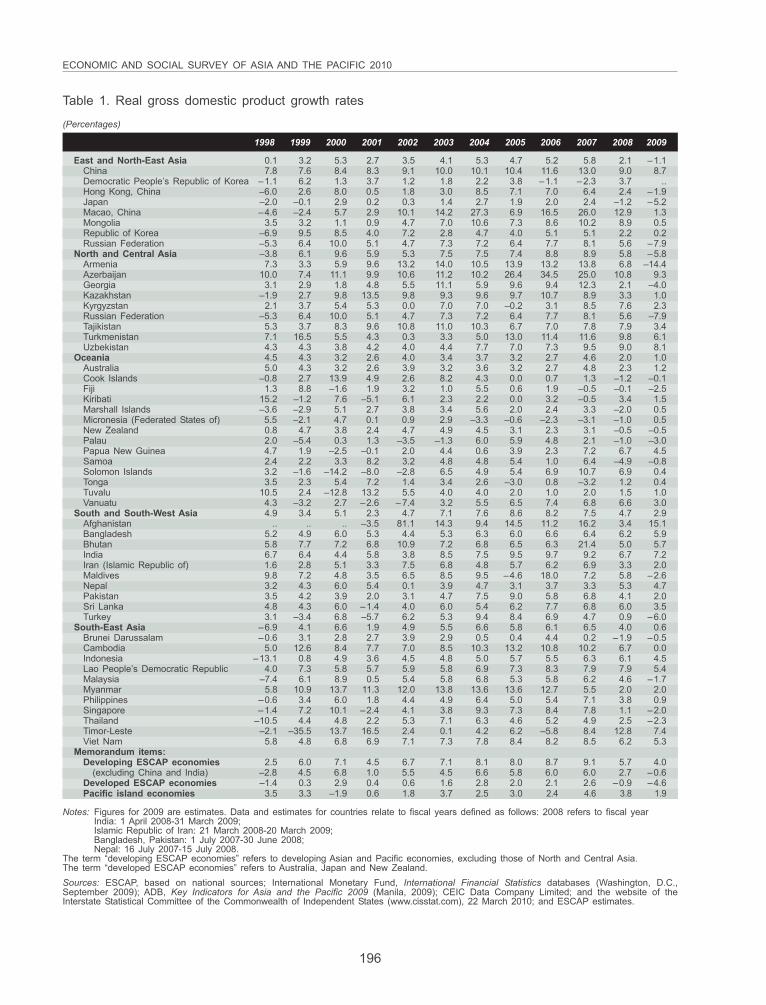
196
ECONOMIC AND SOCIAL SURVEY OF ASIA AND THE PACIFIC 2010
Table 1. Real gross domestic product growth rates
(Percentages)
1998 1999 2000 2001 2002 2003 2004 2005 2006 2007 2008 2009
East and North-East Asia 0.1 3.2 5.3 2.7 3.5 4.1 5.3 4.7 5.2 5.8 2.1 –1.1China 7.8 7.6 8.4 8.3 9.1 10.0 10.1 10.4 11.6 13.0 9.0 8.7Democratic People’s Republic of Korea –1.1 6.2 1.3 3.7 1.2 1.8 2.2 3.8 –1.1 –2.3 3.7 ..Hong Kong, China –6.0 2.6 8.0 0.5 1.8 3.0 8.5 7.1 7.0 6.4 2.4 –1.9Japan –2.0 –0.1 2.9 0.2 0.3 1.4 2.7 1.9 2.0 2.4 –1.2 –5.2Macao, China –4.6 –2.4 5.7 2.9 10.1 14.2 27.3 6.9 16.5 26.0 12.9 1.3Mongolia 3.5 3.2 1.1 0.9 4.7 7.0 10.6 7.3 8.6 10.2 8.9 0.5Republic of Korea –6.9 9.5 8.5 4.0 7.2 2.8 4.7 4.0 5.1 5.1 2.2 0.2Russian Federation –5.3 6.4 10.0 5.1 4.7 7.3 7.2 6.4 7.7 8.1 5.6 –7.9
North and Central Asia –3.8 6.1 9.6 5.9 5.3 7.5 7.5 7.4 8.8 8.9 5.8 –5.8Armenia 7.3 3.3 5.9 9.6 13.2 14.0 10.5 13.9 13.2 13.8 6.8 –14.4Azerbaijan 10.0 7.4 11.1 9.9 10.6 11.2 10.2 26.4 34.5 25.0 10.8 9.3Georgia 3.1 2.9 1.8 4.8 5.5 11.1 5.9 9.6 9.4 12.3 2.1 –4.0Kazakhstan –1.9 2.7 9.8 13.5 9.8 9.3 9.6 9.7 10.7 8.9 3.3 1.0Kyrgyzstan 2.1 3.7 5.4 5.3 0.0 7.0 7.0 –0.2 3.1 8.5 7.6 2.3Russian Federation –5.3 6.4 10.0 5.1 4.7 7.3 7.2 6.4 7.7 8.1 5.6 –7.9Tajikistan 5.3 3.7 8.3 9.6 10.8 11.0 10.3 6.7 7.0 7.8 7.9 3.4Turkmenistan 7.1 16.5 5.5 4.3 0.3 3.3 5.0 13.0 11.4 11.6 9.8 6.1Uzbekistan 4.3 4.3 3.8 4.2 4.0 4.4 7.7 7.0 7.3 9.5 9.0 8.1
Oceania 4.5 4.3 3.2 2.6 4.0 3.4 3.7 3.2 2.7 4.6 2.0 1.0Australia 5.0 4.3 3.2 2.6 3.9 3.2 3.6 3.2 2.7 4.8 2.3 1.2Cook Islands –0.8 2.7 13.9 4.9 2.6 8.2 4.3 0.0 0.7 1.3 –1.2 –0.1Fiji 1.3 8.8 –1.6 1.9 3.2 1.0 5.5 0.6 1.9 –0.5 –0.1 –2.5Kiribati 15.2 –1.2 7.6 –5.1 6.1 2.3 2.2 0.0 3.2 –0.5 3.4 1.5Marshall Islands –3.6 –2.9 5.1 2.7 3.8 3.4 5.6 2.0 2.4 3.3 –2.0 0.5Micronesia (Federated States of) 5.5 –2.1 4.7 0.1 0.9 2.9 –3.3 –0.6 –2.3 –3.1 –1.0 0.5New Zealand 0.8 4.7 3.8 2.4 4.7 4.9 4.5 3.1 2.3 3.1 –0.5 –0.5Palau 2.0 –5.4 0.3 1.3 –3.5 –1.3 6.0 5.9 4.8 2.1 –1.0 –3.0Papua New Guinea 4.7 1.9 –2.5 –0.1 2.0 4.4 0.6 3.9 2.3 7.2 6.7 4.5Samoa 2.4 2.2 3.3 8.2 3.2 4.8 4.8 5.4 1.0 6.4 –4.9 –0.8Solomon Islands 3.2 –1.6 –14.2 –8.0 –2.8 6.5 4.9 5.4 6.9 10.7 6.9 0.4Tonga 3.5 2.3 5.4 7.2 1.4 3.4 2.6 –3.0 0.8 –3.2 1.2 0.4Tuvalu 10.5 2.4 –12.8 13.2 5.5 4.0 4.0 2.0 1.0 2.0 1.5 1.0Vanuatu 4.3 –3.2 2.7 –2.6 –7.4 3.2 5.5 6.5 7.4 6.8 6.6 3.0
South and South-West Asia 4.9 3.4 5.1 2.3 4.7 7.1 7.6 8.6 8.2 7.5 4.7 2.9Afghanistan .. .. .. –3.5 81.1 14.3 9.4 14.5 11.2 16.2 3.4 15.1Bangladesh 5.2 4.9 6.0 5.3 4.4 5.3 6.3 6.0 6.6 6.4 6.2 5.9Bhutan 5.8 7.7 7.2 6.8 10.9 7.2 6.8 6.5 6.3 21.4 5.0 5.7India 6.7 6.4 4.4 5.8 3.8 8.5 7.5 9.5 9.7 9.2 6.7 7.2Iran (Islamic Republic of) 1.6 2.8 5.1 3.3 7.5 6.8 4.8 5.7 6.2 6.9 3.3 2.0Maldives 9.8 7.2 4.8 3.5 6.5 8.5 9.5 –4.6 18.0 7.2 5.8 –2.6Nepal 3.2 4.3 6.0 5.4 0.1 3.9 4.7 3.1 3.7 3.3 5.3 4.7Pakistan 3.5 4.2 3.9 2.0 3.1 4.7 7.5 9.0 5.8 6.8 4.1 2.0Sri Lanka 4.8 4.3 6.0 –1.4 4.0 6.0 5.4 6.2 7.7 6.8 6.0 3.5Turkey 3.1 –3.4 6.8 –5.7 6.2 5.3 9.4 8.4 6.9 4.7 0.9 –6.0
South-East Asia –6.9 4.1 6.6 1.9 4.9 5.5 6.6 5.8 6.1 6.5 4.0 0.6Brunei Darussalam –0.6 3.1 2.8 2.7 3.9 2.9 0.5 0.4 4.4 0.2 –1.9 –0.5Cambodia 5.0 12.6 8.4 7.7 7.0 8.5 10.3 13.2 10.8 10.2 6.7 0.0Indonesia –13.1 0.8 4.9 3.6 4.5 4.8 5.0 5.7 5.5 6.3 6.1 4.5Lao People’s Democratic Republic 4.0 7.3 5.8 5.7 5.9 5.8 6.9 7.3 8.3 7.9 7.9 5.4Malaysia –7.4 6.1 8.9 0.5 5.4 5.8 6.8 5.3 5.8 6.2 4.6 –1.7Myanmar 5.8 10.9 13.7 11.3 12.0 13.8 13.6 13.6 12.7 5.5 2.0 2.0Philippines –0.6 3.4 6.0 1.8 4.4 4.9 6.4 5.0 5.4 7.1 3.8 0.9Singapore –1.4 7.2 10.1 –2.4 4.1 3.8 9.3 7.3 8.4 7.8 1.1 –2.0Thailand –10.5 4.4 4.8 2.2 5.3 7.1 6.3 4.6 5.2 4.9 2.5 –2.3Timor-Leste –2.1 –35.5 13.7 16.5 2.4 0.1 4.2 6.2 –5.8 8.4 12.8 7.4Viet Nam 5.8 4.8 6.8 6.9 7.1 7.3 7.8 8.4 8.2 8.5 6.2 5.3
Memorandum items:Developing ESCAP economies 2.5 6.0 7.1 4.5 6.7 7.1 8.1 8.0 8.7 9.1 5.7 4.0
(excluding China and India) –2.8 4.5 6.8 1.0 5.5 4.5 6.6 5.8 6.0 6.0 2.7 –0.6Developed ESCAP economies –1.4 0.3 2.9 0.4 0.6 1.6 2.8 2.0 2.1 2.6 –0.9 –4.6Pacific island economies 3.5 3.3 –1.9 0.6 1.8 3.7 2.5 3.0 2.4 4.6 3.8 1.9
Notes: Figures for 2009 are estimates. Data and estimates for countries relate to fiscal years defined as follows: 2008 refers to fiscal yearIndia: 1 April 2008-31 March 2009;Islamic Republic of Iran: 21 March 2008-20 March 2009;Bangladesh, Pakistan: 1 July 2007-30 June 2008;Nepal: 16 July 2007-15 July 2008.
The term “developing ESCAP economies” refers to developing Asian and Pacific economies, excluding those of North and Central Asia.The term “developed ESCAP economies” refers to Australia, Japan and New Zealand.Sources: ESCAP, based on national sources; International Monetary Fund, International Financial Statistics databases (Washington, D.C.,September 2009); ADB, Key Indicators for Asia and the Pacific 2009 (Manila, 2009); CEIC Data Company Limited; and the website of theInterstate Statistical Committee of the Commonwealth of Independent States (www.cisstat.com), 22 March 2010; and ESCAP estimates.
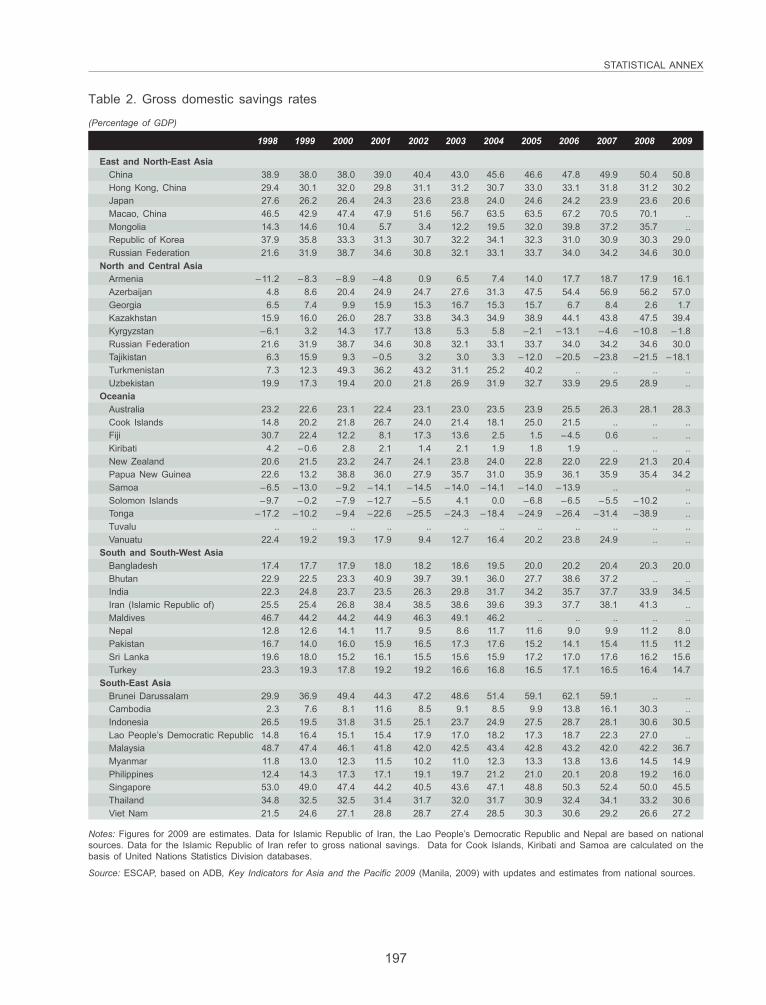
197
STATISTICAL ANNEX
Table 2. Gross domestic savings rates
(Percentage of GDP)
1998 1999 2000 2001 2002 2003 2004 2005 2006 2007 2008 2009
East and North-East AsiaChina 38.9 38.0 38.0 39.0 40.4 43.0 45.6 46.6 47.8 49.9 50.4 50.8Hong Kong, China 29.4 30.1 32.0 29.8 31.1 31.2 30.7 33.0 33.1 31.8 31.2 30.2Japan 27.6 26.2 26.4 24.3 23.6 23.8 24.0 24.6 24.2 23.9 23.6 20.6Macao, China 46.5 42.9 47.4 47.9 51.6 56.7 63.5 63.5 67.2 70.5 70.1 ..Mongolia 14.3 14.6 10.4 5.7 3.4 12.2 19.5 32.0 39.8 37.2 35.7 ..Republic of Korea 37.9 35.8 33.3 31.3 30.7 32.2 34.1 32.3 31.0 30.9 30.3 29.0Russian Federation 21.6 31.9 38.7 34.6 30.8 32.1 33.1 33.7 34.0 34.2 34.6 30.0
North and Central AsiaArmenia –11.2 –8.3 –8.9 –4.8 0.9 6.5 7.4 14.0 17.7 18.7 17.9 16.1Azerbaijan 4.8 8.6 20.4 24.9 24.7 27.6 31.3 47.5 54.4 56.9 56.2 57.0Georgia 6.5 7.4 9.9 15.9 15.3 16.7 15.3 15.7 6.7 8.4 2.6 1.7Kazakhstan 15.9 16.0 26.0 28.7 33.8 34.3 34.9 38.9 44.1 43.8 47.5 39.4Kyrgyzstan –6.1 3.2 14.3 17.7 13.8 5.3 5.8 –2.1 –13.1 –4.6 –10.8 –1.8Russian Federation 21.6 31.9 38.7 34.6 30.8 32.1 33.1 33.7 34.0 34.2 34.6 30.0Tajikistan 6.3 15.9 9.3 –0.5 3.2 3.0 3.3 –12.0 –20.5 –23.8 –21.5 –18.1Turkmenistan 7.3 12.3 49.3 36.2 43.2 31.1 25.2 40.2 .. .. .. ..Uzbekistan 19.9 17.3 19.4 20.0 21.8 26.9 31.9 32.7 33.9 29.5 28.9 ..
OceaniaAustralia 23.2 22.6 23.1 22.4 23.1 23.0 23.5 23.9 25.5 26.3 28.1 28.3Cook Islands 14.8 20.2 21.8 26.7 24.0 21.4 18.1 25.0 21.5 .. .. ..Fiji 30.7 22.4 12.2 8.1 17.3 13.6 2.5 1.5 –4.5 0.6 .. ..Kiribati 4.2 –0.6 2.8 2.1 1.4 2.1 1.9 1.8 1.9 .. .. ..New Zealand 20.6 21.5 23.2 24.7 24.1 23.8 24.0 22.8 22.0 22.9 21.3 20.4Papua New Guinea 22.6 13.2 38.8 36.0 27.9 35.7 31.0 35.9 36.1 35.9 35.4 34.2Samoa –6.5 –13.0 –9.2 –14.1 –14.5 –14.0 –14.1 –14.0 –13.9 .. ..Solomon Islands –9.7 –0.2 –7.9 –12.7 –5.5 4.1 0.0 –6.8 –6.5 –5.5 –10.2 ..Tonga –17.2 –10.2 –9.4 –22.6 –25.5 –24.3 –18.4 –24.9 –26.4 –31.4 –38.9 ..Tuvalu .. .. .. .. .. .. .. .. .. .. .. ..Vanuatu 22.4 19.2 19.3 17.9 9.4 12.7 16.4 20.2 23.8 24.9 .. ..
South and South-West AsiaBangladesh 17.4 17.7 17.9 18.0 18.2 18.6 19.5 20.0 20.2 20.4 20.3 20.0Bhutan 22.9 22.5 23.3 40.9 39.7 39.1 36.0 27.7 38.6 37.2 .. ..India 22.3 24.8 23.7 23.5 26.3 29.8 31.7 34.2 35.7 37.7 33.9 34.5Iran (Islamic Republic of) 25.5 25.4 26.8 38.4 38.5 38.6 39.6 39.3 37.7 38.1 41.3 ..Maldives 46.7 44.2 44.2 44.9 46.3 49.1 46.2 .. .. .. .. ..Nepal 12.8 12.6 14.1 11.7 9.5 8.6 11.7 11.6 9.0 9.9 11.2 8.0Pakistan 16.7 14.0 16.0 15.9 16.5 17.3 17.6 15.2 14.1 15.4 11.5 11.2Sri Lanka 19.6 18.0 15.2 16.1 15.5 15.6 15.9 17.2 17.0 17.6 16.2 15.6Turkey 23.3 19.3 17.8 19.2 19.2 16.6 16.8 16.5 17.1 16.5 16.4 14.7
South-East AsiaBrunei Darussalam 29.9 36.9 49.4 44.3 47.2 48.6 51.4 59.1 62.1 59.1 .. ..Cambodia 2.3 7.6 8.1 11.6 8.5 9.1 8.5 9.9 13.8 16.1 30.3 ..Indonesia 26.5 19.5 31.8 31.5 25.1 23.7 24.9 27.5 28.7 28.1 30.6 30.5Lao People’s Democratic Republic 14.8 16.4 15.1 15.4 17.9 17.0 18.2 17.3 18.7 22.3 27.0 ..Malaysia 48.7 47.4 46.1 41.8 42.0 42.5 43.4 42.8 43.2 42.0 42.2 36.7Myanmar 11.8 13.0 12.3 11.5 10.2 11.0 12.3 13.3 13.8 13.6 14.5 14.9Philippines 12.4 14.3 17.3 17.1 19.1 19.7 21.2 21.0 20.1 20.8 19.2 16.0Singapore 53.0 49.0 47.4 44.2 40.5 43.6 47.1 48.8 50.3 52.4 50.0 45.5Thailand 34.8 32.5 32.5 31.4 31.7 32.0 31.7 30.9 32.4 34.1 33.2 30.6Viet Nam 21.5 24.6 27.1 28.8 28.7 27.4 28.5 30.3 30.6 29.2 26.6 27.2
Notes: Figures for 2009 are estimates. Data for Islamic Republic of Iran, the Lao People’s Democratic Republic and Nepal are based on nationalsources. Data for the Islamic Republic of Iran refer to gross national savings. Data for Cook Islands, Kiribati and Samoa are calculated on thebasis of United Nations Statistics Division databases.
Source: ESCAP, based on ADB, Key Indicators for Asia and the Pacific 2009 (Manila, 2009) with updates and estimates from national sources.
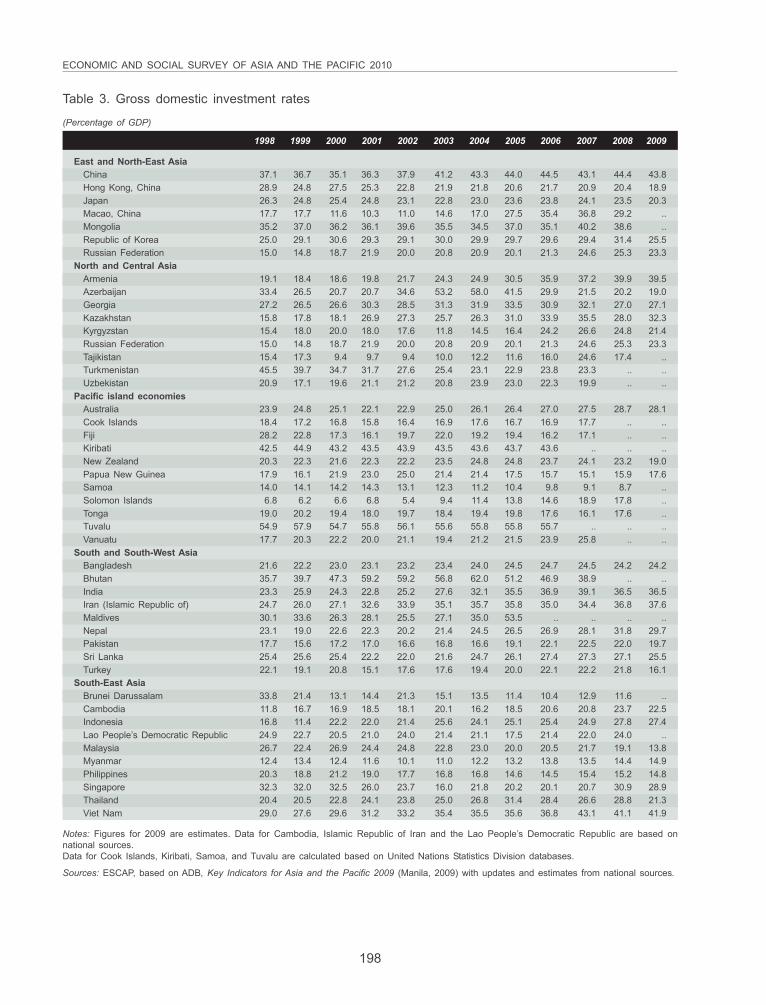
198
ECONOMIC AND SOCIAL SURVEY OF ASIA AND THE PACIFIC 2010
Table 3. Gross domestic investment rates
(Percentage of GDP)
1998 1999 2000 2001 2002 2003 2004 2005 2006 2007 2008 2009
East and North-East AsiaChina 37.1 36.7 35.1 36.3 37.9 41.2 43.3 44.0 44.5 43.1 44.4 43.8Hong Kong, China 28.9 24.8 27.5 25.3 22.8 21.9 21.8 20.6 21.7 20.9 20.4 18.9Japan 26.3 24.8 25.4 24.8 23.1 22.8 23.0 23.6 23.8 24.1 23.5 20.3Macao, China 17.7 17.7 11.6 10.3 11.0 14.6 17.0 27.5 35.4 36.8 29.2 ..Mongolia 35.2 37.0 36.2 36.1 39.6 35.5 34.5 37.0 35.1 40.2 38.6 ..Republic of Korea 25.0 29.1 30.6 29.3 29.1 30.0 29.9 29.7 29.6 29.4 31.4 25.5Russian Federation 15.0 14.8 18.7 21.9 20.0 20.8 20.9 20.1 21.3 24.6 25.3 23.3
North and Central AsiaArmenia 19.1 18.4 18.6 19.8 21.7 24.3 24.9 30.5 35.9 37.2 39.9 39.5Azerbaijan 33.4 26.5 20.7 20.7 34.6 53.2 58.0 41.5 29.9 21.5 20.2 19.0Georgia 27.2 26.5 26.6 30.3 28.5 31.3 31.9 33.5 30.9 32.1 27.0 27.1Kazakhstan 15.8 17.8 18.1 26.9 27.3 25.7 26.3 31.0 33.9 35.5 28.0 32.3Kyrgyzstan 15.4 18.0 20.0 18.0 17.6 11.8 14.5 16.4 24.2 26.6 24.8 21.4Russian Federation 15.0 14.8 18.7 21.9 20.0 20.8 20.9 20.1 21.3 24.6 25.3 23.3Tajikistan 15.4 17.3 9.4 9.7 9.4 10.0 12.2 11.6 16.0 24.6 17.4 ..Turkmenistan 45.5 39.7 34.7 31.7 27.6 25.4 23.1 22.9 23.8 23.3 .. ..Uzbekistan 20.9 17.1 19.6 21.1 21.2 20.8 23.9 23.0 22.3 19.9 .. ..
Pacific island economiesAustralia 23.9 24.8 25.1 22.1 22.9 25.0 26.1 26.4 27.0 27.5 28.7 28.1Cook Islands 18.4 17.2 16.8 15.8 16.4 16.9 17.6 16.7 16.9 17.7 .. ..Fiji 28.2 22.8 17.3 16.1 19.7 22.0 19.2 19.4 16.2 17.1 .. ..Kiribati 42.5 44.9 43.2 43.5 43.9 43.5 43.6 43.7 43.6 .. .. ..New Zealand 20.3 22.3 21.6 22.3 22.2 23.5 24.8 24.8 23.7 24.1 23.2 19.0Papua New Guinea 17.9 16.1 21.9 23.0 25.0 21.4 21.4 17.5 15.7 15.1 15.9 17.6Samoa 14.0 14.1 14.2 14.3 13.1 12.3 11.2 10.4 9.8 9.1 8.7 ..Solomon Islands 6.8 6.2 6.6 6.8 5.4 9.4 11.4 13.8 14.6 18.9 17.8 ..Tonga 19.0 20.2 19.4 18.0 19.7 18.4 19.4 19.8 17.6 16.1 17.6 ..Tuvalu 54.9 57.9 54.7 55.8 56.1 55.6 55.8 55.8 55.7 .. .. ..Vanuatu 17.7 20.3 22.2 20.0 21.1 19.4 21.2 21.5 23.9 25.8 .. ..
South and South-West AsiaBangladesh 21.6 22.2 23.0 23.1 23.2 23.4 24.0 24.5 24.7 24.5 24.2 24.2Bhutan 35.7 39.7 47.3 59.2 59.2 56.8 62.0 51.2 46.9 38.9 .. ..India 23.3 25.9 24.3 22.8 25.2 27.6 32.1 35.5 36.9 39.1 36.5 36.5Iran (Islamic Republic of) 24.7 26.0 27.1 32.6 33.9 35.1 35.7 35.8 35.0 34.4 36.8 37.6Maldives 30.1 33.6 26.3 28.1 25.5 27.1 35.0 53.5 .. .. .. ..Nepal 23.1 19.0 22.6 22.3 20.2 21.4 24.5 26.5 26.9 28.1 31.8 29.7Pakistan 17.7 15.6 17.2 17.0 16.6 16.8 16.6 19.1 22.1 22.5 22.0 19.7Sri Lanka 25.4 25.6 25.4 22.2 22.0 21.6 24.7 26.1 27.4 27.3 27.1 25.5Turkey 22.1 19.1 20.8 15.1 17.6 17.6 19.4 20.0 22.1 22.2 21.8 16.1
South-East AsiaBrunei Darussalam 33.8 21.4 13.1 14.4 21.3 15.1 13.5 11.4 10.4 12.9 11.6 ..Cambodia 11.8 16.7 16.9 18.5 18.1 20.1 16.2 18.5 20.6 20.8 23.7 22.5Indonesia 16.8 11.4 22.2 22.0 21.4 25.6 24.1 25.1 25.4 24.9 27.8 27.4Lao People’s Democratic Republic 24.9 22.7 20.5 21.0 24.0 21.4 21.1 17.5 21.4 22.0 24.0 ..Malaysia 26.7 22.4 26.9 24.4 24.8 22.8 23.0 20.0 20.5 21.7 19.1 13.8Myanmar 12.4 13.4 12.4 11.6 10.1 11.0 12.2 13.2 13.8 13.5 14.4 14.9Philippines 20.3 18.8 21.2 19.0 17.7 16.8 16.8 14.6 14.5 15.4 15.2 14.8Singapore 32.3 32.0 32.5 26.0 23.7 16.0 21.8 20.2 20.1 20.7 30.9 28.9Thailand 20.4 20.5 22.8 24.1 23.8 25.0 26.8 31.4 28.4 26.6 28.8 21.3Viet Nam 29.0 27.6 29.6 31.2 33.2 35.4 35.5 35.6 36.8 43.1 41.1 41.9
Notes: Figures for 2009 are estimates. Data for Cambodia, Islamic Republic of Iran and the Lao People’s Democratic Republic are based onnational sources.Data for Cook Islands, Kiribati, Samoa, and Tuvalu are calculated based on United Nations Statistics Division databases.
Sources: ESCAP, based on ADB, Key Indicators for Asia and the Pacific 2009 (Manila, 2009) with updates and estimates from national sources.
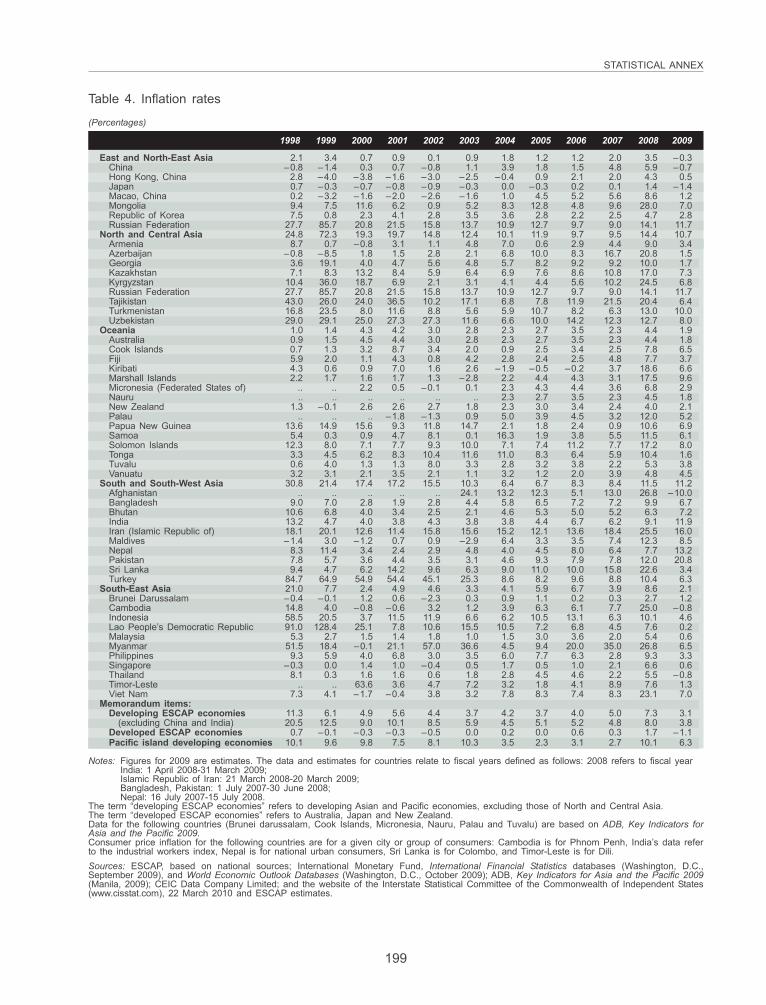
199
STATISTICAL ANNEX
Table 4. Inflation rates
(Percentages)
1998 1999 2000 2001 2002 2003 2004 2005 2006 2007 2008 2009
East and North-East Asia 2.1 3.4 0.7 0.9 0.1 0.9 1.8 1.2 1.2 2.0 3.5 –0.3China –0.8 –1.4 0.3 0.7 –0.8 1.1 3.9 1.8 1.5 4.8 5.9 –0.7Hong Kong, China 2.8 –4.0 –3.8 –1.6 –3.0 –2.5 –0.4 0.9 2.1 2.0 4.3 0.5Japan 0.7 –0.3 –0.7 –0.8 –0.9 –0.3 0.0 –0.3 0.2 0.1 1.4 –1.4Macao, China 0.2 –3.2 –1.6 –2.0 –2.6 –1.6 1.0 4.5 5.2 5.6 8.6 1.2Mongolia 9.4 7.5 11.6 6.2 0.9 5.2 8.3 12.8 4.8 9.6 28.0 7.0Republic of Korea 7.5 0.8 2.3 4.1 2.8 3.5 3.6 2.8 2.2 2.5 4.7 2.8Russian Federation 27.7 85.7 20.8 21.5 15.8 13.7 10.9 12.7 9.7 9.0 14.1 11.7
North and Central Asia 24.8 72.3 19.3 19.7 14.8 12.4 10.1 11.9 9.7 9.5 14.4 10.7Armenia 8.7 0.7 –0.8 3.1 1.1 4.8 7.0 0.6 2.9 4.4 9.0 3.4Azerbaijan –0.8 –8.5 1.8 1.5 2.8 2.1 6.8 10.0 8.3 16.7 20.8 1.5Georgia 3.6 19.1 4.0 4.7 5.6 4.8 5.7 8.2 9.2 9.2 10.0 1.7Kazakhstan 7.1 8.3 13.2 8.4 5.9 6.4 6.9 7.6 8.6 10.8 17.0 7.3Kyrgyzstan 10.4 36.0 18.7 6.9 2.1 3.1 4.1 4.4 5.6 10.2 24.5 6.8Russian Federation 27.7 85.7 20.8 21.5 15.8 13.7 10.9 12.7 9.7 9.0 14.1 11.7Tajikistan 43.0 26.0 24.0 36.5 10.2 17.1 6.8 7.8 11.9 21.5 20.4 6.4Turkmenistan 16.8 23.5 8.0 11.6 8.8 5.6 5.9 10.7 8.2 6.3 13.0 10.0Uzbekistan 29.0 29.1 25.0 27.3 27.3 11.6 6.6 10.0 14.2 12.3 12.7 8.0
Oceania 1.0 1.4 4.3 4.2 3.0 2.8 2.3 2.7 3.5 2.3 4.4 1.9Australia 0.9 1.5 4.5 4.4 3.0 2.8 2.3 2.7 3.5 2.3 4.4 1.8Cook Islands 0.7 1.3 3.2 8.7 3.4 2.0 0.9 2.5 3.4 2.5 7.8 6.5Fiji 5.9 2.0 1.1 4.3 0.8 4.2 2.8 2.4 2.5 4.8 7.7 3.7Kiribati 4.3 0.6 0.9 7.0 1.6 2.6 –1.9 –0.5 –0.2 3.7 18.6 6.6Marshall Islands 2.2 1.7 1.6 1.7 1.3 –2.8 2.2 4.4 4.3 3.1 17.5 9.6Micronesia (Federated States of) .. .. 2.2 0.5 –0.1 0.1 2.3 4.3 4.4 3.6 6.8 2.9Nauru .. .. .. .. .. .. 2.3 2.7 3.5 2.3 4.5 1.8New Zealand 1.3 –0.1 2.6 2.6 2.7 1.8 2.3 3.0 3.4 2.4 4.0 2.1Palau .. .. .. –1.8 –1.3 0.9 5.0 3.9 4.5 3.2 12.0 5.2Papua New Guinea 13.6 14.9 15.6 9.3 11.8 14.7 2.1 1.8 2.4 0.9 10.6 6.9Samoa 5.4 0.3 0.9 4.7 8.1 0.1 16.3 1.9 3.8 5.5 11.5 6.1Solomon Islands 12.3 8.0 7.1 7.7 9.3 10.0 7.1 7.4 11.2 7.7 17.2 8.0Tonga 3.3 4.5 6.2 8.3 10.4 11.6 11.0 8.3 6.4 5.9 10.4 1.6Tuvalu 0.6 4.0 1.3 1.3 8.0 3.3 2.8 3.2 3.8 2.2 5.3 3.8Vanuatu 3.2 3.1 2.1 3.5 2.1 1.1 3.2 1.2 2.0 3.9 4.8 4.5
South and South-West Asia 30.8 21.4 17.4 17.2 15.5 10.3 6.4 6.7 8.3 8.4 11.5 11.2Afghanistan .. .. .. .. .. 24.1 13.2 12.3 5.1 13.0 26.8 –10.0Bangladesh 9.0 7.0 2.8 1.9 2.8 4.4 5.8 6.5 7.2 7.2 9.9 6.7Bhutan 10.6 6.8 4.0 3.4 2.5 2.1 4.6 5.3 5.0 5.2 6.3 7.2India 13.2 4.7 4.0 3.8 4.3 3.8 3.8 4.4 6.7 6.2 9.1 11.9Iran (Islamic Republic of) 18.1 20.1 12.6 11.4 15.8 15.6 15.2 12.1 13.6 18.4 25.5 16.0Maldives –1.4 3.0 –1.2 0.7 0.9 –2.9 6.4 3.3 3.5 7.4 12.3 8.5Nepal 8.3 11.4 3.4 2.4 2.9 4.8 4.0 4.5 8.0 6.4 7.7 13.2Pakistan 7.8 5.7 3.6 4.4 3.5 3.1 4.6 9.3 7.9 7.8 12.0 20.8Sri Lanka 9.4 4.7 6.2 14.2 9.6 6.3 9.0 11.0 10.0 15.8 22.6 3.4Turkey 84.7 64.9 54.9 54.4 45.1 25.3 8.6 8.2 9.6 8.8 10.4 6.3
South-East Asia 21.0 7.7 2.4 4.9 4.6 3.3 4.1 5.9 6.7 3.9 8.6 2.1Brunei Darussalam –0.4 –0.1 1.2 0.6 –2.3 0.3 0.9 1.1 0.2 0.3 2.7 1.2Cambodia 14.8 4.0 –0.8 –0.6 3.2 1.2 3.9 6.3 6.1 7.7 25.0 –0.8Indonesia 58.5 20.5 3.7 11.5 11.9 6.6 6.2 10.5 13.1 6.3 10.1 4.6Lao People’s Democratic Republic 91.0 128.4 25.1 7.8 10.6 15.5 10.5 7.2 6.8 4.5 7.6 0.2Malaysia 5.3 2.7 1.5 1.4 1.8 1.0 1.5 3.0 3.6 2.0 5.4 0.6Myanmar 51.5 18.4 –0.1 21.1 57.0 36.6 4.5 9.4 20.0 35.0 26.8 6.5Philippines 9.3 5.9 4.0 6.8 3.0 3.5 6.0 7.7 6.3 2.8 9.3 3.3Singapore –0.3 0.0 1.4 1.0 –0.4 0.5 1.7 0.5 1.0 2.1 6.6 0.6Thailand 8.1 0.3 1.6 1.6 0.6 1.8 2.8 4.5 4.6 2.2 5.5 –0.8Timor-Leste .. .. 63.6 3.6 4.7 7.2 3.2 1.8 4.1 8.9 7.6 1.3Viet Nam 7.3 4.1 –1.7 –0.4 3.8 3.2 7.8 8.3 7.4 8.3 23.1 7.0
Memorandum items:Developing ESCAP economies 11.3 6.1 4.9 5.6 4.4 3.7 4.2 3.7 4.0 5.0 7.3 3.1
(excluding China and India) 20.5 12.5 9.0 10.1 8.5 5.9 4.5 5.1 5.2 4.8 8.0 3.8Developed ESCAP economies 0.7 –0.1 –0.3 –0.3 –0.5 0.0 0.2 0.0 0.6 0.3 1.7 –1.1Pacific island developing economies 10.1 9.6 9.8 7.5 8.1 10.3 3.5 2.3 3.1 2.7 10.1 6.3
Notes: Figures for 2009 are estimates. The data and estimates for countries relate to fiscal years defined as follows: 2008 refers to fiscal yearIndia: 1 April 2008-31 March 2009;Islamic Republic of Iran: 21 March 2008-20 March 2009;Bangladesh, Pakistan: 1 July 2007-30 June 2008;Nepal: 16 July 2007-15 July 2008.
The term “developing ESCAP economies” refers to developing Asian and Pacific economies, excluding those of North and Central Asia.The term “developed ESCAP economies” refers to Australia, Japan and New Zealand.Data for the following countries (Brunei darussalam, Cook Islands, Micronesia, Nauru, Palau and Tuvalu) are based on ADB, Key Indicators forAsia and the Pacific 2009.Consumer price inflation for the following countries are for a given city or group of consumers: Cambodia is for Phnom Penh, India’s data referto the industrial workers index, Nepal is for national urban consumers, Sri Lanka is for Colombo, and Timor-Leste is for Dili.Sources: ESCAP, based on national sources; International Monetary Fund, International Financial Statistics databases (Washington, D.C.,September 2009), and World Economic Outlook Databases (Washington, D.C., October 2009); ADB, Key Indicators for Asia and the Pacific 2009(Manila, 2009); CEIC Data Company Limited; and the website of the Interstate Statistical Committee of the Commonwealth of Independent States(www.cisstat.com), 22 March 2010 and ESCAP estimates.
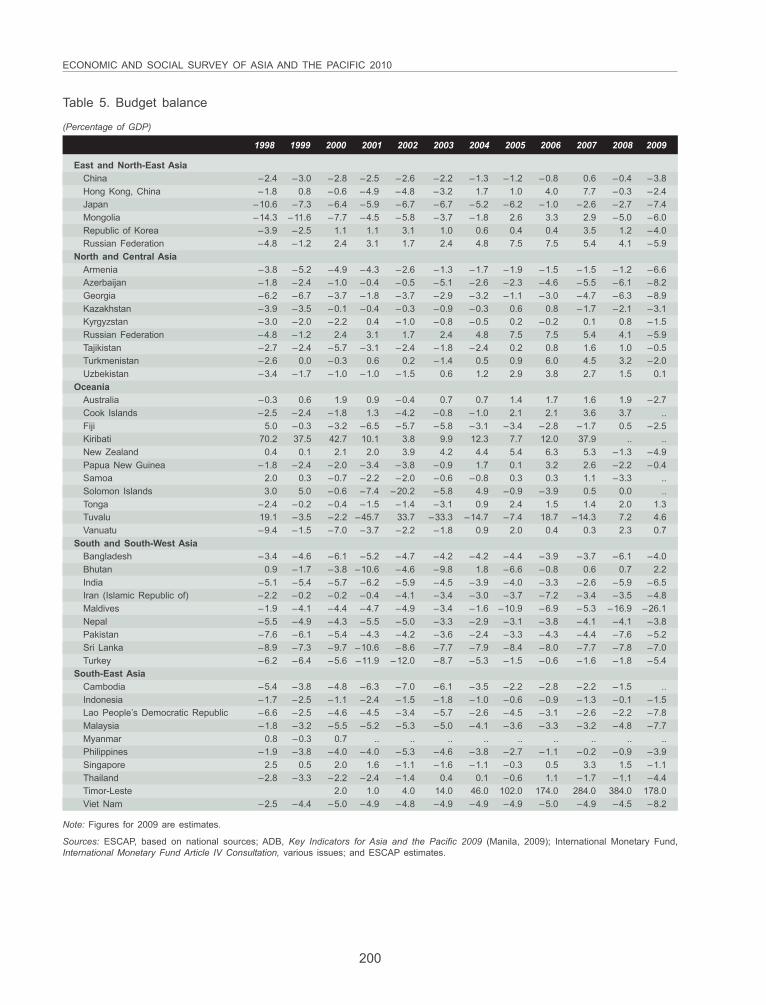
200
ECONOMIC AND SOCIAL SURVEY OF ASIA AND THE PACIFIC 2010
Table 5. Budget balance
(Percentage of GDP)
1998 1999 2000 2001 2002 2003 2004 2005 2006 2007 2008 2009
East and North-East AsiaChina –2.4 –3.0 –2.8 –2.5 –2.6 –2.2 –1.3 –1.2 –0.8 0.6 –0.4 –3.8Hong Kong, China –1.8 0.8 –0.6 –4.9 –4.8 –3.2 1.7 1.0 4.0 7.7 –0.3 –2.4Japan –10.6 –7.3 –6.4 –5.9 –6.7 –6.7 –5.2 –6.2 –1.0 –2.6 –2.7 –7.4Mongolia –14.3 –11.6 –7.7 –4.5 –5.8 –3.7 –1.8 2.6 3.3 2.9 –5.0 –6.0Republic of Korea –3.9 –2.5 1.1 1.1 3.1 1.0 0.6 0.4 0.4 3.5 1.2 –4.0Russian Federation –4.8 –1.2 2.4 3.1 1.7 2.4 4.8 7.5 7.5 5.4 4.1 –5.9
North and Central AsiaArmenia –3.8 –5.2 –4.9 –4.3 –2.6 –1.3 –1.7 –1.9 –1.5 –1.5 –1.2 –6.6Azerbaijan –1.8 –2.4 –1.0 –0.4 –0.5 –5.1 –2.6 –2.3 –4.6 –5.5 –6.1 –8.2Georgia –6.2 –6.7 –3.7 –1.8 –3.7 –2.9 –3.2 –1.1 –3.0 –4.7 –6.3 –8.9Kazakhstan –3.9 –3.5 –0.1 –0.4 –0.3 –0.9 –0.3 0.6 0.8 –1.7 –2.1 –3.1Kyrgyzstan –3.0 –2.0 –2.2 0.4 –1.0 –0.8 –0.5 0.2 –0.2 0.1 0.8 –1.5Russian Federation –4.8 –1.2 2.4 3.1 1.7 2.4 4.8 7.5 7.5 5.4 4.1 –5.9Tajikistan –2.7 –2.4 –5.7 –3.1 –2.4 –1.8 –2.4 0.2 0.8 1.6 1.0 –0.5Turkmenistan –2.6 0.0 –0.3 0.6 0.2 –1.4 0.5 0.9 6.0 4.5 3.2 –2.0Uzbekistan –3.4 –1.7 –1.0 –1.0 –1.5 0.6 1.2 2.9 3.8 2.7 1.5 0.1
OceaniaAustralia –0.3 0.6 1.9 0.9 –0.4 0.7 0.7 1.4 1.7 1.6 1.9 –2.7Cook Islands –2.5 –2.4 –1.8 1.3 –4.2 –0.8 –1.0 2.1 2.1 3.6 3.7 ..Fiji 5.0 –0.3 –3.2 –6.5 –5.7 –5.8 –3.1 –3.4 –2.8 –1.7 0.5 –2.5Kiribati 70.2 37.5 42.7 10.1 3.8 9.9 12.3 7.7 12.0 37.9 .. ..New Zealand 0.4 0.1 2.1 2.0 3.9 4.2 4.4 5.4 6.3 5.3 –1.3 –4.9Papua New Guinea –1.8 –2.4 –2.0 –3.4 –3.8 –0.9 1.7 0.1 3.2 2.6 –2.2 –0.4Samoa 2.0 0.3 –0.7 –2.2 –2.0 –0.6 –0.8 0.3 0.3 1.1 –3.3 ..Solomon Islands 3.0 5.0 –0.6 –7.4 –20.2 –5.8 4.9 –0.9 –3.9 0.5 0.0 ..Tonga –2.4 –0.2 –0.4 –1.5 –1.4 –3.1 0.9 2.4 1.5 1.4 2.0 1.3Tuvalu 19.1 –3.5 –2.2 –45.7 33.7 –33.3 –14.7 –7.4 18.7 –14.3 7.2 4.6Vanuatu –9.4 –1.5 –7.0 –3.7 –2.2 –1.8 0.9 2.0 0.4 0.3 2.3 0.7
South and South-West AsiaBangladesh –3.4 –4.6 –6.1 –5.2 –4.7 –4.2 –4.2 –4.4 –3.9 –3.7 –6.1 –4.0Bhutan 0.9 –1.7 –3.8 –10.6 –4.6 –9.8 1.8 –6.6 –0.8 0.6 0.7 2.2India –5.1 –5.4 –5.7 –6.2 –5.9 –4.5 –3.9 –4.0 –3.3 –2.6 –5.9 –6.5Iran (Islamic Republic of) –2.2 –0.2 –0.2 –0.4 –4.1 –3.4 –3.0 –3.7 –7.2 –3.4 –3.5 –4.8Maldives –1.9 –4.1 –4.4 –4.7 –4.9 –3.4 –1.6 –10.9 –6.9 –5.3 –16.9 –26.1Nepal –5.5 –4.9 –4.3 –5.5 –5.0 –3.3 –2.9 –3.1 –3.8 –4.1 –4.1 –3.8Pakistan –7.6 –6.1 –5.4 –4.3 –4.2 –3.6 –2.4 –3.3 –4.3 –4.4 –7.6 –5.2Sri Lanka –8.9 –7.3 –9.7 –10.6 –8.6 –7.7 –7.9 –8.4 –8.0 –7.7 –7.8 –7.0Turkey –6.2 –6.4 –5.6 –11.9 –12.0 –8.7 –5.3 –1.5 –0.6 –1.6 –1.8 –5.4
South-East AsiaCambodia –5.4 –3.8 –4.8 –6.3 –7.0 –6.1 –3.5 –2.2 –2.8 –2.2 –1.5 ..Indonesia –1.7 –2.5 –1.1 –2.4 –1.5 –1.8 –1.0 –0.6 –0.9 –1.3 –0.1 –1.5Lao People’s Democratic Republic –6.6 –2.5 –4.6 –4.5 –3.4 –5.7 –2.6 –4.5 –3.1 –2.6 –2.2 –7.8Malaysia –1.8 –3.2 –5.5 –5.2 –5.3 –5.0 –4.1 –3.6 –3.3 –3.2 –4.8 –7.7Myanmar 0.8 –0.3 0.7 .. .. .. .. .. .. .. .. ..Philippines –1.9 –3.8 –4.0 –4.0 –5.3 –4.6 –3.8 –2.7 –1.1 –0.2 –0.9 –3.9Singapore 2.5 0.5 2.0 1.6 –1.1 –1.6 –1.1 –0.3 0.5 3.3 1.5 –1.1Thailand –2.8 –3.3 –2.2 –2.4 –1.4 0.4 0.1 –0.6 1.1 –1.7 –1.1 –4.4Timor-Leste 2.0 1.0 4.0 14.0 46.0 102.0 174.0 284.0 384.0 178.0Viet Nam –2.5 –4.4 –5.0 –4.9 –4.8 –4.9 –4.9 –4.9 –5.0 –4.9 –4.5 –8.2
Note: Figures for 2009 are estimates.
Sources: ESCAP, based on national sources; ADB, Key Indicators for Asia and the Pacific 2009 (Manila, 2009); International Monetary Fund,International Monetary Fund Article IV Consultation, various issues; and ESCAP estimates.
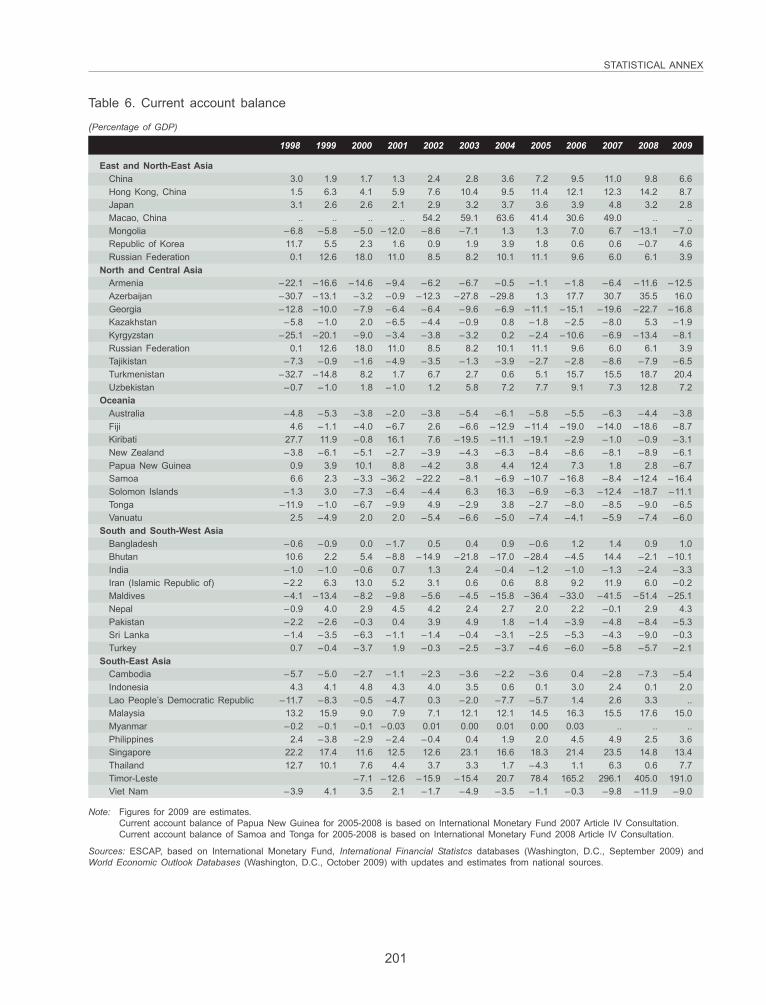
201
STATISTICAL ANNEX
Table 6. Current account balance
(Percentage of GDP)
1998 1999 2000 2001 2002 2003 2004 2005 2006 2007 2008 2009
East and North-East AsiaChina 3.0 1.9 1.7 1.3 2.4 2.8 3.6 7.2 9.5 11.0 9.8 6.6Hong Kong, China 1.5 6.3 4.1 5.9 7.6 10.4 9.5 11.4 12.1 12.3 14.2 8.7Japan 3.1 2.6 2.6 2.1 2.9 3.2 3.7 3.6 3.9 4.8 3.2 2.8Macao, China .. .. .. .. 54.2 59.1 63.6 41.4 30.6 49.0 .. ..Mongolia –6.8 –5.8 –5.0 –12.0 –8.6 –7.1 1.3 1.3 7.0 6.7 –13.1 –7.0Republic of Korea 11.7 5.5 2.3 1.6 0.9 1.9 3.9 1.8 0.6 0.6 –0.7 4.6Russian Federation 0.1 12.6 18.0 11.0 8.5 8.2 10.1 11.1 9.6 6.0 6.1 3.9
North and Central AsiaArmenia –22.1 –16.6 –14.6 –9.4 –6.2 –6.7 –0.5 –1.1 –1.8 –6.4 –11.6 –12.5Azerbaijan –30.7 –13.1 –3.2 –0.9 –12.3 –27.8 –29.8 1.3 17.7 30.7 35.5 16.0Georgia –12.8 –10.0 –7.9 –6.4 –6.4 –9.6 –6.9 –11.1 –15.1 –19.6 –22.7 –16.8Kazakhstan –5.8 –1.0 2.0 –6.5 –4.4 –0.9 0.8 –1.8 –2.5 –8.0 5.3 –1.9Kyrgyzstan –25.1 –20.1 –9.0 –3.4 –3.8 –3.2 0.2 –2.4 –10.6 –6.9 –13.4 –8.1Russian Federation 0.1 12.6 18.0 11.0 8.5 8.2 10.1 11.1 9.6 6.0 6.1 3.9Tajikistan –7.3 –0.9 –1.6 –4.9 –3.5 –1.3 –3.9 –2.7 –2.8 –8.6 –7.9 –6.5Turkmenistan –32.7 –14.8 8.2 1.7 6.7 2.7 0.6 5.1 15.7 15.5 18.7 20.4Uzbekistan –0.7 –1.0 1.8 –1.0 1.2 5.8 7.2 7.7 9.1 7.3 12.8 7.2
OceaniaAustralia –4.8 –5.3 –3.8 –2.0 –3.8 –5.4 –6.1 –5.8 –5.5 –6.3 –4.4 –3.8Fiji 4.6 –1.1 –4.0 –6.7 2.6 –6.6 –12.9 –11.4 –19.0 –14.0 –18.6 –8.7Kiribati 27.7 11.9 –0.8 16.1 7.6 –19.5 –11.1 –19.1 –2.9 –1.0 –0.9 –3.1New Zealand –3.8 –6.1 –5.1 –2.7 –3.9 –4.3 –6.3 –8.4 –8.6 –8.1 –8.9 –6.1Papua New Guinea 0.9 3.9 10.1 8.8 –4.2 3.8 4.4 12.4 7.3 1.8 2.8 –6.7Samoa 6.6 2.3 –3.3 –36.2 –22.2 –8.1 –6.9 –10.7 –16.8 –8.4 –12.4 –16.4Solomon Islands –1.3 3.0 –7.3 –6.4 –4.4 6.3 16.3 –6.9 –6.3 –12.4 –18.7 –11.1Tonga –11.9 –1.0 –6.7 –9.9 4.9 –2.9 3.8 –2.7 –8.0 –8.5 –9.0 –6.5Vanuatu 2.5 –4.9 2.0 2.0 –5.4 –6.6 –5.0 –7.4 –4.1 –5.9 –7.4 –6.0
South and South-West AsiaBangladesh –0.6 –0.9 0.0 –1.7 0.5 0.4 0.9 –0.6 1.2 1.4 0.9 1.0Bhutan 10.6 2.2 5.4 –8.8 –14.9 –21.8 –17.0 –28.4 –4.5 14.4 –2.1 –10.1India –1.0 –1.0 –0.6 0.7 1.3 2.4 –0.4 –1.2 –1.0 –1.3 –2.4 –3.3Iran (Islamic Republic of) –2.2 6.3 13.0 5.2 3.1 0.6 0.6 8.8 9.2 11.9 6.0 –0.2Maldives –4.1 –13.4 –8.2 –9.8 –5.6 –4.5 –15.8 –36.4 –33.0 –41.5 –51.4 –25.1Nepal –0.9 4.0 2.9 4.5 4.2 2.4 2.7 2.0 2.2 –0.1 2.9 4.3Pakistan –2.2 –2.6 –0.3 0.4 3.9 4.9 1.8 –1.4 –3.9 –4.8 –8.4 –5.3Sri Lanka –1.4 –3.5 –6.3 –1.1 –1.4 –0.4 –3.1 –2.5 –5.3 –4.3 –9.0 –0.3Turkey 0.7 –0.4 –3.7 1.9 –0.3 –2.5 –3.7 –4.6 –6.0 –5.8 –5.7 –2.1
South-East AsiaCambodia –5.7 –5.0 –2.7 –1.1 –2.3 –3.6 –2.2 –3.6 0.4 –2.8 –7.3 –5.4Indonesia 4.3 4.1 4.8 4.3 4.0 3.5 0.6 0.1 3.0 2.4 0.1 2.0Lao People’s Democratic Republic –11.7 –8.3 –0.5 –4.7 0.3 –2.0 –7.7 –5.7 1.4 2.6 3.3 ..Malaysia 13.2 15.9 9.0 7.9 7.1 12.1 12.1 14.5 16.3 15.5 17.6 15.0Myanmar –0.2 –0.1 –0.1 –0.03 0.01 0.00 0.01 0.00 0.03 .. .. ..Philippines 2.4 –3.8 –2.9 –2.4 –0.4 0.4 1.9 2.0 4.5 4.9 2.5 3.6Singapore 22.2 17.4 11.6 12.5 12.6 23.1 16.6 18.3 21.4 23.5 14.8 13.4Thailand 12.7 10.1 7.6 4.4 3.7 3.3 1.7 –4.3 1.1 6.3 0.6 7.7Timor-Leste –7.1 –12.6 –15.9 –15.4 20.7 78.4 165.2 296.1 405.0 191.0Viet Nam –3.9 4.1 3.5 2.1 –1.7 –4.9 –3.5 –1.1 –0.3 –9.8 –11.9 –9.0
Note: Figures for 2009 are estimates.Current account balance of Papua New Guinea for 2005-2008 is based on International Monetary Fund 2007 Article IV Consultation.Current account balance of Samoa and Tonga for 2005-2008 is based on International Monetary Fund 2008 Article IV Consultation.
Sources: ESCAP, based on International Monetary Fund, International Financial Statistcs databases (Washington, D.C., September 2009) andWorld Economic Outlook Databases (Washington, D.C., October 2009) with updates and estimates from national sources.
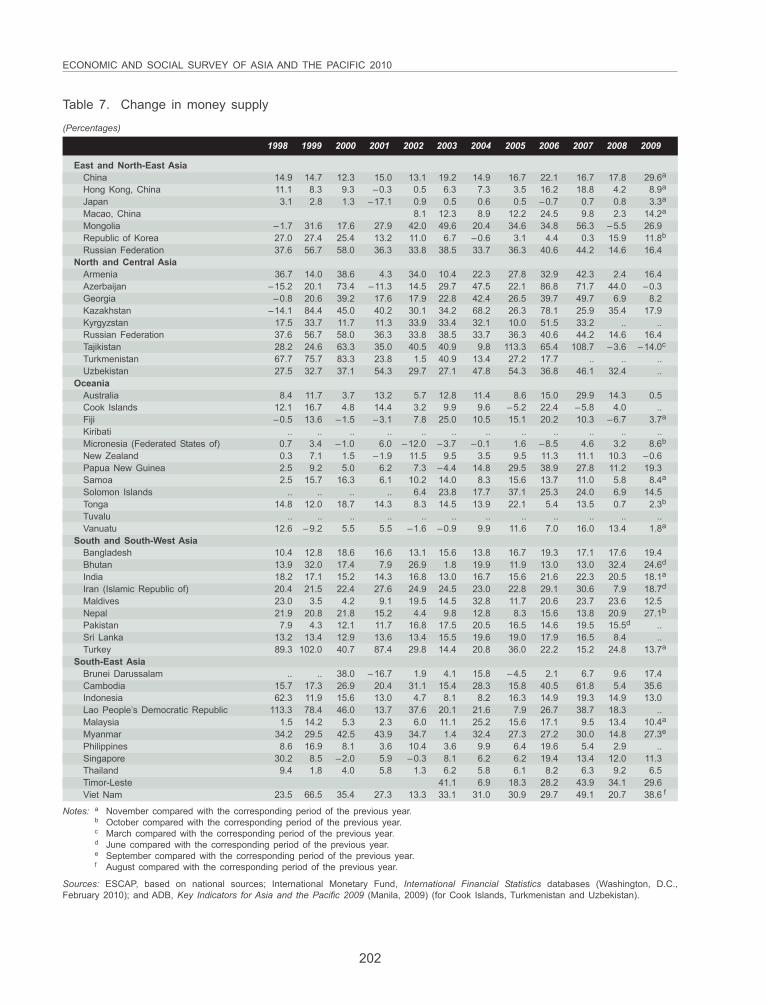
202
ECONOMIC AND SOCIAL SURVEY OF ASIA AND THE PACIFIC 2010
Table 7. Change in money supply
(Percentages)
1998 1999 2000 2001 2002 2003 2004 2005 2006 2007 2008 2009
East and North-East AsiaChina 14.9 14.7 12.3 15.0 13.1 19.2 14.9 16.7 22.1 16.7 17.8 29.6a
Hong Kong, China 11.1 8.3 9.3 –0.3 0.5 6.3 7.3 3.5 16.2 18.8 4.2 8.9a
Japan 3.1 2.8 1.3 –17.1 0.9 0.5 0.6 0.5 –0.7 0.7 0.8 3.3a
Macao, China 8.1 12.3 8.9 12.2 24.5 9.8 2.3 14.2a
Mongolia –1.7 31.6 17.6 27.9 42.0 49.6 20.4 34.6 34.8 56.3 –5.5 26.9Republic of Korea 27.0 27.4 25.4 13.2 11.0 6.7 –0.6 3.1 4.4 0.3 15.9 11.8b
Russian Federation 37.6 56.7 58.0 36.3 33.8 38.5 33.7 36.3 40.6 44.2 14.6 16.4North and Central Asia
Armenia 36.7 14.0 38.6 4.3 34.0 10.4 22.3 27.8 32.9 42.3 2.4 16.4Azerbaijan –15.2 20.1 73.4 –11.3 14.5 29.7 47.5 22.1 86.8 71.7 44.0 –0.3Georgia –0.8 20.6 39.2 17.6 17.9 22.8 42.4 26.5 39.7 49.7 6.9 8.2Kazakhstan –14.1 84.4 45.0 40.2 30.1 34.2 68.2 26.3 78.1 25.9 35.4 17.9Kyrgyzstan 17.5 33.7 11.7 11.3 33.9 33.4 32.1 10.0 51.5 33.2 .. ..Russian Federation 37.6 56.7 58.0 36.3 33.8 38.5 33.7 36.3 40.6 44.2 14.6 16.4Tajikistan 28.2 24.6 63.3 35.0 40.5 40.9 9.8 113.3 65.4 108.7 –3.6 –14.0c
Turkmenistan 67.7 75.7 83.3 23.8 1.5 40.9 13.4 27.2 17.7 .. .. ..Uzbekistan 27.5 32.7 37.1 54.3 29.7 27.1 47.8 54.3 36.8 46.1 32.4 ..
OceaniaAustralia 8.4 11.7 3.7 13.2 5.7 12.8 11.4 8.6 15.0 29.9 14.3 0.5Cook Islands 12.1 16.7 4.8 14.4 3.2 9.9 9.6 –5.2 22.4 –5.8 4.0 ..Fiji –0.5 13.6 –1.5 –3.1 7.8 25.0 10.5 15.1 20.2 10.3 –6.7 3.7a
Kiribati .. .. .. .. .. .. .. .. .. .. .. ..Micronesia (Federated States of) 0.7 3.4 –1.0 6.0 –12.0 –3.7 –0.1 1.6 –8.5 4.6 3.2 8.6b
New Zealand 0.3 7.1 1.5 –1.9 11.5 9.5 3.5 9.5 11.3 11.1 10.3 –0.6Papua New Guinea 2.5 9.2 5.0 6.2 7.3 –4.4 14.8 29.5 38.9 27.8 11.2 19.3Samoa 2.5 15.7 16.3 6.1 10.2 14.0 8.3 15.6 13.7 11.0 5.8 8.4a
Solomon Islands .. .. .. .. 6.4 23.8 17.7 37.1 25.3 24.0 6.9 14.5Tonga 14.8 12.0 18.7 14.3 8.3 14.5 13.9 22.1 5.4 13.5 0.7 2.3b
Tuvalu .. .. .. .. .. .. .. .. .. .. .. ..Vanuatu 12.6 –9.2 5.5 5.5 –1.6 –0.9 9.9 11.6 7.0 16.0 13.4 1.8a
South and South-West AsiaBangladesh 10.4 12.8 18.6 16.6 13.1 15.6 13.8 16.7 19.3 17.1 17.6 19.4Bhutan 13.9 32.0 17.4 7.9 26.9 1.8 19.9 11.9 13.0 13.0 32.4 24.6d
India 18.2 17.1 15.2 14.3 16.8 13.0 16.7 15.6 21.6 22.3 20.5 18.1a
Iran (Islamic Republic of) 20.4 21.5 22.4 27.6 24.9 24.5 23.0 22.8 29.1 30.6 7.9 18.7d
Maldives 23.0 3.5 4.2 9.1 19.5 14.5 32.8 11.7 20.6 23.7 23.6 12.5Nepal 21.9 20.8 21.8 15.2 4.4 9.8 12.8 8.3 15.6 13.8 20.9 27.1b
Pakistan 7.9 4.3 12.1 11.7 16.8 17.5 20.5 16.5 14.6 19.5 15.5d ..Sri Lanka 13.2 13.4 12.9 13.6 13.4 15.5 19.6 19.0 17.9 16.5 8.4 ..Turkey 89.3 102.0 40.7 87.4 29.8 14.4 20.8 36.0 22.2 15.2 24.8 13.7a
South-East AsiaBrunei Darussalam .. .. 38.0 –16.7 1.9 4.1 15.8 –4.5 2.1 6.7 9.6 17.4Cambodia 15.7 17.3 26.9 20.4 31.1 15.4 28.3 15.8 40.5 61.8 5.4 35.6Indonesia 62.3 11.9 15.6 13.0 4.7 8.1 8.2 16.3 14.9 19.3 14.9 13.0Lao People’s Democratic Republic 113.3 78.4 46.0 13.7 37.6 20.1 21.6 7.9 26.7 38.7 18.3 ..Malaysia 1.5 14.2 5.3 2.3 6.0 11.1 25.2 15.6 17.1 9.5 13.4 10.4a
Myanmar 34.2 29.5 42.5 43.9 34.7 1.4 32.4 27.3 27.2 30.0 14.8 27.3e
Philippines 8.6 16.9 8.1 3.6 10.4 3.6 9.9 6.4 19.6 5.4 2.9 ..Singapore 30.2 8.5 –2.0 5.9 –0.3 8.1 6.2 6.2 19.4 13.4 12.0 11.3Thailand 9.4 1.8 4.0 5.8 1.3 6.2 5.8 6.1 8.2 6.3 9.2 6.5Timor-Leste 41.1 6.9 18.3 28.2 43.9 34.1 29.6Viet Nam 23.5 66.5 35.4 27.3 13.3 33.1 31.0 30.9 29.7 49.1 20.7 38.6 f
Notes: a November compared with the corresponding period of the previous year.b October compared with the corresponding period of the previous year.c March compared with the corresponding period of the previous year.d June compared with the corresponding period of the previous year.e September compared with the corresponding period of the previous year.f August compared with the corresponding period of the previous year.
Sources: ESCAP, based on national sources; International Monetary Fund, International Financial Statistics databases (Washington, D.C.,February 2010); and ADB, Key Indicators for Asia and the Pacific 2009 (Manila, 2009) (for Cook Islands, Turkmenistan and Uzbekistan).
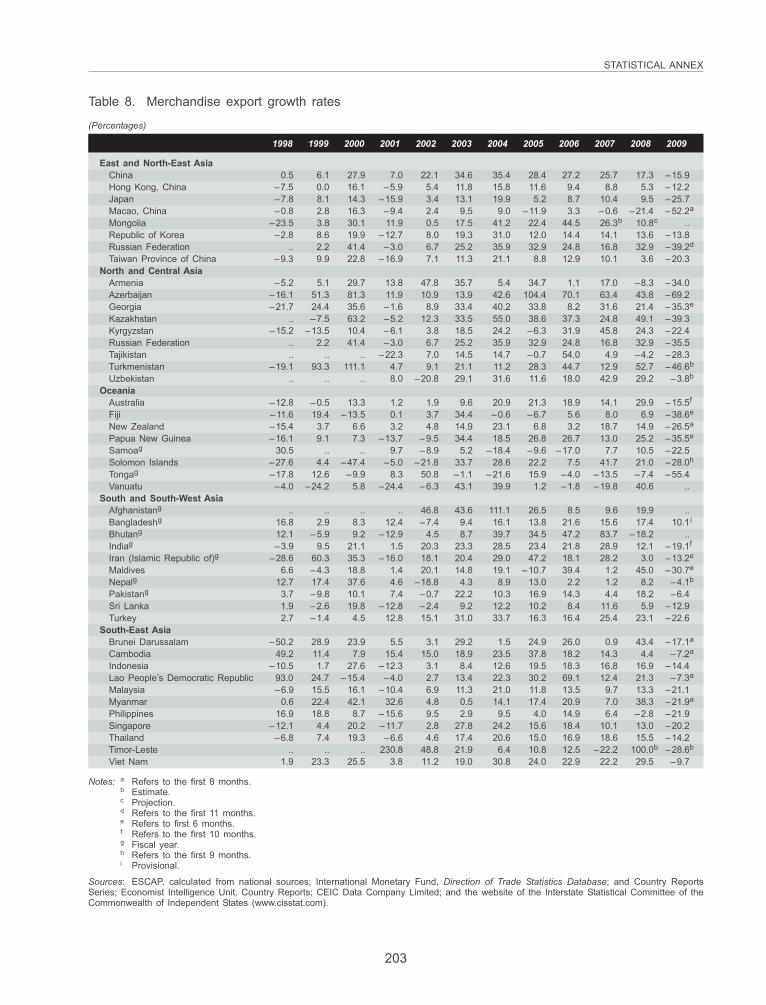
203
STATISTICAL ANNEX
Table 8. Merchandise export growth rates
(Percentages)
1998 1999 2000 2001 2002 2003 2004 2005 2006 2007 2008 2009
East and North-East AsiaChina 0.5 6.1 27.9 7.0 22.1 34.6 35.4 28.4 27.2 25.7 17.3 –15.9Hong Kong, China –7.5 0.0 16.1 –5.9 5.4 11.8 15.8 11.6 9.4 8.8 5.3 –12.2Japan –7.8 8.1 14.3 –15.9 3.4 13.1 19.9 5.2 8.7 10.4 9.5 –25.7Macao, China –0.8 2.8 16.3 –9.4 2.4 9.5 9.0 –11.9 3.3 –0.6 –21.4 –52.2a
Mongolia –23.5 3.8 30.1 11.9 0.5 17.5 41.2 22.4 44.5 26.3b 10.8c ..Republic of Korea –2.8 8.6 19.9 –12.7 8.0 19.3 31.0 12.0 14.4 14.1 13.6 –13.8Russian Federation .. 2.2 41.4 –3.0 6.7 25.2 35.9 32.9 24.8 16.8 32.9 –39.2d
Taiwan Province of China –9.3 9.9 22.8 –16.9 7.1 11.3 21.1 8.8 12.9 10.1 3.6 –20.3North and Central Asia
Armenia –5.2 5.1 29.7 13.8 47.8 35.7 5.4 34.7 1.1 17.0 –8.3 –34.0Azerbaijan –16.1 51.3 81.3 11.9 10.9 13.9 42.6 104.4 70.1 63.4 43.8 –69.2Georgia –21.7 24.4 35.6 –1.6 8.9 33.4 40.2 33.8 8.2 31.6 21.4 –35.3e
Kazakhstan .. –7.5 63.2 –5.2 12.3 33.5 55.0 38.6 37.3 24.8 49.1 –39.3Kyrgyzstan –15.2 –13.5 10.4 –6.1 3.8 18.5 24.2 –6.3 31.9 45.8 24.3 –22.4Russian Federation .. 2.2 41.4 –3.0 6.7 25.2 35.9 32.9 24.8 16.8 32.9 –35.5Tajikistan .. .. .. –22.3 7.0 14.5 14.7 –0.7 54.0 4.9 –4.2 –28.3Turkmenistan –19.1 93.3 111.1 4.7 9.1 21.1 11.2 28.3 44.7 12.9 52.7 –46.6b
Uzbekistan .. .. .. 8.0 –20.8 29.1 31.6 11.6 18.0 42.9 29.2 –3.8b
OceaniaAustralia –12.8 –0.5 13.3 1.2 1.9 9.6 20.9 21.3 18.9 14.1 29.9 –15.5f
Fiji –11.6 19.4 –13.5 0.1 3.7 34.4 –0.6 –6.7 5.6 8.0 6.9 –38.6e
New Zealand –15.4 3.7 6.6 3.2 4.8 14.9 23.1 6.8 3.2 18.7 14.9 –26.5a
Papua New Guinea –16.1 9.1 7.3 –13.7 –9.5 34.4 18.5 26.8 26.7 13.0 25.2 –35.5e
Samoag 30.5 .. .. 9.7 –8.9 5.2 –18.4 –9.6 –17.0 7.7 10.5 –22.5Solomon Islands –27.6 4.4 –47.4 –5.0 –21.8 33.7 28.6 22.2 7.5 41.7 21.0 –28.0h
Tongag –17.8 12.6 –9.9 8.3 50.8 –1.1 –21.6 15.9 –4.0 –13.5 –7.4 –55.4Vanuatu –4.0 –24.2 5.8 –24.4 –6.3 43.1 39.9 1.2 –1.8 –19.8 40.6 ..
South and South-West AsiaAfghanistang .. .. .. .. 46.8 43.6 111.1 26.5 8.5 9.6 19.9 ..Bangladeshg 16.8 2.9 8.3 12.4 –7.4 9.4 16.1 13.8 21.6 15.6 17.4 10.1i
Bhutang 12.1 –5.9 9.2 –12.9 4.5 8.7 39.7 34.5 47.2 83.7 –18.2 ..Indiag –3.9 9.5 21.1 1.5 20.3 23.3 28.5 23.4 21.8 28.9 12.1 –19.1f
Iran (Islamic Republic of)g –28.6 60.3 35.3 –16.0 18.1 20.4 29.0 47.2 18.1 28.2 3.0 –13.2e
Maldives 6.6 –4.3 18.8 1.4 20.1 14.8 19.1 –10.7 39.4 1.2 45.0 –30.7e
Nepalg 12.7 17.4 37.6 4.6 –18.8 4.3 8.9 13.0 2.2 1.2 8.2 –4.1b
Pakistang 3.7 –9.8 10.1 7.4 –0.7 22.2 10.3 16.9 14.3 4.4 18.2 –6.4Sri Lanka 1.9 –2.6 19.8 –12.8 –2.4 9.2 12.2 10.2 8.4 11.6 5.9 –12.9Turkey 2.7 –1.4 4.5 12.8 15.1 31.0 33.7 16.3 16.4 25.4 23.1 –22.6
South-East AsiaBrunei Darussalam –50.2 28.9 23.9 5.5 3.1 29.2 1.5 24.9 26.0 0.9 43.4 –17.1a
Cambodia 49.2 11.4 7.9 15.4 15.0 18.9 23.5 37.8 18.2 14.3 4.4 –7.2a
Indonesia –10.5 1.7 27.6 –12.3 3.1 8.4 12.6 19.5 18.3 16.8 16.9 –14.4Lao People’s Democratic Republic 93.0 24.7 –15.4 –4.0 2.7 13.4 22.3 30.2 69.1 12.4 21.3 –7.3a
Malaysia –6.9 15.5 16.1 –10.4 6.9 11.3 21.0 11.8 13.5 9.7 13.3 –21.1Myanmar 0.6 22.4 42.1 32.6 4.8 0.5 14.1 17.4 20.9 7.0 38.3 –21.9a
Philippines 16.9 18.8 8.7 –15.6 9.5 2.9 9.5 4.0 14.9 6.4 –2.8 –21.9Singapore –12.1 4.4 20.2 –11.7 2.8 27.8 24.2 15.6 18.4 10.1 13.0 –20.2Thailand –6.8 7.4 19.3 –6.6 4.6 17.4 20.6 15.0 16.9 18.6 15.5 –14.2Timor-Leste .. .. .. 230.8 48.8 21.9 6.4 10.8 12.5 –22.2 100.0b –28.6b
Viet Nam 1.9 23.3 25.5 3.8 11.2 19.0 30.8 24.0 22.9 22.2 29.5 –9.7
Notes: a Refers to the first 8 months.b Estimate.c Projection.d Refers to the first 11 months.e Refers to first 6 months.f Refers to the first 10 months.g Fiscal year.h Refers to the first 9 months.i Provisional.
Sources: ESCAP, calculated from national sources; International Monetary Fund, Direction of Trade Statistics Database; and Country ReportsSeries; Economist Intelligence Unit, Country Reports; CEIC Data Company Limited; and the website of the Interstate Statistical Committee of theCommonwealth of Independent States (www.cisstat.com).
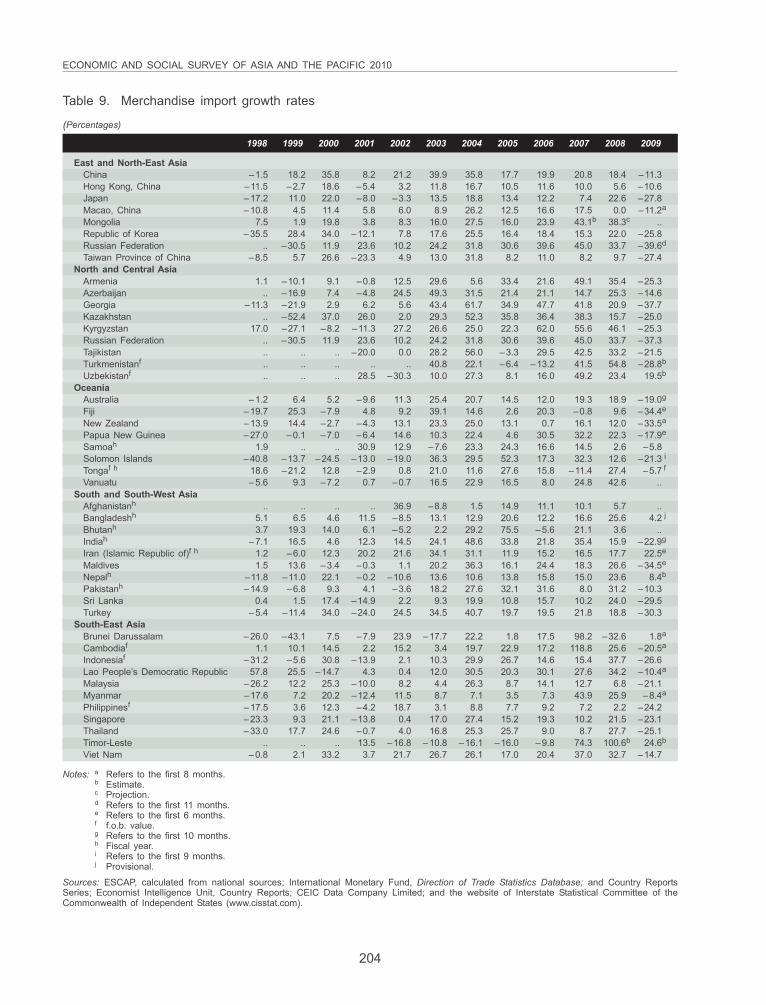
204
ECONOMIC AND SOCIAL SURVEY OF ASIA AND THE PACIFIC 2010
Table 9. Merchandise import growth rates
(Percentages)
1998 1999 2000 2001 2002 2003 2004 2005 2006 2007 2008 2009
East and North-East AsiaChina –1.5 18.2 35.8 8.2 21.2 39.9 35.8 17.7 19.9 20.8 18.4 –11.3Hong Kong, China –11.5 –2.7 18.6 –5.4 3.2 11.8 16.7 10.5 11.6 10.0 5.6 –10.6Japan –17.2 11.0 22.0 –8.0 –3.3 13.5 18.8 13.4 12.2 7.4 22.6 –27.8Macao, China –10.8 4.5 11.4 5.8 6.0 8.9 26.2 12.5 16.6 17.5 0.0 –11.2a
Mongolia 7.5 1.9 19.8 3.8 8.3 16.0 27.5 16.0 23.9 43.1b 38.3c ..Republic of Korea –35.5 28.4 34.0 –12.1 7.8 17.6 25.5 16.4 18.4 15.3 22.0 –25.8Russian Federation .. –30.5 11.9 23.6 10.2 24.2 31.8 30.6 39.6 45.0 33.7 –39.6d
Taiwan Province of China –8.5 5.7 26.6 –23.3 4.9 13.0 31.8 8.2 11.0 8.2 9.7 –27.4North and Central Asia
Armenia 1.1 –10.1 9.1 –0.8 12.5 29.6 5.6 33.4 21.6 49.1 35.4 –25.3Azerbaijan .. –16.9 7.4 –4.8 24.5 49.3 31.5 21.4 21.1 14.7 25.3 –14.6Georgia –11.3 –21.9 2.9 6.2 5.6 43.4 61.7 34.9 47.7 41.8 20.9 –37.7Kazakhstan .. –52.4 37.0 26.0 2.0 29.3 52.3 35.8 36.4 38.3 15.7 –25.0Kyrgyzstan 17.0 –27.1 –8.2 –11.3 27.2 26.6 25.0 22.3 62.0 55.6 46.1 –25.3Russian Federation .. –30.5 11.9 23.6 10.2 24.2 31.8 30.6 39.6 45.0 33.7 –37.3Tajikistan .. .. .. –20.0 0.0 28.2 56.0 –3.3 29.5 42.5 33.2 –21.5Turkmenistanf .. .. .. .. .. 40.8 22.1 –6.4 –13.2 41.5 54.8 –28.8b
Uzbekistanf .. .. .. 28.5 –30.3 10.0 27.3 8.1 16.0 49.2 23.4 19.5b
OceaniaAustralia –1.2 6.4 5.2 –9.6 11.3 25.4 20.7 14.5 12.0 19.3 18.9 –19.0g
Fiji –19.7 25.3 –7.9 4.8 9.2 39.1 14.6 2.6 20.3 –0.8 9.6 –34.4e
New Zealand –13.9 14.4 –2.7 –4.3 13.1 23.3 25.0 13.1 0.7 16.1 12.0 –33.5a
Papua New Guinea –27.0 –0.1 –7.0 –6.4 14.6 10.3 22.4 4.6 30.5 32.2 22.3 –17.9e
Samoah 1.9 .. .. 30.9 12.9 –7.6 23.3 24.3 16.6 14.5 2.6 –5.8Solomon Islands –40.8 –13.7 –24.5 –13.0 –19.0 36.3 29.5 52.3 17.3 32.3 12.6 –21.3 i
Tongaf h 18.6 –21.2 12.8 –2.9 0.8 21.0 11.6 27.6 15.8 –11.4 27.4 –5.7 f
Vanuatu –5.6 9.3 –7.2 0.7 –0.7 16.5 22.9 16.5 8.0 24.8 42.6 ..South and South-West Asia
Afghanistanh .. .. .. .. 36.9 –8.8 1.5 14.9 11.1 10.1 5.7 ..Bangladeshh 5.1 6.5 4.6 11.5 –8.5 13.1 12.9 20.6 12.2 16.6 25.6 4.2 j
Bhutanh 3.7 19.3 14.0 6.1 –5.2 2.2 29.2 75.5 –5.6 21.1 3.6 ..Indiah –7.1 16.5 4.6 12.3 14.5 24.1 48.6 33.8 21.8 35.4 15.9 –22.9g
Iran (Islamic Republic of)f h 1.2 –6.0 12.3 20.2 21.6 34.1 31.1 11.9 15.2 16.5 17.7 22.5e
Maldives 1.5 13.6 –3.4 –0.3 1.1 20.2 36.3 16.1 24.4 18.3 26.6 –34.5e
Nepalh –11.8 –11.0 22.1 –0.2 –10.6 13.6 10.6 13.8 15.8 15.0 23.6 8.4b
Pakistanh –14.9 –6.8 9.3 4.1 –3.6 18.2 27.6 32.1 31.6 8.0 31.2 –10.3Sri Lanka 0.4 1.5 17.4 –14.9 2.2 9.3 19.9 10.8 15.7 10.2 24.0 –29.5Turkey –5.4 –11.4 34.0 –24.0 24.5 34.5 40.7 19.7 19.5 21.8 18.8 –30.3
South-East AsiaBrunei Darussalam –26.0 –43.1 7.5 –7.9 23.9 –17.7 22.2 1.8 17.5 98.2 –32.6 1.8a
Cambodiaf 1.1 10.1 14.5 2.2 15.2 3.4 19.7 22.9 17.2 118.8 25.6 –20.5a
Indonesiaf –31.2 –5.6 30.8 –13.9 2.1 10.3 29.9 26.7 14.6 15.4 37.7 –26.6Lao People’s Democratic Republic 57.8 25.5 –14.7 4.3 0.4 12.0 30.5 20.3 30.1 27.6 34.2 –10.4a
Malaysia –26.2 12.2 25.3 –10.0 8.2 4.4 26.3 8.7 14.1 12.7 6.8 –21.1Myanmar –17.6 7.2 20.2 –12.4 11.5 8.7 7.1 3.5 7.3 43.9 25.9 –8.4a
Philippinesf –17.5 3.6 12.3 –4.2 18.7 3.1 8.8 7.7 9.2 7.2 2.2 –24.2Singapore –23.3 9.3 21.1 –13.8 0.4 17.0 27.4 15.2 19.3 10.2 21.5 –23.1Thailand –33.0 17.7 24.6 –0.7 4.0 16.8 25.3 25.7 9.0 8.7 27.7 –25.1Timor-Leste .. .. .. 13.5 –16.8 –10.8 –16.1 –16.0 –9.8 74.3 100.6b 24.6b
Viet Nam –0.8 2.1 33.2 3.7 21.7 26.7 26.1 17.0 20.4 37.0 32.7 –14.7
Notes: a Refers to the first 8 months.b Estimate.c Projection.d Refers to the first 11 months.e Refers to the first 6 months.f f.o.b. value.g Refers to the first 10 months.h Fiscal year.i Refers to the first 9 months.j Provisional.
Sources: ESCAP, calculated from national sources; International Monetary Fund, Direction of Trade Statistics Database; and Country ReportsSeries; Economist Intelligence Unit, Country Reports; CEIC Data Company Limited; and the website of Interstate Statistical Committee of theCommonwealth of Independent States (www.cisstat.com).
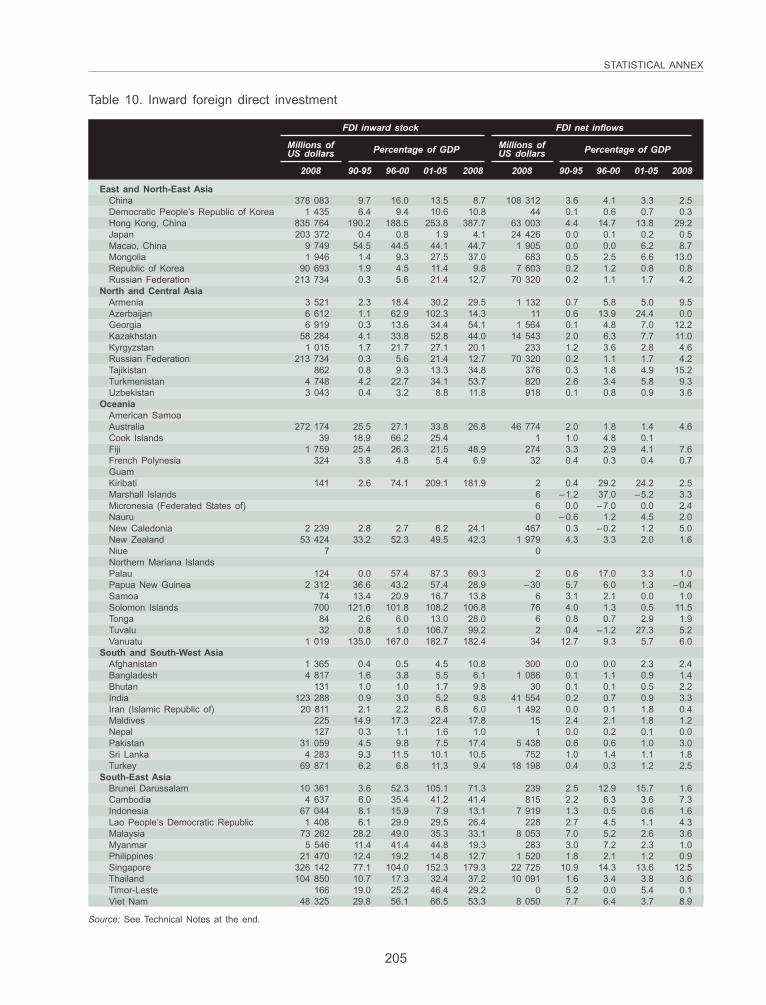
205
STATISTICAL ANNEX
Table 10. Inward foreign direct investment
FDI inward stock FDI net inflows
Millions of Percentage of GDP Millions of Percentage of GDPUS dollars US dollars
2008 90-95 96-00 01-05 2008 2008 90-95 96-00 01-05 2008
East and North-East AsiaChina 378 083 9.7 16.0 13.5 8.7 108 312 3.6 4.1 3.3 2.5Democratic People’s Republic of Korea 1 435 6.4 9.4 10.6 10.8 44 0.1 0.6 0.7 0.3Hong Kong, China 835 764 190.2 188.5 253.8 387.7 63 003 4.4 14.7 13.8 29.2Japan 203 372 0.4 0.8 1.9 4.1 24 426 0.0 0.1 0.2 0.5Macao, China 9 749 54.5 44.5 44.1 44.7 1 905 0.0 0.0 6.2 8.7Mongolia 1 946 1.4 9.3 27.5 37.0 683 0.5 2.5 6.6 13.0Republic of Korea 90 693 1.9 4.5 11.4 9.8 7 603 0.2 1.2 0.8 0.8Russian Federation 213 734 0.3 5.6 21.4 12.7 70 320 0.2 1.1 1.7 4.2
North and Central AsiaArmenia 3 521 2.3 18.4 30.2 29.5 1 132 0.7 5.8 5.0 9.5Azerbaijan 6 612 1.1 62.9 102.3 14.3 11 0.6 13.9 24.4 0.0Georgia 6 919 0.3 13.6 34.4 54.1 1 564 0.1 4.8 7.0 12.2Kazakhstan 58 284 4.1 33.8 52.8 44.0 14 543 2.0 6.3 7.7 11.0Kyrgyzstan 1 015 1.7 21.7 27.1 20.1 233 1.2 3.6 2.8 4.6Russian Federation 213 734 0.3 5.6 21.4 12.7 70 320 0.2 1.1 1.7 4.2Tajikistan 862 0.8 9.3 13.3 34.8 376 0.3 1.8 4.9 15.2Turkmenistan 4 748 4.2 22.7 34.1 53.7 820 2.6 3.4 5.8 9.3Uzbekistan 3 043 0.4 3.2 8.8 11.8 918 0.1 0.8 0.9 3.6
OceaniaAmerican SamoaAustralia 272 174 25.5 27.1 33.8 26.8 46 774 2.0 1.8 1.4 4.6Cook Islands 39 18.9 66.2 25.4 1 1.0 4.8 0.1Fiji 1 759 25.4 26.3 21.5 48.9 274 3.3 2.9 4.1 7.6French Polynesia 324 3.8 4.8 5.4 6.9 32 0.4 0.3 0.4 0.7GuamKiribati 141 2.6 74.1 209.1 181.9 2 0.4 29.2 24.2 2.5Marshall Islands 6 –1.2 37.0 –5.2 3.3Micronesia (Federated States of) 6 0.0 –7.0 0.0 2.4Nauru 0 –0.6 1.2 4.5 2.0New Caledonia 2 239 2.8 2.7 6.2 24.1 467 0.3 –0.2 1.2 5.0New Zealand 53 424 33.2 52.3 49.5 42.3 1 979 4.3 3.3 2.0 1.6Niue 7 0Northern Mariana IslandsPalau 124 0.0 57.4 87.3 69.3 2 0.6 17.0 3.3 1.0Papua New Guinea 2 312 36.6 43.2 57.4 28.9 –30 5.7 6.0 1.3 –0.4Samoa 74 13.4 20.9 16.7 13.8 6 3.1 2.1 0.0 1.0Solomon Islands 700 121.6 101.8 108.2 106.8 76 4.0 1.3 0.5 11.5Tonga 84 2.6 6.0 13.0 28.0 6 0.8 0.7 2.9 1.9Tuvalu 32 0.8 1.0 106.7 99.2 2 0.4 –1.2 27.3 5.2Vanuatu 1 019 135.0 167.0 182.7 182.4 34 12.7 9.3 5.7 6.0
South and South-West AsiaAfghanistan 1 365 0.4 0.5 4.5 10.8 300 0.0 0.0 2.3 2.4Bangladesh 4 817 1.6 3.8 5.5 6.1 1 086 0.1 1.1 0.9 1.4Bhutan 131 1.0 1.0 1.7 9.8 30 0.1 0.1 0.5 2.2India 123 288 0.9 3.0 5.2 9.8 41 554 0.2 0.7 0.9 3.3Iran (Islamic Republic of) 20 811 2.1 2.2 6.8 6.0 1 492 0.0 0.1 1.8 0.4Maldives 225 14.9 17.3 22.4 17.8 15 2.4 2.1 1.8 1.2Nepal 127 0.3 1.1 1.6 1.0 1 0.0 0.2 0.1 0.0Pakistan 31 059 4.5 9.8 7.5 17.4 5 438 0.6 0.6 1.0 3.0Sri Lanka 4 283 9.3 11.5 10.1 10.5 752 1.0 1.4 1.1 1.8Turkey 69 871 6.2 6.8 11.3 9.4 18 198 0.4 0.3 1.2 2.5
South-East AsiaBrunei Darussalam 10 361 3.6 52.3 105.1 71.3 239 2.5 12.9 15.7 1.6Cambodia 4 637 6.0 35.4 41.2 41.4 815 2.2 6.3 3.6 7.3Indonesia 67 044 8.1 15.9 7.9 13.1 7 919 1.3 0.5 0.6 1.6Lao People’s Democratic Republic 1 408 6.1 29.9 29.5 26.4 228 2.7 4.5 1.1 4.3Malaysia 73 262 28.2 49.0 35.3 33.1 8 053 7.0 5.2 2.6 3.6Myanmar 5 546 11.4 41.4 44.8 19.3 283 3.0 7.2 2.3 1.0Philippines 21 470 12.4 19.2 14.8 12.7 1 520 1.8 2.1 1.2 0.9Singapore 326 142 77.1 104.0 152.3 179.3 22 725 10.9 14.3 13.6 12.5Thailand 104 850 10.7 17.3 32.4 37.2 10 091 1.6 3.4 3.8 3.6Timor-Leste 166 19.0 25.2 46.4 29.2 0 5.2 0.0 5.4 0.1Viet Nam 48 325 29.8 56.1 66.5 53.3 8 050 7.7 6.4 3.7 8.9
Source: See Technical Notes at the end.
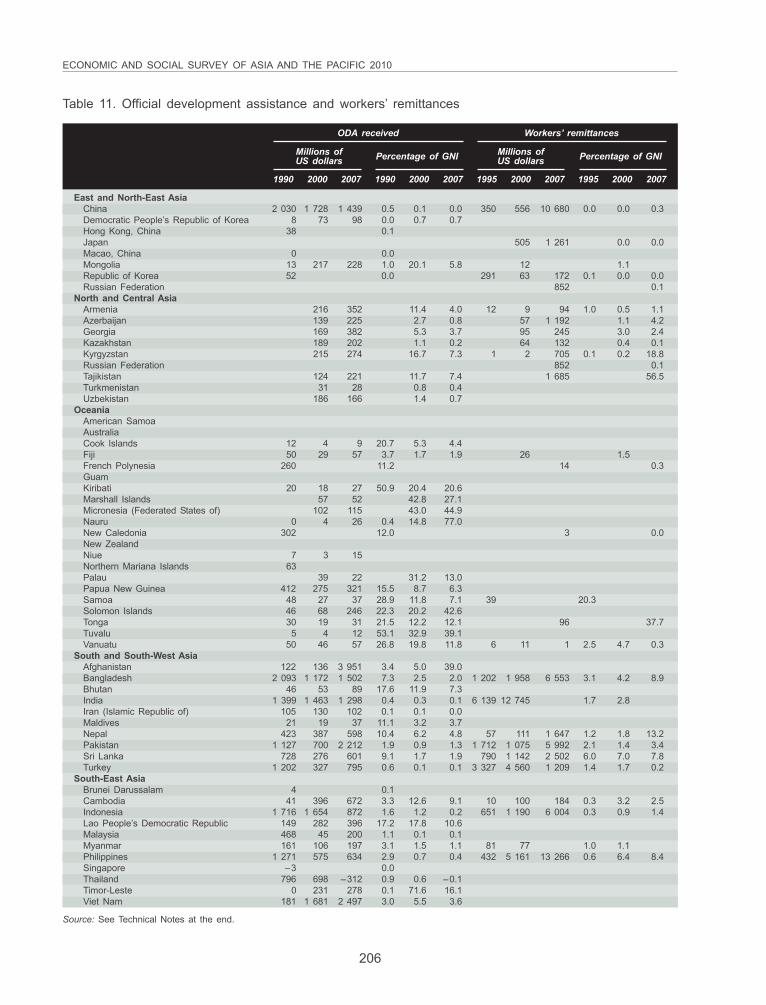
206
ECONOMIC AND SOCIAL SURVEY OF ASIA AND THE PACIFIC 2010
Table 11. Official development assistance and workers’ remittances
ODA received Workers’ remittances
Millions of Percentage of GNI Millions of Percentage of GNIUS dollars US dollars
1990 2000 2007 1990 2000 2007 1995 2000 2007 1995 2000 2007
East and North-East AsiaChina 2 030 1 728 1 439 0.5 0.1 0.0 350 556 10 680 0.0 0.0 0.3Democratic People’s Republic of Korea 8 73 98 0.0 0.7 0.7Hong Kong, China 38 0.1Japan 505 1 261 0.0 0.0Macao, China 0 0.0Mongolia 13 217 228 1.0 20.1 5.8 12 1.1Republic of Korea 52 0.0 291 63 172 0.1 0.0 0.0Russian Federation 852 0.1
North and Central AsiaArmenia 216 352 11.4 4.0 12 9 94 1.0 0.5 1.1Azerbaijan 139 225 2.7 0.8 57 1 192 1.1 4.2Georgia 169 382 5.3 3.7 95 245 3.0 2.4Kazakhstan 189 202 1.1 0.2 64 132 0.4 0.1Kyrgyzstan 215 274 16.7 7.3 1 2 705 0.1 0.2 18.8Russian Federation 852 0.1Tajikistan 124 221 11.7 7.4 1 685 56.5Turkmenistan 31 28 0.8 0.4Uzbekistan 186 166 1.4 0.7
OceaniaAmerican SamoaAustraliaCook Islands 12 4 9 20.7 5.3 4.4Fiji 50 29 57 3.7 1.7 1.9 26 1.5French Polynesia 260 11.2 14 0.3GuamKiribati 20 18 27 50.9 20.4 20.6Marshall Islands 57 52 42.8 27.1Micronesia (Federated States of) 102 115 43.0 44.9Nauru 0 4 26 0.4 14.8 77.0New Caledonia 302 12.0 3 0.0New ZealandNiue 7 3 15Northern Mariana Islands 63Palau 39 22 31.2 13.0Papua New Guinea 412 275 321 15.5 8.7 6.3Samoa 48 27 37 28.9 11.8 7.1 39 20.3Solomon Islands 46 68 246 22.3 20.2 42.6Tonga 30 19 31 21.5 12.2 12.1 96 37.7Tuvalu 5 4 12 53.1 32.9 39.1Vanuatu 50 46 57 26.8 19.8 11.8 6 11 1 2.5 4.7 0.3
South and South-West AsiaAfghanistan 122 136 3 951 3.4 5.0 39.0Bangladesh 2 093 1 172 1 502 7.3 2.5 2.0 1 202 1 958 6 553 3.1 4.2 8.9Bhutan 46 53 89 17.6 11.9 7.3India 1 399 1 463 1 298 0.4 0.3 0.1 6 139 12 745 1.7 2.8Iran (Islamic Republic of) 105 130 102 0.1 0.1 0.0Maldives 21 19 37 11.1 3.2 3.7Nepal 423 387 598 10.4 6.2 4.8 57 111 1 647 1.2 1.8 13.2Pakistan 1 127 700 2 212 1.9 0.9 1.3 1 712 1 075 5 992 2.1 1.4 3.4Sri Lanka 728 276 601 9.1 1.7 1.9 790 1 142 2 502 6.0 7.0 7.8Turkey 1 202 327 795 0.6 0.1 0.1 3 327 4 560 1 209 1.4 1.7 0.2
South-East AsiaBrunei Darussalam 4 0.1Cambodia 41 396 672 3.3 12.6 9.1 10 100 184 0.3 3.2 2.5Indonesia 1 716 1 654 872 1.6 1.2 0.2 651 1 190 6 004 0.3 0.9 1.4Lao People’s Democratic Republic 149 282 396 17.2 17.8 10.6Malaysia 468 45 200 1.1 0.1 0.1Myanmar 161 106 197 3.1 1.5 1.1 81 77 1.0 1.1Philippines 1 271 575 634 2.9 0.7 0.4 432 5 161 13 266 0.6 6.4 8.4Singapore –3 0.0Thailand 796 698 –312 0.9 0.6 –0.1Timor-Leste 0 231 278 0.1 71.6 16.1Viet Nam 181 1 681 2 497 3.0 5.5 3.6
Source: See Technical Notes at the end.
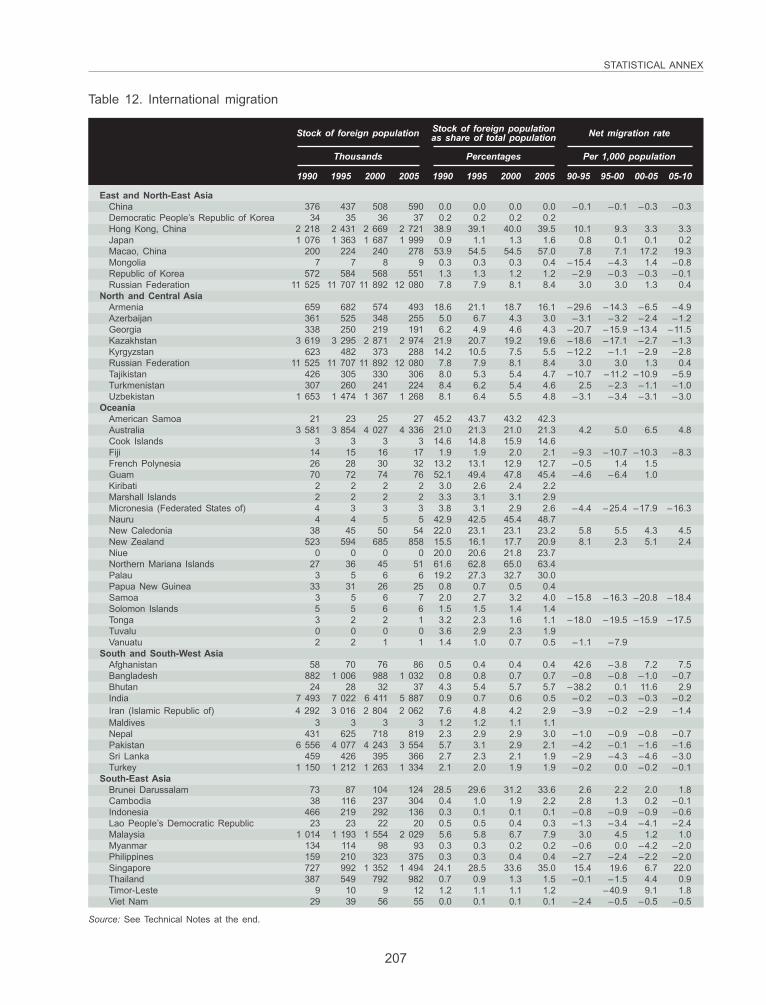
207
STATISTICAL ANNEX
Table 12. International migration
Stock of foreign populationStock of foreign population as share of total population Net migration rate
Thousands Percentages Per 1,000 population
1990 1995 2000 2005 1990 1995 2000 2005 90-95 95-00 00-05 05-10
East and North-East AsiaChina 376 437 508 590 0.0 0.0 0.0 0.0 –0.1 –0.1 –0.3 –0.3Democratic People’s Republic of Korea 34 35 36 37 0.2 0.2 0.2 0.2Hong Kong, China 2 218 2 431 2 669 2 721 38.9 39.1 40.0 39.5 10.1 9.3 3.3 3.3Japan 1 076 1 363 1 687 1 999 0.9 1.1 1.3 1.6 0.8 0.1 0.1 0.2Macao, China 200 224 240 278 53.9 54.5 54.5 57.0 7.8 7.1 17.2 19.3Mongolia 7 7 8 9 0.3 0.3 0.3 0.4 –15.4 –4.3 1.4 –0.8Republic of Korea 572 584 568 551 1.3 1.3 1.2 1.2 –2.9 –0.3 –0.3 –0.1Russian Federation 11 525 11 707 11 892 12 080 7.8 7.9 8.1 8.4 3.0 3.0 1.3 0.4
North and Central AsiaArmenia 659 682 574 493 18.6 21.1 18.7 16.1 –29.6 –14.3 –6.5 –4.9Azerbaijan 361 525 348 255 5.0 6.7 4.3 3.0 –3.1 –3.2 –2.4 –1.2Georgia 338 250 219 191 6.2 4.9 4.6 4.3 –20.7 –15.9 –13.4 –11.5Kazakhstan 3 619 3 295 2 871 2 974 21.9 20.7 19.2 19.6 –18.6 –17.1 –2.7 –1.3Kyrgyzstan 623 482 373 288 14.2 10.5 7.5 5.5 –12.2 –1.1 –2.9 –2.8Russian Federation 11 525 11 707 11 892 12 080 7.8 7.9 8.1 8.4 3.0 3.0 1.3 0.4Tajikistan 426 305 330 306 8.0 5.3 5.4 4.7 –10.7 –11.2 –10.9 –5.9Turkmenistan 307 260 241 224 8.4 6.2 5.4 4.6 2.5 –2.3 –1.1 –1.0Uzbekistan 1 653 1 474 1 367 1 268 8.1 6.4 5.5 4.8 –3.1 –3.4 –3.1 –3.0
OceaniaAmerican Samoa 21 23 25 27 45.2 43.7 43.2 42.3Australia 3 581 3 854 4 027 4 336 21.0 21.3 21.0 21.3 4.2 5.0 6.5 4.8Cook Islands 3 3 3 3 14.6 14.8 15.9 14.6Fiji 14 15 16 17 1.9 1.9 2.0 2.1 –9.3 –10.7 –10.3 –8.3French Polynesia 26 28 30 32 13.2 13.1 12.9 12.7 –0.5 1.4 1.5Guam 70 72 74 76 52.1 49.4 47.8 45.4 –4.6 –6.4 1.0Kiribati 2 2 2 2 3.0 2.6 2.4 2.2Marshall Islands 2 2 2 2 3.3 3.1 3.1 2.9Micronesia (Federated States of) 4 3 3 3 3.8 3.1 2.9 2.6 –4.4 –25.4 –17.9 –16.3Nauru 4 4 5 5 42.9 42.5 45.4 48.7New Caledonia 38 45 50 54 22.0 23.1 23.1 23.2 5.8 5.5 4.3 4.5New Zealand 523 594 685 858 15.5 16.1 17.7 20.9 8.1 2.3 5.1 2.4Niue 0 0 0 0 20.0 20.6 21.8 23.7Northern Mariana Islands 27 36 45 51 61.6 62.8 65.0 63.4Palau 3 5 6 6 19.2 27.3 32.7 30.0Papua New Guinea 33 31 26 25 0.8 0.7 0.5 0.4Samoa 3 5 6 7 2.0 2.7 3.2 4.0 –15.8 –16.3 –20.8 –18.4Solomon Islands 5 5 6 6 1.5 1.5 1.4 1.4Tonga 3 2 2 1 3.2 2.3 1.6 1.1 –18.0 –19.5 –15.9 –17.5Tuvalu 0 0 0 0 3.6 2.9 2.3 1.9Vanuatu 2 2 1 1 1.4 1.0 0.7 0.5 –1.1 –7.9
South and South-West AsiaAfghanistan 58 70 76 86 0.5 0.4 0.4 0.4 42.6 –3.8 7.2 7.5Bangladesh 882 1 006 988 1 032 0.8 0.8 0.7 0.7 –0.8 –0.8 –1.0 –0.7Bhutan 24 28 32 37 4.3 5.4 5.7 5.7 –38.2 0.1 11.6 2.9India 7 493 7 022 6 411 5 887 0.9 0.7 0.6 0.5 –0.2 –0.3 –0.3 –0.2Iran (Islamic Republic of) 4 292 3 016 2 804 2 062 7.6 4.8 4.2 2.9 –3.9 –0.2 –2.9 –1.4Maldives 3 3 3 3 1.2 1.2 1.1 1.1Nepal 431 625 718 819 2.3 2.9 2.9 3.0 –1.0 –0.9 –0.8 –0.7Pakistan 6 556 4 077 4 243 3 554 5.7 3.1 2.9 2.1 –4.2 –0.1 –1.6 –1.6Sri Lanka 459 426 395 366 2.7 2.3 2.1 1.9 –2.9 –4.3 –4.6 –3.0Turkey 1 150 1 212 1 263 1 334 2.1 2.0 1.9 1.9 –0.2 0.0 –0.2 –0.1
South-East AsiaBrunei Darussalam 73 87 104 124 28.5 29.6 31.2 33.6 2.6 2.2 2.0 1.8Cambodia 38 116 237 304 0.4 1.0 1.9 2.2 2.8 1.3 0.2 –0.1Indonesia 466 219 292 136 0.3 0.1 0.1 0.1 –0.8 –0.9 –0.9 –0.6Lao People’s Democratic Republic 23 23 22 20 0.5 0.5 0.4 0.3 –1.3 –3.4 –4.1 –2.4Malaysia 1 014 1 193 1 554 2 029 5.6 5.8 6.7 7.9 3.0 4.5 1.2 1.0Myanmar 134 114 98 93 0.3 0.3 0.2 0.2 –0.6 0.0 –4.2 –2.0Philippines 159 210 323 375 0.3 0.3 0.4 0.4 –2.7 –2.4 –2.2 –2.0Singapore 727 992 1 352 1 494 24.1 28.5 33.6 35.0 15.4 19.6 6.7 22.0Thailand 387 549 792 982 0.7 0.9 1.3 1.5 –0.1 –1.5 4.4 0.9Timor-Leste 9 10 9 12 1.2 1.1 1.1 1.2 –40.9 9.1 1.8Viet Nam 29 39 56 55 0.0 0.1 0.1 0.1 –2.4 –0.5 –0.5 –0.5
Source: See Technical Notes at the end.
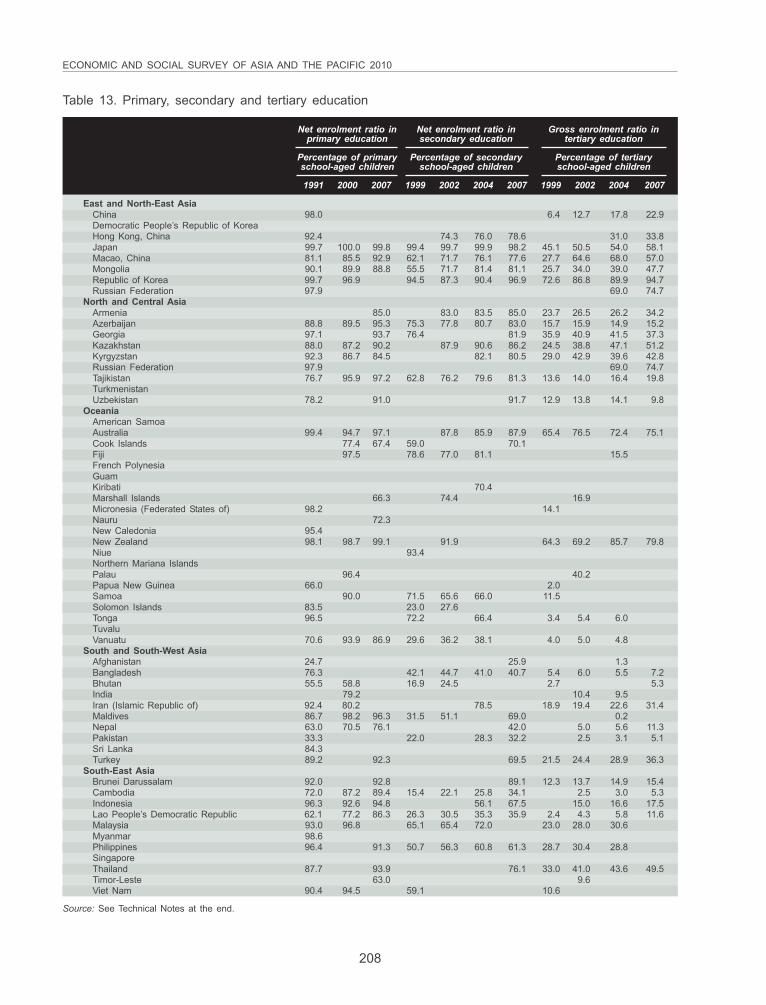
208
ECONOMIC AND SOCIAL SURVEY OF ASIA AND THE PACIFIC 2010
Table 13. Primary, secondary and tertiary education
Net enrolment ratio in Net enrolment ratio in Gross enrolment ratio inprimary education secondary education tertiary education
Percentage of primary Percentage of secondary Percentage of tertiaryschool-aged children school-aged children school-aged children
1991 2000 2007 1999 2002 2004 2007 1999 2002 2004 2007
East and North-East AsiaChina 98.0 6.4 12.7 17.8 22.9Democratic People’s Republic of KoreaHong Kong, China 92.4 74.3 76.0 78.6 31.0 33.8Japan 99.7 100.0 99.8 99.4 99.7 99.9 98.2 45.1 50.5 54.0 58.1Macao, China 81.1 85.5 92.9 62.1 71.7 76.1 77.6 27.7 64.6 68.0 57.0Mongolia 90.1 89.9 88.8 55.5 71.7 81.4 81.1 25.7 34.0 39.0 47.7Republic of Korea 99.7 96.9 94.5 87.3 90.4 96.9 72.6 86.8 89.9 94.7Russian Federation 97.9 69.0 74.7
North and Central AsiaArmenia 85.0 83.0 83.5 85.0 23.7 26.5 26.2 34.2Azerbaijan 88.8 89.5 95.3 75.3 77.8 80.7 83.0 15.7 15.9 14.9 15.2Georgia 97.1 93.7 76.4 81.9 35.9 40.9 41.5 37.3Kazakhstan 88.0 87.2 90.2 87.9 90.6 86.2 24.5 38.8 47.1 51.2Kyrgyzstan 92.3 86.7 84.5 82.1 80.5 29.0 42.9 39.6 42.8Russian Federation 97.9 69.0 74.7Tajikistan 76.7 95.9 97.2 62.8 76.2 79.6 81.3 13.6 14.0 16.4 19.8TurkmenistanUzbekistan 78.2 91.0 91.7 12.9 13.8 14.1 9.8
OceaniaAmerican SamoaAustralia 99.4 94.7 97.1 87.8 85.9 87.9 65.4 76.5 72.4 75.1Cook Islands 77.4 67.4 59.0 70.1Fiji 97.5 78.6 77.0 81.1 15.5French PolynesiaGuamKiribati 70.4Marshall Islands 66.3 74.4 16.9Micronesia (Federated States of) 98.2 14.1Nauru 72.3New Caledonia 95.4New Zealand 98.1 98.7 99.1 91.9 64.3 69.2 85.7 79.8Niue 93.4Northern Mariana IslandsPalau 96.4 40.2Papua New Guinea 66.0 2.0Samoa 90.0 71.5 65.6 66.0 11.5Solomon Islands 83.5 23.0 27.6Tonga 96.5 72.2 66.4 3.4 5.4 6.0TuvaluVanuatu 70.6 93.9 86.9 29.6 36.2 38.1 4.0 5.0 4.8
South and South-West AsiaAfghanistan 24.7 25.9 1.3Bangladesh 76.3 42.1 44.7 41.0 40.7 5.4 6.0 5.5 7.2Bhutan 55.5 58.8 16.9 24.5 2.7 5.3India 79.2 10.4 9.5Iran (Islamic Republic of) 92.4 80.2 78.5 18.9 19.4 22.6 31.4Maldives 86.7 98.2 96.3 31.5 51.1 69.0 0.2Nepal 63.0 70.5 76.1 42.0 5.0 5.6 11.3Pakistan 33.3 22.0 28.3 32.2 2.5 3.1 5.1Sri Lanka 84.3Turkey 89.2 92.3 69.5 21.5 24.4 28.9 36.3
South-East AsiaBrunei Darussalam 92.0 92.8 89.1 12.3 13.7 14.9 15.4Cambodia 72.0 87.2 89.4 15.4 22.1 25.8 34.1 2.5 3.0 5.3Indonesia 96.3 92.6 94.8 56.1 67.5 15.0 16.6 17.5Lao People’s Democratic Republic 62.1 77.2 86.3 26.3 30.5 35.3 35.9 2.4 4.3 5.8 11.6Malaysia 93.0 96.8 65.1 65.4 72.0 23.0 28.0 30.6Myanmar 98.6Philippines 96.4 91.3 50.7 56.3 60.8 61.3 28.7 30.4 28.8SingaporeThailand 87.7 93.9 76.1 33.0 41.0 43.6 49.5Timor-Leste 63.0 9.6Viet Nam 90.4 94.5 59.1 10.6
Source: See Technical Notes at the end.
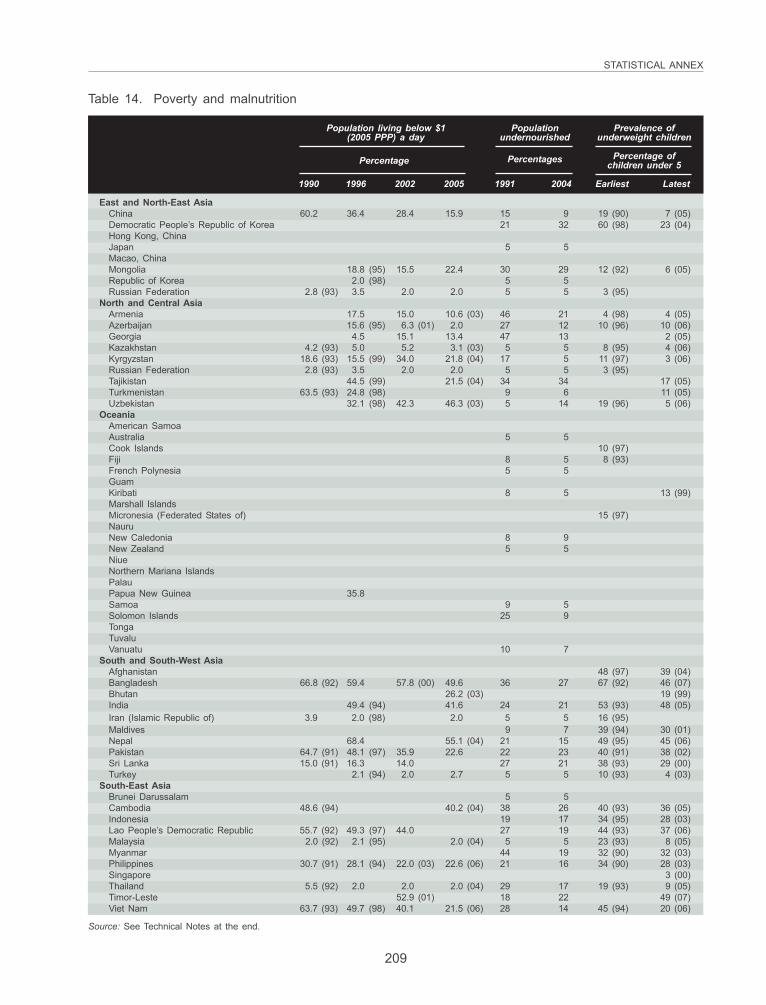
209
STATISTICAL ANNEX
Table 14. Poverty and malnutrition
Population living below $1 Population Prevalence of(2005 PPP) a day undernourished underweight children
Percentage Percentages Percentage ofchildren under 5
1990 1996 2002 2005 1991 2004 Earliest Latest
East and North-East AsiaChina 60.2 36.4 28.4 15.9 15 9 19 (90) 7 (05)Democratic People’s Republic of Korea 21 32 60 (98) 23 (04)Hong Kong, ChinaJapan 5 5Macao, ChinaMongolia 18.8 (95) 15.5 22.4 30 29 12 (92) 6 (05)Republic of Korea 2.0 (98) 5 5Russian Federation 2.8 (93) 3.5 2.0 2.0 5 5 3 (95)
North and Central AsiaArmenia 17.5 15.0 10.6 (03) 46 21 4 (98) 4 (05)Azerbaijan 15.6 (95) 6.3 (01) 2.0 27 12 10 (96) 10 (06)Georgia 4.5 15.1 13.4 47 13 2 (05)Kazakhstan 4.2 (93) 5.0 5.2 3.1 (03) 5 5 8 (95) 4 (06)Kyrgyzstan 18.6 (93) 15.5 (99) 34.0 21.8 (04) 17 5 11 (97) 3 (06)Russian Federation 2.8 (93) 3.5 2.0 2.0 5 5 3 (95)Tajikistan 44.5 (99) 21.5 (04) 34 34 17 (05)Turkmenistan 63.5 (93) 24.8 (98) 9 6 11 (05)Uzbekistan 32.1 (98) 42.3 46.3 (03) 5 14 19 (96) 5 (06)
OceaniaAmerican SamoaAustralia 5 5Cook Islands 10 (97)Fiji 8 5 8 (93)French Polynesia 5 5GuamKiribati 8 5 13 (99)Marshall IslandsMicronesia (Federated States of) 15 (97)NauruNew Caledonia 8 9New Zealand 5 5NiueNorthern Mariana IslandsPalauPapua New Guinea 35.8Samoa 9 5Solomon Islands 25 9TongaTuvaluVanuatu 10 7
South and South-West AsiaAfghanistan 48 (97) 39 (04)Bangladesh 66.8 (92) 59.4 57.8 (00) 49.6 36 27 67 (92) 46 (07)Bhutan 26.2 (03) 19 (99)India 49.4 (94) 41.6 24 21 53 (93) 48 (05)Iran (Islamic Republic of) 3.9 2.0 (98) 2.0 5 5 16 (95)Maldives 9 7 39 (94) 30 (01)Nepal 68.4 55.1 (04) 21 15 49 (95) 45 (06)Pakistan 64.7 (91) 48.1 (97) 35.9 22.6 22 23 40 (91) 38 (02)Sri Lanka 15.0 (91) 16.3 14.0 27 21 38 (93) 29 (00)Turkey 2.1 (94) 2.0 2.7 5 5 10 (93) 4 (03)
South-East AsiaBrunei Darussalam 5 5Cambodia 48.6 (94) 40.2 (04) 38 26 40 (93) 36 (05)Indonesia 19 17 34 (95) 28 (03)Lao People’s Democratic Republic 55.7 (92) 49.3 (97) 44.0 27 19 44 (93) 37 (06)Malaysia 2.0 (92) 2.1 (95) 2.0 (04) 5 5 23 (93) 8 (05)Myanmar 44 19 32 (90) 32 (03)Philippines 30.7 (91) 28.1 (94) 22.0 (03) 22.6 (06) 21 16 34 (90) 28 (03)Singapore 3 (00)Thailand 5.5 (92) 2.0 2.0 2.0 (04) 29 17 19 (93) 9 (05)Timor-Leste 52.9 (01) 18 22 49 (07)Viet Nam 63.7 (93) 49.7 (98) 40.1 21.5 (06) 28 14 45 (94) 20 (06)
Source: See Technical Notes at the end.
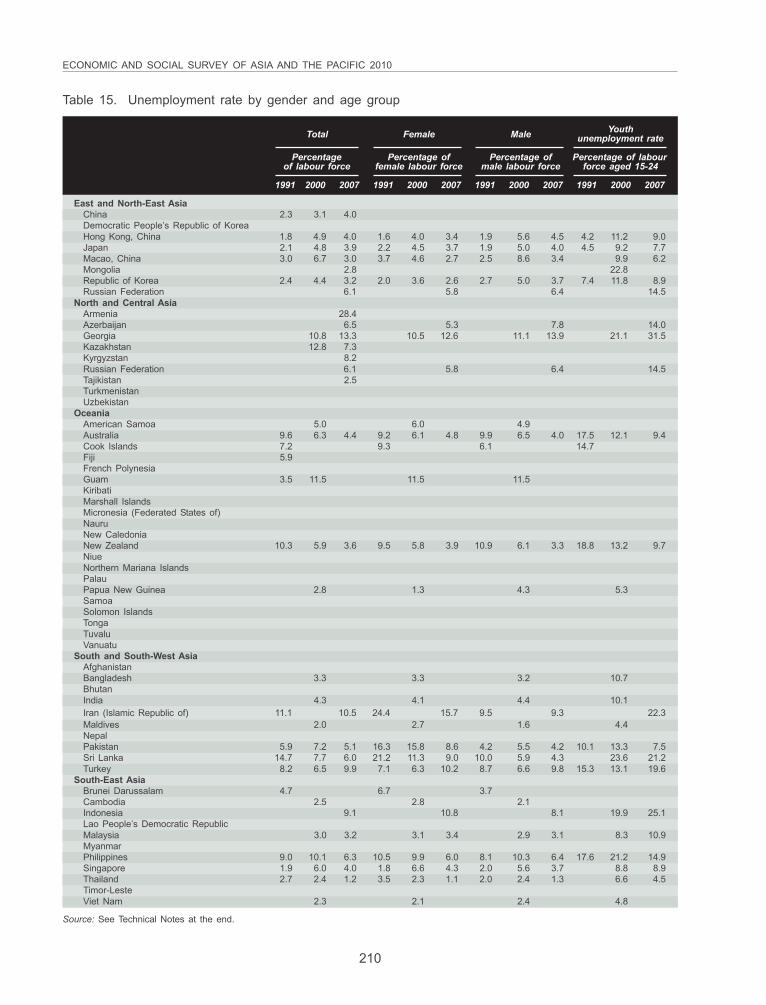
210
ECONOMIC AND SOCIAL SURVEY OF ASIA AND THE PACIFIC 2010
Table 15. Unemployment rate by gender and age group
Total Female Male Youthunemployment rate
Percentage Percentage of Percentage of Percentage of labourof labour force female labour force male labour force force aged 15-24
1991 2000 2007 1991 2000 2007 1991 2000 2007 1991 2000 2007
East and North-East AsiaChina 2.3 3.1 4.0Democratic People’s Republic of KoreaHong Kong, China 1.8 4.9 4.0 1.6 4.0 3.4 1.9 5.6 4.5 4.2 11.2 9.0Japan 2.1 4.8 3.9 2.2 4.5 3.7 1.9 5.0 4.0 4.5 9.2 7.7Macao, China 3.0 6.7 3.0 3.7 4.6 2.7 2.5 8.6 3.4 9.9 6.2Mongolia 2.8 22.8Republic of Korea 2.4 4.4 3.2 2.0 3.6 2.6 2.7 5.0 3.7 7.4 11.8 8.9Russian Federation 6.1 5.8 6.4 14.5
North and Central AsiaArmenia 28.4Azerbaijan 6.5 5.3 7.8 14.0Georgia 10.8 13.3 10.5 12.6 11.1 13.9 21.1 31.5Kazakhstan 12.8 7.3Kyrgyzstan 8.2Russian Federation 6.1 5.8 6.4 14.5Tajikistan 2.5TurkmenistanUzbekistan
OceaniaAmerican Samoa 5.0 6.0 4.9Australia 9.6 6.3 4.4 9.2 6.1 4.8 9.9 6.5 4.0 17.5 12.1 9.4Cook Islands 7.2 9.3 6.1 14.7Fiji 5.9French PolynesiaGuam 3.5 11.5 11.5 11.5KiribatiMarshall IslandsMicronesia (Federated States of)NauruNew CaledoniaNew Zealand 10.3 5.9 3.6 9.5 5.8 3.9 10.9 6.1 3.3 18.8 13.2 9.7NiueNorthern Mariana IslandsPalauPapua New Guinea 2.8 1.3 4.3 5.3SamoaSolomon IslandsTongaTuvaluVanuatu
South and South-West AsiaAfghanistanBangladesh 3.3 3.3 3.2 10.7BhutanIndia 4.3 4.1 4.4 10.1Iran (Islamic Republic of) 11.1 10.5 24.4 15.7 9.5 9.3 22.3Maldives 2.0 2.7 1.6 4.4NepalPakistan 5.9 7.2 5.1 16.3 15.8 8.6 4.2 5.5 4.2 10.1 13.3 7.5Sri Lanka 14.7 7.7 6.0 21.2 11.3 9.0 10.0 5.9 4.3 23.6 21.2Turkey 8.2 6.5 9.9 7.1 6.3 10.2 8.7 6.6 9.8 15.3 13.1 19.6
South-East AsiaBrunei Darussalam 4.7 6.7 3.7Cambodia 2.5 2.8 2.1Indonesia 9.1 10.8 8.1 19.9 25.1Lao People’s Democratic RepublicMalaysia 3.0 3.2 3.1 3.4 2.9 3.1 8.3 10.9MyanmarPhilippines 9.0 10.1 6.3 10.5 9.9 6.0 8.1 10.3 6.4 17.6 21.2 14.9Singapore 1.9 6.0 4.0 1.8 6.6 4.3 2.0 5.6 3.7 8.8 8.9Thailand 2.7 2.4 1.2 3.5 2.3 1.1 2.0 2.4 1.3 6.6 4.5Timor-LesteViet Nam 2.3 2.1 2.4 4.8
Source: See Technical Notes at the end.
211
STATISTICAL ANNEX
Table 1. Real gross domestic productgrowth rates
GDP growth rate at constant prices. The real annualpercentage changes in GDP (at constant market prices) innational currencies are reported in this table. GDP isdefined as the total cost of all finished goods and servicesproduced within the country in a given year. Most countriesuse constant market price values. The growth rates ofsome countries are at factor cost, including Fiji, India, theIslamic Republic of Iran and Pakistan, while Nepal is atproducers’ prices. In the case of Timor-Leste, the datarefer to real non-oil GDP. The table contains historicaldata from 1998 to 2008. Historical data are mainlybased on IMF, International Financial Statistics databasesand ADB, Key Indicators for Asia and the Pacific 2009with updates from national and local sources. The datafor 2009 are generally ESCAP estimates and calcula-tions, although some projections are in line with theeconomic programmes/projections of the Governmentsconcerned.
Tables 2 and 3. Gross domestic savings andinvestment rates
Gross domestic savings and investment as a percent-age of GDP. Gross domestic savings (GDS) are calculatedas the difference between GDP and total consumptionexpenditure in the national accounts statistics. Gross do-mestic investment (GDI) is the sum of gross fixed capitalformation and changes in inventories. Gross fixed capitalformation is measured by the total value of a producer’sacquisitions minus disposals of fixed assets in a givenaccounting period. Additions to the value of non-producedassets, such as land, form part of gross fixed capitalformation. Inventories are stocks of goods held by institu-tional units to meet temporary or unexpected fluctuations inproduction and sales. The amounts computed in the tablerefer to GDS and GDI as a percentage of GDP at currentprices. Historical data are mostly derived from ADB, KeyIndicators for Asia and the Pacific 2009 while data onsome countries/areas (Georgia, Maldives, Russian Federa-tion, Solomon Islands, Tajikistan, Turkey, Turkmenistan,Uzbekistan and Macao, China) are based on World Bank,World Development Indicators. The 2009 data are obtainedfrom input supplied by national authorities and ESCAPcalculations and estimates.
Table 4. Inflation rates
Inflation rates. Rates of inflation in this table refer tochanges in the consumer price index (CPI) and reflectchanges in the cost of acquiring a fixed basket of goodsand services by an average consumer. Historical data are
Technical notes
based on IMF, International Financial Statistics databasesand World Economic Outlook databases, October 2009while data on Brunei Darussalam, Cook Islands, Micronesia(Federated States of), Nauru, Palau and Tuvalu are basedon ADB, Key Indicators for Asia and the Pacific 2009. Thefigures for 2009 are generally estimates and based onESCAP calculations. The projections/estimates are alsoprovided by country authorities. For India, data refer tothe industrial workers index. Consumer price inflation arefor a given city or group of consumers in respect ofthe following countries: Cambodia is for Phnom Penh;Sri Lanka is for Colombo; and Nepal is for national urbanconsumers.
Table 5. Budget balance
Government surplus or deficit, as percentage of GDP.The Government fiscal balance (surplus/deficit) is the differ-ence between central government total revenues (includinggrants) and total expenditures as a percentage of GDP.This provides a picture of the changes in the Government’sfinancial position each year. When the difference is posi-tive, the fiscal position is in surplus; otherwise, it is indeficit. Government revenue is the sum of current andcapital revenues. Current revenue is the revenue accruingfrom taxes, as well as all current non-tax revenues, exceptfor transfers received from other (foreign or domestic)governments and international institutions. Major items ofnon-tax revenue include receipts from government enter-prises, rents and royalties, fees and fines, forfeits, privatedonations and repayments of loans properly defined ascomponents of net lending. Capital revenue is the pro-ceeds from the sale of non-financial capital assets. As forgovernment expenditure, it is the sum of current andcapital expenditure. Current expenditure comprises pur-chases of goods and services by the central Government,transfers to non-central government units and to house-holds, subsidies to producers and the interest on publicdebt. Capital expenditures, on the other hand, cover out-lays for the acquisition or construction of capital assetsand for the purchase of land and intangible assets, as wellas capital transfers to domestic and foreign recipients.Loans and advances for capital purposes are also in-cluded. Grants are excluded in Bangladesh, Cambodia,China, Hong Kong (China), Indonesia, Iran (Islamic Repub-lic of), Kiribati, Malaysia, Pakistan, the Republic of Korea,Singapore, Sri Lanka, Thailand, Turkmenistan, and devel-oped ESCAP countries. In the case of Timor-Leste, theamounts are computed as a share of non-oil GDP. Thebudget surplus/deficit of Singapore was computed fromgovernment operating revenue minus government operatingexpenditure and minus government development expendi-ture; while the budget balance of Thailand refers to agovernment cash balance comprising the budgetary bal-ance and non-budgetary balance.
212
ECONOMIC AND SOCIAL SURVEY OF ASIA AND THE PACIFIC 2010
Table 6. Current account balance
Current account balance, as a share of GDP. The currentaccount balance refers to the sum of the balance on goods,services and income. It also includes current transferscrossing national borders. A positive balance shows that theforeign currencies flow into the domestic economy; likewise,a negative balance shows the opposite. The figures arereported as a percentage of GDP at current prices (nationalcurrency) to allow for cross-country comparisons. Historicaldata are mainly based on IMF, International Financial Statis-tics databases and World Economic Outlook database,October 2009, with updates and estimates from national,local and country sources. The 2009 data are derived fromprojections supplied by national authorities and ESCAPestimates. In the case of Timor-Leste, current accountbalance includes international assistance and the amount iscomputed as a percentage of non-oil GDP.
Table 7. Change in money supply
Growth of money supply. The annual growth rates ofboard money supply (at the end of a given period) asrepresented by M2. M2 is defined as the sum of currencyin circulation plus demand deposits (M1) and quasi-money,which consists of time and savings deposits, includingforeign currency deposits. Historical data for M2 are mainlyobtained from IMF, International Financial Statisticsdatabases with updates and estimates from national andlocal sources. In the case of Cook Islands, Turkmenistanand Uzbekistan, the data are based on ADB, Key Indica-tors for Asia and the Pacific 2009. The data for 2009 arecomputed by ESCAP on the basis of IMF data andestimates based on national sources.
Tables 8 and 9. Growth rates of merchandiseexports and imports
Growth rates of exports and imports. The annual growthrates of exports and imports, in terms of merchandisegoods only, are shown in these tables. Data are in millionsof United States dollars primarily obtained from the bal-ance-of-payments accounts of each country. Exports ingeneral are reported on a free-on-board (f.o.b.) basis. Inthis case, exports are valued at the customs frontier of theexporting country plus export duties and the costs ofloading the goods onto the carriers unless the latter isborne by the carrier. It excludes the cost of freight andinsurance beyond the customs frontier. As for imports, dataare reported either on an f.o.b. or c.i.f. (cost, insurance,freight) basis. On a c.i.f. basis, the value of importsincludes the cost of international freight and insurance upto the customs frontier of the importing country. It excludesthe cost of unloading the goods from the carrier unless itis borne by the carrier.
Historical data on exports and imports are mainly obtainedfrom country sources, statistical publications, and second-ary publications. The figures for 2009 are generally esti-mates based on country sources and calculations byESCAP, and are also provided by national consultants.
Table 10. Inward foreign direct investment
Foreign direct investment (FDI) inward stock. Repre-sents the value of the share of capital and reserves(including retained profits) attributable to the parent enter-prise, plus the net indebtedness of affiliates to the parententerprise. Inward stock is the value of the capital andreserves in the economy attributable to a parent enterpriseresident in a different economy. Expressed in millions ofUnited States dollars and as a percentage of GDP.Source: Calculated by ESCAP using data from UnitedNations Conference on Trade and Development, ForeignDirect Investment and National Accounts Main Aggregatesdatabase (online database accessed on 21 September2009 and 22 October 2009).
Foreign direct investment (FDI) inflows. Comprise capi-tal provided (either directly or through other related enter-prises) by a foreign direct investor to an FDI enterprise, orcapital received by a foreign direct investor from an FDIenterprise. FDI inflows comprise capital provided (eitherdirectly or through other related enterprises) by a foreigndirect investor to an FDI enterprise in the reportingeconomy. Expressed in millions of United States dollars andas a percentage of GDP. Source: Calculated by ESCAPusing data from United Nations Conference on Trade andDevelopment, Foreign Direct Investment and NationalAccounts Main Aggregates database (online databaseaccessed on 21 September 2009 and 22 October 2009).
Table 11. Official development assistanceand workers’ remittances
Official development assistance received. The amountof official development assistance (ODA) received in grantsand loans during the reporting period, expressed in millionsof United States dollars and as a percentage of the grossnational income (GNI). Source: Calculated by ESCAP us-ing data from Organization for Economic Co-operation andDevelopment, Development Database on Aid from DACMembers and National Accounts Main Aggregates database(online database accessed on 2 October 2009 and 5November 2009).
Workers’ remittances received. Current transfers fromabroad by migrants who are employed or intend to remainemployed for more than a year in another economy inwhich they are considered residents, expressed in millionsof United States dollars and as a percentage of grossnational income (GNI). Source: Calculated by ESCAP us-ing data from International Monetary Fund, Balance ofPayment Statistics (CD-ROM, August 2009) and NationalAccounts Main Aggregates Database (online databaseaccessed on 5 November 2009).
Table 12. International migration
Stock of foreign population. Estimated number of interna-tional immigrants, male and female, in the middle of theindicated year, expressed in thousands. Generally, thisrepresents the number of persons born in a country otherthan where they live. Source: World Migrant Stock: The2008 Revision population database (online databaseaccessed on 25 August 2009).
213
STATISTICAL ANNEX
Stock of foreign population as share of total popula-tion. The number of international immigrants divided bythe total population. Expressed as a percentage in themiddle of the indicated year. Where data on the place ofbirth was unavailable, the number of non-citizens was usedas a proxy for the number of international immigrants. Ineither case, the migrant stock includes refugees, some ofwhom may not be foreign-born. Source: World MigrantStock: The 2008 Revision population database (online data-base accessed on 25 August 2009).
Net migration rate. The number of international immi-grants minus the number of emigrants over a period,divided by the average population of the receiving countryover that period. Expressed as the net number of migrantsper 1,000 population. Source: World Population Prospects:The 2008 Revision population database (online databaseaccessed on 28 April 2009).
Table 13. Primary, secondary and tertiaryeducation
Net enrolment ratio in primary education. The number ofpupils of the theoretical school-age group for primary edu-cation, expressed as a percentage of the total populationin that age group. Source: UNESCO Institute for Statistics,Data Centre (online database accessed on 17 November2009).
Net enrolment ratio in secondary education. Thenumber of pupils of the theoretical school-age group forsecondary education, expressed as a percentage of thetotal population in that age group. Source: UNESCO Insti-tute for Statistics, Data Centre (online database accessedon 28 August 2009).
Gross enrolment ratio in tertiary education. The numberof pupils enrolled in the tertiary level of education, regard-less of age, expressed as a percentage of the populationin the theoretical age group for the same level ofeducation. For the tertiary level, the population used isthe five-year age group following on from the secondaryschool leaving age. Source: UNESCO Institute for Statis-tics, Data Centre (online database accessed on 10 August2009).
Table 14. Poverty and malnutrition
Population living below $1.25 (2005 PPP) a day. Thepoverty rate at $1.25 a day is the proportion of the
population living on less than $1.25 a day, measured at2005 international prices, adjusted for purchasing powerparity (PPP). The purchasing power parity conversion factoris the number of units of a country’s currency required tobuy the same amounts of goods and services in thedomestic market as the United States dollar would buy inthe United States. Source: United Nations Millennium De-velopment Goals Indicators (online database accessed on3 September 2009).
Population undernourished. The prevalence of (severely)underweight children, expressed as the percentage of chil-dren aged 0-59 months whose weight for age is less thanminus 3 standard deviations from the median for theinternational reference population ages 0-59 months.Source: United Nations Millennium Development GoalsIndicators (online database accessed on 3 September2009).
Prevalence of underweight children. The percentage ofchildren aged 0-59 months who fall below minus 2 stand-ard deviations from the median weight for age of theinternational reference population. The international refer-ence population, often referred to as the NCHS/WHOreference population, was formulated by the NationalCenter for Health Statistics (NCHS) as a reference for theUnited States and later adopted by the World HealthOrganization (WHO). Source: United Nations MillenniumDevelopment Goals Indicators (online database accessedon 4 August 2009).
Table 15. Unemployment rate by genderand age group
Unemployment rate: total, female, male. The number ofpersons of working age who, during the reference period,were without work, currently available for work and seekingwork, divided by the total labour force. National definitionsand coverage of unemployment may vary. Data aredisaggregated by sex. Source: Calculated by ESCAP usingdata from International Labour Organization, Key Indicatorsof the Labour Market, Sixth Edition (online databaseaccessed on 14 September 2009).
Youth unemployment rate: total. The number of youngpersons aged 15-24 who are without work, currently avail-able for work and seeking work, divided by the total labourforce of that age group. Source: United Nations MillenniumDevelopment Goals Indicators (online database accessedon 27 July 2009).

214
ECONOMIC AND SOCIAL SURVEY OF ASIA AND THE PACIFIC 2010
Since the 1957 issue, the Economic and Social Survey of Asia and the Pacific has, in addition to a review of the currentsituation of the region, contained a study or studies of some major aspect or problem of the economies of the Asian andPacific region, as specified below:
1957: Postwar problems of economic development1958: Review of postwar industrialization1959: Foreign trade of ECAFE primary exporting countries1960: Public finance in the postwar period1961: Economic growth of ECAFE countries1962: Asia’s trade with western Europe1963: Imports substitution and export diversification1964: Economic development and the role of the agricultural sector1965: Economic development and human resources1966: Aspects of the finance of development1967: Policies and planning for export1968: Economic problems of export-dependent countries. Implications of economic controls and liberalization1969: Strategies for agricultural development. Intraregional trade as a growth strategy1970: The role of foreign private investment in economic development and cooperation in the ECAFE region. Problems
and prospects of the ECAFE region in the Second Development Decade1971: Economic growth and social justice. Economic growth and employment. Economic growth and income distribution1972: First biennial review of social and economic developments in ECAFE developing countries during the Second United
Nations Development Decade1973: Education and employment1974: Mid-term review and appraisal of the International Development Strategy for the Second United Nations Development
Decade in the ESCAP region, 19741975: Rural development, the small farmer and institutional reform1976: Biennial review and appraisal of the International Development Strategy at the regional level for the Second United
Nations Development Decade in the ESCAP region, 19761977: The international economic crises and developing Asia and the Pacific1978: Biennial review and appraisal at the regional level of the International Development Strategy for the Second United
Nations Development Decade1979: Regional development strategy for the 1980s1980: Short-term economic policy aspects of the energy situation in the ESCAP region1981: Recent economic developments in major subregions of the ESCAP region1982: Fiscal policy for development in the ESCAP region1983: Implementing the International Development Strategy: major issues facing the developing ESCAP region1984: Financing development1985: Trade, trade policies and development1986: Human resources development in Asia and the Pacific: problems, policies and perspectives1987: International trade in primary commodities1988: Recent economic and social developments1989: Patterns of economic growth and structural transformation in the least developed and Pacific island countries of the
ESCAP region: implications for development policy and planning for the 1990s1990: Infrastructure development in the developing ESCAP region: needs, issues and policy options1991: Challenges of macroeconomic management in the developing ESCAP region1992: Expansion of investment and intraregional trade as a vehicle for enhancing regional economic cooperation and
development in Asia and the Pacific1993: Fiscal reform. Economic transformation and social development. Population dynamics: implications for development1995: Reform and liberalization of the financial sector. Social security1996: Enhancing the role of the private sector in development. The role of public expenditure in the provision of social services1997: External financial and investment flows. Transport and communications1998: Managing the external sector. Growth and equity1999: Social impact of the economic crisis. Information technology, globalization, economic security and development2000: Social security and safety nets. Economic and financial monitoring and surveillance2001: Socio-economic implications of demographic dynamics. Financing for development2002: The feasibility of achieving the Millennium Development Goals in Asia and the Pacific. Regional development
cooperation in Asia and the Pacific2003: The role of public expenditure in the provision of education and health. Environment-poverty nexus revisited:
linkages and policy options2004: Poverty reduction strategies: tackling the multidimensional nature of poverty2005: Dynamics of population ageing: how can Asia and the Pacific respond?2006: Emerging unemployment issues in Asia and the Pacific: rising to the challenges2007: Gender inequality continues – at great cost2008: Unequal benefits of growth – agriculture left behind2009: Triple threats to development: food, fuel and climate change policy challenges
This publication may be obtained from bookstores and distributors throughout the world. Pleaseconsult your bookstore or write to any of the following:
Sales Section Tel: (1) (212) 963-8302Room DC2-0853 Fax: (1) (212) 963-4116United Nations Secretariat E-mail: [email protected] York, NY 10017USA
Sales Section Tel: (41) (22) 917-1234United Nations Office at Geneva Fax: (41) (22) 917-0123Palais des Nations E-mail: [email protected] Geneva 10Switzerland
Chief Tel: (662) 288-1234Conference Management Unit Fax: (662) 288-1000Conference Services Section E-mail: [email protected] Services DivisionEconomic and Social Commission for
Asia and the Pacific (ESCAP)United Nations BuildingRajadamnern Nok AvenueBangkok 10200, Thailand
For further information on publications in this series, please address your enquiries to:
DirectorMacroeconomic Policy and Development DivisionEconomic and Social Commission for
Asia and the Pacific (ESCAP)United Nations BuildingRajadamnern Nok AvenueBangkok 10200, Thailand
Tel: (662) 288-1430Fax: (662) 288-1000, 288-3007E-mail: [email protected]

__
__
__
__
__
__
__
__
__
__
__
__
__
__
__
__
__
__
__
__
__
__
__
__
__
__
__
__
__
__
__
__
_
READERSHIP SURVEY
The Macroeconomic Policy and Development Division of ESCAP is undertaking an evaluation of thispublication, Economic and Social Survey of Asia and the Pacific 2010, with a view to makingfuture issues more useful for our readers. We would appreciate it if you could complete thisquestionnaire and return it, at your earliest convenience, to:
DirectorMacroeconomic Policy and Development DivisionESCAP, United Nations BuildingRajadamnern Nok AvenueBangkok 10200, THAILAND
QUESTIONNAIRE
Excellent Very Average Poorgood
1. Please indicate your assessment of the qualityof the publication on:
• Presentation/format 4 3 2 1
• Readability 4 3 2 1
• Timeliness of information 4 3 2 1
• Coverage of subject matter 4 3 2 1
• Analytical rigour 4 3 2 1
• Overall quality 4 3 2 1
2. How useful is the publication for your work?
• Provision of information 4 3 2 1
• Clarification of issues 4 3 2 1
• Its findings 4 3 2 1
• Policy suggestions 4 3 2 1
• Overall usefulness 4 3 2 1
3. Please give examples of how this publication has contributed to your work:
............................................................................................................................................................
............................................................................................................................................................
............................................................................................................................................................
............................................................................................................................................................
4. Suggestions for improving the publication:
............................................................................................................................................................
............................................................................................................................................................
............................................................................................................................................................
............................................................................................................................................................
5. Your background information, please:
Name: ................................................................................................................................................
Title/position: ......................................................................................................................................
Institution: ...........................................................................................................................................
Office address: ..................................................................................................................................
............................................................................................................................................................
Please use additional sheets of paper, if required, to answer the questions.Thank you for your kind cooperation in completing this questionnaire.
__
__
__
__
__
__
__
__
__
__
__
__
__
__
__
__
__
__
__
__
__
__
__
__
__
__
__
__
__
__
__
__
_
United Nations publicationPrinted in Bangkok
April 2010 – 2860
USD $80ISBN 978-92-1-120592-3
“... Let us begin an economic recovery that is not only robust, but also just, inclusive, and sustainable -- lifting the entire world. For if we do not do it now, at a moment of crisis, when will we?”
BAN Ki-moon Secretary-General of the United Nations
After the first global economic contraction in recent history, a rebound began to take shape among Asian and
Pacific countries. The regional rebound remains fragile and uneven with a number of downside risks. Turning it
into a sustained recovery will make 2010 a year of complex policymaking, far exceeding that of emergency crisis
management in 2009, with rising inflationary tendencies and asset bubbles.
The global crisis has exposed underlying structural imbalances built up over decades. Reorienting the macro-
economic structure in fairer, more balanced and inclusive channels of development will help sustain the recovery
once fiscal stimulus policies have done their job. Redressing the multiple imbalances will enable the Asia-Pacific
region to drive its own development and create new sources of economic growth from within. In such a radically
altered panorama, the long-awaited arrival of the region as a central participant in global economic relations is
on the horizon. But fulfilling this potential requires an ambitious regional policy agenda.
The 2010 edition of the oldest and most comprehensive annual review of economic and social development
spanning all economies in this vast and diverse region, the Economic and Social Survey of Asia and the Pacific 2010 assesses the critical issues, policy challenges and risks that the region faces in the months ahead as it leads
the world economy in recovery from a dire recession. It also outlines the elements of a policy agenda for
regaining the region’s dynamism through inclusive and sustainable growth.
Recommended