
Welcome to the Gigabit era
Pierre-Michel ATTALI
Director of the
Digital Territories Business unit, IDATE
Future Networks Forum
18 November 2015
Superfast and ultra fast broadband networks
in France at mid 2015
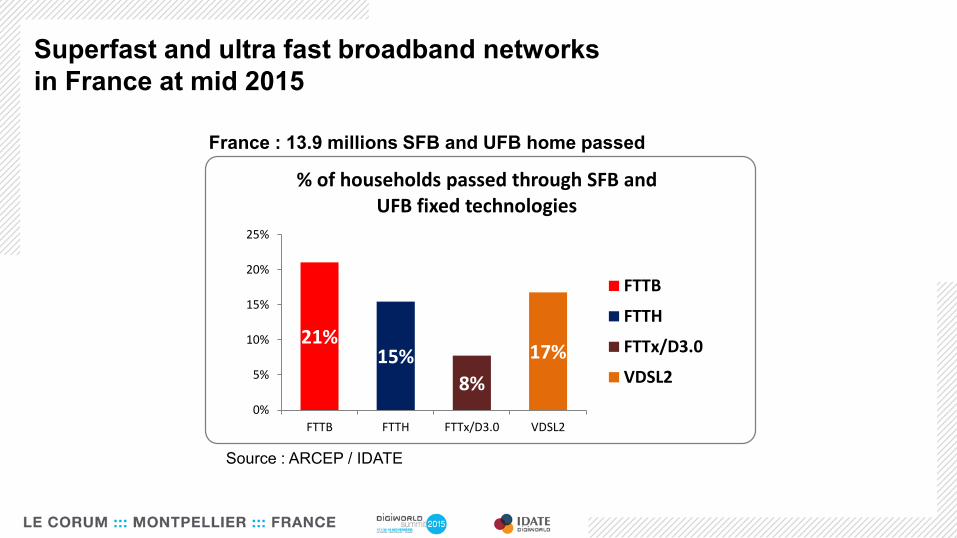
France : 13.9 millions SFB and UFB home passed
Source : ARCEP / IDATE
21%15%
8%
17%
0%
5%
10%
15%
20%
25%
FTTB FTTH FTTx/D3.0 VDSL2
% of households passed through SFB and UFB fixed technologies
FTTB
FTTH
FTTx/D3.0
VDSL2

Superfast and ultra fast broadband networks
in France at mid 2015
France : 3.84 millions SFB and UFB subscribers
30%
26%15%
29%FTTH
FTTB
FTTx/D3.0
VDSL
Breakdown of SFB and UFB subscribers
Source : ARCEP / IDATE
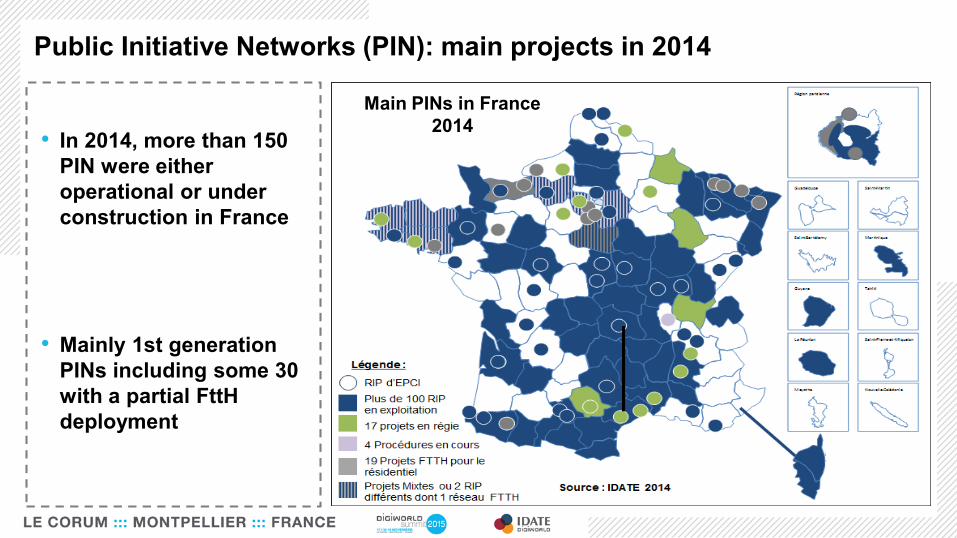
Public Initiative Networks (PIN): main projects in 2014
Main PINs in France
2014• In 2014, more than 150
PIN were either
operational or under
construction in France
• Mainly 1st generation
PINs including some 30
with a partial FttH
deployment

Impact of PIN market players in 2014
Companies involved in PINs in 2014 (jobs and turnover)

• Extremely dynamic sector in terms of
job creation: over 82% of firms expect to
increase their (full time, open ended and
set term contract) employees over the
next three years
• A more than 91% increase in jobs
between 2010 and 2014 (representing
over 5,000 jobs in 2014)
Impact of PINs: Job creation
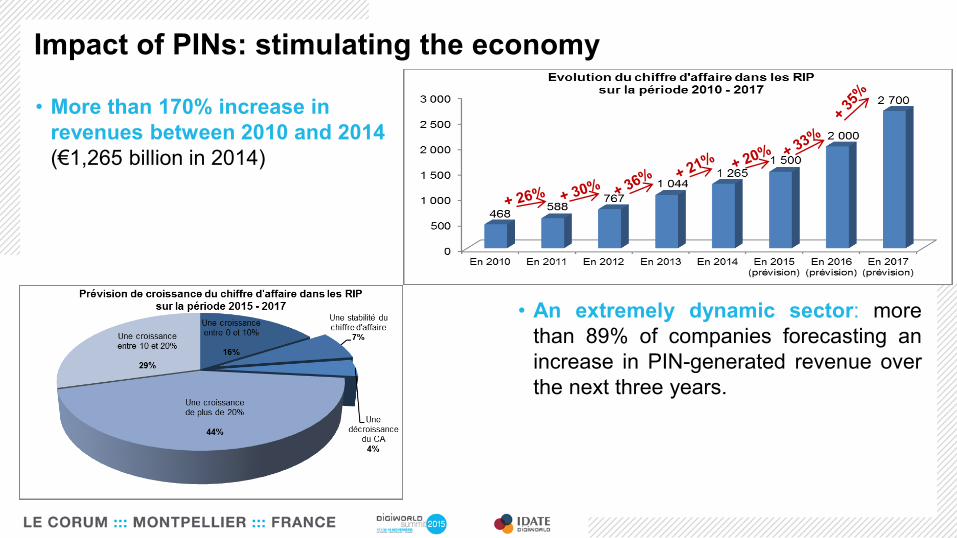
• More than 170% increase in
revenues between 2010 and 2014
(€1,265 billion in 2014)
• An extremely dynamic sector: more
than 89% of companies forecasting an
increase in PIN-generated revenue over
the next three years.
Impact of PINs: stimulating the economy
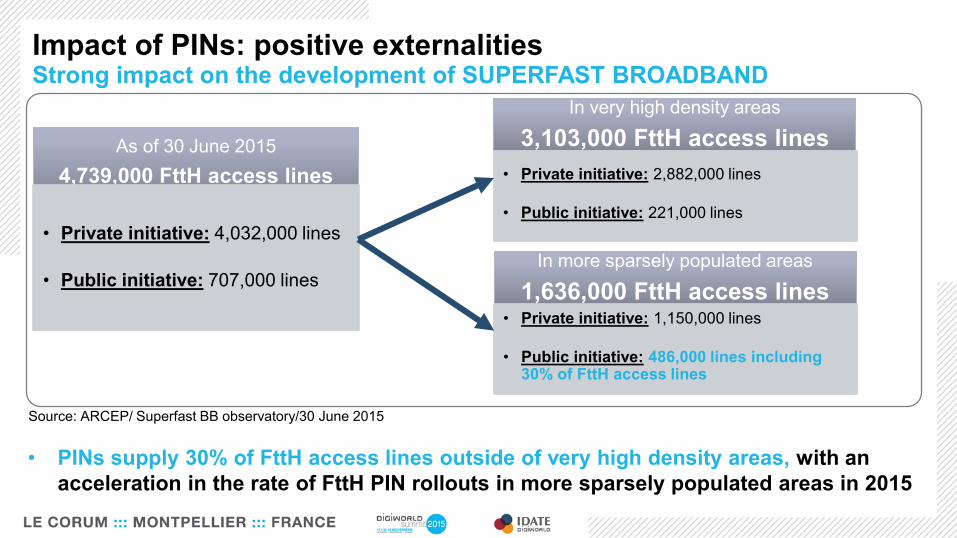
As of 30 June 2015
4,739,000 FttH access lines
• Private initiative: 4,032,000 lines
• Public initiative: 707,000 lines
In very high density areas
3,103,000 FttH access lines
• Private initiative: 2,882,000 lines
• Public initiative: 221,000 lines
In more sparsely populated areas
1,636,000 FttH access lines• Private initiative: 1,150,000 lines
• Public initiative: 486,000 lines including 30% of FttH access lines
• PINs supply 30% of FttH access lines outside of very high density areas, with an
acceleration in the rate of FttH PIN rollouts in more sparsely populated areas in 2015
Source: ARCEP/ Superfast BB observatory/30 June 2015
Impact of PINs: positive externalities Strong impact on the development of SUPERFAST BROADBAND
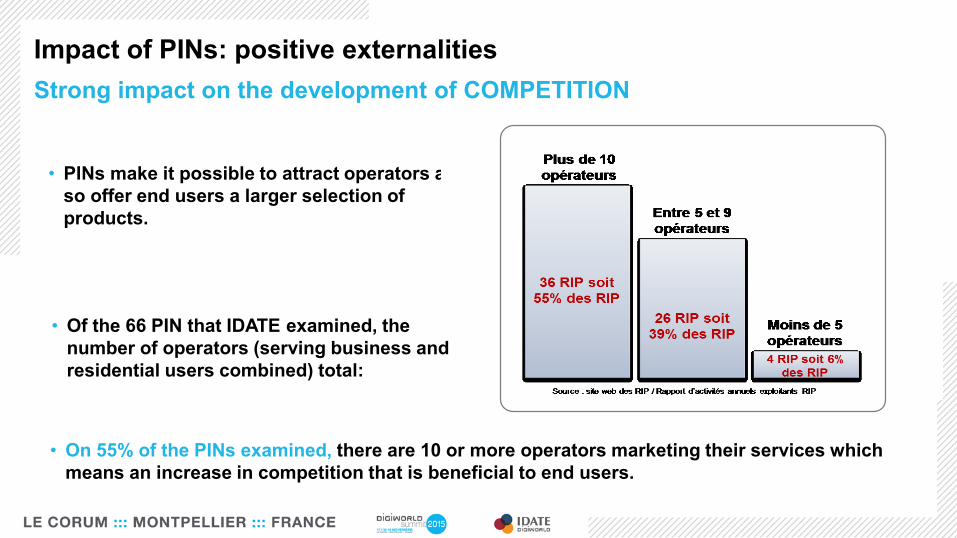
• PINs make it possible to attract operators and
so offer end users a larger selection of
products.
• On 55% of the PINs examined, there are 10 or more operators marketing their services which
means an increase in competition that is beneficial to end users.
Impact of PINs: positive externalities
• Of the 66 PIN that IDATE examined, the
number of operators (serving business and
residential users combined) total:
Strong impact on the development of COMPETITION
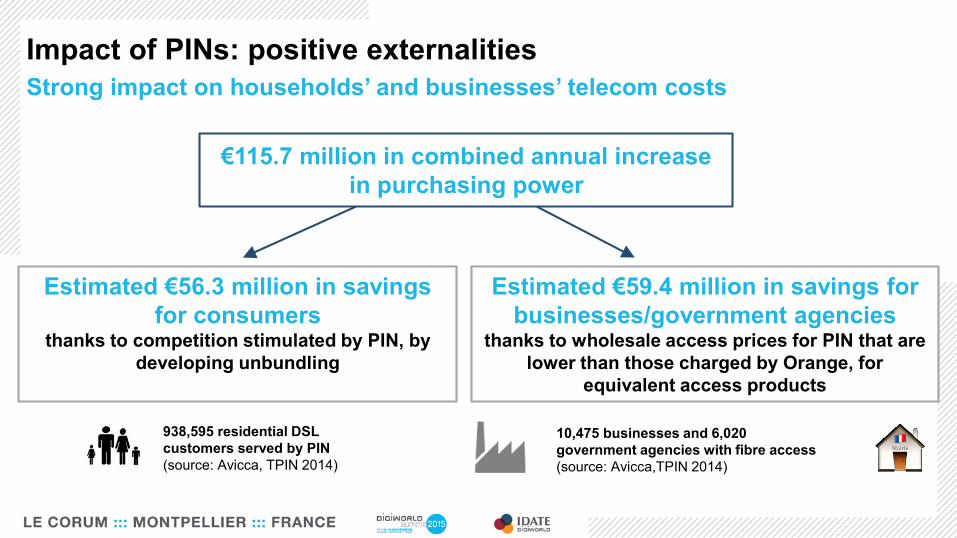
€115.7 million in combined annual increase
in purchasing power
Impact of PINs: positive externalities
938,595 residential DSL
customers served by PIN
(source: Avicca, TPIN 2014)
Estimated €56.3 million in savings
for consumersthanks to competition stimulated by PIN, by
developing unbundling
Estimated €59.4 million in savings for
businesses/government agenciesthanks to wholesale access prices for PIN that are
lower than those charged by Orange, for
equivalent access products
10,475 businesses and 6,020
government agencies with fibre access
(source: Avicca,TPIN 2014)
Strong impact on households’ and businesses’ telecom costs

In municipalities with a population of over 500: an overall correlation between the presence of a PIN
and a lower rate of unemployment and a higher rate of new businesses creation than in equivalent size
towns not covered by a PIN.
Impact of PINs: positive externalities
Average number of new businesses (Source: INSEE
2013)
Average unemployment rate
(Source: INSEE 2011)
In municipalities with
optical fibre supplied by a
PIN
In municipalities without
optical fibre supplied by a
PIN
In municipalities with
optical fibre supplied by
a PIN
In municipalities without
optical fibre supplied by a
PIN
Municipalities with a population of between 500
and 2,000 (11,608 municipalities)6.83 5.90 7.14% 7.30%
Municipalities with a population of between
2,000 and 4,999 (3,060 municipalities)22.09 21.26 7.80% 8.56%
Municipalities with a population of between
5,000 and 9,999 (1,073 municipalities)52.77 50.77 9.18% 9.89%
Municipalities with a population of between
10,000 and 49,999 (783 municipalities)175.05 15.80 10.85% 11.81%
Municipalities with a population of between
50,000 and 200,000 (103 municipalities)826.78 689.59 12.06% 13.61%
Stimulating jobs and new BUSINESSES
Recommended


![[FR] PR Hangout of the DigiWorld Summit 2015 - #DWS15](https://img.pdfslide.us/doc/110x75/58e669e91a28ab8d758b62db/fr-pr-hangout-of-the-digiworld-summit-2015-dws15.jpg)