Embed Size (px)
Citation preview
TV & Video Forum
Can the Internet handle everything?
Florence LE BORGNE
Head of TV & Digital Content Practice, IDATE
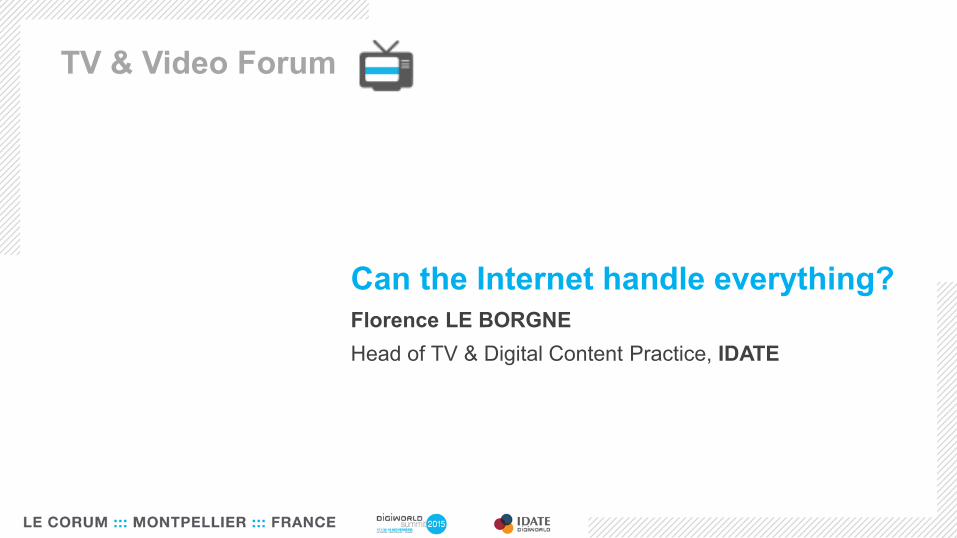
Source: Ericsson ConsumerLab TV & Media 2010-2015 StudyBASE: Population aged 16-59 with broadband at home who watch any type of TV/Video at least weekly in
Brazil*, China, Germany, South Korea*, Spain, Sweden, Taiwan, UK and US. * excluded. in 2010 figures,
** 3 years moving average ¼, ½, ¼
Share of self-reported total weekly TV/video viewing time, per year,
done on respective device **
A rapid swift towards mobile devices
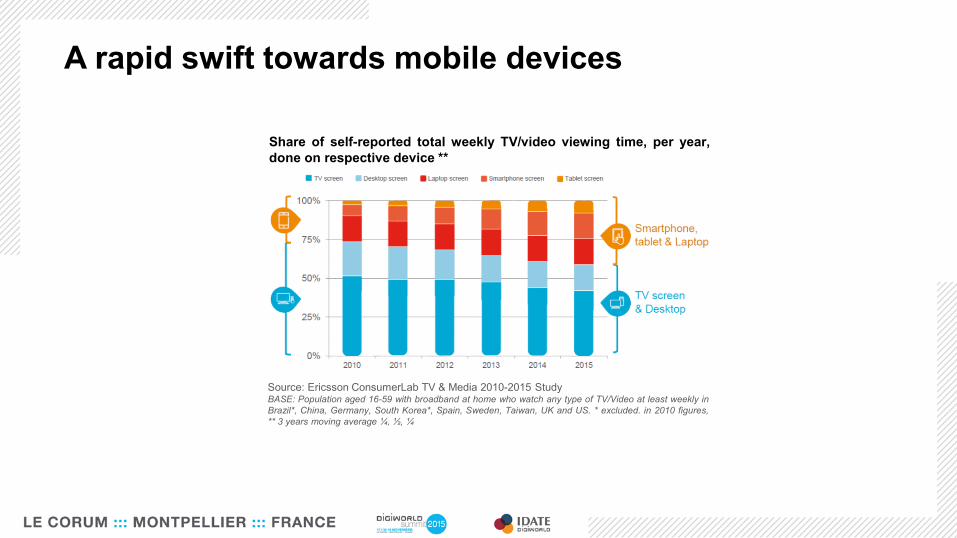
Source: Ericsson ConsumerLab TV & Media 2010-2015 StudyBASE: Population aged 16-59 with broadband at home who watch any type of TV/Video at least weekly in
Brazil, Canada, China, Colombia, France, Germany, Greece, Ireland, Italy, Mexico, Portugal, Russia,
South Korea, Spain, Sweden, Taiwan, Turkey, UK, Ukraine and US
Self-reported share of total TV-time by age group, done on respective
device **
The weight of smartphone consumption among the
youngest
Source: Ericsson ConsumerLab TV & Media 2010-2015 StudyBASE: Population aged 16-59 with broadband at home who watch any type of TV/Video at least weekly in
Brazil*, China, Germany, Spain, South Korea*, Sweden, Taiwan, UK, US,
* excluded in 2010 figures, ** 3 years moving average ¼, ½, ¼
[Showing: Use once per day or more]
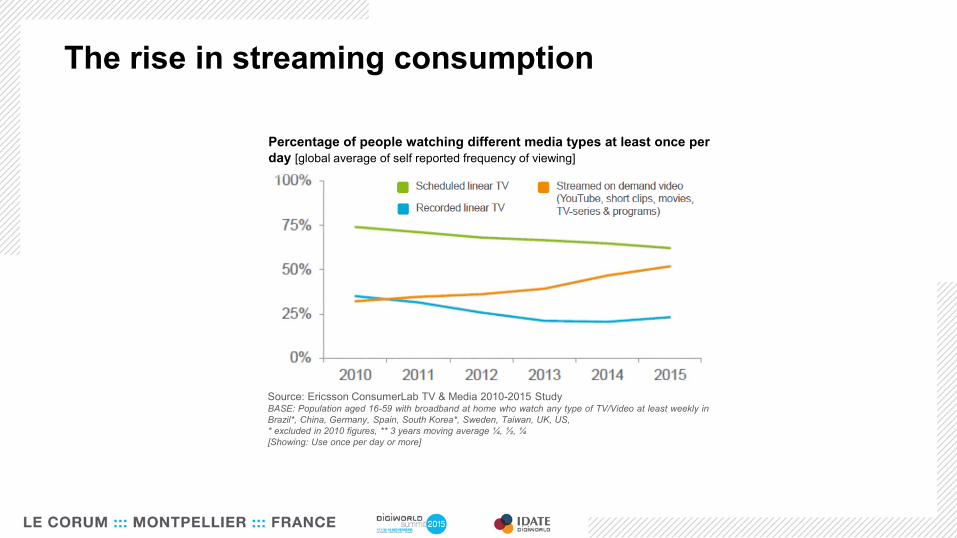
Percentage of people watching different media types at least once per
day [global average of self reported frequency of viewing]
The rise in streaming consumption
A stagnation of the pay-TV
subscribers in the USA:
10% of US broadband HH are cord-cutters
7% of US broadband HH are cord-shavers
3% of US broadband HH are cord-nevers
(Park Associates, October 2015)
In Europe, the number of pay-TV HH
seems to be still growing, but:
Canal+ is struggling to keep its subscribers
Sky does not provide its subscribers by platform
anymore
And SVOD services are far from being as
developed as in the USA
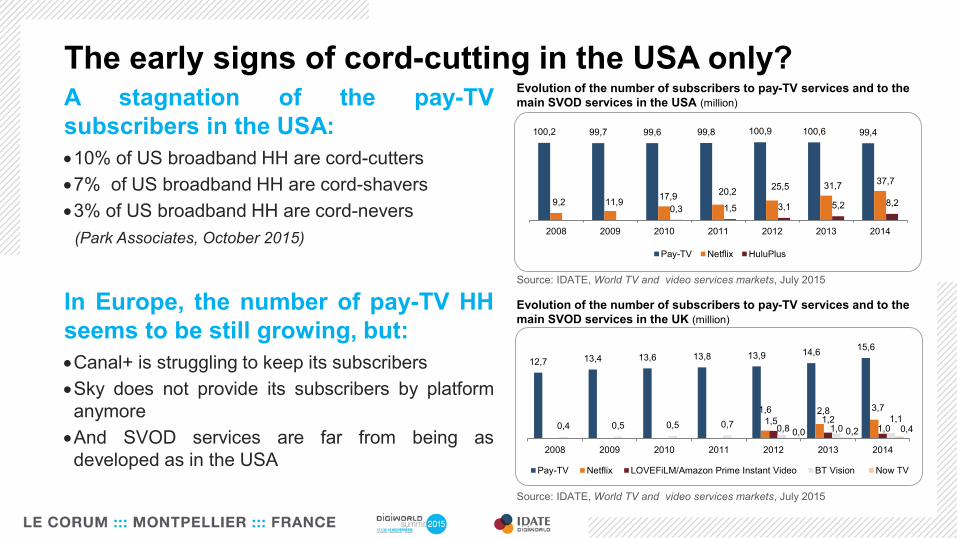
The early signs of cord-cutting in the USA only?
Source: IDATE, World TV and video services markets, July 2015
Evolution of the number of subscribers to pay-TV services and to the
main SVOD services in the USA (million)
100,2 99,7 99,6 99,8 100,9 100,6 99,4
9,2 11,917,9
20,225,5 31,7
37,7
0,3 1,5 3,1 5,2 8,2
2008 2009 2010 2011 2012 2013 2014
Pay-TV Netflix HuluPlus
12,7 13,4 13,6 13,8 13,9 14,615,6
1,6 2,8 3,7
1,5 1,21,00,4 0,5 0,5 0,7 0,8 1,0
1,1
0,0 0,2 0,4
2008 2009 2010 2011 2012 2013 2014
Pay-TV Netflix LOVEFiLM/Amazon Prime Instant Video BT Vision Now TV
Source: IDATE, World TV and video services markets, July 2015
Evolution of the number of subscribers to pay-TV services and to the
main SVOD services in the UK (million)
Source: Ericsson ConsumerLab TV & Media 2010-2015 StudyBASE: Population aged 16-59 with broadband at home who watch any type of TV/Video at least
weekly in Brazil*, China, Germany, Spain, South Korea*, Sweden, Taiwan, UK, US,
* excluded in 2010 figures, ** 3 years moving average ¼, ½, ¼
[Showing: Use once per day or more]
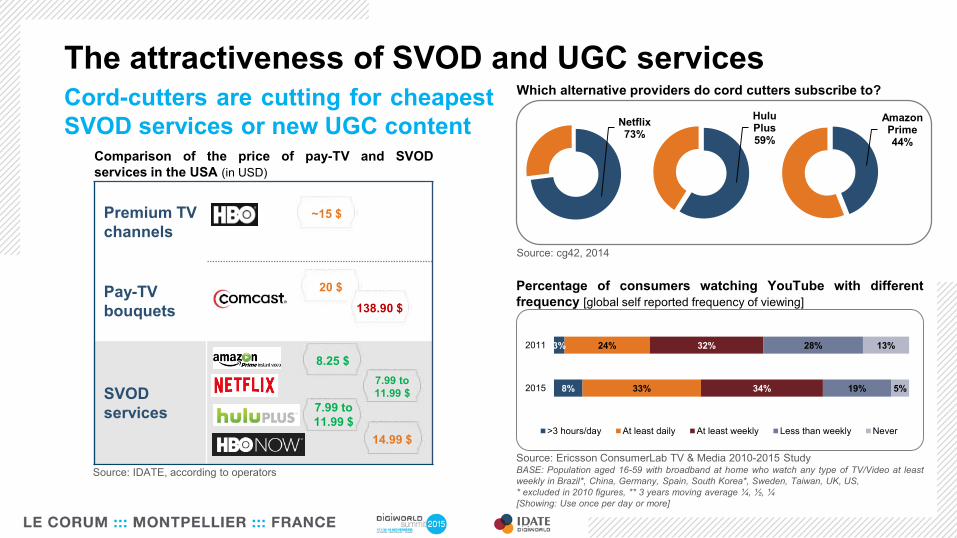
Percentage of consumers watching YouTube with different
frequency [global self reported frequency of viewing]
8%
3%
33%
24%
34%
32%
19%
28%
5%
13%
2015
2011
>3 hours/day At least daily At least weekly Less than weekly Never
Cord-cutters are cutting for cheapest
SVOD services or new UGC content
The attractiveness of SVOD and UGC services
Amazon Prime44%
Hulu Plus59%
Netflix73%
Source: cg42, 2014
Which alternative providers do cord cutters subscribe to?
Premium TV
channels
Pay-TV
bouquets
SVOD
services
8.25 $
7.99 to
11.99 $
7.99 to
11.99 $
14.99 $
20 $
138.90 $
~15 $
Source: IDATE, according to operators
Comparison of the price of pay-TV and SVOD
services in the USA (in USD)
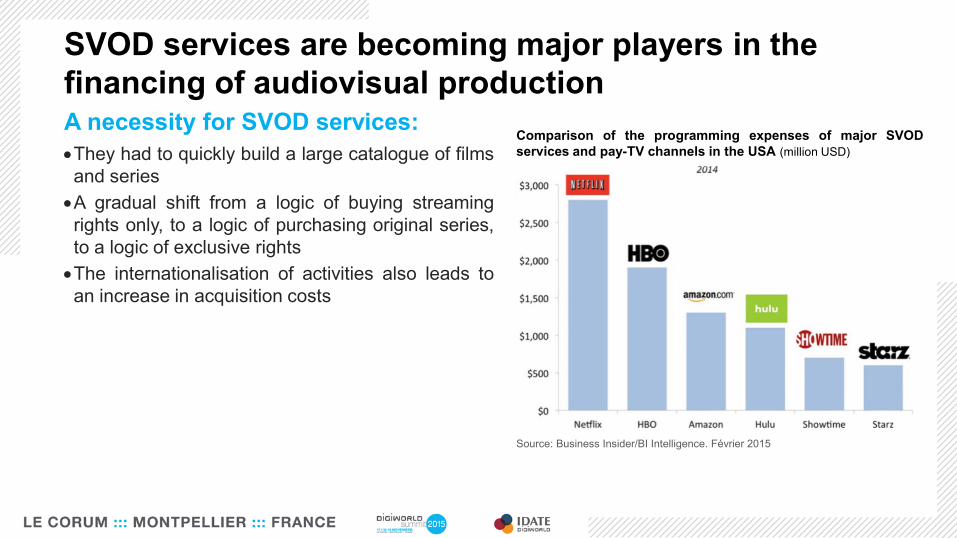
Source: Business Insider/BI Intelligence. Février 2015
Comparison of the programming expenses of major SVOD
services and pay-TV channels in the USA (million USD)
SVOD services are becoming major players in the
financing of audiovisual production A necessity for SVOD services:
They had to quickly build a large catalogue of films
and series
A gradual shift from a logic of buying streaming
rights only, to a logic of purchasing original series,
to a logic of exclusive rights
The internationalisation of activities also leads to
an increase in acquisition costs
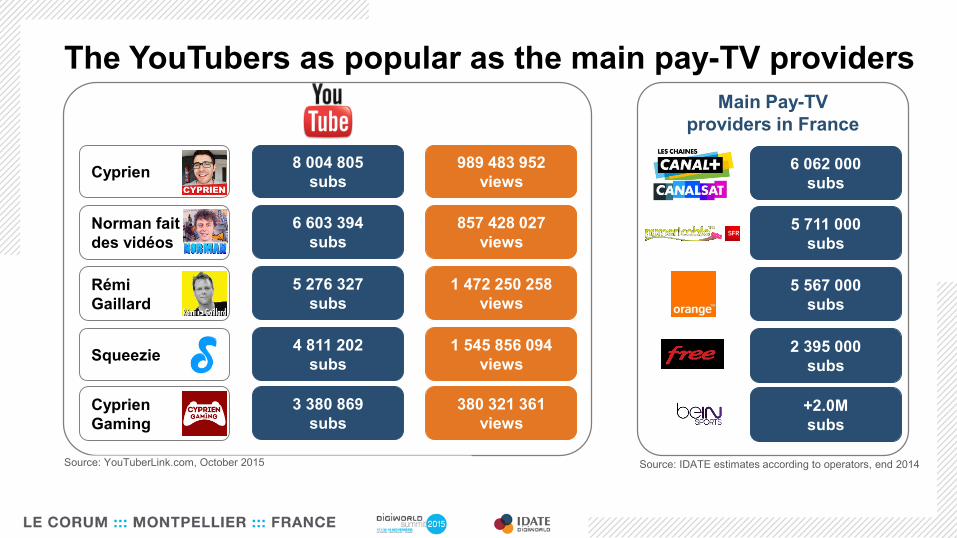
The YouTubers as popular as the main pay-TV providers
Cyprien
Norman fait
des vidéos
Rémi
Gaillard
Squeezie
Cyprien
Gaming
8 004 805
subs
6 603 394
subs
5 276 327
subs
4 811 202
subs
3 380 869
subs
989 483 952
views
857 428 027
views
1 472 250 258
views
1 545 856 094
views
380 321 361
views
Main Pay-TV
providers in France
6 062 000
subs
5 711 000
subs
5 567 000
subs
2 395 000
subs
+2.0M
subs
Source: YouTuberLink.com, October 2015 Source: IDATE estimates according to operators, end 2014
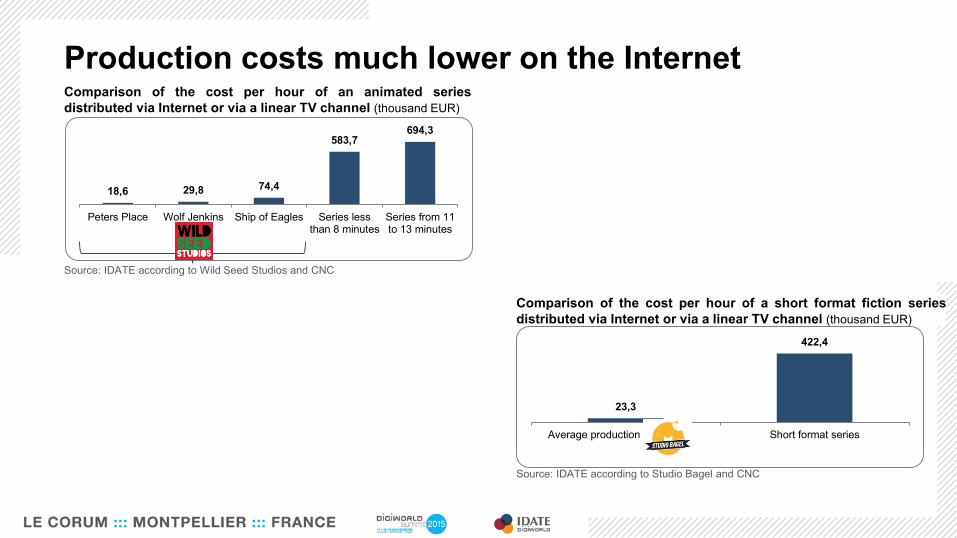
Source: IDATE according to Studio Bagel and CNC
Comparison of the cost per hour of a short format fiction series
distributed via Internet or via a linear TV channel (thousand EUR)
Production costs much lower on the Internet
23,3
422,4
Average production Studio Bagel Short format series
18,6 29,8 74,4
583,7694,3
Peters Place Wolf Jenkins Ship of Eagles Series lessthan 8 minutes
Series from 11to 13 minutes
Source: IDATE according to Wild Seed Studios and CNC
Comparison of the cost per hour of an animated series
distributed via Internet or via a linear TV channel (thousand EUR)
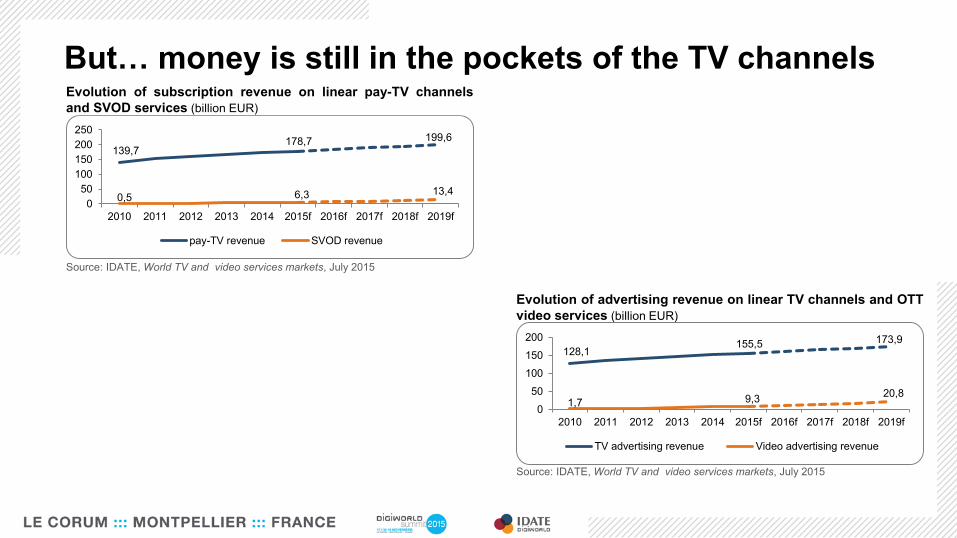
Source: IDATE, World TV and video services markets, July 2015
Evolution of advertising revenue on linear TV channels and OTT
video services (billion EUR)
But… money is still in the pockets of the TV channels
128,1155,5 173,9
1,7 9,320,8
0
50
100
150
200
2010 2011 2012 2013 2014 2015f 2016f 2017f 2018f 2019f
TV advertising revenue Video advertising revenue
139,7178,7 199,6
0,5 6,3 13,4
0
50
100
150
200
250
2010 2011 2012 2013 2014 2015f 2016f 2017f 2018f 2019f
pay-TV revenue SVOD revenue
Source: IDATE, World TV and video services markets, July 2015
Evolution of subscription revenue on linear pay-TV channels
and SVOD services (billion EUR)
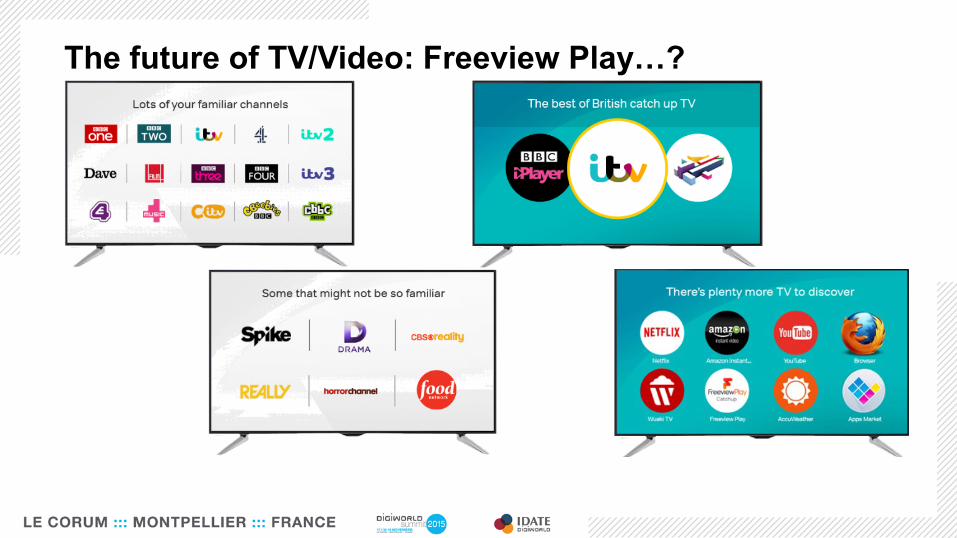
The future of TV/Video: Freeview Play…?
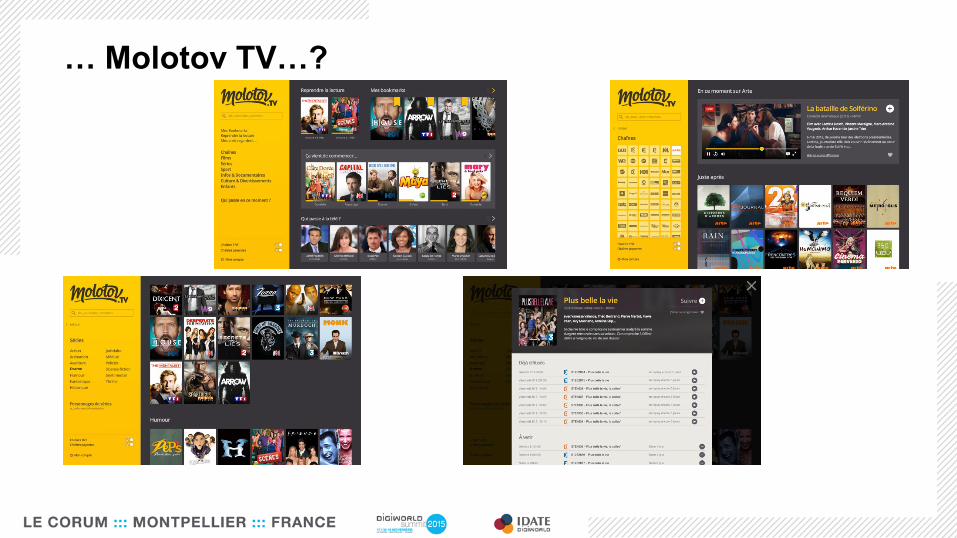
… Molotov TV…?
…or YouTube?


![[FR] PR Hangout of the DigiWorld Summit 2015 - #DWS15](https://img.pdfslide.us/doc/110x75/58e669e91a28ab8d758b62db/fr-pr-hangout-of-the-digiworld-summit-2015-dws15.jpg)