CinemarkS t b 2008September 2008
Forward Looking Statements
The following information contains, or may be deemed to contain, “forward-looking statements.” By their nature, forward-looking statements involve risks, assumptions and uncertainties because they relate to events and depend on circumstances that may or may not occur in the future. The future results of the Company may vary from the results and performance p y y y pexpressed in, or implied by, the following forward-looking statements, possibly to a material degree. For discussion of some of the important factors that could cause the Company’s results and performance to differfactors that could cause the Company s results and performance to differ from those expressed in, or implied by, the following forward-looking statements, please refer to the preliminary prospectus delivered to you, in particular the “Risk Factors” section thereof The Company undertakes noparticular the Risk Factors section thereof. The Company undertakes no obligation to update or revise any forward-looking statements.
2
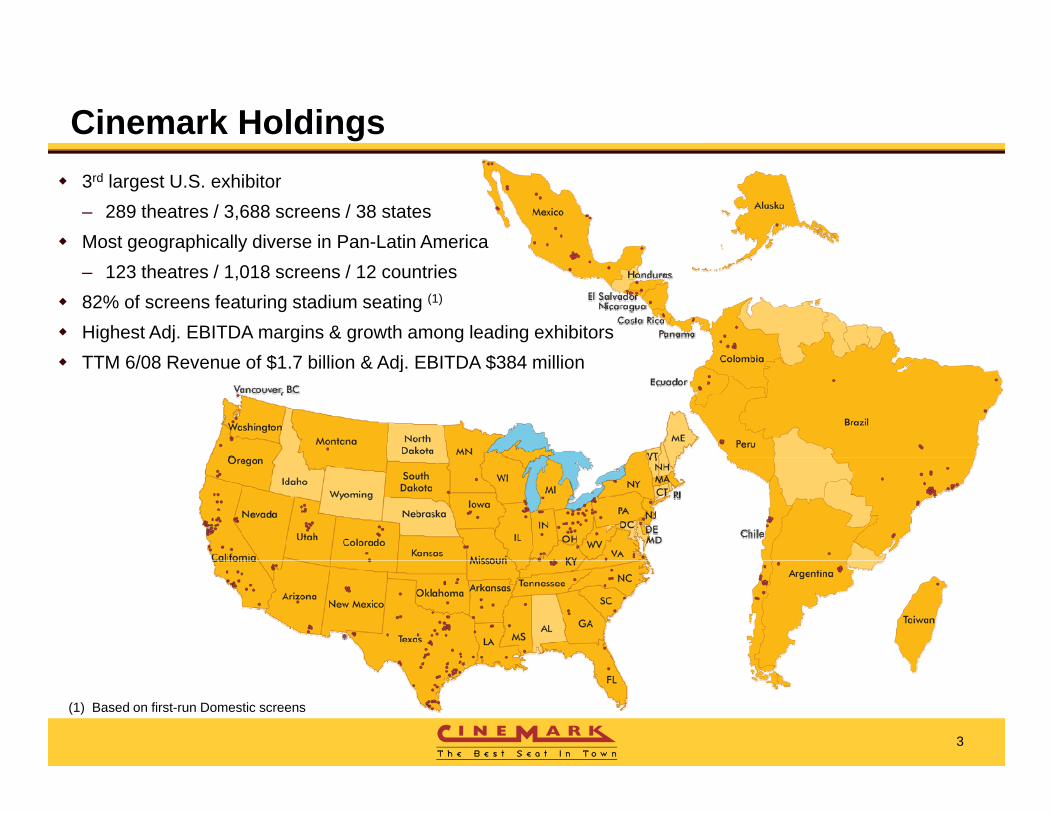
Cinemark Holdings3rd largest U.S. exhibitor– 289 theatres / 3,688 screens / 38 statesMost geographically diverse in Pan-Latin America – 123 theatres / 1,018 screens / 12 countries82% of screens featuring stadium seating (1)
Highest Adj. EBITDA margins & growth among leading exhibitorsTTM 6/08 R f $1 7 billi & Adj EBITDA $384 illiTTM 6/08 Revenue of $1.7 billion & Adj. EBITDA $384 million
3
(1) Based on first-run Domestic screens
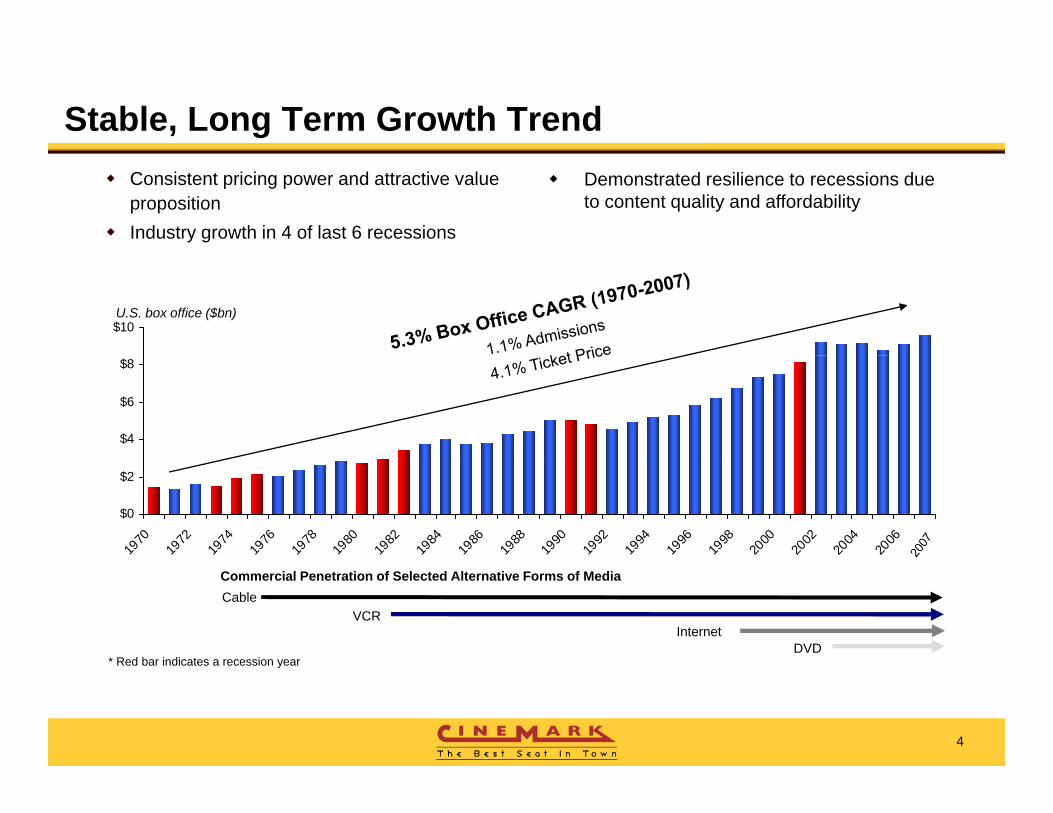
Stable, Long Term Growth TrendConsistent pricing power and attractive value propositionIndustry growth in 4 of last 6 recessions
Demonstrated resilience to recessions due to content quality and affordability
$10U.S. box office ($bn)
$4
$6
$8
$0
$2
1970
1972
1974
1976
1978
1980
1982
1984
1986
1988
1990
1992
1994
1996
1998
2000
2002
2004
2006
CableVCR
InternetDVD
Commercial Penetration of Selected Alternative Forms of Media
* Red bar indicates a recession year
4
Red bar indicates a recession year
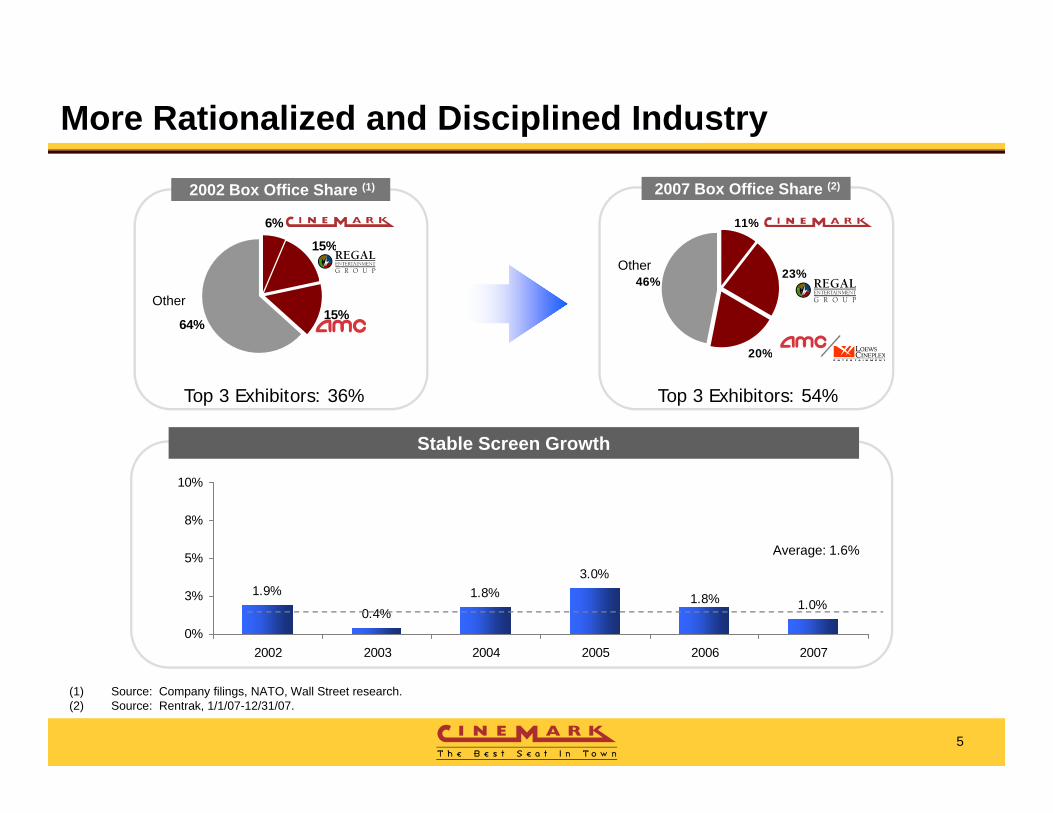
More Rationalized and Disciplined Industry
15%
6% 11%
2007 Box Office Share (2)2002 Box Office Share (1)
15%64%
Other
23%
20%
46%Other
20%
Stable Screen Growth
Top 3 Exhibitors: 36% Top 3 Exhibitors: 54%
5%
8%
10%
Average: 1.6%
1.9%
0.4%1.8%
3.0%
1.0%1.8%
0%
3%
5%
2002 2003 2004 2005 2006 2007
5
(1) Source: Company filings, NATO, Wall Street research.(2) Source: Rentrak, 1/1/07-12/31/07.

Digital Technology Promotes Innovation
Digital Innovations
DCIP Higher Ticket Pricing
Higher Attendance
Cinema Advertising Growth
Digital 3-D
Quality digital product Released in January 2008
Ticket Pricing Attendance
3D - Hannah Montana
Flexible content management drives
increased revenue and customer
Average ticket price of $15
Opened nationwide at $31.1M on 683 screens
Average of over $45,000
satisfaction
Alternative Entertainment
per screen
6
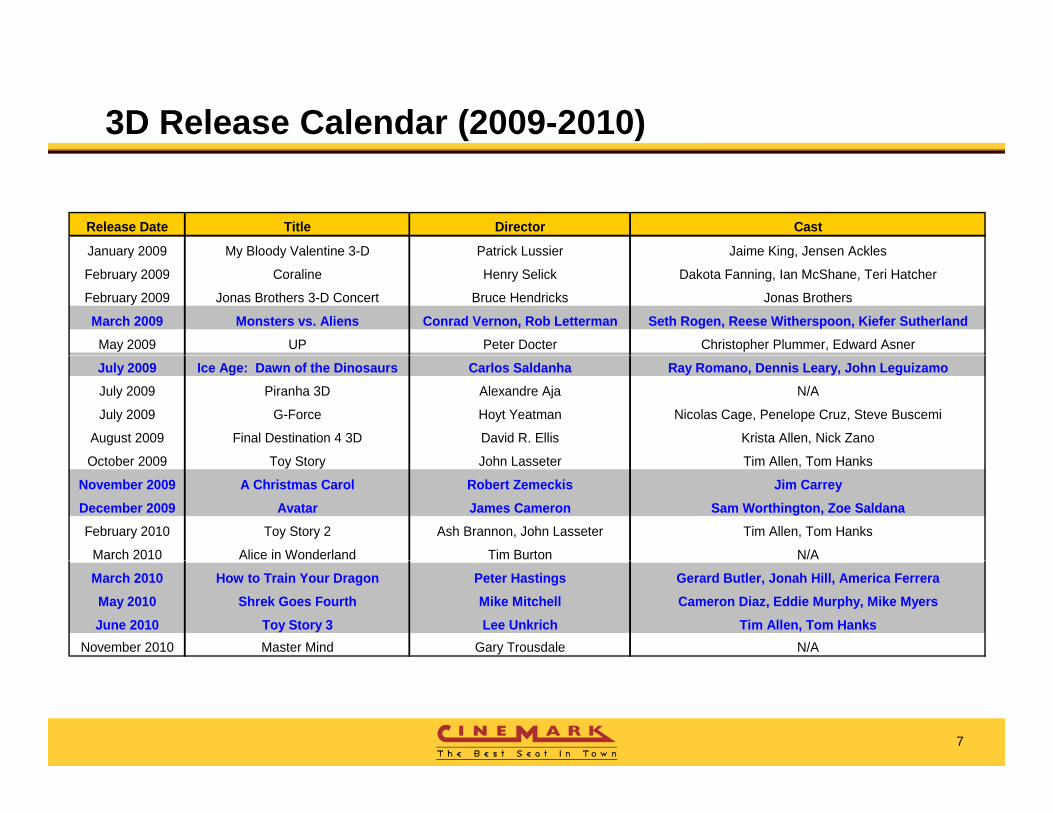
3D Release Calendar (2009-2010)
Release Date Title Director Cast
January 2009 My Bloody Valentine 3-D Patrick Lussier Jaime King Jensen AcklesJanuary 2009 My Bloody Valentine 3 D Patrick Lussier Jaime King, Jensen Ackles
February 2009 Coraline Henry Selick Dakota Fanning, Ian McShane, Teri Hatcher
February 2009 Jonas Brothers 3-D Concert Bruce Hendricks Jonas Brothers
March 2009 Monsters vs. Aliens Conrad Vernon, Rob Letterman Seth Rogen, Reese Witherspoon, Kiefer SutherlandMay 2009 UP Peter Docter Christopher Plummer, Edward Asner
July 2009 Ice Age: Dawn of the Dinosaurs Carlos Saldanha Ray Romano, Dennis Leary, John LeguizamoJuly 2009 Piranha 3D Alexandre Aja N/A
July 2009 G-Force Hoyt Yeatman Nicolas Cage, Penelope Cruz, Steve Buscemi
August 2009 Final Destination 4 3D David R. Ellis Krista Allen, Nick Zano
O t b 2009 T St J h L t Ti All T H kOctober 2009 Toy Story John Lasseter Tim Allen, Tom Hanks
November 2009 A Christmas Carol Robert Zemeckis Jim CarreyDecember 2009 Avatar James Cameron Sam Worthington, Zoe SaldanaFebruary 2010 Toy Story 2 Ash Brannon, John Lasseter Tim Allen, Tom Hanks
March 2010 Alice in Wonderland Tim Burton N/A
March 2010 How to Train Your Dragon Peter Hastings Gerard Butler, Jonah Hill, America FerreraMay 2010 Shrek Goes Fourth Mike Mitchell Cameron Diaz, Eddie Murphy, Mike MyersJune 2010 Toy Story 3 Lee Unkrich Tim Allen, Tom Hanks
November 2010 Master Mind Gary Trousdale N/A
7
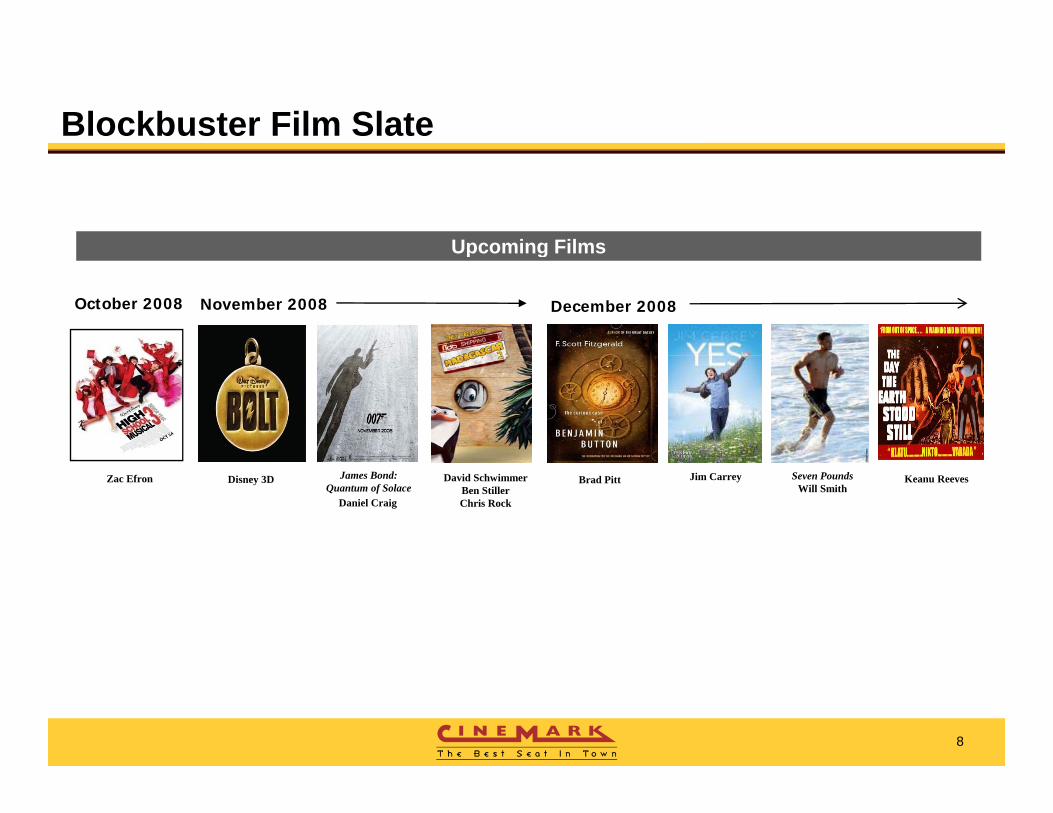
Blockbuster Film Slate
Upcoming FilmsUpcoming Films
November 2008 December 2008October 2008
Keanu ReevesJames Bond: Quantum of Solace
Daniel Craig
Disney 3D David SchwimmerBen StillerChris Rock
Jim CarreyZac Efron Brad Pitt Seven PoundsWill Smith
8

Best in Class Management Team Average of ~29 years of theatre operating experience among senior management
Name / Position Years in the Industry
Years withCompany Experience
Lee Roy Mitchell Chairman
50+ 21 CEO from 1996 until 2007 and Director since inception in 1987; Chairman since 1996
Alan StockCEO
28 21 President and COO from 1993 until 2007
Industry Company
CEO
Tim WarnerPresident and COO
41 12 President of Cinemark International, LLC from 1996until 2007Director of National Association of Theatres Owners
Valmir Fernandez 12 12 President of Cinemark Brasil S A from 1996 until 2007Valmir FernandezPresident of Cinemark International
12 12 President of Cinemark Brasil, S.A. from 1996 until 2007
Robert CoppleExecutive VP and CFO
15 15 President of PBA Development, Inc., an investment management and venture capital companySenior Manager at Deloitte & Touche, LLP
Average 29 16
9
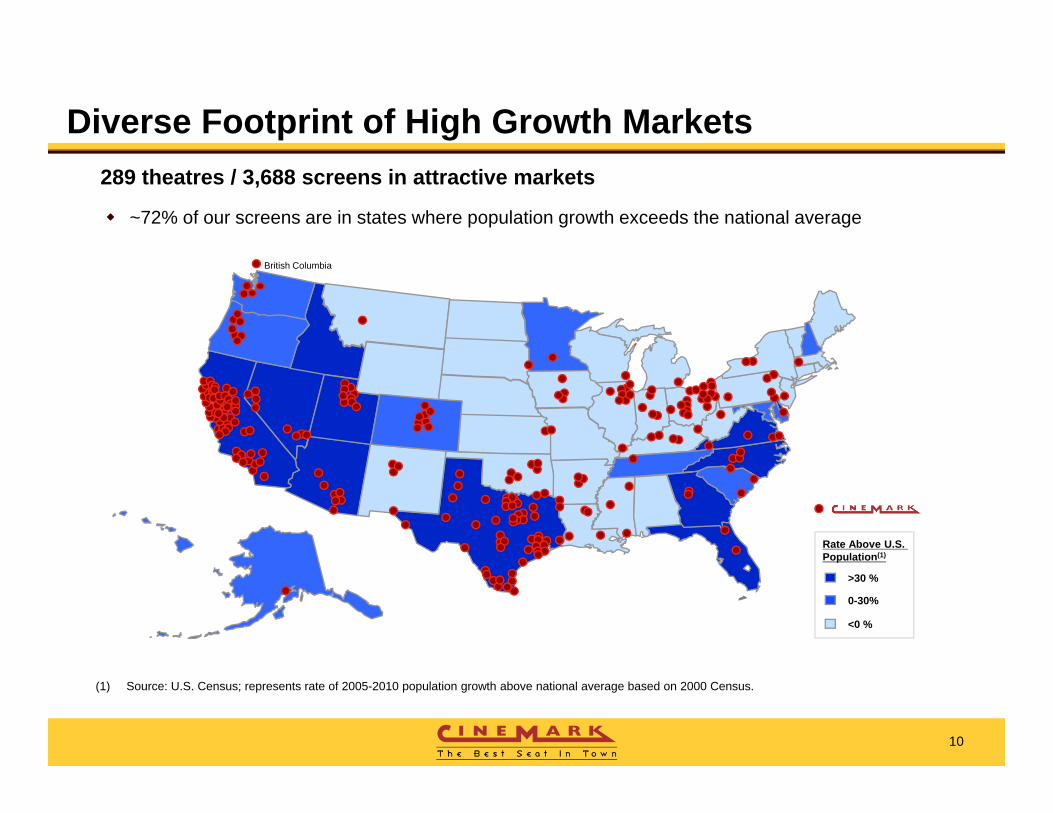
Diverse Footprint of High Growth Markets289 theatres / 3,688 screens in attractive markets
~72% of our screens are in states where population growth exceeds the national average
British Columbia
Rate Above U.S. Population(1)
>30 %
<0 %
opu at o
0-30%
10
(1) Source: U.S. Census; represents rate of 2005-2010 population growth above national average based on 2000 Census.
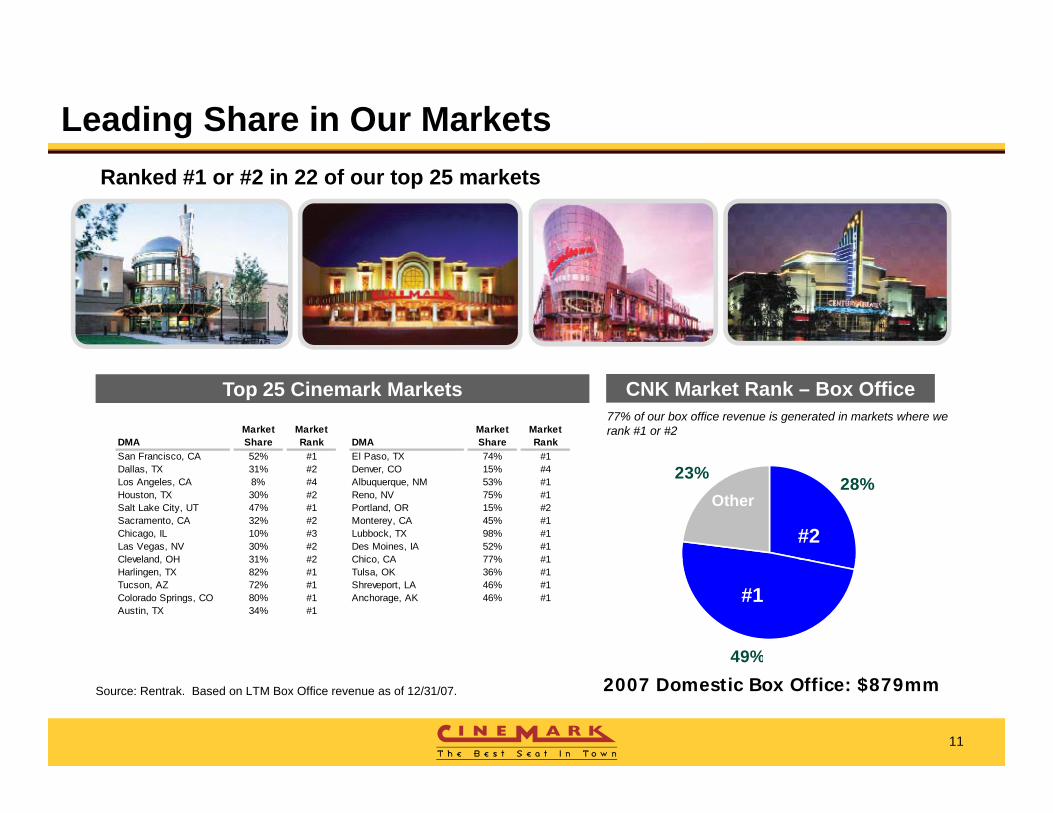
Leading Share in Our Markets Ranked #1 or #2 in 22 of our top 25 markets
Top 25 Cinemark Markets CNK Market Rank – Box Office 77% of our box office revenue is generated in markets where we rank #1 or #2 Market Market Market Market
DMA Share Rank DMA Share RankSan Francisco CA 52% #1 El Paso TX 74% #1
28%23%
#2
Other
San Francisco, CA 52% #1 El Paso, TX 74% #1Dallas, TX 31% #2 Denver, CO 15% #4Los Angeles, CA 8% #4 Albuquerque, NM 53% #1Houston, TX 30% #2 Reno, NV 75% #1Salt Lake City, UT 47% #1 Portland, OR 15% #2Sacramento, CA 32% #2 Monterey, CA 45% #1Chicago, IL 10% #3 Lubbock, TX 98% #1Las Vegas, NV 30% #2 Des Moines, IA 52% #1Cleveland OH 31% #2 Chico CA 77% #1
49%
#1
Cleveland, OH 31% #2 Chico, CA 77% #1Harlingen, TX 82% #1 Tulsa, OK 36% #1Tucson, AZ 72% #1 Shreveport, LA 46% #1Colorado Springs, CO 80% #1 Anchorage, AK 46% #1Austin, TX 34% #1
11
Source: Rentrak. Based on LTM Box Office revenue as of 12/31/07. 2007 Domestic Box Office: $879mm
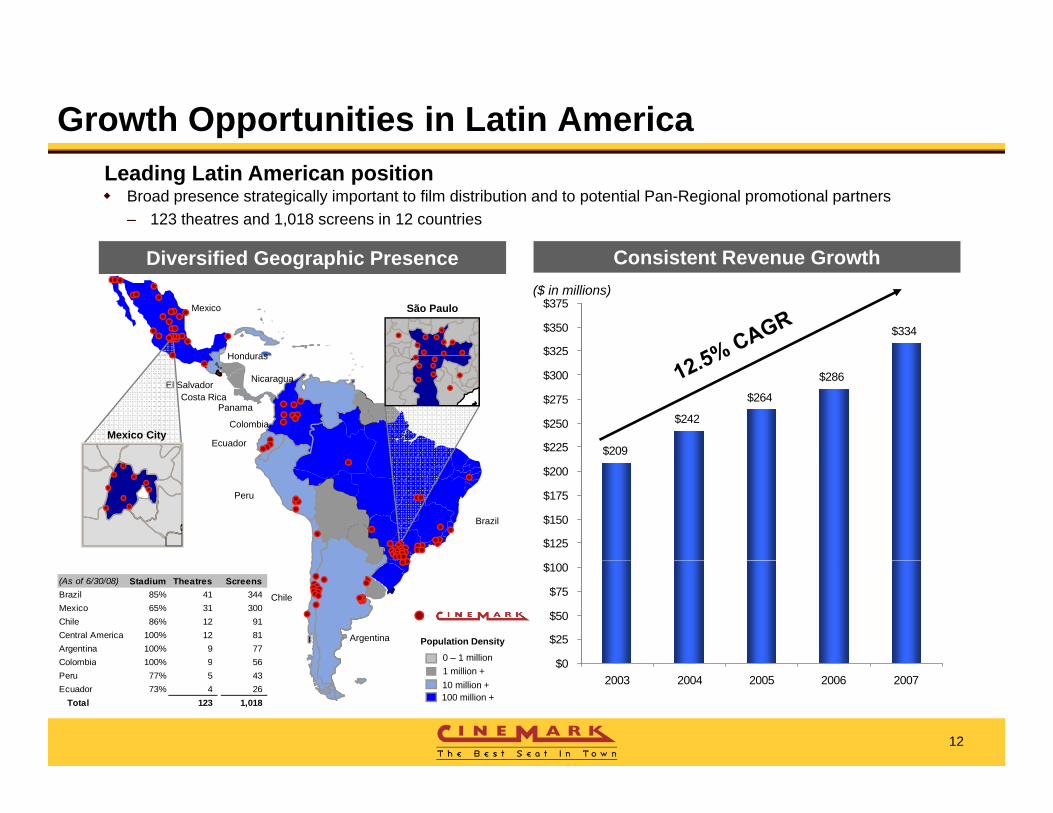
Growth Opportunities in Latin AmericaLeading Latin American position
Di ifi d G hi P C i t t R G th
Broad presence strategically important to film distribution and to potential Pan-Regional promotional partners– 123 theatres and 1,018 screens in 12 countries
Diversified Geographic Presence($ in millions)
$334
$325
$350
$375
Consistent Revenue Growth
Honduras
Mexico São Paulo
$209
$242
$264
$286
$225
$250
$275
$300
$
El Salvador
Ecuador
Colombia
Nicaragua
Honduras
Costa RicaPanama
Mexico City
$125
$150
$175
$200
Peru
Brazil
0 – 1 million
Population Density
$0
$25
$50
$75
$100
Argentina
Chile
(As of 6/30/08) Stadium Theatres ScreensBrazil 85% 41 344 Mexico 65% 31 300 Chile 86% 12 91 Central America 100% 12 81 Argentina 100% 9 77 Colombia 100% 9 56
12
10 million +1 million +
100 million +
$02003 2004 2005 2006 2007
Colombia 100% 9 56 Peru 77% 5 43 Ecuador 73% 4 26
Total 123 1,018
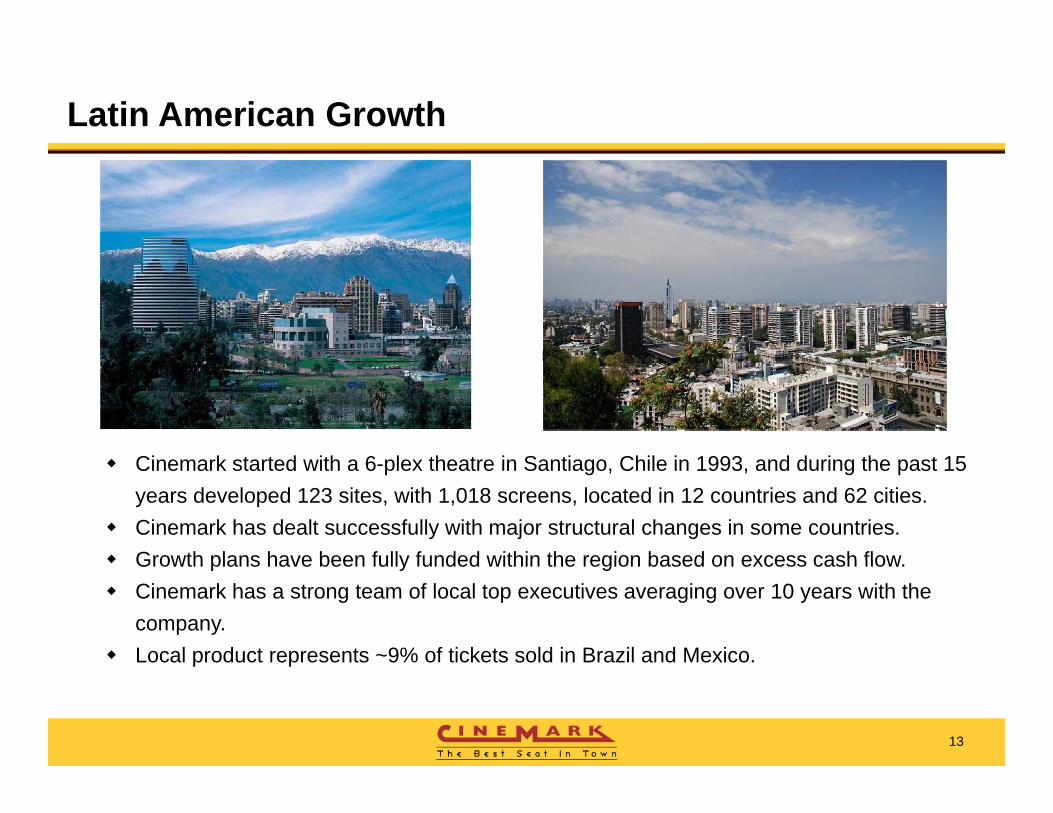
Latin American Growth
Ci k t t d ith 6 l th t i S ti Chil i 1993 d d i th t 15Cinemark started with a 6-plex theatre in Santiago, Chile in 1993, and during the past 15 years developed 123 sites, with 1,018 screens, located in 12 countries and 62 cities. Cinemark has dealt successfully with major structural changes in some countries. Growth plans have been fully funded within the region based on excess cash flowGrowth plans have been fully funded within the region based on excess cash flow.Cinemark has a strong team of local top executives averaging over 10 years with the company. Local product represents ~9% of tickets sold in Brazil and Mexico.
13
p p
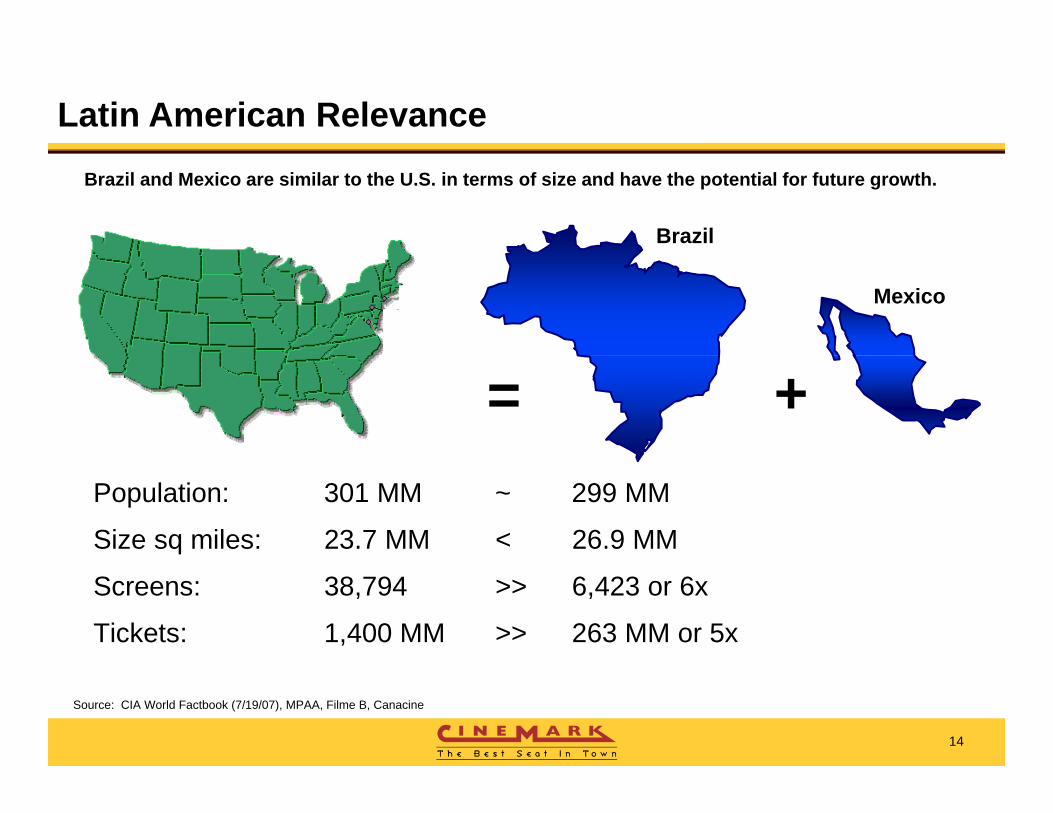
Latin American RelevanceBrazil and Mexico are similar to the U.S. in terms of size and have the potential for future growth.
Brazil
Mexico
+=Population: 301 MM ~ 299 MM
Size sq miles: 23.7 MM < 26.9 MM
Screens: 38,794 >> 6,423 or 6x
Tickets: 1,400 MM >> 263 MM or 5x
14
Source: CIA World Factbook (7/19/07), MPAA, Filme B, Canacine
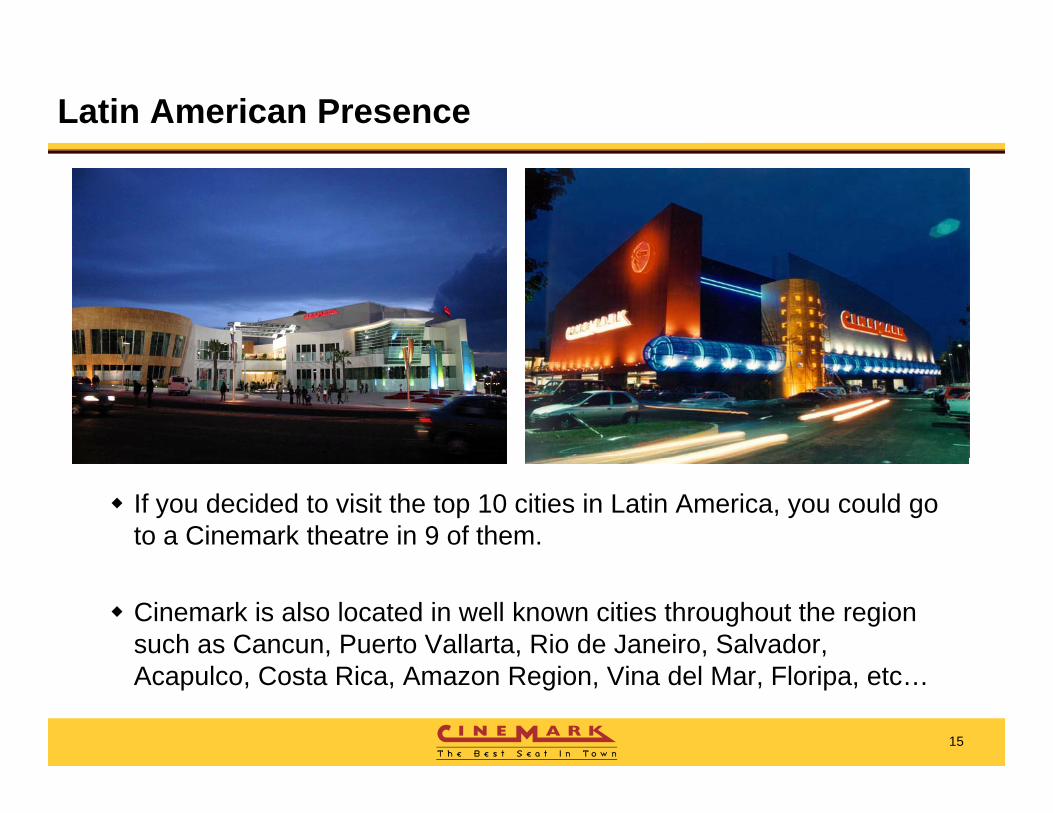
Latin American Presence
If you decided to visit the top 10 cities in Latin America, you could go to a Cinemark theatre in 9 of them.
Cinemark is also located in well known cities throughout the region such as Cancun, Puerto Vallarta, Rio de Janeiro, Salvador,
15
Acapulco, Costa Rica, Amazon Region, Vina del Mar, Floripa, etc…
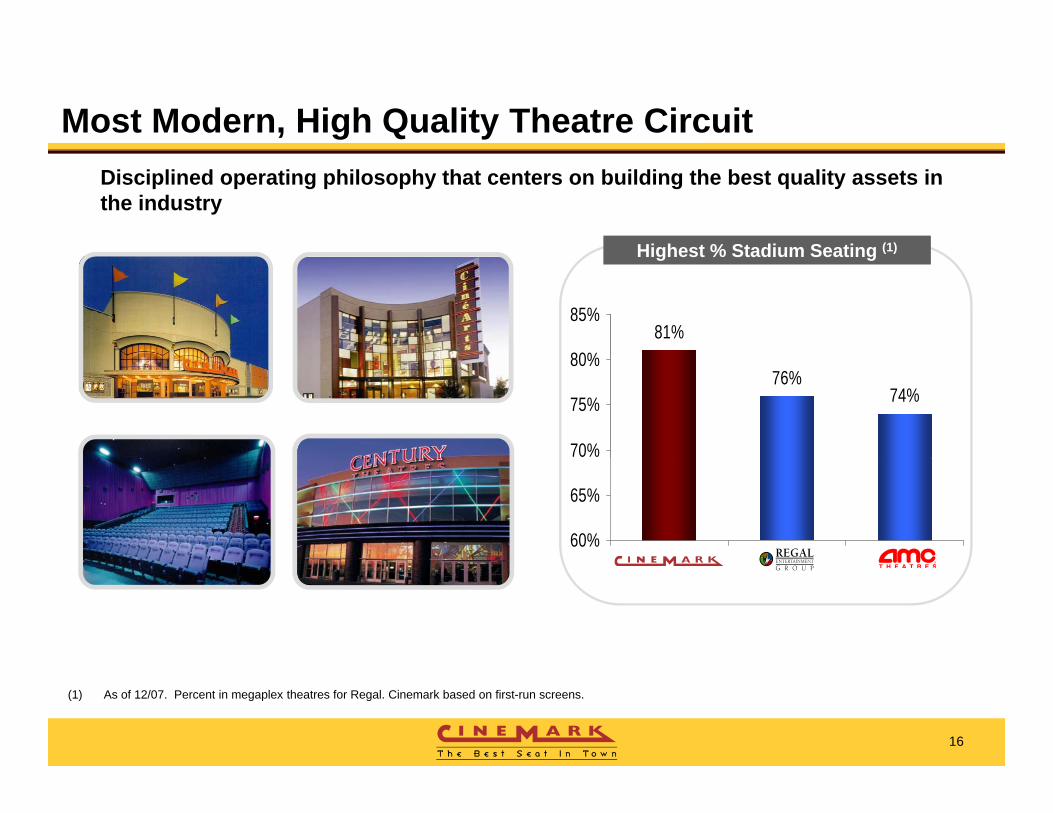
Most Modern, High Quality Theatre Circuit
Highest % Stadium Seating (1)
Disciplined operating philosophy that centers on building the best quality assets in the industry
81%80%
85%
Highest % Stadium Seating ( )
76%74%
70%
75%
80%
60%
65%
16
(1) As of 12/07. Percent in megaplex theatres for Regal. Cinemark based on first-run screens.
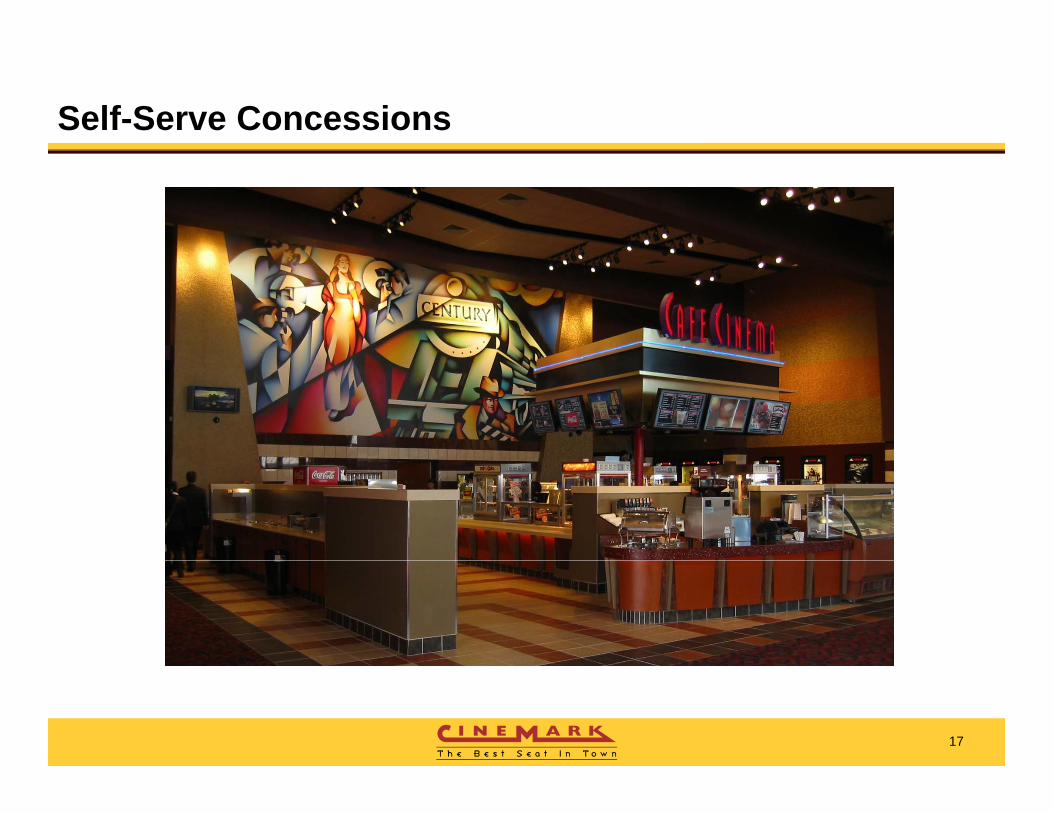
Self-Serve Concessions
17

Product Selection Criteria
18

Track Record of Consistent Growth
Rev($mm)
$1,800 $500
Adj. EBITDA ($mm)
$1,221
$1,612$1,683
$377$360
$
$1,400
$1,600
$ ,
$400
$
$713$786
$854$936 $951
$1,024 $1,021
$206 $210$229
$210
$272
$800
$1,000
$1,200
$200
$300
$435
$571$142
$170
$128$108
$87
$200
$400
$600
$100
$01997 1998 1999 2000 2001 2002 2003 2004 2005 2006 PF2006 2007
$0
Revenue Adj. EBITDA
19
Note: 1996 – 2006 not pro forma for acquisition of Century Theatres.
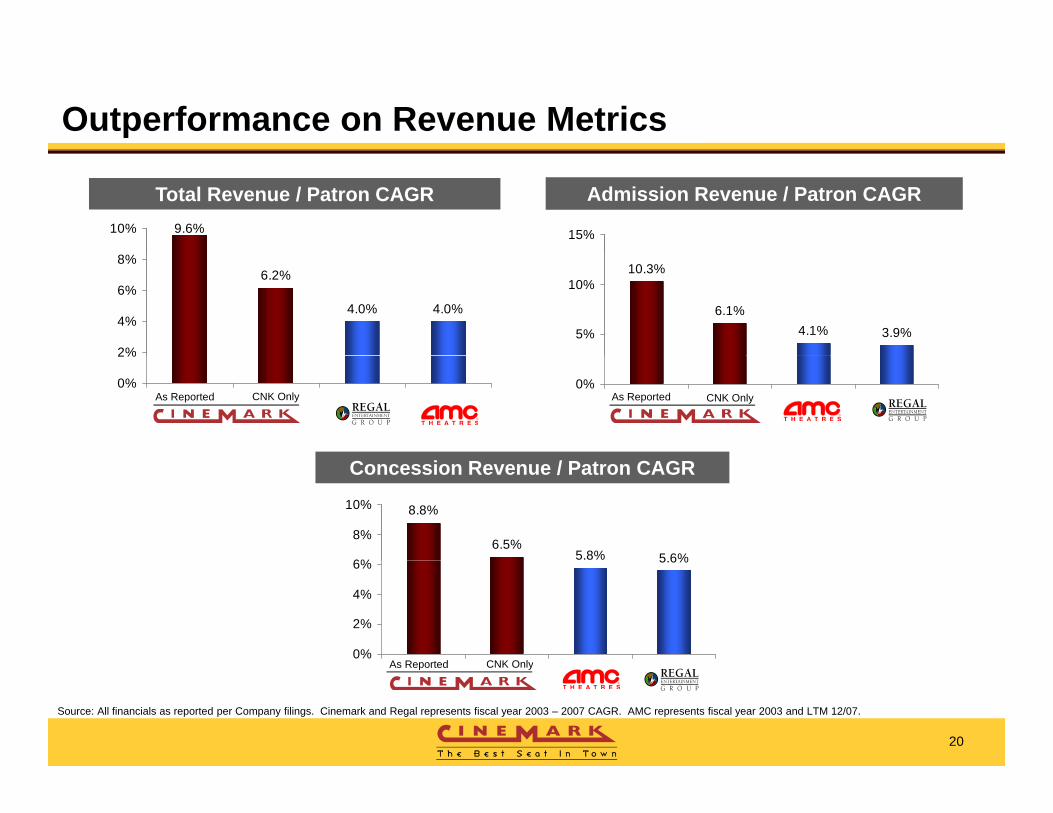
Outperformance on Revenue Metrics
Total Revenue / Patron CAGR Admission Revenue / Patron CAGR9.6%10% 15%
6.2%
4.0% 4.0%
2%
4%
6%
8%10.3%
6.1%4.1% 3.9%5%
10%
0%
2%
As Reported CNK Only0%
As Reported CNK Only
8.8%
6.5%5.8% 5 6%6%
8%
10%
Concession Revenue / Patron CAGR
5.6%
0%
2%
4%
6%
As Reported CNK Only
20
Source: All financials as reported per Company filings. Cinemark and Regal represents fiscal year 2003 – 2007 CAGR. AMC represents fiscal year 2003 and LTM 12/07.
As Reported CNK Only
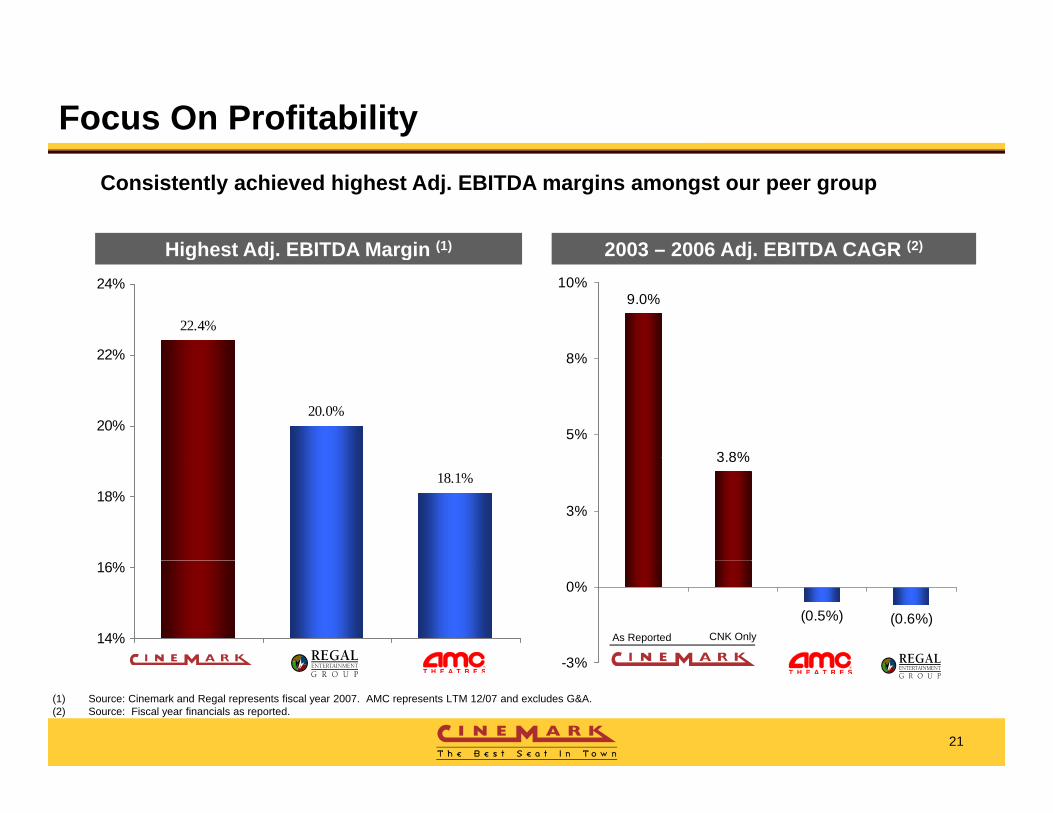
Focus On Profitability
2003 – 2006 Adj EBITDA CAGR (2)Highest Adj EBITDA Margin (1)
Consistently achieved highest Adj. EBITDA margins amongst our peer group
22.4%
22%
24%
2003 2006 Adj. EBITDA CAGR ( )Highest Adj. EBITDA Margin ( )
9.0%
8%
10%
20.0%20%
22%
3 8%5%
8%
18.1%18%
3.8%
3%
14%
16%
(0.5%) (0.6%)
3%
0%
As Reported CNK Only
21
(1) Source: Cinemark and Regal represents fiscal year 2007. AMC represents LTM 12/07 and excludes G&A.(2) Source: Fiscal year financials as reported.
-3%
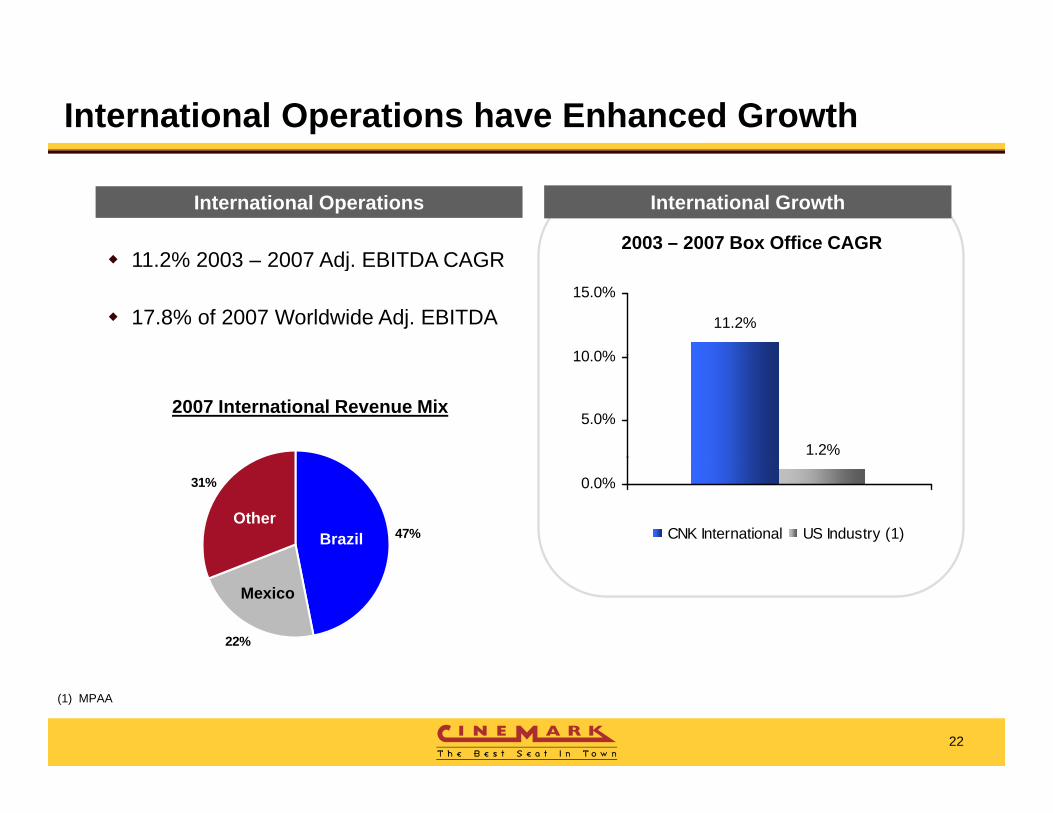
International Operations have Enhanced Growth
11 2% 2003 2007 Adj EBITDA CAGR
International GrowthInternational Operations
2003 – 2007 Box Office CAGR11.2% 2003 – 2007 Adj. EBITDA CAGR
17.8% of 2007 Worldwide Adj. EBITDA 11.2%
10 0%
15.0%
2007 International Revenue Mix
1.2%
5.0%
10.0%
47%
31%
Brazil Other
0.0%
CNK International US Industry (1)
22%
Mexico
22
(1) MPAA
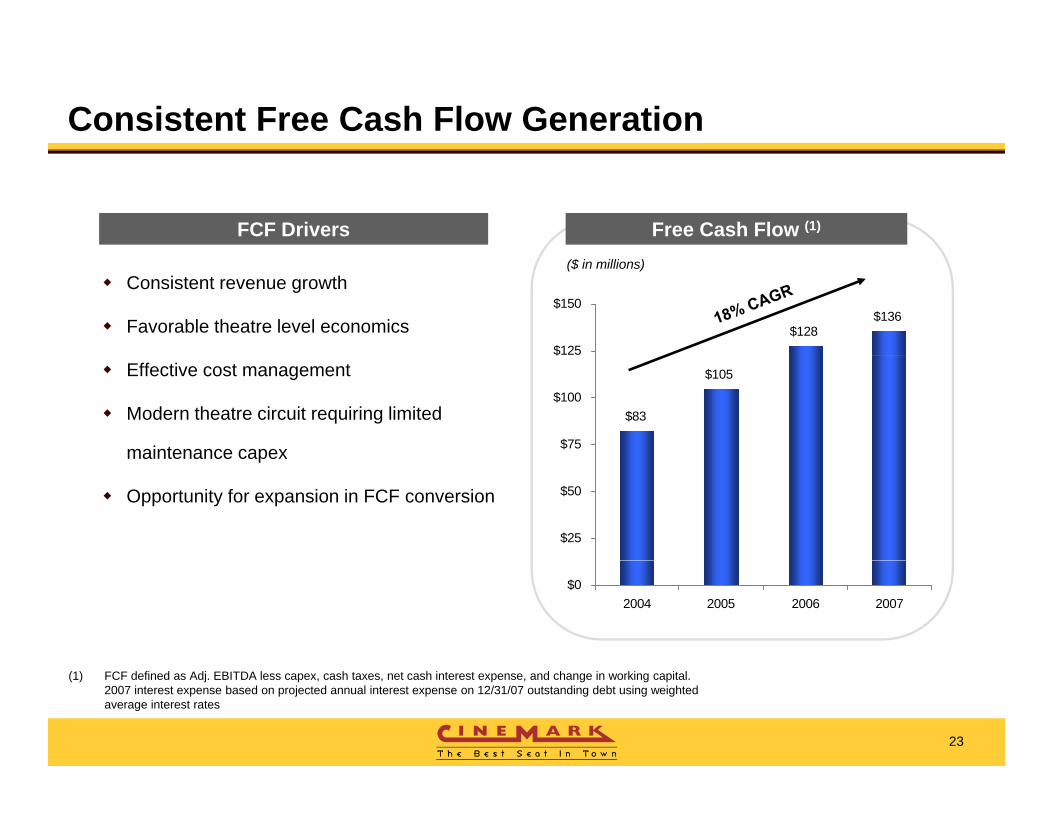
Consistent Free Cash Flow Generation
Free Cash Flow (1)FCF Drivers
Consistent revenue growth
Favorable theatre level economics
($ in millions)
$128$136
$125
$150
Effective cost management
Modern theatre circuit requiring limited
maintenance capex
$83
$105
$75
$100
$
maintenance capex
Opportunity for expansion in FCF conversion
$25
$50
$02004 2005 2006 2007
23
(1) FCF defined as Adj. EBITDA less capex, cash taxes, net cash interest expense, and change in working capital. 2007 interest expense based on projected annual interest expense on 12/31/07 outstanding debt using weighted average interest rates
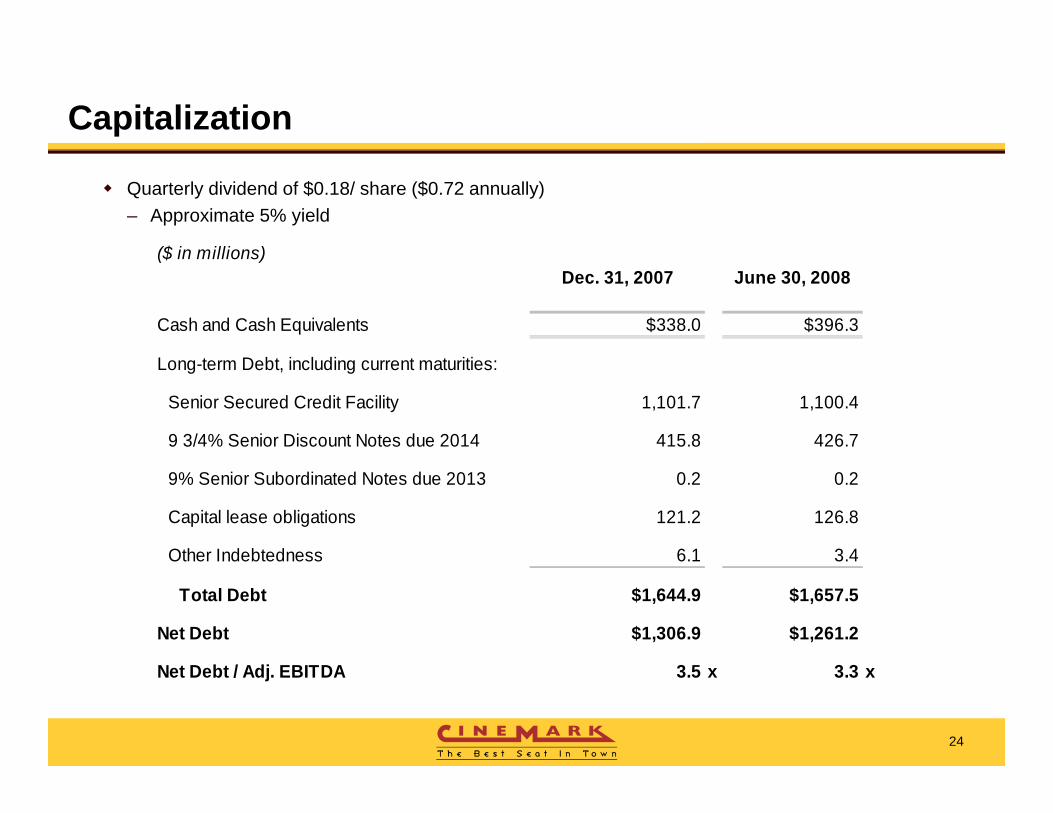
Capitalization
Quarterly dividend of $0.18/ share ($0.72 annually)– Approximate 5% yield
($ in millions)($ in millions)Dec. 31, 2007 June 30, 2008
Cash and Cash Equivalents $338.0 $396.3
Long-term Debt, including current maturities:
Senior Secured Credit Facility 1,101.7 1,100.4
9 3/4% Senior Discount Notes due 2014 415.8 426.7
9% Senior Subordinated Notes due 2013 0.2 0.2
Capital lease obligations 121.2 126.8
Other Indebtedness 6.1 3.4Other Indebtedness 6.1 3.4
Total Debt $1,644.9 $1,657.5
Net Debt $1,306.9 $1,261.2
24
Net Debt / Adj. EBITDA 3.5 x 3.3 x
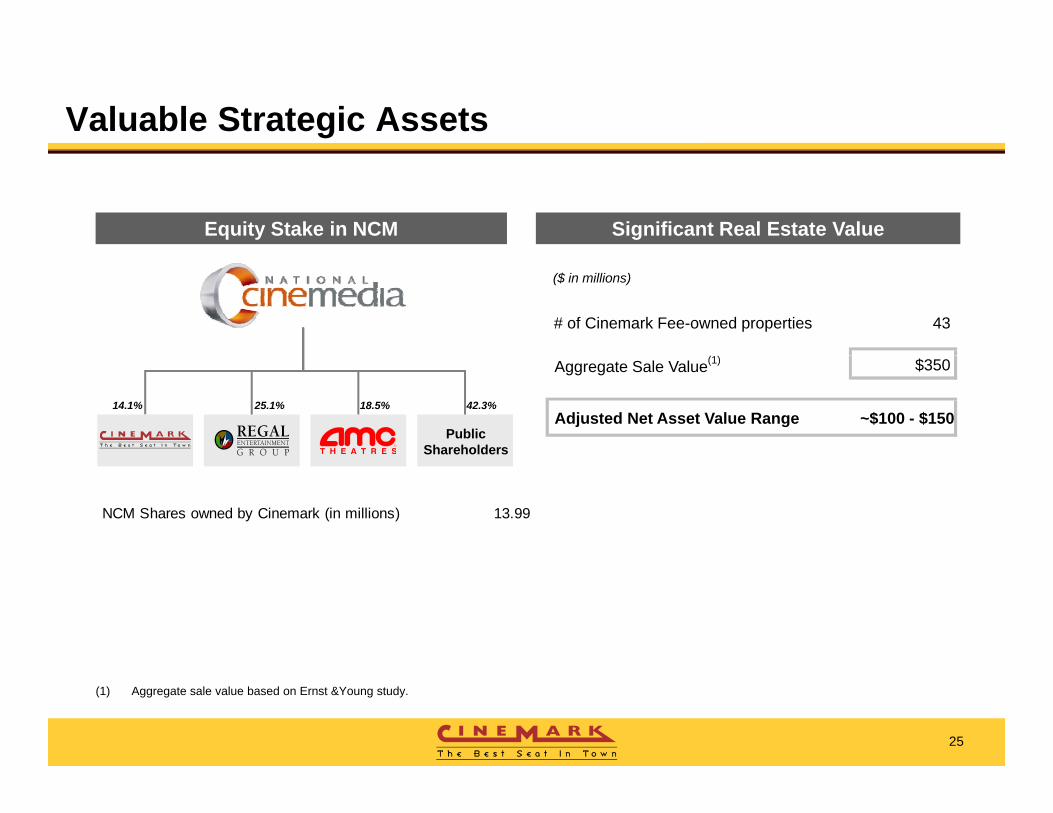
Valuable Strategic Assets
Significant Real Estate ValueEquity Stake in NCM
($ in millions)
# of Cinemark Fee-owned properties 43
14.1% 25.1% 18.5%
PublicShareholders
42.3%
Aggregate Sale Value(1) $350
Adjusted Net Asset Value Range ~$100 - $150
NCM Shares owned by Cinemark (in millions) 13.99
25
(1) Aggregate sale value based on Ernst &Young study.

Recent Results
TTM Year Ended IPOJune 30, December 31, Proforma
2008 2007 2006
REVENUESU.S. 1,365,671 1,352,042 1,328,194 International 360,582 333,624 285,854 Eliminations (3,220) (2,825) (1,944)
Total Revenues 1,723,033 1,682,841 1,612,104
ADJUSTED EBITDAU.S. 310,617 309,800 International 73,181 67,138
Total Adjusted EBITDA 383 798 376 938Total Adjusted EBITDA 383,798 376,938
26
(1) Adjusted EBITDA as calculated in the chart above represents net income before income taxes, interest expense, gain on NCM transaction, gain on Fandango transaction, other income/expense excluding distributions from NCM, termination of profit participation agreement, depreciation and amortization, amortization of favorable leases, impairment of long-lived assets, (gain) loss on sale of assets and other, deferred lease expense, amortization of long-term prepaid rents and stock option compensation expense.
CinemarkS t b 2008September 2008
Recommended