Embed Size (px)
Citation preview

Spraberry Investor PresentationSeptember 2008
2
Forward-Looking StatementsExcept for historical information contained herein, the statements, charts and graphs in this presentation are forward-looking statements that are made pursuant to the Safe Harbor Provisions of the Private Securities Litigation Reform Act of 1995. Forward-looking statements and the business prospects of Pioneer are subject to a number of risks and uncertainties that may cause Pioneer's actual results in future periods to differ materially from the forward-looking statements. These risks and uncertainties include, among other things, volatility of commodity prices, product supply and demand, competition, the ability to obtain environmental and other permits and the timing thereof, other government regulation or action, the ability to obtain approvals from third parties and negotiate agreements with third parties on acceptable terms, international operations and associated international political and economic instability, litigation, the costs and results of drilling and operations, access to and availability of drilling equipment and transportation, processing and refining facilities, Pioneer's ability to replace reserves, implement its business plans or complete its development activities as scheduled, access to and cost of capital, uncertainties about estimates of reserves and resource potential and the ability to add proved reserves in the future, the assumptions underlying production forecasts, quality of technical data, environmental and weather risks, and acts of war or terrorism. These and other risks are described in Pioneer's 10-K and 10-Q Reports and other filings with the Securities and Exchange Commission. In addition, Pioneer may be subject to currently unforeseen risks that may have a materially adverse impact on it. Pioneer undertakes no duty to publicly update these statements except as required by law.
Please see the appendix slides included in this presentation for other important information.

3
SPRABERRY OVERVIEW
4
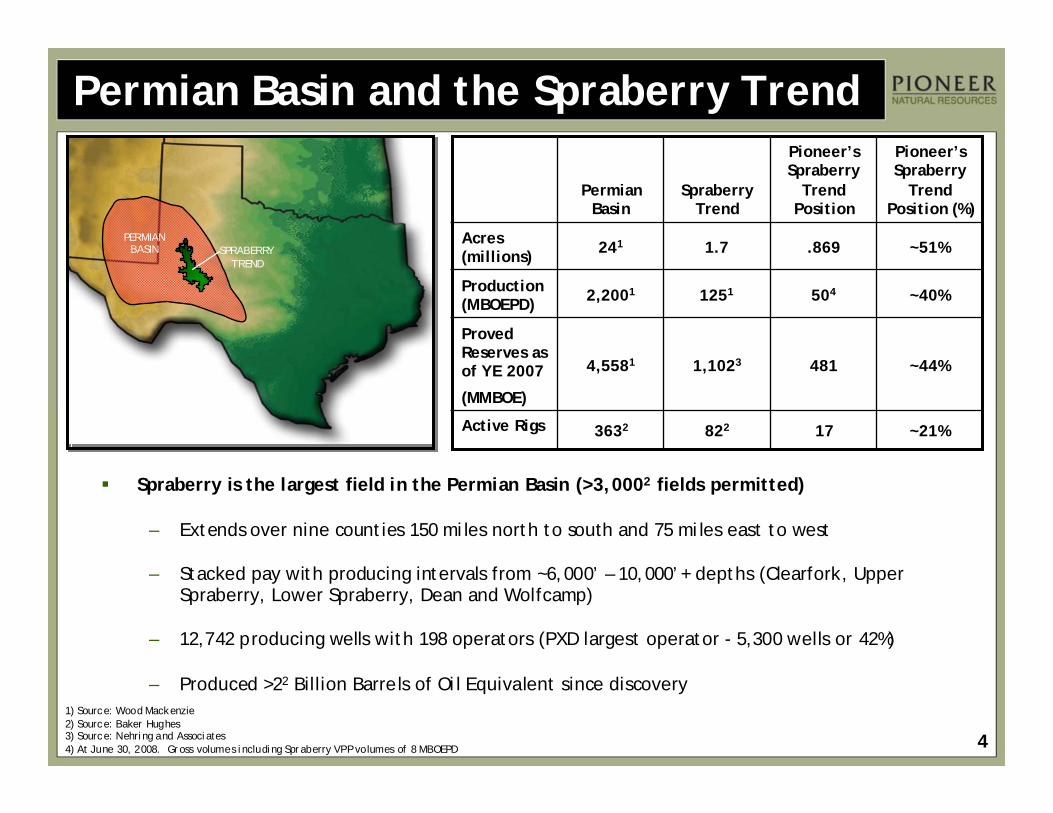
Permian Basin and the Spraberry Trend
~21%178223632Active Rigs
~44%
~40%
~51%
Pioneer’s Spraberry
Trend Position (%)
481
504
.869
Pioneer’s Spraberry
Trend Position
1,10234,5581
Proved Reserves as of YE 2007
(MMBOE)
12512,2001Production (MBOEPD)
1.7241Acres (millions)
Spraberry Trend
Permian Basin
Spraberry is the largest field in the Permian Basin (>3,0002 fields permitted)
– Extends over nine counties 150 miles north to south and 75 miles east to west
– Stacked pay with producing intervals from ~6,000’ – 10,000’+ depths (Clearfork, Upper Spraberry, Lower Spraberry, Dean and Wolfcamp)
– 12,742 producing wells with 198 operators (PXD largest operator - 5,300 wells or 42%)
– Produced >22 Billion Barrels of Oil Equivalent since discovery1) Source: Wood Mackenzie2) Source: Baker Hughes3) Source: Nehring and Associates 4) At June 30, 2008. Gross volumes including Spraberry VPP volumes of 8 MBOEPD
PERMIAN BASIN SPRABERRY
TREND
5
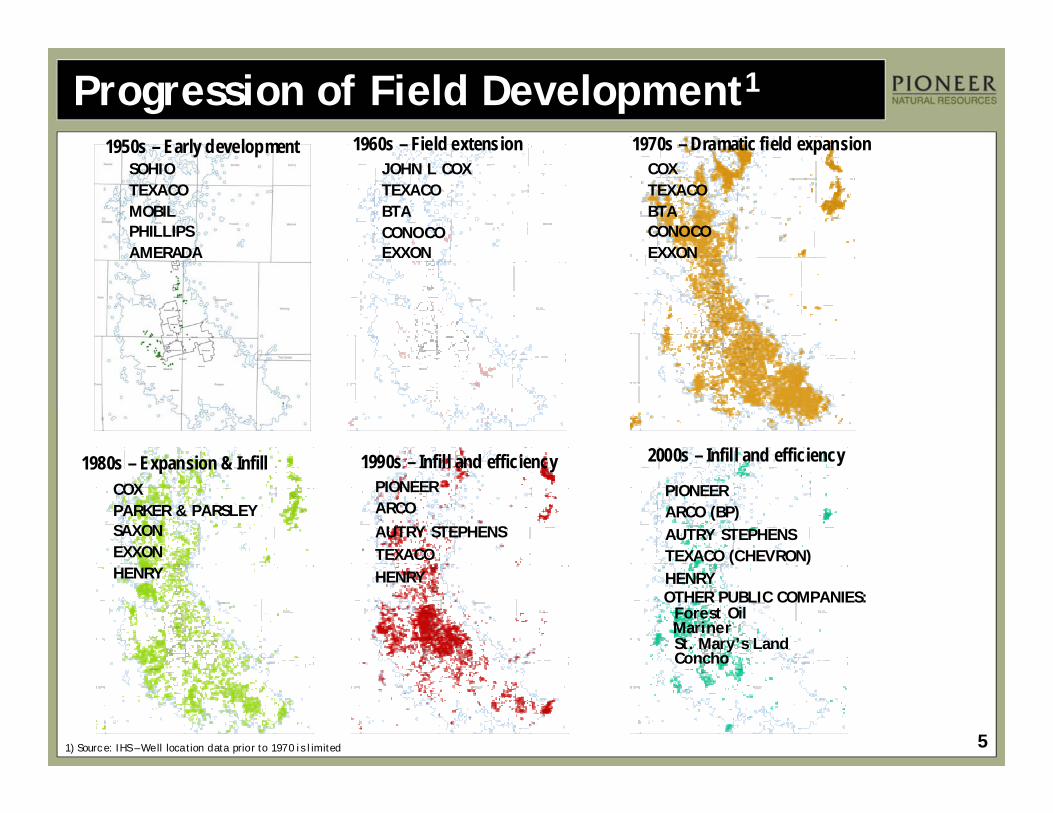
1950s – Early developmentSOHIOTEXACOMOBILPHILLIPSAMERADA
1960s – Field extensionJOHN L COXTEXACOBTACONOCOEXXON
1970s – Dramatic field expansionCOXTEXACOBTACONOCOEXXON
1980s – Expansion & InfillCOXPARKER & PARSLEYSAXONEXXONHENRY
1990s – Infill and efficiencyPIONEERARCOAUTRY STEPHENSTEXACOHENRY
2000s – Infill and efficiency
PIONEERARCO (BP)AUTRY STEPHENSTEXACO (CHEVRON)HENRY
Progression of Field Development1
OTHER PUBLIC COMPANIES:Forest OilMarinerSt. Mary’s LandConcho
1) Source: IHS – Well location data prior to 1970 is limited
6
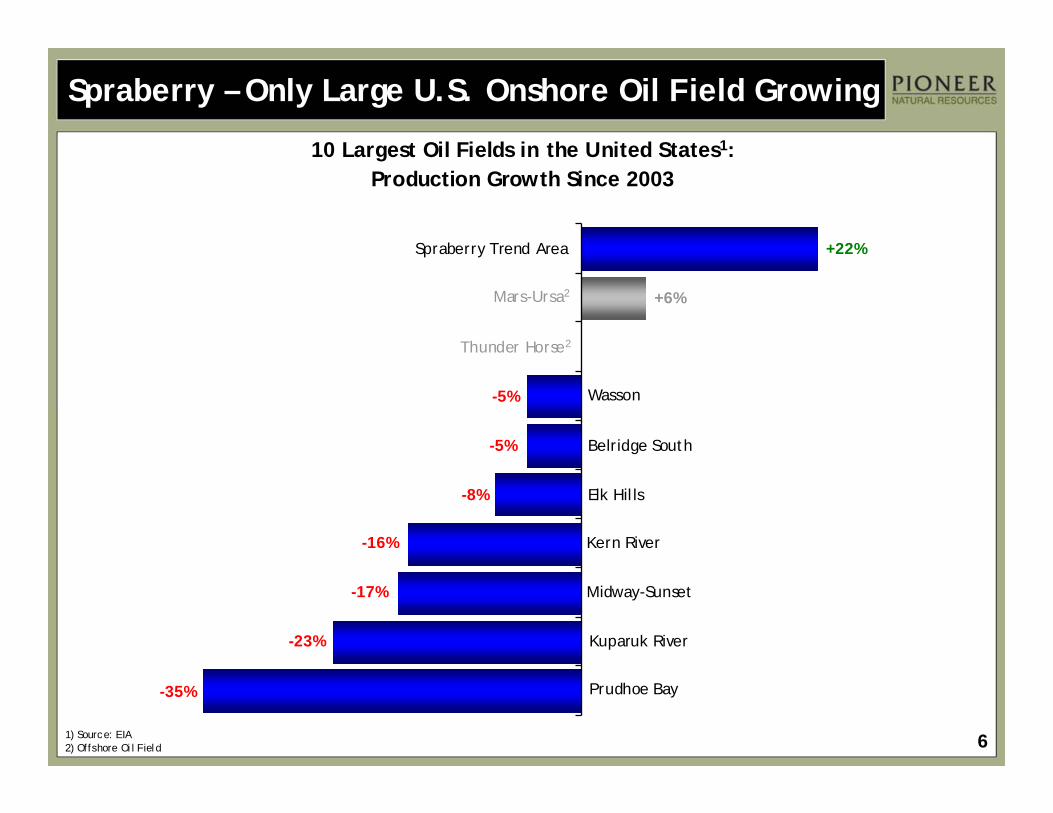
Spraberry – Only Large U.S. Onshore Oil Field Growing
10 Largest Oil Fields in the United States1:Production Growth Since 2003
Spraberry Trend Area
Mars-Ursa2
Thunder Horse2
Wasson
Belridge South
Elk Hills
Kern River
Midway-Sunset
Kuparuk River
Prudhoe Bay
+22%
+6%
-5%
-8%
-16%
-17%
-23%
-35%
1) Source: EIA2) Offshore Oil Field
-5%
7
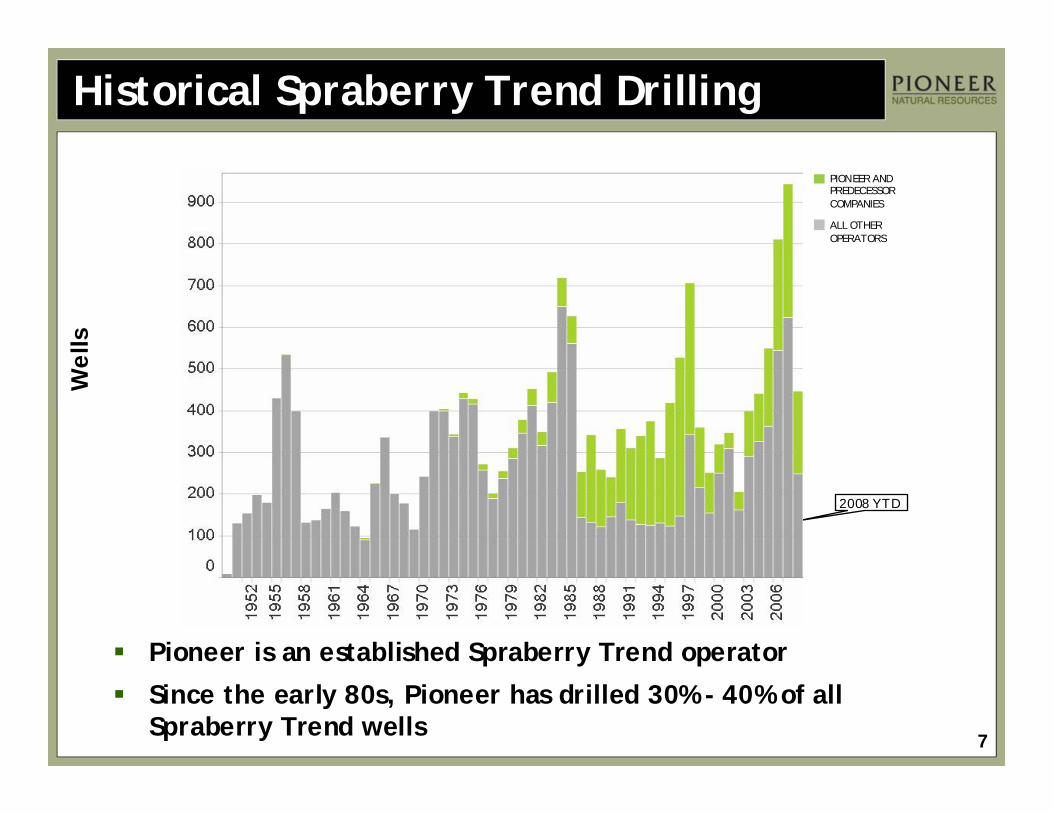
Historical Spraberry Trend Drilling
Pioneer is an established Spraberry Trend operator
Since the early 80s, Pioneer has drilled 30% - 40% of all Spraberry Trend wells
Wel
ls
2008 YTD
PIONEER AND PREDECESSOR COMPANIES
ALL OTHER OPERATORS
8
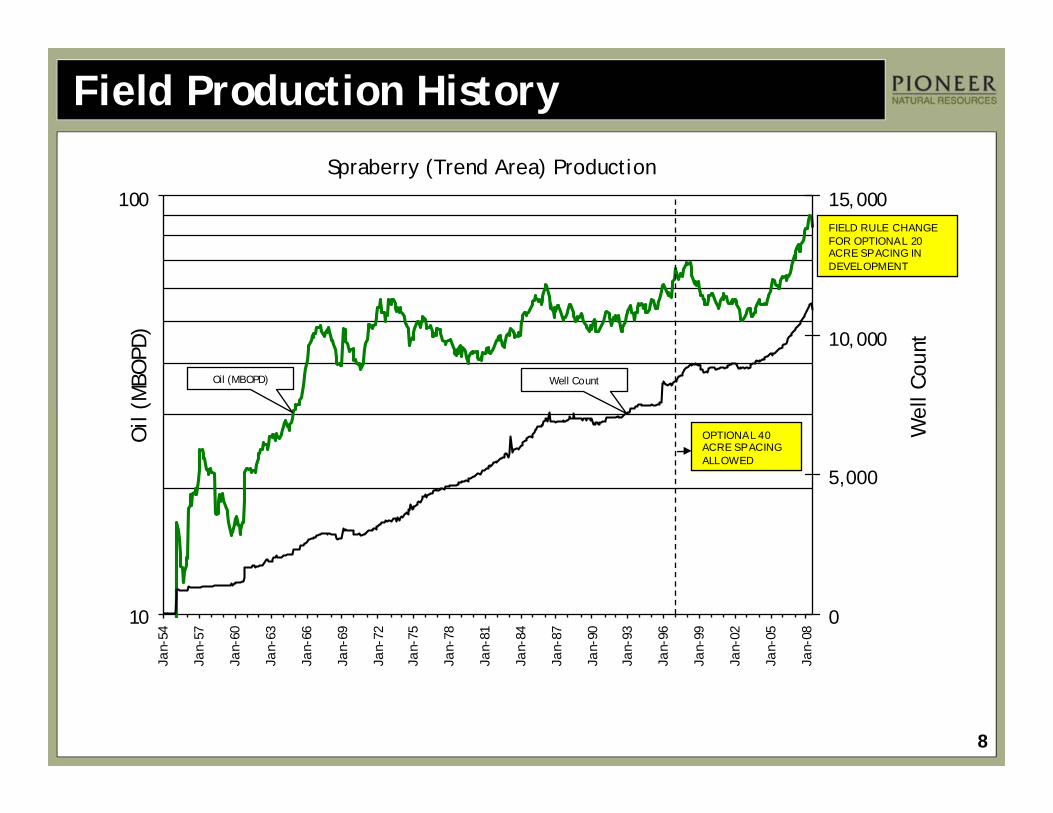
Field Production History
10
100
Jan-
54
Jan-
57
Jan-
60
Jan-
63
Jan-
66
Jan-
69
Jan-
72
Jan-
75
Jan-
78
Jan-
81
Jan-
84
Jan-
87
Jan-
90
Jan-
93
Jan-
96
Jan-
99
Jan-
02
Jan-
05
Jan-
08
0
5,000
10,000
15,000
Spraberry (Trend Area) ProductionO
il (M
BOPD
)
Wel
l Cou
nt
Oil (MBOPD) Well Count
OPTIONAL 40 ACRE SPACING ALLOWED
FIELD RULE CHANGE FOR OPTIONAL 20 ACRE SPACING IN DEVELOPMENT
9
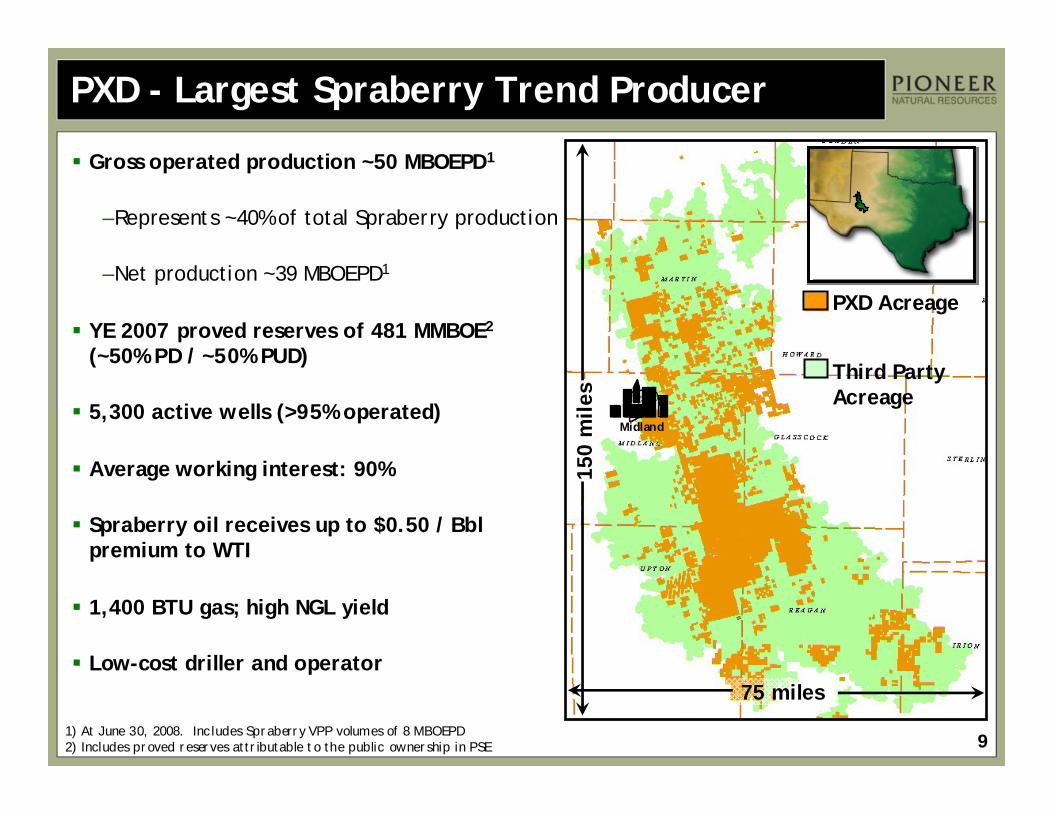
PXD - Largest Spraberry Trend Producer
Gross operated production ~50 MBOEPD1
–Represents ~40% of total Spraberry production
–Net production ~39 MBOEPD1
YE 2007 proved reserves of 481 MMBOE2
(~50% PD / ~50% PUD)
5,300 active wells (>95% operated)
Average working interest: 90%
Spraberry oil receives up to $0.50 / Bbl premium to WTI
1,400 BTU gas; high NGL yield
Low-cost driller and operator
1) At June 30, 2008. Includes Spraberry VPP volumes of 8 MBOEPD2) Includes proved reserves attr ibutable to the public ownership in PSE
Midland
(869,000 gross acres)
PXD Acreage
150
mile
s
75 miles
Third Party Acreage
Midland
10
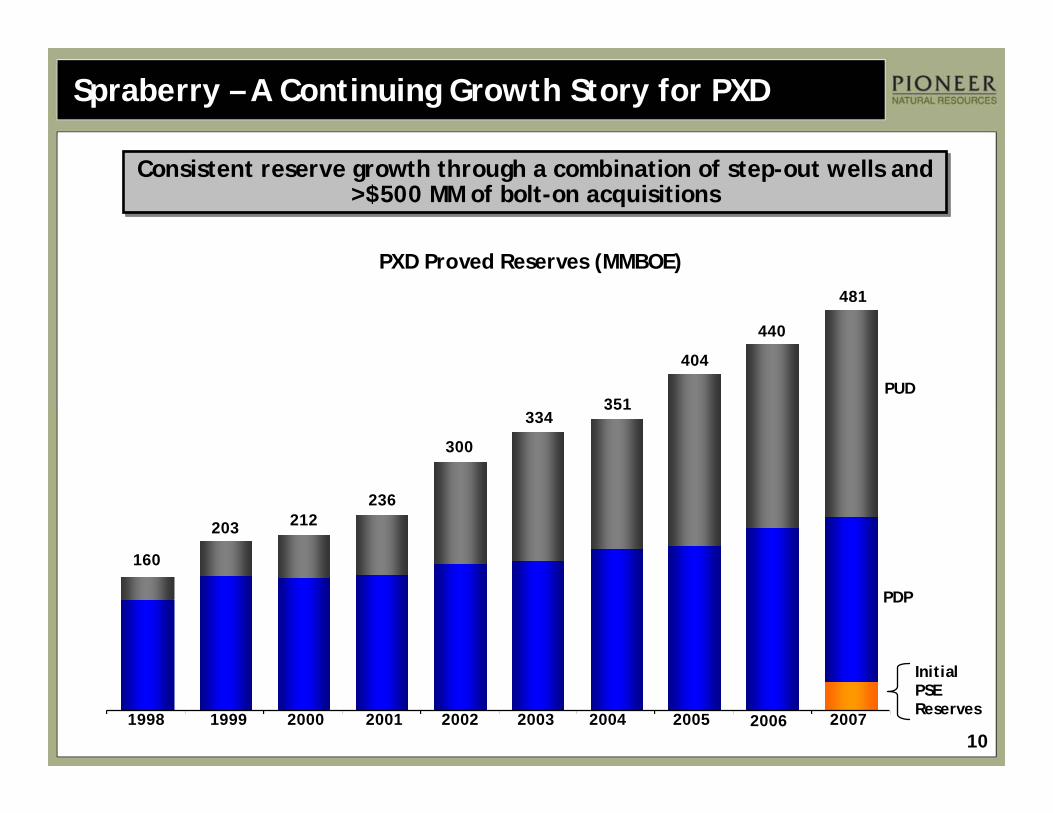
Spraberry – A Continuing Growth Story for PXD
PXD Proved Reserves (MMBOE)
Consistent reserve growth through a combination of step-out wells and >$500 MM of bolt-on acquisitions
Consistent reserve growth through a combination of step-out wells and >$500 MM of bolt-on acquisitions
Initial PSE Reserves
PDP
PUD
20072005200420032001 2002200019991998
440
404
351334
236
300
212203
160
2006
481
11
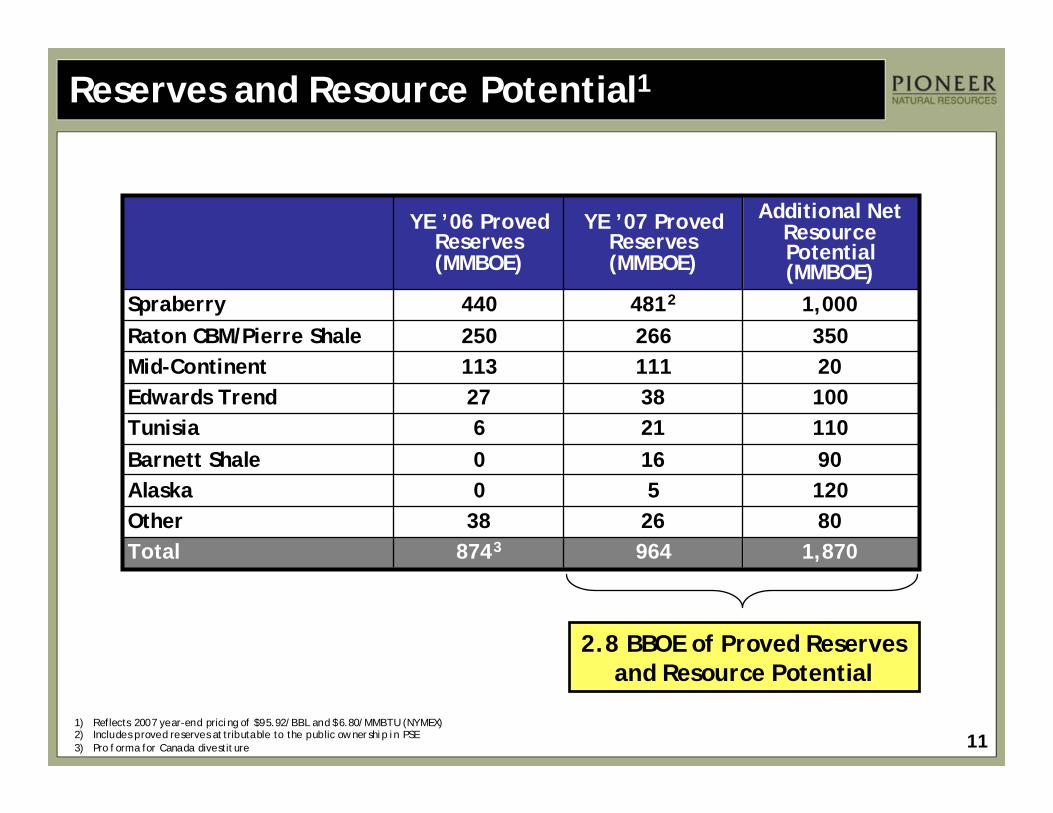
Reserves and Resource Potential1
8743
38006
27113250440
YE ’06 Proved Reserves (MMBOE)
1205Alaska8026Other
964
1621381112664812
YE ’07 Proved Reserves(MMBOE)
1,870Total
Additional Net Resource Potential(MMBOE)
20Mid-Continent
90110100
3501,000
Barnett ShaleTunisiaEdwards Trend
Raton CBM/Pierre ShaleSpraberry
1) Reflects 2007 year-end pricing of $95.92/BBL and $6.80/MMBTU (NYMEX)2) Includes proved reserves attributable to the public ownership in PSE3) Pro forma for Canada divestiture
2.8 BBOE of Proved Reserves and Resource Potential
12
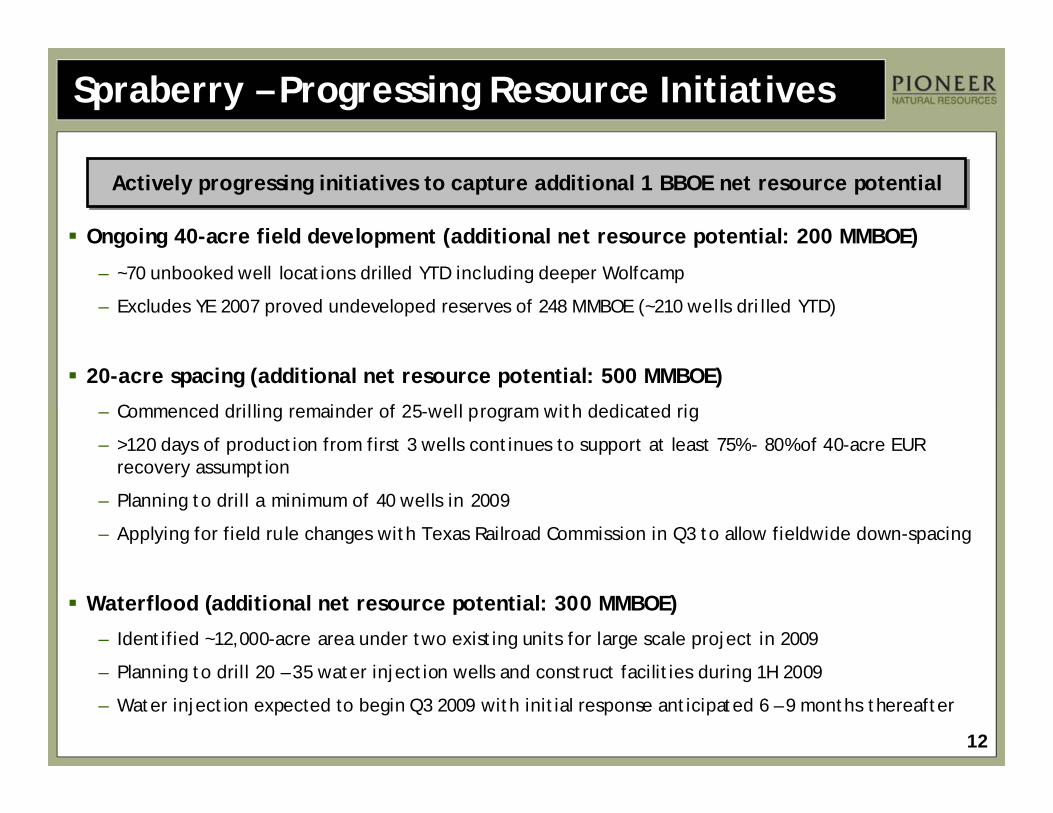
Spraberry – Progressing Resource Initiatives
Ongoing 40-acre field development (additional net resource potential: 200 MMBOE)
– ~70 unbooked well locations drilled YTD including deeper Wolfcamp
– Excludes YE 2007 proved undeveloped reserves of 248 MMBOE (~210 wells drilled YTD)
20-acre spacing (additional net resource potential: 500 MMBOE)
– Commenced drilling remainder of 25-well program with dedicated rig
– >120 days of production from first 3 wells continues to support at least 75% - 80% of 40-acre EUR recovery assumption
– Planning to drill a minimum of 40 wells in 2009
– Applying for field rule changes with Texas Railroad Commission in Q3 to allow fieldwide down-spacing
Waterflood (additional net resource potential: 300 MMBOE)
– Identified ~12,000-acre area under two existing units for large scale project in 2009
– Planning to drill 20 – 35 water injection wells and construct facilities during 1H 2009
– Water injection expected to begin Q3 2009 with initial response anticipated 6 – 9 months thereafter
Actively progressing initiatives to capture additional 1 BBOE net resource potentialActively progressing initiatives to capture additional 1 BBOE net resource potential
13
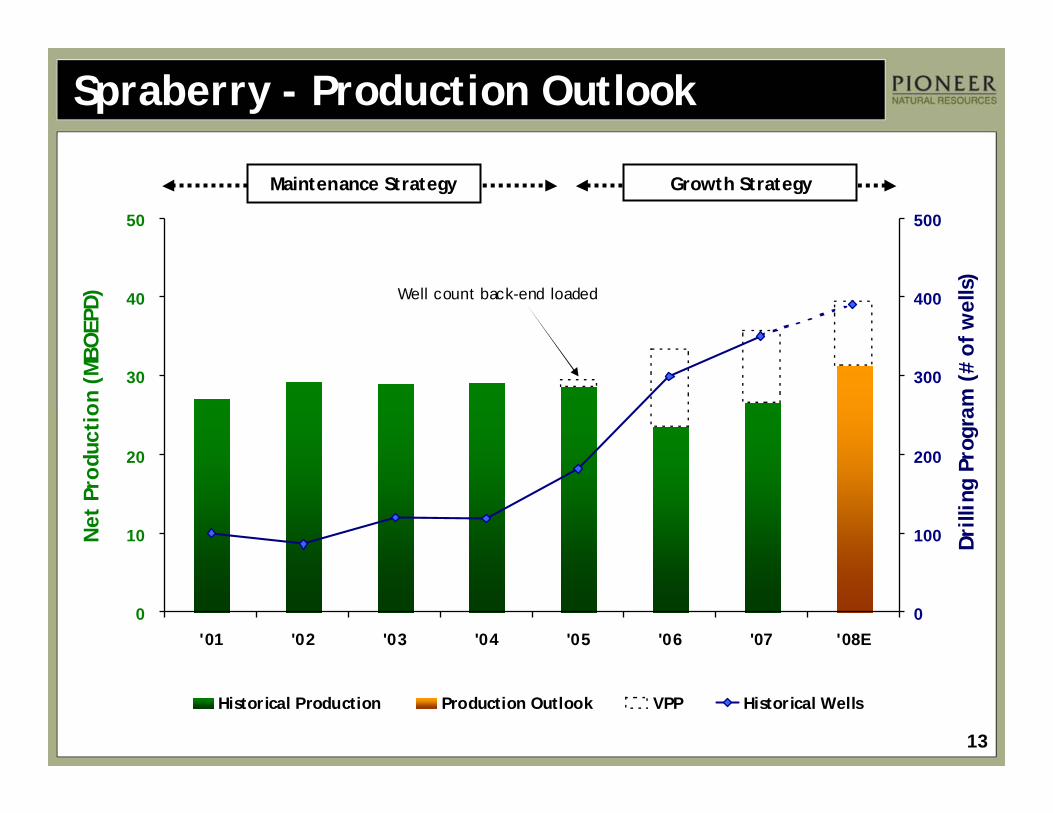
Spraberry - Production Outlook
0
10
20
30
40
50
'01 '02 '03 '04 '05 '06 '07 '08E0
100
200
300
400
500
Historical Production Production Outlook VPP Historical Wells
Net
Pro
duct
ion
(MBO
EPD)
Dri
lling
Pro
gram
(#
of
wel
ls)
Maintenance Strategy
Well count back-end loaded
Growth Strategy
14
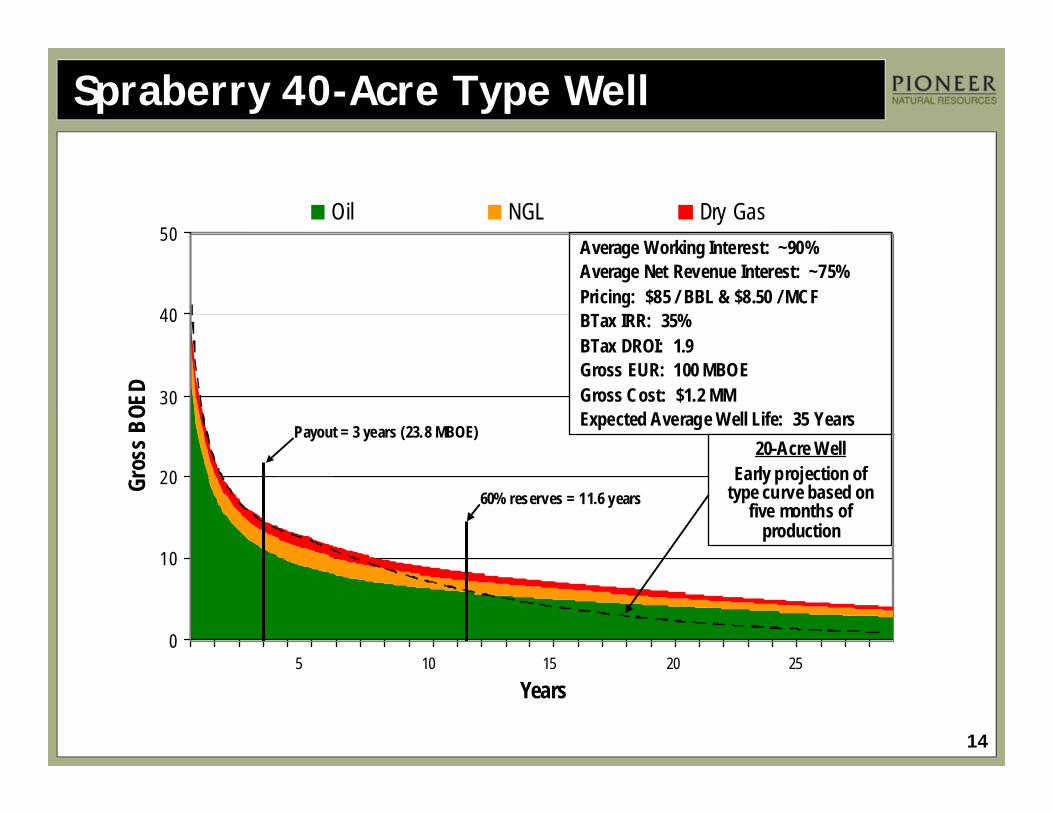
Spraberry 40-Acre Type Well
0
10
20
30
40
50
Years
Gros
s BOE
D
Oil NGL Dry Gas
Payout = 3 years (23.8 MBOE)
5 10 15 20 25
Average Working Interest: ~90%Average Net Revenue Interest: ~75% Pricing: $85 / BBL & $8.50 / MCFBTax IRR: 35%BTax DROI: 1.9Gross EUR: 100 MBOEGross Cost: $1.2 MMExpected Average Well Life: 35 Years
60% reserves = 11.6 years
20-Acre WellEarly projection of
type curve based on five months of
production

15
SPRABERRY GEOLOGY
16
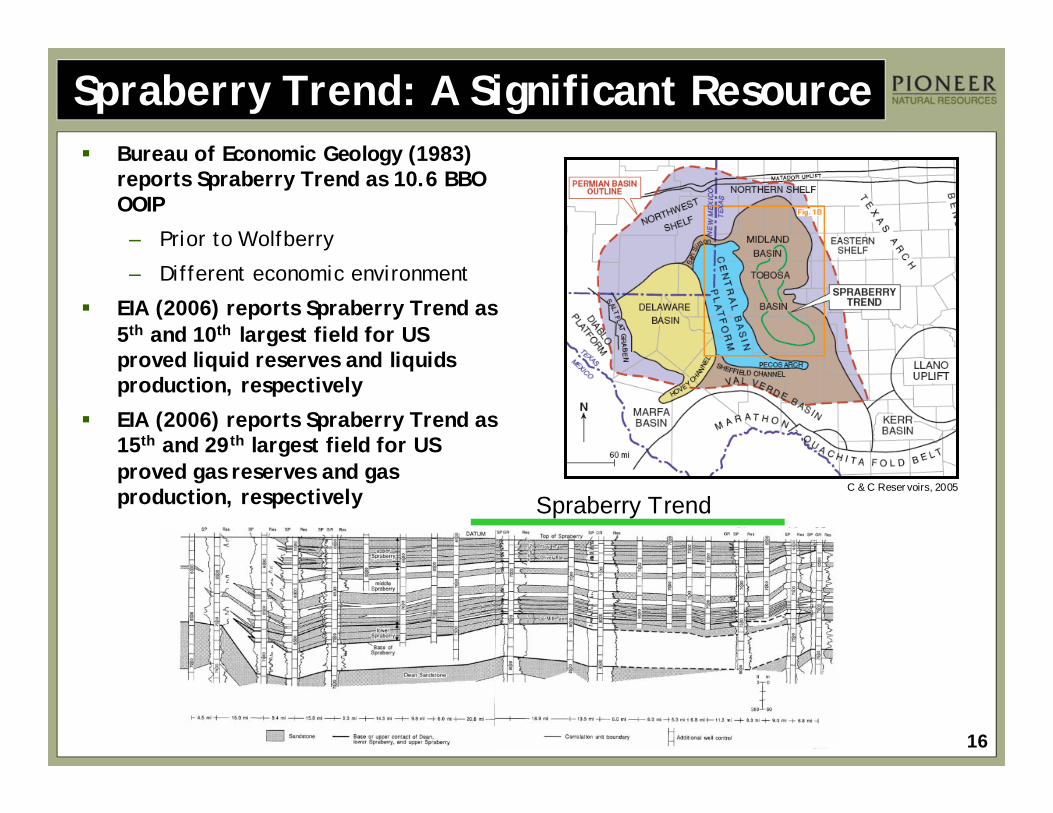
Spraberry Trend: A Significant ResourceBureau of Economic Geology (1983) reports Spraberry Trend as 10.6 BBO OOIP
– Prior to Wolfberry
– Different economic environment
EIA (2006) reports Spraberry Trend as 5th and 10th largest field for US proved liquid reserves and liquids production, respectively
EIA (2006) reports Spraberry Trend as 15th and 29th largest field for US proved gas reserves and gas production, respectively C & C Reser voirs, 2005
Spraberry Trend
17
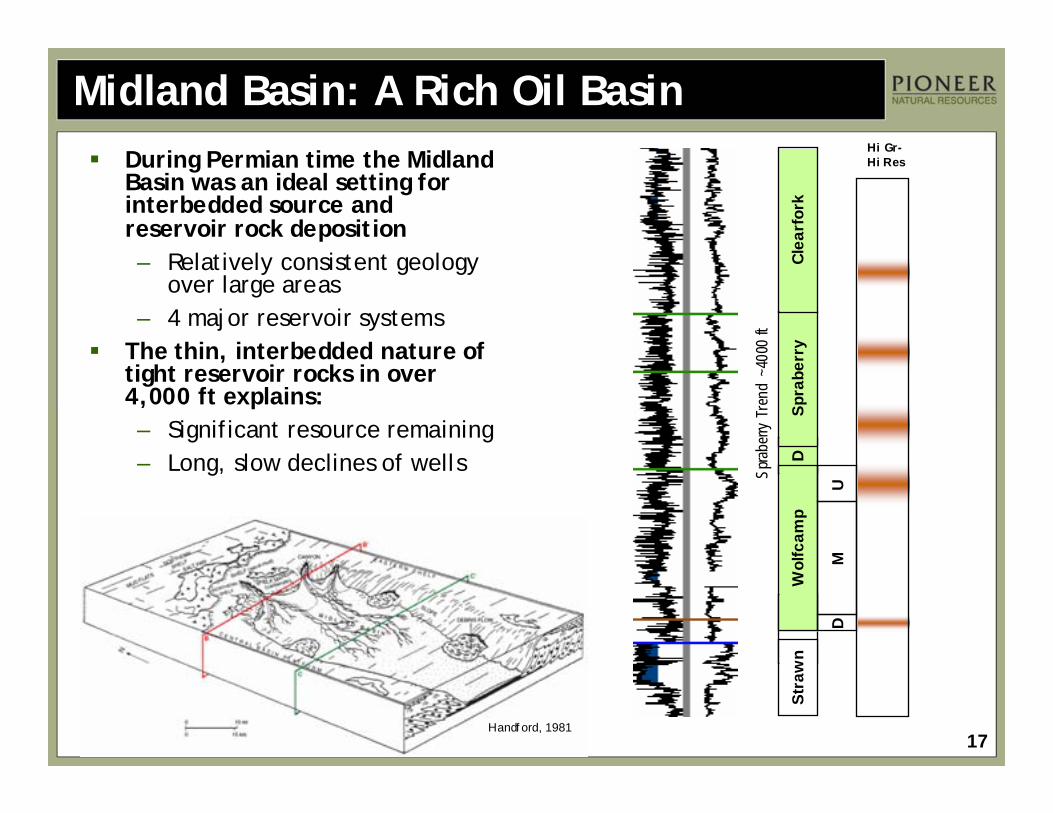
Midland Basin: A Rich Oil BasinDuring Permian time the Midland Basin was an ideal setting for interbedded source and reservoir rock deposition– Relatively consistent geology
over large areas– 4 major reservoir systems
The thin, interbedded nature of tight reservoir rocks in over 4,000 ft explains: – Significant resource remaining– Long, slow declines of wells D
Stra
wn
Wol
fcam
pSp
rabe
rry
Clea
rfor
k
UM
D
Hi Gr-Hi Res
Sprab
erry
Tren
d ~4
000
ft
Handf ord, 1981
18
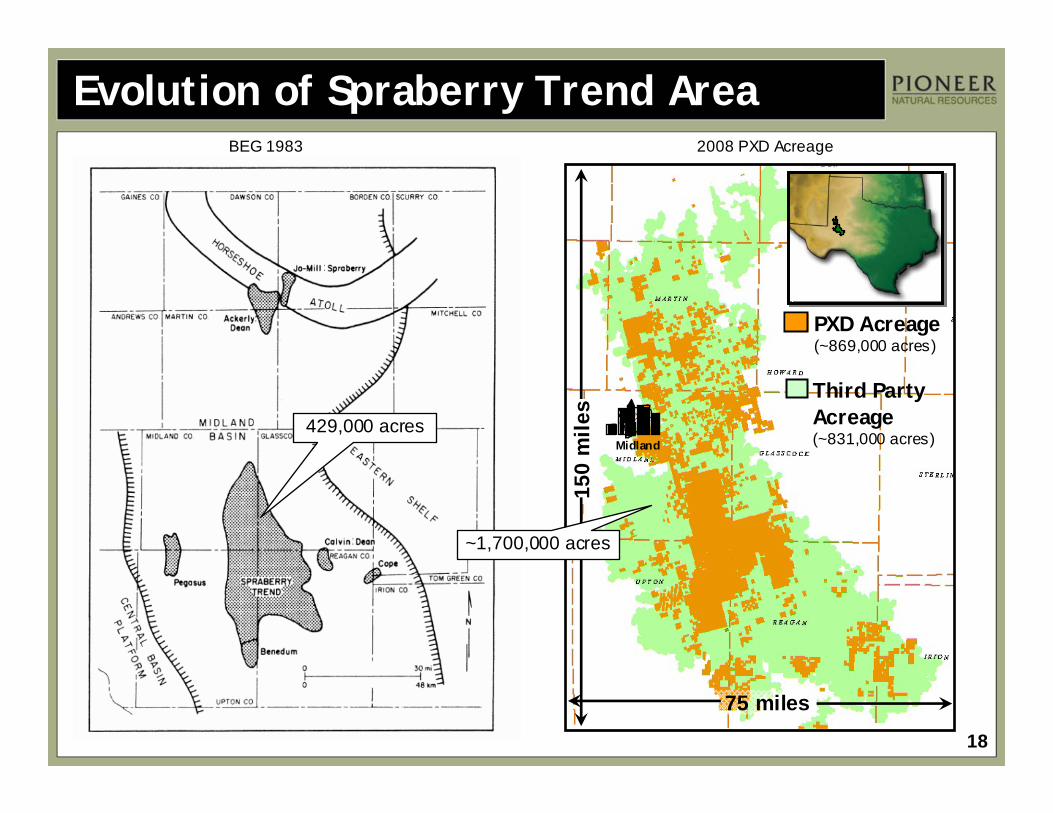
2008 PXD Acreage
Evolution of Spraberry Trend AreaBEG 1983
429,000 acres
PXD Acreage
150
mile
s
75 miles
Third Party Acreage
Midland
(~869,000 acres)
(~831,000 acres)
~1,700,000 acres
19
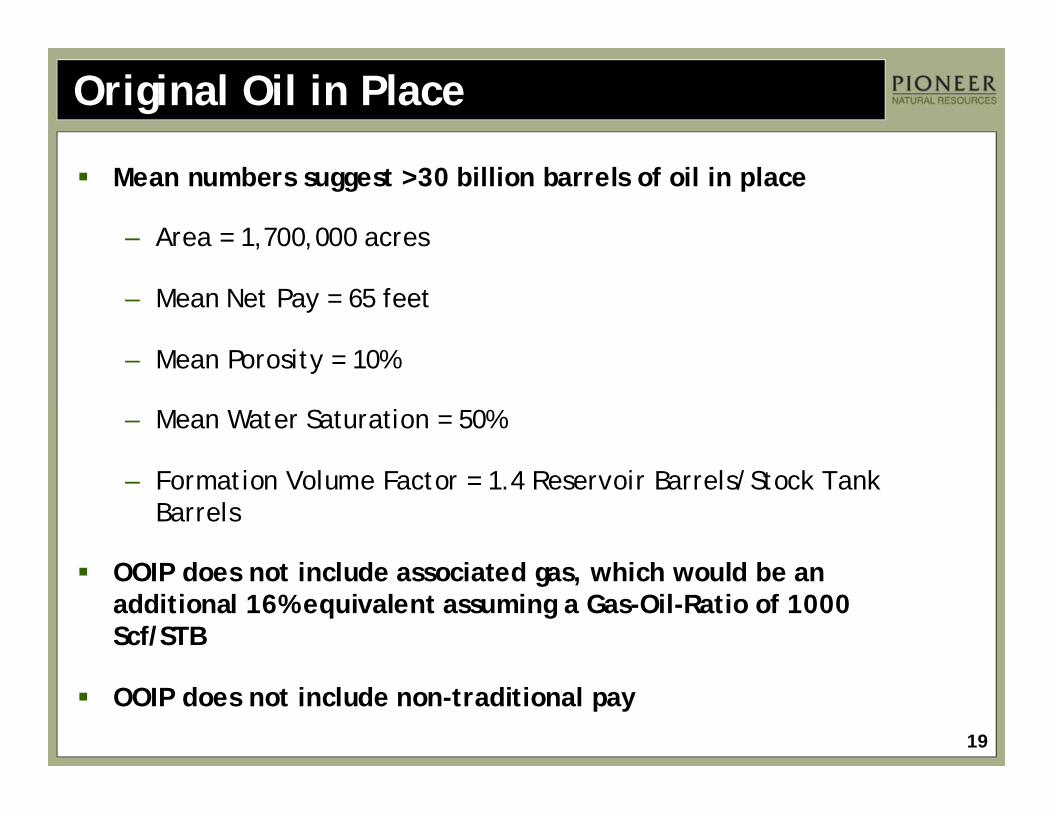
Original Oil in Place
Mean numbers suggest >30 billion barrels of oil in place
– Area = 1,700,000 acres
– Mean Net Pay = 65 feet
– Mean Porosity = 10%
– Mean Water Saturation = 50%
– Formation Volume Factor = 1.4 Reservoir Barrels/Stock Tank Barrels
OOIP does not include associated gas, which would be an additional 16% equivalent assuming a Gas-Oil-Ratio of 1000 Scf/STB
OOIP does not include non-traditional pay
20
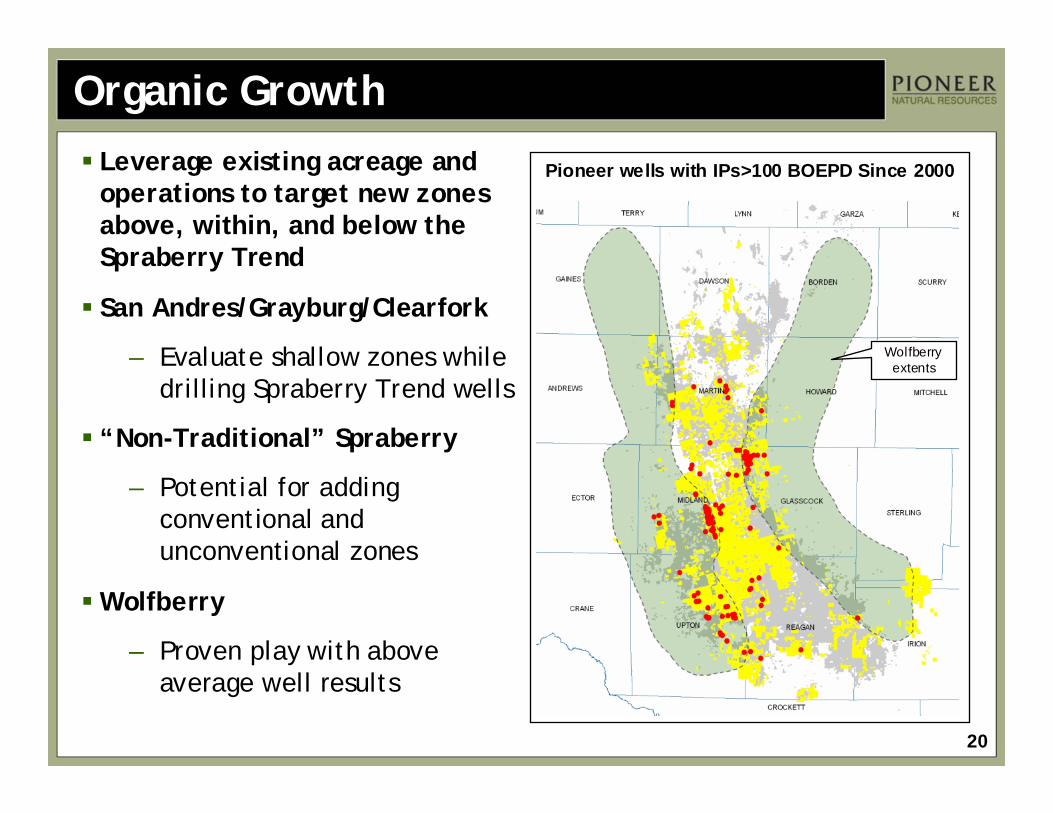
Organic GrowthLeverage existing acreage and operations to target new zones above, within, and below the Spraberry Trend
San Andres/Grayburg/Clearfork
– Evaluate shallow zones while drilling Spraberry Trend wells
“Non-Traditional” Spraberry
– Potential for adding conventional and unconventional zones
Wolfberry
– Proven play with above average well results
Wolfberry extents
Pioneer wells with IPs>100 BOEPD Since 2000
21
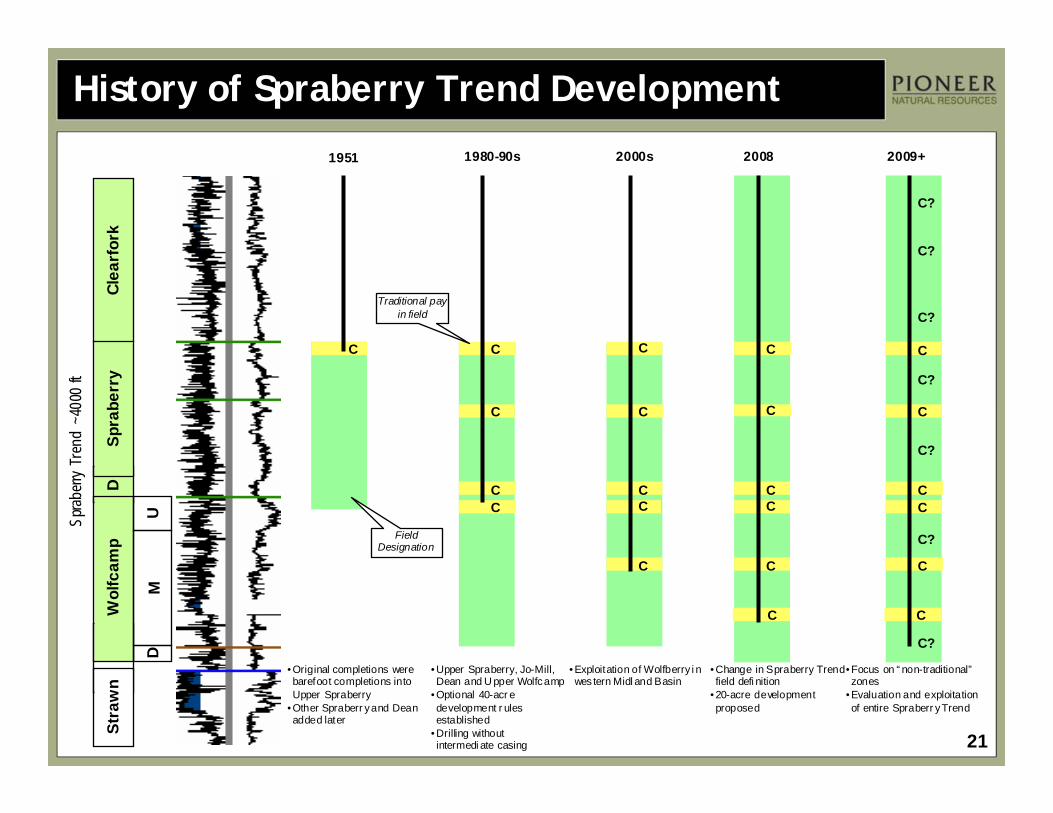
History of Spraberry Trend DevelopmentD
Stra
wn
Wol
fcam
pSp
rabe
rry
Clea
rfor
k
UM
D
Sprab
erry
Tren
d ~4
000
ft
C
1951
C
1980-90s
C
CC
C
C
CC
2000s
• Exploitation of Wolfberry i n wes tern Midl and Basin
C
2008
• Change in Spraberry Trend field defi nition
• 20-acre development proposed
2009+
• Upper Spraberry, Jo-Mill, Dean and U pper Wolfcamp
• Optional 40-acr e development r ules established
• Drilling without intermedi ate casing
• Focus on “ non-traditional”zones
• Evaluation and exploitation of entire Spraberr y Trend
• Original completions were barefoot completions into Upper Spraberry
• Other Spraberr y and Dean added later
C
C
CC
C
C
C
C
CC
C
C
C?
C?
C?
C?
C?
C?
Traditional pay in field
Field Designation
C?
22
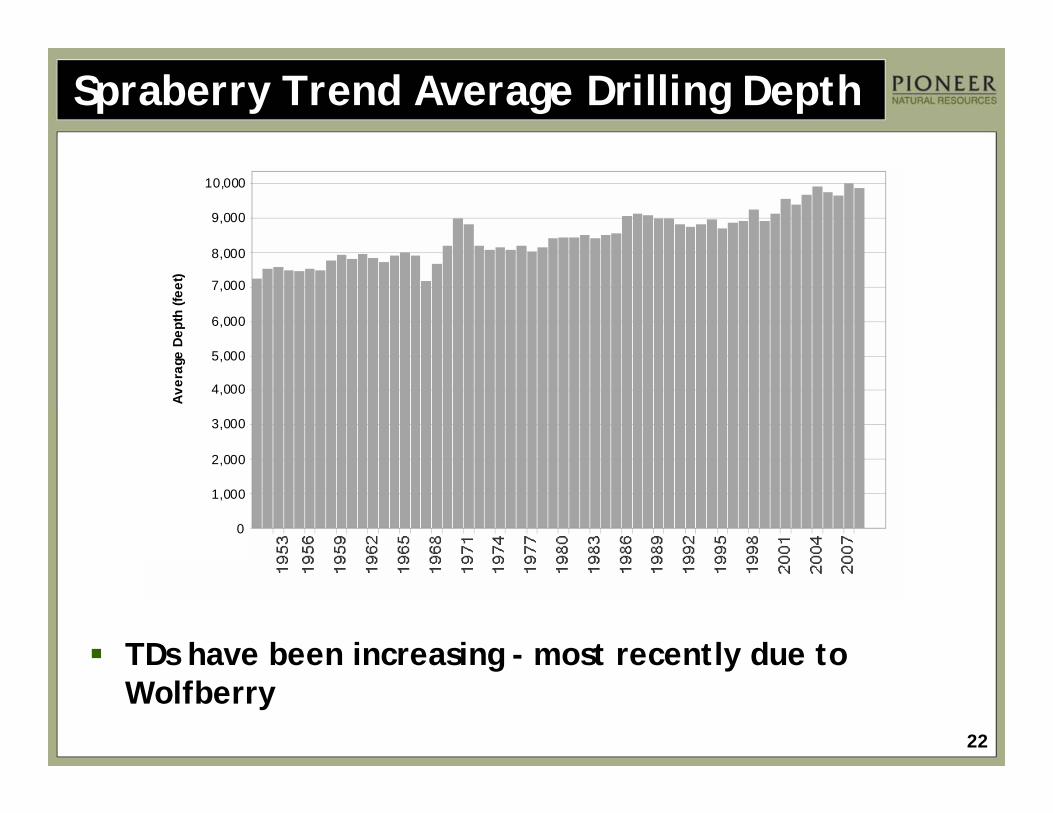
Spraberry Trend Average Drilling Depth
TDs have been increasing - most recently due to Wolfberry
0
1,000
2,000
3,000
4,000
5,000
6,000
7,000
8,000
9,000
10,000A
vera
ge D
epth
(fee
t)
23
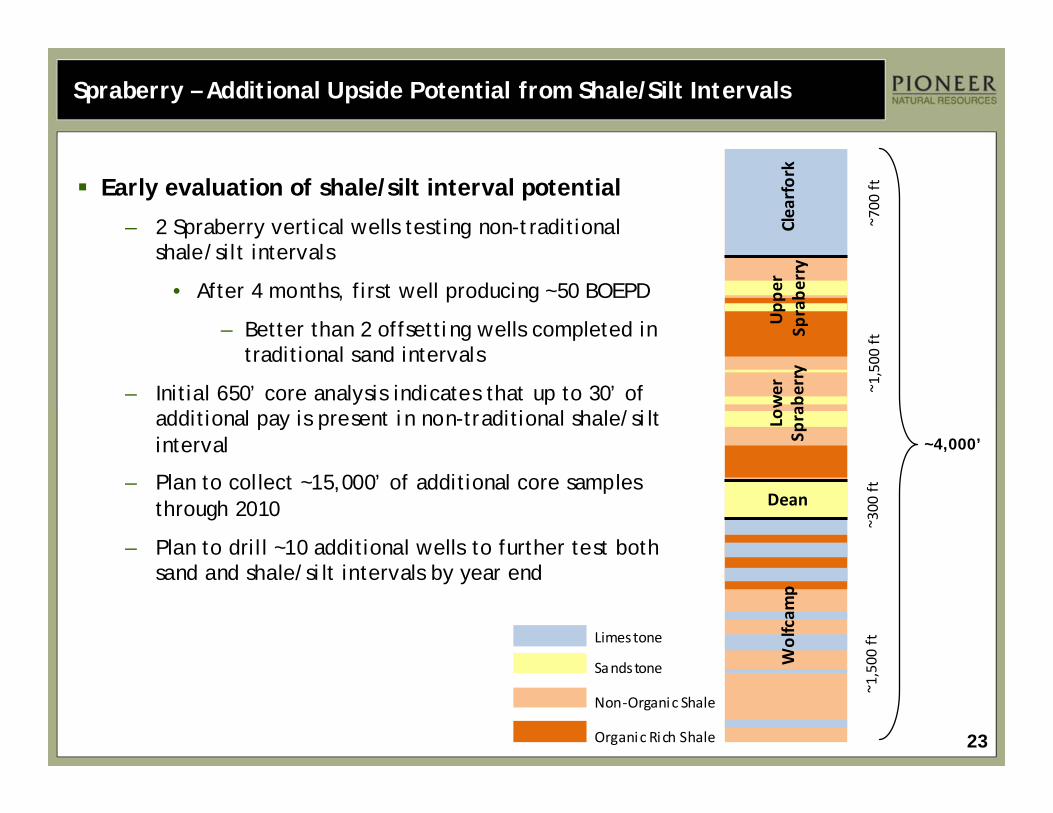
Spraberry Trend
Limestone
Sandstone
Non‐Organic Shale
Organic Rich Shale
~700
ft
~1,500
ft
Clearfork
Dean
Upp
er
Sprabe
rry
Wolfcam
p
~300
ft
~1,500
ft
~4,000’
Early evaluation of shale/silt interval potential
– 2 Spraberry vertical wells testing non-traditional shale/silt intervals
• After 4 months, first well producing ~50 BOEPD
– Better than 2 offsetting wells completed in traditional sand intervals
– Initial 650’ core analysis indicates that up to 30’ of additional pay is present in non-traditional shale/silt interval
– Plan to collect ~15,000’ of additional core samples through 2010
– Plan to drill ~10 additional wells to further test both sand and shale/silt intervals by year end
Spraberry – Additional Upside Potential from Shale/Silt Intervals
Lower
Sprabe
rry
24
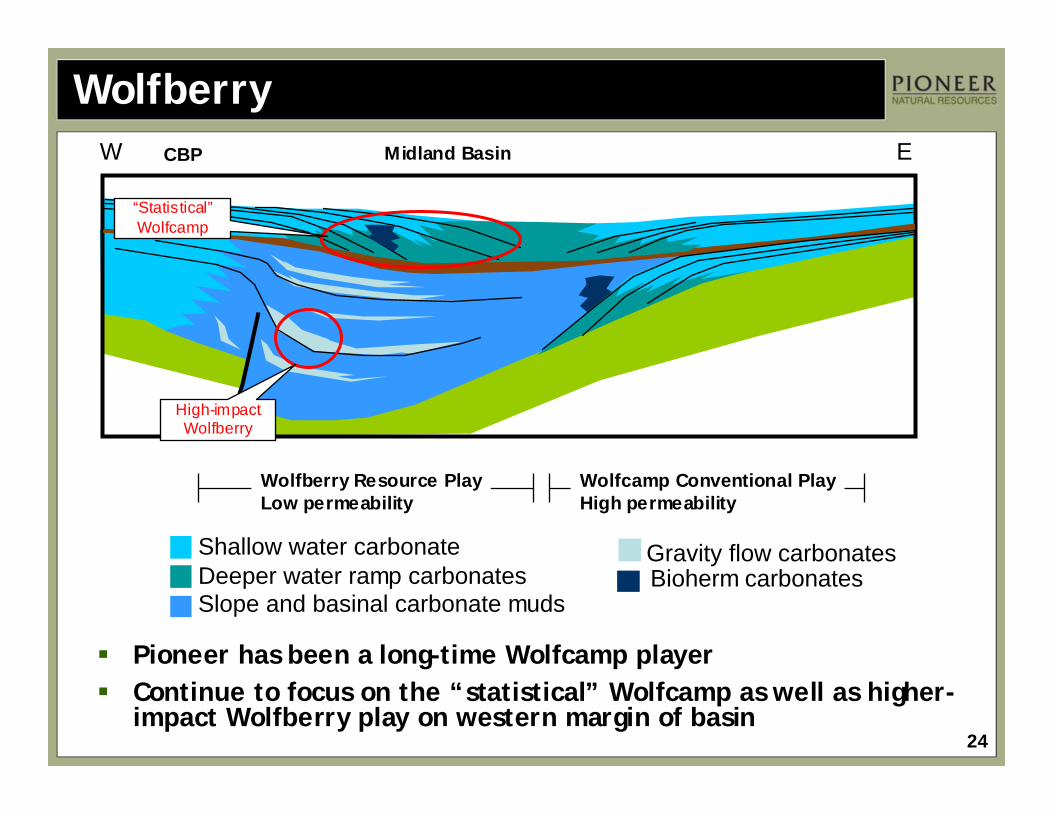
Shallow water carbonate
Slope and basinal carbonate mudsDeeper water ramp carbonates Bioherm carbonates
WolfberryW EMidland BasinCBP
Wolfberry Resource PlayLow permeability
Wolfcamp Conventional PlayHigh permeability
High-impact Wolfberry
“Statistical”Wolfcamp
Gravity flow carbonates
Pioneer has been a long-time Wolfcamp playerContinue to focus on the “statistical” Wolfcamp as well as higher-impact Wolfberry play on western margin of basin
25
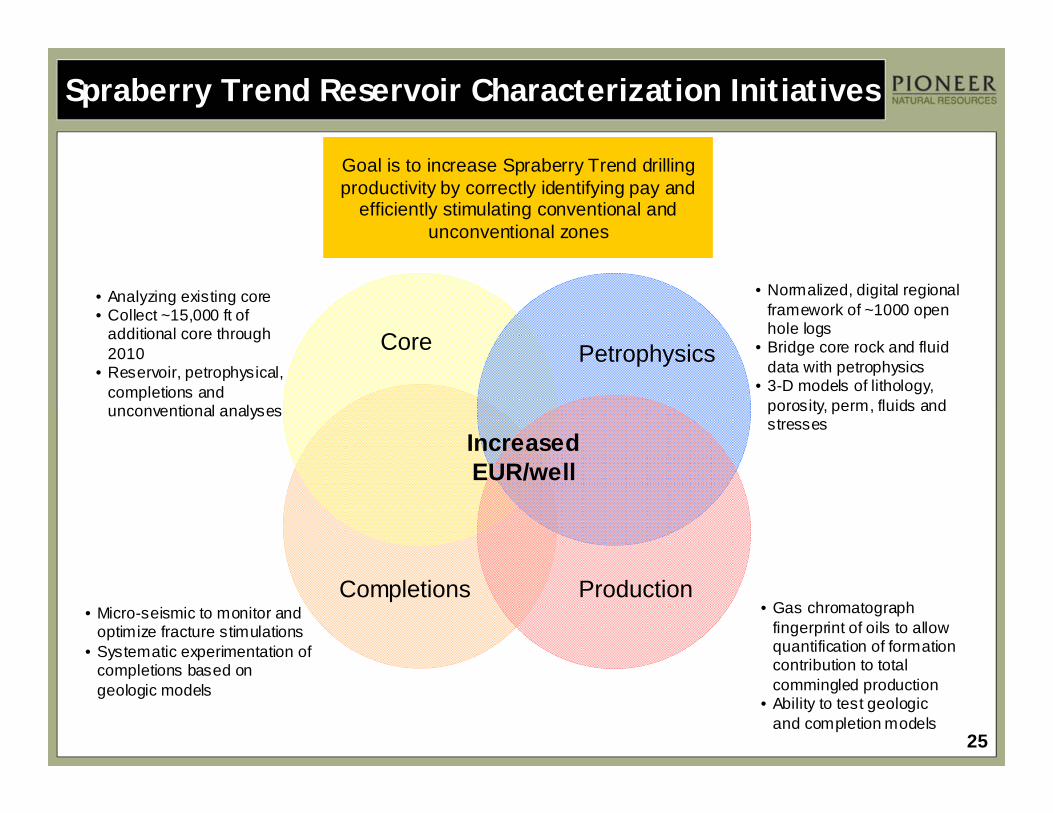
Spraberry Trend Reservoir Characterization Initiatives
IncreasedEUR/well
Core Petrophysics
ProductionCompletions
• Analyzing existing core• Collect ~15,000 ft of
additional core through 2010
• Reservoir, petrophysical, completions and unconventional analyses
• Normalized, digital regional framework of ~1000 open hole logs
• Bridge core rock and fluid data with petrophysics
• 3-D models of lithology, porosity, perm, fluids and stresses
• Gas chromatograph fingerprint of oils to allow quantification of formation contribution to total commingled production
• Ability to test geologic and completion models
• Micro-seismic to monitor and optimize fracture stimulations
• Systematic experimentation of completions based on geologic models
Goal is to increase Spraberry Trend drilling productivity by correctly identifying pay and
efficiently stimulating conventional and unconventional zones
26
SPRABERRY OPERATIONS
27
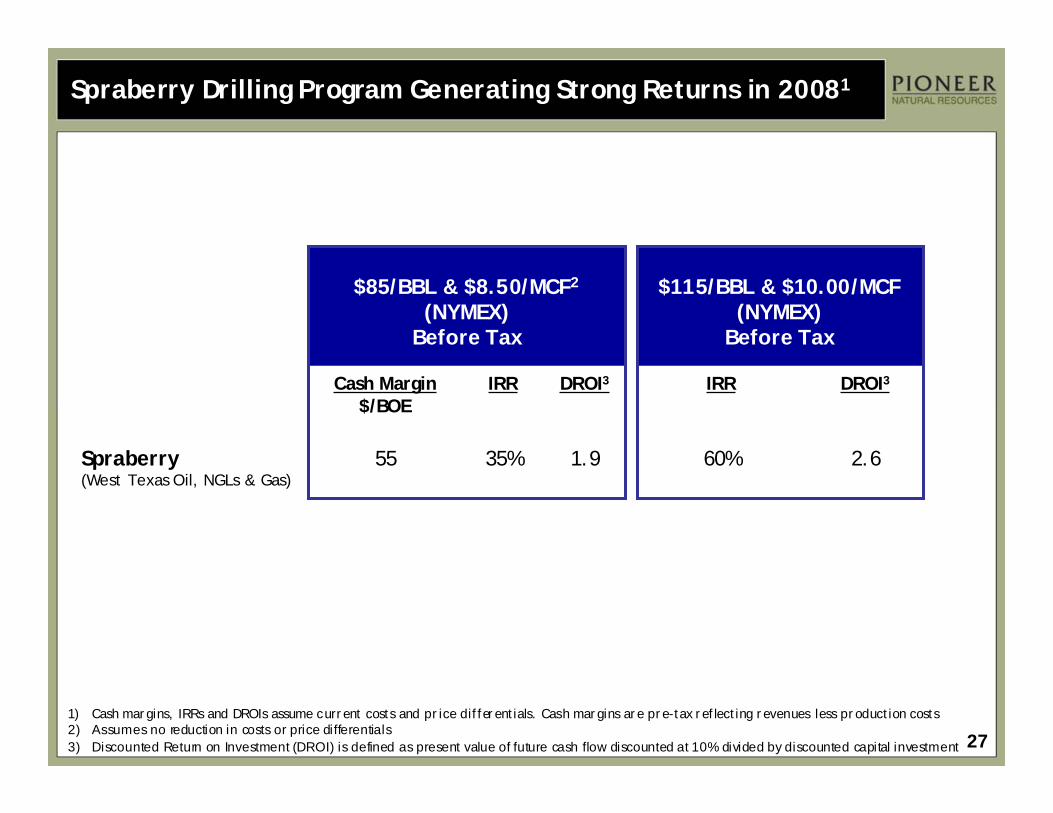
Spraberry Drilling Program Generating Strong Returns in 20081
60%
IRR
$115/BBL & $10.00/MCF (NYMEX)
Before Tax
2.6
DROI3
55
Cash Margin$/BOE
$85/BBL & $8.50/MCF2
(NYMEX)Before Tax
35%
IRR
1.9
DROI3
Spraberry (West Texas Oil, NGLs & Gas)
1) Cash margins, IRRs and DROIs assume current costs and pr ice differentials. Cash margins are pre-tax reflecting revenues less production costs2) Assumes no reduction in costs or price differentials3) Discounted Return on Investment (DROI) is defined as present value of future cash flow discounted at 10% divided by discounted capital investment
28
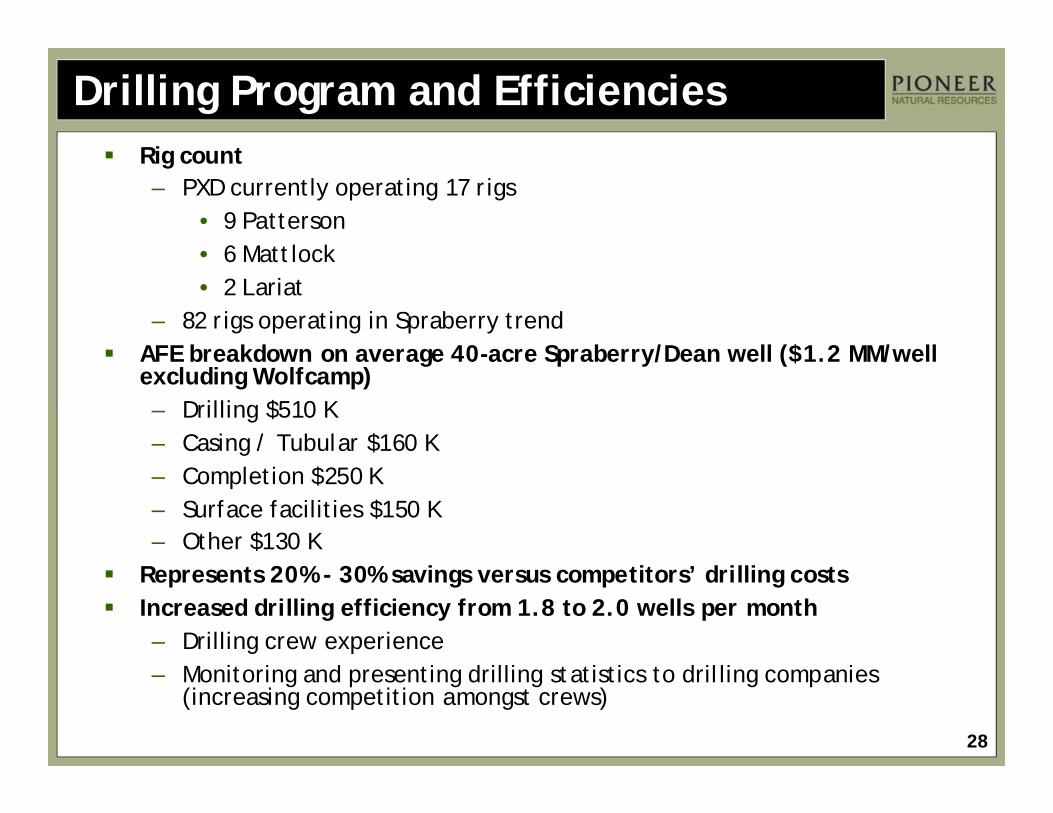
Drilling Program and EfficienciesRig count– PXD currently operating 17 rigs
• 9 Patterson• 6 Mattlock• 2 Lariat
– 82 rigs operating in Spraberry trendAFE breakdown on average 40-acre Spraberry/Dean well ($1.2 MM/well excluding Wolfcamp)– Drilling $510 K– Casing / Tubular $160 K– Completion $250 K– Surface facilities $150 K– Other $130 K
Represents 20% - 30% savings versus competitors’ drilling costsIncreased drilling efficiency from 1.8 to 2.0 wells per month– Drilling crew experience – Monitoring and presenting drilling statistics to drilling companies
(increasing competition amongst crews)
29
Continuing Focus on Field Optimization
Automation
Route Optimization
Rig Scheduling
Training
API Crude Oil Measurement
Thermography Gas Leak Detection
30
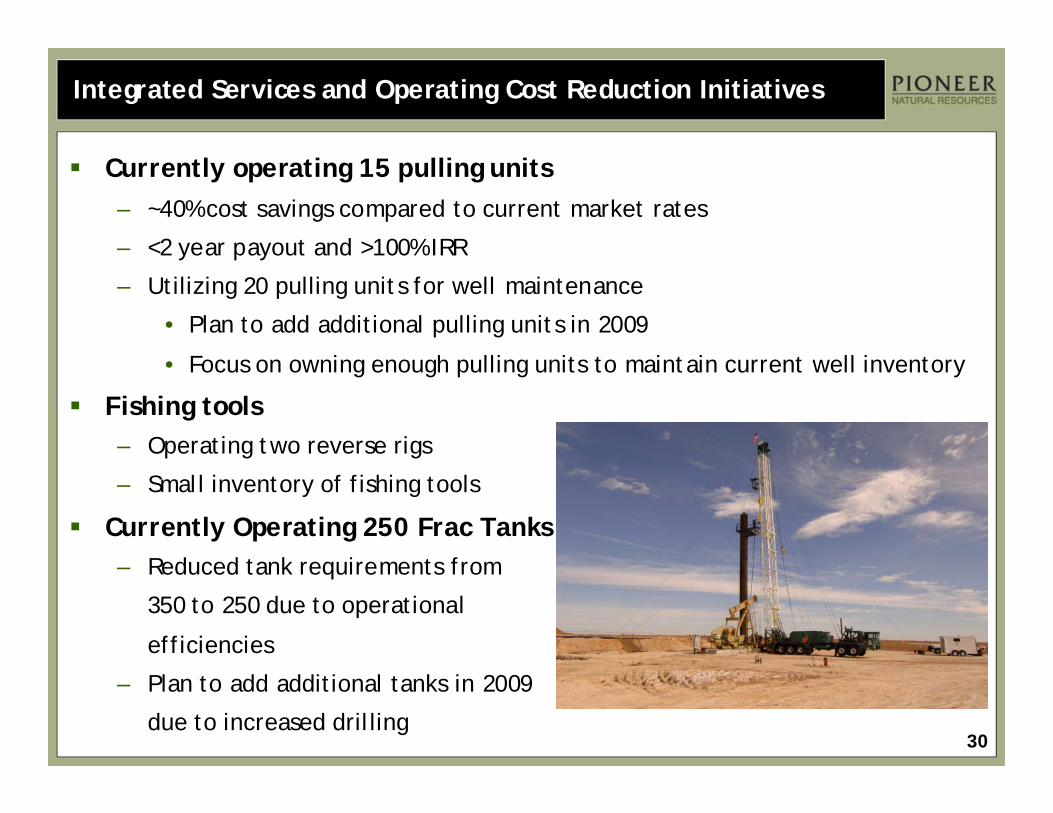
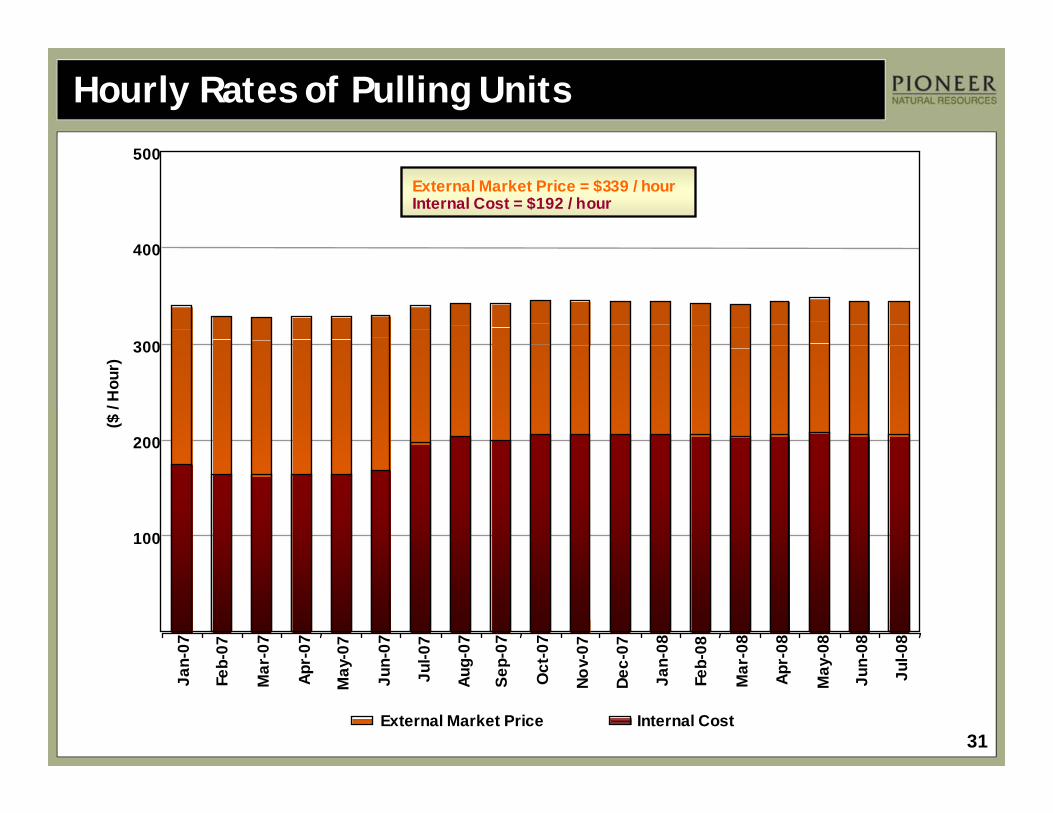
Integrated Services and Operating Cost Reduction Initiatives
Currently operating 15 pulling units– ~40% cost savings compared to current market rates
– <2 year payout and >100% IRR
– Utilizing 20 pulling units for well maintenance
• Plan to add additional pulling units in 2009
• Focus on owning enough pulling units to maintain current well inventory
Fishing tools– Operating two reverse rigs
– Small inventory of fishing tools
Currently Operating 250 Frac Tanks– Reduced tank requirements from
350 to 250 due to operational
efficiencies
– Plan to add additional tanks in 2009
due to increased drilling
31
Hourly Rates of Pulling Units($
/ H
our)
100
200
300
400
500
Jan-
07
Feb-
07
Mar
-07
Apr-
07
May
-07
Jun-
07
Jul-0
7
Aug-
07
Sep-
07
Oct
-07
Nov-
07
Dec-
07
Jan-
08
Feb-
08
Mar
-08
Apr-
08
May
-08
Jun-
08
Jul-0
8
External Market Price Internal Cost
External Market Price = $339 / hourInternal Cost = $192 / hour
32
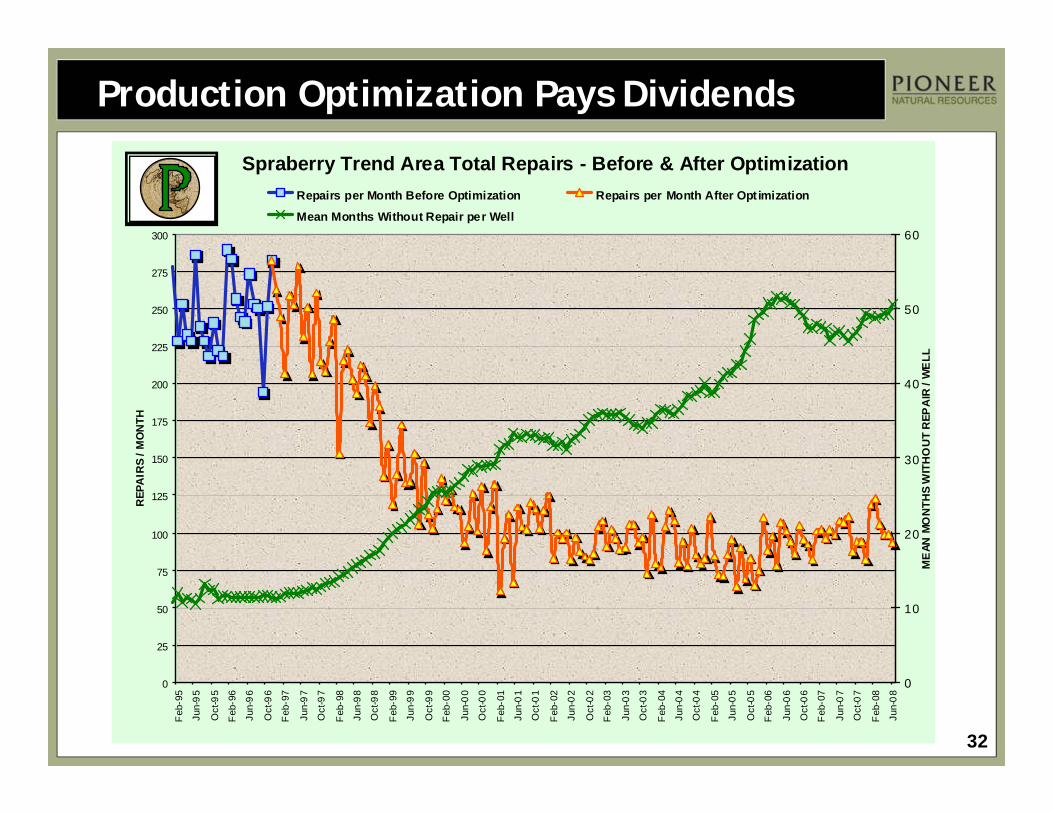
Production Optimization Pays Dividends
Spraberry Trend Area Total Repairs - Before & After Optimization
0
25
50
75
100
125
150
175
200
225
250
275
300
Feb
-95
Jun-
95
Oct
-95
Feb
-96
Jun-
96
Oct
-96
Feb
-97
Jun-
97
Oct
-97
Feb
-98
Jun-
98
Oct
-98
Feb
-99
Jun-
99
Oct
-99
Feb
-00
Jun-
00
Oct
-00
Feb
-01
Jun-
01
Oct
-01
Feb
-02
Jun-
02
Oct
-02
Feb
-03
Jun-
03
Oct
-03
Feb
-04
Jun-
04
Oct
-04
Feb
-05
Jun-
05
Oct
-05
Feb
-06
Jun-
06
Oct
-06
Feb
-07
Jun-
07
Oct
-07
Feb
-08
Jun-
08
REP
AIR
S / M
ON
TH
0
10
20
30
40
50
60
ME
AN M
ON
THS
WIT
HO
UT
REP
AIR
/ W
ELL
Repairs per Month Before Optimization Repairs per Month After Optimization
Mean Months Without Repair per Well

33
SPRABERRY OUTLOOK
34
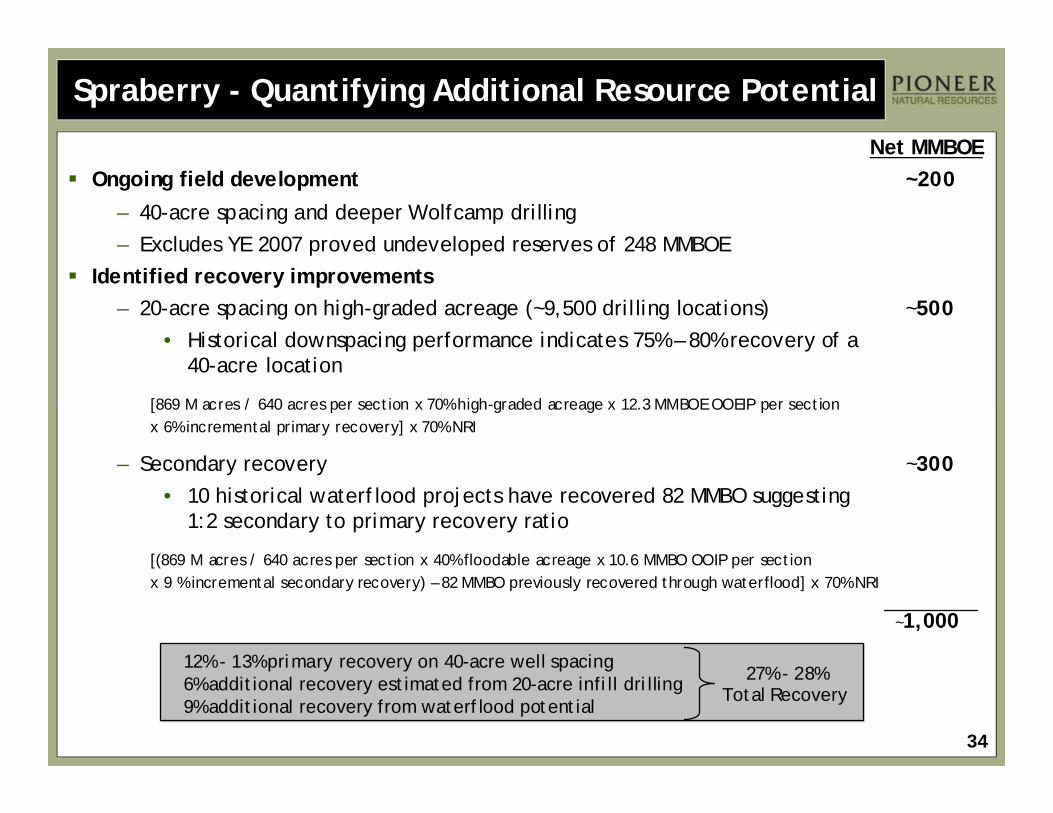
Spraberry - Quantifying Additional Resource Potential
Net MMBOEOngoing field development ~200
– 40-acre spacing and deeper Wolfcamp drilling – Excludes YE 2007 proved undeveloped reserves of 248 MMBOE
Identified recovery improvements– 20-acre spacing on high-graded acreage (~9,500 drilling locations) ~500
• Historical downspacing performance indicates 75% – 80% recovery of a 40-acre location
[869 M acres / 640 acres per section x 70% high-graded acreage x 12.3 MMBOE OOEIP per section x 6% incremental primary recovery] x 70% NRI
– Secondary recovery ~300• 10 historical waterflood projects have recovered 82 MMBO suggesting
1:2 secondary to primary recovery ratio
[(869 M acres / 640 acres per section x 40% floodable acreage x 10.6 MMBO OOIP per section x 9 % incremental secondary recovery) – 82 MMBO previously recovered through waterflood] x 70% NRI
~1,000
12% - 13% primary recovery on 40-acre well spacing6% additional recovery estimated from 20-acre infill drilling9% additional recovery from waterflood potential
27% - 28%Total Recovery
35
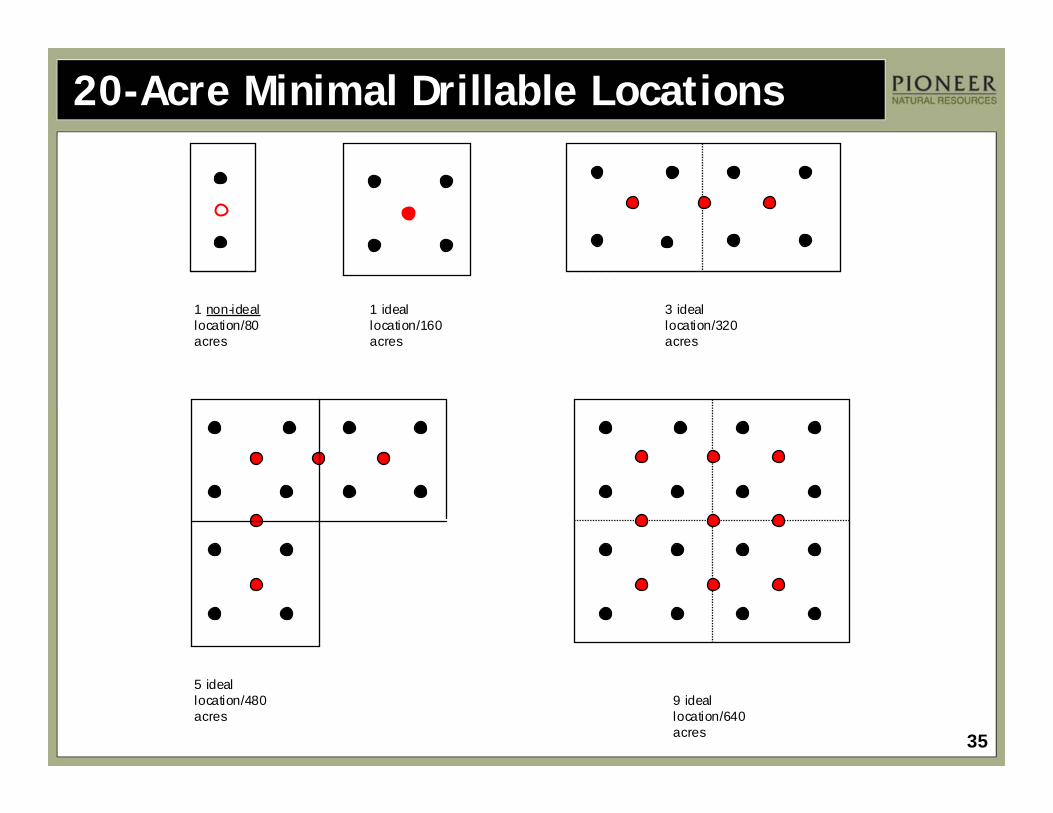
1 non-ideallocation/80 acres
1 ideal location/160 acres
3 ideal location/320acres
5 ideal location/480acres
9 ideal location/640acres
20-Acre Minimal Drillable Locations
36
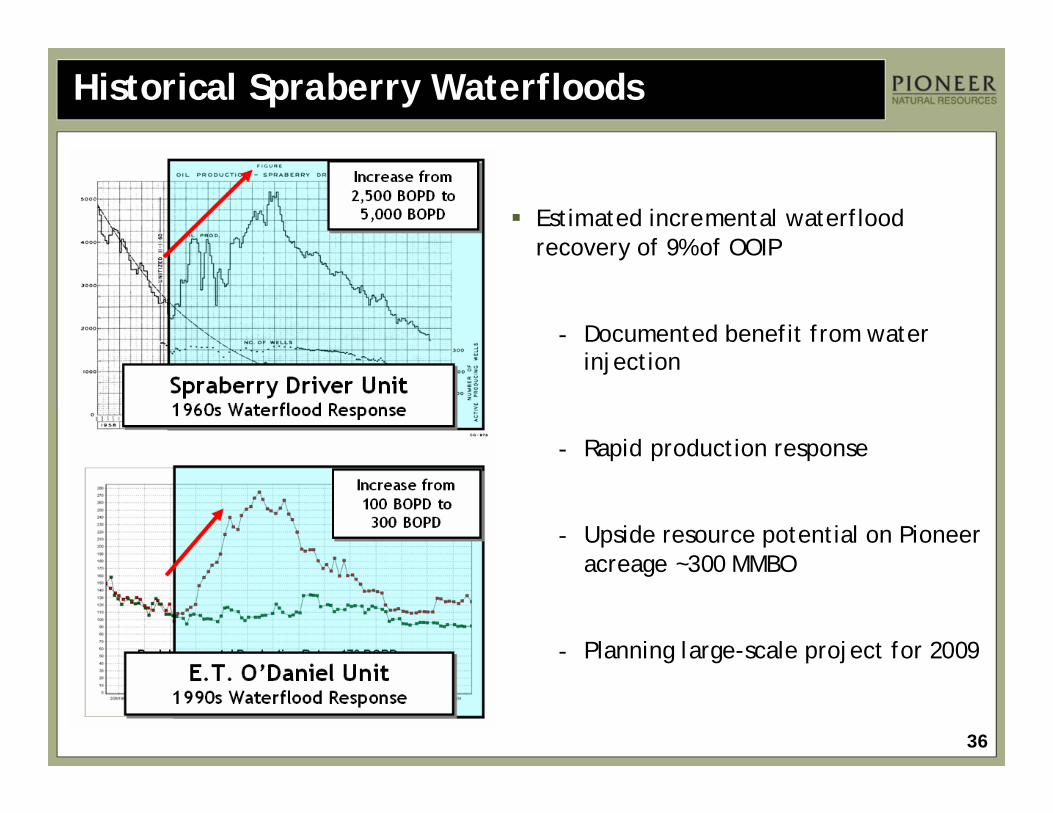
Historical Spraberry Waterfloods
Estimated incremental waterflood recovery of 9% of OOIP
- Documented benefit from water injection
- Rapid production response
- Upside resource potential on Pioneer acreage ~300 MMBO
- Planning large-scale project for 2009

37
Waterflood Design and Implementation
Fracture Trend
Example coverage of 14:1 2-mile ellipses: 2/3 producers on-trend
Implementing new spacing design to take advantage of natural fracture trend and elliptical drainage patterns
Implementing a controlled dump flood technique which won’t require the use of high pressure injection pumps
Injectors will have the ability to be converted to producers and vice-versa
– Ensures optimal injection conformance
38
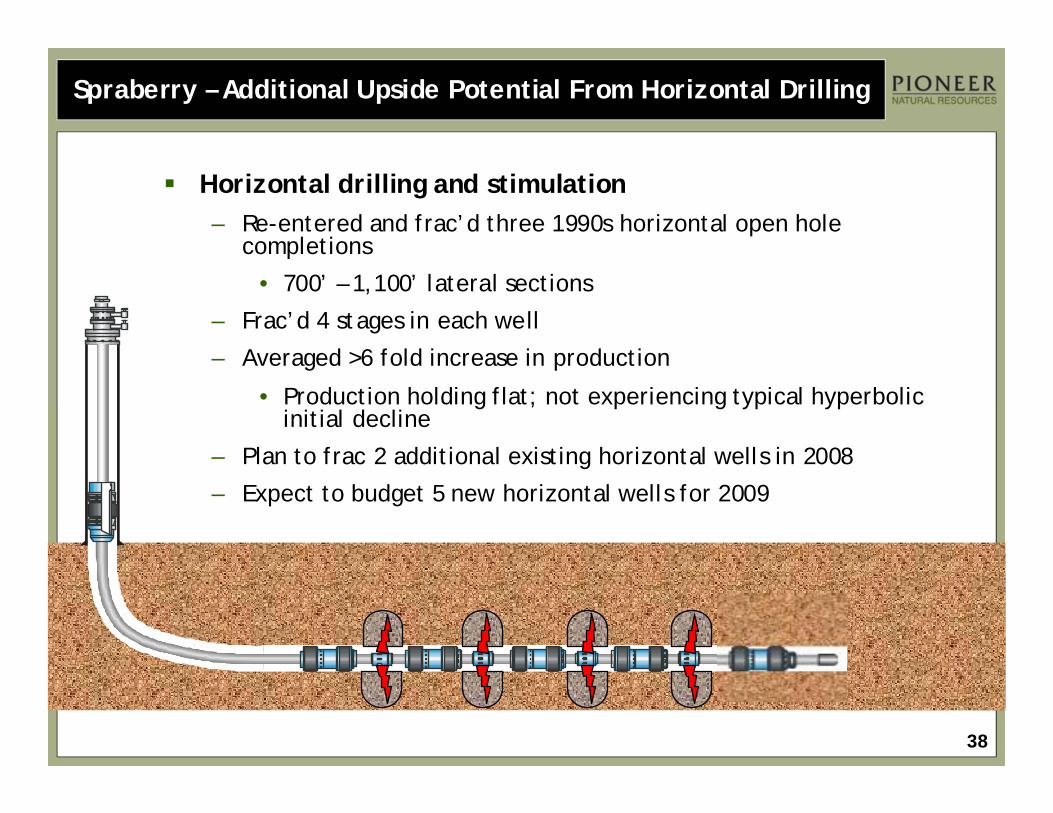
Spraberry – Additional Upside Potential From Horizontal Drilling
Horizontal drilling and stimulation– Re-entered and frac’d three 1990s horizontal open hole
completions
• 700’ – 1,100’ lateral sections
– Frac’d 4 stages in each well
– Averaged >6 fold increase in production
• Production holding flat; not experiencing typical hyperbolic initial decline
– Plan to frac 2 additional existing horizontal wells in 2008
– Expect to budget 5 new horizontal wells for 2009
39
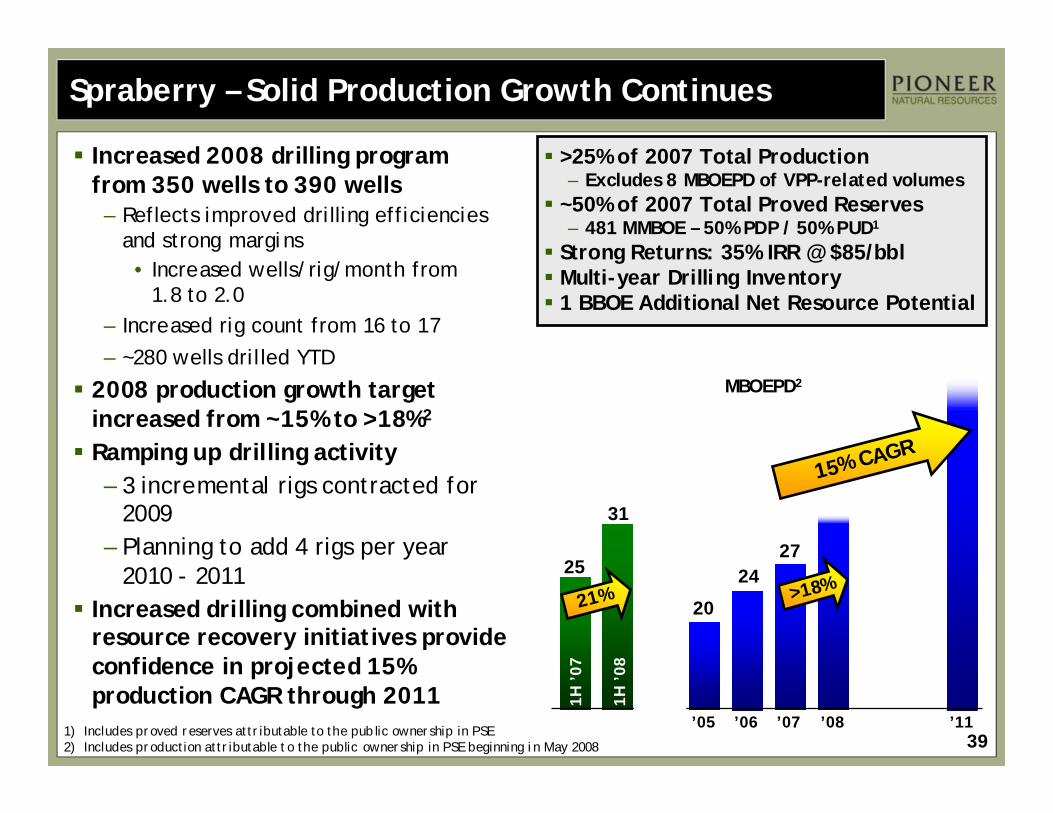
Spraberry – Solid Production Growth Continues
Increased 2008 drilling program from 350 wells to 390 wells
– Reflects improved drilling efficiencies and strong margins
• Increased wells/rig/month from 1.8 to 2.0
– Increased rig count from 16 to 17 – ~280 wells drilled YTD
2008 production growth target increased from ~15% to >18%2
Ramping up drilling activity– 3 incremental rigs contracted for
2009 – Planning to add 4 rigs per year
2010 - 2011Increased drilling combined with resource recovery initiatives provide confidence in projected 15% production CAGR through 2011
>25% of 2007 Total Production – Excludes 8 MBOEPD of VPP-related volumes
~50% of 2007 Total Proved Reserves– 481 MMBOE – 50% PDP / 50% PUD1
Strong Returns: 35% IRR @ $85/bblMulti-year Drilling Inventory1 BBOE Additional Net Resource Potential
1) Includes proved reserves attr ibutable to the pub lic ownership in PSE2) Includes production attr ibutable to the public ownership in PSE beginning in May 2008
’11
MBOEPD2
2427
’06 ’07 ’08
20
’05
15% CAGR
>18%1H
’07
31
25
1H ’
08
21%
40
Certain Reserve Information
Cautionary Note to U.S. Investors -- The U.S. Securities and Exchange Commission (the “SEC”) permits oil and gas companies, in their filings with the SEC, to disclose only proved reserves that a company has demonstrated by actual production or conclusive formation tests to be economically and legally producible under existing economic and operating conditions. Pioneer uses certain terms in this presentation, such as “resource potential,” “net resource potential,” “EUR,” “original oil in place” or other descriptions of volumes of reserves that the SEC’s guidelines strictly prohibit Pioneer from including in filings with the SEC. These estimates are by their nature more speculative than estimates of proved reserves and accordingly are subject to substantially greater risk of being recovered by Pioneer. U.S. investors are urged to consider closely the disclosure in our most recent Form 10-K, file No. 1-13245, available from us at Investor Relations, 5205 N. O’Connor Blvd., Suite 200, Irving, Texas 75039. You can also obtain this form from SEC by calling 1-800-SEC-0330.