Embed Size (px)
Citation preview

1

2
This presentation includes "forward-looking statements" within the meaning of the federal securities laws, commonly identified by such terms as “looking ahead,” “anticipates,” “estimates” and other terms with similar meaning. Although the Company believes that the assumptions upon which the financial information and its forward-looking statements are based are reasonable, it can give no assurance that these assumptions will prove to be correct. Important factors that could cause actual results to differ materially from the Company's projections and expectations are disclosed in the Company’s filings with the Securities and Exchange Commission on Forms 10-K and 10-Q. These factors include, among others, our ability to open new restaurants and expand into existing or new markets; delay or failure of new restaurants to achieve profitability; increases in costs and seasonality; cost or availability of labor; possibility of inadequate systems to support our growth; geographic concentration of our restaurants; impact of price increases on guest visits and changes in consumer preference. All forward-looking statements in this presentation are expressly qualified by such cautionary statements and by reference to the underlying assumptions. These statements are not guarantees of future performance and therefore undue reliance should not be placed on them.We do not undertake to publicly update forward-looking statements, whether as a result of new information, future events or otherwise.
Forward-Looking Statement

3

4
Concept Overview
Unique brand positioningOffer high quality, imaginative menu itemsCreate a fun and memorable dining experienceProvide exceptional dining value with broad consumer appeal
Capitalize on key demographic trends
Significant growth opportunity

5
The Same Great MenuThe Same Great Menu

6
Imaginative Menu ItemsImaginative Menu Items

7
Imaginative &Cravable Food

8
Imaginative &Cravable Food

9
Imaginative &Cravable Beverages

10
Unique Brand Positioning
Family-friendly atmosphere attracts teens, tweens, and high-income women
Uniquely positioned between casual dining & fast-casual
$11.15 2007 YTD average check – one of the lowest in the industry37-42 minute dining experience
“We wait on our guest, they neverwait on us”

11
Unique Brand Positioning Perceptual Map
Source: Red Robin USA: Perceptual Map Analysis; by Data Development Worldwide, February 2007.

12
Key Demographics

13
Unique Brand Positioning
$11.50 $11.55$12.45 $12.69 $12.98 $13.37
$15.00
$18.00
$11.15
Red RobinGourmetBurgers
RubyTuesday
Applebee's Chili's O'Charley's TGIFriday's
CaliforniaPizza
Kitchen
OliveGarden
RedLobster
Strong Value PropositionLow Average Check Drives Customer Traffic
at Lunch (50%) and Dinner (50%)

14
Unique Brand Positioning70% of family meal decisions heavily influencedby teens/tweens
Red Robin averages more guests under 18 thanthe casual-dining average
26%21% 24% 21%
20%24%
13%17% 16% 14%
18% 20%
6% 10% 12% 13%
28% 22% 24% 22% 22% 17%
26%28%35%29%30%26%
7% 8%
Red Robin Applebees Chili's TGIF Olive Garden Casual Dining
<18 18-34 35-49 50-64 65+
Demographic Comparison - Age
Crest, The NPD Group, year-end 2007

15
Unique Brand PositioningStrong brand loyalty - one third of guests generateover 70% of business
Attract high income families, including women,teens and tweens
25%
27%26% 23%
31%25%
19%
16%16% 16%
12%17%
35%24%
33% 33% 27% 32%
11%12%13%9%14%8%
13%19%
16%15% 19% 16%
Red Robin Applebees Chili's TGIF Olive Garden Casual Dining
less than $25,000 $25,000 - 45,000 $45,000 - 75,000 $75,000 - 100,000 $100,000 +
Household Income: Distribution of Guests
Crest, The NPD Group, year-end 2007

16

17
Extremely popular with developers
Customer base overlaps with specialty retail
High unit volumes and a low average check translate into strong guest traffic
Few pure competitors in casual-dining
Specialty retail is focused on high income women, teens & tweens
Red Robin delivers the specialty retail customer
Unique Brand Leads toStrong Growth Opportunities
18
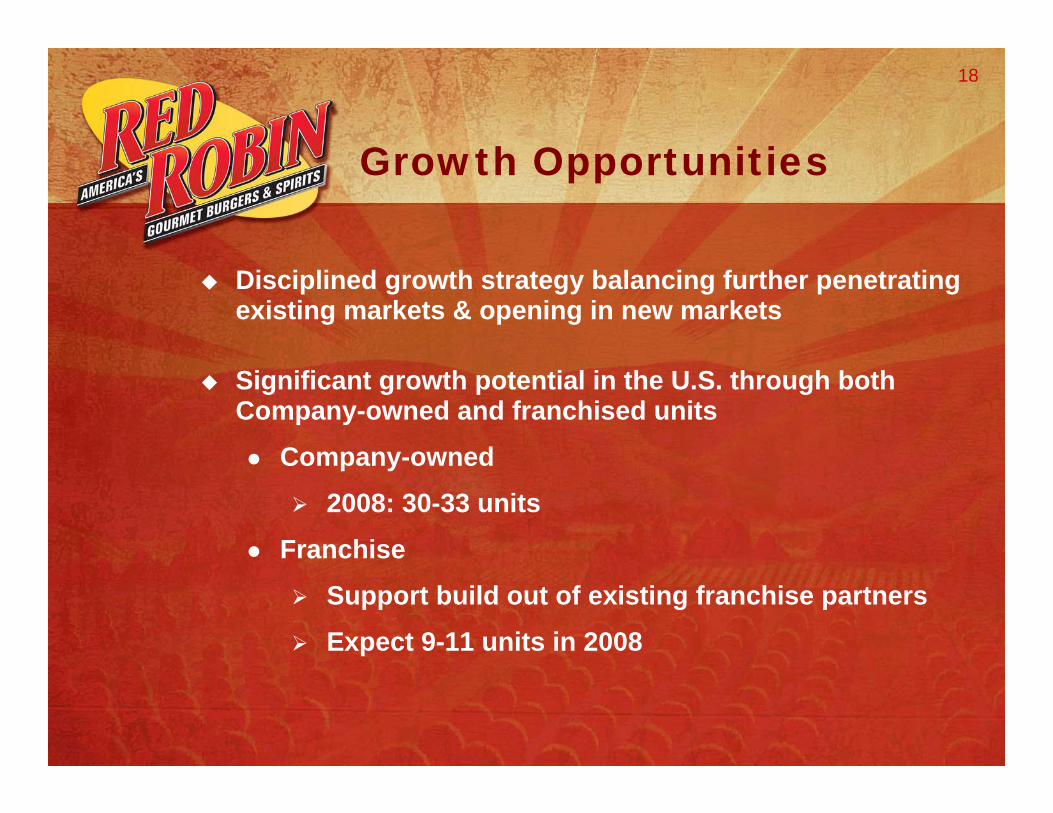
Growth Opportunities
Disciplined growth strategy balancing further penetrating existing markets & opening in new markets
Significant growth potential in the U.S. through both Company-owned and franchised units
Company-owned
2008: 30-33 units
Franchise
Support build out of existing franchise partners
Expect 9-11 units in 2008

19
391604 622 651
879
1,839
1,260
Red Robin TGI Friday's OliveGarden
Red Lobster RubyTuesday
Chili's Applebee's
Substantial New Unit Opportunity to Expand Chain in U.S.
Note: Total North American locations as per recent SEC filings or company website disclosures
Growth Opportunities

20

21
Diverse Food &Beverage Offerings
Q4 2007 Food Sales
Non AlcoholicBeverages
13.6%
Alcoholic Beverages
6.8%
Food79.6%
* Includes Chicken, fish, turkey, pot roast, veggie and other
Kids Menu7%
Sandwiches9%
Salads9%
Entrees8%
Other Burgers*
17%
Beef Burgers36%
Appetizers11%
Desserts1%
Soups2%
Q4 2007 Total Sales

22
Average Unit Volume –Distribution
19%
58%
23%
<$2.5m $2.5m-$4.0m >$4.0m
2007 Comp Base of Restaurants has Significant Room for AUV Improvement
Note: 2007 Comp AUV = $3.3M

23Minimal Exposure to Fluctuations in Commodity Prices
2007 vs 2006 Commodity Costs as a Percentage of Food Sales
24.5%
5.2%
4.1%
2.9%
3.0%
2.4%
2.1%
2.1%
1.0%
1.1%
0.6%
24.3%
5.4%
4.2%
2.9%
2.9%
2.2%
1.9%
2.0%
1.1%
1.2%
0.5%
Total
Other (a)
Poultry
Produce
Hamburger
Steak Fries
Cheese
Bread
Meat
Seafood
Fry Oil
FY 2007 FY 2006(a) Other includes canned and dry goods and dairy products

24
2007 Commodity Landscape
% of Sales% of Food & Beverage Costs Spot or Contract?
Poultry 3.2% 13.5% Contract thru 12/09Hamburger 2.4% 10.0% Contract thru 12/08Produce 2.3% 9.8% MixedFries 1.9% 8.0% Contract thru 11/08Bread 1.7% 7.0% Contract thru 8/08Cheese 1.7% 7.0% Contract thru 4/08Seafood 0.9% 3.9% Contract thru 12/08Meat 0.9% 3.9% Contract thru 12/08Dairy 0.5% 1.9% MixedOther/Misc 4.2% 17.9% MixedNon-Alcoholic 2.6% 11.0% Contract thru 2011Alcoholic 1.4% 6.1% MixedRebates -0.7%
Total Food & Beverage 23.0% 100.0%

25
Strong Historical Financial Performance:
$ in millionsTotal Revenues
Net Income, before taxes*
Rest Level Operating Profit
Cash Flow from Operations
$23.4
$35.4 $41.2 $44.0 $47.0
2003 2004 2005 2006 2007
$403.4$324.1
$486.0
$618.7$763.5
2003 2004 2005 2006 2007
$61.6$84.3
$100.7$127.9
$153.0
2003 2004 2005 2006 2007
$54.4$44.0
$65.3$78.5
$93.6
2003 2004 2005 2006 2007
23%
24% 20%27%
20%
37%
51%
19%27%
7 %16%
7%19%
24%20%
20%
*NOTE: 2006 contains 53 weeks vs. 52 weeks in years 2003-2005 & 2007. 2006 includes 5.8M pretax FAS123R Expense and excludes $1.7M pretax one time charge for Washington acquisition. 2007 includes 6.9M pretax FAS123R expense and excludes $2.1M in one time charges for California acquisition and $1.65M for one-time legal settlement.

26
2008 Guidance
SSS% = 2.0%-3.5%
Includes expected March 2008 price increase of 0.5% and a full year price/mix weighting of ~2.5%.
Revenue = $880.0M to $893.0M
GAAP EPS = $2.00-$2.20 per share
Includes $0.26-$0.28 impact from stock compensation expense

27
2008 Guidance continued
Company Development = 30-33 units with 50% of operating weeks in new markets / 50% in existing markets.
Majority of openings in Q1-Q3.
Franchise Development = 9-11 units
Fairly evenly spread throughout the year.
National Marketing Campaign = Incremental 50bps in 2008 for a total restaurant contribution of 1.5%.

Current Initiatives

29
Current Initiatives
The “NRO Normalcy” project is focused on retaining maximum honeymoon sales and accelerating the “normalization” of restaurant level profit margins.
Building cost reduction initiative to manage inflation on our construction costs and to continue our focus on improving ROIC.
Expand our national advertising campaign.
30
NRO Normalcy -Leadership Selection
Implemented tools for selection of leaders
Identified seasoned leaders
2006 NRO Openings ~ 20% seasoned leaders
2007 NRO Openings ~ 70% seasoned leaders
2008 NRO Openings identified >90% seasoned leaders

31NRO Normalcy - Redefined & Strengthen Training
Improved “Manager-in-Training” programs
Instituted NRO workshops
“Heart-of-the-House” training certifications

32
NRO Normalcy -Institutionalized into Operations
Creation of New Restaurant Development (NRD) Department1K Program (collaborative work flow tool)42 Day Building TurnoverSenior GMPre and Post Opening SupportNRO Budget Management
33
Building Cost Reduction Initiative
Starting point full year 2005/early 2006 units average cost to build = $2.5 million
Phase 1: objective to reduce cost without impacting the guest experience
Phase 1 results = $150,000 savings in 99.12 prototype building

34
Building Cost Reduction Initiative (con’t)
Phase 2: objective to develop a smaller prototype with same seating capacity.
2007A prototype ~5,600 sq. ft. with cost savings of an additional $150,000
75% of 2008 openings will include the 2007A prototype.
2008
Manage cost inflation.
Focus on continuous improvement of ROIC.

35
National Advertising Fund
$18.0-$19.0 million budget for 2008.4 new commercials (same campaign) funded by Cooperative Advertising budget in 20071.5% NAF system-wide contribution
24 week national cable buy (+118% from 2007)Commenced February 4th and runs through mid November 2008.Will include 54% more cable GRPs than 2007Will have 73% more 30 second spots vs. 2007
Additional media10 second network spotsOnline network video
Internet AdvertisingJanuary – December Internet support

36
National Advertising Fund -Benefits
Drives sales growth across system
Increases brand awareness and builds brand image (which protects pricing)
Generates new Guest trial
Jump-starts new markets
Builds system momentum and excitement
Adds a media layer of support to all markets and strengthens local community efforts
National Kid’s Burger recipe contestLocal Restaurant Marketing

37
Company Highlights
Leader in casual dining serving gourmet burgers to America’s families
Unique brand positioning
Powerful demographics lead to great sites
Strong unit-level economics
Significant unit growth story
History of strong financial performance
Operations focused management team

38