Children’s television viewingResearch overviewMARCH 2015
Canberra Red Building Benjamin Offices Chan Street Belconnen ACT PO Box 78 Belconnen ACT 2616 T +61 2 6219 5555 F +61 2 6219 5353
Melbourne Level 32 Melbourne Central Tower 360 Elizabeth Street Melbourne VIC PO Box 13112 Law Courts Melbourne VIC 8010 T +61 3 9963 6800 F +61 3 9963 6899
Sydney Level 5 The Bay Centre 65 Pirrama Road Pyrmont NSW PO Box Q500 Queen Victoria Building NSW 1230 T +61 2 9334 7700 1800 226 667
F +61 2 9334 7799
Copyright notice
http://creativecommons.org/licenses/by/3.0/au/
With the exception of coats of arms, logos, emblems, images, other third-party material or devices protected by a trademark, this
content is licensed under the Creative Commons Australia Attribution 3.0 Licence.
We request attribution as: © Commonwealth of Australia (Australian Communications and Media Authority) 2015.
All other rights are reserved.
The Australian Communications and Media Authority has undertaken reasonable enquiries to identify material owned by third parties and secure permission
for its reproduction. Permission may need to be obtained from third parties to re-use their material.
Written enquiries may be sent to:
Manager, Editorial and Design
PO Box 13112
Law Courts
Melbourne VIC 8010
Tel: 03 9963 6968
Email: [email protected]
Contents
| iii
About the research 1
Background 1
Summary of key research findings 4
1. When are children watching TV? 4
2. How much TV are children watching? 5
3. What types of TV programs do children watch? 6
4. What are the most popular TV programs children watch? 7
5. What are the most popular children’s programs? 8
6. What channels are popular with kids? 9
7. Is commercial television relevant to children’s programming? 10
8. What is the audience for C and P programs? 11
9. How are parents involved in their children’s TV viewing? 12
10. What rules and restrictions do parents place on children’s viewing? 13
Conclusion 14
Methodology 14
researchacma 15

| 1
About the research In 2014, the Australian Communications and Media Authority (the ACMA) conducted
research to help measure the ongoing importance of children’s programs on television,
including Children’s (C) and Preschool (P) programs provided by commercial
broadcasters.
This research comprises two studies into children’s viewing of broadcast television:
a community survey of parents and carers
an analysis of children’s television audiences and program ratings between 2001
and 2013.
The first study, Attachment A: Children’s television viewing—Community research
2014, is a survey of 954 parents and carers of children aged 0–14, commissioned by
the ACMA from Newspoll. This study offers a contemporary view of parental attitudes
to children’s viewing patterns and behaviours.
The second study, Attachment B: Children’s television viewing—Analysis of audience
data 2001–13, draws on audience data provided by the industry ratings agency,
OzTAM.1 By comparing audience data over 13 years, this study identifies the longer
term changes that have occurred in children’s viewing patterns.
This 13-year period has coincided with significant changes in Australia’s television
viewing, with the introduction of digital television, catch-up viewing and, more recently,
the availability of online and over-the-top viewing experiences. The ACMA is
monitoring changes in the industry and content delivery more broadly to see how they
will affect audience viewing over time.
This paper is primarily concerned with reporting the key findings from the Newspoll
survey and OzTAM data.
Background Section 122 of the Broadcasting Services Act 1992 (the BSA) requires the ACMA to
determine standards for commercial television broadcasting licensees that relate to
programs for children. Compliance with standards determined under section 122 of the
BSA is a licence condition for commercial television broadcasters. In August 2009, the
ACMA determined the Children’s Television Standards 2009 (the CTS). The
determination followed a review of the previous standard, the Children’s Television
Standards 2005 (CTS 2005).
The objectives of the CTS are to ensure that children have access to a range of quality
television programs made specifically for them, including Australian drama and non-
drama programs, and to protect children from the possible harmful effects of
television.2
1 This study focuses on free-to-air and subscription television viewing by children in the five metropolitan
cities of Australia (Adelaide, Brisbane, Melbourne, Perth and Sydney). The data includes live and time-
shifted viewing for broadcast television but does not include online viewing of catch-up television services. 2 Revised Explanatory Memorandum, Broadcasting Services Bill 1992, pp. 61–2.
2 |
Strategies to achieve these objectives include programming quota and scheduling
requirements as well as protection provisions. Under the CTS, the ACMA can classify
programs as either ‘C’ or ‘P’. Commercial television broadcasters (such as networks 7,
9 and 10) must broadcast the following each year:
260 hours of C-classified programs within designated time bands—programs with a
C classification in the TV Guide
130 hours of P-classified programs within designated time bands—programs with a
P classification in the TV Guide.
The CTS also contain protections for children against the possible harmful effects of
viewing certain material. Child protections in the CTS include that:
no advertisements are to be shown during P-classified programs
no alcohol can be advertised during C programs
material during C and P programs cannot encourage children to engage in
activities that are dangerous to them.
In reviewing the CTS 2005, the ACMA noted in its Children’s Television Standards
Review issues paper that the revision of the standards was intended to enable
them to:
remain relevant
continue to promote quality children’s free-to-air programs on commercial television
continue to protect children from the potentially harmful effects of television viewing
within the changing media environment.3
Since the introduction of the current CTS, television in Australia has continued to
change.4
The ACMA’s 2011 research Digital Australians noted that Australians have a high
awareness of the ongoing evolution of media and communications. Associated with
this change are the numerous ways in which television content is now accessed—from
traditional media such as free-to-air (FTA) and subscription (STV) television to new
and emerging platforms such as on-demand services and internet providers. This
reflects not just how viewers are watching television content, but how traditional
broadcasters are now providing it.
As Screen Australia discussed in its 2013 report Child’s Play, the evolving media
environment is affecting and creating challenges for children’s television.5 Since the
current CTS was determined, many more STV children’s channels have been made
available. Further, the national broadcaster, the ABC, is providing children’s programs
all day on dedicated children’s channels and its on-demand internet service, iView.
Since legislative amendments in 2013, commercial television licensees have been
permitted to meet their CTS quota obligations across their television services (that is,
not solely on a licensee’s primary channel). By the end of 2013, all commercial
television broadcasters were scheduling the majority of their CTS programs on non-
primary channels (7TWO, GO! and Eleven). National, STV and, to a lesser extent,
commercial television broadcasters are now scheduling ‘blocks’ of children’s programs
and creating ‘destination’ viewing.
3 ACMA, Children’s Television Standards Review, Issues Paper, June 2007, p. 4. 4 See ACMA research from 2013, Like, Post, Share, for more information. 5 Screen Australia, Child’s Play: Issues in Australian Children’s Television 2013, p. 3.

| 3
Following consultation with industry, the Department of Communications released a
Deregulation Roadmap in 2014, reflecting the government’s intention to reduce the
regulatory burden on business and the community. One area identified for potential
reform was the children’s television quota requirements.6 Noting that the standards
were last reviewed in 2009, the ACMA considered it appropriate to undertake research
that could inform any future review of the CTS.
6 Department of Communications, ‘Communications portfolio: Deregulation Roadmap 2014’,
www.communications.gov.au/deregulation/communications_portfolio_deregulation_roadmap_2014.
4 |
Summary of key research findings
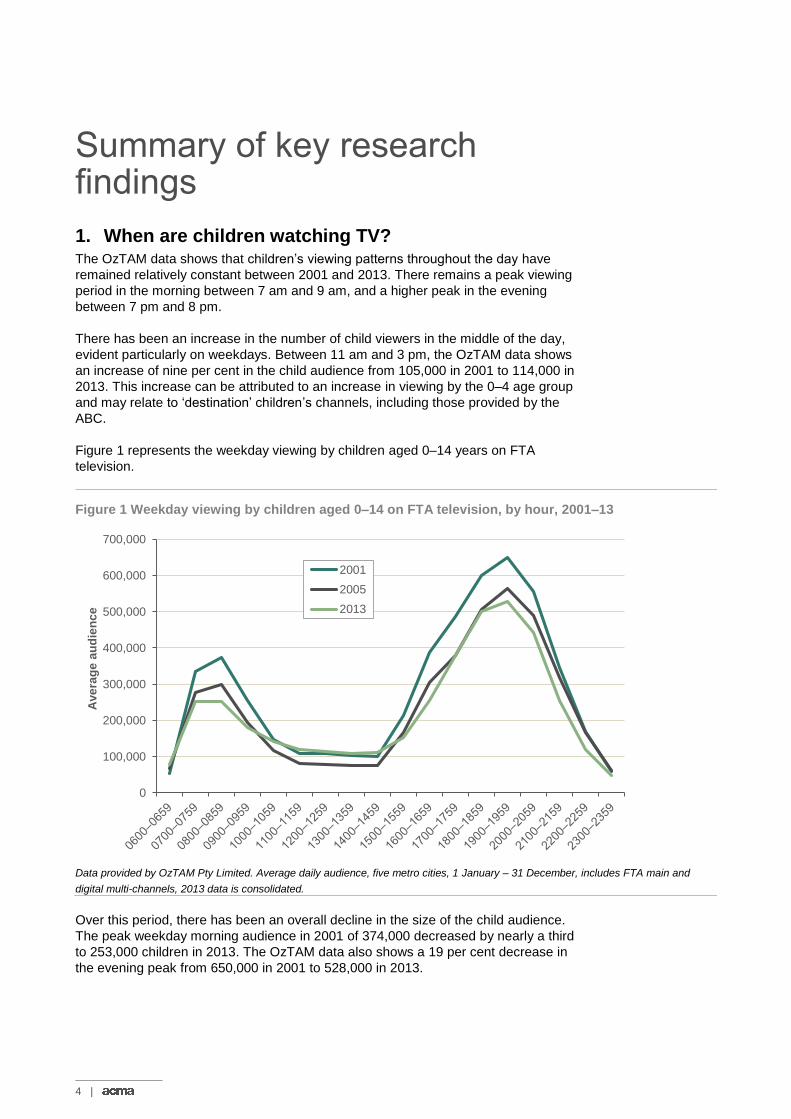
1. When are children watching TV? The OzTAM data shows that children’s viewing patterns throughout the day have
remained relatively constant between 2001 and 2013. There remains a peak viewing
period in the morning between 7 am and 9 am, and a higher peak in the evening
between 7 pm and 8 pm.
There has been an increase in the number of child viewers in the middle of the day,
evident particularly on weekdays. Between 11 am and 3 pm, the OzTAM data shows
an increase of nine per cent in the child audience from 105,000 in 2001 to 114,000 in
2013. This increase can be attributed to an increase in viewing by the 0–4 age group
and may relate to ‘destination’ children’s channels, including those provided by the
ABC.
Figure 1 represents the weekday viewing by children aged 0–14 years on FTA
television.
Figure 1 Weekday viewing by children aged 0–14 on FTA television, by hour, 2001–13
Data provided by OzTAM Pty Limited. Average daily audience, five metro cities, 1 January – 31 December, includes FTA main and
digital multi-channels, 2013 data is consolidated.
Over this period, there has been an overall decline in the size of the child audience.
The peak weekday morning audience in 2001 of 374,000 decreased by nearly a third
to 253,000 children in 2013. The OzTAM data also shows a 19 per cent decrease in
the evening peak from 650,000 in 2001 to 528,000 in 2013.
0
100,000
200,000
300,000
400,000
500,000
600,000
700,000
Ave
rag
e a
ud
ien
ce
2001
2005
2013
| 5
Overall, between 2001 and 2013 there has been a nine per cent decline in the
average daily number of children watching television in metropolitan cities. Notably,
there has also been a decline in child viewers—from 13 per cent to 11 per cent of the
potential child audience.7 Commercial television licensees experienced the biggest
drop in the potential child audience—from 8.5 per cent in 2001 to 4.5 per cent in 2013.
2. How much TV are children watching? The OzTAM data shows that children aged 0–14 are spending less time watching
television than they did over a decade ago. In 2013, children watched television for
one hour and 54 minutes per day when averaged across all television households.8
Comparatively, OzTAM data for 2001 showed children watched a daily average of two
hours and 24 minutes. Specifically for FTA television, the research shows that children
are watching 33 fewer minutes of television each day in 2013 than they did in 2001.
There are some important differences in the amount of time spent viewing and the
viewing destination across different age groups. Preschool children (0–4) are spending
more time watching FTA television than older children. In 2013, preschool children
watched one hour and 54 minutes per day, the 5–12 age group averaged one hour
and 20 minutes per day, and the 13–17 age group averaged one hour and two
minutes per day.
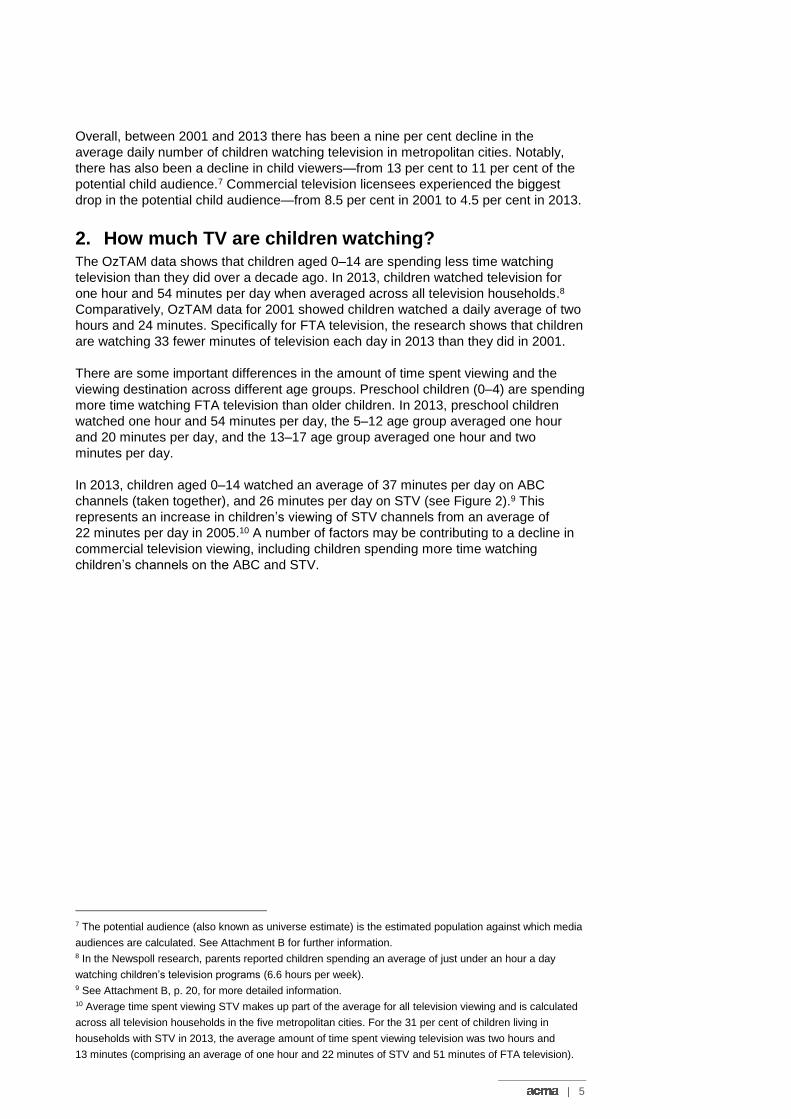
In 2013, children aged 0–14 watched an average of 37 minutes per day on ABC
channels (taken together), and 26 minutes per day on STV (see Figure 2).9 This
represents an increase in children’s viewing of STV channels from an average of
22 minutes per day in 2005.10 A number of factors may be contributing to a decline in
commercial television viewing, including children spending more time watching
children’s channels on the ABC and STV.
7 The potential audience (also known as universe estimate) is the estimated population against which media
audiences are calculated. See Attachment B for further information. 8 In the Newspoll research, parents reported children spending an average of just under an hour a day
watching children’s television programs (6.6 hours per week). 9 See Attachment B, p. 20, for more detailed information. 10 Average time spent viewing STV makes up part of the average for all television viewing and is calculated
across all television households in the five metropolitan cities. For the 31 per cent of children living in
households with STV in 2013, the average amount of time spent viewing television was two hours and
13 minutes (comprising an average of one hour and 22 minutes of STV and 51 minutes of FTA television).
6 |
Figure 2 Average time spent viewing FTA television networks and STV, by children aged 0–14,
2001–13
In 2013, each ‘Network’ shows an aggregated average for the primary channel and its digital multi-channels.
Network ABC includes ABC1 and ABC2 in 2009, with the addition of ABC3 and ABC News 24 in 2013.
Time spent viewing data is averaged across all metro television households.
STV data was not reported by OzTAM in 2001.
While each television network provided programming for children of different ages in
2013, ABC2 (also known as ABC4Kids) attracted more children aged 0–4 and an
increase in average time spent viewing. Conversely, each of the commercial networks,
STV and ABC3 attracted more viewers aged 5–12.
3. What types of TV programs do children watch? While parents in the Newspoll survey reported that nine in 10 children aged 14 and
under watch children’s television programs, OzTAM data showed that programs made
specifically for children were watched most commonly by those aged 0–4.11
For children aged 5–12, movies made for family or general audiences were most
popular on FTA television.
Table 1 shows that, for the accumulative 0–14 age group on FTA television, the
number of programs by program category watched by children has varied little over
time.
For STV, the top 30 programs watched by children aged 0–14 were broadcast on
children’s channels or were live sports events.
11 ACMA, Children’s Television Standards Review, Issues Paper, June 2007, p. 4.
30 29
32
2523
20
26 25
22
18 1820
23
30
16
20
12
37
26
0
5
10
15
20
25
30
35
40
Network 7 Network 9 Network TEN Network ABC SubscriptionTV
Min
ute
s p
er
da
y
2001 2005 2009 2013
| 7
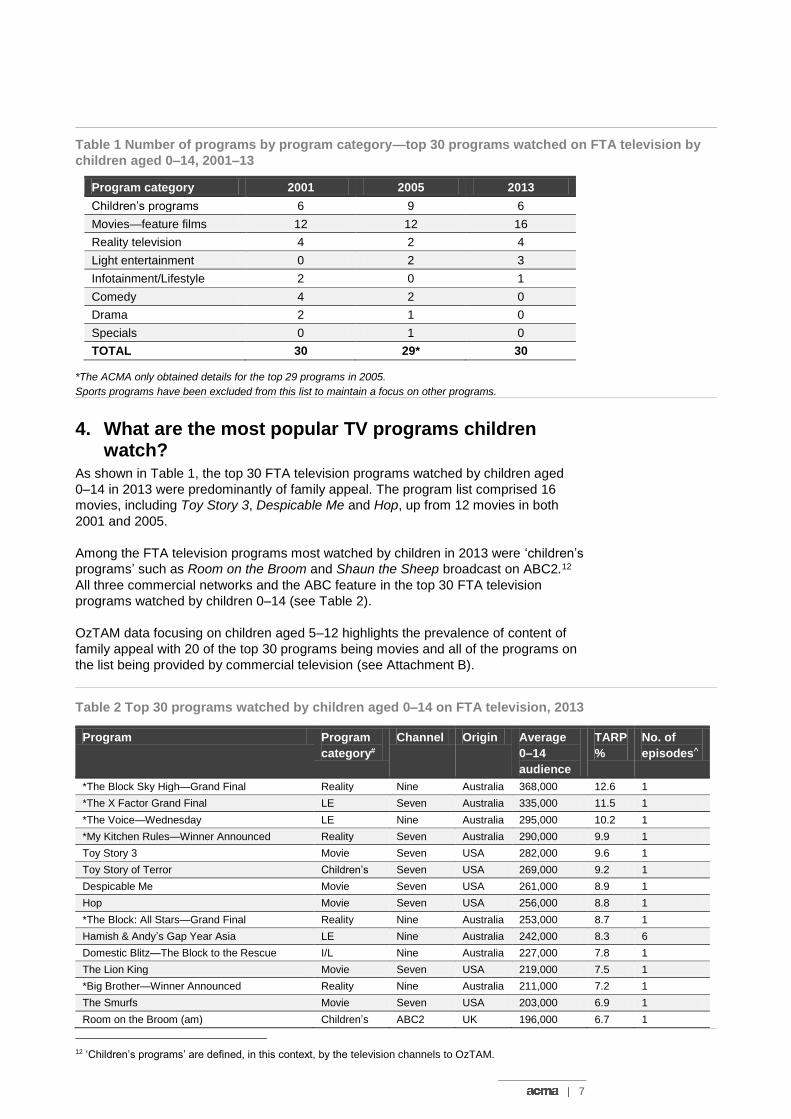
Table 1 Number of programs by program category—top 30 programs watched on FTA television by
children aged 0–14, 2001–13
Program category 2001 2005 2013
Children’s programs 6 9 6
Movies—feature films 12 12 16
Reality television 4 2 4
Light entertainment 0 2 3
Infotainment/Lifestyle 2 0 1
Comedy 4 2 0
Drama 2 1 0
Specials 0 1 0
TOTAL 30 29* 30
*The ACMA only obtained details for the top 29 programs in 2005.
Sports programs have been excluded from this list to maintain a focus on other programs.
4. What are the most popular TV programs children watch?
As shown in Table 1, the top 30 FTA television programs watched by children aged
0–14 in 2013 were predominantly of family appeal. The program list comprised 16
movies, including Toy Story 3, Despicable Me and Hop, up from 12 movies in both
2001 and 2005.
Among the FTA television programs most watched by children in 2013 were ‘children’s
programs’ such as Room on the Broom and Shaun the Sheep broadcast on ABC2.12
All three commercial networks and the ABC feature in the top 30 FTA television
programs watched by children 0–14 (see Table 2).
OzTAM data focusing on children aged 5–12 highlights the prevalence of content of
family appeal with 20 of the top 30 programs being movies and all of the programs on
the list being provided by commercial television (see Attachment B).
Table 2 Top 30 programs watched by children aged 0–14 on FTA television, 2013
Program Program
category#
Channel Origin Average
0–14
audience
TARP
%
No. of
episodes^
*The Block Sky High—Grand Final Reality Nine Australia 368,000 12.6 1
*The X Factor Grand Final LE Seven Australia 335,000 11.5 1
*The Voice—Wednesday LE Nine Australia 295,000 10.2 1
*My Kitchen Rules—Winner Announced Reality Seven Australia 290,000 9.9 1
Toy Story 3 Movie Seven USA 282,000 9.6 1
Toy Story of Terror Children’s Seven USA 269,000 9.2 1
Despicable Me Movie Seven USA 261,000 8.9 1
Hop Movie Seven USA 256,000 8.8 1
*The Block: All Stars—Grand Final Reality Nine Australia 253,000 8.7 1
Hamish & Andy’s Gap Year Asia LE Nine Australia 242,000 8.3 6
Domestic Blitz—The Block to the Rescue I/L Nine Australia 227,000 7.8 1
The Lion King Movie Seven USA 219,000 7.5 1
*Big Brother—Winner Announced Reality Nine Australia 211,000 7.2 1
The Smurfs Movie Seven USA 203,000 6.9 1
Room on the Broom (am) Children’s ABC2 UK 196,000 6.7 1
12 ‘Children’s programs’ are defined, in this context, by the television channels to OzTAM.
8 |
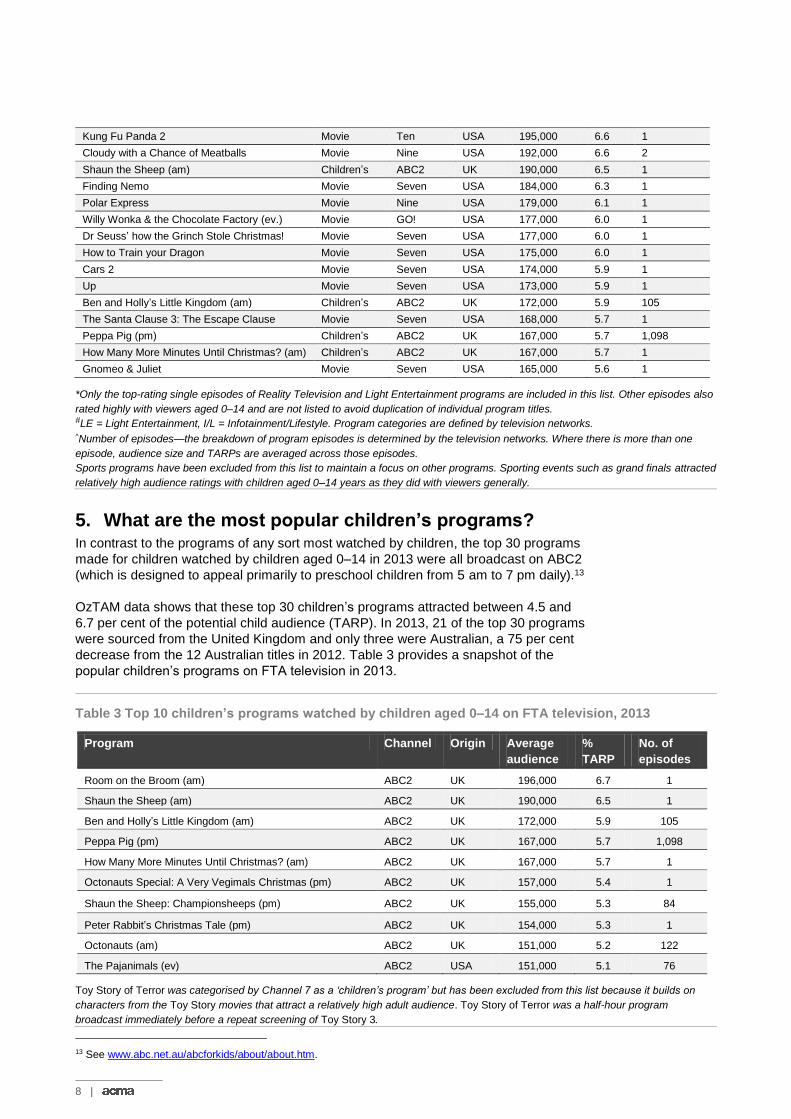
Kung Fu Panda 2 Movie Ten USA 195,000 6.6 1
Cloudy with a Chance of Meatballs Movie Nine USA 192,000 6.6 2
Shaun the Sheep (am) Children’s ABC2 UK 190,000 6.5 1
Finding Nemo Movie Seven USA 184,000 6.3 1
Polar Express Movie Nine USA 179,000 6.1 1
Willy Wonka & the Chocolate Factory (ev.) Movie GO! USA 177,000 6.0 1
Dr Seuss’ how the Grinch Stole Christmas! Movie Seven USA 177,000 6.0 1
How to Train your Dragon Movie Seven USA 175,000 6.0 1
Cars 2 Movie Seven USA 174,000 5.9 1
Up Movie Seven USA 173,000 5.9 1
Ben and Holly’s Little Kingdom (am) Children’s ABC2 UK 172,000 5.9 105
The Santa Clause 3: The Escape Clause Movie Seven USA 168,000 5.7 1
Peppa Pig (pm) Children’s ABC2 UK 167,000 5.7 1,098
How Many More Minutes Until Christmas? (am) Children’s ABC2 UK 167,000 5.7 1
Gnomeo & Juliet Movie Seven USA 165,000 5.6 1
*Only the top-rating single episodes of Reality Television and Light Entertainment programs are included in this list. Other episodes also
rated highly with viewers aged 0–14 and are not listed to avoid duplication of individual program titles. #LE = Light Entertainment, I/L = Infotainment/Lifestyle. Program categories are defined by television networks. ^Number of episodes—the breakdown of program episodes is determined by the television networks. Where there is more than one
episode, audience size and TARPs are averaged across those episodes.
Sports programs have been excluded from this list to maintain a focus on other programs. Sporting events such as grand finals attracted
relatively high audience ratings with children aged 0–14 years as they did with viewers generally.
5. What are the most popular children’s programs? In contrast to the programs of any sort most watched by children, the top 30 programs
made for children watched by children aged 0–14 in 2013 were all broadcast on ABC2
(which is designed to appeal primarily to preschool children from 5 am to 7 pm daily).13
OzTAM data shows that these top 30 children’s programs attracted between 4.5 and
6.7 per cent of the potential child audience (TARP). In 2013, 21 of the top 30 programs
were sourced from the United Kingdom and only three were Australian, a 75 per cent
decrease from the 12 Australian titles in 2012. Table 3 provides a snapshot of the
popular children’s programs on FTA television in 2013.
Table 3 Top 10 children’s programs watched by children aged 0–14 on FTA television, 2013
Program Channel Origin Average
audience
%
TARP
No. of
episodes
Room on the Broom (am) ABC2 UK 196,000 6.7 1
Shaun the Sheep (am) ABC2 UK 190,000 6.5 1
Ben and Holly’s Little Kingdom (am) ABC2 UK 172,000 5.9 105
Peppa Pig (pm) ABC2 UK 167,000 5.7 1,098
How Many More Minutes Until Christmas? (am) ABC2 UK 167,000 5.7 1
Octonauts Special: A Very Vegimals Christmas (pm) ABC2 UK 157,000 5.4 1
Shaun the Sheep: Championsheeps (pm) ABC2 UK 155,000 5.3 84
Peter Rabbit’s Christmas Tale (pm) ABC2 UK 154,000 5.3 1
Octonauts (am) ABC2 UK 151,000 5.2 122
The Pajanimals (ev) ABC2 USA 151,000 5.1 76
Toy Story of Terror was categorised by Channel 7 as a ‘children’s program’ but has been excluded from this list because it builds on
characters from the Toy Story movies that attract a relatively high adult audience. Toy Story of Terror was a half-hour program
broadcast immediately before a repeat screening of Toy Story 3.
13 See www.abc.net.au/abcforkids/about/about.htm.
| 9
6. What channels are popular with kids? The ABC has played a significant role as a broadcaster of children’s programs for
many years.14 OzTAM data for the ABC network shows increased children’s viewing
since 2009 and this can be attributed mainly to children aged 0–4 watching ABC2
throughout the day until early evening. During this time, ABC2 has provided
‘destination’ viewing comprising preschool children’s programs.
Unlike commercial television broadcasters, there is no obligation for the ABC to meet
C and P quotas.
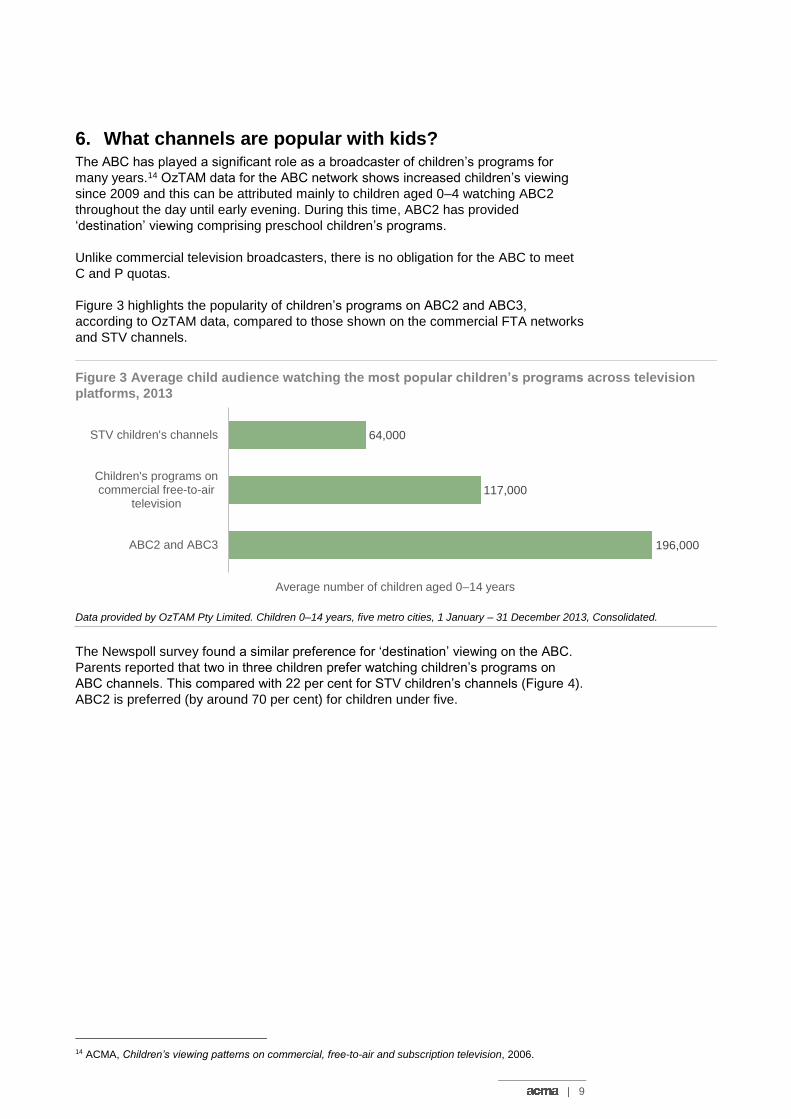
Figure 3 highlights the popularity of children’s programs on ABC2 and ABC3,
according to OzTAM data, compared to those shown on the commercial FTA networks
and STV channels.
Figure 3 Average child audience watching the most popular children’s programs across television
platforms, 2013
Data provided by OzTAM Pty Limited. Children 0–14 years, five metro cities, 1 January – 31 December 2013, Consolidated.
The Newspoll survey found a similar preference for ‘destination’ viewing on the ABC.
Parents reported that two in three children prefer watching children’s programs on
ABC channels. This compared with 22 per cent for STV children’s channels (Figure 4).
ABC2 is preferred (by around 70 per cent) for children under five.
14 ACMA, Children’s viewing patterns on commercial, free-to-air and subscription television, 2006.
196,000
117,000
64,000
ABC2 and ABC3
Children's programs oncommercial free-to-air
television
STV children's channels
Average number of children aged 0–14 years
10 |
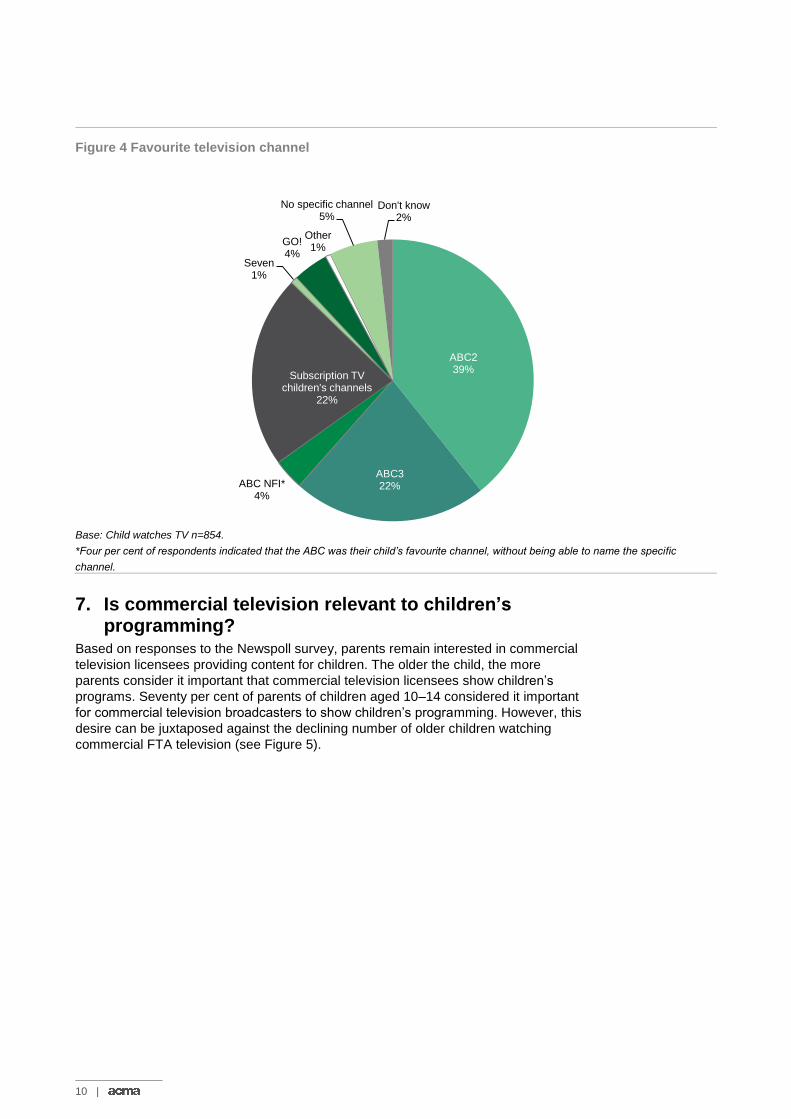
Figure 4 Favourite television channel
Base: Child watches TV n=854.
*Four per cent of respondents indicated that the ABC was their child’s favourite channel, without being able to name the specific
channel.
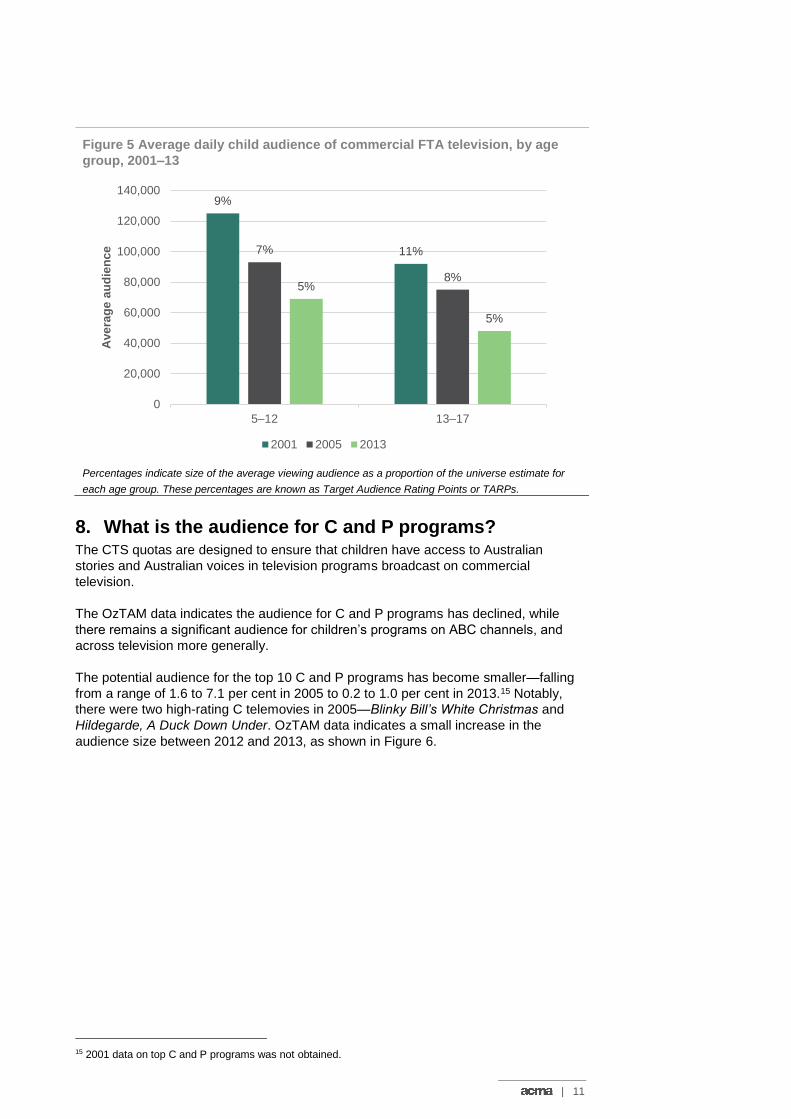
7. Is commercial television relevant to children’s programming?
Based on responses to the Newspoll survey, parents remain interested in commercial
television licensees providing content for children. The older the child, the more
parents consider it important that commercial television licensees show children’s
programs. Seventy per cent of parents of children aged 10–14 considered it important
for commercial television broadcasters to show children’s programming. However, this
desire can be juxtaposed against the declining number of older children watching
commercial FTA television (see Figure 5).
ABC239%
ABC322%ABC NFI*
4%
Subscription TV children's channels
22%
Seven1%
GO!4%
Other1%
No specific channel5%
Don't know2%
| 11
Figure 5 Average daily child audience of commercial FTA television, by age
group, 2001–13
Percentages indicate size of the average viewing audience as a proportion of the universe estimate for
each age group. These percentages are known as Target Audience Rating Points or TARPs.
8. What is the audience for C and P programs? The CTS quotas are designed to ensure that children have access to Australian
stories and Australian voices in television programs broadcast on commercial
television.
The OzTAM data indicates the audience for C and P programs has declined, while
there remains a significant audience for children’s programs on ABC channels, and
across television more generally.
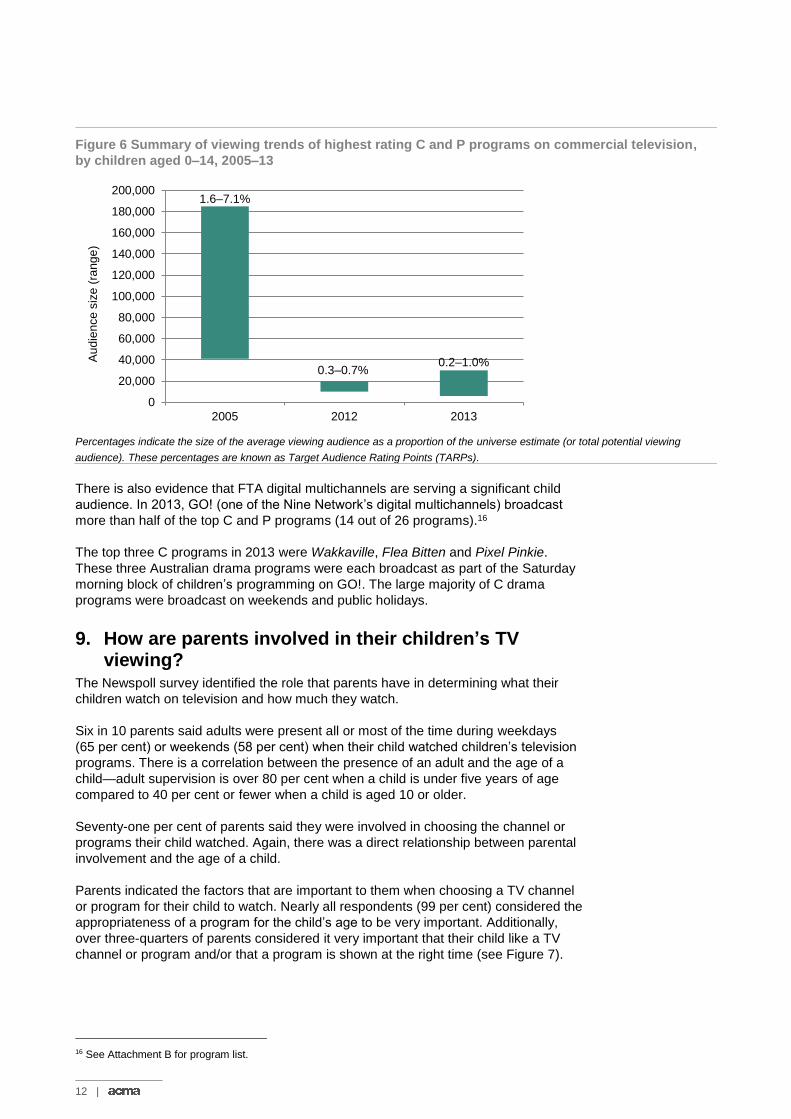
The potential audience for the top 10 C and P programs has become smaller—falling
from a range of 1.6 to 7.1 per cent in 2005 to 0.2 to 1.0 per cent in 2013.15 Notably,
there were two high-rating C telemovies in 2005—Blinky Bill’s White Christmas and
Hildegarde, A Duck Down Under. OzTAM data indicates a small increase in the
audience size between 2012 and 2013, as shown in Figure 6.
15 2001 data on top C and P programs was not obtained.
9%
11%7%
8%5%
5%
0
20,000
40,000
60,000
80,000
100,000
120,000
140,000
5–12 13–17
Ave
rag
e a
ud
ien
ce
2001 2005 2013
12 |
Figure 6 Summary of viewing trends of highest rating C and P programs on commercial television,
by children aged 0–14, 2005–13
Percentages indicate the size of the average viewing audience as a proportion of the universe estimate (or total potential viewing
audience). These percentages are known as Target Audience Rating Points (TARPs).
There is also evidence that FTA digital multichannels are serving a significant child
audience. In 2013, GO! (one of the Nine Network’s digital multichannels) broadcast
more than half of the top C and P programs (14 out of 26 programs).16
The top three C programs in 2013 were Wakkaville, Flea Bitten and Pixel Pinkie.
These three Australian drama programs were each broadcast as part of the Saturday
morning block of children’s programming on GO!. The large majority of C drama
programs were broadcast on weekends and public holidays.
9. How are parents involved in their children’s TV viewing?
The Newspoll survey identified the role that parents have in determining what their
children watch on television and how much they watch.
Six in 10 parents said adults were present all or most of the time during weekdays
(65 per cent) or weekends (58 per cent) when their child watched children’s television
programs. There is a correlation between the presence of an adult and the age of a
child—adult supervision is over 80 per cent when a child is under five years of age
compared to 40 per cent or fewer when a child is aged 10 or older.
Seventy-one per cent of parents said they were involved in choosing the channel or
programs their child watched. Again, there was a direct relationship between parental
involvement and the age of a child.
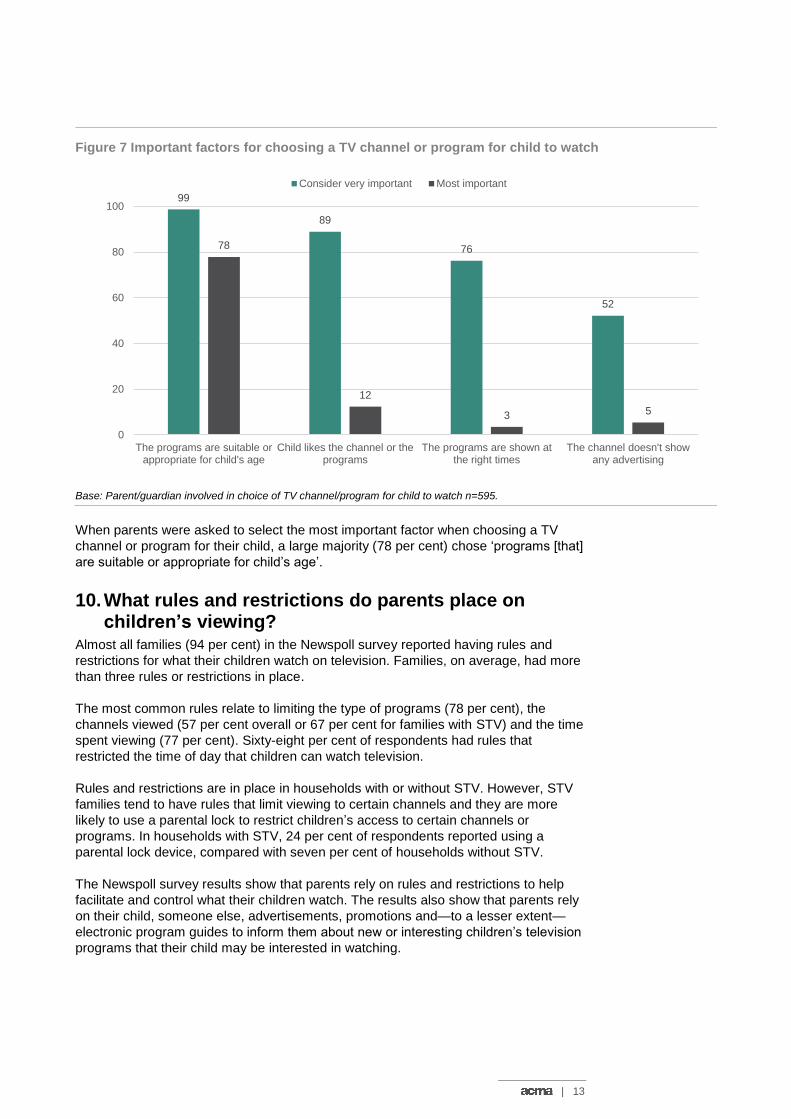
Parents indicated the factors that are important to them when choosing a TV channel
or program for their child to watch. Nearly all respondents (99 per cent) considered the
appropriateness of a program for the child’s age to be very important. Additionally,
over three-quarters of parents considered it very important that their child like a TV
channel or program and/or that a program is shown at the right time (see Figure 7).
16 See Attachment B for program list.
1.6–7.1%
0.3–0.7%0.2–1.0%
0
20,000
40,000
60,000
80,000
100,000
120,000
140,000
160,000
180,000
200,000
2005 2012 2013
Au
die
nce
siz
e (
ran
ge
)
| 13
Figure 7 Important factors for choosing a TV channel or program for child to watch
Base: Parent/guardian involved in choice of TV channel/program for child to watch n=595.
When parents were asked to select the most important factor when choosing a TV
channel or program for their child, a large majority (78 per cent) chose ‘programs [that]
are suitable or appropriate for child’s age’.
10. What rules and restrictions do parents place on children’s viewing?
Almost all families (94 per cent) in the Newspoll survey reported having rules and
restrictions for what their children watch on television. Families, on average, had more
than three rules or restrictions in place.
The most common rules relate to limiting the type of programs (78 per cent), the
channels viewed (57 per cent overall or 67 per cent for families with STV) and the time
spent viewing (77 per cent). Sixty-eight per cent of respondents had rules that
restricted the time of day that children can watch television.
Rules and restrictions are in place in households with or without STV. However, STV
families tend to have rules that limit viewing to certain channels and they are more
likely to use a parental lock to restrict children’s access to certain channels or
programs. In households with STV, 24 per cent of respondents reported using a
parental lock device, compared with seven per cent of households without STV.
The Newspoll survey results show that parents rely on rules and restrictions to help
facilitate and control what their children watch. The results also show that parents rely
on their child, someone else, advertisements, promotions and—to a lesser extent—
electronic program guides to inform them about new or interesting children’s television
programs that their child may be interested in watching.
99
89
76
52
78
12
3 5
0
20
40
60
80
100
The programs are suitable orappropriate for child's age
Child likes the channel or theprograms
The programs are shown atthe right times
The channel doesn't showany advertising
Consider very important Most important
14 |
Conclusion Children—especially young children—still watch programs that are specifically made
for them. Further, while parents believe it is important that commercial television
licensees continue to provide children’s programming, the research shows that
‘dedicated’ ABC children’s channels are consistently attracting a higher proportion of
the younger child audience than commercial television. Block programming on
commercial multi-channels (for example, on weekend mornings) is also successful in
attracting a higher child audience. At the same time, commercial television
broadcasters are attracting an older child audience aged 5–12 years, watching more
movies and general entertainment programs that have family appeal.
When parents are involved in selecting a TV channel or program for their child to
watch, they still consider it very important that the content is appropriate, the child
‘likes’ the TV channel or program and a program is shown at the right time.
While the research has not specifically examined the importance, if any, that parents
and children place on access to Australian programs, the OzTAM data shows that
Australian television programs have generally maintained their popularity with children
aged 0–4, 5–12 and 13–17 between 2001 and 2013. The OzTAM data also indicates
that the source of the top programs watched by children aged 0–4 has shifted from
Australia to the United Kingdom, which is likely a reflection of the availability of
programs on the dedicated ABC channel for children in this age group. In 2013,
Australian programming such as reality television and infotainment/lifestyle programs
were especially popular with the 13–17 age group.
Methodology Newspoll survey
The Newspoll omnibus research was conducted nationally with 1,137 respondents
aged 18 years and over with a child aged 0–15 living in their household. This included
954 respondents who were the parent, guardian or carer of a child aged 0–14.
Random sampling was used to select respondents.
Telephone interviews were conducted with respondents between 16 May and 1 June
2014 (using three rounds of the Newspoll national telephone omnibus). The main
focus of the Newspoll research was to:
gain a better understanding about parents’ preferences for the times children’s
television programs are scheduled and the extent of their involvement in choosing
the television channel(s) and programs their children watch
identify the rules or restrictions parents have for their children about watching
television, and the tools (if any) they use to enforce any rules or restrictions on
viewing
gain a better understanding about whether parents co-view with children watching
children’s programs on television or whether children view alone
gain a better understanding about the importance of children’s television programs
from a parent’s perspective.
OzTAM audience data
The OzTAM audience research provides insight into children’s television viewing
including:
patterns of children’s viewing and program ratings for commercial and ABC
channels between 2001 and 2013
specific analysis of audiences for C and P programs, as well as focusing on
children’s viewing of FTA television in the five metropolitan cities
children’s viewing of STV, where relevant.
| 15
The analysis of OzTAM audience and ratings data provides information on:
the size and availability of the child audience, as indicated by patterns of viewing
over the day
the amount of time children spend watching FTA, STV and commercial television
the most watched programs on FTA television—overall and for children’s programs
viewing of C and P programs by their respective target audiences, including case
studies of specific C programs
differences in viewing patterns and preferences between children at different
developmental stages, with data presented for children aged 0–4, 5–12 and 13–14
years
trends in children’s television viewing with data points from 2001 to 2013.
Unless stated otherwise, the OzTAM data cover five metropolitan Australian cities—
Adelaide, Brisbane, Melbourne, Perth and Sydney combined. Annual averages are
calculated over a calendar year from 6 am to midnight. From 2009, the FTA television
data includes both the primary channels and digital multi-channels, and the 2013 data
is consolidated, including ‘live’ and ‘playback’ viewing.
researchacma Our research program—researchacma—underpins our work and decisions as an
evidence-informed regulator. It contributes to our strategic policy development,
regulatory reviews and investigations, and helps us to make media and
communications work for all Australians.
researchacma has five broad areas of interest:
market developments
media content and culture
social and economic participation
citizen and consumer safeguards
regulatory best practice and development.
This research contributes to the ACMA’s media content and culture research theme.
acma.gov.au
CanberraRed Building Benjamin Offices Chan Street Belconnen ACT
PO Box 78 Belconnen ACT 2616
T +61 2 6219 5555F +61 2 6219 5353
MelbourneLevel 32 Melbourne Central Tower 360 Elizabeth Street Melbourne VIC
PO Box 13112 Law Courts Melbourne VIC 8010
T +61 3 9963 6800 F +61 3 9963 6899
SydneyLevel 5 The Bay Centre 65 Pirrama Road Pyrmont NSW
PO Box Q500 Queen Victoria Building NSW 1230
T +61 2 9334 7700 1800 226 667 F +61 2 9334 7799
Recommended