Embed Size (px)
Citation preview

Developmental Psychology1990, Vol. 26, No. 3,409-420
Copyright 1990 by the American Psychological Association, Inc.0012-1649/90/$00.75
Development of Television Viewing Patterns in Early Childhood:A Longitudinal Investigation
Aletha C. Huston, John C. Wright, Mabel L. Rice, Dennis Rerkman, and Michelle St. PetersCenter for Research on the Influence of Television on Children (CRITC)
Department of Human DevelopmentUniversity of Kansas
A 2-year longitudinal study of children from ages 3 to 5 and 5 to 7 investigated age changes andenvironmental influences on TV viewing. Viewing child-informative programs declined with age;viewing cartoons and comedies increased. No age changes occurred on other types of entertainmentprograms. With increasing age, children watched programs with increasing cognitive demands—less redundancy, longer temporal integration demands, and increasing complexity. Boys watchedmore cartoons and action-adventure programs than did girls. Cable subscription and changes inprogram availability over time also accounted for amount and type of viewing. Individual differencesin TV viewing remained highly stable over 2 years. It was concluded that cognitive and developmentalchanges are less important determinants of TV use than are family patterns and external variablesaffecting the opportunity to view.
By the time American children are 18 years old, they havespent more time watching television than in any other activityexcept sleep. Moreover, their experiences with television beginlong before exposure to school or, in many cases, any socializa-tion agent other than the family. Infants respond to the sightsand sounds of television, and by the second year of life, theyreact to characters and events on television by imitation, point-ing, verbal labeling, and selective attention (Hollenbeck &Slaby, 1979; Lemish& Rice, 1986; Meltzoff, 1988).
As the television set is a ubiquitous part of most children'senvironments from birth onward, the preschool years are alikely period for socialization of television habits. The average3- or 4-year-old spends 2-4 hours a day watching television(Comstock, Chaffee, Katzman, McCoombs, & Roberts, 1978;Friedrich & Stein, 1973; Singer & Singer, 1981). Home observa-tions show that during the first few years of life, children becomeincreasingly attentive to programs when they are in the vicinityof the television set (Anderson, Lorch, Field, Collins, & Nathan,1986).
Less is known about the kinds of programming childrenwatch than about the amount of time they spend watching. Tounderstand the role of television in children's lives, it is at leastas important to consider the nature of the programming they
This research was supported by Grant MH-39595 from the NationalInstitute of Mental Health.
The authors are grateful to Marilyn Bremer, who coordinated datacollection and maintained good relations with the families, and to manyothers who participated in various parts of the data collection and analy-sis.
Dennis Kerkman is now at the Department of Psychology, CarnegieMellon University.
Correspondence concerning this article should be addressed toAletha C. Huston, Department of Human Development, University ofKansas, Lawrence, Kansas 66045.
view as it is to measure the quantity of it. Just as reading News-week is not equivalent to reading a comic book, so watching"Sesame Street" is different from watching a soap opera.
The investigation reported here was a longitudinal assess-ment of the types as well as the amounts of children's early view-ing experiences, tracing the course of home viewing from ages 3to 7. It constitutes the most comprehensive assessment of earlytelevision viewing to date. Among the major questions ad-dressed were the following: What developmental changes occuras a function of age or cognitive development? What individualattributes and/or environmental variables affect children'sviewing patterns? How is viewing related to secular changes intelevision programming? How stable are individual differencesin viewing patterns over time?
Individual Attributes Versus Environmental Influences
Recent theory and empirical study have emphasized the roleof cognitive variables—children's ability to comprehend, drawinferences, and integrate the content—as influences on viewing(e.g., Bryant & Anderson, 1983). For example, Anderson andhis colleagues have demonstrated that children lose interest inmaterial that is incomprehensible and attend to material thatis clearly within their range of comprehensibility (Anderson &Lorch, 1983).
Interests, goals for viewing, and motivations constitute an-other set of individual characteristics guiding viewing. Individ-uals watch television to satisfy a variety of needs or to gratify awide range of interests (Rosengren, Wenner, & Palmgreen,1985; Wright & Huston, 1983). For example, gender differencesin viewing presumably reflect the influence of individuals' sex-typed interests and motivations. Boys watch a little more televi-sion than do girls during childhood (Singer & Singer, 1981),particularly such violent programs as cartoons and action ad-ventures (Comstock et al., 1978; Huesmann & Eron, 1986). Inlaboratory observations, boys are often more attentive than
409

410 HUSTON, WRIGHT, RICE, KERKMAN, AND ST. PETERS
girls to cartoons and to commercials with high rates of action,violence, and visual special effects (Alvarez, Huston, Wright, &Kerkman, 1988).
Individual preferences are only one basis for viewing deci-sions. Most young children use television in an environmentalcontext in which parents and siblings select programs and par-ents regulate or encourage viewing. Broadcasters' decisionsabout programming and parents' decisions about subscribingto cable or buying a videoplayer determine what is available toview. Alternative activities affect television viewing choices (Pi-non, Huston, & Wright, 1989). Television can readily be con-ceived as a default option for spending time, chosen when noth-ing else interferes or has strong appeal and rather automaticallyreturned to when other activities end. One mundane illustrationis the well-documented seasonal fluctuation in television view-ing—people watch more in the winter than in the summer(Comstock et al., 1978).
Development as a Function of Age and Secular Change
Life-span developmental theory provides a broad frameworkfor understanding development because it includes changes as-sociated with age and those associated with secular events(Baltes & Schaie, 1973). Although psychologists typically thinkabout development as ontogenetic change, sociologists such asElder (1973) have demonstrated the usefulness of examiningsecular, historical changes as determinants of individual devel-opment.
Age Changes
The comprehensibility of program content is one importantdeterminant of young children's attention to television in labo-ratory settings (Anderson & Smith, 1984; Field & Anderson,1985). Clearly, what can be comprehended is a joint functionof program content and the knowledge that the viewer brings toit. Thus, developmental change in knowledge is a major reasonfor expecting age-related changes in viewing. Such knowledgecan be conceptualized as a set of schemata derived from regular-ities and redundancies in one's experiences (Anderson & Lorch,1983; Collins, 1983; Huston & Wright, 1989). Schemata in-clude expectancies about situations that permit the person toanticipate and organize incoming information; they guide at-tention, influence memory, and generate inferences about con-tent (Fiske & Taylor, 1984). Television programs that containrepeated characters and settings across episodes lend them-selves to schema formation; the regular viewer approaches anew episode with considerable knowledge about the characters,likely actions, and probable events, together with their signifi-cance in context. Hence, program series with high redundancyacross episodes are likely to be more comprehensible than thosewith low redundancy, particularly to young children who donot bring a large store of world knowledge to their televisionexperience.
The difficulty level of a program also depends on the degreeto which temporally separate events must be integrated (Col-lins, 1982, 1983). In a complex story, young children often donot connect a character's motive, shown in one part of a story,with the character's actions, shown in another part of the story.
Hence, long stories are relatively difficult to understand. Tem-poral integration abilities develop gradually during the child-hood years and depend on an expanding representational andmnemonic capability as well as a growing familiarity with themedium (Collins, 1983).
These two dimensions, redundancy and temporal integrationrequirements, plus program categories, were used in the pres-ent study as means of denning the cognitive difficulty of televi-sion programs. Viewing programs with greater cognitive de-mands was expected to increase with age. Because of the limitedage range studied (3 to 7 years), none of the children were ex-pected to shift to the most cognitively demanding programs.
Age changes may also result from age-correlated events. Themost obvious candidate for this age group is school entry, whichoccurs at two identifiable points (half-day kindergarten and full-day primary school). Survey data show a slight decline in totaltelevision viewing around age 6 that is probably due to timespent in school (Comstock et al., 1978).
Secular Change
Secular or historical change in the availability of differenttypes of programming and changes in the technology of televi-sion dissemination can produce developmental changes inviewing patterns. For example, over the period from 1981 to1983, when the present data were collected, network stationsreduced the amount of children's informative programmingbroadcast to less than 30 min per week (Kerkman, Kunkel,Huston, Wright, & Pinon, in press). Introduction of cable op-tions in a community also changes the viewing environmentdramatically, and the sudden proliferation of VCRs and videostores has multiplied options still more rapidly.
Psychologists are sometimes tempted to dismiss the effects ofsuch variables on the grounds that they are mundane or obvi-ous. On the contrary, there is considerable conceptual value inlearning how large a role such variables play in viewing patterns.If changes in television habits over time are primarily a functionof what is available to watch, then a model that assumes thatindividual development and preferences are the primary basesfor viewing decisions comes into question.
In the present study, a longitudinal design permitting separa-tion of age—based from historical or secular (time of measure-ment) changes—was selected (Nesselroade & Baltes, 1979). Inthe one existing longitudinal study of preschool children, mea-surements were collected four times in one year for two cohorts(3- and 4-year-olds). The changes over time were nonlinear anddifficult to interpret, probably because secular effects were con-founded with age changes (Singer & Singer, 1981).
Stability of Individual Differences
The longitudinal design also permitted assessment of the sta-bility of individual differences, independently from meanchanges. If the relative amounts of viewing over time remainstable, then early childhood may be an important time for theestablishment of long-term patterns of television use. Lack ofstability would suggest that viewing is subject to variables thatchange fairly rapidly, and might indicate a less important rolefor early childhood in acquiring habits of television use.

EARLY TELEVISION VIEWING 411
The few longitudinal studies available suggest some stabilityof television viewing. Singer and Singer (1981) found fairly highconsistency of total viewing times, as well as viewing in mostprogram categories over the course of one year. Other investiga-tions of older children have reported moderate to high stabil-ities in the amount of violent programming viewed (Hues-mann, 1982; Milavsky, Kessler, Stipp, & Rubens, 1982).
Continuities or developmental progressions (McCall, 1977)from one type of programming to another were also investi-gated in the present study. The major question addressed waswhether early viewing of certain types of program (e.g., infor-mative programs or cartoons) predicts later viewing of pro-grams with similar form or content (e.g., humorous or violentprograms).
In summary, the study reported here was a longitudinal inves-tigation of young children's home television viewing patterns,emphasizing the types of programs viewed rather than totalviewing time. Its design permits differential attribution ofchanges in viewing to age, cognitive demands of programs, andsecular, environmental influences such as viewing opportuni-ties and alternate means of television distribution. It containsan analysis of stabilities of children's television viewing overtime by program categories and analyses of the developmentalprogressions from one type of program to another.
Table 1Design of Longitudinal Study: Ages of Children atEach Time of Measurement
Method
Sample
The initial sample consisted of 326 children and their families in To-peka, Kansas. The children were within 3 months of their third (n =160) or fifth (n = 166) birthdays at the beginning of the study. Theywere recruited through newspaper birth records, preschools, churches,mass media publicity, and posters placed in large office buildings, laun-dromats, and grocery stores. The sample was predominantly White, andall but 18 families had both parents living in the home at the beginningof the study. Educational level of each parent was coded on a scale inwhich 1 = less than high school, 2 = high school graduate, 3 = somepost-high-school training, 4 = bachelor's degree, 5 = some postgraduatetraining, and 6 = graduate or professional degree. For fathers, the meanwas 3.78 (SD = 1.40); for mothers, the mean was 3.35 (SD = 1.23).
Occupational status was rated on the Duncan scale, which has a rangefrom 1 to 99 (Duncan, 1961). For fathers, the mean was 52.73 (SD =23.90); for mothers, the mean was 52.18 (SD = 18.52).1 The samplerepresented a wide range of educational and occupational levels, but itwas a volunteer sample in which White, intact, relatively stable familieswere overrepresented. (One necessary criterion for inclusion in thestudy was the intention to stay in Topeka for at least 2 years.)
An additional sample of 41 children in the two cohorts was recruitedfor a single diary collection at the end of the longitudinal study in orderto test for the effects of repeated diary collection. The demographiccharacteristics of their families were similar to the main study sample(fathers' mean education = 3.70; mothers' mean education = 3.14; fa-thers' Duncan = 55.72; mothers' Duncan = 54.37).
Design
The design was a combination of cross-sequential and cohort-sequen-tial methods (Nesselroade & Baltes, 1979). It is summarized in Table 1.Two cohorts, 3 and 5 years old at the beginning of the study, were fol-lowed for a 2-year period. Within each of these groups, there were twosubcohorts who began the study at different times: Children with birth-
Birth cohort/start time
Jan-Aug 1978Spring
Sept 1978-Feb 1979
FallJan-Aug 1976
SpringSept 1976-
Feb 1977Fall
1981
Spring
3(1)
5(1)
Fall
3'/2
(2)
3(1)
5V2*
(2)
5(1)
Age of children
1982
Spring
4(3)
Vh(2)6
(3)
5'/2(2)
Fall
4'/2(4)
4(3)
6'/2b
(4)
6'(3)
1983
Spring
5(5)
4V2(4)7
(5)
6'/2(4)
Fall
5(5)
7"(5)
Note. Figures in parentheses are waves.a Entered kindergarten. b Entered first grade.
days from February through August began the study in the spring of1981; children with birthdays from September through the followingFebruary began in the fall of 1981. For clarity, these subcohorts arereferred to as having spring and fall start times, respectively.
Viewing was measured from diaries maintained by the parents for 1week in the spring and 1 week in the fall for 2 years (a total of fivediaries). Viewing by all members of the household was recorded in 15-min intervals from 6:00 a.m. to 2:00 a.m. for each day. If children werein regular day-care, their viewing was recorded by the caregiver. Springand fall were sampled to avoid the extremes of heavy viewing in winteror light viewing in summer. Although each family kept a diary for only1 week, each time of measurement lasted approximately 3 weeks, withfamilies spread across them in order to reduce the effects of weather andhistorical incidents (e.g., the assassination of President Sadat of Egypt)on the viewing measure.
Parents were instructed to record as a viewer anyone who was presentfor more than one half of a 15-min interval in which the television wasturned on. This definition was adopted to avoid the necessity for paren-tal judgments of when the child was watching, but it undoubtedly re-sulted in some overestimation of true viewing. Anderson, Field, Collins,Lorch, and Nathan (1985) compared similar diaries with videotapesmade in the home during viewing. Diaries slightly overestimated chil-dren's viewing time, but the correlation between the two methods atthis age level was .84, indicating that such diaries are a valid method ofassessing individual differences. In the present study, validity was alsoassessed indirectly by examining errors in the diaries (e.g., wrong pro-gram title for time and channel listed). Two children were eliminatedbecause their diaries contained large numbers of errors.
A total of 271 subjects returned four (n = 27) or five (n = 244) diariesand were, therefore, considered to have sufficient data for analyses ofviewing. To determine whether there was selective retention, t tests wereperformed comparing the retained sample with those who weredropped on the following variables measured in an initial home visit: sexof child, starting season, parent education, parent occupational status,
1 Although individual occupations receive different ratings on theDuncan, they can be understood from the following average ratings:professional and technical workers = 75; managers, officials, and propri-etors = 57; clerical and sales workers = 47; craftsmen and foremen =31; operatives and service workers = 18; and laborers = 7.
412 HUSTON, WRIGHT, RICE, KERKMAN, AND ST. PETERS
maternal employment, family size, sibling composition, cable options,number of television sets, child's score on the Peabody Picture Vocabu-lary Test (PPVT-R; Dunn & Dunn, 1981), child's preschool atten-dance, and child's media preferences. There were no significant differ-ences; therefore, the retained sample was comparable with the originalsample.
Classification of Television Programs
Because the theoretical framework emphasized the categories of pro-gramming viewed, an extensive coding system was developed for catego-rizing available television programs (Center for Research on the Influ-ence of Television on Children, 1983). Each program was classified onsix dimensions. Four of these were similar to those used in other mediaresearch: (a) intended audience (child or general), (b) informative pur-pose (yes or no), (c) animation used (full, partial, none), and {A)programtype (real world events and information, variety, comedy, drama, or ac-tion adventure). The other two dimensions were designed to index thecognitive processing demands of the program: (e) Redundancy (or fa-miliarity) was defined as the degree of repetition of scenes and charac-ters from one episode to another. It was intended to assess the extent towhich regular viewers could form schemata for a program series thatwould supply an interpretive context for understanding later episodes.It was coded on a scale from most settings and characters are the sameacross episodes (1) to no continuing characters or settings (4). High scalescores thus represent more difficult programs to understand. Temporalintegration demands (f) were defined by the average time span duringwhich a continuous plot or theme endures. They were coded on a scalefrom 1 = less than five minutes (e.g., "Sesame Street," news) to 6 =multiple episodes (e.g., miniseries, soap opera).
All of the programs in the "TV Guide" and cable guides for the view-ing weeks were coded on the basis of raters' knowledge of the series anddescriptions in the television guides. Of the 5,007 titles in the list, theproportions that could be coded on each dimension were as follows:audience = 95.7%, purpose = 95.9%, animation = 95.1%, programtype = 90.2%, temporal integration demands = 90.6%, and redun-dancy = 91.1%. The few programs that could not be coded on one ormore dimensions were almost never viewed by our sample of families.
A total of 12 graduate students and PhD-level staff members servedas coders over the 3 years. To establish intercoder agreement, pairs ofindividuals independently coded the television listings for 1 weekdayand 1 weekend day. The percentage of programs coded identically wascalculated. The average interrater agreements on each dimension wereas follows: audience = 97%, purpose = 95%, animation = 98%, programtype = 93%, temporal integration demands = 86%, and redundancy =84%. When new coders were trained, their ratings were compared withthose of an experienced coder until they reached the above levels ofagreement.
Each program viewed by a child was assigned ratings on each dimen-sion from the master file of coded programs. Any programs viewed thatdid not appear in the television guides (e.g., videotapes) were also codedwhenever possible. Viewing could then be calculated as the amount oftime (number of 15-min spots) the child viewed any program category,defined by a single dimension or a combination of dimensions.
If programs had been subdivided on all six dimensions simulta-neously, there could have been as many as 1,440 cells, many of themempty because they contain no television programs or little viewing.For the present analyses, programs were separated by intended audience(child programs and general audience programs), then further subdi-vided in three different ways. The first subdivision, designating programtype, was based on intended audience, informative purpose, animation,and program content. The second was based on redundancy and thethird on temporal integration demands.
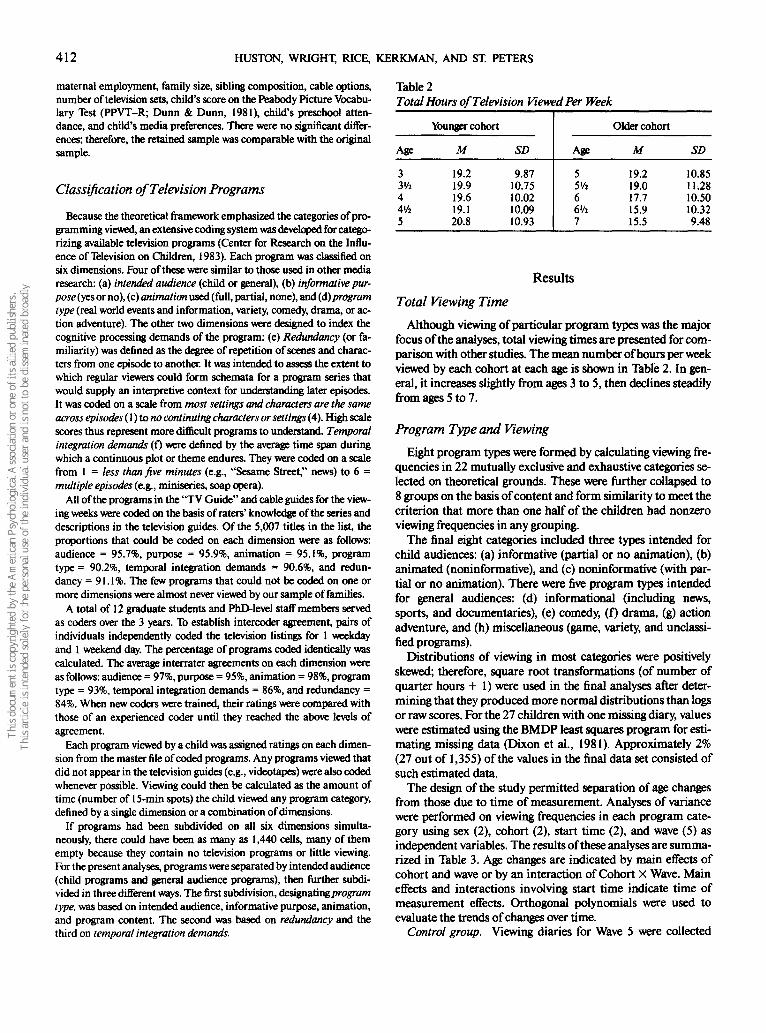
Table 2Total Hours of Television Viewed Per Week
Age
33'/244'/25
Younger cohort
M
19.219.919.619.120.8
SD
9.8710.7510.0210.0910.93
Age
55'/266'/27
Older cohort
M
19.219.017.715.915.5
SD
10.8511.2810.5010.329.48
Results
Total Viewing Time
Although viewing of particular program types was the majorfocus of the analyses, total viewing times are presented for com-parison with other studies. The mean number of hours per weekviewed by each cohort at each age is shown in Table 2. In gen-eral, it increases slightly from ages 3 to 5, then declines steadilyfrom ages 5 to 7.
Program Type and Viewing
Eight program types were formed by calculating viewing fre-quencies in 22 mutually exclusive and exhaustive categories se-lected on theoretical grounds. These were further collapsed to8 groups on the basis of content and form similarity to meet thecriterion that more than one half of the children had nonzeroviewing frequencies in any grouping.
The final eight categories included three types intended forchild audiences: (a) informative (partial or no animation), (b)animated (noninformative), and (c) noninformative (with par-tial or no animation). There were five program types intendedfor general audiences: (d) informational (including news,sports, and documentaries), (e) comedy, (f) drama, (g) actionadventure, and (h) miscellaneous (game, variety, and unclassi-fied programs).
Distributions of viewing in most categories were positivelyskewed; therefore, square root transformations (of number ofquarter hours + 1) were used in the final analyses after deter-mining that they produced more normal distributions than logsor raw scores. For the 27 children with one missing diary, valueswere estimated using the BMDP least squares program for esti-mating missing data (Dixon et al., 1981). Approximately 2%(27 out of 1,355) of the values in the final data set consisted ofsuch estimated data.
The design of the study permitted separation of age changesfrom those due to time of measurement. Analyses of variancewere performed on viewing frequencies in each program cate-gory using sex (2), cohort (2), start time (2), and wave (5) asindependent variables. The results of these analyses are summa-rized in Table 3. Age changes are indicated by main effects ofcohort and wave or by an interaction of Cohort X Wave. Maineffects and interactions involving start time indicate time ofmeasurement effects. Orthogonal polynomials were used toevaluate the trends of changes over time.
Control group. Viewing diaries for Wave 5 were collected
EARLY TELEVISION VIEWING 413
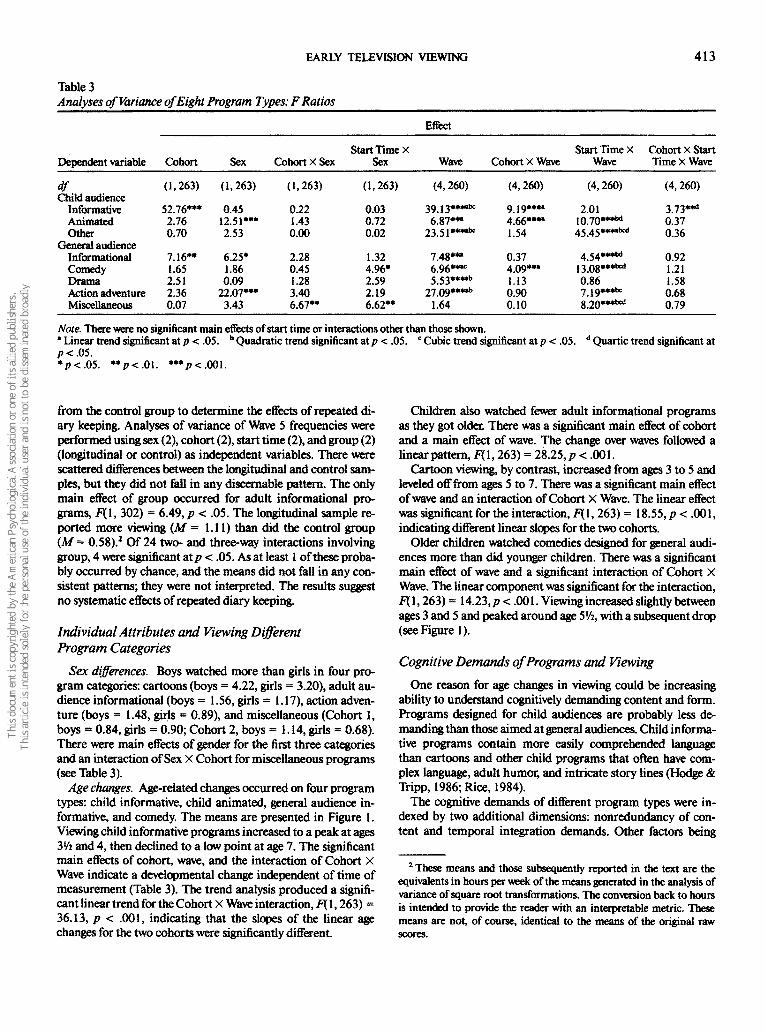
Table 3Analyses of Variance of Eight Program Types: F Ratios
Dependent variable
dfChild audience
InformativeAnimatedOther
General audienceInformationalComedyDramaAction adventureMiscellaneous
Cohort
(1,263)
52.76***2.760.70
7.16**1.652.512.360.07
Sex
(1,263)
0.4512.51***2.53
6.25*1.860.09
22.07***3.43
Cohort X Sex
(1,263)
0.221.430.00
2.280.451.283.406.67**
Start Time xSex
(1,263)
0.030.720.02
1.324.96*2.592.196.62**
Effect
Wave
(4,260)
39.13***"1*6.87***
235i«««bc
7.48***6.96**"5.53***1"
27.09****"1.64
Cohort X Wave
(4,260)
9.19***4.66****1.54
0.374.09**"1.130.900.10
Start Time XWave
(4,260)
2.0110.70***w
45.45***"bod
454. . .MMM*****0.867.19****0
8.20***1**!
Cohort X StartTime X Wave
(4,260)
3.73**1
0.370.36
0.921.211.580.680.79
Note. There were no significant main effects of start time or interactions other than those shown.* Linear trend significant at p < .05. b Quadratic trend significant at p < .05. c Cubic trend significant at p < .05. d Quartic trend significant at
*p<.05. **p<.01. ***/><.001.
from the control group to determine the effects of repeated di-ary keeping. Analyses of variance of Wave 5 frequencies wereperformed using sex (2), cohort (2), start time (2), and group (2)(longitudinal or control) as independent variables. There werescattered differences between the longitudinal and control sam-ples, but they did not fall in any discemable pattern. The onlymain effect of group occurred for adult informational pro-grams, F(l, 302) = 6.49, p < .05. The longitudinal sample re-ported more viewing (M - 1.11) than did the control group(Af = 0.58).2 Of 24 two- and three-way interactions involvinggroup, 4 were significant atp < .05. As at least 1 of these proba-bly occurred by chance, and the means did not fall in any con-sistent patterns; they were not interpreted. The results suggestno systematic effects of repeated diary keeping.
Individual Attributes and Viewing DifferentProgram Categories
Sex differences. Boys watched more than girls in four pro-gram categories: cartoons (boys = 4.22, girls = 3.20), adult au-dience informational (boys = 1.56, girls = 1.17), action adven-ture (boys = 1.48, girls = 0.89), and miscellaneous (Cohort 1,boys = 0.84, girls = 0.90; Cohort 2, boys =1.14, girls = 0.68).There were main effects of gender for the first three categoriesand an interaction of Sex X Cohort for miscellaneous programs(see Table 3).
Age changes. Age-related changes occurred on four programtypes: child informative, child animated, general audience in-formative, and comedy. The means are presented in Figure 1.Viewing child informative programs increased to a peak at agesVh and 4, then declined to a low point at age 7. The significantmain effects of cohort, wave, and the interaction of Cohort XWave indicate a developmental change independent of time ofmeasurement (Table 3). The trend analysis produced a signifi-cant linear trend for the Cohort X Wave interaction, F( 1,263) =36.13, p < .001, indicating that the slopes of the linear agechanges for the two cohorts were significantly different.
Children also watched fewer adult informational programsas they got older. There was a significant main effect of cohortand a main effect of wave. The change over waves followed alinear pattern, F( 1,263) = 28.25, p < .001.
Cartoon viewing, by contrast, increased from ages 3 to 5 andleveled off from ages 5 to 7. There was a significant main effectof wave and an interaction of Cohort X Wave. The linear effectwas significant for the interaction, F{ 1,263) = 18.55, p < .001,indicating different linear slopes for the two cohorts.
Older children watched comedies designed for general audi-ences more than did younger children. There was a significantmain effect of wave and a significant interaction of Cohort XWave. The linear component was significant for the interaction,F\ 1,263) = 14.23, p < .001. Viewing increased slightly betweenages 3 and 5 and peaked around age 5Vi, with a subsequent drop(see Figure 1).
Cognitive Demands of Programs and Viewing
One reason for age changes in viewing could be increasingability to understand cognitively demanding content and form.Programs designed for child audiences are probably less de-manding than those aimed at general audiences. Child informa-tive programs contain more easily comprehended languagethan cartoons and other child programs that often have com-plex language, adult humor, and intricate story lines (Hodge &Tripp, 1986; Rice, 1984).
The cognitive demands of different program types were in-dexed by two additional dimensions: nonredundancy of con-tent and temporal integration demands. Other factors being
2 These means and those subsequently reported in the text are theequivalents in hours per week of the means generated in the analysis ofvariance of square root transformations. The conversion back to hoursis intended to provide the reader with an interpretable metric. Thesemeans are not, of course, identical to the means of the original rawscores.

414 HUSTON, WRIGHT, RICE, KERKMAN, AND ST. PETERS
CHILD INFORMATIVEPROGRAMS
H
O
CO
cr
E-ioo
CO
CHILD ANIMATEDPROGRAMS
5 ?
- SPRINGSTARTTIME
-6- FAU-ST ARTTIME
CHILD NONINFORMATIVE"PROGRAMS
V-7
ADULT INFORMATIVEPROGRAMS
ADULT COMEDYPROGRAMS
7
6 7
ADULT DRAMAPROGRAMS
ADULT ACTION/ADVENTUREPROGRAMS
ADULT MISCELLANEOUSPROGRAMS
1961 1962 1983
COHORT 11981 1962 1983
COHORT 2TIME OF MEASUREMENT
S F S F S F S F S F S F1981 1982 1963 1981 1982 1983
COHORT 1 COHORT 2TIME OF MEASUREMENT
Figure 1. Mean viewing frequencies for each age level and time of mea-surement for eight categories of child and general audience programs.(Units are transformed scores [SQ = square root of number of quarterhours of viewing + 1 ]. Equivalents in hours per week are SQ 1.0 = 0 hr;SQ 2.0 = 0.75 hr; SQ 3.0 = 2.0 hr; SQ 4.0 = 3.75 hr; and SQ 5.0 = 6.00hr. S = spring measurement [April]; F = fall measurement [October].Numbers at each data point indicate children's age.)
were clearly more redundant (average level was 1 = highly re-dundant) and less temporally demanding (average duration =16-30 min) than dramas and action adventure series (averageredundancy was 2 = some recurring characters and settings; av-erage duration = >60 min).3
For each analysis, programs were first classified as child oradult audience, but they were not further subdivided by pro-gram type because many children had zero viewing frequenciesin at least one of the smaller cells. The average redundancy ofthe child audience and general audience programs viewed byeach child were computed as follows. Each 15-min interval ofviewing was assigned a value of 1 to 4 on the basis of the redun-dancy rating of the program broadcast. The sum of the ratingsfor all of the intervals viewed was divided by the number ofintervals viewed to obtain the average redundancy level of theprograms viewed—a measure that is independent of viewingfrequency. Subjects with zero viewing in child or general audi-ence programs for any wave were excluded leaving 250 and 248subjects for child and general audience program analyses, re-spectively. Analyses of variance of sex (2) X cohort (2) X starttime (2) X wave (5) were performed on these scores.
Age changes in redundancy of programs viewed. For childaudience programs, there were significant main effects of co-hort, F(l, 242) = 5.64,p < .05, and wave, F{4,239) = 2.71, p <.05. The means are shown in Figure 2. As predicted, the oldercohort watched programs that were less redundant than thoseviewed by the younger cohort. There was a slight increase withage (wave) modified by a dip at the fourth time of measurement.Consequently, there was a significant cubic trend in the maineffect of wave, F\l, 239) = 9.07, p < .01.
The mean redundancy scores for general audience programs,divided by gender, are also shown in Figure 2. There was a sig-nificant main effect of wave, F(4, 238) = 3.37, p < .01, andsignificant interactions of Sex X Cohort, F(l, 241) = 7.94, p <.01, and Sex X Cohort X Wave, F(4,238) = 2.58, p < .05. Noneof the orthogonal polynomials was significant. Inspection ofFigure 2 indicates that older boys watched more nonredundantprograms than did younger boys; older girls were not muchdifferent from younger girls.
Age changes in temporal integration demands of programsviewed. The second method of assessing program difficulty wasclassification based on the length of the average content unit.The average temporal integration levels of child audience andgeneral audience programs viewed by each child were com-puted following the same procedure as that used for redun-dancy. Each 15-min interval was assigned a value of 1 to 6 onthe basis of the temporal integration demand of the programviewed. For each wave, the sum was divided by the total numberof intervals viewed to obtain an average level. The average tem-
equal, programs that are redundant and pose few temporal in-tegration demands were expected to be less demanding andmore readily comprehended than those that are nonredundantor have high integration requirements. These variables may bebetter indexes of cognitive demands for programs aimed atchild audiences than for general audience programs because thelatter include more varied form and content (e.g., news, variety,and dramatic series). However, general audience comedy series
3 It would appear that differences among program types in redun-dancy or temporal integration could be established by calculating meanlevels for each category. However, if each program title is weightedequally, then movies and specials are seriously overweighted in compari-son with series. The other alternative would involve weighting each bythe amount of time it was broadcast per week, but that process alsointroduces some distortions because some broadcast times are muchmore accessible than others. Therefore, typical levels for series wereconsidered more representative than overall means.

EARLY TELEVISION VIEWING 415
2.2
2
1.8
1.0
1.4
1.2
1
REDUNDANCYCHILD PROGRAMS
2.2
2
1.8
1.0
1.4
1.2
1
2.2
2
l.B
1.0
1.4
1.2
1
REDUNDANCYvADULT PROGRAMS
- B O Y S
-o- GIRLS
TEMPORAL INTEGRATION DEMANDSCHILD PROGRAMS
3 4 5COHORT 1
5 0 7COHORT 2
CHRONOLOGICAL AGE
Figure 2. Mean scores for redundancy and temporal integrationdemand of programs viewed at different age levels.
poral integration levels were subjected to analyses of varianceof sex (2) X cohort (2) X start time (2) X wave (5).
For child audience programs, there were significant maineffects of cohort, F(l, 242) = 43.59, p < .001, and wave, ^ 4 ,239) = 11.02, p < .001. The means appear in Figure 2. As ex-pected, the mean temporal integration level of programs viewedincreased with age, both within and between cohorts. The lineartrend for wave was significant, F( 1,239) = 38.61, p < .001. Theolder cohort watched more demanding programs than did theyounger cohort, and temporal integration levels increasedacross waves. For adult audience programs, there were nodifferences associated with cohort or wave.
Time of Measurement Effects on Viewing
Time of measurement effects were manifested in significantinteractions of Start Time X Wave on six of the eight programtypes (see Table 3). Almost all of the trends were nonlinear.These changes have substantive interest as indicators of the in-fluence of age-related events, broadcasting changes, or othersecular changes, but they also demonstrate the importance of
the cohort sequential component of the design for separatingage change from secular change. The parallel curves for thespring and fall start times associated with time of measurementare evident in Figure 1. The time of measurement effects appearto reflect two types of influences: age-correlated events and sec-ular changes in television programming.
Age-correlated events. For child informative programs, thesignificant interaction of Cohort X Start Time X Wave indicatesthat children in the two start times followed different develop-mental patterns within each cohort. The quartic trend for theinteraction was significant, F{\, 263) = 14.65, p < .001. Thedifferences for the two start times in Cohort 2 are probably dueto the fact that they entered school at different ages. The spring-start-time children were eligible for kindergarten in the fall of1981 and for first grade in the fall of 1982. The fall-start-timechildren, who were 6 months younger, began school one yearlater because of the September-1 school cutoff. Drops in viewingwere associated with school entry points, as indicated on Fig-ure 1.
In Cohort 1, children in the two start times were equally likelyto be in preschool at age 3, but significantly more spring-groupchildren were in preschool or child care by age 5, r( 121 ) = 0.18,p < .05. As preschool attendance was negatively associated withviewing child informative programs (Pinon et al., 1989), it mayaccount for the lower frequencies of the spring group.
Program Availability
Changes in viewing that occurred at similar times of mea-surement for both cohorts and both start time groups may bedue to changes in what is available to view. The effects of pro-gram availability on viewing were tested in two ways: (a) Fami-lies with different levels of cable service were compared and (b)changes in availability over time were compared with changesin mean levels of viewing.
Cable subscription. Families had one of three levels of cableservice: (a) Broadcast only received three network affiliates anda public broadcasting station (PBS) affiliate, (b) basic cable sup-plied six network affiliates, two PBS affiliates, two commercialindependent channels, and four special interest cable channels,and (c) pay movie received basic cable plus home box office(HBO), Cinemax, and/or Disney (in the sixth time of measure-ment only). Differences among these levels of cable service wereevaluated in analyses of variance of viewing in the eight pro-gram types using cable subscription level (3), sex (2), cohort (2),start time (2) and wave (5) as independent variables.
Cable subscribers viewed relatively low amounts of child in-formative programming, F(2,247) = 5.64, p < .05. The meanswere as follows: broadcast = 3.39, cable = 2.50, and movie =2.42. Cable subscribers viewed more cartoons, F[2, 247) =11.20, p < .001, and comedies, F(2, 247) = 4.50, p < .05. Themeans for cartoons were as follows: broadcast = 3.08, cable =3.77, and movie = 4.55; the means for comedies were as follows:broadcast = 2.61, cable = 2.86, and movie = 3.45.
These overall patterns were modified by interactions of Ca-ble X Start Time for cartoons, ^ 2 , 247) = 3.30, p < .05, andcomedies, F(2, 247) = 4.57, p < .05. For cartoons, the spring-start-time means were as follows: broadcast = 3.55, cable =3.24, and movie = 4.68; the fall-start-time means were broad-

416 HUSTON, WRIGHT, RICE, KERKMAN, AND ST. PETERS
cast = 2.66, cable = 4.31, and movie = 4.42. For comedies,spring-start-time means were broadcast = 2.95, cable = 2.34,and movie = 3.53; fall-start-time means were broadcast = 2.31,cable = 3.55, and movie = 3.42.
The Disney channel was added to the cable system in fall1983. Families of 16 children in the fall start time subscribed.The effects on viewing were evaluated in analyses of variancefor fall-start-time children of Disney subscription (2) X cohort(2) X waves 1-4 versus 5 (2). The interaction of Disney X Wavewas significant for child noninformative programs, F[l, 66) =83.06, p < .001, the program category that was increased mostby Disney. Waves 1 -4 means for children with and without Dis-ney were 0.73 and 0.61, respectively; in Wave 5, means were3.71 and 0.35, respectively. Children with Disney increased theamount of child noninformative programming viewed; thosewithout it declined slightly.
Temporal changes in availability. To determine changes inavailability over time, all programs broadcast from 6:00 a.m. to10:00 p.m. during the six 2-week periods in which viewing datawere collected (spring and fall in 1981, 1982, and 1983) weretabulated according to the eight program types. Availability wasdenned as the total number of hours during which at least oneprogram of a given type was broadcast. This index was choseninstead of the total number of hours because stations oftenbroadcast similar programs simultaneously (e.g., Saturday-morning cartoons). If 20 hr of programming occurs during a 5-hr period, the true availability is 5 hr. Program availability wascalculated for each of the three levels of cable subscription:broadcast only, basic cable, and pay movies. The availability in-dices are shown in Figure 3.
Program availability over the six times of measurement wascompared with mean viewing levels for the six categories inwhich there were significant interactions of Start Time X Wave(Table 3). The parallels can be examined visually by comparingFigures 1 and 3. Spearman rank order correlations were calcu-lated between mean viewing frequency and mean availabilityfor six times of measurement (i.e., each n = 6). Such corre-lations have meaning only in instances in which there were tem-poral changes in availability.
As all of the viewers had access to the programs availablewithout cable, mean viewing for the whole sample was enteredin correlations with broadcast availability. Temporal changes inavailability were not related to changes in viewing for any of theprogram categories aimed at child audiences nor for generalaudience informational programs. For action adventure pro-grams, broadcast availability was correlated with mean viewingfor all subjects, p(6) = 0.83, p< .05. For comedy, the correlationof availability with all subjects' viewing was p(6) = 0.63, ns;although viewing dropped at Time 4 when programmingdropped, viewing increased at Time 5 when programming re-mained low. For miscellaneous variety programs, the correla-tion of viewing with availability was p(6) = 0.77, ns, suggestingsome correspondence, although the correlation with such asmall number of data points did not reach statistical signifi-cance.
Changes in cable availability were tested in rank order corre-lations with mean viewing by cable subscribers. The correlationfor action adventure was p(6) = 1.00, p < .01, but correlationsfor other categories were near zero.4 Hence, viewing of adult
1
oo«PL,
O
w
O
H
WU«
100-
SO'
60
40
20
0
CHILD INFORMATIVEPROGRAMS
CHILD ANIMATEDPROGRAMS
100
80
60
100T
BO-
60
40
20
0
100-
60
60
40
20
1
fa- -«-
•e- BROADCAST
- BASIC CABLE
• PREMIUM PAY
CHILD NONINFORMATIVEPROGRAMS
ADULT INFORMATIVE.. PROGRAMS
ADULT COMEDYPROGRAMS
ADULT DRAMAPROGRAMS
ADULT ACTION/ADVENTUREPROGRAMS
ADULT MISCELLANEOUSPROGRAMS
S F S F S F19B1 1962 1983
TIME OF MEASUREMENT
S F S F S F1981 1862 1983TIME OF MEASUREMENT
Figure 3. Mean percentage of time per week between 6:00 a.m. and 10:00 p.m. that programs in a given category were available to view forfamilies without cable (broadcast), with basic cable (cable), or with ca-ble plus movie channels (premium pay).
entertainment programs varied in some cases with changes inavailability, but such changes did not predict viewing for otherprogram types.
Individual Differences
Stability over time. Stability of viewing was evaluated by cor-relations of total viewing and viewing within each program type
4 Because different families had different pay movie channels, corre-lations were not computed with movie availability.

EARLY TELEVISION VIEWING 417
Table 4Stability Coefficients of Total Viewing Time and Time Viewing EachProgram Type Across Five Waves
Wave
12345
12345
12345
1
.72
.68
.65
.64
2 3 4
All television
.66
.68
.65
.55
.63
.62
.66
.67
.54
.62
.71
.71
5
.57
.55
.65
.71—
Child noninformative
.270
.200
.44
.37
.43
.34
0
000
.61
.45
.35
.20
00
00
Drama
.51
.53
.45
.35
.3600
.20
.52
.55
.58—.34
.2500
.20—
.38
.47
.61
.55—
1
„
.31
.37
.34
.23
.60
.57
.48
.42
.50
.36
.44
.46
2 3 4
Child informative
.54
.55
.51
.48
.36
.44
.54
.55
.30
.49
.55
.59
Adult informative
-.55
.45
.48
.35
.55
.52
.43
.49
.46
.54
.61
.45
Action adventure
.30
.27
.37
.45
.34
.22
.46
.43
0.25.45
.54
5
.30
.40
.39
.64—
.48
.52
.67
.63—
.21
.30
.26
.45—
1
,.55.56.49.56
.65
.54
.54
.55
2 3 4
Child animated
.52
.47
.51
.36
.44
.52
.62
.52
.49
.56
.54
.48
Comedy
.48
.58
.49
.52
.36
.55
.59
.61
.46
.55
.64
.62
5
.33
.37
.47
.58—
.54
.46
.54
.63—
Variety, miscellaneous
.46
.37
.43
.29
.44
.56
.38
.34
.32
.47
.38
.44
.41
.32
.38
.37
.30
.32
.40
.48—
Note. Younger cohort above diagonal; older cohort below diagonal. All correlations of .20 or higher aresignificant at p < .01.
over the five waves. The correlations are shown in Table 4. Inboth cohorts, the total time spent viewing television was consis-tent over 2 years. Moreover, the time spent viewing each pro-gram category remained stable over time (except child nonin-formative programming, which had low frequencies). By theirthird birthdays, children's total television viewing time was setin patterns that remained quite stable over a 2-year period.
Progressions over time. If children move from less demand-ing to more cognitively demanding programming with age, thenearly viewing of easy programming might predict later viewingof more complex programs. Moreover, children might shiftfrom child audience programs to general audience programswith similar content. Developmental progressions were testedfor four pairs of categories preselected because they representeddifferent levels of cognitive difficulty and similar content (e.g.,humor or violence): child informative to child entertainmentprograms (cartoons + noninformative), child informative tocomedies, child entertainment to comedies, and child enter-tainment to action adventure. For these tests, early viewing wascalculated as the sum of Waves 1 + 2 (Time 1); late viewing wasthe sum of Waves 4 + 5 (Time 2). Viewing at two waves wassummed to increase stability and remove individual variationdue to season.
For each pair of program categories, two multiple regressionswere performed—one to test the predicted progression and oneto test the reverse sequence for comparison. For example, childinformative viewing was expected to be followed by child enter-tainment viewing. Therefore, Time-2 child entertainment view-ing was regressed on Time-1 child informative viewing (enter-ing Time-1 child entertainment viewing first to control for ini-tial individual differences). The reverse sequence was tested by
regressing Time-2 child informative viewing on Time-1 childentertainment, controlling for Time-1 child informative. Thisprocedure has the same logic as cross-lag correlation but in-cludes statistical controls for stability of variables.
The progression from child informative to child entertain-ment was supported by the results, shown in Table 5. Early childinformative viewing predicts later viewing of child entertain-ment, as predicted. Conversely, early viewing of child entertain-ment is negatively related to later child informative viewing forthe period between 3 and 5 years of age. A similar pattern oc-curred for the analysis testing the progression from child infor-mative to adult comedy viewing, but only for the younger co-hort.
Viewing child entertainment was associated with later actionadventure viewing, especially between ages 5 and 7; a positiveassociation in the reverse direction was considerably weaker andappeared only for the older cohort. Child entertainment view-ing also predicted comedy for the older cohort. These results forindividuals are consistent with the hypothesized developmentalprogression from easier to more complex content and shiftsacross program categories with similar content.
Although these correlational patterns are statistically inde-pendent of mean age changes, they support the developmentalchanges discussed earlier. Not only is there a mean shift withage from viewing child informative programs to viewing car-toons and comedies, but individuals who are high viewers ofchild informative programs early become high viewers of car-toons and comedy programs later. The regressions also suggesta sequence from viewing children's entertainment to viewinggeneral audience entertainment—action adventure and com-edy—that was not apparent in the mean changes in viewing.

418 HUSTON, WRIGHT, RICE, KERKMAN, AND ST. PETERS
Table 5Regressions Testing Developmental Progressions Across Viewing Categories
Dependent variable/predictor
Child entertainment T2Child entertainment T1Child informative Tl
Child informative T2Child informative TlChild entertainment T1
Comedy T2Comedy TlChild informative Tl
Child informative T2Child informative TlComedy Tl
Comedy T2Comedy TlChild entertainment Tl
Child entertainment T2Child entertainment T1Comedy Tl
Action adventure T2Action adventure T1Child entertainment Tl
Child entertainment T2Child entertainment T1Action adventure T1
.48
.16
.53- .22
.65
.17
.48- .15
.65
.09
.52
.12
.28
.21
.52
.12
Cohort 1
R2
.26
.28
.21
.26
.42
.45
.21
.23
.42
.42
.26
.26
.10
.14
.26
.26
Fchange
49.25**4.23*
37.64**8.37**
99.41**6.71*
37.64**3.92*
99.41"ns
49.25**ns
16.50**6.18*
49.24**ns
.56
.16
.54- .10
.69
.11
.54- .09
.59
.18
.59
.13
.43
.35
.52
.18
Cohort 2
R2
.35
.37
.29
.29
.47
.45
.29
.29
.47
.49
.35
.35
.33
.43
.35
.37
Fchange
72.71**5.11*
55.48**ns
120.36**ns
55.48**ns
120.36**6.36*
72.71**ns
66.61**23.89**
72.71**6.10*
Note. T = time.*/><.05. **/>
Discussion
Children develop stable patterns of television use early in life.By their third birthdays, the average children in the samplewatched between 2 and 3 hr of television a day; they were expe-rienced viewers. Averages tell only part of the story, however;variation among individuals was extremely high. The range oftotal hours viewed in 1 week was from 0 to 75.75 hr. Moreover,individual differences in viewing were quite stable over time.
Because watching was defined as presence in the room, itcould signify active, concentrated attention, or passive, shallowexposure. Videotapes of home viewing (Anderson et al., 1986)showed that children between the ages of 3 and 7 attend visuallyto the television set 50%-70% of the time that they are in theroom. Attention probably varies considerably with the type ofprogram being shown. The results of the present study supportour initial assumption that viewing signifies different levels ofactive engagement and has different determinants depending onthe type of programs. For example, sex-typed interests appar-ently influenced viewing. Boys watched more program typesthat contained masculine sex-typed content—cartoons, actionadventure, and adult informational (that included sports)—than did girls. Sex differences were absent in most other pro-gram categories.
Despite mean changes in viewing as a function of age andtime of measurement, individual differences remained quitestable over time. Not only was the total time spent viewing tele-vision stable, but viewing within most program categories re-mained stable over a 2-year period. Stability between ages 3 and
5 was generally as high as that between ages 5 and 7. These con-sistencies probably reflect the influence of family environmentsin which adults and older siblings have stable habits of televisionuse to which children are exposed early in life. Whatever thereasons, the finding is important. It demonstrates that earlychildhood is an important period for acquisition of televisionviewing patterns and that such patterns have long-term implica-tions for children's development.
Cognitive developmental changes were expected to accountfor some age changes in viewing patterns. The age-basedchanges in viewing were consistent with an a priori ordering ofprograms for cognitive demands using the criteria of intendedaudience, program type, redundancy, and temporal integrationrequirements. Both mean viewing frequencies and intraindivid-ual analyses of developmental progressions indicated shiftsfrom child informative programs to other child entertainmentand situation comedies. Most of the available child informativeprograms are designed for preschool levels of comprehension;cartoons and comedies contain more sophisticated languageand humor. With age, children moved from child audience pro-grams with high redundancy and low temporal integration de-mands to less redundant and more temporally demanding pro-grams.
Developmental changes also occurred across programs withsimilar content, but different cognitive demands. Many chil-dren's entertainment and informative programs are humorous;their viewers become comedy viewers at a later age. Many childentertainment programs are violent adventure stories; theirviewers become heavy viewers of action adventure by age 7.

EARLY TELEVISION VIEWING 419
Nonetheless, age-based developmental changes were not aspronounced as cognitive theories might predict, and even thoseage changes observed could be partially due to age-correlatedevents rather than to cognitive development. It is unlikely thatchildren reach a peak of comprehension for children's informa-tive programs by age 4 or an asymptote for cartoons and come-dies around age 5. There were drops in viewing child informa-tive programs (which are broadcast on weekdays) at school en-try points. It is possible that the effects of increasing cognitivecapacities (which might maintain child informative viewingand increase cartoon and comedy viewing) are canceled by age-correlated reductions in time available for television.
Recent theory and research in the laboratory have empha-sized that children are active users of television—they adjusttheir attention on the basis of their interests and ability to com-prehend the program content. We propose that, although mostviewing is active, passive exposure does occur. Children makeactive choices to view child audience programs and the leastdemanding type of adult audience programs (comedy) becausethese fall within their range of understanding during the age pe-riod from 3 to 7. As their comprehension abilities develop, theyactively select programs that fit those abilities. Hence, there areage changes in viewing. When cable supplies more variety, chil-dren actively select more programming in the program catego-ries within their comprehension levels—namely, cartoons andcomedies.
For many adult programs, however, young children's "view-ing" remains largely passive because such programming fallsoutside their range of comprehension and interest, even at age7. Factors external to the child, such as parental choices andprogram availability, appear to play the major role in determin-ing children's exposure to most adult audience programming.For these programs, there were few age-based changes in view-ing, and viewing trends were generally unrelated to programredundancy or temporal integration requirements. Changes insuch viewing, when they occurred, were a function of theamount broadcast. Analyses of this data set, reported else-where, indicate that most of children's viewing of adult audi-ence programs occurred with parents, and that programchoices were heavily influenced by parents (St. Peters, Fitch,Wright, Huston, & Eakins, 1989).
Signs of active choices are not entirely absent during generalaudience programming, however. The decline with age in view-ing adult informational programs suggests that children in-creasingly leave the room during programs that are beyondtheir levels of comprehension and interest. Sex differences inviewing several general audience program categories with mas-culine sex-typed content also suggest some active selection evenfor fairly cognitively demanding programs.
Psychologists' emphasis on cognitive and individual determi-nants of television use may have led us to underestimate theimportance of social forces both inside and outside the homeon children's television viewing experiences. Most televisionviewing occurs with family members; it is not simply a matterof individual choices by a young child. What is viewed also de-pends on what is available at what times; hence, it is subject tothe influence of events and family time schedules, as well todecisions by broadcasters, cable companies, and parents aboutwhat kinds of programming to supply.
The importance of these external influences is apparent fromthe relations of program availability to children's viewing.Changes in programs broadcast over the 3 years of the studyaccounted for changes in viewing some types of adult entertain-ment programs. Cable subscription was related to viewing chil-dren's programs and comedies. Similarly, the Disney channelled to increased viewing of nonanimated entertainment pro-grams. When a greater number and variety of programs withinchildren's range of comprehensibility and interest are available,viewing increases. However, child informative viewing actuallydecreased with cable. Because the second PBS station essen-tially duplicated programs available without cable, there wasnot much increase in variety of child informative program-ming.
Children whose families also received pay movie channels(primarily HBO) viewed even more cartoons and comediesthan those with regular cable, despite the fact that the moviechannels did not substantially increase availability of these pro-grams. Hence, the viewing patterns associated with cable sub-scription reflect differences in family orientation as well as theeffects of program availability.
The media environment in the average American family haschanged considerably since the early 1980s when these datawere collected. The majority of families now own videotapeplayers, and most cable systems supply a much larger numberof channels than our children had. Although such changesprobably affect children's television use, the basic developmen-tal and environmental variables affecting program selectionand exposure identified in this study are likely to continue tooperate. The present data also provide a valuable baseline forfuture research investigating the effects of new technology andincreased variety on children's media use.
Finally, a note on longitudinal design is in order. The designused in the present study met minimal requirements for allow-ing separation of the effects of age, cohort, and time of measure-ment (cf. Nesselroade & Baltes, 1979). The power to distinguishage changes from temporal changes was critical in interpretingthe findings. The results support the role of cognitive develop-ment and individual interests in the development of children'sviewing patterns and make clear the importance of temporaland social influences within and outside the family.
References
Alvarez, M., Huston, A. C, Wright, J. C, & Kerkman, D. (1988). Gen-der differences in visual attention to television form and content.Journal of Applied Developmental Psychology, 9,459-475.
Anderson, D. R., Field, D. E., Collins, P. A., Lorch, E. P., & Nathan,J. G. (1985). Estimates of young children's time with television: Amethodological comparison of parent reports with time-lapse videohome observation. Child Development, 56, 1345-1357.
Anderson, D. R., & Lorch, E. P. (1983). Looking at television: Actionor reaction? In J. Bryant & D. R. Anderson (Eds.), Children's under-standing of television: Research on attention and comprehension (pp.1-33). New York: Academic Press.
Anderson, D. R., Lorch, E. P., Field, D. E., Collins, P. A., & Nathan,J. G. (1986). Television viewing at home: Age trends in visual atten-tion and time with TV. Child Development, 57, 1024-1033.
Anderson, D. R., & Smith, R. (1984). Young children's TV viewing:The problem of cognitive continuity. In F. J. Morrison, C. Lord, &

420 HUSTON, WRIGHT, RICE, KERKMAN, AND ST. PETERS
D. F. Keating (Eds.), Advances in applied developmental psychology(Vol. 1, pp. 115-163). New York: Academic Press.
Baltes, P. B., & Schaie, W. (Eds.). (1973). Life-span developmental psy-chology: Personality and socialization. New York: Academic Press.
Bryant, J., & Anderson, D. R. (Eds.). (1983). Children's understandingof television: Research on attention and comprehension. New York:Academic Press.
Center for Research on the Influence of Television on Children (1983).CRITC program categorization system coding manual. Lawrence:University of Kansas, Department of Human Development.
Collins, W. A. (1982). Cognitive processing in television viewing. In D.Pearl, L. Bouthilet, & J. Lazar (Eds.). Television and behavior: Tenyears of scientific progress and implications for the eighties: Vol. 2,Technical reviews (pp. 9-23). Washington, DC: National Institute ofMental Health.
Collins, W. A. (1983). Interpretation and inference in children's televi-sion viewing. In J. Bryant & D. R. Anderson (Eds.), Children's under-standing of television: Research on attention and comprehension (pp.125-150). New York: Academic Press.
Comstock, G., Chaffee, S., Katzman, N., McCoombs, M., & Roberts,D. (1978). Television and human behavior. New York: Columbia Uni-versity Press.
Dixon, W. J., et al. (1981). BMDP statistical software. Berkeley: Univer-sity of California Press.
Duncan, O. D. (1961). A socioeconomic index for all occupations. InA. J. Reiss, Jr. (Ed.), Occupations and social status (pp. 263-275).New York: Free Press.
Dunn, L. M., & Dunn, L. M. (1981). Peabody Picture Vocabulary Test-Revised: Manual for Forms L and M. Circle Pines, MN: AmericanGuidance Service.
Elder, G. H., Jr. (1973). Children of the great depression: Social changein life experience. Chicago: University of Chicago Press.
Field, D. E., & Anderson, D. R. (1985). Instruction and modality effectson children's television attention and comprehension. Journal of Ed-ucational Psychology, 77, 91-100.
Fiske, S. T, & Taylor, S. E. (1984). Social cognition. Reading, MA: Ad-dison-Wesley.
Friedrich, L. K., & Stein, A. H. (1973). Aggressive and prosocial televi-sion programs and the natural behavior of preschool children. Mono-graphs of the Society for Research in Child Development, 38 (4,Whole No. 151).
Hollenbeck, A. R., & Slaby, R. G. (1979). Infant visual and vocal re-sponses to television. Child Development, 50, 41-45.
Hodge, B., & Tripp, D. (1986). Children and television: A semiotic ap-proach. Stanford, CA: Stanford University Press.
Huesmann, L. R. (1982). Television violence and aggressive behavior.In D. Pearl, L. Bouthilet, & J. Lazar (Eds.), Television and behavior:Ten years of scientific progress and implications for the eighties: Vol.2, Technical reviews (pp. 126-137). Washington, DC: National Insti-tute of Mental Health.
Huesmann, L. R., & Eron, L. D. (Eds.). (1986). Television and the ag-gressive child: A cross-national comparison. Hillsdale, NJ: Erlbaum.
Huston, A. C , & Wright, J. C. (1989). The forms of television and thechild viewer. In G. A. Comstock (Ed.), Public communication andbehavior (Vol. 2, pp. 103-158). New Ybrk: Academic Press.
Kerkman, D. D., Kunkel, D., Huston, A. C , Wright, J. C , & Pinon,M. F. (in press). Profiles in television programming: Children's televi-sion and the "free market solution." Journalism Quarterly.
Lemish, D., & Rice, M. L. (1986). Television as a talking picture book:A prop for language acquisition. Journal of Child Language, 13,251—274.
McCall, R. B. (1977). Challenges to a science of developmental psychol-ogy. Child Development, 48, 333-344.
Meltzoff, A. N. (1988). Imitation of televised models by infants. ChildDevelopment, 59, 1221-1229.
Milavsky, J. R., Kessler, R. C , Stipp, H. H., & Rubens, W. S. (1982).Television and aggression: A panel study. New Ybrk: Academic Press.
Nesselroade, J. R., & Baltes, P. B. (Eds.). (1979). Longitudinal researchin the study of behavior and development. New Ybrk: Academic Press.
Pinon, M., Huston, A. C , & Wright, J. C. (1989). Family ecology andchild characteristics that predict young children's educational televi-sion viewing. Child Development, 60, 846-856.
Rice, M. L. (1984). The words of children's television. JournalofBroad-casting, 28, 445-461.
Rosengren, K. E., Wenner, L. A., & Palmgreen, P. (Eds.). (1985). Mediagratifications research: Current perspectives. Beverly Hills, CA: Sage.
Singer, J. L., & Singer, D. G. (1981). Television, imagination and aggres-sion: A study of preschoolers. Hillsdale, NJ: Erlbaum.
St. Peters, M., Fitch, M., Wright, J. C , Huston, A. C , & Eakins, D.(1989). Television and families: What do young children watch withtheir parents?Unpublished manuscript, CRITC, University of Kan-sas, Lawrence.
Wright, J. C , & Huston, A. C. (1983). A matter of form: Potentials oftelevision for young viewers. American Psychologist, 38, 835-843.
Received June 23,1987Revision received October 25,1989
Accepted November 16,1989