Biostatistics Case Studies 2014
Youngju Pak, PhD.
Biostatistician
Session 3:
Research Study Designs I
Type of Research Study Designs
Observational Study: Researchers do not attempt to influence subjects
or surroundings. The goal is to OBSERVE/COLLECT data on characteristic of interests w/o influencing subjects
Experimental Study
: Researchers deliberately influence the course of events & investigate the effect of the treatment on selected population of subjects
More specific types of observational studies
Observation Studies
Ecological Studies : Utilize population level data. e.g. Total cigarette consumptions and lung cancer prevalence by different countries
Case Reports / Case Series Single subject or case
Simple description of series of individual case
e.g., CDC and prevention Morbidity and Mortality Week Reports(MMWR) of Pneumocystis pneumonia in previously
healthy, homosexual men (LA,1981)
(http://www.cdc.gov/mmwr/preview/mmwrhtml/june_5.htm)
More specific types of observational studies cont.
Cross Sectional: Single time point studies that define a population at a specific time point, may unsuitable for rare disease
Prevalence or Incidence of disease or other characteristicsNational Health and Nutrition Examination Survey on overweight and obesity in US.
Case-Control Typically retrospective studies
Good for rare disease
Case/Control are collected by PI and retrospectively looking for risk factors/exposure
Prospective Longitudinal Cohort Study Suitable for rare exposure
Large sample size are needed for rare disease
Risk factors/exposure are collected by PI and follow up study participants over time
How to make a better cross –Sectional Study
Sometimes it is hard to define denominator if it is an incidence study
Determining what to be studied is the most important things. A disease or a disease condition or
characteristics may be very difficult to define at a certain time point. eg, atherosclerosis is so common and its manifestations at time can be very subtle.
The definition of the condition and health characteristics under study SHOULD be standardized, reproducible, and feasible to apply for a larger scale study.
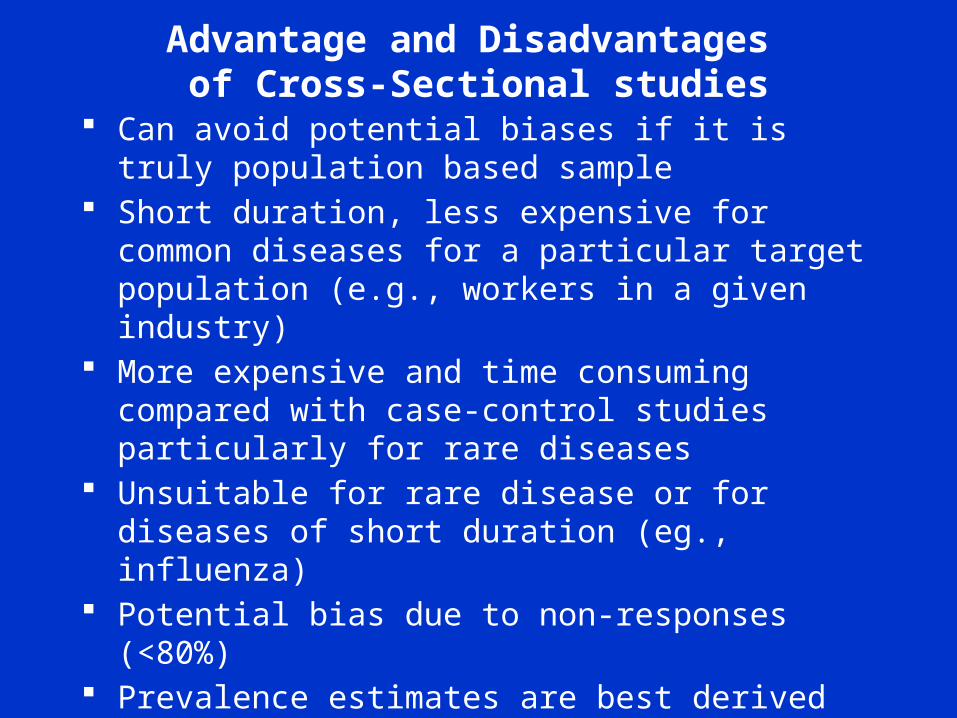
Advantage and Disadvantages of Cross-Sectional studies
Can avoid potential biases if it is truly population based sample
Short duration, less expensive for common diseases for a particular target population (e.g., workers in a given industry)
More expensive and time consuming compared with case-control studies particularly for rare diseases
Unsuitable for rare disease or for diseases of short duration (eg., influenza)
Potential bias due to non-responses (<80%) Prevalence estimates are best derived from cross-
sectional studies but factors associated with a disease or condition can be assessed by both cross-sectional and case-control studies.
Information you will need – Equivalence Margin
• Non-Inferiority Margin(NIM) =1.5 for the IOP study
– Assumed mean difference in change of IOP between two groups -> usually zero difference assumed but it is assumed 0.5 for the IOP study
– SD of changes of IOP = 3.5– α (usually set to 2.5%) since the confidence level of
the confidence interval is (100-2 x α) %
Cross Sectional Examples
Jonas JB, et al. Diabetes mellitus in rural India.Epidemiology. 2010;21:754–755.
Hedley AA, Ogden CL, Johnson CL, Carroll MD, Curtin LR, Flegal KM. Prevalence of overweight and obesity among US children, adolescents, and adults, 1999-2002. JAMA 2004;291:2847-50. Measure height and weight in National Health and
Nutrition Examination Survey (NHANES) Flegal KM, Graubard BI, Williamson DF, Gail MH.
Cause-specific excess deaths associated with underweight, overweight, and obesity. JAMA 2007;298:2028-37.
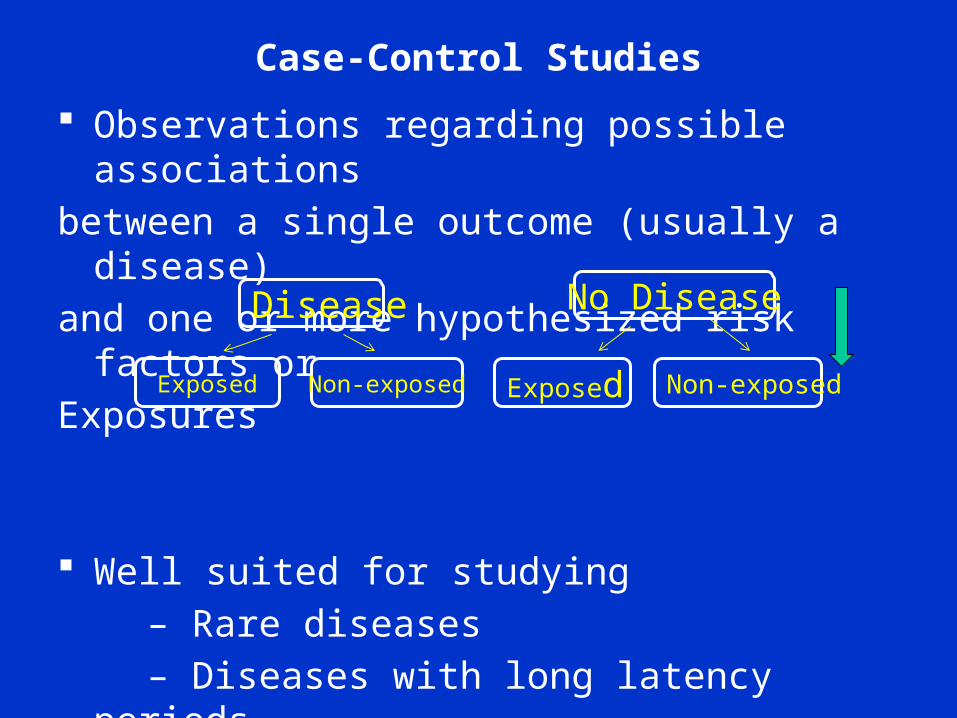
Case-Control Studies
Observations regarding possible associations
between a single outcome (usually a disease)
and one or more hypothesized risk factors or
Exposures
Well suited for studying
– Rare diseases
– Diseases with long latency periods Generally quicker and less expensive than
cohort studies
Non-exposed
No Disease
Exposed Non-exposed Exposed
Disease
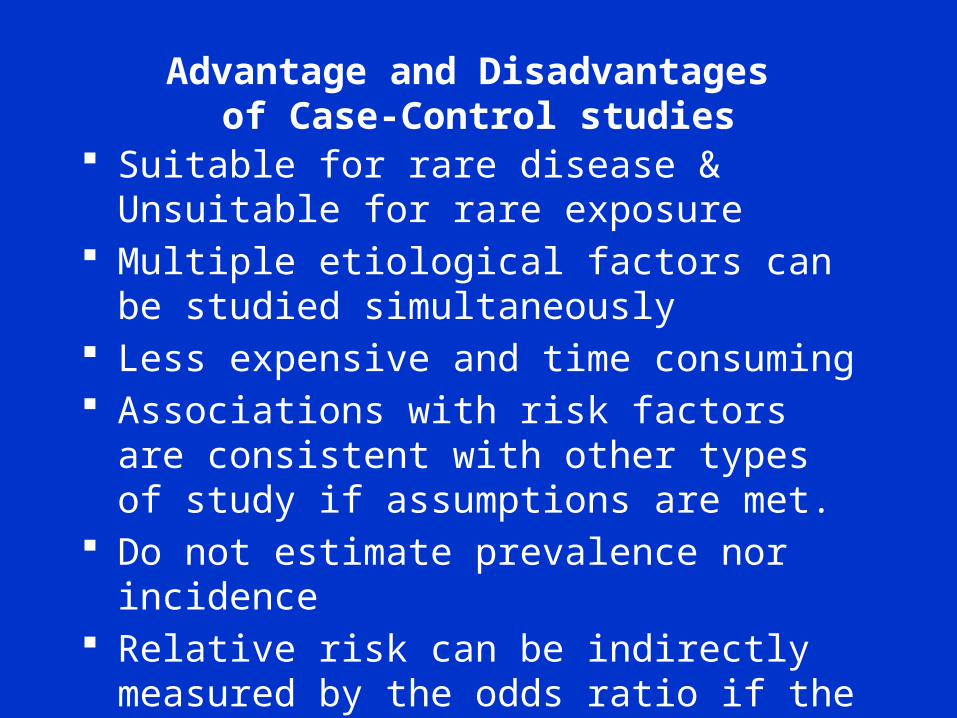
Advantage and Disadvantages of Case-Control studies
Suitable for rare disease & Unsuitable for rare exposure
Multiple etiological factors can be studied simultaneously
Less expensive and time consuming Associations with risk factors are consistent
with other types of study if assumptions are met.
Do not estimate prevalence nor incidence Relative risk can be indirectly measured by
the odds ratio if the disease is rare
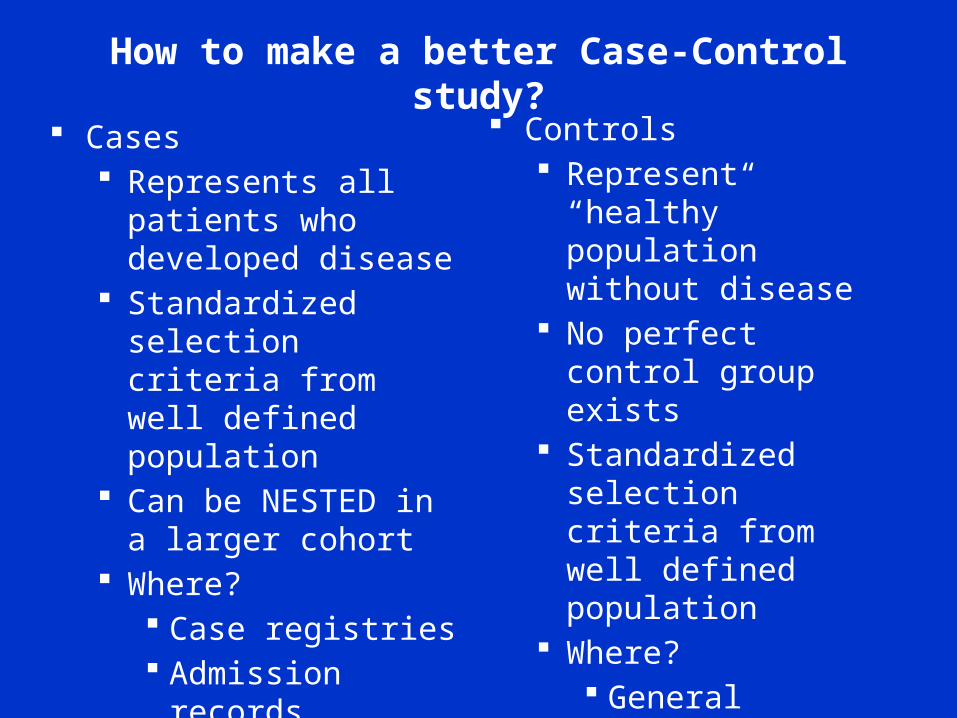
How to make a better Case-Control study?
Cases Represents all patients
who developed disease Standardized selection
criteria from well defined population
Can be NESTED in a larger cohort
Where? Case registries Admission records Pathology logs
High participation rate
Controls Represent “healthy”
population without disease
No perfect control group exists
Standardized selection criteria from well defined population
Where? General population Neighborhood Families Hospitals
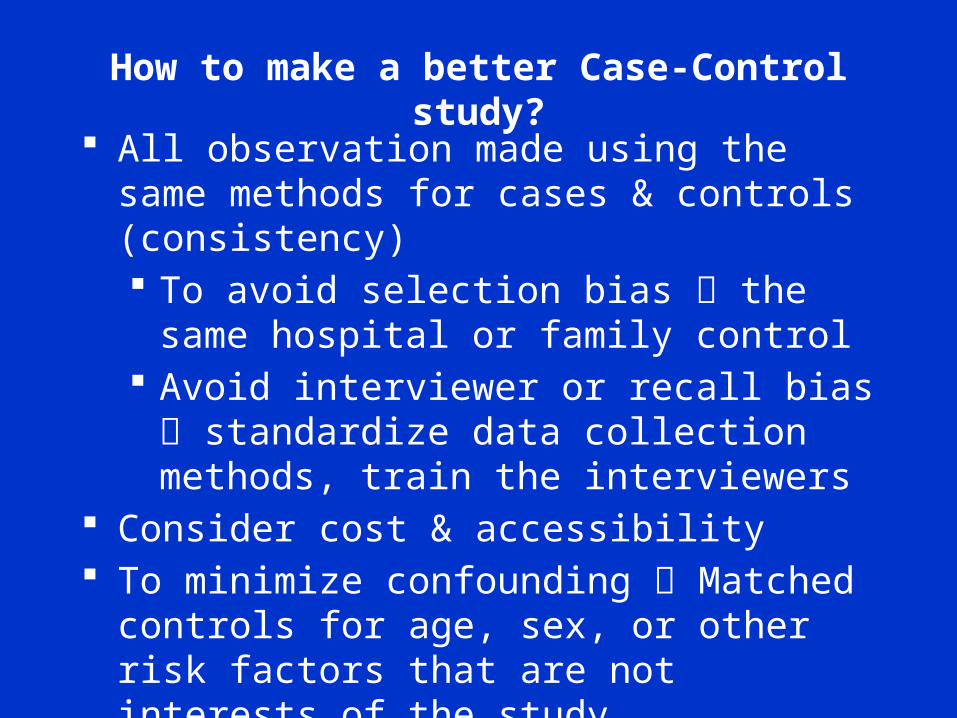
How to make a better Case-Control study?
All observation made using the same methods for cases & controls (consistency) To avoid selection bias the same hospital
or family control Avoid interviewer or recall bias
standardize data collection methods, train the interviewers
Consider cost & accessibility To minimize confounding Matched controls
for age, sex, or other risk factors that are not interests of the study
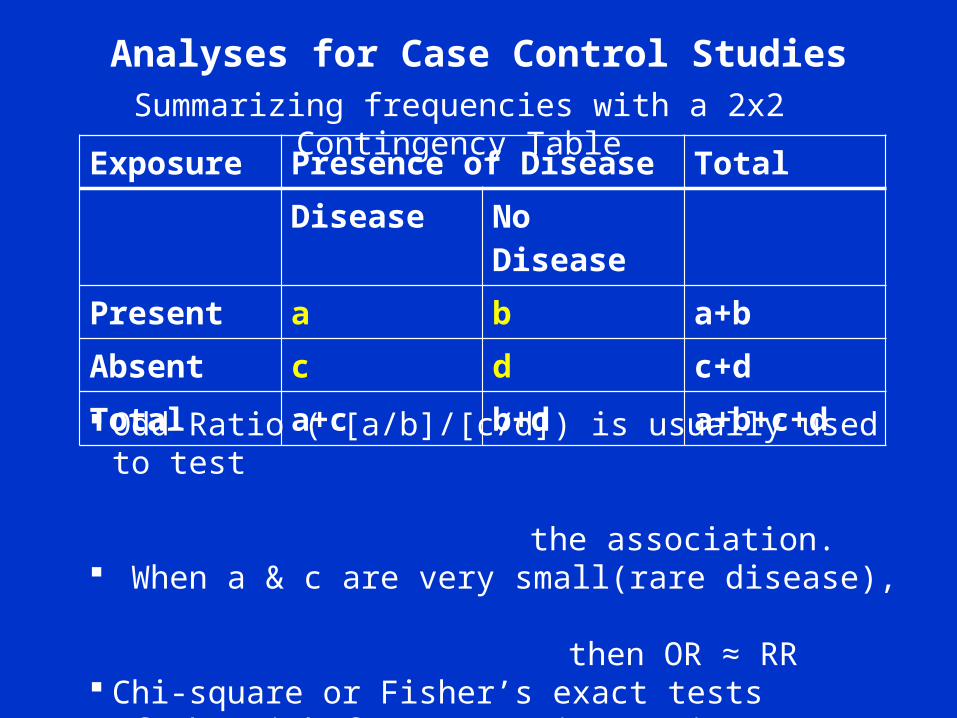
Analyses for Case Control Studies
Exposure Presence of Disease Total
Disease No Disease
Present a b a+b
Absent c d c+d
Total a+c b+d a+b+c+d
Summarizing frequencies with a 2x2 Contingency Table
Odd Ratio ( [a/b]/[c/d]) is usually used to test the association. When a & c are very small(rare disease), then OR ≈ RR Chi-square or Fisher’s exact tests If the risk factor (X) is continuous measure such as
BMI, the a logistic regression model will be used to estimate OR as one unit change in X.
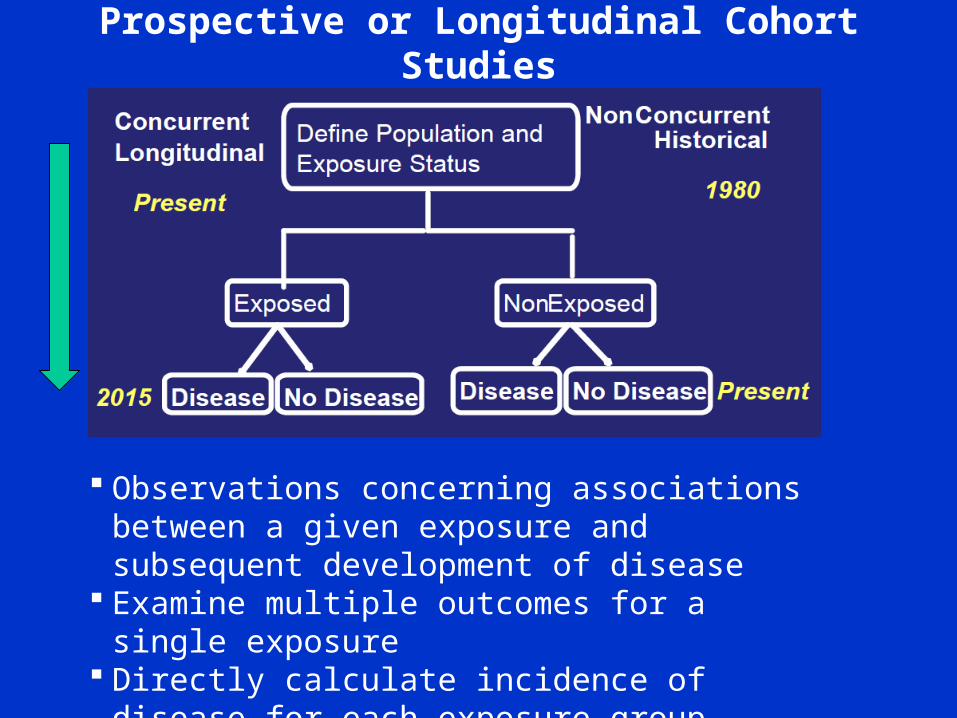
Prospective or Longitudinal Cohort Studies
Observations concerning associations between a given exposure and subsequent development of disease
Examine multiple outcomes for a single exposure Directly calculate incidence of disease for each
exposure group.
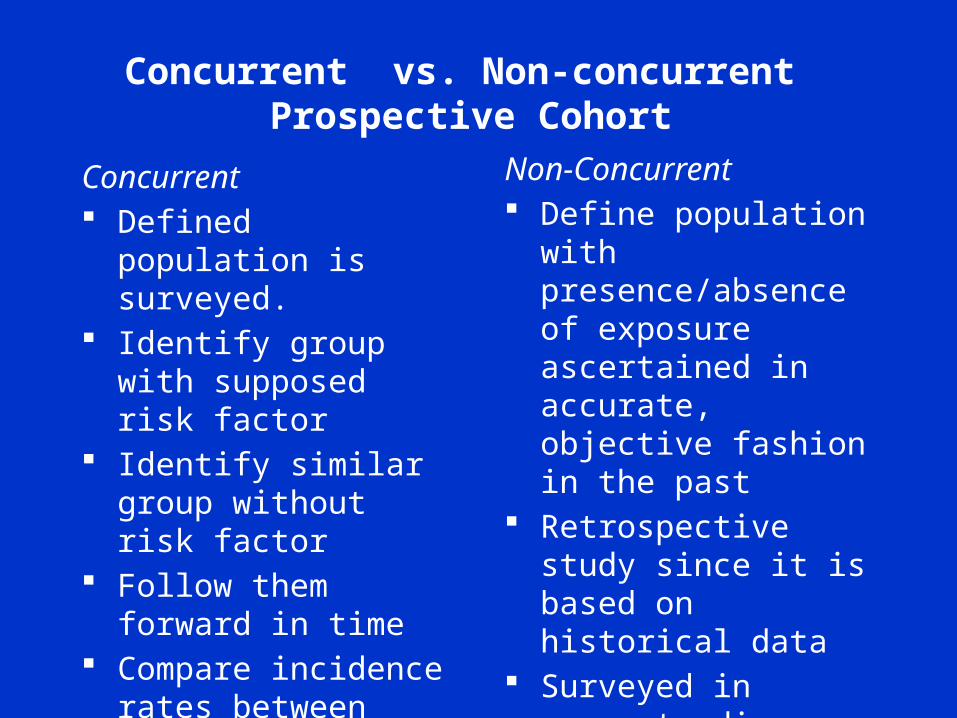
Concurrent vs. Non-concurrent Prospective Cohort
Concurrent Defined population is
surveyed. Identify group with
supposed risk factor Identify similar group
without risk factor Follow them forward in
time Compare incidence
rates between groups
Non-Concurrent Define population with
presence/absence of exposure ascertained in accurate, objective fashion in the past
Retrospective study since it is based on historical data
Surveyed in present: disease occurrence
Define incidence rates and compare between the two groups
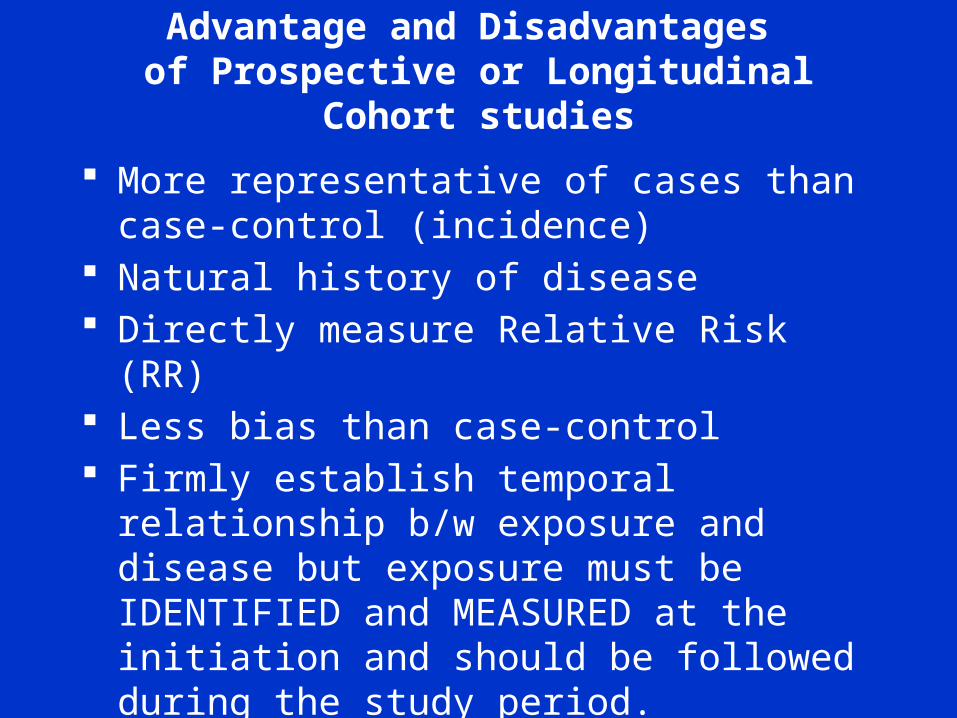
Advantage and Disadvantages of Prospective or Longitudinal Cohort
studies
More representative of cases than case-control (incidence)
Natural history of disease Directly measure Relative Risk (RR) Less bias than case-control Firmly establish temporal relationship b/w
exposure and disease but exposure must be IDENTIFIED and MEASURED at the initiation and should be followed during the study period.
Suitable for Rare exposure
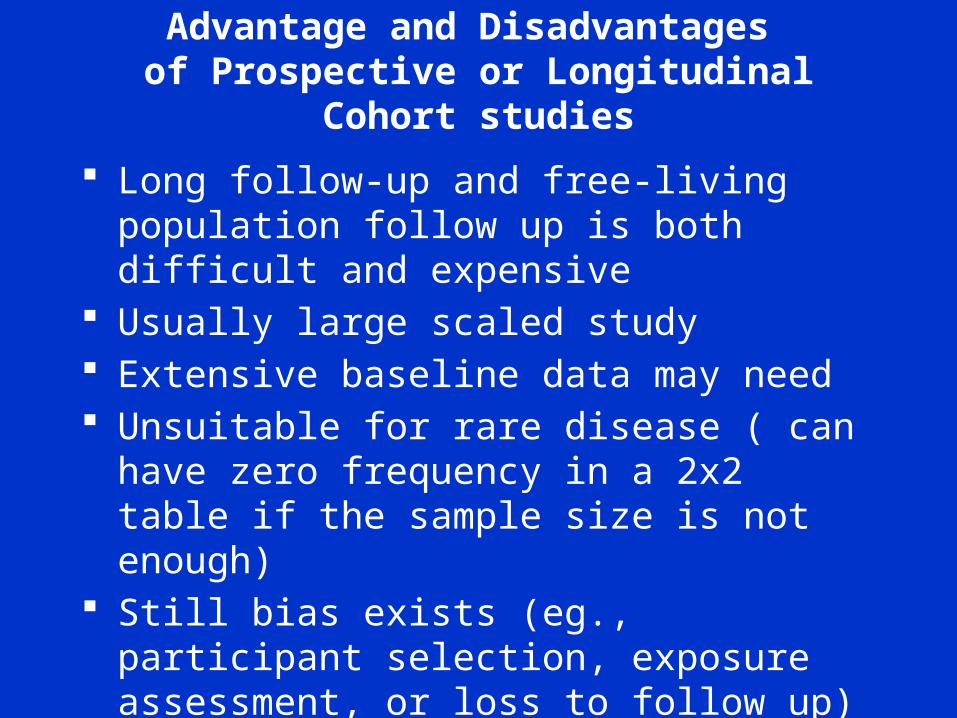
Advantage and Disadvantages of Prospective or Longitudinal Cohort
studies
Long follow-up and free-living population follow up is both difficult and expensive
Usually large scaled study Extensive baseline data may need Unsuitable for rare disease ( can have zero
frequency in a 2x2 table if the sample size is not enough)
Still bias exists (eg., participant selection, exposure assessment, or loss to follow up)
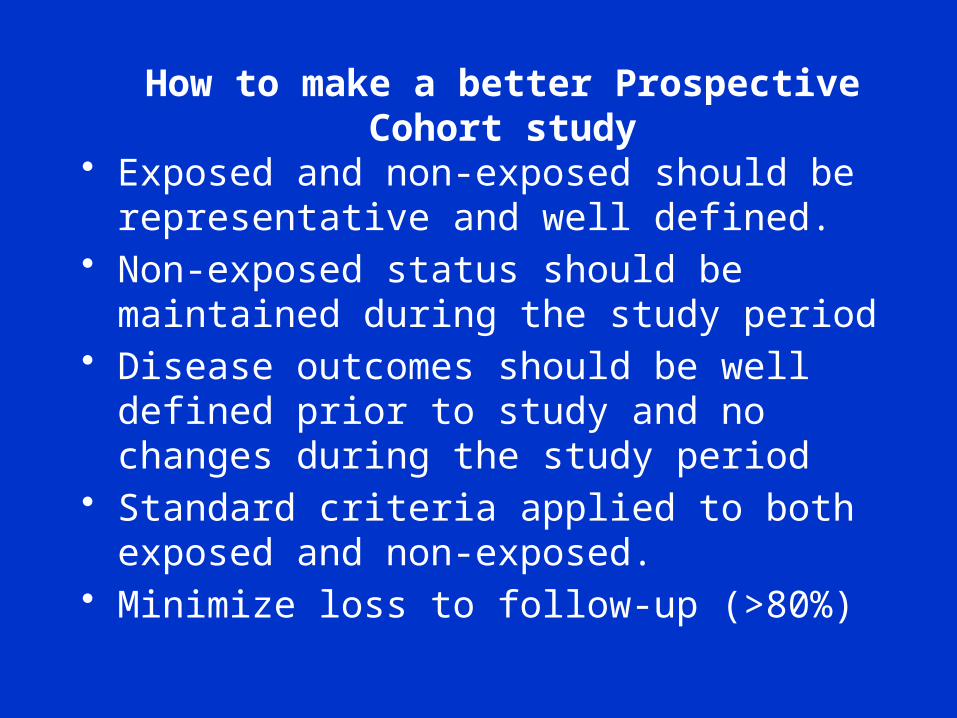
How to make a better Prospective Cohort study
• Exposed and non-exposed should be representative and well defined.
• Non-exposed status should be maintained during the study period
• Disease outcomes should be well defined prior to study and no changes during the study period
• Standard criteria applied to both exposed and non-exposed.
• Minimize loss to follow-up (>80%)
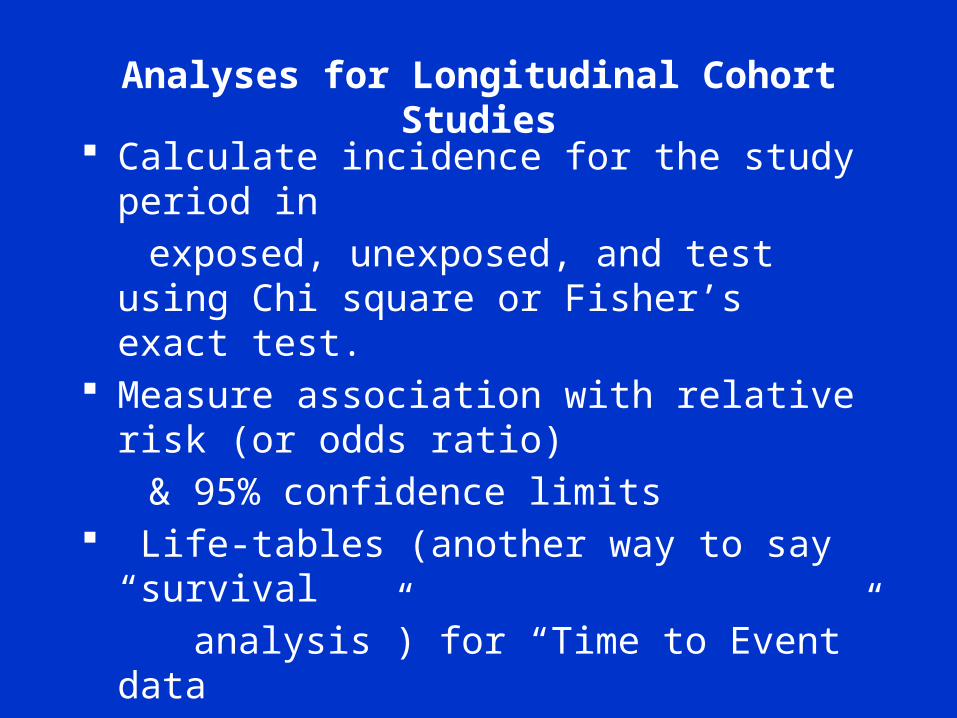
Analyses for Longitudinal Cohort Studies
Calculate incidence for the study period in
exposed, unexposed, and test using Chi square or Fisher’s exact test.
Measure association with relative risk (or odds ratio)
& 95% confidence limits Life-tables (another way to say “survival
analysis”) for “Time to Event” data • Regression models
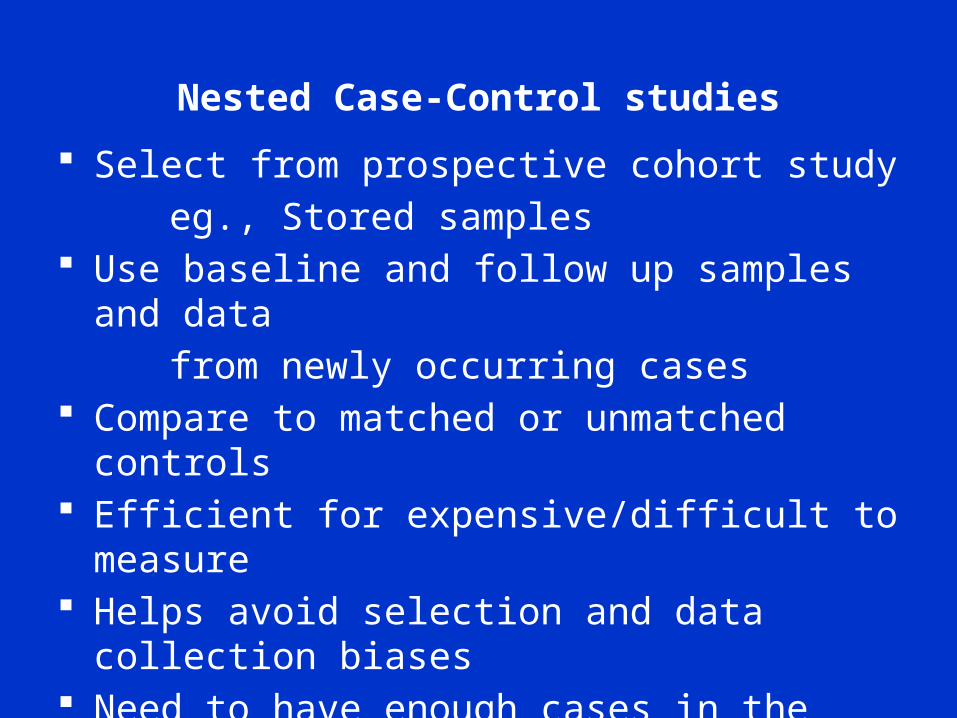
Nested Case-Control studies
Select from prospective cohort study
eg., Stored samples Use baseline and follow up samples and data
from newly occurring cases Compare to matched or unmatched controls Efficient for expensive/difficult to measure Helps avoid selection and data collection biases Need to have enough cases in the cohort Need to store all the samples and data
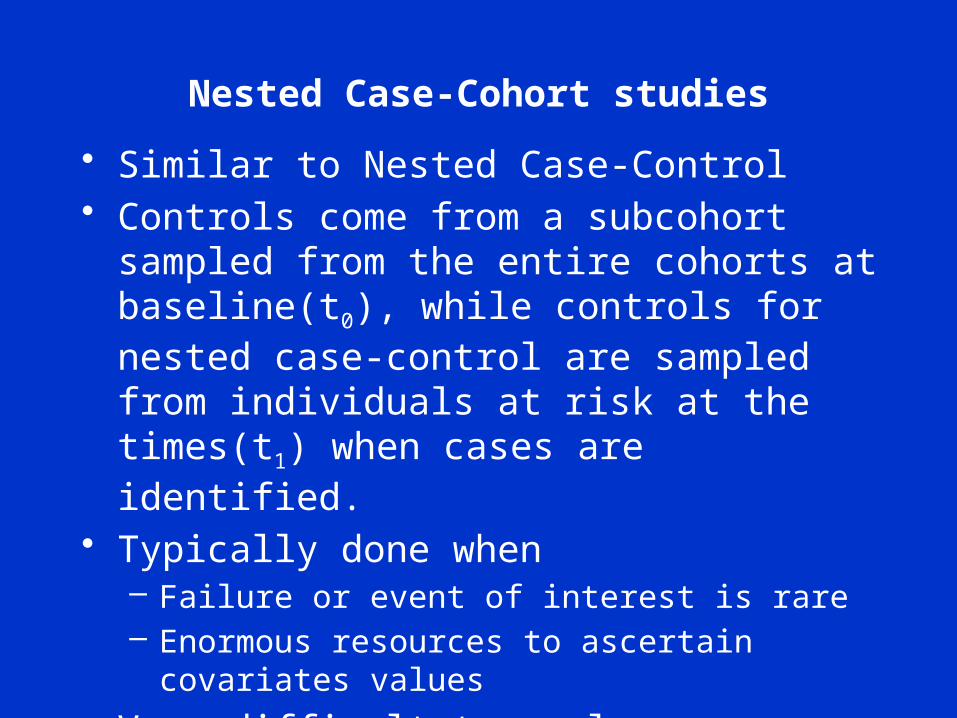
Nested Case-Cohort studies
• Similar to Nested Case-Control• Controls come from a subcohort sampled
from the entire cohorts at baseline(t0), while controls for nested case-control are sampled from individuals at risk at the times(t1) when cases are identified.
• Typically done when– Failure or event of interest is rare– Enormous resources to ascertain covariates values
• Very difficult to analyze
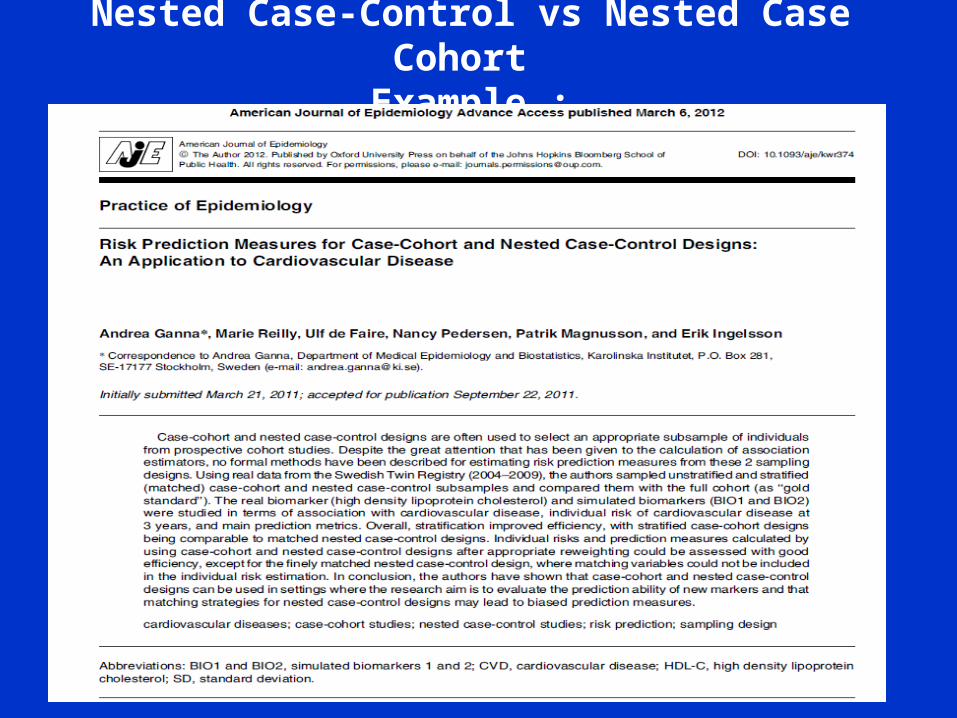
Nested Case-Control vs Nested Case Cohort
Example :
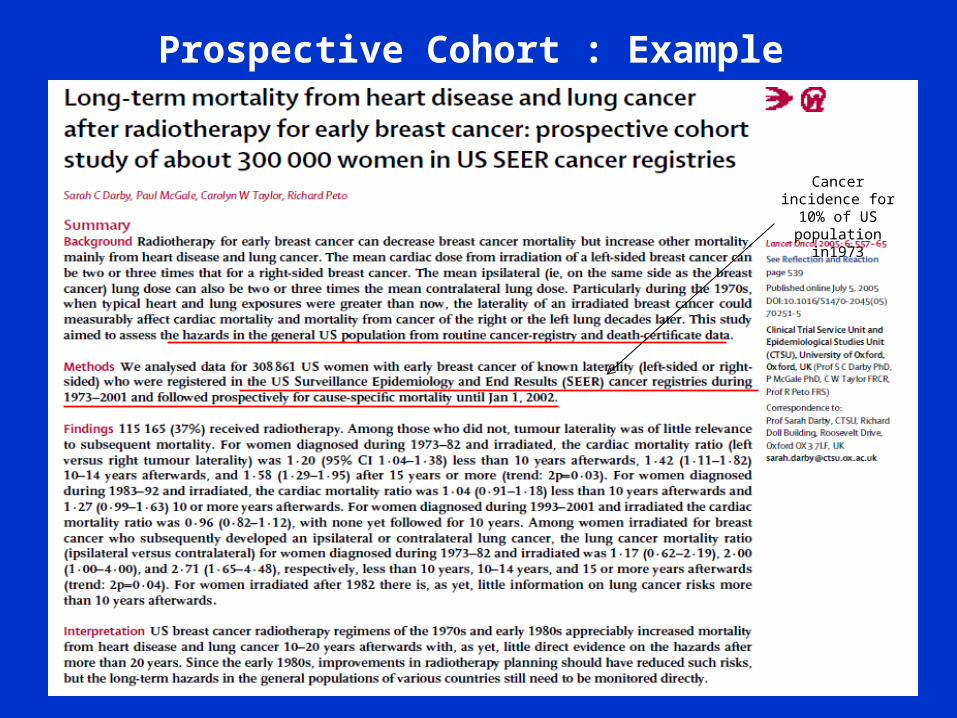
Prospective Cohort : Example
Cancer incidence for 10% of US
population in1973
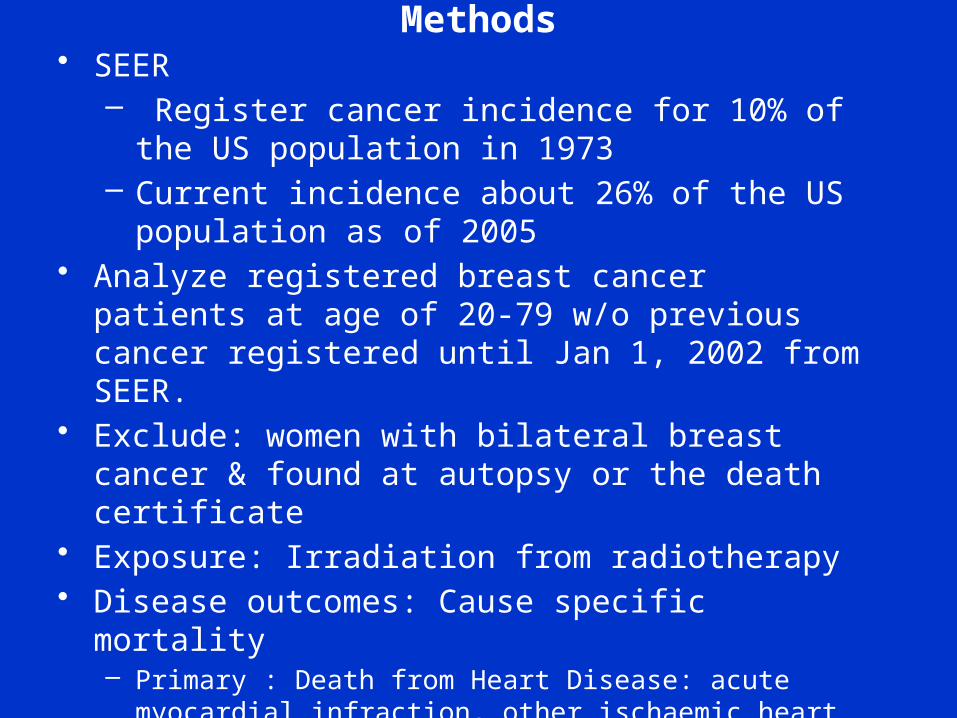
Methods• SEER
– Register cancer incidence for 10% of the US population in 1973
– Current incidence about 26% of the US population as of 2005
• Analyze registered breast cancer patients at age of 20-79 w/o previous cancer registered until Jan 1, 2002 from SEER.
• Exclude: women with bilateral breast cancer & found at autopsy or the death certificate
• Exposure: Irradiation from radiotherapy • Disease outcomes: Cause specific mortality
– Primary : Death from Heart Disease: acute myocardial infraction, other ischaemic heart disease or other heart disease ( using ICD 9 code)
– Secondary: Death from Lung Cancer
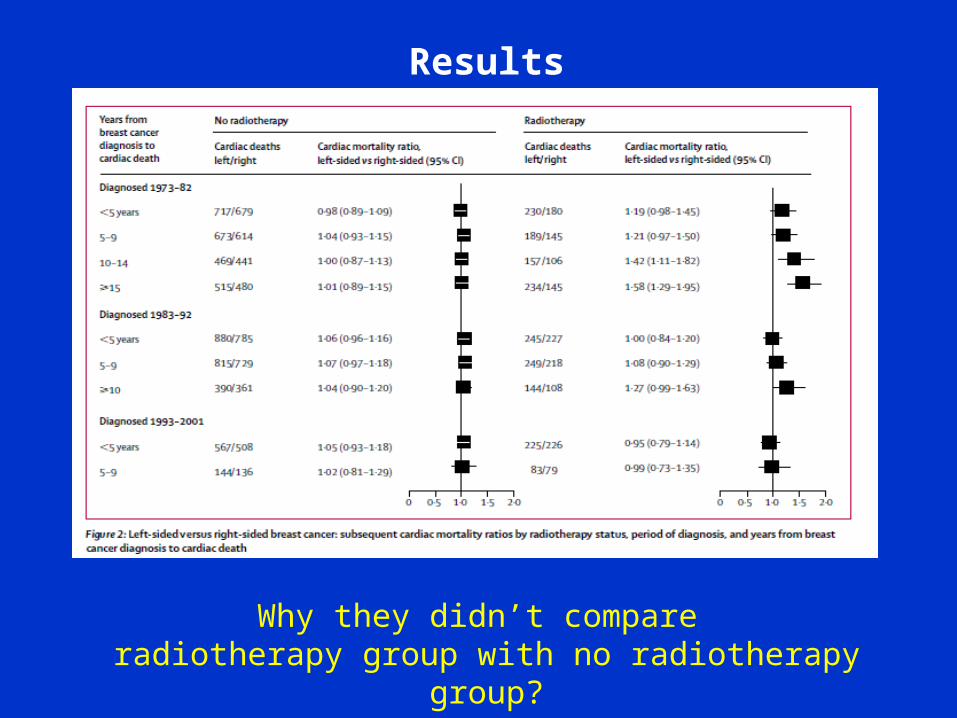
Results
Why they didn’t compare radiotherapy group with no radiotherapy group?
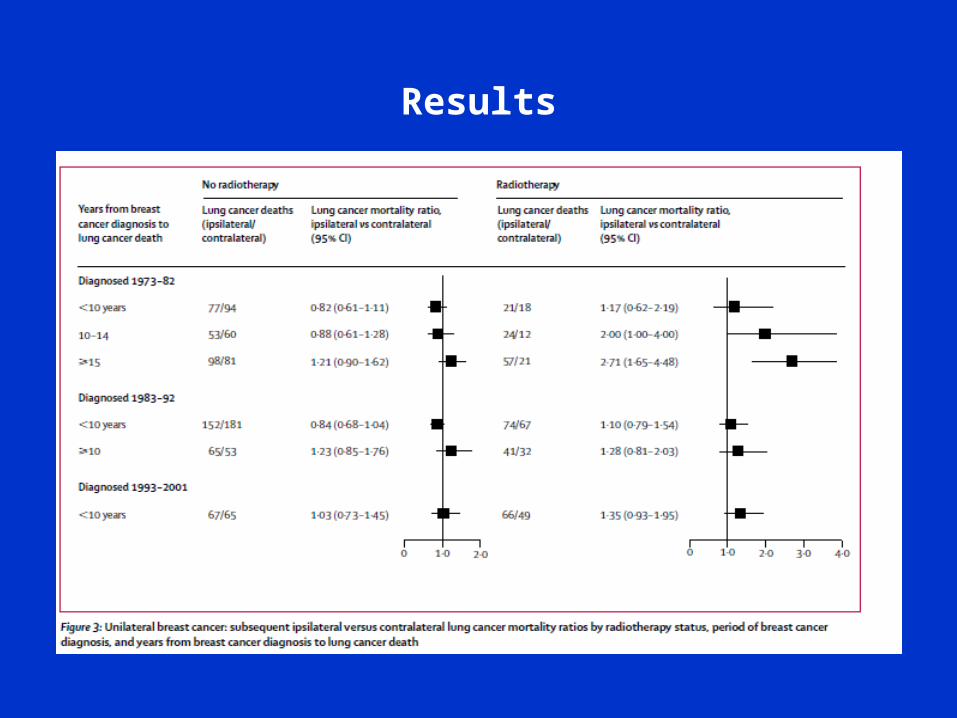
Results
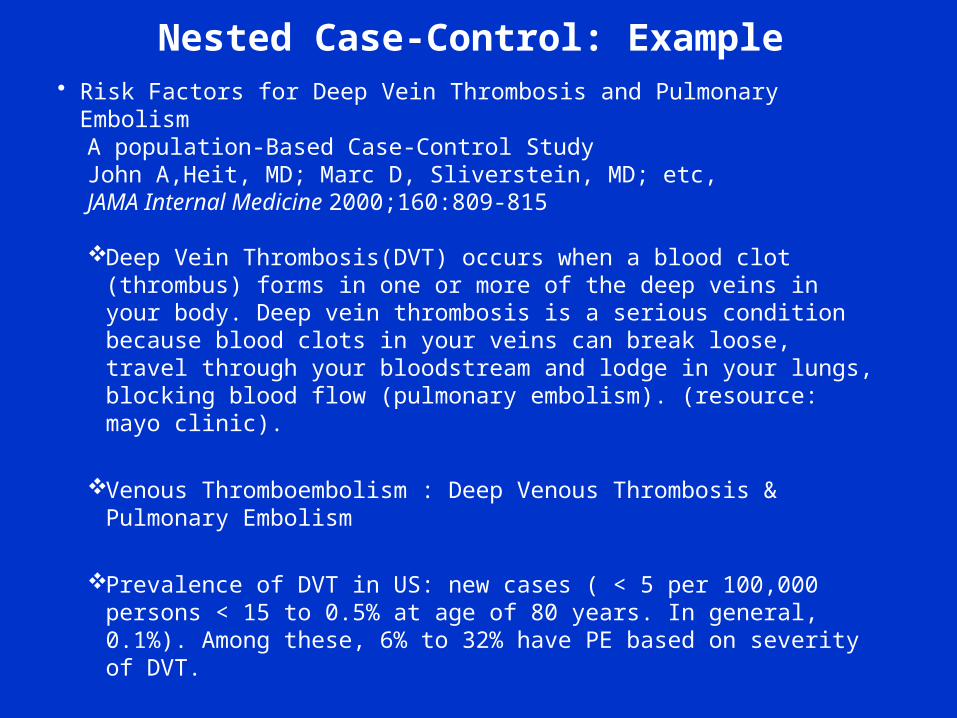
Nested Case-Control: Example• Risk Factors for Deep Vein Thrombosis and Pulmonary
EmbolismA population-Based Case-Control StudyJohn A,Heit, MD; Marc D, Sliverstein, MD; etc, JAMA Internal Medicine 2000;160:809-815
Deep Vein Thrombosis(DVT) occurs when a blood clot (thrombus) forms in one or more of the deep veins in your body. Deep vein thrombosis is a serious condition because blood clots in your veins can break loose, travel through your bloodstream and lodge in your lungs, blocking blood flow (pulmonary embolism). (resource: mayo clinic).
Venous Thromboembolism : Deep Venous Thrombosis & Pulmonary Embolism
Prevalence of DVT in US: new cases ( < 5 per 100,000 persons < 15 to 0.5% at age of 80 years. In general, 0.1%). Among these, 6% to 32% have PE based on severity of DVT.
Review points
• Where case & control are obtained? Are they consistent ?
• How were cases & controls defined?• Selection criteria?• Exclusion criteria? Why?• Any potential bias?• Minimize potential confounding?

Reference book
Recommended