19 April 2012 Annual General Meeting
20 April 2012 Dividend payment
10 May 2012 Interim report for the fi rst quarter of 2012
14 August 2012 Interim report for the fi rst half of 2012
14 November 2012 Interim report for the fi rst three quarters of 2012
5 March 2013 Annual report for fi scal 2012
18 April 2013 Annual General Meeting
19 April 2013 Dividend payment
15 May 2013 Interim report for the fi rst quarter of 2013
14 August 2013 Interim report for the fi rst half of 2013
14 November 2013 Interim report for the fi rst three quarters of 2013
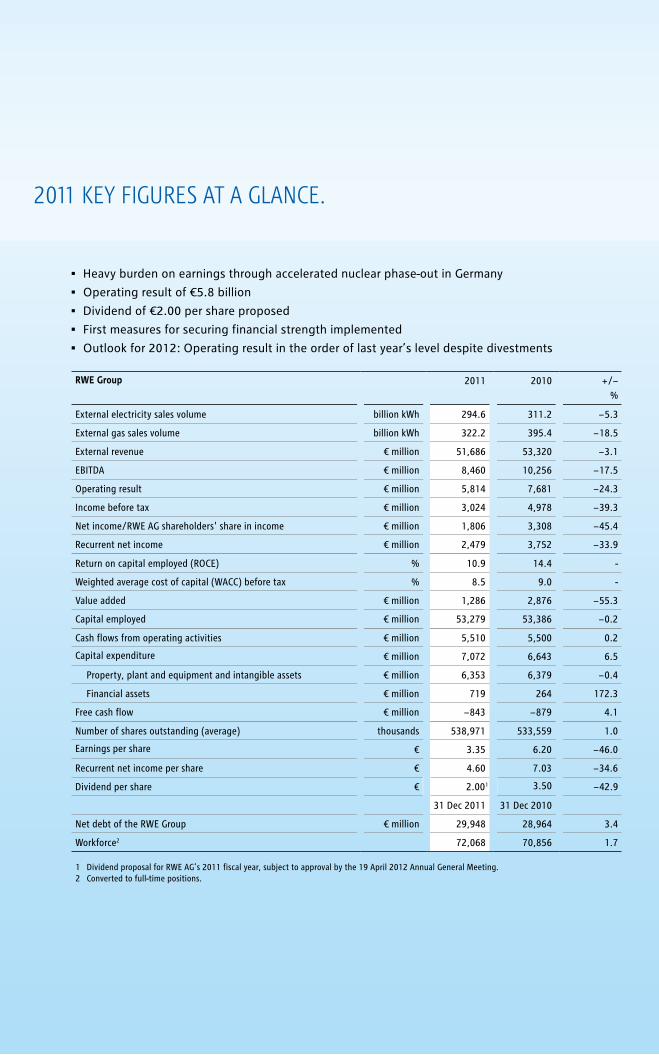
RWE Group 2011 2010 + /−%
External electricity sales volume billion kWh 294.6 311.2 − 5.3
External gas sales volume billion kWh 322.2 395.4 − 18.5
External revenue € million 51,686 53,320 − 3.1
EBITDA € million 8,460 10,256 − 17.5
Operating result € million 5,814 7,681 − 24.3
Income before tax € million 3,024 4,978 − 39.3
Net income/RWE AG shareholders' share in income € million 1,806 3,308 − 45.4
Recurrent net income € million 2,479 3,752 − 33.9
Return on capital employed (ROCE) % 10.9 14.4 -
Weighted average cost of capital (WACC) before tax % 8.5 9.0 -
Value added € million 1,286 2,876 − 55.3
Capital employed € million 53,279 53,386 − 0.2
Cash fl ows from operating activities € million 5,510 5,500 0.2
Capital expenditure € million 7,072 6,643 6.5
Property, plant and equipment and intangible assets € million 6,353 6,379 − 0.4
Financial assets € million 719 264 172.3
Free cash fl ow € million − 843 − 879 4.1
Number of shares outstanding (average) thousands 538,971 533,559 1.0
Earnings per share € 3.35 6.20 − 46.0
Recurrent net income per share € 4.60 7.03 − 34.6
Dividend per share € 2.001 3.50 − 42.9
31 Dec 2011 31 Dec 2010
Net debt of the RWE Group € million 29,948 28,964 3.4
Workforce2 72,068 70,856 1.7
1 Dividend proposal for RWE AG’s 2011 fi scal year, subject to approval by the 19 April 2012 Annual General Meeting. 2 Converted to full-time positions.
RWE
annu
al R
epor
t 201
1 annual RepoRT 2011
RWE Aktiengesellschaft
Opernplatz 145128 EssenGermany
T +49 201 12-00F +49 201 12-15199I www.rwe.com
FiNaNCial CalENdar 2012/2013 2011 kEY FigurES aT a glaNCE.
The Annual General Meeting and all events concerning the publication of the fi nancial reports are broadcast live on the internet and recorded.
We will keep the recordings on our website for at least twelve months.
• Heavy burden on earnings through accelerated nuclear phase-out in Germany
• Operating result of €5.8 billion
• Dividend of €2.00 per share proposed
• First measures for securing fi nancial strength implemented
• Outlook for 2012: Operating result in the order of last year’s level despite divestments
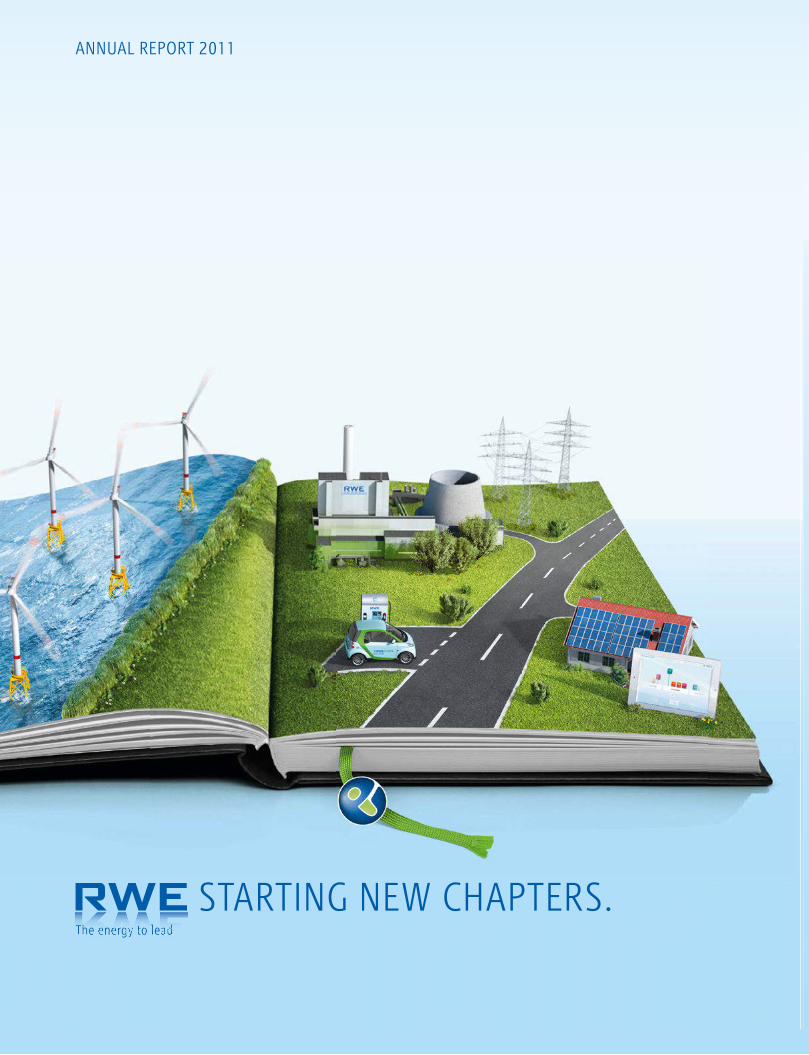
STarTiNg NEw CHapTErS.
19 April 2012 Annual General Meeting
20 April 2012 Dividend payment
10 May 2012 Interim report for the fi rst quarter of 2012
14 August 2012 Interim report for the fi rst half of 2012
14 November 2012 Interim report for the fi rst three quarters of 2012
5 March 2013 Annual report for fi scal 2012
18 April 2013 Annual General Meeting
19 April 2013 Dividend payment
15 May 2013 Interim report for the fi rst quarter of 2013
14 August 2013 Interim report for the fi rst half of 2013
14 November 2013 Interim report for the fi rst three quarters of 2013
RWE Group 2011 2010 + /−%
External electricity sales volume billion kWh 294.6 311.2 − 5.3
External gas sales volume billion kWh 322.2 395.4 − 18.5
External revenue € million 51,686 53,320 − 3.1
EBITDA € million 8,460 10,256 − 17.5
Operating result € million 5,814 7,681 − 24.3
Income before tax € million 3,024 4,978 − 39.3
Net income/RWE AG shareholders' share in income € million 1,806 3,308 − 45.4
Recurrent net income € million 2,479 3,752 − 33.9
Return on capital employed (ROCE) % 10.9 14.4 -
Weighted average cost of capital (WACC) before tax % 8.5 9.0 -
Value added € million 1,286 2,876 − 55.3
Capital employed € million 53,279 53,386 − 0.2
Cash fl ows from operating activities € million 5,510 5,500 0.2
Capital expenditure € million 7,072 6,643 6.5
Property, plant and equipment and intangible assets € million 6,353 6,379 − 0.4
Financial assets € million 719 264 172.3
Free cash fl ow € million − 843 − 879 4.1
Number of shares outstanding (average) thousands 538,971 533,559 1.0
Earnings per share € 3.35 6.20 − 46.0
Recurrent net income per share € 4.60 7.03 − 34.6
Dividend per share € 2.001 3.50 − 42.9
31 Dec 2011 31 Dec 2010
Net debt of the RWE Group € million 29,948 28,964 3.4
Workforce2 72,068 70,856 1.7
1 Dividend proposal for RWE AG’s 2011 fi scal year, subject to approval by the 19 April 2012 Annual General Meeting. 2 Converted to full-time positions.
RWE
annu
al R
epor
t 201
1 annual RepoRT 2011
RWE Aktiengesellschaft
Opernplatz 145128 EssenGermany
T +49 201 12-00F +49 201 12-15199I www.rwe.com
FiNaNCial CalENdar 2012/2013 2011 kEY FigurES aT a glaNCE.
The Annual General Meeting and all events concerning the publication of the fi nancial reports are broadcast live on the internet and recorded.
We will keep the recordings on our website for at least twelve months.
• Heavy burden on earnings through accelerated nuclear phase-out in Germany
• Operating result of €5.8 billion
• Dividend of €2.00 per share proposed
• First measures for securing fi nancial strength implemented
• Outlook for 2012: Operating result in the order of last year’s level despite divestments
STarTiNg NEw CHapTErS.
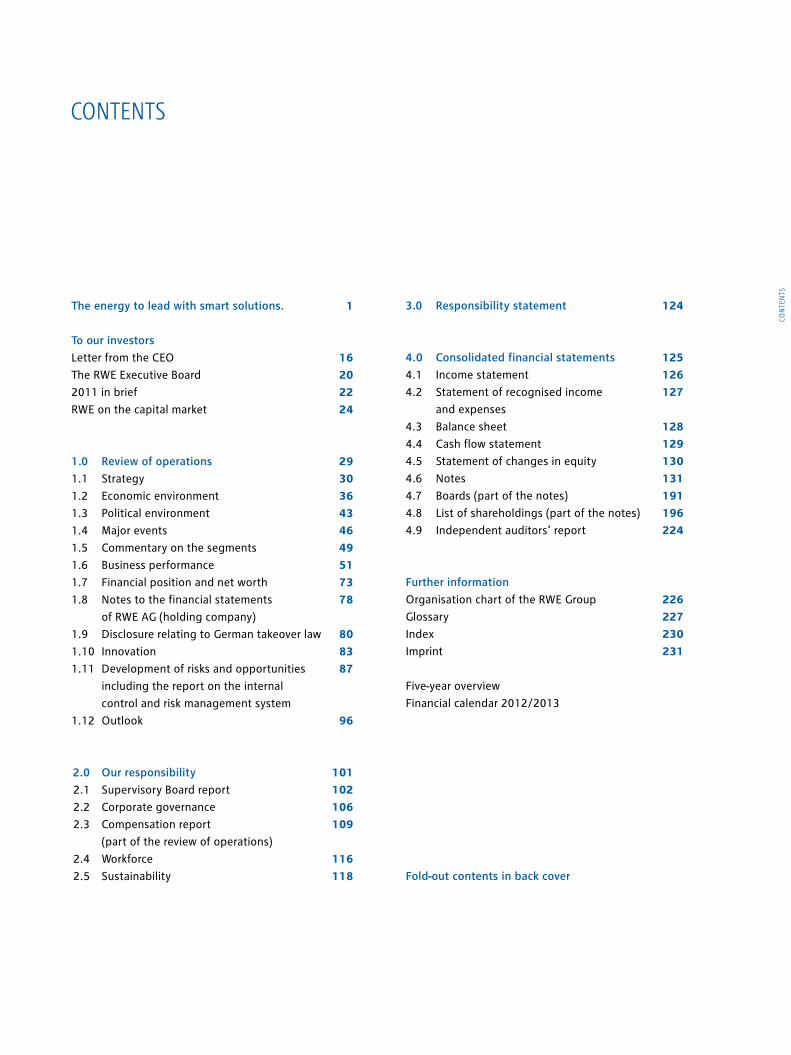
The energy to lead with smart solutions. 1
To our investors
Letter from the CEO 16
The RWE Executive Board 20
2011 in brief 22
RWE on the capital market 24
1.0 Review of operations 29
1.1 Strategy 30
1.2 Economic environment 36
1.3 Political environment 43
1.4 Major events 46
1.5 Commentary on the segments 49
1.6 Business performance 51
1.7 Financial position and net worth 73
1.8 Notes to the financial statements 78
of RWE AG (holding company)
1.9 Disclosure relating to German 80
takeover law
1.10 Innovation 83
1.11 Development of risks and opportunities 87
including the report on the internal
control and risk management system
1.12 Outlook 96
2.0 Our responsibility 101
2.1 Supervisory Board report 102
2.2 Corporate governance 106
2.3 Compensation report 109
(part of the review of operations)
2.4 Workforce 116
2.5 Sustainability 118
3.0 Responsibility statement 124 4.0 Consolidated financial statements 125
4.1 Income statement 126
4.2 Statement of recognised income 127
and expenses
4.3 Balance sheet 128
4. 4 Cash flow statement 129
4.5 Statement of changes in equity 130
4.6 Notes 131
4.7 Boards (part of the notes) 191
4.8 List of shareholdings 196
(part of the notes)
4.9 Independent auditors‘ report 224
Further information
Organisation chart of the RWE Group 226
Glossary 227
Index 230
Imprint 231
Five-year overview
Financial calendar 2012/2013
CONTENTS
Power generation
Conventional generation
Renewableenergy
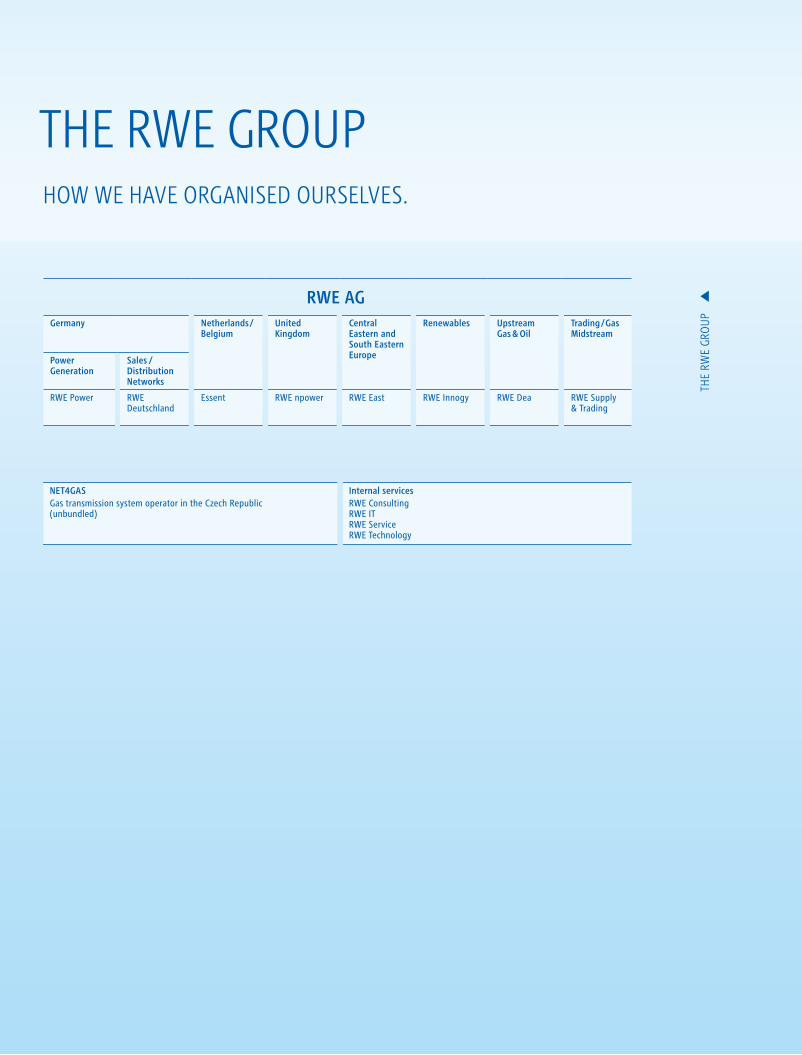
HOw wE HavE OrgaNiSEd OurSElvES.
THE rwE grOup
The
RWe
GRo
up Five-YeaR o
veRvieW
Fold
-ou
T Table oF co
nTen
Ts
wHaT wE dO.
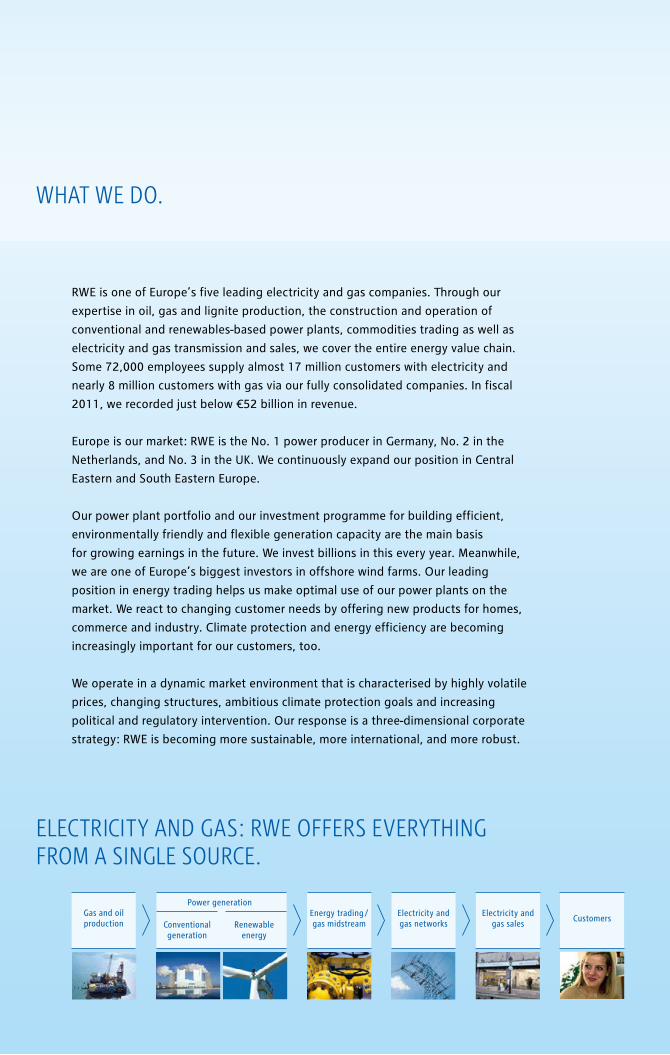
RWE is one of Europe’s five leading electricity and gas companies. Through our
expertise in oil, gas and lignite production, the construction and operation of
conventional and renewables-based power plants, commodities trading as well as
electricity and gas transmission and sales, we cover the entire energy value chain.
Some 72,000 employees supply almost 17 million customers with electricity and
nearly 8 million customers with gas via our fully consolidated companies. In fiscal
2011, we recorded just below €52 billion in revenue.
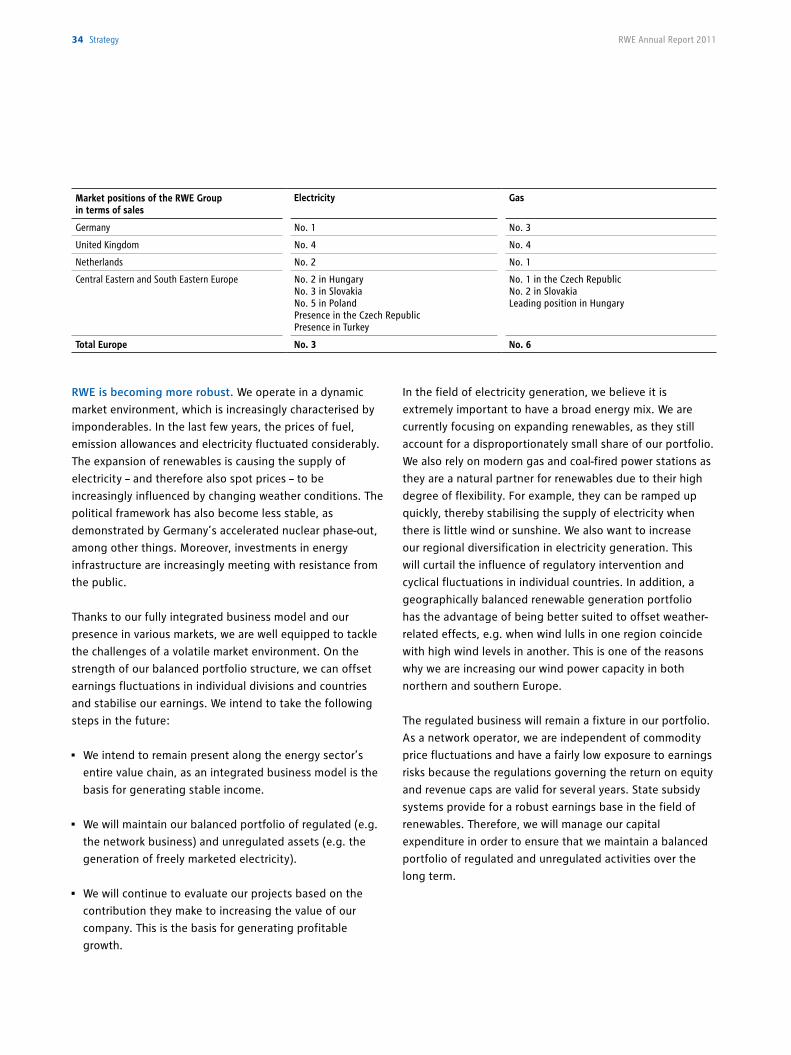
Europe is our market: RWE is the No. 1 power producer in Germany, No. 2 in the
Netherlands, and No. 3 in the UK. We continuously expand our position in Central
Eastern and South Eastern Europe.
Our power plant portfolio and our investment programme for building efficient,
environmentally friendly and flexible generation capacity are the main basis
for growing earnings in the future. We invest billions in this every year. Meanwhile,
we are one of Europe’s biggest investors in offshore wind farms. Our leading
position in energy trading helps us make optimal use of our power plants on the
market. We react to changing customer needs by offering new products for homes,
commerce and industry. Climate protection and energy efficiency are becoming
increasingly important for our customers, too.
We operate in a dynamic market environment that is characterised by highly volatile
prices, changing structures, ambitious climate protection goals and increasing
political and regulatory intervention. Our response is a three-dimensional corporate
strategy: RWE is becoming more sustainable, more international, and more robust.
Gas and oil production
Energy trading /gas midstream
Electricity andgas networks
Electricity andgas sales
Customers
ElECTriCiTY aNd gaS: rwE OFFErS EvErYTHiNg FrOM a SiNglE SOurCE.
NET4GASGas transmission system operator in the Czech Republic(unbundled)
Internal servicesRWE ConsultingRWE ITRWE ServiceRWE Technology
Five-year overviewRWE Group
2011 2010 2009 2008 2007
Net financial debt € million 12,239 11,904 10,382 − 650 − 2,064
Net debt of the RWE Group € million 29,948 28,964 25,787 18,659 16,514
Leverage factor 3.5 2.8 2.8 2.1 2.1
Workforce
Workforce at the end of the year2 72,068 70,856 70,726 65,908 63,439
Research & development
R&D costs € million 146 149 110 105 74
R&D employees 410 360 350 330 270
Emissions balance
CO2 emissions million metric tons 162 165 149 172 187
Free allocation of CO2 certificates million metric tons 117 115 105 105 170
Shortage of CO2 certificates million metric tons 45 50 44 67 17
Specific CO2 emissions metric tons/MWh 0.787 0.732 0.796 0.768 0.866
Five-year overviewRWE Aktiengesellschaft
2011 2010 2009 2008 2007
Dividend/dividend payment
Dividend payment € million 1,2293 1,867 1,867 2,401 1,689
Dividend per share € 2.003 3.50 3.50 4.50 3.15
Market capitalisation
Market capitalisation at the end of the year € billion 16.6 28.0 38.0 35.4 53.5
Long-term credit rating
Moody’s A3 A2 A2 A1 A1
Outlook negative negative negative negative stable
Standard & Poor’s A− A A A A+
Outlook negative negative negative stable negative
1 Since 2008, EBITDA has also included operating income from investments.2 Converted to full-time positions.3 Proposed dividend for RWE AG’s 2011 fiscal year, subject to approval by the 19 April 2012 Annual General Meeting.
RWE AGGermany Netherlands /
BelgiumUnited Kingdom
Central Eastern and South Eastern Europe
Renewables Upstream Gas & Oil
Trading /Gas Midstream
Power Generation
Sales / Distribution Networks
RWE Power RWE Deutschland
Essent RWE npower RWE East RWE Innogy RWE Dea RWE Supply & Trading
The energy to lead with smart solutions. 1
To our investors
Letter from the CEO 16
The RWE Executive Board 20
2011 in brief 22
RWE on the capital market 24
1.0 Review of operations 29
1.1 Strategy 30
1.2 Economic environment 36
1.3 Political environment 43
1.4 Major events 46
1.5 Commentary on the segments 49
1.6 Business performance 51
1.7 Financial position and net worth 73
1.8 Notes to the financial statements 78
of RWE AG (holding company)
1.9 Disclosure relating to German 80
takeover law
1.10 Innovation 83
1.11 Development of risks and opportunities 87
including the report on the internal
control and risk management system
1.12 Outlook 96
2.0 Our responsibility 101
2.1 Supervisory Board report 102
2.2 Corporate governance 106
2.3 Compensation report 109
(part of the review of operations)
2.4 Workforce 116
2.5 Sustainability 118
3.0 Responsibility statement 124 4.0 Consolidated financial statements 125
4.1 Income statement 126
4.2 Statement of recognised income 127
and expenses
4.3 Balance sheet 128
4. 4 Cash flow statement 129
4.5 Statement of changes in equity 130
4.6 Notes 131
4.7 Boards (part of the notes) 191
4.8 List of shareholdings 196
(part of the notes)
4.9 Independent auditors‘ report 224
Further information
Organisation chart of the RWE Group 226
Glossary 227
Index 230
Imprint 231
Five-year overview
Financial calendar 2012/2013
CONTENTS
Power generation
Conventional generation
Renewableenergy
HOw wE HavE OrgaNiSEd OurSElvES.
THE rwE grOup
The
RWe
GRo
up Five-YeaR o
veRvieW
Fold
-ou
T Table oF co
nTen
Ts
wHaT wE dO.
RWE is one of Europe’s five leading electricity and gas companies. Through our
expertise in oil, gas and lignite production, the construction and operation of
conventional and renewables-based power plants, commodities trading as well as
electricity and gas transmission and sales, we cover the entire energy value chain.
Some 72,000 employees supply almost 17 million customers with electricity and
nearly 8 million customers with gas via our fully consolidated companies. In fiscal
2011, we recorded just below €52 billion in revenue.
Europe is our market: RWE is the No. 1 power producer in Germany, No. 2 in the
Netherlands, and No. 3 in the UK. We continuously expand our position in Central
Eastern and South Eastern Europe.
Our power plant portfolio and our investment programme for building efficient,
environmentally friendly and flexible generation capacity are the main basis
for growing earnings in the future. We invest billions in this every year. Meanwhile,
we are one of Europe’s biggest investors in offshore wind farms. Our leading
position in energy trading helps us make optimal use of our power plants on the
market. We react to changing customer needs by offering new products for homes,
commerce and industry. Climate protection and energy efficiency are becoming
increasingly important for our customers, too.
We operate in a dynamic market environment that is characterised by highly volatile
prices, changing structures, ambitious climate protection goals and increasing
political and regulatory intervention. Our response is a three-dimensional corporate
strategy: RWE is becoming more sustainable, more international, and more robust.
Gas and oil production
Energy trading /gas midstream
Electricity andgas networks
Electricity andgas sales
Customers
ElECTriCiTY aNd gaS: rwE OFFErS EvErYTHiNg FrOM a SiNglE SOurCE.
NET4GASGas transmission system operator in the Czech Republic(unbundled)
Internal servicesRWE ConsultingRWE ITRWE ServiceRWE Technology
Five-year overviewRWE Group
2011 2010 2009 2008 2007
Net financial debt € million 12,239 11,904 10,382 − 650 − 2,064
Net debt of the RWE Group € million 29,948 28,964 25,787 18,659 16,514
Leverage factor 3.5 2.8 2.8 2.1 2.1
Workforce
Workforce at the end of the year2 72,068 70,856 70,726 65,908 63,439
Research & development
R&D costs € million 146 149 110 105 74
R&D employees 410 360 350 330 270
Emissions balance
CO2 emissions million metric tons 162 165 149 172 187
Free allocation of CO2 certificates million metric tons 117 115 105 105 170
Shortage of CO2 certificates million metric tons 45 50 44 67 17
Specific CO2 emissions metric tons/MWh 0.787 0.732 0.796 0.768 0.866
Five-year overviewRWE Aktiengesellschaft
2011 2010 2009 2008 2007
Dividend/dividend payment
Dividend payment € million 1,2293 1,867 1,867 2,401 1,689
Dividend per share € 2.003 3.50 3.50 4.50 3.15
Market capitalisation
Market capitalisation at the end of the year € billion 16.6 28.0 38.0 35.4 53.5
Long-term credit rating
Moody’s A3 A2 A2 A1 A1
Outlook negative negative negative negative stable
Standard & Poor’s A− A A A A+
Outlook negative negative negative stable negative
1 Since 2008, EBITDA has also included operating income from investments.2 Converted to full-time positions.3 Proposed dividend for RWE AG’s 2011 fiscal year, subject to approval by the 19 April 2012 Annual General Meeting.
RWE AGGermany Netherlands /
BelgiumUnited Kingdom
Central Eastern and South Eastern Europe
Renewables Upstream Gas & Oil
Trading /Gas Midstream
Power Generation
Sales / Distribution Networks
RWE Power RWE Deutschland
Essent RWE npower RWE East RWE Innogy RWE Dea RWE Supply & Trading
SMarT ENErgY EquaTES TO iNNOvaTivE THiNkiNg aNd FOrward-lOOkiNg aCTiON.
www.vorweggehen.de
Energy drives our lives. It enables us to be mobile, productive and connected. But energy is a limited resource – and its price is rising. For companies and households, this means that making effi cient use of energy pays off. And if this is done intelligently, it does not reduce growth or quality of life.
As one of Europe’s leading utilities, conserving energy is at the centre of our business model. We continuously improve our electricity generation in order to lower fuel consumption and emissions. However, our horizon extends beyond our plant premises. We also want our customers to benefi t from the opportunities offered by making more effi cient use of energy.
With innovative products and services, we help households and companies to reduce costs and protect the environment. From electric cars to home automation, we offer solutions across the board while setting new product standards.
We invite you to begin a new chapter with us and convince yourself fi rst-hand of the benefi ts of smart energy!
Five-year overviewRWE Group
2011 2010 2009 2008 2007
External revenue € million 51,686 53,320 47,741 48,950 42,507
Income
EBITDA1 € million 8,460 10,256 9,165 8,773 7,915
Operating result € million 5,814 7,681 7,090 6,826 6,533
Income before tax € million 3,024 4,978 5,598 4,866 5,246
Net income/RWE AG shareholders’ share in net income € million 1,806 3,308 3,571 2,558 2,667
Earnings per share € 3.35 6.20 6.70 4.75 4.74
Recurrent net income per share € 4.60 7.03 6.63 6.25 5.29
Return on equity % 12.6 23.1 28.5 20.7 20.1
Return on revenue % 8.3 12.3 14.8 12.3 16.0
Value management
Return on capital employed (ROCE) % 10.9 14.4 16.3 17.2 16.5
Value added € million 1,286 2,876 3,177 3,453 2,970
Capital employed € million 53,279 53,386 43,597 39,809 39,710
Cash fl ow/capital expenditure/depreciation and amortisation
Cash fl ows from operating activities € million 5,510 5,500 5,299 8,853 6,085
Free cash fl ow € million − 843 − 879 − 614 4,399 2,020
Capital expenditure including acquisitions € million 7,072 6,643 15,637 5,693 4,227
of which: Property, plant and equipment and intangible assets € million 6,353 6,379 5,913 4,454 4,065
Depreciation, amortisation, impairment losses and asset disposals € million 3,632 3,410 2,553 2,416 2,629
Degree of asset depreciation % 58.5 61.8 64.0 69.4 70.9
Free cash fl ow per share € − 1.56 − 1.65 − 1.15 8.17 3.59
Asset/capital structure
Non-current assets € million 63,539 60,465 56,563 41,763 41,360
Current assets € million 29,117 32,612 36,875 51,667 42,060
Balance sheet equity € million 17,082 17,417 13,717 13,140 14,659
Non-current liabilities € million 44,391 45,162 45,633 36,793 36,796
Current liabilities € million 31,183 30,498 34,088 43,497 31,965
Balance sheet total € million 92,656 93,077 93,438 93,430 83,420
Fixed asset intensity of investments % 56.0 53.4 49.4 35.5 38.4
Current asset intensity of investments % 31.4 35.0 39.5 55.3 50.4
Asset coverage % 96.7 103.5 104.9 119.6 124.4
Equity ratio % 18.4 18.7 14.7 14.1 17.6
Five-YeaR oveRvieW

4 To our investors Review of operations our responsibility
Responsibility statement consolidated fi nancial statements Further information
Forward-looking statements. This report contains forward-looking statements regarding the future development of the RWE Group
and its companies as well as economic and political developments. These statements are assessments that we have made based
on information available to us at the time this document was prepared. In the event that the underlying assumptions do not
materialise or additional risks arise, actual performance can deviate from the performance expected at present. Therefore, we
cannot assume responsibility for the correctness of these statements.
Electricity used to only go in one direction: from power plant to customer. However, traffi c on former one-way streets has become more complex. Numerous small solar panels and wind turbines now feed electricity into the grid from distributed points. And they do this irregularly, depending on the weather and time of day. This places completely new demands on network operators.
With the Smart Country project in the District of Bitburg-Prüm in Germany, RWE is demonstrating the advantages to be gained in being properly connected. Thanks to a sophisticated control system,
imprint 231
iMpriNT
Design concept and layout:
Jung von Matt/brand identity, Hamburg
Typesetting, image editing and production:
CHIARI – Agentur für Markenkommunikation, Düsseldorf
Photographs:
Catrin Moritz, Essen
Jann Klee, Hamburg
RWE archive
Printing:
Kunst- und Werbedruck GmbH & Co KG, Bad Oeynhausen
RWE is a member of DIRK –
the German Investor Relations Association.
RWE Aktiengesellschaft
Opernplatz 1
45128 Essen
Germany
Phone +49 201 12-00
Fax +49 201 12-15199
E-mail [email protected]
Investor Relations:
Phone +49 201 12-15025
Fax +49 201 12-15265
E-mail [email protected]
Corporate Communications:
Phone +49 201 12-15250
Fax +49 201 12-15094
For annual reports, interim reports and further information
on RWE, please visit us on the internet at www.rwe.com
This annual report was published on 6 March 2012. This is a
translation of the German annual report. In case of divergence
from the German version, the German version shall prevail.
carbon neutralnatureOffice.com | DE-149-453272
print production
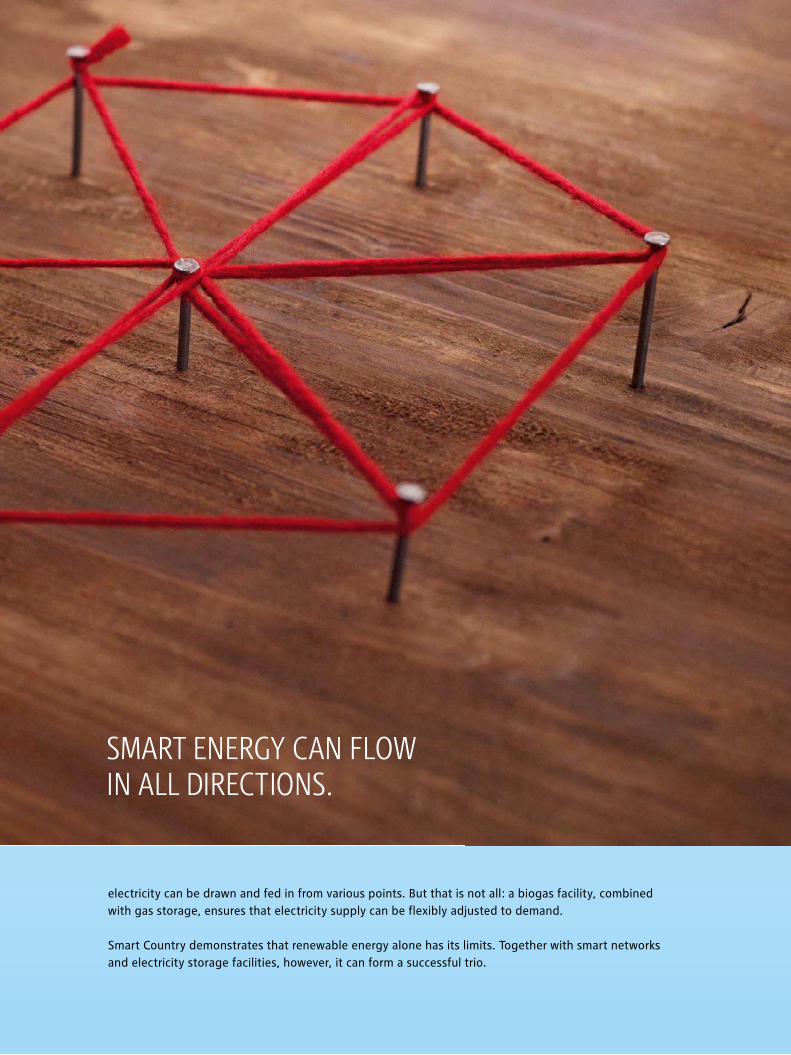
SMarT ENErgY CaN FlOw iN all dirECTiONS.
electricity can be drawn and fed in from various points. But that is not all: a biogas facility, combined with gas storage, ensures that electricity supply can be fl exibly adjusted to demand.
Smart Country demonstrates that renewable energy alone has its limits. Together with smart networks and electricity storage facilities, however, it can form a successful trio.
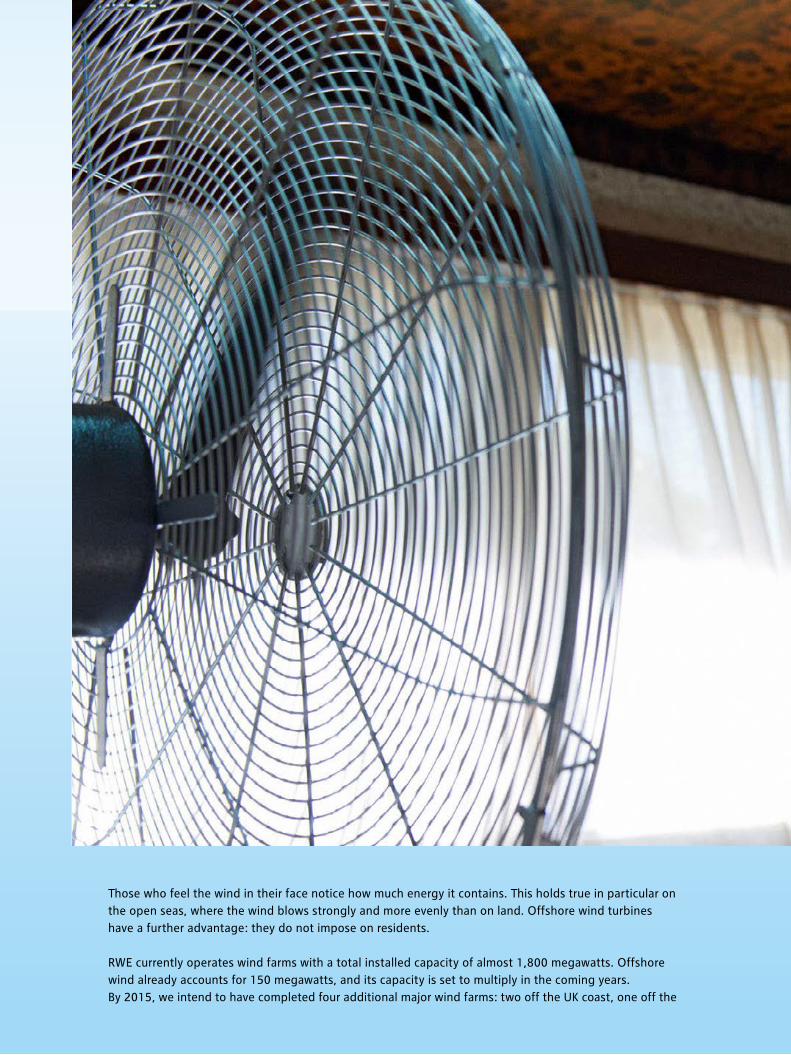
Those who feel the wind in their face notice how much energy it contains. This holds true in particular on the open seas, where the wind blows strongly and more evenly than on land. Offshore wind turbines have a further advantage: they do not impose on residents.
RWE currently operates wind farms with a total installed capacity of almost 1,800 megawatts. Offshore wind already accounts for 150 megawatts, and its capacity is set to multiply in the coming years. By 2015, we intend to have completed four additional major wind farms: two off the UK coast, one off the
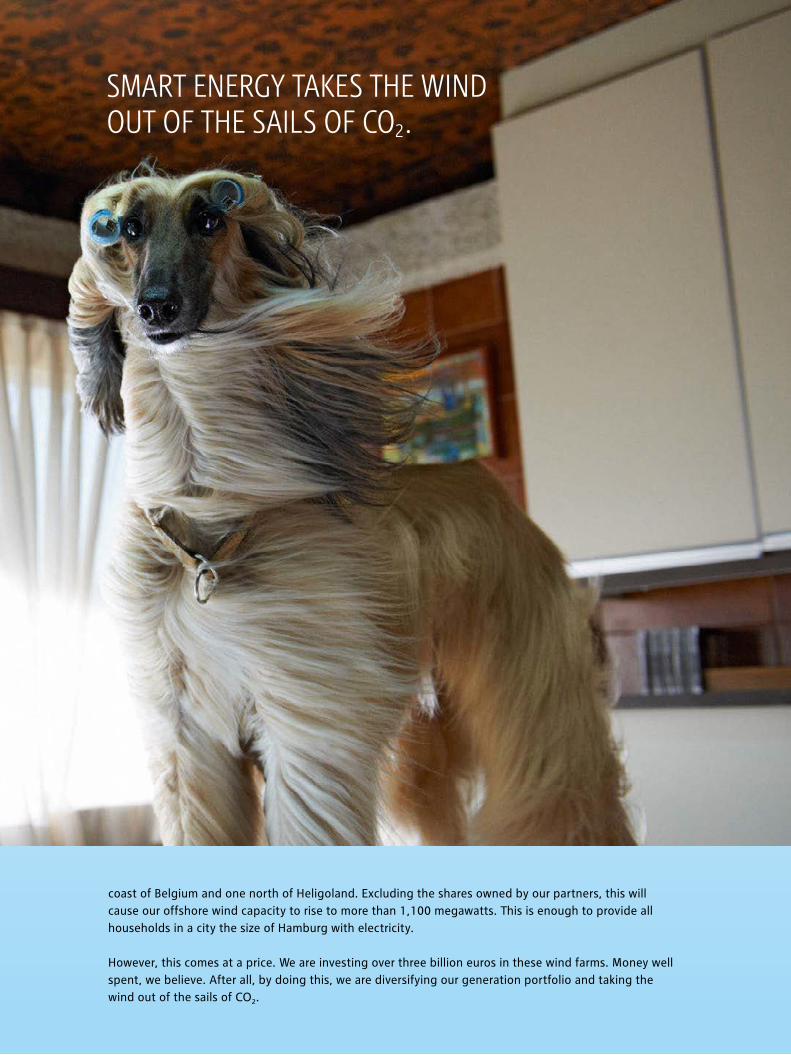
coast of Belgium and one north of Heligoland. Excluding the shares owned by our partners, this will cause our offshore wind capacity to rise to more than 1,100 megawatts. This is enough to provide all households in a city the size of Hamburg with electricity.
However, this comes at a price. We are investing over three billion euros in these wind farms. Money well spent, we believe. After all, by doing this, we are diversifying our generation portfolio and taking the wind out of the sails of CO2.
SMarT ENErgY TakES THE wiNd OuT OF THE SailS OF CO2.
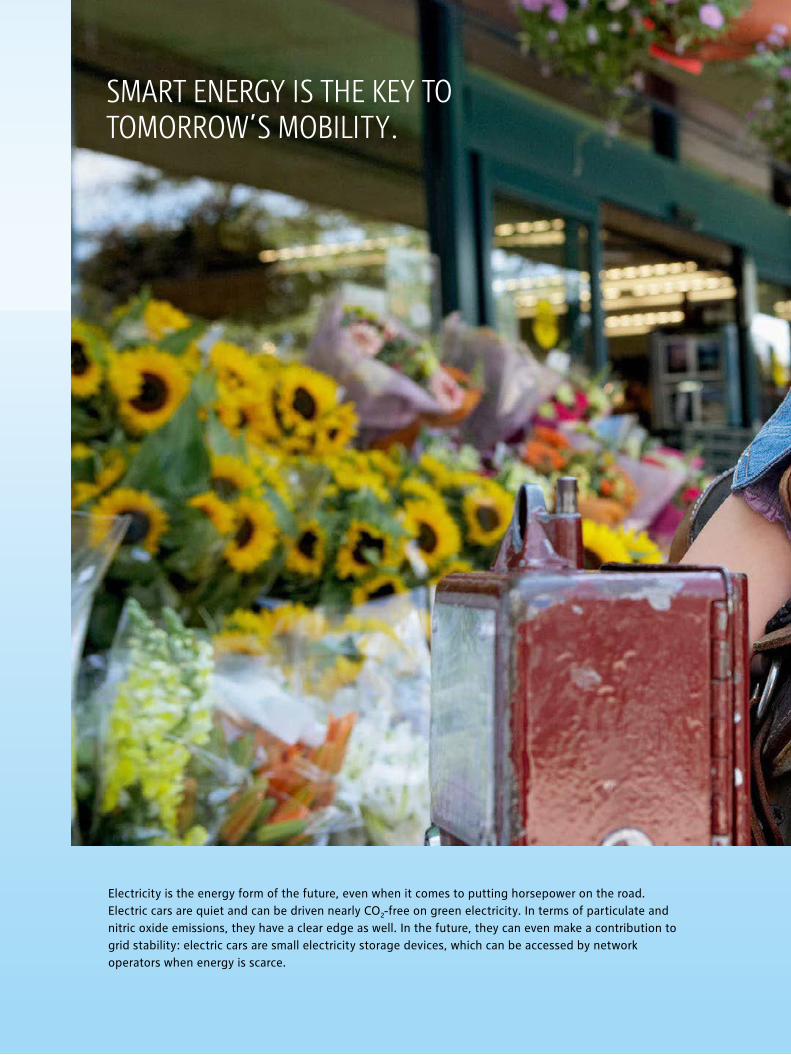
Electricity is the energy form of the future, even when it comes to putting horsepower on the road. Electric cars are quiet and can be driven nearly CO2- free on green electricity. In terms of particulate and nitric oxide emissions, they have a clear edge as well. In the future, they can even make a contribution to grid stability: electric cars are small electricity storage devices, which can be accessed by network operators when energy is scarce.
SMarT ENErgY iS THE kEY TO TOMOrrOw’S MObiliTY.

RWE began rolling out a nationwide electric charging station network three years ago. We now have more than 1,000 charging points in Germany making use of sophisticated technology: they automatically recognise customers, adding each charge to their electricity bill. This enables convenient and cashless car charging, whether at home, at work or in a shopping mall.
With our ‘RWE ePower Basic’ product, we also offer the matching green fuel – for mobility that is gentle on the climate and is fun.
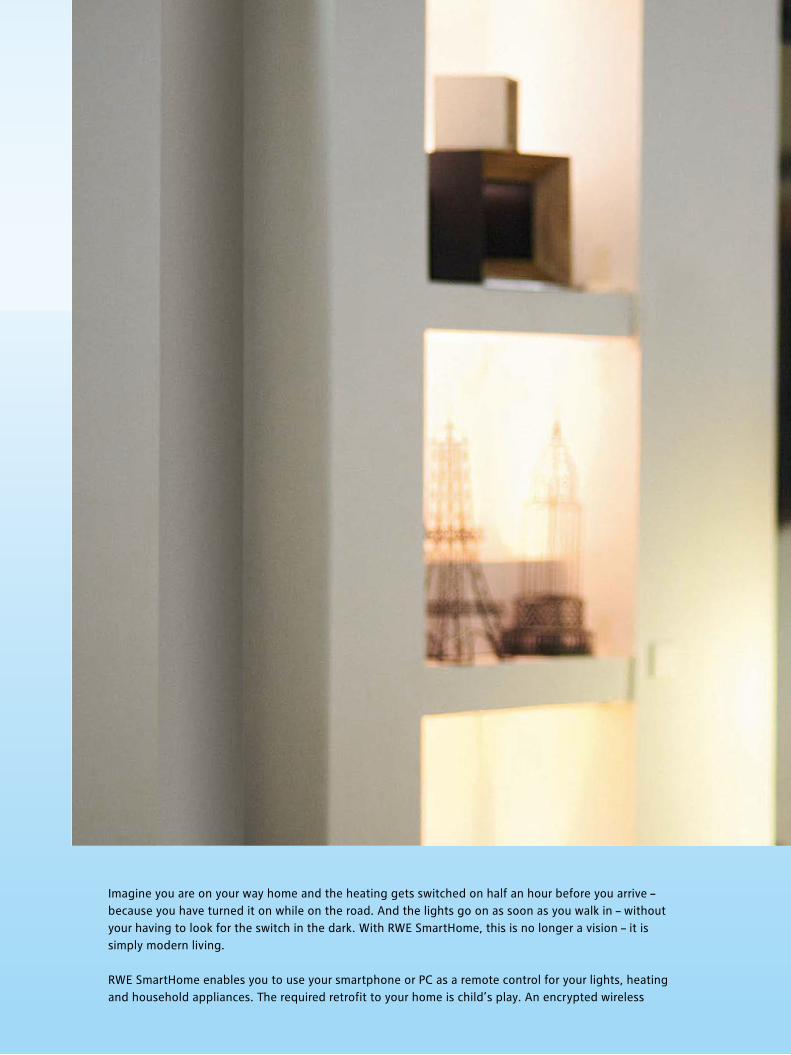
Imagine you are on your way home and the heating gets switched on half an hour before you arrive – because you have turned it on while on the road. And the lights go on as soon as you walk in – without your having to look for the switch in the dark. With RWE SmartHome, this is no longer a vision – it is simply modern living.
RWE SmartHome enables you to use your smartphone or PC as a remote control for your lights, heating and household appliances. The required retrofit to your home is child’s play. An encrypted wireless
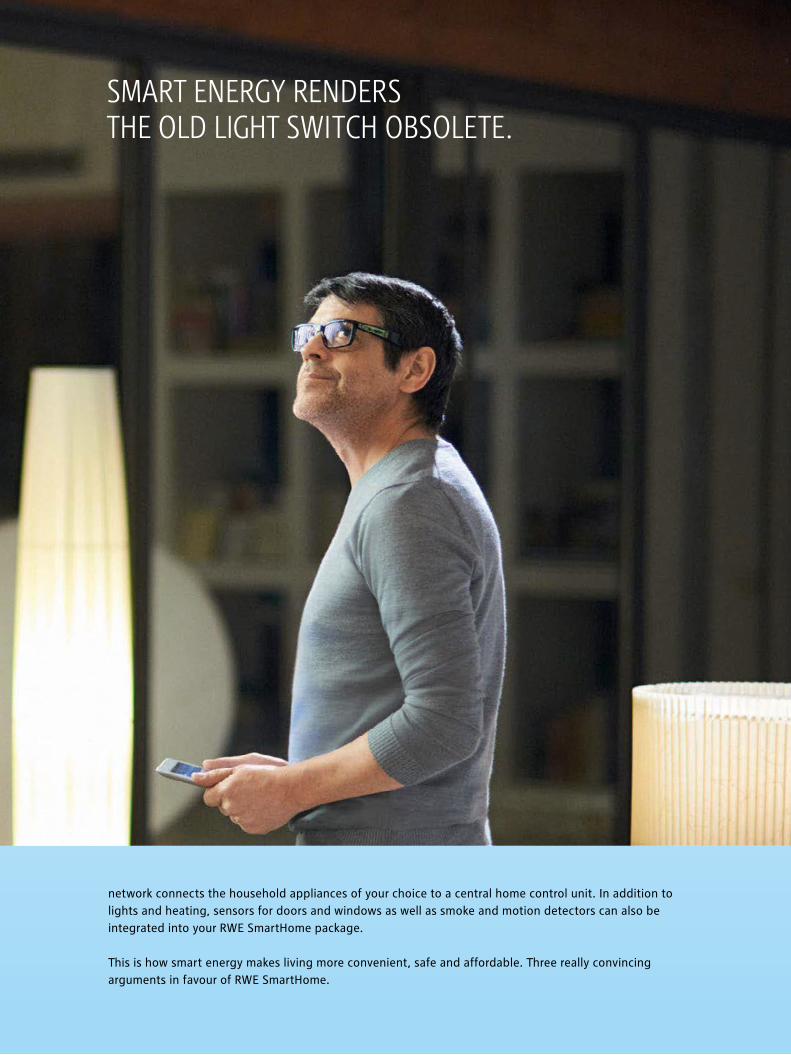
network connects the household appliances of your choice to a central home control unit. In addition to lights and heating, sensors for doors and windows as well as smoke and motion detectors can also be integrated into your RWE SmartHome package.
This is how smart energy makes living more convenient, safe and affordable. Three really convincing arguments in favour of RWE SmartHome.
SMarT ENErgY rENdErS THE Old ligHT SwiTCH ObSOlETE.
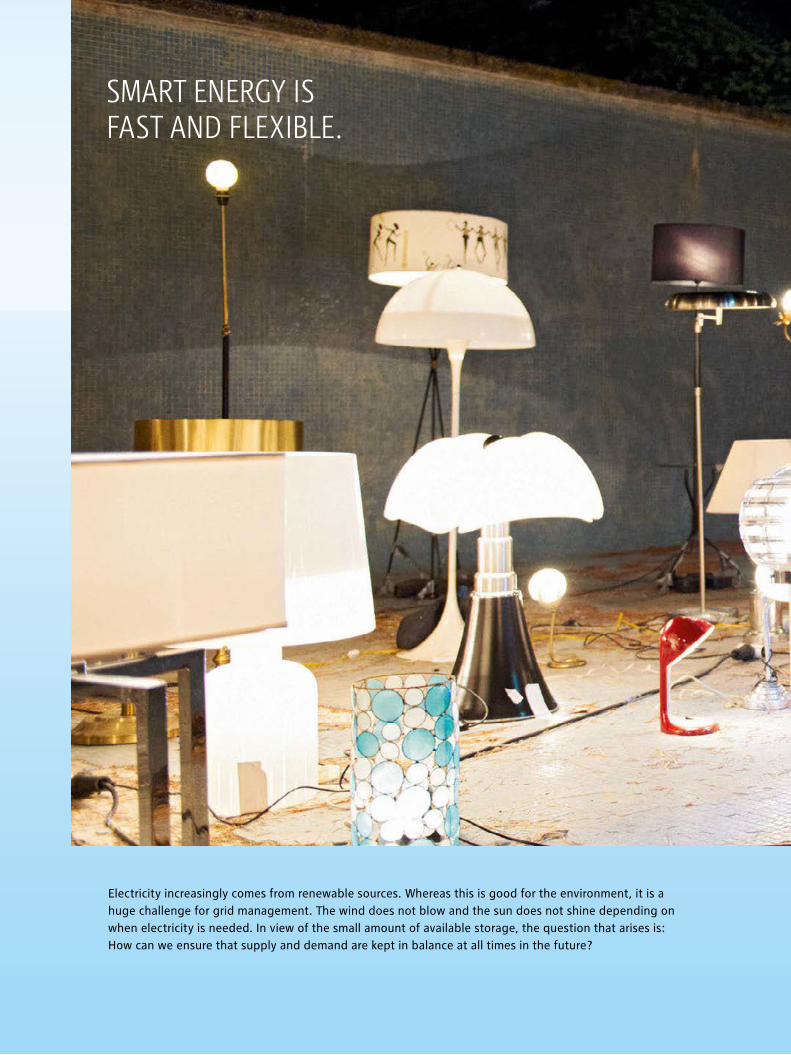
Electricity increasingly comes from renewable sources. Whereas this is good for the environment, it is a huge challenge for grid management. The wind does not blow and the sun does not shine depending on when electricity is needed. In view of the small amount of available storage, the question that arises is: How can we ensure that supply and demand are kept in balance at all times in the future?
SMarT ENErgY iSFaST aNd FlExiblE.
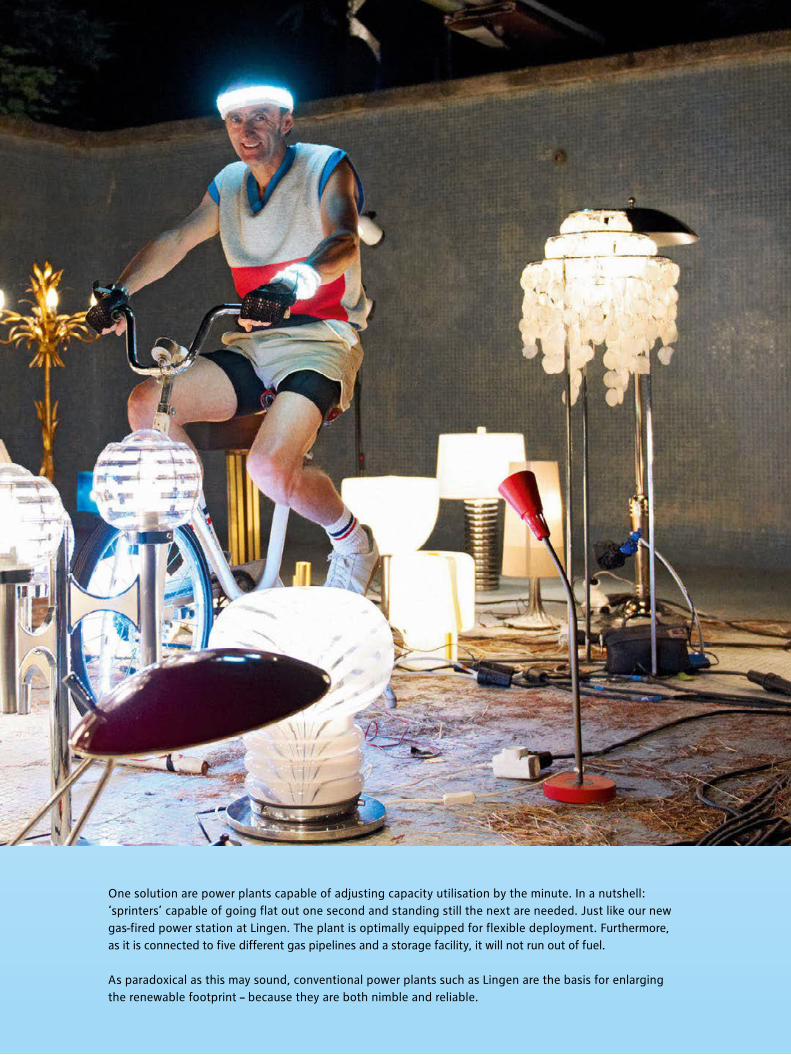
One solution are power plants capable of adjusting capacity utilisation by the minute. In a nutshell: ‘sprinters’ capable of going flat out one second and standing still the next are needed. Just like our new gas-fired power station at Lingen. The plant is optimally equipped for flexible deployment. Furthermore, as it is connected to five different gas pipelines and a storage facility, it will not run out of fuel.
As paradoxical as this may sound, conventional power plants such as Lingen are the basis for enlarging the renewable footprint – because they are both nimble and reliable.

A situation commonly faced in daily life: you fill your washing machine, press the start button and the drum starts turning. In tomorrow’s energy world, after pressing the start button, often nothing happens at first. Because the electricity price is too high for the moment. Only hours later is the machine set in motion – taking advantage of a temporary drop in prices on the electricity wholesale market.
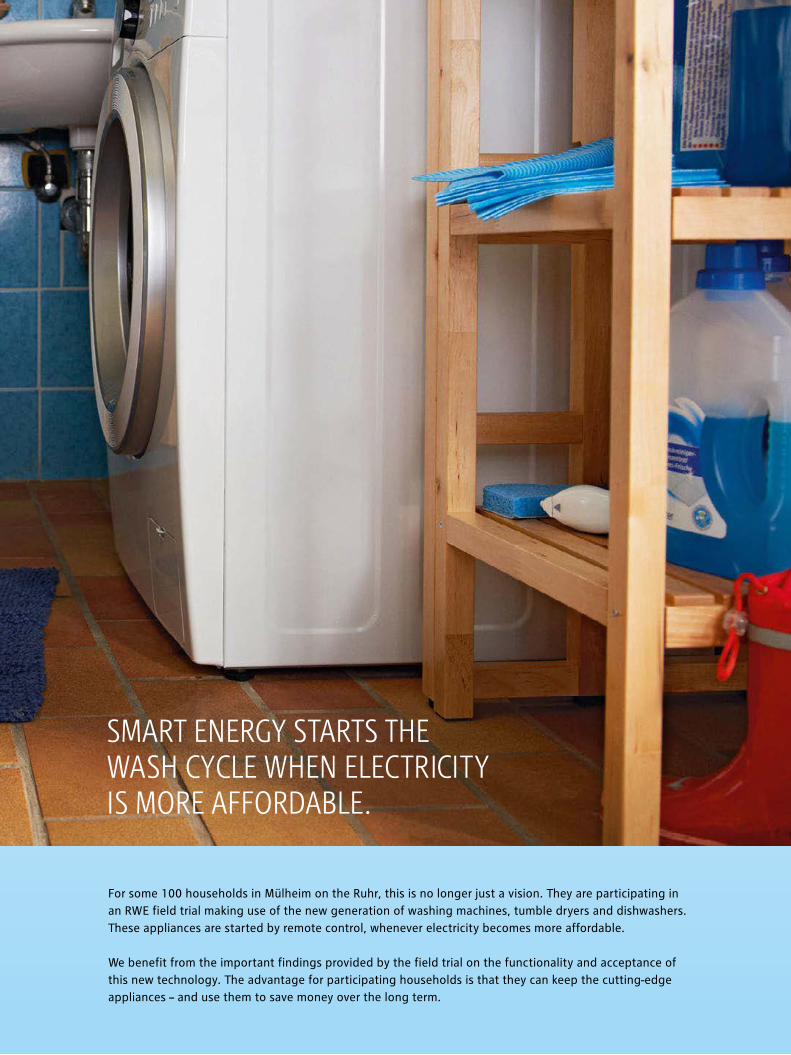
For some 100 households in Mülheim on the Ruhr, this is no longer just a vision. They are participating in an RWE field trial making use of the new generation of washing machines, tumble dryers and dishwashers. These appliances are started by remote control, whenever electricity becomes more affordable.
We benefit from the important findings provided by the field trial on the functionality and acceptance of this new technology. The advantage for participating households is that they can keep the cutting-edge appliances – and use them to save money over the long term.
SMarT ENErgY STarTS THE waSH CYClE wHEN ElECTriCiTY iS MOrE aFFOrdablE.
HavE wE arOuSEd YOur iNTErEST iN SMarT ENErgY?
Then visit us at
www.vorweggehen.de
The energy to lead with smart solutions. 1
To our investors
Letter from the CEO 16The RWE Executive Board 202011 in brief 22RWE on the capital market 24
1.0 Review of operations 291.1 Strategy 301.2 Economic environment 361.3 Political environment 431.4 Major events 461.5 Commentary on the segments 491.6 Business performance 511.7 Financial position and net worth 731.8 Notes to the financial statements 78
of RWE AG (holding company)
1.9 Disclosure relating to German takeover law 80
1.10 Innovation 831.11 Development of risks and opportunities 87
including the report on the internal
control and risk management system 1.12 Outlook 96
2.0 Our responsibility 101 2.1 Supervisory Board report 102 2.2 Corporate governance 106 2.3 Compensation report 109 (part of the review of operations)
2.4 Workforce 116 2.5 Sustainability 118
3.0 Responsibility statement 124
4.0 Consolidated financial statements 1254.1 Income statement 1264.2 Statement of recognised income 127
and expenses
4.3 Balance sheet 1284.4 Cash flow statement 1294.5 Statement of changes in equity 1304.6 Notes 1314.7 Boards (part of the notes) 1914.8 List of shareholdings (part of the notes) 1964.9 Independent auditors‘ report 224
Further information
Organisation chart of the RWE Group 226Glossary 227Index 230Imprint 231
Five-year overview
Financial calendar 2012/2013
Fold-out contents in back cover
CONTENTS
con
Ten
Ts
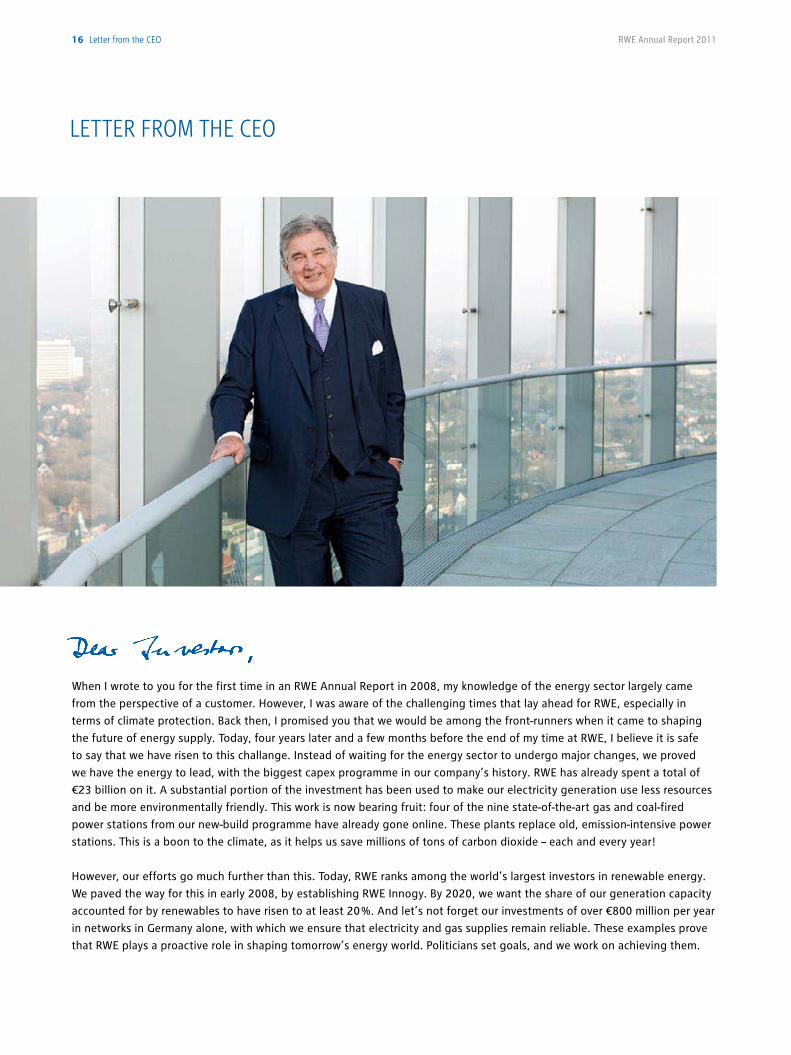
lETTEr FrOM THE CEO
When I wrote to you for the first time in an RWE Annual Report in 2008, my knowledge of the energy sector largely came
from the perspective of a customer. However, I was aware of the challenging times that lay ahead for RWE, especially in
terms of climate protection. Back then, I promised you that we would be among the front-runners when it came to shaping
the future of energy supply. Today, four years later and a few months before the end of my time at RWE, I believe it is safe
to say that we have risen to this challange. Instead of waiting for the energy sector to undergo major changes, we proved
we have the energy to lead, with the biggest capex programme in our company’s history. RWE has already spent a total of
€23 billion on it. A substantial portion of the investment has been used to make our electricity generation use less resources
and be more environmentally friendly. This work is now bearing fruit: four of the nine state-of-the-art gas and coal-fired
power stations from our new-build programme have already gone online. These plants replace old, emission-intensive power
stations. This is a boon to the climate, as it helps us save millions of tons of carbon dioxide – each and every year!
However, our efforts go much further than this. Today, RWE ranks among the world’s largest investors in renewable energy.
We paved the way for this in early 2008, by establishing RWE Innogy. By 2020, we want the share of our generation capacity
accounted for by renewables to have risen to at least 20 %. And let’s not forget our investments of over €800 million per year
in networks in Germany alone, with which we ensure that electricity and gas supplies remain reliable. These examples prove
that RWE plays a proactive role in shaping tomorrow’s energy world. Politicians set goals, and we work on achieving them.
16 letter from the ceo RWE Annual Report 2011
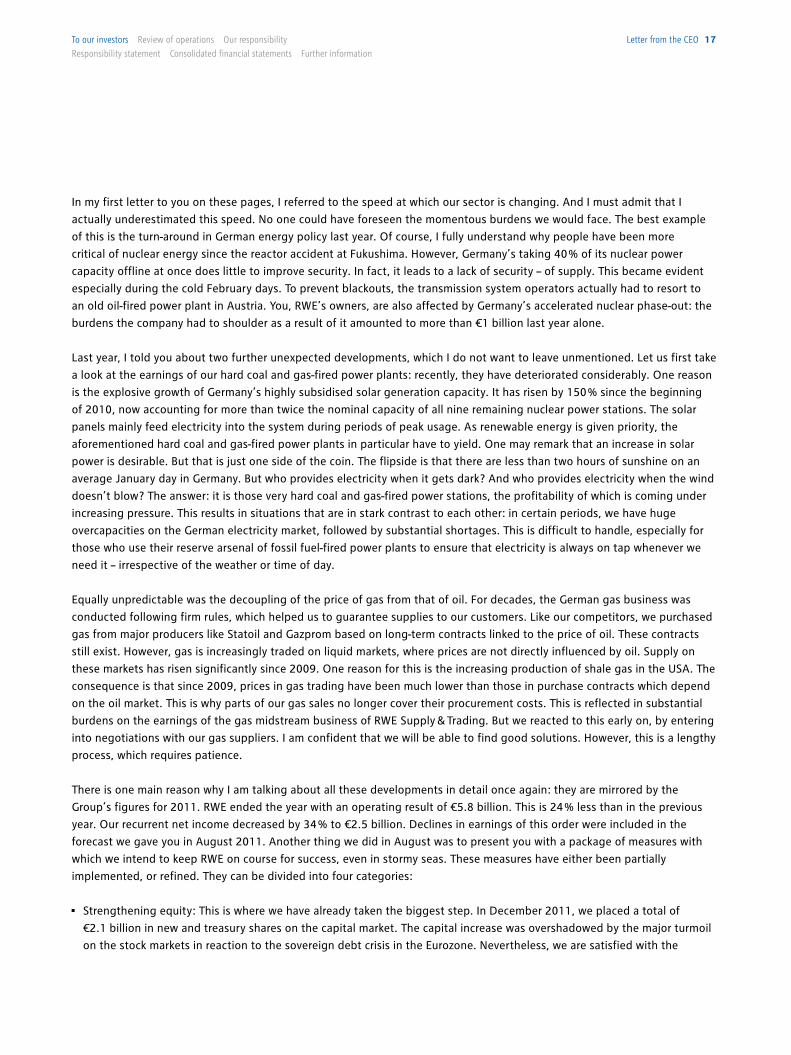
In my first letter to you on these pages, I referred to the speed at which our sector is changing. And I must admit that I
actually underestimated this speed. No one could have foreseen the momentous burdens we would face. The best example
of this is the turn-around in German energy policy last year. Of course, I fully understand why people have been more
critical of nuclear energy since the reactor accident at Fukushima. However, Germany’s taking 40 % of its nuclear power
capacity offline at once does little to improve security. In fact, it leads to a lack of security – of supply. This became evident
especially during the cold February days. To prevent blackouts, the transmission system operators actually had to resort to
an old oil-fired power plant in Austria. You, RWE’s owners, are also affected by Germany’s accelerated nuclear phase-out: the
burdens the company had to shoulder as a result of it amounted to more than €1 billion last year alone.
Last year, I told you about two further unexpected developments, which I do not want to leave unmentioned. Let us first take
a look at the earnings of our hard coal and gas-fired power plants: recently, they have deteriorated considerably. One reason
is the explosive growth of Germany’s highly subsidised solar generation capacity. It has risen by 150 % since the beginning
of 2010, now accounting for more than twice the nominal capacity of all nine remaining nuclear power stations. The solar
panels mainly feed electricity into the system during periods of peak usage. As renewable energy is given priority, the
aforementioned hard coal and gas-fired power plants in particular have to yield. One may remark that an increase in solar
power is desirable. But that is just one side of the coin. The flipside is that there are less than two hours of sunshine on an
average January day in Germany. But who provides electricity when it gets dark? And who provides electricity when the wind
doesn’t blow? The answer: it is those very hard coal and gas-fired power stations, the profitability of which is coming under
increasing pressure. This results in situations that are in stark contrast to each other: in certain periods, we have huge
overcapacities on the German electricity market, followed by substantial shortages. This is difficult to handle, especially for
those who use their reserve arsenal of fossil fuel-fired power plants to ensure that electricity is always on tap whenever we
need it – irrespective of the weather or time of day.
Equally unpredictable was the decoupling of the price of gas from that of oil. For decades, the German gas business was
conducted following firm rules, which helped us to guarantee supplies to our customers. Like our competitors, we purchased
gas from major producers like Statoil and Gazprom based on long-term contracts linked to the price of oil. These contracts
still exist. However, gas is increasingly traded on liquid markets, where prices are not directly influenced by oil. Supply on
these markets has risen significantly since 2009. One reason for this is the increasing production of shale gas in the USA. The
consequence is that since 2009, prices in gas trading have been much lower than those in purchase contracts which depend
on the oil market. This is why parts of our gas sales no longer cover their procurement costs. This is reflected in substantial
burdens on the earnings of the gas midstream business of RWE Supply & Trading. But we reacted to this early on, by entering
into negotiations with our gas suppliers. I am confident that we will be able to find good solutions. However, this is a lengthy
process, which requires patience.
There is one main reason why I am talking about all these developments in detail once again: they are mirrored by the
Group’s figures for 2011. RWE ended the year with an operating result of €5.8 billion. This is 24 % less than in the previous
year. Our recurrent net income decreased by 34 % to €2.5 billion. Declines in earnings of this order were included in the
forecast we gave you in August 2011. Another thing we did in August was to present you with a package of measures with
which we intend to keep RWE on course for success, even in stormy seas. These measures have either been partially
implemented, or refined. They can be divided into four categories:
• Strengthening equity: This is where we have already taken the biggest step. In December 2011, we placed a total of
€2.1 billion in new and treasury shares on the capital market. The capital increase was overshadowed by the major turmoil
on the stock markets in reaction to the sovereign debt crisis in the Eurozone. Nevertheless, we are satisfied with the
letter from the ceo 17To our investors Review of operations our responsibility
Responsibility statement consolidated financial statements Further information
proceeds of the issuance. Furthermore, we issued a second hybrid bond. This is a mix of debt and equity, with
corresponding advantages for our credit rating. As far as possible given the market environment, we will conduct further
hybrid issuances.
• Divestments: By selling parts of our business, we want to make a further contribution to maintaining our good credit
rating. At the top of our list of assets for sale are activities that are associated with substantial investments and will not
add to earnings until several years from now. This applies, among other things, to some of RWE Dea’s growth projects.
We are already in talks with potential buyers. But RWE Dea itself is not up for sale. We intend to dispose of the Czech long-
distance gas transmission system operator NET4GAS, our stake in Berlinwasser, select power plant capacities and some
German sales and network activities. Last fiscal year, we completed the sales of Thyssengas, the majority of Amprion and
a minority stake in a hard coal-fired power plant at Rostock. We aim to generate proceeds of up to €7 billion with the
remaining divestments. This is good news, because, just six months ago, we felt that we needed to make more substantial
divestments.
• Efficiency enhancements: You are familiar with our current programme. By taking measures to cut costs and increase
revenue, we want to make an annual contribution to earnings that gradually rises to a total of €1.5 billion by 2012
compared to 2006. We have made faster progress than planned and are now turning onto the home straight with a huge
lead. And, once we have crossed the finishing line, we will not rest on our laurels, but launch a new programme. By the
end of 2014, we intend to tap an additional €1 billion in earnings potential compared to 2012. We have already initiated
some of the measures. I am optimistic that the programme can be implemented in agreement with the workforce.
• Streamlining the investment budget: By spending €6.4 billion on property, plant and equipment in both 2010 and 2011,
we reached the peak of our record capital expenditure programme. We now plan to invest about €16 billion in the three-
year period ending in 2014. About half of the funds are earmarked for growth projects. In addition to electricity generation
from renewables, we also want to expand our oil and gas production. Among our geographic divisions, Central Eastern and
South Eastern Europe harbours the greatest potential for growth. This is a region in which we could envisage undertaking
power plant projects as well as building wind farms. And let us not forget that work on our power plant new-build
programme will last until 2014. Once it has been completed, i.e. no later than 2015, we will adjust our spending on
investments to the amount of operating cash flow left over after deducting the dividend. This means that we will not
spend more than we can finance with the cash flows we earn. In so doing, we will maintain our payout ratio of between
50 % and 60 % of recurrent net income.
By taking the aforementioned measures, we will prepare the ground for pulling ourselves through these difficult times. In
addition, we will benefit from the fact that we did not just start preparing ourselves for a rough market in 2011. Take our
reorganisation in 2009 and 2010 for example, through which we became leaner and more flexible, reduced duplicated
functions and pooled important tasks, including research and development. Many of these measures continue to have a
positive effect on our earnings today. These should stabilise this year: earnings before interest, taxes, depreciation and
amortisation – EBITDA for short – and the operating result should be in the order of last year’s level, as should recurrent net
income, the yardstick for determining your dividend. This is good news, because we will probably be able to offset the
earnings lost through the divestment of assets. In that sense, we will make ground in 2012.
18 letter from the ceo RWE Annual Report 2011
The fact that our 2013 earnings are likely to be of the order achieved in 2011 is even better news. Especially given that we
no longer receive free allocations of CO2 emission allowances. In addition, further earnings will be lost as we continue
our divestment programme. We are confident of being able to compensate for this. Our operating result and our recurrent
net income should thus be on a par with their 2011 levels. EBITDA could be even higher. We are anticipating a figure of
around €9 billion.
What does this mean for you, our shareholders? Despite the turbulent market environment that brings with it the
aforementioned burdens, RWE offers you the prospect of receiving an attractive dividend in the coming years. Granted, the
dividend of €2 per share we will propose to this year’s Annual General Meeting is far below last year’s, owing to the recent
development of our earnings. However, from our current perspective, it has bottomed out. Based on the closing price of our
common shares at the end of the year, the dividend yield amounts to 7.4 %. This puts us among the leaders in the DAX.
Last year I asked you to place your trust in us. I told you that we were preparing ourselves for rough waters. We are charting
a good course. This also applies to personnel matters: in Peter Terium, who will take the helm in the middle of the year, RWE
has found an executive from within our own ranks, who also has international experience, to succeed me. I am certain that
with him the company will be in good hands, as with his fellow board members and the company’s approximately 72,000
employees.
Energy supply is also in good hands at RWE. We are ready to take action as a partner in the transformation of the German
energy market by staying our course for renewable energy, efficient gas and coal-fired power plants, and a more powerful
network infrastructure. However, politicians must also play their part, as what we need much more than ambitious goals
are ice breakers, who can clear the way so that necessary infrastructure projects can be implemented. And we need the
acceptance of the population. Everyone has to get on board, including the residents in whose neighbourhood new power
lines will be erected. Last but not least, European co-operation needs to be intensified, as national solo attempts are not only
inefficient, but also dangerous in terms of security of supply.
Despite the huge challenges ahead of us, RWE will not be the reason for any failure of the transformation of the German
energy market. It is in stormy weather that good sailors can really prove themselves. RWE is an extremely seaworthy ship
with a strong crew which deserves your trust. I have convinced myself of this first hand during my four-and-a-half years on
board, during which I contributed to ensuring that this status is preserved. I would therefore be all the more pleased if RWE
could continue to count on your support.
Sincerely yours,
Dr. Jürgen Großmann
President and CEO of RWE AG
Essen, 17 February 2012
letter from the ceo 19To our investors Review of operations our responsibility
Responsibility statement consolidated financial statements Further information
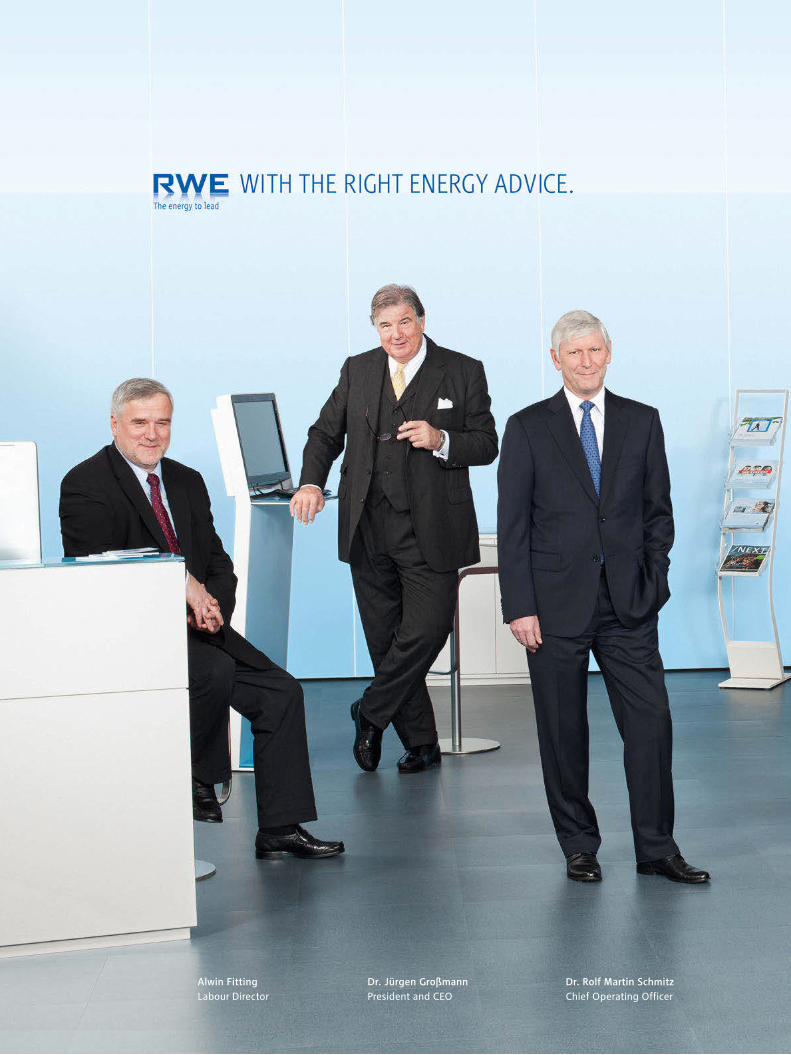
Alwin FittingLabour Director
Dr. Rolf Martin Schmitz Chief Operating Officer
Dr. Jürgen Großmann President and CEO
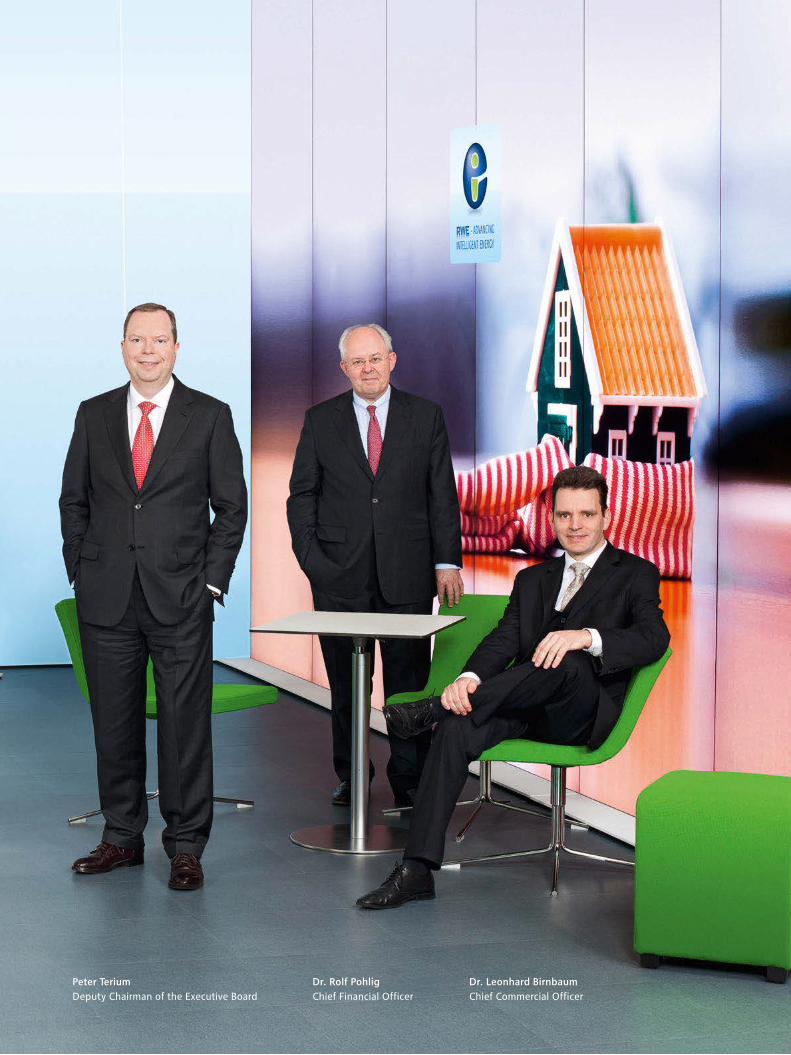
Peter Terium Deputy Chairman of the Executive Board
Dr. Leonhard Birnbaum Chief Commercial Officer
Dr. Rolf Pohlig Chief Financial Officer
MaY
Wood pellet factory in Georgia begins operation
The facility is among the largest and most modern of its kind in the world. It is capable of producing 750,000 metric tons per year. The wood pellets made in Georgia are being used to co-fire our Dutch Amer hard coal power station as well as other facilities.
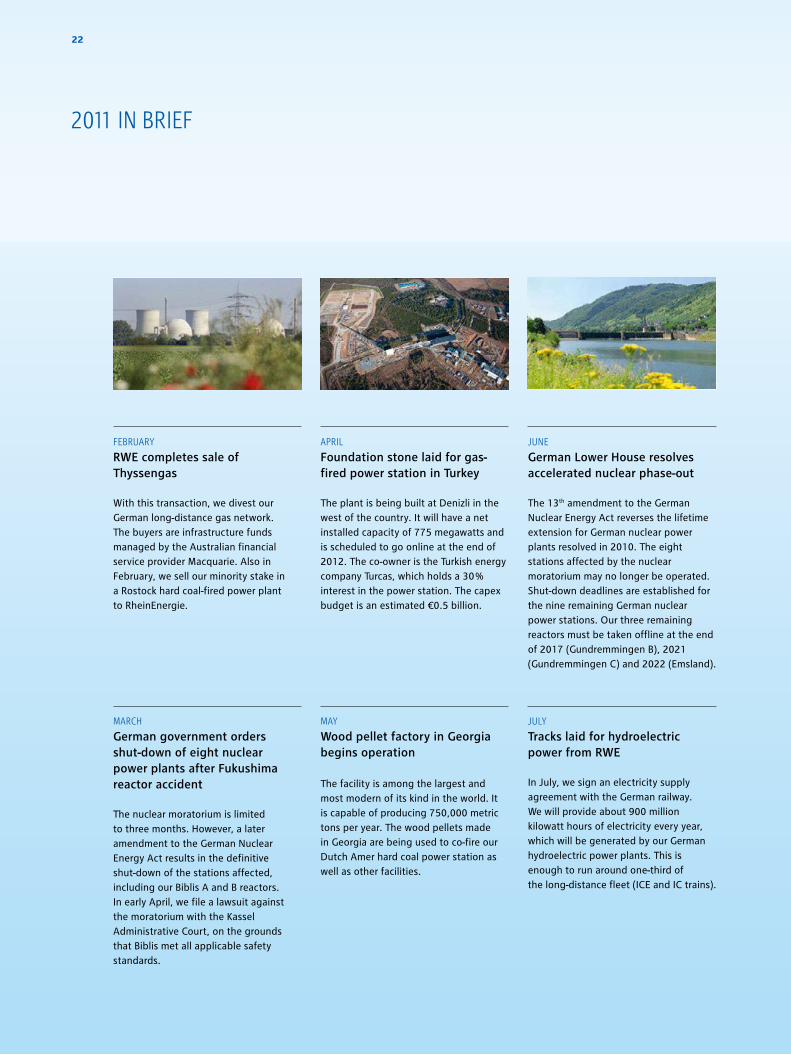
FebRuaRY
RWE completes sale of Thyssengas
With this transaction, we divest our German long-distance gas network. The buyers are infrastructure funds managed by the Australian financial service provider Macquarie. Also in February, we sell our minority stake in a Rostock hard coal-fired power plant to RheinEnergie.
MaRch
German government orders shut-down of eight nuclear power plants after Fukushima reactor accident
The nuclear moratorium is limited to three months. However, a later amendment to the German Nuclear Energy Act results in the definitive shut-down of the stations affected, including our Biblis A and B reactors. In early April, we file a lawsuit against the moratorium with the Kassel Administrative Court, on the grounds that Biblis met all applicable safety standards.
JulY
Tracks laid for hydroelectric power from RWE
In July, we sign an electricity supply agreement with the German railway. We will provide about 900 million kilowatt hours of electricity every year, which will be generated by our German hydroelectric power plants. This is enough to run around one-third of the long-distance fleet (ICE and IC trains).
apRil
Foundation stone laid for gas-fired power station in Turkey
The plant is being built at Denizli in the west of the country. It will have a net installed capacity of 775 megawatts and is scheduled to go online at the end of 2012. The co-owner is the Turkish energy company Turcas, which holds a 30 % interest in the power station. The capex budget is an estimated €0.5 billion.
June
German Lower House resolves accelerated nuclear phase-out
The 13th amendment to the German Nuclear Energy Act reverses the lifetime extension for German nuclear power plants resolved in 2010. The eight stations affected by the nuclear moratorium may no longer be operated. Shut-down deadlines are established for the nine remaining German nuclear power stations. Our three remaining reactors must be taken offline at the end of 2017 (Gundremmingen B), 2021 (Gundremmingen C) and 2022 (Emsland).
2011 iN briEF
22
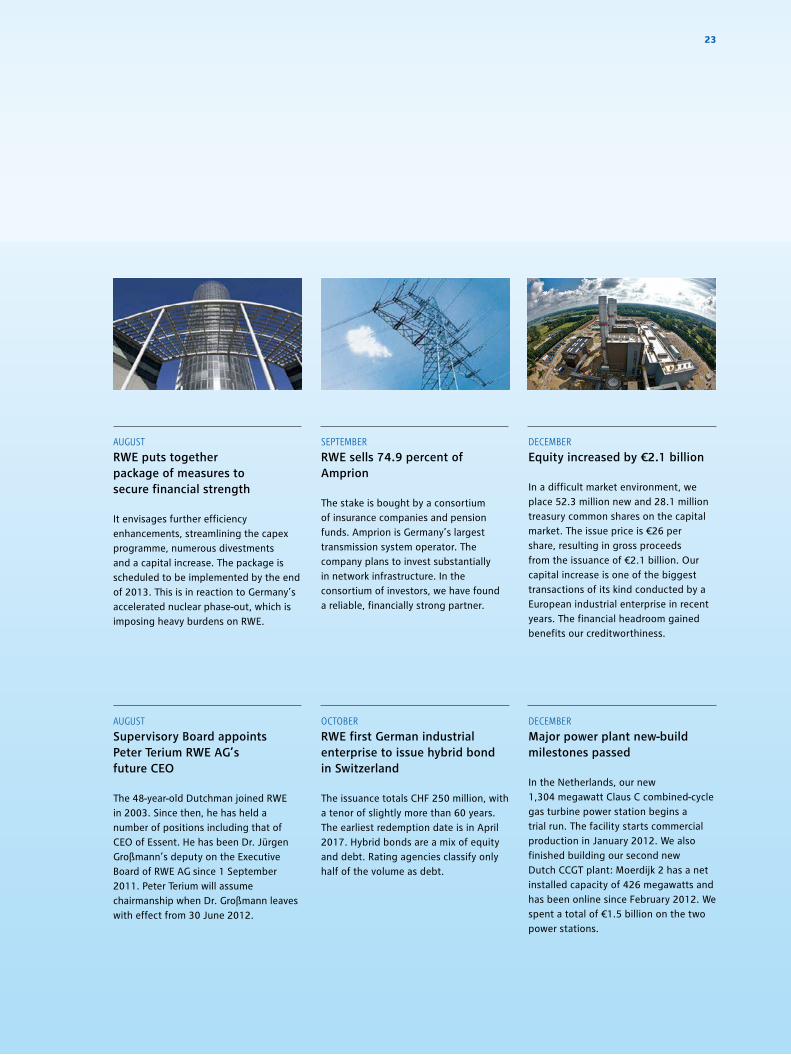
sepTeMbeR
RWE sells 74.9 percent of Amprion
The stake is bought by a consortium of insurance companies and pension funds. Amprion is Germany’s largest transmission system operator. The company plans to invest substantially in network infrastructure. In the consortium of investors, we have found a reliable, financially strong partner.
ocTobeR
RWE first German industrial enterprise to issue hybrid bond in Switzerland
The issuance totals CHF 250 million, with a tenor of slightly more than 60 years. The earliest redemption date is in April 2017. Hybrid bonds are a mix of equity and debt. Rating agencies classify only half of the volume as debt.
deceMbeR
Equity increased by €2.1 billion
In a difficult market environment, we place 52.3 million new and 28.1 million treasury common shares on the capital market. The issue price is €26 per share, resulting in gross proceeds from the issuance of €2.1 billion. Our capital increase is one of the biggest transactions of its kind conducted by a European industrial enterprise in recent years. The financial headroom gained benefits our creditworthiness.
deceMbeR
Major power plant new-build milestones passed
In the Netherlands, our new 1,304 megawatt Claus C combined-cycle gas turbine power station begins a trial run. The facility starts commercial production in January 2012. We also finished building our second new Dutch CCGT plant: Moerdijk 2 has a net installed capacity of 426 megawatts and has been online since February 2012. We spent a total of €1.5 billion on the two power stations.
auGusT
RWE puts together package of measures to secure financial strength
It envisages further efficiency enhancements, streamlining the capex programme, numerous divestments and a capital increase. The package is scheduled to be implemented by the end of 2013. This is in reaction to Germany’s accelerated nuclear phase-out, which is imposing heavy burdens on RWE.
auGusT
Supervisory Board appoints Peter Terium RWE AG’s future CEO
The 48-year-old Dutchman joined RWE in 2003. Since then, he has held a number of positions including that of CEO of Essent. He has been Dr. Jürgen Großmann’s deputy on the Executive Board of RWE AG since 1 September 2011. Peter Terium will assume chairmanship when Dr. Großmann leaves with effect from 30 June 2012.
23
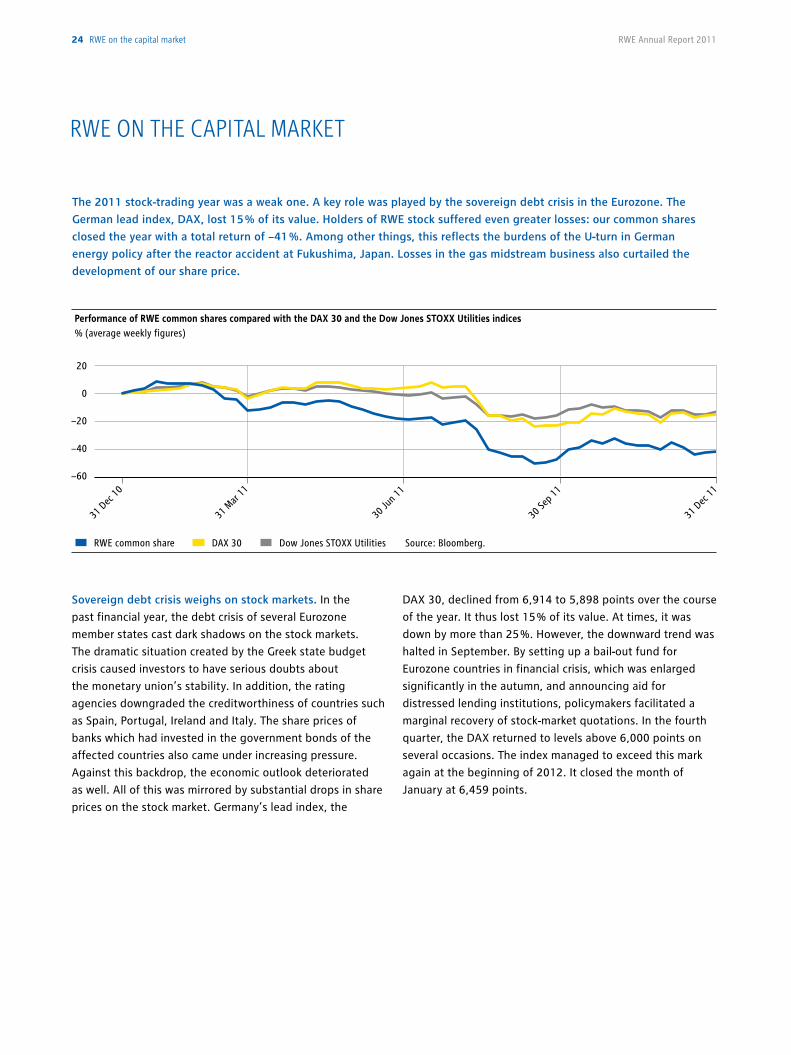
The 2011 stock-trading year was a weak one. A key role was played by the sovereign debt crisis in the Eurozone. The
German lead index, DAX, lost 15 % of its value. Holders of RWE stock suffered even greater losses: our common shares
closed the year with a total return of −41 %. Among other things, this reflects the burdens of the U-turn in German
energy policy after the reactor accident at Fukushima, Japan. Losses in the gas midstream business also curtailed the
development of our share price.
Sovereign debt crisis weighs on stock markets. In the
past financial year, the debt crisis of several Eurozone
member states cast dark shadows on the stock markets.
The dramatic situation created by the Greek state budget
crisis caused investors to have serious doubts about
the monetary union’s stability. In addition, the rating
agencies downgraded the creditworthiness of countries such
as Spain, Portugal, Ireland and Italy. The share prices of
banks which had invested in the government bonds of the
affected countries also came under increasing pressure.
Against this backdrop, the economic outlook deteriorated
as well. All of this was mirrored by substantial drops in share
prices on the stock market. Germany’s lead index, the
DAX 30, declined from 6,914 to 5,898 points over the course
of the year. It thus lost 15 % of its value. At times, it was
down by more than 25 %. However, the downward trend was
halted in September. By setting up a bail-out fund for
Eurozone countries in financial crisis, which was enlarged
significantly in the autumn, and announcing aid for
distressed lending institutions, policymakers facilitated a
marginal recovery of stock-market quotations. In the fourth
quarter, the DAX returned to levels above 6,000 points on
several occasions. The index managed to exceed this mark
again at the beginning of 2012. It closed the month of
January at 6,459 points.
rwE ON THE CapiTal MarkET
31 D
ec 10
31 M
ar 11
30 Ju
n 11
30 Se
p 11
31 D
ec 11
RWE common share Dow Jones STOXX UtilitiesDAX 30 Source: Bloomberg.
20
0
−20
−40
−60
Performance of RWE common shares compared with the DAX 30 and the Dow Jones STOXX Utilities indices % (average weekly figures)
24 RWe on the capital market RWE Annual Report 2011
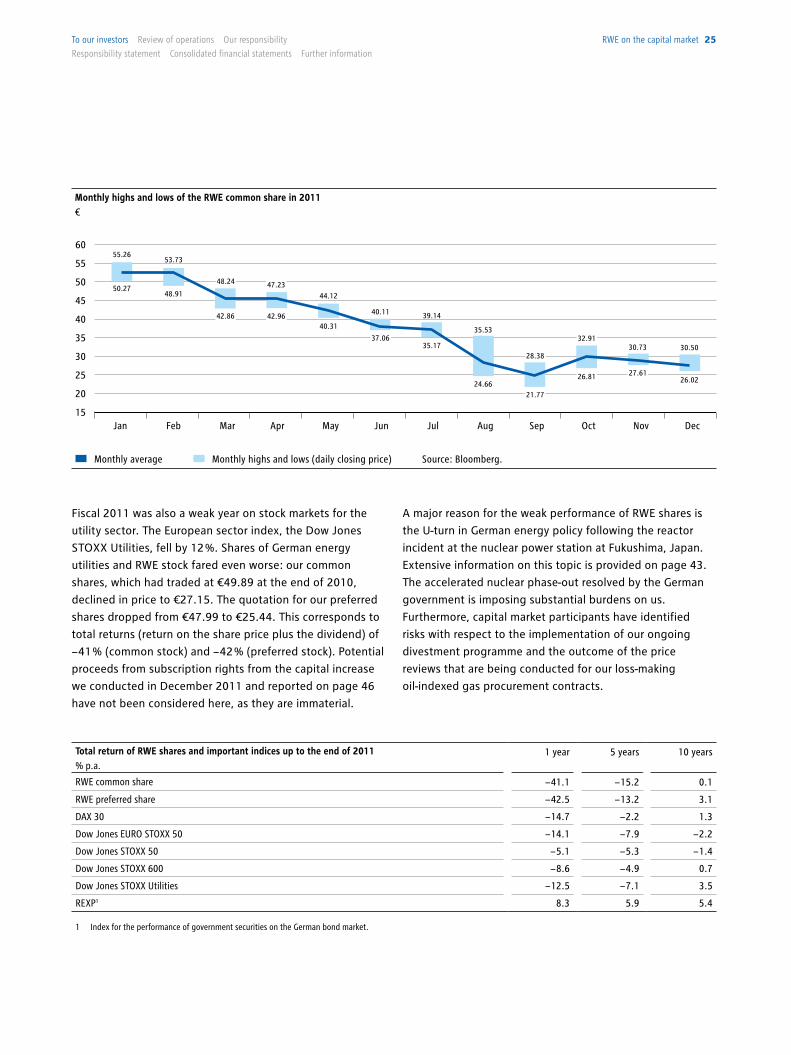
Fiscal 2011 was also a weak year on stock markets for the
utility sector. The European sector index, the Dow Jones
STOXX Utilities, fell by 12 %. Shares of German energy
utilities and RWE stock fared even worse: our common
shares, which had traded at €49.89 at the end of 2010,
declined in price to €27.15. The quotation for our preferred
shares dropped from €47.99 to €25.44. This corresponds to
total returns (return on the share price plus the dividend) of
− 41 % (common stock) and − 42 % (preferred stock). Potential
proceeds from subscription rights from the capital increase
we conducted in December 2011 and reported on page 46
have not been considered here, as they are immaterial.
A major reason for the weak performance of RWE shares is
the U-turn in German energy policy following the reactor
incident at the nuclear power station at Fukushima, Japan.
Extensive information on this topic is provided on page 43.
The accelerated nuclear phase-out resolved by the German
government is imposing substantial burdens on us.
Furthermore, capital market participants have identified
risks with respect to the implementation of our ongoing
divestment programme and the outcome of the price
reviews that are being conducted for our loss-making
oil-indexed gas procurement contracts.
Jan Feb Mar Apr May Jun Jul Aug Sep Oct Nov Dec
Monthly highs and lows (daily closing price)Monthly average Source: Bloomberg.
60
55
50
45
40
35
30
25
20
15
Monthly highs and lows of the RWE common share in 2011€
55.26
50.2744.12
40.11 39.14
35.53
28.38
32.9130.73 30.50
26.0227.6126.81
21.7724.66
35.1737.06
40.3142.96
53.73
48.91
48.24
42.86
47.23
Total return of RWE shares and important indices up to the end of 2011% p.a.
1 year 5 years 10 years
RWE common share − 41.1 − 15.2 0.1
RWE preferred share − 42.5 − 13.2 3.1
DAX 30 − 14.7 − 2.2 1.3
Dow Jones EURO STOXX 50 − 14.1 − 7.9 − 2.2
Dow Jones STOXX 50 − 5.1 − 5.3 − 1.4
Dow Jones STOXX 600 − 8.6 − 4.9 0.7
Dow Jones STOXX Utilities − 12.5 − 7.1 3.5
REXP1 8.3 5.9 5.4
1 Index for the performance of government securities on the German bond market.
RWe on the capital market 25To our investors Review of operations our responsibility
Responsibility statement consolidated financial statements Further information
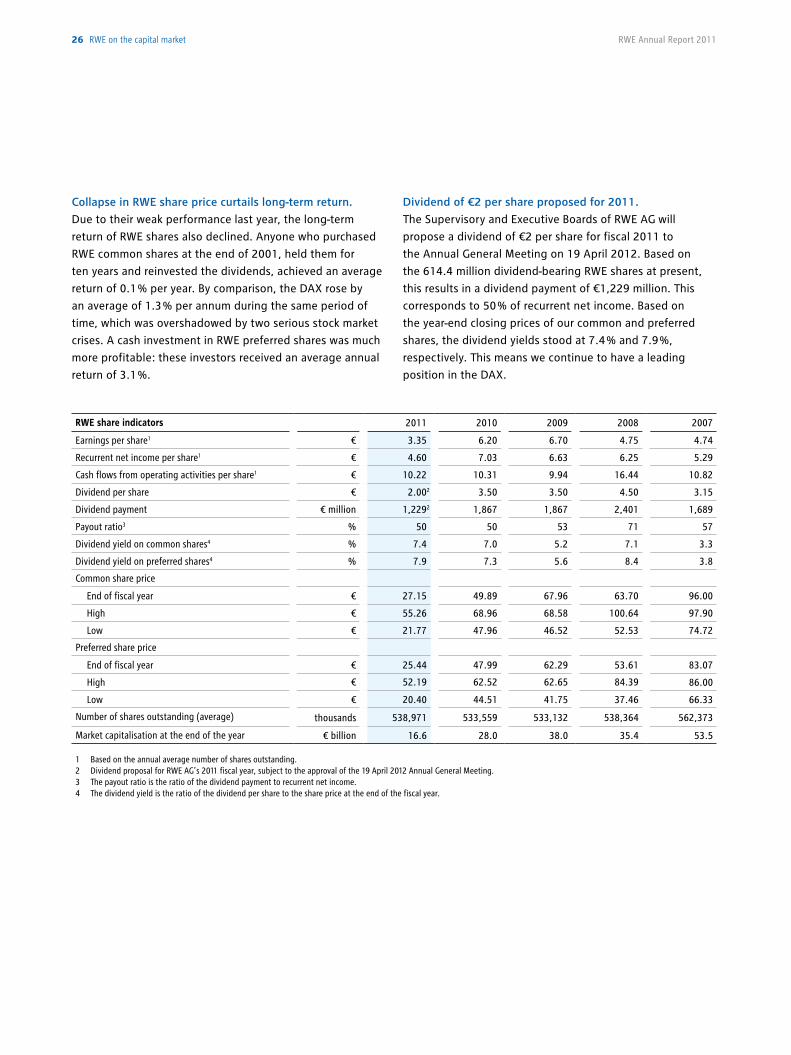
Collapse in RWE share price curtails long-term return.
Due to their weak performance last year, the long-term
return of RWE shares also declined. Anyone who purchased
RWE common shares at the end of 2001, held them for
ten years and reinvested the dividends, achieved an average
return of 0.1 % per year. By comparison, the DAX rose by
an average of 1.3 % per annum during the same period of
time, which was overshadowed by two serious stock market
crises. A cash investment in RWE preferred shares was much
more profitable: these investors received an average annual
return of 3.1 %.
Dividend of €2 per share proposed for 2011.
The Supervisory and Executive Boards of RWE AG will
propose a dividend of €2 per share for fiscal 2011 to
the Annual General Meeting on 19 April 2012. Based on
the 614.4 million dividend-bearing RWE shares at present,
this results in a dividend payment of €1,229 million. This
corresponds to 50 % of recurrent net income. Based on
the year-end closing prices of our common and preferred
shares, the dividend yields stood at 7.4 % and 7.9 %,
respectively. This means we continue to have a leading
position in the DAX.
RWE share indicators 2011 2010 2009 2008 2007
Earnings per share1 € 3.35 6.20 6.70 4.75 4.74
Recurrent net income per share1 € 4.60 7.03 6.63 6.25 5.29
Cash flows from operating activities per share1 € 10.22 10.31 9.94 16.44 10.82
Dividend per share € 2.002 3.50 3.50 4.50 3.15
Dividend payment € million 1,2292 1,867 1,867 2,401 1,689
Payout ratio3 % 50 50 53 71 57
Dividend yield on common shares4 % 7.4 7.0 5.2 7.1 3.3
Dividend yield on preferred shares4 % 7.9 7.3 5.6 8.4 3.8
Common share price
End of fiscal year € 27.15 49.89 67.96 63.70 96.00
High € 55.26 68.96 68.58 100.64 97.90
Low € 21.77 47.96 46.52 52.53 74.72
Preferred share price
End of fiscal year € 25.44 47.99 62.29 53.61 83.07
High € 52.19 62.52 62.65 84.39 86.00
Low € 20.40 44.51 41.75 37.46 66.33
Number of shares outstanding (average) thousands 538,971 533,559 533,132 538,364 562,373
Market capitalisation at the end of the year € billion 16.6 28.0 38.0 35.4 53.5
1 Based on the annual average number of shares outstanding. 2 Dividend proposal for RWE AG’s 2011 fiscal year, subject to the approval of the 19 April 2012 Annual General Meeting. 3 The payout ratio is the ratio of the dividend payment to recurrent net income. 4 The dividend yield is the ratio of the dividend per share to the share price at the end of the fiscal year.
26 RWe on the capital market RWE Annual Report 2011
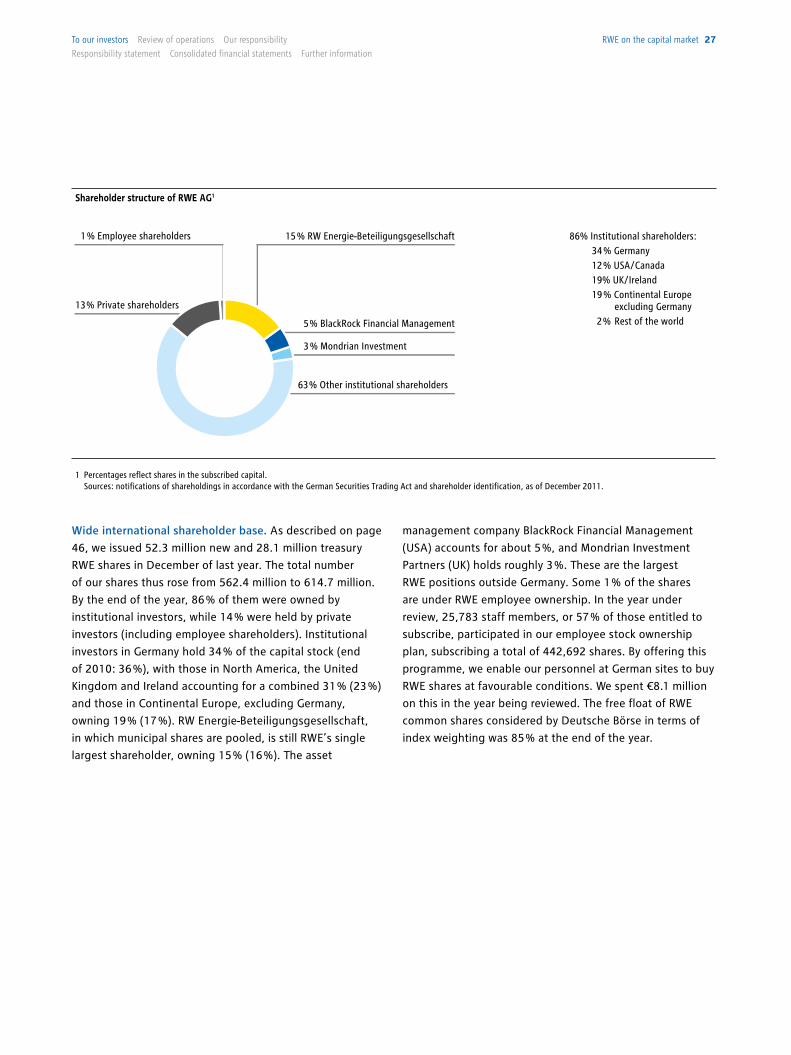
Wide international shareholder base. As described on page
46, we issued 52.3 million new and 28.1 million treasury
RWE shares in December of last year. The total number
of our shares thus rose from 562.4 million to 614.7 million.
By the end of the year, 86 % of them were owned by
institutional investors, while 14 % were held by private
investors (including employee shareholders). Institutional
investors in Germany hold 34 % of the capital stock (end
of 2010: 36 %), with those in North America, the United
Kingdom and Ireland accounting for a combined 31 % (23 %)
and those in Continental Europe, excluding Germany,
owning 19 % (17 %). RW Energie-Beteiligungsgesellschaft,
in which municipal shares are pooled, is still RWE’s single
largest shareholder, owning 15 % (16 %). The asset
management company BlackRock Financial Management
(USA) accounts for about 5 %, and Mondrian Investment
Partners (UK) holds roughly 3 %. These are the largest
RWE positions outside Germany. Some 1 % of the shares
are under RWE employee ownership. In the year under
review, 25,783 staff members, or 57 % of those entitled to
subscribe, participated in our employee stock ownership
plan, subscribing a total of 442,692 shares. By offering this
programme, we enable our personnel at German sites to buy
RWE shares at favourable conditions. We spent €8.1 million
on this in the year being reviewed. The free float of RWE
common shares considered by Deutsche Börse in terms of
index weighting was 85 % at the end of the year.
Shareholder structure of RWE AG1
1 Percentages reflect shares in the subscribed capital. Sources: notifications of shareholdings in accordance with the German Securities Trading Act and shareholder identification, as of December 2011.
13% Private shareholders
1% Employee shareholders 15% RW Energie-Beteiligungsgesellschaft 86% Institutional shareholders: 34% Germany 12% USA/Canada 19% UK/Ireland 19% Continental Europe excluding Germany 2% Rest of the world 5% BlackRock Financial Management
3% Mondrian Investment
63% Other institutional shareholders
RWe on the capital market 27To our investors Review of operations our responsibility
Responsibility statement consolidated financial statements Further information
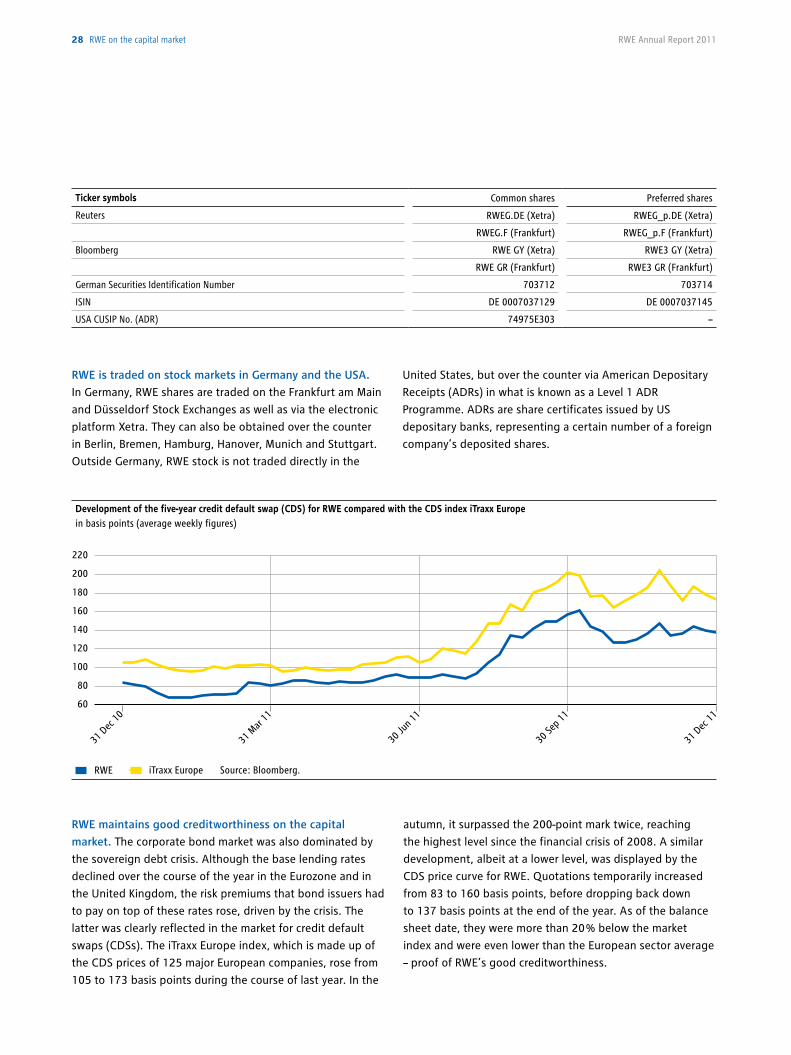
Development of the five-year credit default swap (CDS) for RWE compared with the CDS index iTraxx Europe in basis points (average weekly figures)
31 D
ec 10
RWE
31 M
ar 11
30 Ju
n 11
30 Se
p 11
31 D
ec 11
iTraxx Europe Source: Bloomberg.
220
200
180
160
140
120
100
80
60
RWE is traded on stock markets in Germany and the USA.
In Germany, RWE shares are traded on the Frankfurt am Main
and Düsseldorf Stock Exchanges as well as via the electronic
platform Xetra. They can also be obtained over the counter
in Berlin, Bremen, Hamburg, Hanover, Munich and Stuttgart.
Outside Germany, RWE stock is not traded directly in the
United States, but over the counter via American Depositary
Receipts (ADRs) in what is known as a Level 1 ADR
Programme. ADRs are share certificates issued by US
depositary banks, representing a certain number of a foreign
company’s deposited shares.
RWE maintains good creditworthiness on the capital
market. The corporate bond market was also dominated by
the sovereign debt crisis. Although the base lending rates
declined over the course of the year in the Eurozone and in
the United Kingdom, the risk premiums that bond issuers had
to pay on top of these rates rose, driven by the crisis. The
latter was clearly reflected in the market for credit default
swaps (CDSs). The iTraxx Europe index, which is made up of
the CDS prices of 125 major European companies, rose from
105 to 173 basis points during the course of last year. In the
autumn, it surpassed the 200-point mark twice, reaching
the highest level since the financial crisis of 2008. A similar
development, albeit at a lower level, was displayed by the
CDS price curve for RWE. Quotations temporarily increased
from 83 to 160 basis points, before dropping back down
to 137 basis points at the end of the year. As of the balance
sheet date, they were more than 20 % below the market
index and were even lower than the European sector average
– proof of RWE’s good creditworthiness.
Ticker symbols Common shares Preferred shares
Reuters RWEG.DE (Xetra) RWEG_p.DE (Xetra)
RWEG.F (Frankfurt) RWEG_p.F (Frankfurt)
Bloomberg RWE GY (Xetra) RWE3 GY (Xetra)
RWE GR (Frankfurt) RWE3 GR (Frankfurt)
German Securities Identification Number 703712 703714
ISIN DE 0007037129 DE 0007037145
USA CUSIP No. (ADR) 74975E303 –
28 RWe on the capital market RWE Annual Report 2011
29
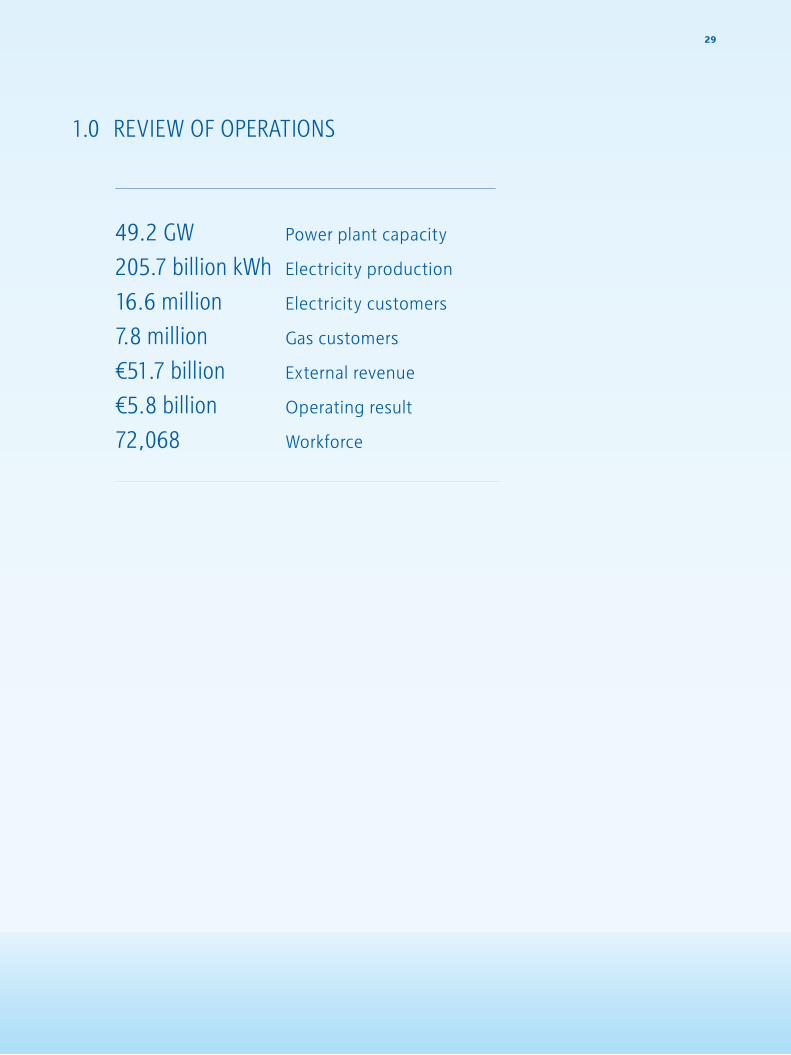
1.0 rEviEw OF OpEraTiONS
49.2 gw205.7 billion kwh16.6 million7.8 million€51.7 billion€5.8 billion72,068
Power plant capacity
Electricity production
Electricity customers
Gas customers
External revenue
Operating result
Workforce
RWE is becoming more sustainable. Energy supply requires
a long-term business model. We plan our investments in
power stations, networks and raw material production
facilities in terms of decades, not in terms of years. To secure
the profitability of these projects, we see to it that they
are in line with the principles of sustainable development.
Protecting the climate is high on our list of priorities. It
sets the course for the modernisation and expansion of
our electricity generation portfolio and also motivates us to
champion the efficient use of energy outside RWE’s factory
gates. To this end, we plan to take the following steps:
• We intend to increase the share of our generation capacity
accounted for by renewables to at least 20 % by 2020. At
the end of 2011, it amounted to 8 %.
• By 2020, we want to have lowered the CO2 emissions of
our power plant fleet per megawatt hour (MWh) of
electricity by more than 20 % compared to 2005. In the
baseline year, we emitted 0.79 metric tons of CO2 per
MWh. Our target is 0.62 metric tons.
• We want to improve the degree of energy utilisation of
our coal and gas-fired power stations significantly and
promote the conservation of energy by our customers.
Against the backdrop of the reactor catastrophe at
Fukushima, in the middle of 2011 the German government
reversed the extension of the lifetimes of German nuclear
power plants it had resolved shortly before. This eliminated a
major component of our CO2 reduction strategy to date.
However, this does not affect our commitment to electricity
generation that is gentle on the climate. To this end, we are
1.1 STraTEgY
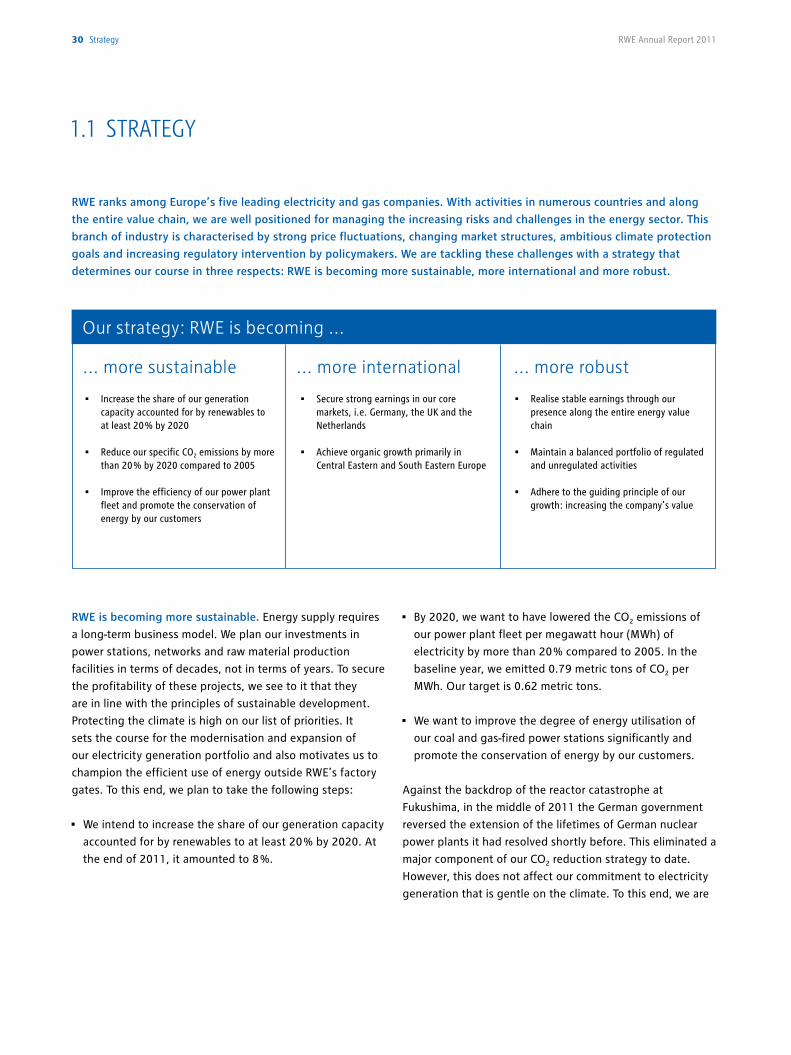
RWE ranks among Europe’s five leading electricity and gas companies. With activities in numerous countries and along
the entire value chain, we are well positioned for managing the increasing risks and challenges in the energy sector. This
branch of industry is characterised by strong price fluctuations, changing market structures, ambitious climate protection
goals and increasing regulatory intervention by policymakers. We are tackling these challenges with a strategy that
determines our course in three respects: RWE is becoming more sustainable, more international and more robust.
• Realise stable earnings through our presence along the entire energy value chain
• Maintain a balanced portfolio of regulated and unregulated activities
• Adhere to the guiding principle of our growth: increasing the company’s value
... more robust
• Secure strong earnings in our core markets, i.e. Germany, the UK and the Netherlands
• Achieve organic growth primarily in Central Eastern and South Eastern Europe
• Increase the share of our generation capacity accounted for by renewables to at least 20 % by 2020
• Reduce our specific CO2 emissions by more than 20 % by 2020 compared to 2005
• Improve the efficiency of our power plant fleet and promote the conservation of energy by our customers
Our strategy: RWE is becoming ...
... more sustainable ... more international
30 strategy RWE Annual Report 2011
focusing above all on the expansion of renewable energy
and, from 2012 to 2014, we intend to spend about €4 billion
on this. RWE Innogy, our Group company which specialises in
producing electricity and heat from renewable sources,
should be building or operating power generating facilities
with a total of 4.5 gigawatts (GW) of capacity by the end of
2014. The company is focusing its capital expenditure on
onshore and offshore wind farms. The regional focus lies on
Germany, the United Kingdom, the Netherlands, Poland,
Spain and Italy. RWE is one of the largest investors in
European offshore wind power. We are building four large-
scale projects either alone or with partners, with a combined
installed capacity of 1,670 megawatts (MW): Gwynt y Môr
off the coast of North Wales, Greater Gabbard in the UK
North Sea, Thornton Bank off the Belgian coast and Nordsee
Ost near the German Isle of Heligoland. Furthermore, several
RWE companies are investing in the production of electricity
from biomass. In addition, we are looking into building new
hydroelectric power plants. RWE Innogy is developing
projects with a total installed capacity of 13.9 GW.
The construction of highly efficient coal and gas-fired power
stations that replace emission-intensive plant also makes a
contribution to protecting the climate. We are investing
approximately €12 billion for this within the scope of the
power plant new-build programme that we launched in 2006
and is scheduled for completion in 2014. How much we can
achieve by this is typified by the new 2,100 MW twin-unit
lignite-fired facility at Neurath near Cologne, which, once
operational, will enable us to decommission a number of
older plants. Thereby, on the back of an essentially
unchanged capacity, we are reducing our CO2 emissions by
about 6 million metric tons – per year! This is a result of the
new power station’s high efficiency of over 43 %, which
surpasses that of the old plants by up to 13 percentage
points.
At the end of 2011, new power stations with a total installed
capacity of 2.6 GW were online as a result of the power plant
new-build programme. Another 6.8 GW will be added this
year. The Dutch Claus C (1,304 MW) and Moerdijk 2
(426 MW) gas-fired power stations began operating
commercially in January and February 2012. The dual-block
lignite-fired power plant at Neurath is scheduled to follow at
the end of March, with two combined-cycle gas turbine
power stations coming online in the second half of the year:
one at Pembroke, Wales (2,188 MW), and the other at
Denizli, West Turkey (775 MW). Further power plants
accounting for a combined 3.1 GW in installed capacity will
be added before the new-build programme ends in 2014.
By then, state-of-the-art gas and coal-fired power plants will
account for more than 25 % of our installed capacity. The
degree of energy utilisation of our fossil fuel-fired facilities,
namely the amount of electricity and usable heat produced
by the energy contained in the fuel, will then have reached
an average of 42 %.
Networks are also of great importance for an energy supply
which increases resource conservation and climate
protection. As a distribution system operator, we face huge
challenges from the rising amounts of electricity fed into the
grid from weather-dependent sources such as wind and solar
power, as well as the mounting number of small, distributed
generation units. Under these conditions, substantial
investments in the maintenance and expansion of
distribution networks need to be made to keep the system
stable. RWE plans to spend a total of €2.6 billion on this
from 2012 to 2014. One of the focal points is the
development and use of new control technologies enabling
the more effective and flexible use of networks. We are
conducting field trials to this end within the scope of the
Smart Country project in Bitburg /Prüm in Eifel County
(Germany), on which we have reported in detail on page 85.
strategy 31To our investors Review of operations our responsibility
Responsibility statement consolidated financial statements Further information
When it comes to making efficient use of scarce resources,
however, the onus is not just on us, but on our customers as
well. We assist them in various ways, including the use of
smart meters, automated domestic consumption (smart
homes) and by promoting electric cars. Our German website
at www.energiewelt.de includes advice on how to save
energy as well as information on subsidy programmes and
manufacturer offers. We also offer our energy efficiency
expertise to commercial and medium-sized industrial
enterprises. Using state-of-the-art measuring techniques and
RWE’s energy controlling system, our experts analyse energy
consumption and develop optimisation measures tailored to
the business in question.
To us, managing our business sustainably means considering
the wide range of expectations that society has of RWE
when we take action. These go far beyond the imperative to
conserve resources and protect the climate. For example,
society feels we are responsible for ensuring the supply of
energy, embedding high occupational safety standards,
setting fair prices, and making certain that our suppliers
protect human rights. We divided this large number of
expectations into ten fields of action. We set ourselves goals
for each of these fields as well as establishing key
performance indicators which we use to measure the degree
to which we achieve our targets and document this for the
public.
RWE is becoming more international. It is becoming
increasingly important to give RWE a large geographic
footprint in order to diversify enhanced political and
regulatory risks and to take advantage of growth
opportunities. However, Europe remains the focal point of
our electricity and gas business. Our most important markets
are Germany, the United Kingdom, the Benelux countries as
well as Central Eastern and South Eastern Europe. We
become active in other regions whenever this enhances our
business in our core markets. This applies especially to
upstream operations: we produce gas and oil not only in
Europe, but also in North Africa. In addition, we are seeking
to expand our operating reach to include, for example, the
Caspian region. In the field of electricity and heat generation
from renewables, we are also active outside our core
markets, for instance in Spain and in Italy. In the US state of
Georgia, we operate one of the biggest and most modern
wood pellet factories in the world, thereby covering a
substantial part of our need for sustainably produced
biomass for firing in some of our power plants.
32 strategy RWE Annual Report 2011
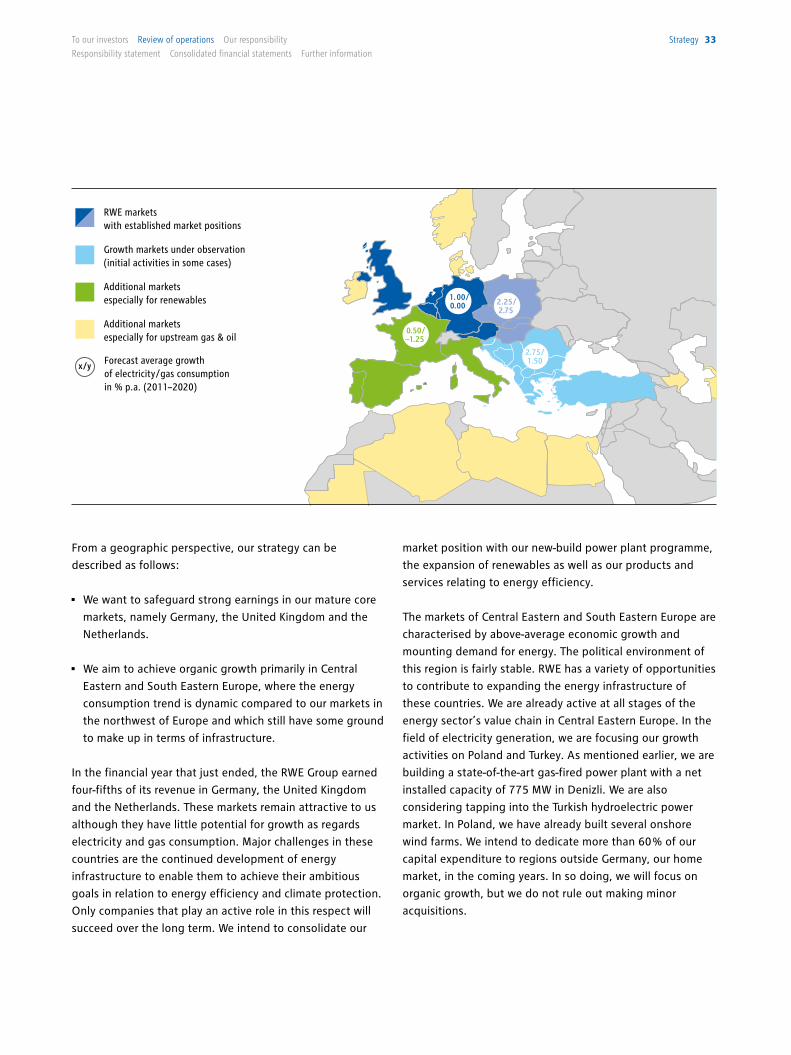
From a geographic perspective, our strategy can be
described as follows:
• We want to safeguard strong earnings in our mature core
markets, namely Germany, the United Kingdom and the
Netherlands.
• We aim to achieve organic growth primarily in Central
Eastern and South Eastern Europe, where the energy
consumption trend is dynamic compared to our markets in
the northwest of Europe and which still have some ground
to make up in terms of infrastructure.
In the financial year that just ended, the RWE Group earned
four-fifths of its revenue in Germany, the United Kingdom
and the Netherlands. These markets remain attractive to us
although they have little potential for growth as regards
electricity and gas consumption. Major challenges in these
countries are the continued development of energy
infrastructure to enable them to achieve their ambitious
goals in relation to energy efficiency and climate protection.
Only companies that play an active role in this respect will
succeed over the long term. We intend to consolidate our
market position with our new-build power plant programme,
the expansion of renewables as well as our products and
services relating to energy efficiency.
The markets of Central Eastern and South Eastern Europe are
characterised by above-average economic growth and
mounting demand for energy. The political environment of
this region is fairly stable. RWE has a variety of opportunities
to contribute to expanding the energy infrastructure of
these countries. We are already active at all stages of the
energy sector’s value chain in Central Eastern Europe. In the
field of electricity generation, we are focusing our growth
activities on Poland and Turkey. As mentioned earlier, we are
building a state-of-the-art gas-fired power plant with a net
installed capacity of 775 MW in Denizli. We are also
considering tapping into the Turkish hydroelectric power
market. In Poland, we have already built several onshore
wind farms. We intend to dedicate more than 60 % of our
capital expenditure to regions outside Germany, our home
market, in the coming years. In so doing, we will focus on
organic growth, but we do not rule out making minor
acquisitions.
Norway
Poland
Algeria Libya Egypt
Germany
Mauritania
1.00/ 0.00
0.50/ −1.25
2.25/ 2.75
2.75/ 1.50
RWE markets with established market positions
Growth markets under observation(initial activities in some cases)
Additional markets especially for renewables
Additional markets especially for upstream gas & oil
Forecast average growth of electricity/gas consumption in % p.a. (2011– 2020)
x/y
strategy 33To our investors Review of operations our responsibility
Responsibility statement consolidated financial statements Further information
RWE is becoming more robust. We operate in a dynamic
market environment, which is increasingly characterised by
imponderables. In the last few years, the prices of fuel,
emission allowances and electricity fluctuated considerably.
The expansion of renewables is causing the supply of
electricity – and therefore also spot prices – to be
increasingly influenced by changing weather conditions. The
political framework has also become less stable, as
demonstrated by Germany’s accelerated nuclear phase-out,
among other things. Moreover, investments in energy
infrastructure are increasingly meeting with resistance from
the public.
Thanks to our fully integrated business model and our
presence in various markets, we are well equipped to tackle
the challenges of a volatile market environment. On the
strength of our balanced portfolio structure, we can offset
earnings fluctuations in individual divisions and countries
and stabilise our earnings. We intend to take the following
steps in the future:
• We intend to remain present along the energy sector’s
entire value chain, as an integrated business model is the
basis for generating stable income.
• We will maintain our balanced portfolio of regulated (e.g.
the network business) and unregulated assets (e.g. the
generation of freely marketed electricity).
• We will continue to evaluate our projects based on the
contribution they make to increasing the value of our
company. This is the basis for generating profitable
growth.
In the field of electricity generation, we believe it is
extremely important to have a broad energy mix. We are
currently focusing on expanding renewables, as they still
account for a disproportionately small share of our portfolio.
We also rely on modern gas and coal-fired power stations as
they are a natural partner for renewables due to their high
degree of flexibility. For example, they can be ramped up
quickly, thereby stabilising the supply of electricity when
there is little wind or sunshine. We also want to increase
our regional diversification in electricity generation. This
will curtail the influence of regulatory intervention and
cyclical fluctuations in individual countries. In addition, a
geographically balanced renewable generation portfolio
has the advantage of being better suited to offset weather-
related effects, e.g. when wind lulls in one region coincide
with high wind levels in another. This is one of the reasons
why we are increasing our wind power capacity in both
northern and southern Europe.
The regulated business will remain a fixture in our portfolio.
As a network operator, we are independent of commodity
price fluctuations and have a fairly low exposure to earnings
risks because the regulations governing the return on equity
and revenue caps are valid for several years. State subsidy
systems provide for a robust earnings base in the field of
renewables. Therefore, we will manage our capital
expenditure in order to ensure that we maintain a balanced
portfolio of regulated and unregulated activities over the
long term.
Market positions of the RWE Groupin terms of sales
Electricity Gas
Germany No. 1 No. 3
United Kingdom No. 4 No. 4
Netherlands No. 2 No. 1
Central Eastern and South Eastern Europe No. 2 in HungaryNo. 3 in SlovakiaNo. 5 in PolandPresence in the Czech RepublicPresence in Turkey
No. 1 in the Czech RepublicNo. 2 in SlovakiaLeading position in Hungary
Total Europe No. 3 No. 6
34 strategy RWE Annual Report 2011
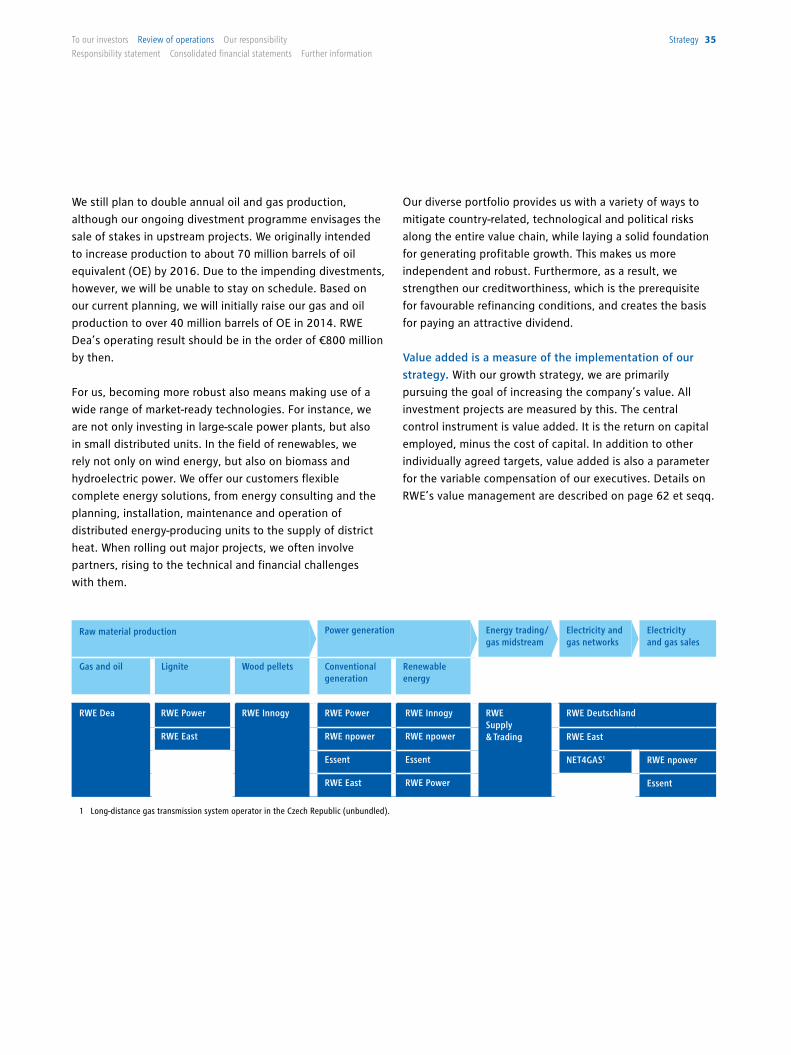
We still plan to double annual oil and gas production,
although our ongoing divestment programme envisages the
sale of stakes in upstream projects. We originally intended
to increase production to about 70 million barrels of oil
equivalent (OE) by 2016. Due to the impending divestments,
however, we will be unable to stay on schedule. Based on
our current planning, we will initially raise our gas and oil
production to over 40 million barrels of OE in 2014. RWE
Dea’s operating result should be in the order of €800 million
by then.
For us, becoming more robust also means making use of a
wide range of market-ready technologies. For instance, we
are not only investing in large-scale power plants, but also
in small distributed units. In the field of renewables, we
rely not only on wind energy, but also on biomass and
hydroelectric power. We offer our customers flexible
complete energy solutions, from energy consulting and the
planning, installation, maintenance and operation of
distributed energy-producing units to the supply of district
heat. When rolling out major projects, we often involve
partners, rising to the technical and financial challenges
with them.
Our diverse portfolio provides us with a variety of ways to
mitigate country-related, technological and political risks
along the entire value chain, while laying a solid foundation
for generating profitable growth. This makes us more
independent and robust. Furthermore, as a result, we
strengthen our creditworthiness, which is the prerequisite
for favourable refinancing conditions, and creates the basis
for paying an attractive dividend.
Value added is a measure of the implementation of our
strategy. With our growth strategy, we are primarily
pursuing the goal of increasing the company’s value. All
investment projects are measured by this. The central
control instrument is value added. It is the return on capital
employed, minus the cost of capital. In addition to other
individually agreed targets, value added is also a parameter
for the variable compensation of our executives. Details on
RWE’s value management are described on page 62 et seqq.
Raw material production Power generation Energy trading/ gas midstream
Electricity and gas networks
Electricity and gas sales
Gas and oil Lignite Wood pellets Conventional generation
Renewable energy
RWE Dea RWE Power RWE Innogy RWE Power RWE Innogy RWE Supply & Trading
RWE Deutschland
RWE East RWE npower RWE npower RWE East
Essent Essent NET4GAS1 RWE npower
RWE East RWE Power Essent
1 Long-distance gas transmission system operator in the Czech Republic (unbundled).
strategy 35To our investors Review of operations our responsibility
Responsibility statement consolidated financial statements Further information
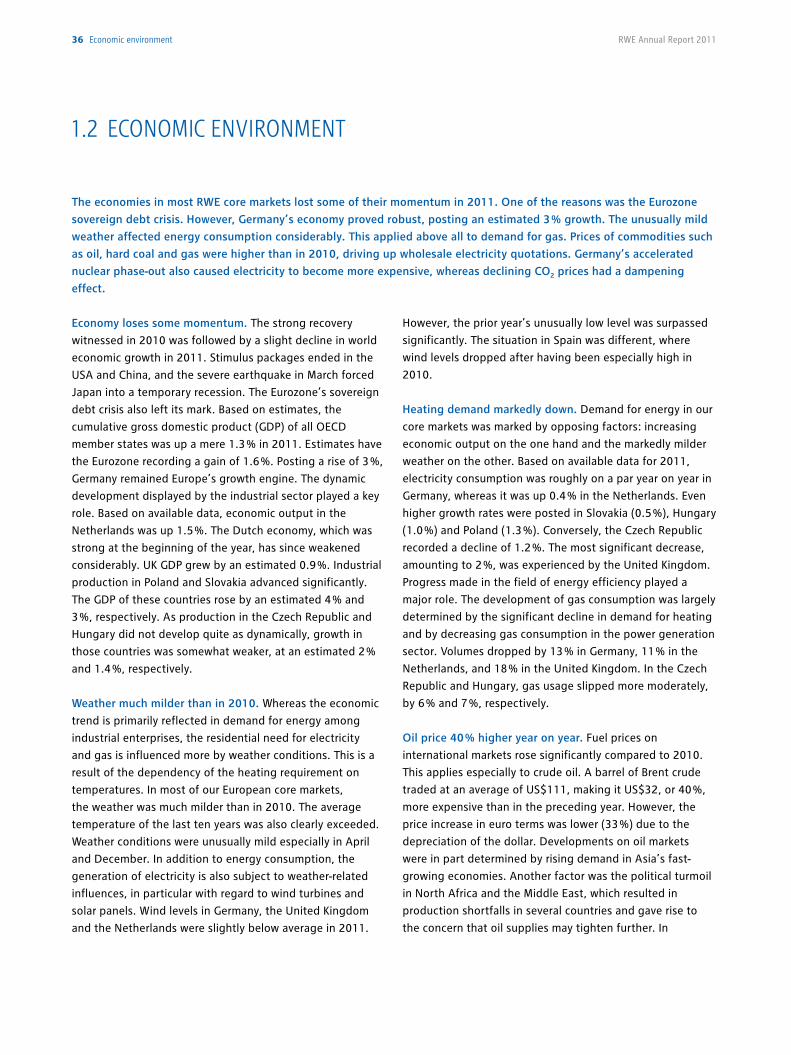
Economy loses some momentum. The strong recovery
witnessed in 2010 was followed by a slight decline in world
economic growth in 2011. Stimulus packages ended in the
USA and China, and the severe earthquake in March forced
Japan into a temporary recession. The Eurozone’s sovereign
debt crisis also left its mark. Based on estimates, the
cumulative gross domestic product (GDP) of all OECD
member states was up a mere 1.3 % in 2011. Estimates have
the Eurozone recording a gain of 1.6 %. Posting a rise of 3 %,
Germany remained Europe’s growth engine. The dynamic
development displayed by the industrial sector played a key
role. Based on available data, economic output in the
Netherlands was up 1.5 %. The Dutch economy, which was
strong at the beginning of the year, has since weakened
considerably. UK GDP grew by an estimated 0.9 %. Industrial
production in Poland and Slovakia advanced significantly.
The GDP of these countries rose by an estimated 4 % and
3 %, respectively. As production in the Czech Republic and
Hungary did not develop quite as dynamically, growth in
those countries was somewhat weaker, at an estimated 2 %
and 1.4 %, respectively.
Weather much milder than in 2010. Whereas the economic
trend is primarily reflected in demand for energy among
industrial enterprises, the residential need for electricity
and gas is influenced more by weather conditions. This is a
result of the dependency of the heating requirement on
temperatures. In most of our European core markets,
the weather was much milder than in 2010. The average
temperature of the last ten years was also clearly exceeded.
Weather conditions were unusually mild especially in April
and December. In addition to energy consumption, the
generation of electricity is also subject to weather-related
influences, in particular with regard to wind turbines and
solar panels. Wind levels in Germany, the United Kingdom
and the Netherlands were slightly below average in 2011.
However, the prior year’s unusually low level was surpassed
significantly. The situation in Spain was different, where
wind levels dropped after having been especially high in
2010.
Heating demand markedly down. Demand for energy in our
core markets was marked by opposing factors: increasing
economic output on the one hand and the markedly milder
weather on the other. Based on available data for 2011,
electricity consumption was roughly on a par year on year in
Germany, whereas it was up 0.4 % in the Netherlands. Even
higher growth rates were posted in Slovakia (0.5 %), Hungary
(1.0 %) and Poland (1.3 %). Conversely, the Czech Republic
recorded a decline of 1.2 %. The most significant decrease,
amounting to 2 %, was experienced by the United Kingdom.
Progress made in the field of energy efficiency played a
major role. The development of gas consumption was largely
determined by the significant decline in demand for heating
and by decreasing gas consumption in the power generation
sector. Volumes dropped by 13 % in Germany, 11 % in the
Netherlands, and 18 % in the United Kingdom. In the Czech
Republic and Hungary, gas usage slipped more moderately,
by 6 % and 7 %, respectively.
Oil price 40 % higher year on year. Fuel prices on
international markets rose significantly compared to 2010.
This applies especially to crude oil. A barrel of Brent crude
traded at an average of US$111, making it US$32, or 40 %,
more expensive than in the preceding year. However, the
price increase in euro terms was lower (33 %) due to the
depreciation of the dollar. Developments on oil markets
were in part determined by rising demand in Asia’s fast-
growing economies. Another factor was the political turmoil
in North Africa and the Middle East, which resulted in
production shortfalls in several countries and gave rise to
the concern that oil supplies may tighten further. In
1.2 ECONOMiC ENvirONMENT
The economies in most RWE core markets lost some of their momentum in 2011. One of the reasons was the Eurozone
sovereign debt crisis. However, Germany’s economy proved robust, posting an estimated 3 % growth. The unusually mild
weather affected energy consumption considerably. This applied above all to demand for gas. Prices of commodities such
as oil, hard coal and gas were higher than in 2010, driving up wholesale electricity quotations. Germany’s accelerated
nuclear phase-out also caused electricity to become more expensive, whereas declining CO2 prices had a dampening
effect.
36 economic environment RWE Annual Report 2011
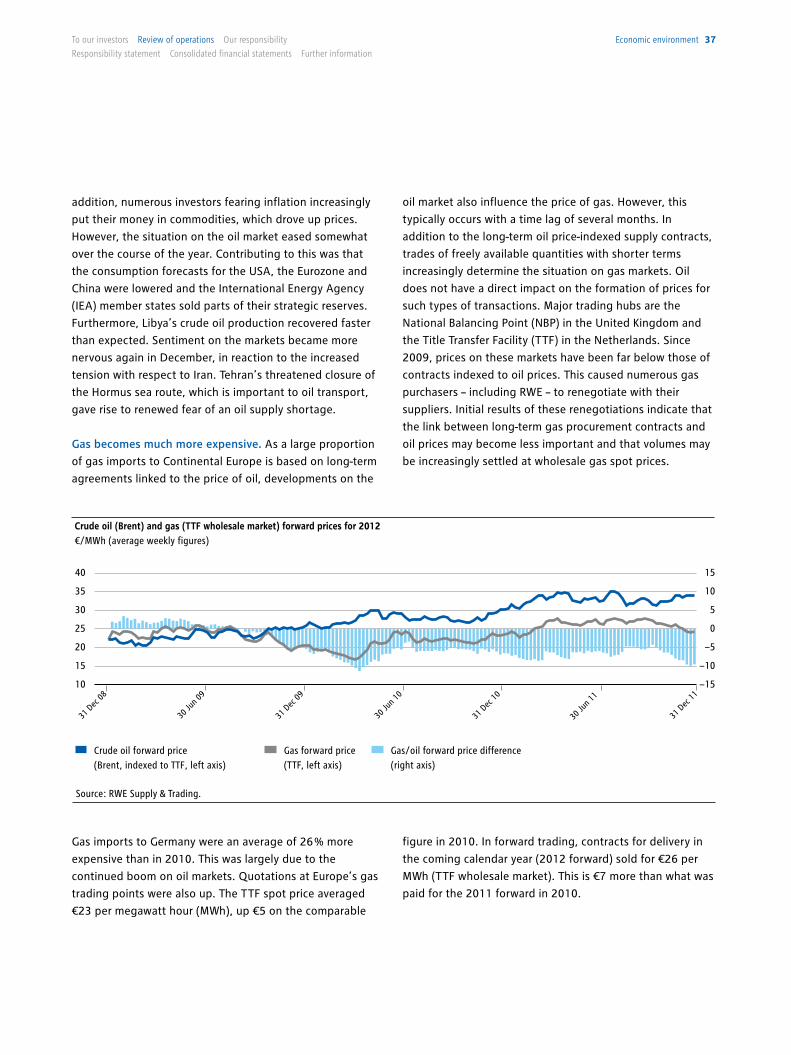
addition, numerous investors fearing inflation increasingly
put their money in commodities, which drove up prices.
However, the situation on the oil market eased somewhat
over the course of the year. Contributing to this was that
the consumption forecasts for the USA, the Eurozone and
China were lowered and the International Energy Agency
(IEA) member states sold parts of their strategic reserves.
Furthermore, Libya’s crude oil production recovered faster
than expected. Sentiment on the markets became more
nervous again in December, in reaction to the increased
tension with respect to Iran. Tehran’s threatened closure of
the Hormus sea route, which is important to oil transport,
gave rise to renewed fear of an oil supply shortage.
Gas becomes much more expensive. As a large proportion
of gas imports to Continental Europe is based on long-term
agreements linked to the price of oil, developments on the
Gas imports to Germany were an average of 26 % more
expensive than in 2010. This was largely due to the
continued boom on oil markets. Quotations at Europe’s gas
trading points were also up. The TTF spot price averaged
€23 per megawatt hour (MWh), up €5 on the comparable
oil market also influence the price of gas. However, this
typically occurs with a time lag of several months. In
addition to the long-term oil price-indexed supply contracts,
trades of freely available quantities with shorter terms
increasingly determine the situation on gas markets. Oil
does not have a direct impact on the formation of prices for
such types of transactions. Major trading hubs are the
National Balancing Point (NBP) in the United Kingdom and
the Title Transfer Facility (TTF) in the Netherlands. Since
2009, prices on these markets have been far below those of
contracts indexed to oil prices. This caused numerous gas
purchasers – including RWE – to renegotiate with their
suppliers. Initial results of these renegotiations indicate that
the link between long-term gas procurement contracts and
oil prices may become less important and that volumes may
be increasingly settled at wholesale gas spot prices.
figure in 2010. In forward trading, contracts for delivery in
the coming calendar year (2012 forward) sold for €26 per
MWh (TTF wholesale market). This is €7 more than what was
paid for the 2011 forward in 2010.
31 D
ec 08
40
35
30
25
20
15
10
15
10
5
0
−5
−10
−15
30 Ju
n 09
30 Ju
n 10
31 D
ec 09
31 D
ec 10
30 Ju
n 11
31 D
ec 11
Crude oil (Brent) and gas (TTF wholesale market) forward prices for 2012€/MWh (average weekly figures)
Gas forward price (TTF, left axis)
Gas/oil forward price difference(right axis)
Crude oil forward price (Brent, indexed to TTF, left axis)
Source: RWE Supply & Trading.
economic environment 37To our investors Review of operations our responsibility
Responsibility statement consolidated financial statements Further information
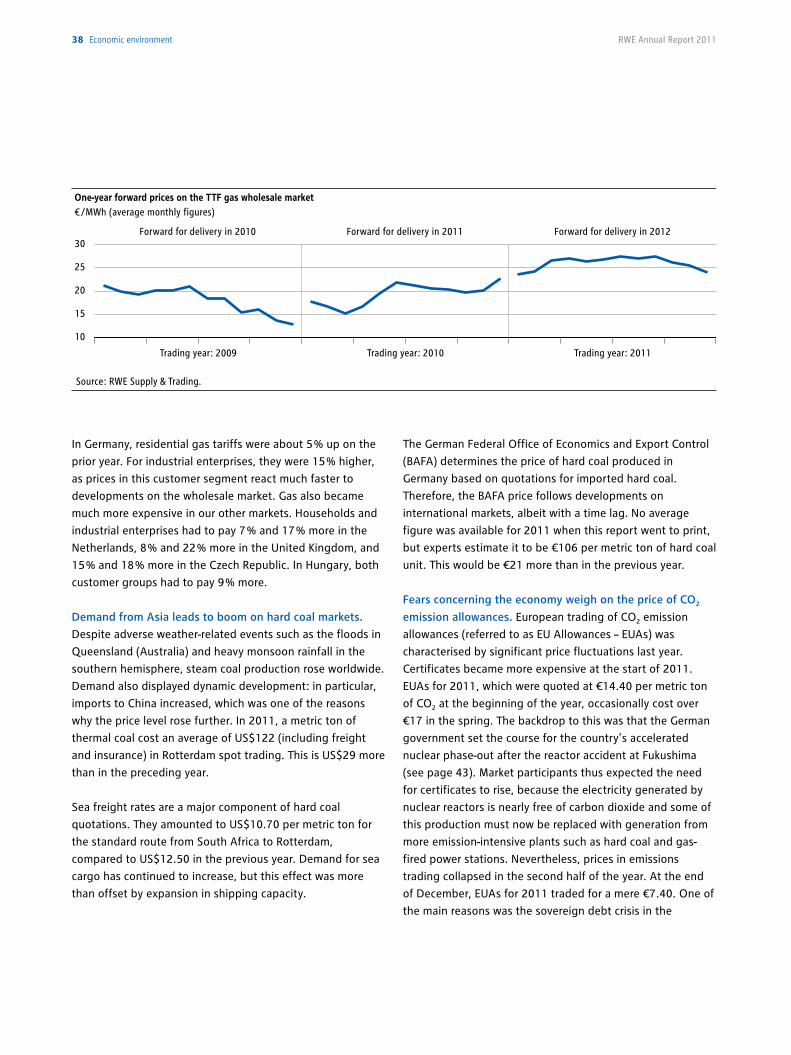
In Germany, residential gas tariffs were about 5 % up on the
prior year. For industrial enterprises, they were 15 % higher,
as prices in this customer segment react much faster to
developments on the wholesale market. Gas also became
much more expensive in our other markets. Households and
industrial enterprises had to pay 7 % and 17 % more in the
Netherlands, 8 % and 22 % more in the United Kingdom, and
15 % and 18 % more in the Czech Republic. In Hungary, both
customer groups had to pay 9 % more.
Demand from Asia leads to boom on hard coal markets.
Despite adverse weather-related events such as the floods in
Queensland (Australia) and heavy monsoon rainfall in the
southern hemisphere, steam coal production rose worldwide.
Demand also displayed dynamic development: in particular,
imports to China increased, which was one of the reasons
why the price level rose further. In 2011, a metric ton of
thermal coal cost an average of US$122 (including freight
and insurance) in Rotterdam spot trading. This is US$29 more
than in the preceding year.
Sea freight rates are a major component of hard coal
quotations. They amounted to US$10.70 per metric ton for
the standard route from South Africa to Rotterdam,
compared to US$12.50 in the previous year. Demand for sea
cargo has continued to increase, but this effect was more
than offset by expansion in shipping capacity.
The German Federal Office of Economics and Export Control
(BAFA) determines the price of hard coal produced in
Germany based on quotations for imported hard coal.
Therefore, the BAFA price follows developments on
international markets, albeit with a time lag. No average
figure was available for 2011 when this report went to print,
but experts estimate it to be €106 per metric ton of hard coal
unit. This would be €21 more than in the previous year.
Fears concerning the economy weigh on the price of CO2
emission allowances. European trading of CO2 emission
allowances (referred to as EU Allowances – EUAs) was
characterised by significant price fluctuations last year.
Certificates became more expensive at the start of 2011.
EUAs for 2011, which were quoted at €14.40 per metric ton
of CO2 at the beginning of the year, occasionally cost over
€17 in the spring. The backdrop to this was that the German
government set the course for the country’s accelerated
nuclear phase-out after the reactor accident at Fukushima
(see page 43). Market participants thus expected the need
for certificates to rise, because the electricity generated by
nuclear reactors is nearly free of carbon dioxide and some of
this production must now be replaced with generation from
more emission-intensive plants such as hard coal and gas-
fired power stations. Nevertheless, prices in emissions
trading collapsed in the second half of the year. At the end
of December, EUAs for 2011 traded for a mere €7.40. One of
the main reasons was the sovereign debt crisis in the
One-year forward prices on the TTF gas wholesale market€/MWh (average monthly figures)
Forward for delivery in 2012Forward for delivery in 2011Forward for delivery in 2010
Trading year: 2009 Trading year: 2010 Trading year: 2011
30
25
20
15
10
Source: RWE Supply & Trading.
38 economic environment RWE Annual Report 2011
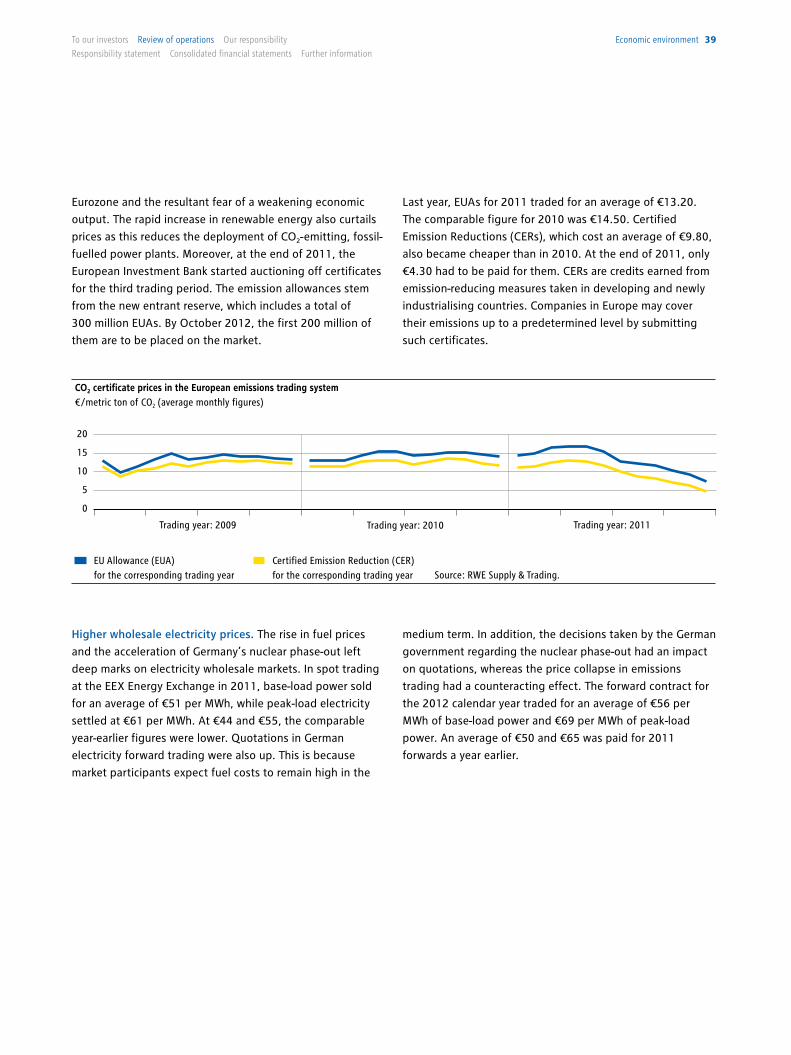
Eurozone and the resultant fear of a weakening economic
output. The rapid increase in renewable energy also curtails
prices as this reduces the deployment of CO2- emitting, fossil-
fuelled power plants. Moreover, at the end of 2011, the
European Investment Bank started auctioning off certificates
for the third trading period. The emission allowances stem
from the new entrant reserve, which includes a total of
300 million EUAs. By October 2012, the first 200 million of
them are to be placed on the market.
Last year, EUAs for 2011 traded for an average of €13.20.
The comparable figure for 2010 was €14.50. Certified
Emission Reductions (CERs), which cost an average of €9.80,
also became cheaper than in 2010. At the end of 2011, only
€4.30 had to be paid for them. CERs are credits earned from
emission-reducing measures taken in developing and newly
industrialising countries. Companies in Europe may cover
their emissions up to a predetermined level by submitting
such certificates.
CO2 certificate prices in the European emissions trading system €/metric ton of CO2
(average monthly figures)
Trading year: 2009 Trading year: 2010 Trading year: 2011
20
15
10
5
0
Source: RWE Supply & Trading.EU Allowance (EUA) for the corresponding trading year
Certified Emission Reduction (CER) for the corresponding trading year
Higher wholesale electricity prices. The rise in fuel prices
and the acceleration of Germany’s nuclear phase-out left
deep marks on electricity wholesale markets. In spot trading
at the EEX Energy Exchange in 2011, base-load power sold
for an average of €51 per MWh, while peak-load electricity
settled at €61 per MWh. At €44 and €55, the comparable
year-earlier figures were lower. Quotations in German
electricity forward trading were also up. This is because
market participants expect fuel costs to remain high in the
medium term. In addition, the decisions taken by the German
government regarding the nuclear phase-out had an impact
on quotations, whereas the price collapse in emissions
trading had a counteracting effect. The forward contract for
the 2012 calendar year traded for an average of €56 per
MWh of base-load power and €69 per MWh of peak-load
power. An average of €50 and €65 was paid for 2011
forwards a year earlier.
economic environment 39To our investors Review of operations our responsibility
Responsibility statement consolidated financial statements Further information
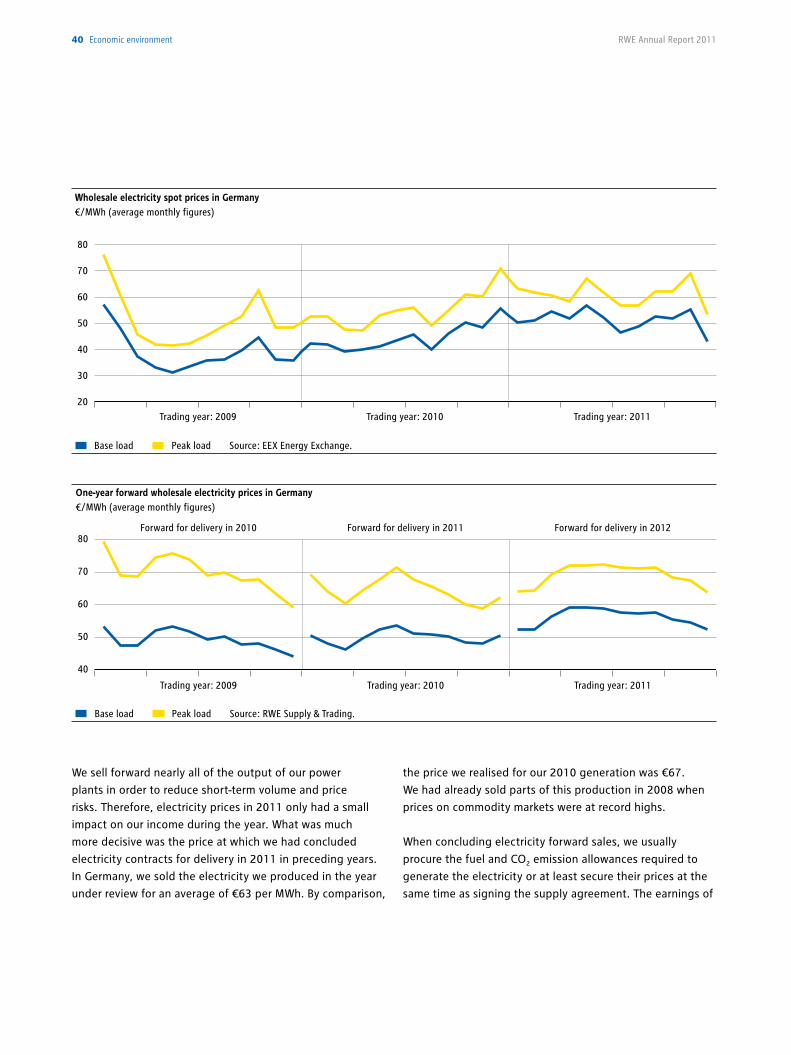
We sell forward nearly all of the output of our power
plants in order to reduce short-term volume and price
risks. Therefore, electricity prices in 2011 only had a small
impact on our income during the year. What was much
more decisive was the price at which we had concluded
electricity contracts for delivery in 2011 in preceding years.
In Germany, we sold the electricity we produced in the year
under review for an average of €63 per MWh. By comparison,
the price we realised for our 2010 generation was €67.
We had already sold parts of this production in 2008 when
prices on commodity markets were at record highs.
When concluding electricity forward sales, we usually
procure the fuel and CO2 emission allowances required to
generate the electricity or at least secure their prices at the
same time as signing the supply agreement. The earnings of
Wholesale electricity spot prices in Germany €/MWh (average monthly figures)
Trading year: 2009 Trading year: 2010 Trading year: 2011
80
70
60
50
40
30
20
Base load Peak load Source: EEX Energy Exchange.
One-year forward wholesale electricity prices in Germany€/MWh (average monthly figures)
Trading year: 2009 Trading year: 2010 Trading year: 2011
80
70
60
50
40
Forward for delivery in 2010 Forward for delivery in 2011 Forward for delivery in 2012
Base load Peak load Source: RWE Supply & Trading.
40 economic environment RWE Annual Report 2011
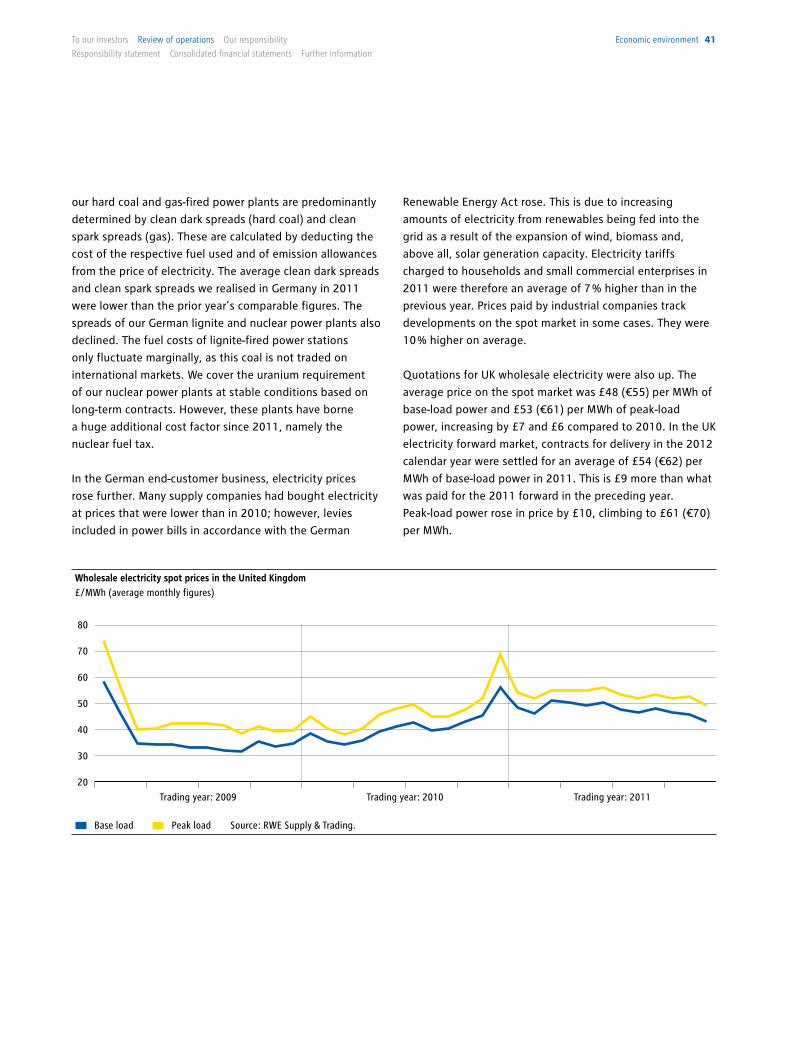
our hard coal and gas-fired power plants are predominantly
determined by clean dark spreads (hard coal) and clean
spark spreads (gas). These are calculated by deducting the
cost of the respective fuel used and of emission allowances
from the price of electricity. The average clean dark spreads
and clean spark spreads we realised in Germany in 2011
were lower than the prior year’s comparable figures. The
spreads of our German lignite and nuclear power plants also
declined. The fuel costs of lignite-fired power stations
only fluctuate marginally, as this coal is not traded on
international markets. We cover the uranium requirement
of our nuclear power plants at stable conditions based on
long-term contracts. However, these plants have borne
a huge additional cost factor since 2011, namely the
nuclear fuel tax.
In the German end-customer business, electricity prices
rose further. Many supply companies had bought electricity
at prices that were lower than in 2010; however, levies
included in power bills in accordance with the German
Renewable Energy Act rose. This is due to increasing
amounts of electricity from renewables being fed into the
grid as a result of the expansion of wind, biomass and,
above all, solar generation capacity. Electricity tariffs
charged to households and small commercial enterprises in
2011 were therefore an average of 7 % higher than in the
previous year. Prices paid by industrial companies track
developments on the spot market in some cases. They were
10 % higher on average.
Quotations for UK wholesale electricity were also up. The
average price on the spot market was £48 (€55) per MWh of
base-load power and £53 (€61) per MWh of peak-load
power, increasing by £7 and £6 compared to 2010. In the UK
electricity forward market, contracts for delivery in the 2012
calendar year were settled for an average of £54 (€62) per
MWh of base-load power in 2011. This is £9 more than what
was paid for the 2011 forward in the preceding year.
Peak-load power rose in price by £10, climbing to £61 (€70)
per MWh.
Wholesale electricity spot prices in the United Kingdom £/MWh (average monthly figures)
Trading year: 2009 Trading year: 2010 Trading year: 2011
80
70
60
50
40
30
20
Base load Peak load Source: RWE Supply & Trading.
economic environment 41To our investors Review of operations our responsibility
Responsibility statement consolidated financial statements Further information
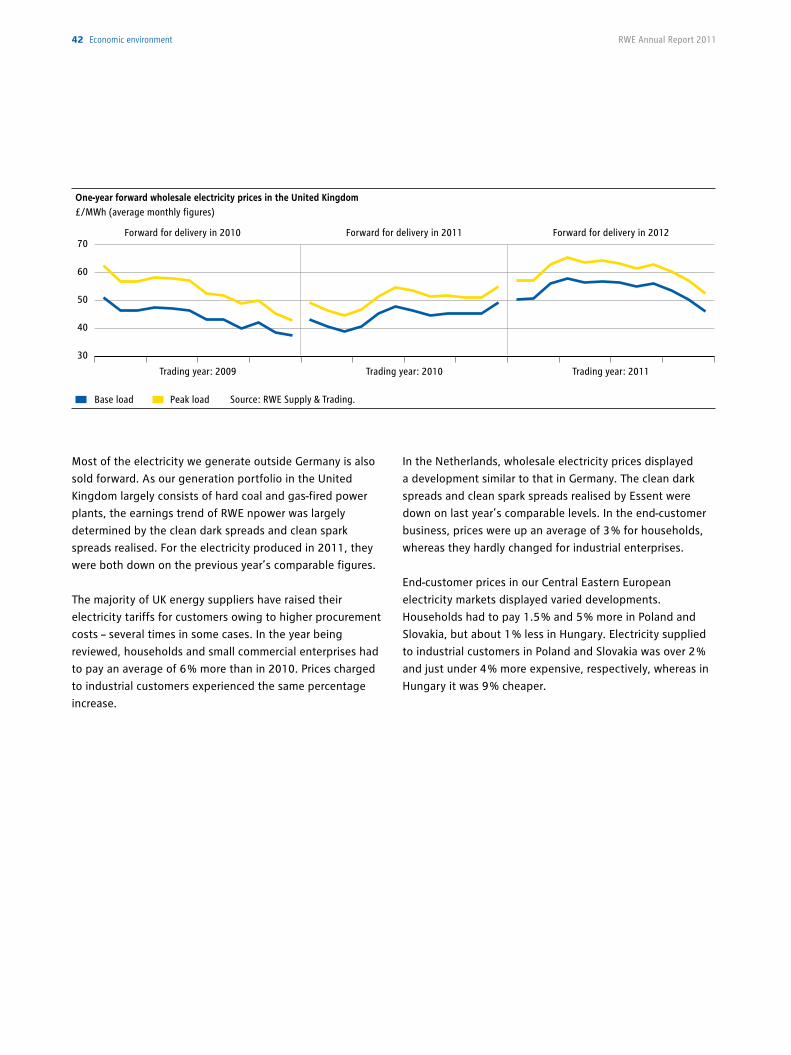
Most of the electricity we generate outside Germany is also
sold forward. As our generation portfolio in the United
Kingdom largely consists of hard coal and gas-fired power
plants, the earnings trend of RWE npower was largely
determined by the clean dark spreads and clean spark
spreads realised. For the electricity produced in 2011, they
were both down on the previous year’s comparable figures.
The majority of UK energy suppliers have raised their
electricity tariffs for customers owing to higher procurement
costs – several times in some cases. In the year being
reviewed, households and small commercial enterprises had
to pay an average of 6 % more than in 2010. Prices charged
to industrial customers experienced the same percentage
increase.
In the Netherlands, wholesale electricity prices displayed
a development similar to that in Germany. The clean dark
spreads and clean spark spreads realised by Essent were
down on last year’s comparable levels. In the end-customer
business, prices were up an average of 3 % for households,
whereas they hardly changed for industrial enterprises.
End-customer prices in our Central Eastern European
electricity markets displayed varied developments.
Households had to pay 1.5 % and 5 % more in Poland and
Slovakia, but about 1 % less in Hungary. Electricity supplied
to industrial customers in Poland and Slovakia was over 2 %
and just under 4 % more expensive, respectively, whereas in
Hungary it was 9 % cheaper.
One-year forward wholesale electricity prices in the United Kingdom£/MWh (average monthly figures)
Trading year: 2009
Forward for delivery in 2010 Forward for delivery in 2011 Forward for delivery in 2012
Trading year: 2010 Trading year: 2011
70
60
50
40
30
Base load Peak load Source: RWE Supply & Trading.
42 economic environment RWE Annual Report 2011
Germany accelerates nuclear phase-out. Against the
backdrop of the reactor accident at Fukushima in Japan, the
German Lower House of Parliament adopted an amendment
to the German Nuclear Energy Act (NEA) on 30 June 2011,
which became effective in August. The lifetime extension for
German nuclear power stations introduced in 2010 was thus
reversed. In addition, the legislator set deadlines for shutting
down each individual reactor. Accordingly, eight of
Germany’s 17 reactors, including our Biblis A and B units,
have not been allowed to generate electricity since the
amendment to the NEA entered into force. In March 2011,
these power plants, most of which exceed a certain age, had
been ordered to cease operations, initially for a period of
three months (nuclear moratorium). The country’s nine
remaining nuclear power stations must be taken offline by
the end of 2015 (Grafenrheinfeld), 2017 (Gundremmingen
B), 2019 (Philippsburg II), 2021 (Grohnde, Brokdorf and
Gundremmingen C) and 2022 (Isar II, Neckarwestheim II and
Emsland). Of the aforementioned plants, Gundremmingen B
and C as well as Emsland are majority-owned by RWE.
We believe the amendment to the NEA is unconstitutional
because the plant operators will not be compensated and
the shut-down dates were established without sound
reasoning. Therefore, we lodged a constitutional complaint
in February 2012. We are also of the opinion that the nuclear
moratorium is unlawful, because we feel the prerequisites for
it did not exist. In April 2011, we filed a lawsuit with the
Hessian Higher Administrative Court in Kassel against it. The
German government based the moratorium on Sec. 19 of the
NEA, according to which the operation of nuclear facilities
may be forbidden if they pose an immediate risk. Our action
builds on the fact that Biblis complied with all applicable
safety standards.
1.3 pOliTiCal ENvirONMENT
The reversal of the lifetime extension eliminates payments
into the new Climate and Energy Fund, to which the
country’s nuclear power plant operators had committed
contractually. It was to be funded with the additional profits
that would have been achieved if the nuclear power stations
had been allowed to run longer than originally planned.
However, the fund will remain in existence despite the U-turn
in German energy policy. The German government intends
to use it to finance the promotion of electric cars, energy
storage facilities and the optimisation of the energy
efficiency of buildings. The fund will also be used to provide
relief to energy-intensive manufacturing companies. The
financing gap resulting from the reversal of the lifetime
extension is to be closed using the proceeds of auctioned
CO2 certificates.
The nuclear phase-out was flanked by a package of laws,
which was also passed at the end of June. They are designed
to promote the increased use of renewable energy, energy-
efficiency measures and the accelerated expansion of
network infrastructure. For example, the German Renewable
Energy Act (REA) now includes a model for promoting
offshore wind farms, which increases profitability in the
initial years of operation. Operators of plants that go
online before 1 January 2018 will receive feed-in revenue
of 19 euro cents per kilowatt hour (kWh), compared to
15 euro cents at present. However, this start-up subsidy will
only be paid for eight instead of twelve years.
Fiscal courts doubt legality of nuclear fuel tax. The
German government is maintaining the new tax on nuclear
fuel despite the heavy additional burdens placed on the
operators of nuclear power plants by the U-turn in German
energy policy. The levy was introduced with effect from
1 January 2011 and will expire at the end of 2016. As there
are strong arguments against its legal validity, we filed
lawsuits with the appropriate fiscal courts. In October, the
The U-turn in German energy policy made headlines last year. After the reactor accident at Fukushima, the German
government reversed the lifetime extension it had only just resolved for nuclear power plants. This move imposes heavy
burdens on RWE. Moreover, it has made it more difficult for Germany to achieve its ambitious climate protection goals. The
UK government is charting a different course, with plans for a new system for promoting environmentally friendly electricity
generation, also focusing on nuclear energy. It also intends to spur climate protection by introducing a new CO2 tax.
political environment 43To our investors Review of operations our responsibility
Responsibility statement consolidated financial statements Further information
44 political environment
Munich Fiscal Court provided temporary relief, ruling that no
nuclear fuel tax needs to be paid for the Gundremmingen B
nuclear power station for the time being. The judges
doubt whether it is a permissible consumption tax. They
are therefore in line with the Hamburg Fiscal Court, which
suspended tax payments in similar cases. A Hamburg
judgement issued in January 2012 related to our Emsland
nuclear power station. We have been reimbursed the
€74 million and €154 million in taxes we paid for
Gundremmingen B and Emsland, respectively. The Fiscal
Court of Baden-Württemberg handed down different
judgements, in relation to two motions filed by EnBW, as it
does not have serious doubts regarding the legitimacy of the
nuclear fuel tax. The main customs authorities responsible
for collecting the tax and EnBW have lodged an appeal
against the judgements, on which the German Fiscal Court
will have to hand down a ruling. Ultimately, the decision on
whether the nuclear fuel tax is legitimate will be reached by
the German Constitutional Court or the European Court of
Justice. Until then, we will recognise the reimbursed funds as
a tax liability. The judgements of the Munich and Hamburg
Fiscal Courts therefore have no direct effects on our
earnings.
Slight decline in returns on equity for network capex in
Germany. In early November, the Federal Network Agency
set the Returns on Equity (RoE) that electricity and gas
network operators are allowed to earn for the upcoming five-
year regulatory period. The allowable annual RoE before
corporate tax will be 9.05 % for assets capitalised after 2005
and 7.14 % for older assets. The new rates become effective
as of 1 January 2013 for gas network operators and as of
1 January 2014 for electricity network operators. The current
allowed returns on equity are 9.29 % and 7.56 %,
respectively. The Federal Network Agency states that it
established the returns on equity based on the development
of the interest rates prevailing on capital markets and the
assessment of company risk. The network regulator had
initially intended to implement a much more significant
reduction. In our opinion, this would have made the much-
needed expansion of networks in Germany even more
difficult.
German government considers accelerating reduction
in solar power subsidies. The controversy over the
subsidisation of solar energy in Germany is continuing. The
backdrop to this is the unfettered expansion of photovoltaic
plants, which recently hit another all-time high. According to
the Federal Network Agency, installed capacity rose by
7.5 gigawatts (GW) to approximately 25 GW last year. Based
on estimates by the German Association of Energy and Water
Industries, more than half of the subsidies paid pursuant to
the REA in 2012 are allocable to photovoltaics, although
solar panels produce a mere fifth of the electricity subject to
the REA. As a result of the significant increase in capacity,
the REA apportionment paid by consumers via their
electricity bills will increase substantially. It already amounts
to 3.59 euro cents per kWh for 2012. Based on calculations
of the four German transmission system operators, it may
rise to as much as 4.74 euro cents in the coming year. The
German government has been reducing the subsidy rates for
solar power every six months since the middle of 2010.
However, this was more than offset by the erosion of prices
on the market for photovoltaic components. The German
Environmental Minister now plans to reduce the subsidies in
monthly steps. The cuts will depend on the degree of
expansion.
State veto powers put a de facto end to CO2 storage in
Germany. Projects for capturing and storing carbon dioxide
underground have very little prospects for the future in
Germany. In the middle of June, the German Lower House of
Parliament passed a CO2 storage law, which would have
established the legal framework for such undertakings.
However, the act did not get a majority vote in the Upper
House of Parliament. In addition, it would have granted the
federal states the right to refuse the storage of carbon
dioxide in their territory. Some states still feel that their
powers are too limited, whereas others are of the opinion
that the law is too restrictive. No agreement is crystallising
on the Arbitration Committee so far. EU member states are
obliged to translate the Brussels directive on the capture and
storage of carbon dioxide into national law. The United
Kingdom and the Netherlands have already passed
corresponding laws. The deadline for doing so expired in
June 2011.
RWE Annual Report 2011
United Kingdom: UK electricity market on the verge of
fundamental reform. In July 2011, the British governing
coalition of conservatives and liberals published a White
Paper on the reform of the electricity market, with which it
mainly intends to spur climate protection. Although the
White Paper was refined in December, key details of the
comprehensive electricity market reform have not yet been
specified. The government is working on a legislative
proposal that it will submit to parliament in the spring
of 2012.
By reforming the electricity market, the government aims to
reduce the CO2 intensity of UK electricity production from
0.5 metric tons of carbon dioxide per megawatt hour (MWh)
at present to 0.1 by 2030. Another goal is to increase the
share of primary energy consumption covered by renewables
to at least 15 % and to have them account for at least 30 % of
electricity generated in 2020. The reform package described
in the White Paper includes the introduction of a tax on fossil
fuel in April 2013. Besides the costs incurred for emission
allowances, operators of coal and gas-fired power plants
would then have to shoulder additional burdens. The amount
of the tax will depend on the CO2 intensity of the fuel, with
the tariff increasing over time. The result envisaged by the
government is for the total cost of CO2 emissions to amount
to at least £30 per metric ton of carbon dioxide in 2020. In
addition, the White Paper establishes a cap for new plant
emissions of 0.45 metric tons of CO2 per MWh, which is to
become effective in 2014. This would mean that only new
coal-fired power stations that capture and store at least a
part of the carbon dioxide they produce could be built.
In the long run, the UK government intends to introduce a
capacity market. Energy utilities will then be compensated
for keeping reliable power station capacity on standby. The
government believes that reserve capacity of this kind is
becoming increasingly important, as the expansion of the
renewable footprint is resulting in a rise in electricity feed-ins
that are dependent on the weather or time of day.
Another mainstay of the electricity market reform is a new
compensation system for climate-friendly electricity
generation from renewable sources and nuclear power, as
well as from fossil fuels in combination with carbon capture
and storage. This is intended to replace the existing system
for the promotion of renewable energy after a transitional
phase. Producers of renewable energy currently receive
renewable obligation certificates. They can sell these
certificates to supply companies which can use them to
prove that the share of their electricity sales determined by
the government stems from renewable sources. A
mechanism termed Contract for Difference (CfD) has also
been planned. According to the principle on which it is
based, there is a contractually guaranteed fee for the
electricity the energy companies put on the system. If the
price realised on the wholesale market is below the fee, they
are paid the difference. However, if the opposite is true, the
energy company is retrospectively obliged to reimburse the
difference. The government’s plan envisages the first CfDs
being concluded in 2014.
political environment 45To our investors Review of operations our responsibility
Responsibility statement consolidated financial statements Further information
Germany accelerates nuclear phase-out. Against the
backdrop of the reactor accident at Fukushima, the German
Lower House accelerated the country’s nuclear phase-out.
On 30 June 2011, it passed an amendment to the German
Nuclear Energy Act, which entered into force in August and
mandates the immediate shut-down of eight of Germany’s
17 reactors. This affects our Biblis A and B units. The
legislator set the deadlines for taking the remaining nine
nuclear power plants offline. They cover the period from
the end of 2015 through to the end of 2022. Detailed
information on this topic can be found on page 43.
RWE adopts package of measures to strengthen financial
power. Not least due to the considerable earnings shortfalls
resulting from the resolutions passed by the German
government on nuclear energy, in August we adopted a
package of measures designed to strengthen RWE’s financial
clout and offer new growth prospects. A key component of
this package are divestments. In August 2011, we presented
the assets we may consider selling. These are the Czech long-
distance gas network operator NET4GAS, our stake in
Berlinwasser, some German sales and network activities, and
select generation capacity. Furthermore, we announced that
we intend to sell RWE Dea either as a whole or individual
upstream activities. However, a complete divestment is no
longer on the agenda. The divestments are scheduled for
completion by the end of 2013. Part of the package of
measures is a leaner capital expenditure budget. Moreover,
we raised the target figure for the ongoing efficiency-
enhancement programme. We now intend to make an annual
earnings contribution that rises to €1.5 billion by the end of
2012 compared to the 2006 level. Previously, the goal was
€1.4 billion. A new efficiency programme is already being
1.4 MajOr EvENTS
prepared for the period after 2012 (see page 98). The
measures we approved in August include strengthening
equity by issuing RWE common shares that are either new or
held by us as treasury shares. We managed to take this step
before the end of the year despite a difficult market
environment.
Capital increased by €2.1 billion. In December, we placed
52.3 million new and 28.1 million treasury RWE common
shares. The issue price of €26 per share resulted in gross
proceeds from the issuance of some €2.1 billion. All of the
stock was offered to institutional investors by way of an
accelerated bookbuilding. Subscription rights were excluded
for the new stock, but not for the treasury shares. The latter
were therefore allocated with a right of withdrawal. RWE
shareholders made frequent use of the subscription right,
purchasing a total of 18.96 million shares. The capital
increase was completed on 21 December, on expiry of the
subscription deadline. It is one of the biggest transactions of
this type concluded by a European industrial enterprise in
recent years and benefits our credit rating. In the middle of
2011, Standard & Poor’s and Moody’s had downgraded
RWE by one notch each, to A- and A3, respectively. They
maintained their “negative” outlooks.
RWE sheds majority of Amprion. We also made progress in
implementing our divestment programme. In early
September, we sold a 74.9 % stake in our German electricity
transmission system operator Amprion. It was acquired by a
consortium of insurance companies and utilities, to which
companies of Munich Re, ERGO, Swiss Life and Talanx belong,
as does the Westphalia-Lippe Physicians Pension Fund. RWE
initially held an interest in the consortium, which it sold at
The German government’s nuclear energy resolutions marked our last financial year. They caused us to launch a package
of measures to strengthen our financial clout, containing additional efficiency enhancements, a leaner capital expenditure
programme and numerous divestments. We already sold some assets in 2011, including the majority of the electricity
transmission system operator Amprion. The package of measures also included a capital increase, which we completed
in a difficult market environment. We passed some major milestones in modernising our generation portfolio: three
state-of-the-art large-scale power plants with a total capacity of 3.8 gigawatts were about to start commercial operation
at the end of 2011.
46 Major events RWE Annual Report 2011
the end of 2011. The sale price for Amprion is based on
the company’s total assessed enterprise value of about
€1.3 billion including €370 million in net debt (cut-off date:
1 January 2011). This roughly corresponds to the company’s
assets recognised by the regulator and eight times recurrent
EBITDA. The transaction provides us with relief in terms of
net debt and capital expenditure. Amprion plans to invest
more than €3 billion to maintain and expand network
infrastructure this decade. In the consortium of investors,
we gained a reliable partner with a strong capital base.
Thyssengas and minority interest in Rostock-based coal
power plant sold. In addition to Amprion, we sold two other
assets in 2011. In February, we completed the divestment of
Thyssengas, the German long-distance gas network operator.
It was purchased by an infrastructure fund managed by the
Australian financial service provider Macquarie. Thyssengas
transmits close to 10 billion cubic metres of natural gas every
year over a long-distance network with a length of some
4,100 kilometres. We had made a commitment to the
EU Commission to sell the company. Also in February, we
divested a minority interest of 24.6 % in a hard coal-fired
power station at Rostock. The facility has an electricity
generation capacity of 553 megawatts (MW) and provides
district heat for the Rostock municipal utility’s network. The
buyer of our share is RheinEnergie AG, which is domiciled in
Cologne.
RWE acquires 30 % stake in Dutch power plant operator
EPZ. In addition to the aforementioned divestments, we also
made some acquisitions in 2011. The largest transaction was
the purchase of Energy Resources Holding B.V. (ERH). ERH
used to belong to Essent, but we were unable to obtain it
when we acquired the Dutch energy utility in 2009 as certain
legal issues remained to be resolved. ERH owns 30 % of EPZ,
a Dutch electricity generator. EPZ operates the 485 MW
Borssele nuclear power plant, a 406 MW hard coal-fired
power station, and a small number of wind turbines. In line
with our stake in EPZ, we can market 30 % of the company’s
electricity generation ourselves. The remaining 70 % of EPZ is
held by the power utility Delta N.V.
Major milestones passed in building new power plants.
In 2011, we made major progress in modernising and
expanding our power plant fleet. We have completed the
construction of the dual-block lignite-fired power station at
Neurath near Cologne. We paid a total of €2.6 billion for
the plant, which has an installed capacity of 2,100 MW. It is
scheduled to begin commercial production at the end of
March 2012. The two Dutch gas-fired power stations, Claus C
and Moerdijk 2, have also been completed. Claus C is located
at Maasbracht, has a net installed capacity of 1,304 MW, and
went online in January 2012 – several months earlier than
originally planned. We spent €1.1 billion on the state-of-the-
art plant, which has an efficiency of nearly 60 %. The 426 MW
Moerdijk 2 gas-fired power station has been operating
commercially since February 2012. The associated investment
cost amounted to €0.4 billion. Furthermore, in April 2011, we
laid the cornerstone for a gas-fired power plant in Denizli in
the west of Turkey. The facility will have a net installed
capacity of 775 MW and is scheduled to become operational
at the end of 2012. The owner and operator will be a joint
venture, in which RWE holds 70 %, with the Turkish energy
utility Turcas owning the remaining 30 %. The capex budget
is an estimated €0.5 billion.
Wood pellet factory in Georgia commences production.
We built a plant for manufacturing wood pellets in the US
state of Georgia in order to secure a sustainable fuel supply
for our biomass facilities. The factory was commissioned in
the middle of May 2011. Its annual production capacity of
750,000 metric tons makes it one of the largest worldwide.
The wood pellets will initially be used in our hard coal-fired
power station at Amer (Netherlands). Some of the plant’s
units already co-fire up to 30 % biomass. This proportion
should be increased considerably in the years ahead.
Furthermore, we intend to use the pellets in our power
station at Tilbury (UK). The three hard-coal units were
converted for firing biomass in 2011. They now have a
combined installed capacity of 750 MW.
Major events 47To our investors Review of operations our responsibility
Responsibility statement consolidated financial statements Further information
RWE concludes billion euro contract with the German
railway. RWE will supply Deutsche Bahn with electricity
generated by hydroelectric power plants for a period of
15 years. This was agreed in a contract worth in the order of
€1 billion at the end of July. From 2014 onwards, we will
provide the German railway with 0.9 billion kilowatt hours
(kWh) per annum, enough to run one-third of the long-
distance fleet (ICE and IC trains). Through certificates of
origin, we will guarantee that we generate electricity from
RWE Innogy hydro plants matching the amounts we supply
to Deutsche Bahn. The transaction was designated the
Commodity Deal of the Year 2011 at the Commodity Business
Awards in November 2011.
Supervisory Board appoints Peter Terium as future CEO
of RWE AG. Peter Terium will succeed Dr. Jürgen Großmann
as CEO of RWE AG. This was decided by the Supervisory
Board of RWE AG at its meeting on 8 August 2011. The
48-year-old Dutchman joined RWE’s Executive Board as of
1 September as Jürgen Großmann’s deputy and will assume
chairmanship when the current CEO retires with effect from
30 June 2012. Peter Terium held positions at KPMG and
Schmalbach-Lubeca AG before joining RWE. He started as
Head of Group Controlling after which he became the
CEO of RWE Supply & Trading and, most recently, Essent.
Dr. Rolf Martin Schmitz will be his deputy with effect from
1 July 2012. The 54-year-old Rhinelander has been a member
of the Executive Board of RWE AG since 2009 and is the
company’s Chief Operating Officer.
48 Major events RWE Annual Report 2011
Group structure with seven divisions. Reporting on the
financial year that just ended is based on the segment
structure used in the 2010 financial statements. The
RWE Group is divided into seven divisions based on
geographic and functional criteria. The following is an
overview of them.
• Germany. This division consists of the Power Generation
and Sales/Distribution Networks Business Areas.
Power Generation: This business area includes the
activities of RWE Power, Germany’s largest electricity
generator. The company mainly produces power from coal,
gas and nuclear fuel. Lignite is produced by RWE Power
through in-house mining activities.
Sales/Distribution Networks: Our German sales and
distribution network operations are pooled in this
business area. They are overseen by RWE Deutschland,
which mainly encompasses the network companies Rhein-
Ruhr and Westfalen-Weser-Ems, RWE Vertrieb (including
eprimo, RWE Energiedienstleistungen and RWE Aqua),
RWE Effizienz, RWE Gasspeicher and our German regional
utilities. The latter operate their own electricity generation
facilities to a small extent, as well as managing network
and end-customer operations. The Sales/Distribution
Networks Business Area also includes some non-German
activities: our minority interests in Austria-based KELAG
and Luxembourg-based ENOVOS as well as our water
operations in Zagreb, Croatia, which have been assigned
to RWE Aqua.
• Netherlands/Belgium: By acquiring Essent with effect from
30 September 2009, we have become a leading energy
utility in the Benelux region. In the Netherlands, the
business area’s core market, Essent generates electricity
from gas, hard coal and biomass and holds a minority
stake in Borssele, the only nuclear power station in the
Netherlands. In addition, the company is active in the
electricity and gas sales business and runs gas midstream
operations. Since the acquisition, some of Essent’s former
activities have been transferred to other RWE divisions.
Most recently, since 1 January 2011, parts of the gas
midstream business of Essent have been transferred to
RWE Supply & Trading.
• United Kingdom: This is the division under which we
report on RWE npower, one of the country’s leading
energy utilities. The company generates electricity from
gas, hard coal, oil and biomass. Furthermore, RWE npower
sells electricity and gas to end-customers.
• Central Eastern and South Eastern Europe: This division
contains our companies in the Czech Republic, Hungary,
Poland, Slovakia and Turkey. In the Czech Republic,
our activities encompass the supply, distribution,
supraregional transmission, transit and storage of gas. In
2010, we started marketing electricity there as well. In
Hungary, we cover the entire electricity value chain, from
production through to the operation of the distribution
system and the end-customer business, and are also active
in the gas and water supply sector via minority stakes. Our
Polish operations consist of the distribution and supply of
electricity. In Slovakia, we are active in the electricity
network and electricity end-customer businesses via our
minority interest in VSE and in the gas supply sector via
RWE Gas Slovensko. In Turkey, we are building a gas-fired
power station with a partner. The newly established RWE
East, headquartered in Prague, Czech Republic, started
overseeing the companies belonging to the Central
Eastern and South Eastern Europe Division in 2011. One
exception is NET4GAS, the operator of our Czech long-
distance gas network. To comply with regulatory
requirements, this company is assigned directly to
RWE AG. However, it is still part of the Central Eastern and
South Eastern Europe Division for accounting purposes.
• Renewables: This division comprises the activities of
RWE Innogy, which specialises in electricity and heat
production from renewable sources.
• Upstream Gas & Oil: This segment consists of RWE Dea’s
business. The company produces gas and oil, focusing on
Germany, the United Kingdom, Norway and Egypt.
• Trading/Gas Midstream: This is the item under which we
report on RWE Supply & Trading, which is responsible
for our energy trading activities and most of our gas
midstream business. Furthermore, the division supplies
major German industrial and corporate customers with
electricity and gas. However, parts of these activities were
transferred to the Germany Division with effect from
1 January 2011.
1.5 COMMENTarY ON THE SEgMENTS
commentary on the segments 49To our investors Review of operations our responsibility
Responsibility statement consolidated financial statements Further information
We report certain groupwide activities outside the divisions
as part of ‘other, consolidation.’ These are the Group
holding company, RWE AG, and our internal service
providers, namely RWE Service, RWE IT, RWE Consulting
and RWE Technology. This item also encompasses
Thyssengas, the long-distance gas network operator we sold
on 28 February 2011. The company is considered in the
January and February figures for 2011. We also report the
electricity transmission system operator Amprion in ‘other,
consolidation.’ However, we started accounting for it using
the equity method in September 2011, as we have only held
a minority stake in Amprion since then. Revenue and capital
expenditure following the change in accounting treatment
are no longer considered in the consolidated financial
statements. However, Amprion continues to contribute to
both RWE’s EBITDA and operating result, on the basis of
pro-rated income after tax.
Full consolidation of the German regional utility NVV.
At the beginning of 2011, we started including NVV AG,
which has since been renamed NEW AG, in the consolidated
financial statements as a fully consolidated company.
Headquartered in Mönchengladbach, NEW is one of the
leading utilities in the Lower Rhine region. Among other
things, it owns majority interests in NEW Viersen (formerly
Niederrheinwerke Viersen) and NEW Tönisvorst (formerly
Stadtwerke Tönisvorst). NEW was previously accounted for
as an associated company of RWE Deutschland AG using the
equity method.
50 commentary on the segments RWE Annual Report 2011
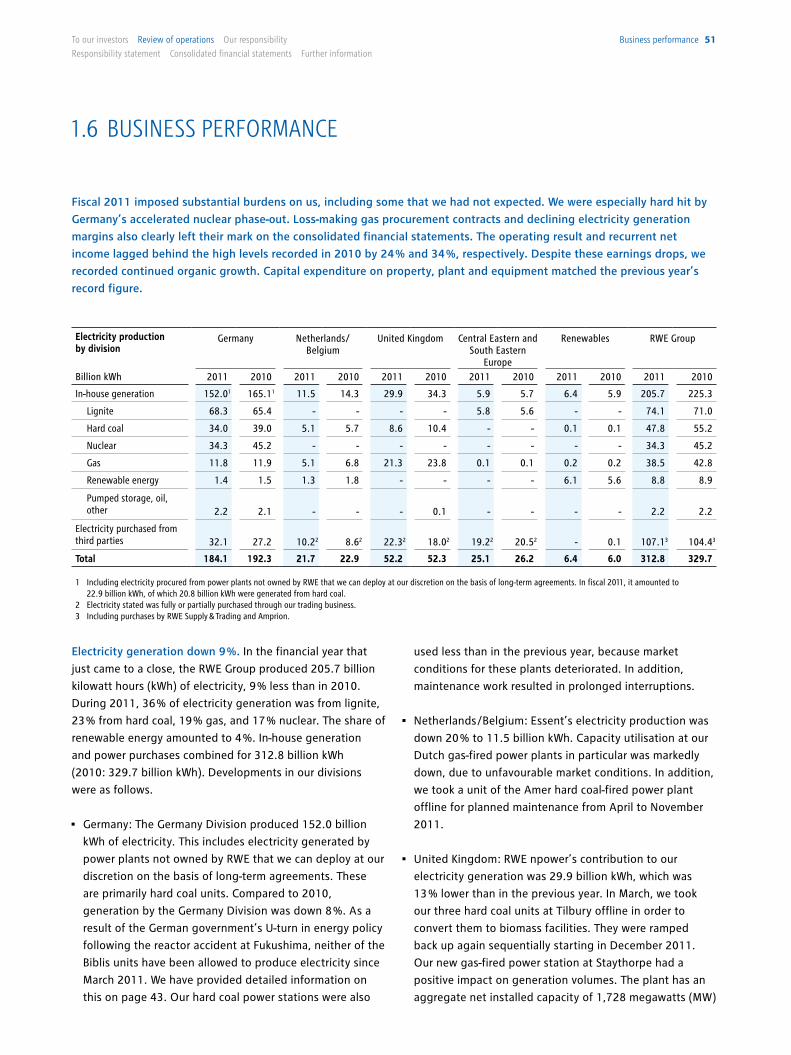
used less than in the previous year, because market
conditions for these plants deteriorated. In addition,
maintenance work resulted in prolonged interruptions.
• Netherlands /Belgium: Essent’s electricity production was
down 20 % to 11.5 billion kWh. Capacity utilisation at our
Dutch gas-fired power plants in particular was markedly
down, due to unfavourable market conditions. In addition,
we took a unit of the Amer hard coal-fired power plant
offline for planned maintenance from April to November
2011.
• United Kingdom: RWE npower’s contribution to our
electricity generation was 29.9 billion kWh, which was
13 % lower than in the previous year. In March, we took
our three hard coal units at Tilbury offline in order to
convert them to biomass facilities. They were ramped
back up again sequentially starting in December 2011.
Our new gas-fired power station at Staythorpe had a
positive impact on generation volumes. The plant has an
aggregate net installed capacity of 1,728 megawatts (MW)
Fiscal 2011 imposed substantial burdens on us, including some that we had not expected. We were especially hard hit by
Germany’s accelerated nuclear phase-out. Loss-making gas procurement contracts and declining electricity generation
margins also clearly left their mark on the consolidated financial statements. The operating result and recurrent net
income lagged behind the high levels recorded in 2010 by 24 % and 34 %, respectively. Despite these earnings drops, we
recorded continued organic growth. Capital expenditure on property, plant and equipment matched the previous year’s
record figure.
Electricity generation down 9 %. In the financial year that
just came to a close, the RWE Group produced 205.7 billion
kilowatt hours (kWh) of electricity, 9 % less than in 2010.
During 2011, 36 % of electricity generation was from lignite,
23 % from hard coal, 19 % gas, and 17 % nuclear. The share of
renewable energy amounted to 4 %. In-house generation
and power purchases combined for 312.8 billion kWh
(2010: 329.7 billion kWh). Developments in our divisions
were as follows.
• Germany: The Germany Division produced 152.0 billion
kWh of electricity. This includes electricity generated by
power plants not owned by RWE that we can deploy at our
discretion on the basis of long-term agreements. These
are primarily hard coal units. Compared to 2010,
generation by the Germany Division was down 8 %. As a
result of the German government’s U-turn in energy policy
following the reactor accident at Fukushima, neither of the
Biblis units have been allowed to produce electricity since
March 2011. We have provided detailed information on
this on page 43. Our hard coal power stations were also
1.6 buSiNESS pErFOrMaNCE
Electricity production by division
Germany Netherlands/Belgium
United Kingdom Central Eastern and South Eastern
Europe
Renewables RWE Group
Billion kWh 2011 2010 2011 2010 2011 2010 2011 2010 2011 2010 2011 2010
In-house generation 152.01 165.11 11.5 14.3 29.9 34.3 5.9 5.7 6.4 5.9 205.7 225.3
Lignite 68.3 65.4 - - - - 5.8 5.6 - - 74.1 71.0
Hard coal 34.0 39.0 5.1 5.7 8.6 10.4 - - 0.1 0.1 47.8 55.2
Nuclear 34.3 45.2 - - - - - - - - 34.3 45.2
Gas 11.8 11.9 5.1 6.8 21.3 23.8 0.1 0.1 0.2 0.2 38.5 42.8
Renewable energy 1.4 1.5 1.3 1.8 - - - - 6.1 5.6 8.8 8.9
Pumped storage, oil, other 2.2 2.1 - - - 0.1 - - - - 2.2 2.2
Electricity purchased from third parties 32.1 27.2 10.22 8.62 22.32 18.02 19.22 20.52 - 0.1 107.13 104.43
Total 184.1 192.3 21.7 22.9 52.2 52.3 25.1 26.2 6.4 6.0 312.8 329.7
1 Including electricity procured from power plants not owned by RWE that we can deploy at our discretion on the basis of long-term agreements. In fiscal 2011, it amounted to 22.9 billion kWh, of which 20.8 billion kWh were generated from hard coal.
2 Electricity stated was fully or partially purchased through our trading business.3 Including purchases by RWE Supply & Trading and Amprion.
business performance 51To our investors Review of operations our responsibility
Responsibility statement consolidated financial statements Further information
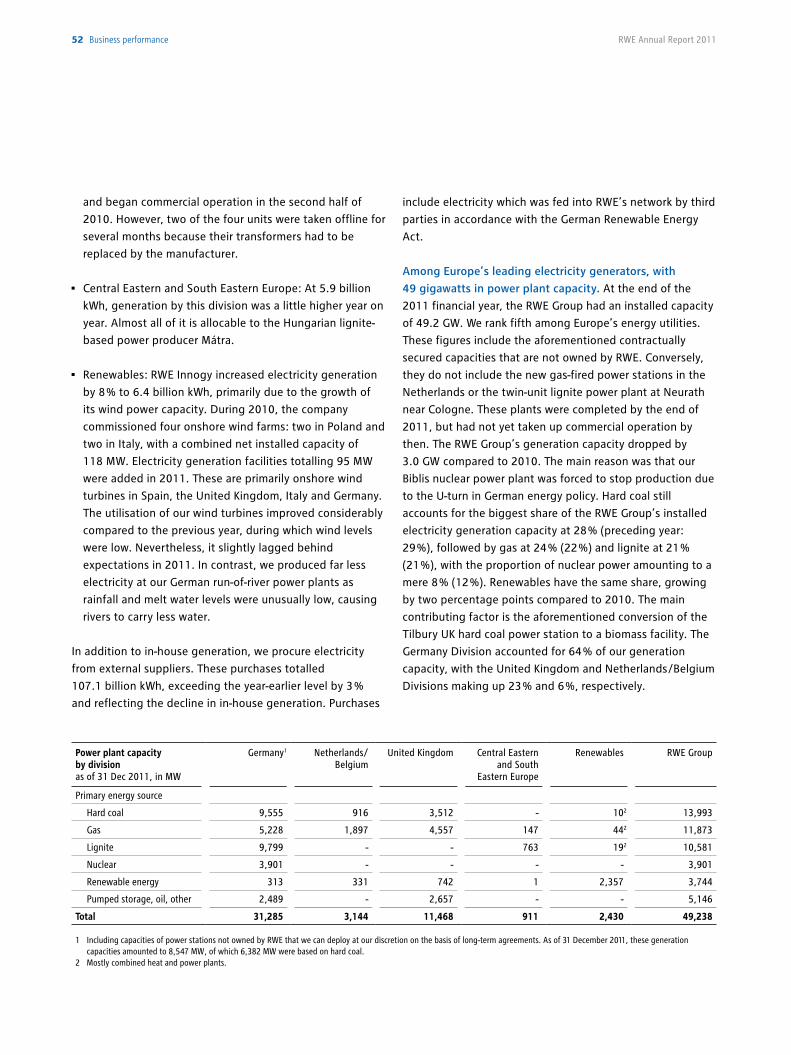
include electricity which was fed into RWE’s network by third
parties in accordance with the German Renewable Energy
Act.
Among Europe’s leading electricity generators, with
49 gigawatts in power plant capacity. At the end of the
2011 financial year, the RWE Group had an installed capacity
of 49.2 GW. We rank fifth among Europe’s energy utilities.
These figures include the aforementioned contractually
secured capacities that are not owned by RWE. Conversely,
they do not include the new gas-fired power stations in the
Netherlands or the twin-unit lignite power plant at Neurath
near Cologne. These plants were completed by the end of
2011, but had not yet taken up commercial operation by
then. The RWE Group’s generation capacity dropped by
3.0 GW compared to 2010. The main reason was that our
Biblis nuclear power plant was forced to stop production due
to the U-turn in German energy policy. Hard coal still
accounts for the biggest share of the RWE Group’s installed
electricity generation capacity at 28 % (preceding year:
29 %), followed by gas at 24 % (22 %) and lignite at 21 %
(21 %), with the proportion of nuclear power amounting to a
mere 8 % (12 %). Renewables have the same share, growing
by two percentage points compared to 2010. The main
contributing factor is the aforementioned conversion of the
Tilbury UK hard coal power station to a biomass facility. The
Germany Division accounted for 64 % of our generation
capacity, with the United Kingdom and Netherlands /Belgium
Divisions making up 23 % and 6 %, respectively.
and began commercial operation in the second half of
2010. However, two of the four units were taken offline for
several months because their transformers had to be
replaced by the manufacturer.
• Central Eastern and South Eastern Europe: At 5.9 billion
kWh, generation by this division was a little higher year on
year. Almost all of it is allocable to the Hungarian lignite-
based power producer Mátra.
• Renewables: RWE Innogy increased electricity generation
by 8 % to 6.4 billion kWh, primarily due to the growth of
its wind power capacity. During 2010, the company
commissioned four onshore wind farms: two in Poland and
two in Italy, with a combined net installed capacity of
118 MW. Electricity generation facilities totalling 95 MW
were added in 2011. These are primarily onshore wind
turbines in Spain, the United Kingdom, Italy and Germany.
The utilisation of our wind turbines improved considerably
compared to the previous year, during which wind levels
were low. Nevertheless, it slightly lagged behind
expectations in 2011. In contrast, we produced far less
electricity at our German run-of-river power plants as
rainfall and melt water levels were unusually low, causing
rivers to carry less water.
In addition to in-house generation, we procure electricity
from external suppliers. These purchases totalled
107.1 billion kWh, exceeding the year-earlier level by 3 %
and reflecting the decline in in-house generation. Purchases
Power plant capacity by divisionas of 31 Dec 2011, in MW
Germany1 Netherlands/Belgium
United Kingdom Central Eastern and South
Eastern Europe
Renewables RWE Group
Primary energy source
Hard coal 9,555 916 3,512 - 102 13,993
Gas 5,228 1,897 4,557 147 442 11,873
Lignite 9,799 - - 763 192 10,581
Nuclear 3,901 - - - - 3,901
Renewable energy 313 331 742 1 2,357 3,744
Pumped storage, oil, other 2,489 - 2,657 - - 5,146
Total 31,285 3,144 11,468 911 2,430 49,238
1 Including capacities of power stations not owned by RWE that we can deploy at our discretion on the basis of long-term agreements. As of 31 December 2011, these generation capacities amounted to 8,547 MW, of which 6,382 MW were based on hard coal.
2 Mostly combined heat and power plants.
52 business performance RWE Annual Report 2011
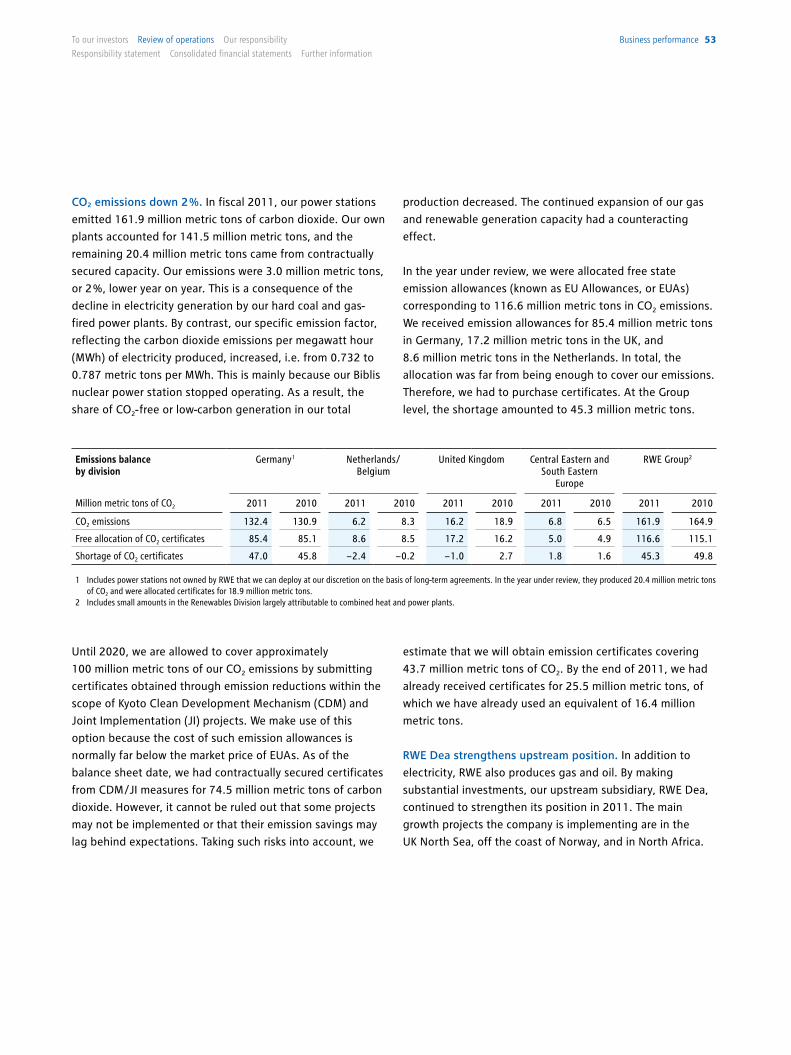
CO2 emissions down 2 %. In fiscal 2011, our power stations
emitted 161.9 million metric tons of carbon dioxide. Our own
plants accounted for 141.5 million metric tons, and the
remaining 20.4 million metric tons came from contractually
secured capacity. Our emissions were 3.0 million metric tons,
or 2 %, lower year on year. This is a consequence of the
decline in electricity generation by our hard coal and gas-
fired power plants. By contrast, our specific emission factor,
reflecting the carbon dioxide emissions per megawatt hour
(MWh) of electricity produced, increased, i.e. from 0.732 to
0.787 metric tons per MWh. This is mainly because our Biblis
nuclear power station stopped operating. As a result, the
share of CO2- free or low-carbon generation in our total
Until 2020, we are allowed to cover approximately
100 million metric tons of our CO2 emissions by submitting
certificates obtained through emission reductions within the
scope of Kyoto Clean Development Mechanism (CDM) and
Joint Implementation (JI) projects. We make use of this
option because the cost of such emission allowances is
normally far below the market price of EUAs. As of the
balance sheet date, we had contractually secured certificates
from CDM /JI measures for 74.5 million metric tons of carbon
dioxide. However, it cannot be ruled out that some projects
may not be implemented or that their emission savings may
lag behind expectations. Taking such risks into account, we
production decreased. The continued expansion of our gas
and renewable generation capacity had a counteracting
effect.
In the year under review, we were allocated free state
emission allowances (known as EU Allowances, or EUAs)
corresponding to 116.6 million metric tons in CO2 emissions.
We received emission allowances for 85.4 million metric tons
in Germany, 17.2 million metric tons in the UK, and
8.6 million metric tons in the Netherlands. In total, the
allocation was far from being enough to cover our emissions.
Therefore, we had to purchase certificates. At the Group
level, the shortage amounted to 45.3 million metric tons.
estimate that we will obtain emission certificates covering
43.7 million metric tons of CO2. By the end of 2011, we had
already received certificates for 25.5 million metric tons, of
which we have already used an equivalent of 16.4 million
metric tons.
RWE Dea strengthens upstream position. In addition to
electricity, RWE also produces gas and oil. By making
substantial investments, our upstream subsidiary, RWE Dea,
continued to strengthen its position in 2011. The main
growth projects the company is implementing are in the
UK North Sea, off the coast of Norway, and in North Africa.
Emissions balance by division
Germany 1 Netherlands/ Belgium
United Kingdom Central Eastern and South Eastern
Europe
RWE Group2
Million metric tons of CO2 2011 2010 2011 2010 2011 2010 2011 2010 2011 2010
CO2 emissions 132.4 130.9 6.2 8.3 16.2 18.9 6.8 6.5 161.9 164.9
Free allocation of CO2 certificates 85.4 85.1 8.6 8.5 17.2 16.2 5.0 4.9 116.6 115.1
Shortage of CO2 certificates 47.0 45.8 − 2.4 − 0.2 − 1.0 2.7 1.8 1.6 45.3 49.8
1 Includes power stations not owned by RWE that we can deploy at our discretion on the basis of long-term agreements. In the year under review, they produced 20.4 million metric tons of CO2 and were allocated certificates for 18.9 million metric tons.
2 Includes small amounts in the Renewables Division largely attributable to combined heat and power plants.
business performance 53To our investors Review of operations our responsibility
Responsibility statement consolidated financial statements Further information
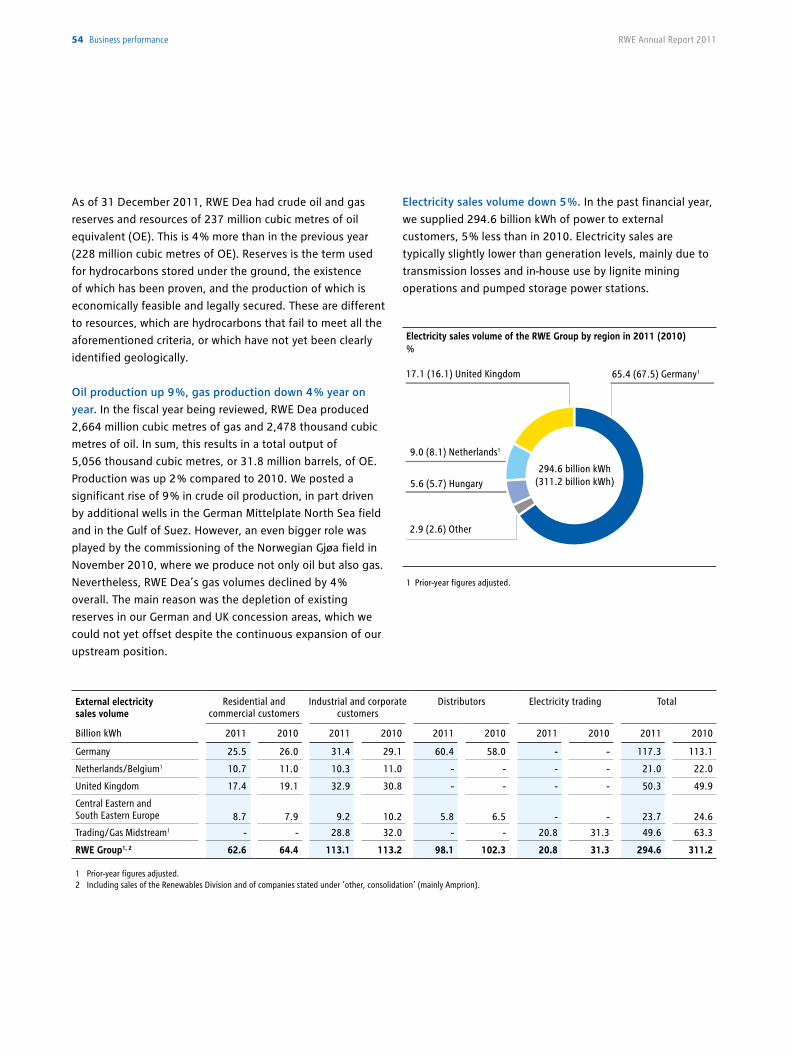
As of 31 December 2011, RWE Dea had crude oil and gas
reserves and resources of 237 million cubic metres of oil
equivalent (OE). This is 4 % more than in the previous year
(228 million cubic metres of OE). Reserves is the term used
for hydrocarbons stored under the ground, the existence
of which has been proven, and the production of which is
economically feasible and legally secured. These are different
to resources, which are hydrocarbons that fail to meet all the
aforementioned criteria, or which have not yet been clearly
identified geologically.
Oil production up 9 %, gas production down 4 % year on
year. In the fiscal year being reviewed, RWE Dea produced
2,664 million cubic metres of gas and 2,478 thousand cubic
metres of oil. In sum, this results in a total output of
5,056 thousand cubic metres, or 31.8 million barrels, of OE.
Production was up 2 % compared to 2010. We posted a
significant rise of 9 % in crude oil production, in part driven
by additional wells in the German Mittelplate North Sea field
and in the Gulf of Suez. However, an even bigger role was
played by the commissioning of the Norwegian Gjøa field in
November 2010, where we produce not only oil but also gas.
Nevertheless, RWE Dea’s gas volumes declined by 4 %
overall. The main reason was the depletion of existing
reserves in our German and UK concession areas, which we
could not yet offset despite the continuous expansion of our
upstream position.
Electricity sales volume down 5 %. In the past financial year,
we supplied 294.6 billion kWh of power to external
customers, 5 % less than in 2010. Electricity sales are
typically slightly lower than generation levels, mainly due to
transmission losses and in-house use by lignite mining
operations and pumped storage power stations.
External electricity sales volume
Residential and commercial customers
Industrial and corporate customers
Distributors Electricity trading Total
Billion kWh 2011 2010 2011 2010 2011 2010 2011 2010 2011 2010
Germany 25.5 26.0 31.4 29.1 60.4 58.0 - - 117.3 113.1
Netherlands/Belgium1 10.7 11.0 10.3 11.0 - - - - 21.0 22.0
United Kingdom 17.4 19.1 32.9 30.8 - - - - 50.3 49.9
Central Eastern and South Eastern Europe 8.7 7.9 9.2 10.2 5.8 6.5 - - 23.7 24.6
Trading/Gas Midstream1 - - 28.8 32.0 - - 20.8 31.3 49.6 63.3
RWE Group1, 2 62.6 64.4 113.1 113.2 98.1 102.3 20.8 31.3 294.6 311.2
1 Prior-year figures adjusted. 2 Including sales of the Renewables Division and of companies stated under ‘other, consolidation’ (mainly Amprion).
Electricity sales volume of the RWE Group by region in 2011 (2010) %
2.9 (2.6) Other
9.0 (8.1) Netherlands1
5.6 (5.7) Hungary
17.1 (16.1) United Kingdom 65.4 (67.5) Germany1
294.6 billion kWh(311.2 billion kWh)
1 Prior-year figures adjusted.
54 business performance RWE Annual Report 2011
• Germany: The division sold 117.3 billion kWh of electricity,
4 % more than in the previous year. A major contributing
factor was the initial full consolidation of NVV, which now
operates as NEW (see page 50). Excluding NEW, we would
have recorded an increase of 2 %. In business with
industrial and corporate customers, the transfer of parts of
the key account business from RWE Supply & Trading
added sales volume. In addition, we benefited from the
robust economy. Moreover, there was a rise in electricity
fed into our network and passed through to distributors
pursuant to the German Renewable Energy Act. In
contrast, the milder weather caused power consumption
by users of electric storage heaters to drop. This curtailed
sales to households and small commercial enterprises. By
the balance sheet date, we were supplying 6,959,000
customers with electricity in this segment. This compares
to 6,674,000 at the end of 2010. The significant growth is
due to the inclusion of NEW, which added 361,000
residential and commercial customers. Furthermore, we
took over customers from TelDaFax, a discounter which
became insolvent.
• Netherlands /Belgium: Electricity sales achieved by Essent
amounted to 21.0 billion kWh. This corresponds to a
decline of 5 % compared to 2010, partly because some
industrial and corporate customers switched providers.
We also suffered volume shortfalls in the residential and
small commercial enterprise segment. This is partially
due to weather-related effects. By the end of 2011, we
were supplying 2,169,000 residential and commercial
customers with electricity in the Netherlands. Our share
of the market thus remained stable. In Belgium, our
customer base grew by 17,000 to 177,000.
• United Kingdom: RWE npower supplied 50.3 billion kWh
of electricity, slightly more than in 2010. In the UK, we
won industrial and corporate customers. The number of
households and small commercial operations we serve
rose by 58,000 to 3,935,000. However, electricity
consumption per customer was down, due to the milder
weather as well as progress made in the field of energy
efficiency.
• Central Eastern and South Eastern Europe: We marketed
23.7 billion kWh of electricity in this division, 4 % less
than in the preceding year. Our industrial and corporate
customer bases in Hungary and Poland shrank. The
number of residential and small commercial enterprises we
served developed as follows: by the end of 2011, we had
2,178,000 customers in Hungary, which was close to the
previous year’s level, while in Poland, the corresponding
customer base had risen marginally to 897,000. Since the
spring of 2010, we have also been supplying electricity in
the Czech Republic. Our expansion in this market had a
positive impact on sales. We already have 80,000
residential and commercial customers there.
• Trading /Gas Midstream: External electricity sales achieved
by this division fell by 22 % to 49.6 billion kWh. As our
production dropped, RWE Supply & Trading sold less
electricity generated by RWE’s own power plants on the
wholesale market. In addition, sales to key accounts
declined because parts of this business were transferred
to the Germany Division.
business performance 55To our investors Review of operations our responsibility
Responsibility statement consolidated financial statements Further information
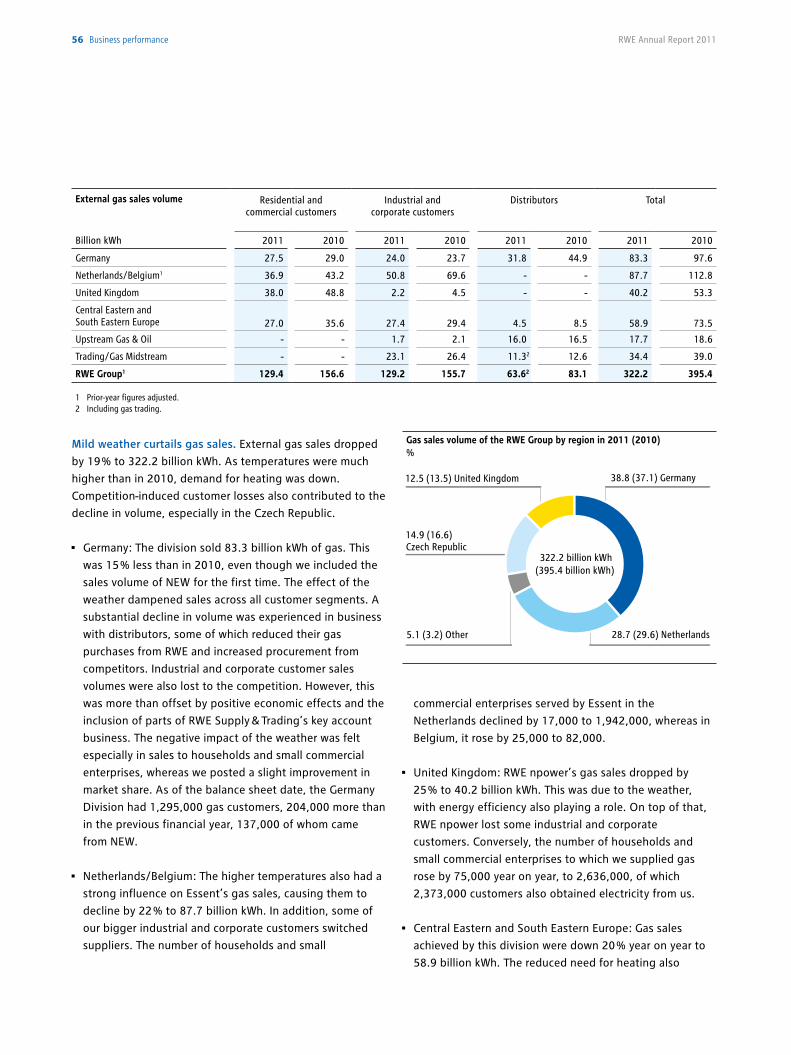
External gas sales volume Residential and commercial customers
Industrial and corporate customers
Distributors Total
Billion kWh 2011 2010 2011 2010 2011 2010 2011 2010
Germany 27.5 29.0 24.0 23.7 31.8 44.9 83.3 97.6
Netherlands/Belgium1 36.9 43.2 50.8 69.6 - - 87.7 112.8
United Kingdom 38.0 48.8 2.2 4.5 - - 40.2 53.3
Central Eastern and South Eastern Europe 27.0 35.6 27.4 29.4 4.5 8.5 58.9 73.5
Upstream Gas & Oil - - 1.7 2.1 16.0 16.5 17.7 18.6
Trading/Gas Midstream - - 23.1 26.4 11.32 12.6 34.4 39.0
RWE Group1 129.4 156.6 129.2 155.7 63.62 83.1 322.2 395.4
1 Prior-year figures adjusted. 2 Including gas trading.
commercial enterprises served by Essent in the
Netherlands declined by 17,000 to 1,942,000, whereas in
Belgium, it rose by 25,000 to 82,000.
• United Kingdom: RWE npower’s gas sales dropped by
25 % to 40.2 billion kWh. This was due to the weather,
with energy efficiency also playing a role. On top of that,
RWE npower lost some industrial and corporate
customers. Conversely, the number of households and
small commercial enterprises to which we supplied gas
rose by 75,000 year on year, to 2,636,000, of which
2,373,000 customers also obtained electricity from us.
• Central Eastern and South Eastern Europe: Gas sales
achieved by this division were down 20 % year on year to
58.9 billion kWh. The reduced need for heating also
Mild weather curtails gas sales. External gas sales dropped
by 19 % to 322.2 billion kWh. As temperatures were much
higher than in 2010, demand for heating was down.
Competition-induced customer losses also contributed to the
decline in volume, especially in the Czech Republic.
• Germany: The division sold 83.3 billion kWh of gas. This
was 15 % less than in 2010, even though we included the
sales volume of NEW for the first time. The effect of the
weather dampened sales across all customer segments. A
substantial decline in volume was experienced in business
with distributors, some of which reduced their gas
purchases from RWE and increased procurement from
competitors. Industrial and corporate customer sales
volumes were also lost to the competition. However, this
was more than offset by positive economic effects and the
inclusion of parts of RWE Supply & Trading’s key account
business. The negative impact of the weather was felt
especially in sales to households and small commercial
enterprises, whereas we posted a slight improvement in
market share. As of the balance sheet date, the Germany
Division had 1,295,000 gas customers, 204,000 more than
in the previous financial year, 137,000 of whom came
from NEW.
• Netherlands/Belgium: The higher temperatures also had a
strong influence on Essent’s gas sales, causing them to
decline by 22 % to 87.7 billion kWh. In addition, some of
our bigger industrial and corporate customers switched
suppliers. The number of households and small
Gas sales volume of the RWE Group by region in 2011 (2010) %
12.5 (13.5) United Kingdom
5.1 (3.2) Other
14.9 (16.6) Czech Republic
38.8 (37.1) Germany
28.7 (29.6) Netherlands
322.2 billion kWh(395.4 billion kWh)
56 business performance RWE Annual Report 2011
played a central role here, as did mounting competitive
pressure in our core market, the Czech Republic, where we
lost some major industrial and corporate customers.
Moreover, a distributor we supply further diversified its
procurement. The number of our Czech residential and
commercial customers declined by 300,000 to 1,836,000.
Conversely, a positive trend was observed in Slovakia
where RWE Gas Slovensko, the subsidiary founded in
July 2008, grew its share of the market. The company
increased its sales by 3.1 billion kWh to 10.9 billion kWh,
despite the unfavourable effect of the weather.
• Upstream Gas & Oil: External gas sales by RWE Dea
totalled 17.7 billion kWh, 5 % lower than a year earlier.
This reflects the decline in gas produced in our German
and UK concession areas.
• Trading/Gas Midstream: The division sold 34.4 billion kWh
of gas outside the Group. RWE Supply & Trading focuses
on procuring gas for RWE companies and therefore
predominantly generates internal sales. The company’s
external sales consist of deliveries to key accounts as well
as surplus purchased gas, which we sell on directly to
External revenue€ million
2011 2010 + /– %
Germany 21,520 19,528 10.2
Power Generation 1,166 1,072 8.8
Supply/Distribution Networks 20,354 18,456 10.3
Netherlands/Belgium 5,818 6,510 − 10.6
United Kingdom 7,696 7,759 − 0.8
Central Eastern and South Eastern Europe 4,990 5,297 − 5.8
Renewables 443 366 21.0
Upstream Gas & Oil 1,766 1,353 30.5
Trading/Gas Midstream 5,750 7,517 − 23.5
Other, consolidation 3,703 4,990 − 25.8
RWE Group 51,686 53,320 − 3.1
of which:
Electricity revenue 33,765 34,803 − 3.0
Gas revenue 13,229 14,491 − 8.7
Oil revenue 1,641 1,049 56.4
Natural gas tax/electricity tax 2,533 2,598 − 2.5
RWE Group (excluding natural gas tax/electricity tax) 49,153 50,722 − 3.1
distributors or on the wholesale market. Compared to
2010, gas sales volume was down 12 %. This was
predominantly due to the aforementioned transfer of
parts of the key account business to the Germany Division.
External revenue 3 % down year on year. The RWE Group
generated €51,686 million in external revenue, 3 % less
than the preceding year’s figure. There was a marked
decline in revenue from the sale of in-house electricity
generation through RWE Supply & Trading. In addition, the
decrease in gas sales volume and the deconsolidation of
Thyssengas and Amprion had an effect. This was contrasted
by the positive impact of the full consolidation of NEW and
by the rise in crude oil prices. Developments of foreign
exchange rates also had an effect on the revenue trend. In
2011, the British pound cost an average of €1.15, as
opposed to €1.17 the year before. The US dollar was also
down on the euro, decreasing in value from €0.76 to €0.71.
Conversely, the Czech crown appreciated from €0.040 to
€0.041. Net of material consolidation and foreign exchange
effects, Group revenue was down 2 %.
business performance 57To our investors Review of operations our responsibility
Responsibility statement consolidated financial statements Further information
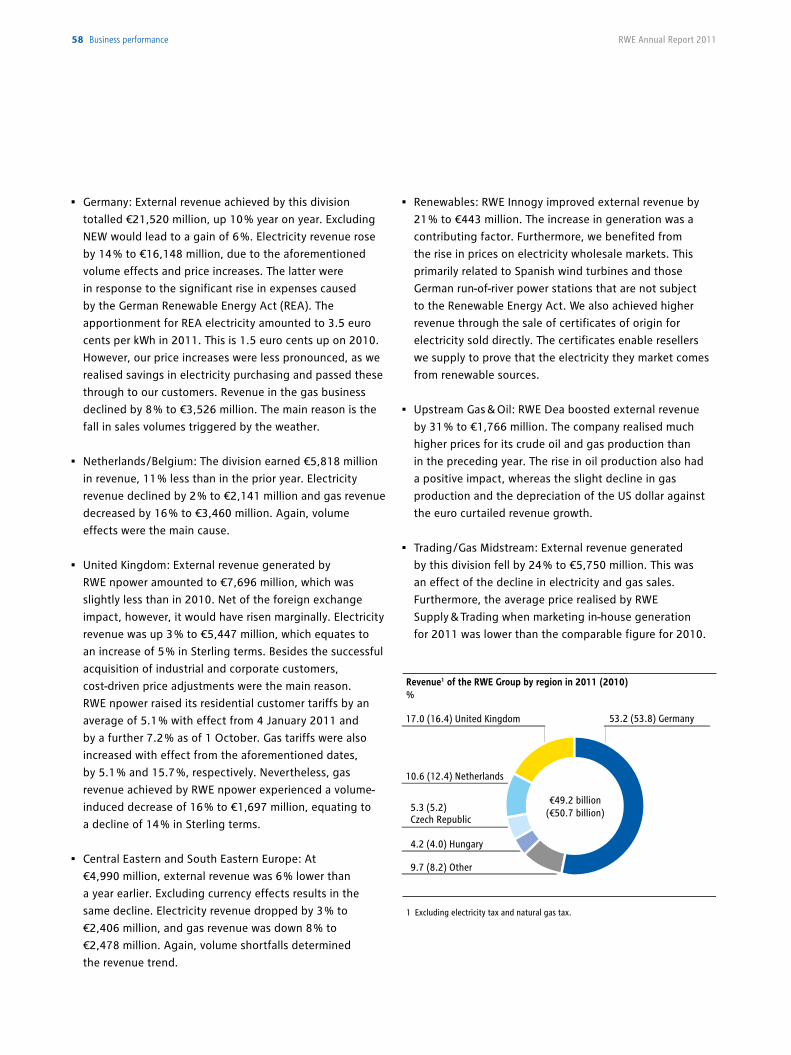
• Renewables: RWE Innogy improved external revenue by
21 % to €443 million. The increase in generation was a
contributing factor. Furthermore, we benefited from
the rise in prices on electricity wholesale markets. This
primarily related to Spanish wind turbines and those
German run-of-river power stations that are not subject
to the Renewable Energy Act. We also achieved higher
revenue through the sale of certificates of origin for
electricity sold directly. The certificates enable resellers
we supply to prove that the electricity they market comes
from renewable sources.
• Upstream Gas & Oil: RWE Dea boosted external revenue
by 31 % to €1,766 million. The company realised much
higher prices for its crude oil and gas production than
in the preceding year. The rise in oil production also had
a positive impact, whereas the slight decline in gas
production and the depreciation of the US dollar against
the euro curtailed revenue growth.
• Trading /Gas Midstream: External revenue generated
by this division fell by 24 % to €5,750 million. This was
an effect of the decline in electricity and gas sales.
Furthermore, the average price realised by RWE
Supply & Trading when marketing in-house generation
for 2011 was lower than the comparable figure for 2010.
Revenue1 of the RWE Group by region in 2011 (2010) %
9.7 (8.2) Other
10.6 (12.4) Netherlands
17.0 (16.4) United Kingdom
4.2 (4.0) Hungary
5.3 (5.2) Czech Republic
53.2 (53.8) Germany
1 Excluding electricity tax and natural gas tax.
€49.2 billion(€50.7 billion)
• Germany: External revenue achieved by this division
totalled €21,520 million, up 10 % year on year. Excluding
NEW would lead to a gain of 6 %. Electricity revenue rose
by 14 % to €16,148 million, due to the aforementioned
volume effects and price increases. The latter were
in response to the significant rise in expenses caused
by the German Renewable Energy Act (REA). The
apportionment for REA electricity amounted to 3.5 euro
cents per kWh in 2011. This is 1.5 euro cents up on 2010.
However, our price increases were less pronounced, as we
realised savings in electricity purchasing and passed these
through to our customers. Revenue in the gas business
declined by 8 % to €3,526 million. The main reason is the
fall in sales volumes triggered by the weather.
• Netherlands /Belgium: The division earned €5,818 million
in revenue, 11 % less than in the prior year. Electricity
revenue declined by 2 % to €2,141 million and gas revenue
decreased by 16 % to €3,460 million. Again, volume
effects were the main cause.
• United Kingdom: External revenue generated by
RWE npower amounted to €7,696 million, which was
slightly less than in 2010. Net of the foreign exchange
impact, however, it would have risen marginally. Electricity
revenue was up 3 % to €5,447 million, which equates to
an increase of 5 % in Sterling terms. Besides the successful
acquisition of industrial and corporate customers,
cost-driven price adjustments were the main reason.
RWE npower raised its residential customer tariffs by an
average of 5.1 % with effect from 4 January 2011 and
by a further 7.2 % as of 1 October. Gas tariffs were also
increased with effect from the aforementioned dates,
by 5.1 % and 15.7 %, respectively. Nevertheless, gas
revenue achieved by RWE npower experienced a volume-
induced decrease of 16 % to €1,697 million, equating to
a decline of 14 % in Sterling terms.
• Central Eastern and South Eastern Europe: At
€4,990 million, external revenue was 6 % lower than
a year earlier. Excluding currency effects results in the
same decline. Electricity revenue dropped by 3 % to
€2,406 million, and gas revenue was down 8 % to
€2,478 million. Again, volume shortfalls determined
the revenue trend.
58 business performance RWE Annual Report 2011
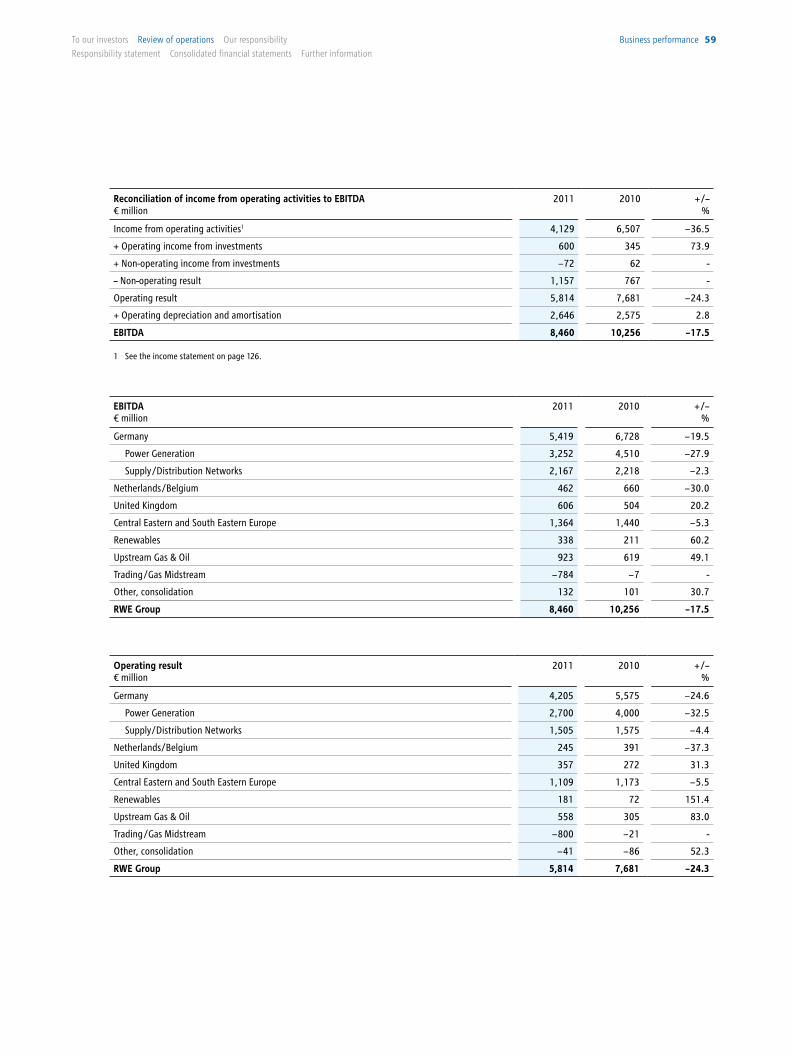
Operating result€ million
2011 2010 + /– %
Germany 4,205 5,575 − 24.6
Power Generation 2,700 4,000 − 32.5
Supply/Distribution Networks 1,505 1,575 − 4.4
Netherlands/Belgium 245 391 − 37.3
United Kingdom 357 272 31.3
Central Eastern and South Eastern Europe 1,109 1,173 − 5.5
Renewables 181 72 151.4
Upstream Gas & Oil 558 305 83.0
Trading/Gas Midstream − 800 − 21 -
Other, consolidation − 41 − 86 52.3
RWE Group 5,814 7,681 − 24.3
EBITDA€ million
2011 2010 + /– %
Germany 5,419 6,728 − 19.5
Power Generation 3,252 4,510 − 27.9
Supply /Distribution Networks 2,167 2,218 − 2.3
Netherlands /Belgium 462 660 − 30.0
United Kingdom 606 504 20.2
Central Eastern and South Eastern Europe 1,364 1,440 − 5.3
Renewables 338 211 60.2
Upstream Gas & Oil 923 619 49.1
Trading /Gas Midstream − 784 − 7 -
Other, consolidation 132 101 30.7
RWE Group 8,460 10,256 − 17.5
Reconciliation of income from operating activities to EBITDA€ million
2011 2010 + /– %
Income from operating activities1 4,129 6,507 − 36.5
+ Operating income from investments 600 345 73.9
+ Non-operating income from investments − 72 62 -
– Non-operating result 1,157 767 -
Operating result 5,814 7,681 − 24.3
+ Operating depreciation and amortisation 2,646 2,575 2.8
EBITDA 8,460 10,256 − 17.5
1 See the income statement on page 126.
business performance 59To our investors Review of operations our responsibility
Responsibility statement consolidated financial statements Further information
Operating result reflects burdens from German energy
policy. The RWE Group’s earnings deteriorated considerably
year on year. EBITDA declined by 18 % to €8,460 million, and
the operating result was down 24 % to €5,814 million. We
thus marginally exceeded the forecast we issued in August
2011, which envisaged declines in EBITDA and the operating
result of 20 % and 25 %, respectively. We had to make a
downward correction to the original earnings forecast we
published in February 2011 (− 15 % and − 20 %, respectively)
in view of the U-turn in German energy policy. The lifetime
reduction imposed on our German nuclear power stations in
the middle of 2011 was a major burden on RWE. Together
with the new nuclear fuel tax, it reduced the operating result
by about €1.3 billion compared to the prior year. Lower
electricity generation margins also had a negative impact.
Losses in the gas midstream business and an unusually weak
performance by our energy trading activities contributed to
the earnings shortfall as well. On balance, consolidation and
foreign exchange effects did not have a notable influence on
the Group’s earnings.
• Germany: The division posted an operating result of
€4,205 million, down 25 % on the previous year. The
following developments were observed in the Power
Generation and Sales /Distribution Networks Business
Areas:
Power Generation: The operating result recorded by this
business area declined by 33 % to €2,700 million.
Decisions made by the German government on energy
policy following the reactor disaster at Fukushima were
the main reason. Our margins declined significantly as a
result of the nuclear moratorium imposed in March, which
included the immediate cessation of operation of both
Biblis A and B and was initially limited to three months.
Further burdens came from the 13th amendment to the
Nuclear Energy Act, which entered into force in early
August (see page 43). Due to the accelerated nuclear
phase-out, we had to increase the provisions we built to
decommission the plants. Furthermore, we were forced to
recognise an impairment loss on the power plant facilities
and fuel rods we will not be able to use any longer at
Biblis. The nuclear fuel tax, levied for the first time, had a
negative effect of €251 million. Besides energy policy,
unfavourable developments on commodity markets were
also a burden. The average price realised by RWE Power
for its 2011 electricity generation was €63 per MWh,
which was below the previous year’s comparable figure
(€67 per MWh). In addition, our hard coal purchases
became more expensive. We typically sell our generation
up to three years before the electricity is delivered,
purchasing the required fuel and emission allowances at
the same time. We experienced some relief in procuring
CO2 emission allowances, as the associated cost dropped
by €87 million to €602 million. Further adjustments to our
nuclear provisions became necessary, countering the
negative effect of the lifetime reduction. Furthermore, the
release of mining provisions generated income.
Sales /Distribution Networks: This business area’s
operating result fell by 4 % to €1,505 million. Net of the
effect of the full consolidation of NEW, it would have
declined by 11 %. In the network business, there was a rise
in costs incurred to improve infrastructure. Furthermore,
throughput – and in turn network fee revenue - declined
due to weather-related reasons, especially in the gas
network. However, there was a positive effect: the German
Federal Network Agency is of the opinion that revenue
from network fees charged at the beginning of network
regulation (2005 to 2007) was too high. The excess
amounts must be refunded via rebates on network fees
from 2010 onwards. The effect of this issue decreased.
Despite declining gas volumes, earnings in our German
sales business were stable year on year, partially because
margins were slightly higher. The business area’s income
from investments improved.
• Netherlands /Belgium: The operating result recorded by
this division dropped by 37 % to €245 million. As set out
earlier, we started reporting parts of Essent’s gas
midstream business under RWE Supply & Trading with
60 business performance RWE Annual Report 2011
effect from 2011. In the preceding year, the earnings
contribution made by these activities was unusually high,
partly due to weather-related reasons. The fact that
Essent’s earnings worsened is also because of the decline
in electricity generation margins. This was contrasted by
the positive impact of cost reductions. In addition, we
benefited from expanding our Dutch gas midstream
activities. We are increasingly organising the transmission
of gas from suppliers or traders to our end-customers
ourselves.
• United Kingdom: RWE npower increased its operating
result by €85 million to €357 million, due to extensive
measures to cut costs and improve efficiency. These steps
primarily affected the supply business, enabling it, among
other things, to decrease bad debt significantly. Overall,
earnings generated by supply activities improved
considerably. Here, improved margins in the industrial
customer business also played a role. In the residential
customer segment, the decline in sales curtailed earnings,
especially from gas. Furthermore, we faced higher
electricity and gas procurement prices and increased
network usage fees. There was also a rise in the cost
caused by government programmes to promote energy
savings in households. These burdens were cushioned by
the tariff rises in January and October. In the generation
business, margins deteriorated due to unfavourable
market conditions. However, we benefited from
compensation for damages paid to us by a supplier for
project delays as well as from the commissioning of our
gas-fired power station at Staythorpe. Another positive
factor was that some of the amortised old accounts
receivable from Enron, the energy trader which went
bankrupt at the end of 2001, have been paid.
• Central Eastern and South Eastern Europe: The operating
result we achieved in this division decreased by 5 % to
€1,109 million. Currency effects did not have a material
impact on this. In the Czech gas business, volume
shortfalls reduced the result and lower throughput
curtailed margins in the distribution network.
Furthermore, a change in regulatory requirements led to a
decline in NET4GAS’ transmission revenue and, in turn,
earnings. In Hungary, competition-driven volume shortfalls
curtailed earnings achieved by electricity sales.
• Renewables: A rise in generation output and the recent
increase in electricity prices helped RWE Innogy to grow
its operating result by €109 million to €181 million.
Similar to RWE npower, a positive effect was felt from the
compensation for damages which we received for delays
in the construction of the Greater Gabbard offshore
wind farm, in which we have a 50 % stake. However,
RWE Innogy’s growth strategy continues to have a
negative impact on the bottom line, as both on-going
and planned capital expenditure projects go hand in hand
with high run-up costs.
• Upstream Gas & Oil: RWE Dea grew its operating result by
83 % to €558 million, mainly due to the increase in oil and
gas prices, with the rise in oil production also playing a
role. However, this resulted in higher production costs,
which together with the weaker US dollar and the decline
in gas volume slowed RWE Dea’s earnings growth. In
addition, we had to pay higher gas royalties at our site in
Lower Saxony. In contrast, exploration costs were
essentially unchanged.
• Trading /Gas Midstream: RWE Supply & Trading closed the
year with an operating loss of €800 million, which was
much higher than in the prior year (€21 million). Our
performance in the trading business was unusually weak.
On top of that, compared to 2010, we benefited less from
the realisation of successful forward transactions from
earlier years. This related above all to the external
marketing of RWE Power and RWE npower’s electricity
generation. The realised trading margins are recognised in
earnings once the underlying transactions are effected,
business performance 61To our investors Review of operations our responsibility
Responsibility statement consolidated financial statements Further information
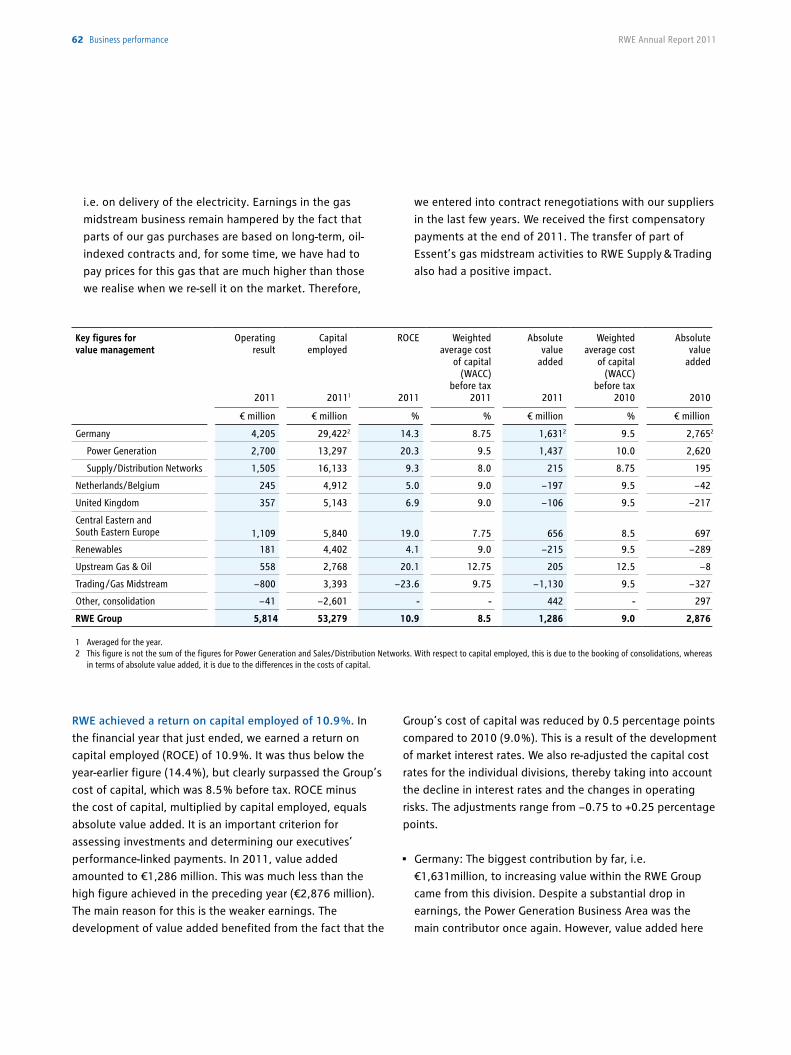
i.e. on delivery of the electricity. Earnings in the gas
midstream business remain hampered by the fact that
parts of our gas purchases are based on long-term, oil-
indexed contracts and, for some time, we have had to
pay prices for this gas that are much higher than those
we realise when we re-sell it on the market. Therefore,
we entered into contract renegotiations with our suppliers
in the last few years. We received the first compensatory
payments at the end of 2011. The transfer of part of
Essent’s gas midstream activities to RWE Supply & Trading
also had a positive impact.
Key figures for value management
Operating result
2011
Capital employed
20111
ROCE
2011
Weighted average cost
of capital (WACC)
before tax2011
Absolute value
added
2011
Weighted average cost
of capital (WACC)
before tax 2010
Absolute value
added
2010
€ million € million % % € million % € million
Germany 4,205 29,4222 14.3 8.75 1,6312 9.5 2,7652
Power Generation 2,700 13,297 20.3 9.5 1,437 10.0 2,620
Supply/Distribution Networks 1,505 16,133 9.3 8.0 215 8.75 195
Netherlands/Belgium 245 4,912 5.0 9.0 − 197 9.5 − 42
United Kingdom 357 5,143 6.9 9.0 − 106 9.5 − 217
Central Eastern and South Eastern Europe 1,109 5,840 19.0 7.75 656 8.5 697
Renewables 181 4,402 4.1 9.0 − 215 9.5 − 289
Upstream Gas & Oil 558 2,768 20.1 12.75 205 12.5 − 8
Trading/Gas Midstream − 800 3,393 − 23.6 9.75 − 1,130 9.5 − 327
Other, consolidation − 41 − 2,601 - - 442 - 297
RWE Group 5,814 53,279 10.9 8.5 1,286 9.0 2,876
1 Averaged for the year. 2 This figure is not the sum of the figures for Power Generation and Sales/Distribution Networks. With respect to capital employed, this is due to the booking of consolidations, whereas
in terms of absolute value added, it is due to the differences in the costs of capital.
RWE achieved a return on capital employed of 10.9 %. In
the financial year that just ended, we earned a return on
capital employed (ROCE) of 10.9 %. It was thus below the
year-earlier figure (14.4 %), but clearly surpassed the Group’s
cost of capital, which was 8.5 % before tax. ROCE minus
the cost of capital, multiplied by capital employed, equals
absolute value added. It is an important criterion for
assessing investments and determining our executives’
performance-linked payments. In 2011, value added
amounted to €1,286 million. This was much less than the
high figure achieved in the preceding year (€2,876 million).
The main reason for this is the weaker earnings. The
development of value added benefited from the fact that the
Group’s cost of capital was reduced by 0.5 percentage points
compared to 2010 (9.0 %). This is a result of the development
of market interest rates. We also re-adjusted the capital cost
rates for the individual divisions, thereby taking into account
the decline in interest rates and the changes in operating
risks. The adjustments range from − 0.75 to +0.25 percentage
points.
• Germany: The biggest contribution by far, i.e.
€1,631million, to increasing value within the RWE Group
came from this division. Despite a substantial drop in
earnings, the Power Generation Business Area was the
main contributor once again. However, value added here
62 business performance RWE Annual Report 2011
declined by €1,183 million to €1,437 million. In contrast,
in the Sales /Distribution Networks Business Area, we
recorded a rise of €20 million to €215 million. This was
largely due to the reduction in the cost of capital, which
had a stronger effect than the decline in earnings.
• Netherlands /Belgium: Despite the lower cost of capital,
value added by this division dropped by €155 million to
− €197 million. This was primarily due to the decline in the
operating result. Furthermore, capital employed rose,
driven by investing activity.
• United Kingdom: RWE npower’s value added was also
negative. However, owing to the significant improvement
in the company’s earnings and reduced cost of capital, it
improved by €111 million to − €106 million year on year.
• Central Eastern and South Eastern Europe: At €656 million,
the division made the second-largest contribution to value
added within the RWE Group. However, it fell just short of
the previous year’s level. Besides the marginal decrease in
earnings, the increase in capital employed was decisive,
whereas the lower cost of capital had a counteracting
effect.
• Renewables: At RWE Innogy, the extensive investment in
the expansion of the generation portfolio was the main
reason why the cost of capital could not be earned back
yet. The background to this is that new plants are already
considered in capital employed during the construction
phase, although they do not contribute to earnings yet. In
particular, the large-scale offshore wind projects will only
start producing income in the coming years. However,
value added by this division increased considerably
compared to 2010, rising by €74 million to − €215 million.
This climb is primarily due to the positive earnings trend,
which is likely to continue in the next few years.
• Upstream Gas & Oil: At RWE Dea, the successful
development of business caused value added to increase
by €213 million to €205 million. A dampening effect was
felt from the significant amount of capital we spent to
expand our upstream position, which led to a rise in capital
employed. In addition, the cost of capital was lifted
somewhat.
• Trading /Gas Midstream: The significant operating loss was
reflected in negative value added by RWE Supply & Trading.
It amounted to − €1,130 million, clearly down on the prior-
year figure (− €327 million) which was already very low.
business performance 63To our investors Review of operations our responsibility
Responsibility statement consolidated financial statements Further information
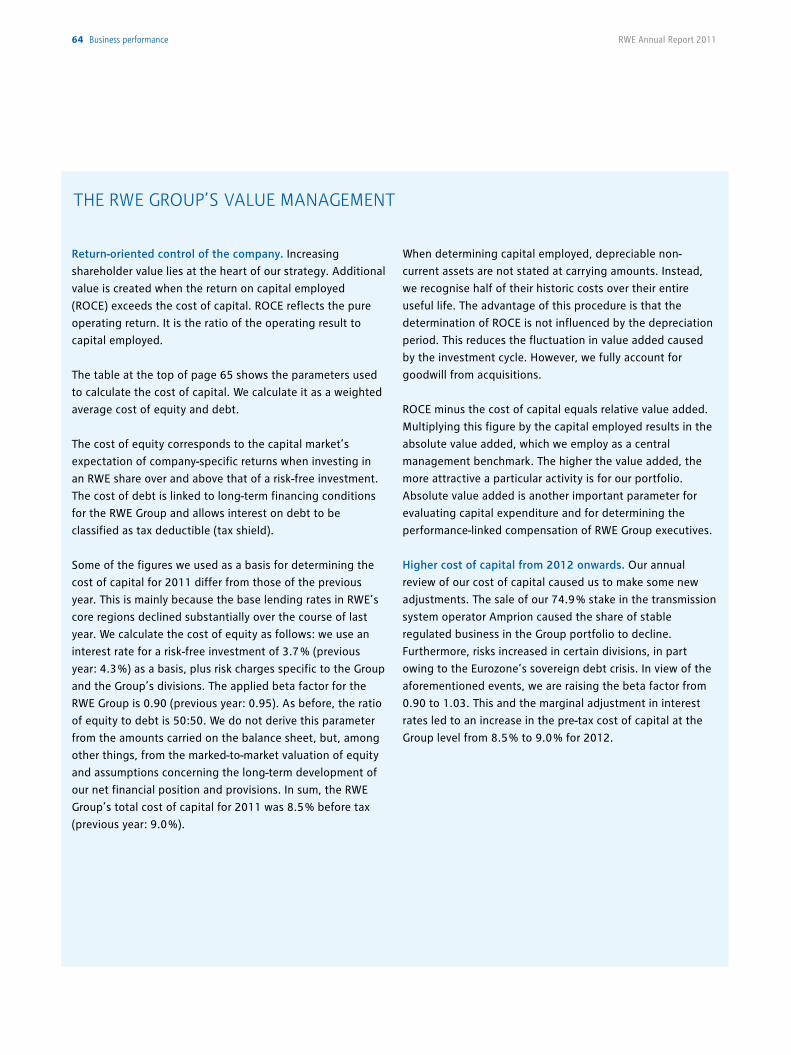
Return-oriented control of the company. Increasing
shareholder value lies at the heart of our strategy. Additional
value is created when the return on capital employed
(ROCE) exceeds the cost of capital. ROCE reflects the pure
operating return. It is the ratio of the operating result to
capital employed.
The table at the top of page 65 shows the parameters used
to calculate the cost of capital. We calculate it as a weighted
average cost of equity and debt.
The cost of equity corresponds to the capital market’s
expectation of company-specific returns when investing in
an RWE share over and above that of a risk-free investment.
The cost of debt is linked to long-term financing conditions
for the RWE Group and allows interest on debt to be
classified as tax deductible (tax shield).
Some of the figures we used as a basis for determining the
cost of capital for 2011 differ from those of the previous
year. This is mainly because the base lending rates in RWE’s
core regions declined substantially over the course of last
year. We calculate the cost of equity as follows: we use an
interest rate for a risk-free investment of 3.7 % (previous
year: 4.3 %) as a basis, plus risk charges specific to the Group
and the Group’s divisions. The applied beta factor for the
RWE Group is 0.90 (previous year: 0.95). As before, the ratio
of equity to debt is 50:50. We do not derive this parameter
from the amounts carried on the balance sheet, but, among
other things, from the marked-to-market valuation of equity
and assumptions concerning the long-term development of
our net financial position and provisions. In sum, the RWE
Group’s total cost of capital for 2011 was 8.5 % before tax
(previous year: 9.0 %).
When determining capital employed, depreciable non-
current assets are not stated at carrying amounts. Instead,
we recognise half of their historic costs over their entire
useful life. The advantage of this procedure is that the
determination of ROCE is not influenced by the depreciation
period. This reduces the fluctuation in value added caused
by the investment cycle. However, we fully account for
goodwill from acquisitions.
ROCE minus the cost of capital equals relative value added.
Multiplying this figure by the capital employed results in the
absolute value added, which we employ as a central
management benchmark. The higher the value added, the
more attractive a particular activity is for our portfolio.
Absolute value added is another important parameter for
evaluating capital expenditure and for determining the
performance-linked compensation of RWE Group executives.
Higher cost of capital from 2012 onwards. Our annual
review of our cost of capital caused us to make some new
adjustments. The sale of our 74.9 % stake in the transmission
system operator Amprion caused the share of stable
regulated business in the Group portfolio to decline.
Furthermore, risks increased in certain divisions, in part
owing to the Eurozone’s sovereign debt crisis. In view of the
aforementioned events, we are raising the beta factor from
0.90 to 1.03. This and the marginal adjustment in interest
rates led to an increase in the pre-tax cost of capital at the
Group level from 8.5 % to 9.0 % for 2012.
THE RWE GROUP’S VALUE MANAGEMENT
64 business performance RWE Annual Report 2011
RWE Group - capital costs 2012 2011 2010
Risk-free interest rate % 3.8 3.7 4.3
Market premium % 5.0 5.0 5.0
Beta factor 1.03 0.90 0.95
Cost of equity after tax % 8.9 8.2 9.0
Cost of debt before tax % 5.0 4.9 5.8
Tax rate for debt % 27.4 27.4 27.1
Tax shield % − 1.4 − 1.3 − 1.6
Cost of debt after tax % 3.6 3.6 4.2
Proportion of equity % 50 50 50
Proportion of debt % 50 50 50
Capital costs after tax % 6.3 5.8 6.5
Tax rate for blanket conversion % 31 31 30
Weighted average cost of capital (WACC) before tax % 9.0 8.5 9.0
RWE Group - determining capital employed 31 Dec 2011 31 Dec 2010
Intangible assets/property, plant and equipment1 € million 57,596 58,849
+ Investments including loans2 € million 6,286 5,998
+ Inventories € million 3,342 3,293
+ Trade accounts receivable € million 7,459 9,481
+ Other accounts receivable and other assets3 € million 9,978 12,872
- Non-interest-bearing provisions4 € million 11,566 12,384
- Non-interest-bearing liabilities5 € million 20,225 22,156
- Adjustments6 € million 890 954
Capital employed € million 51,981 54,999
RWE Group - determining value added 2011
Capital employed before adjustments (averaged for the year) € million 53,490
+ Adjustments7 € million − 211
Capital employed after adjustments (averaged for the year) € million 53,279
Operating result € million 5,814
ROCE % 10.9
Relative value added % 2.4
Absolute value added € million 1,286
1 Intangible assets; property, plant and equipment; and investment property were stated at half of their cost (see the statement of changes in assets); goodwill and the customer base were recognised at carrying amounts. For 2011, €808 million in non-productive assets in the German network business were deducted.
2 Investments accounted for using the equity method and other financial assets (excluding non-current securities).3 Including tax refund claims; excluding the net present value of defined contribution pension benefit obligations as well as derivative financial instruments in the
amount of €1,204 million (previous year: €938 million).4 Including tax provisions and other provisions; excluding non-current provisions in the amount of €598 million (previous year: €425 million).5 Including trade liabilities, income tax liabilities and other liabilities; excluding derivative financial instruments in the amount of €981 million
(previous year: €534 million) and purchase price liabilities of €1,593 million (previous year: €1,775 million) from put options.6 Essentially, assets capitalised in accordance with IAS 16.15 in the amount of €447 million (previous year: €486 million) are not taken into account since they do not
employ capital. Deferred tax liabilities relating to RWE npower’s capitalised customer base are not taken into account, either.7 Corrections to reflect timing differences, primarily due to first-time consolidations /deconsolidations during the year. In addition, corrections to 2010 assets to
reflect non-productive assets in the German network business.
business performance 65To our investors Review of operations our responsibility
Responsibility statement consolidated financial statements Further information
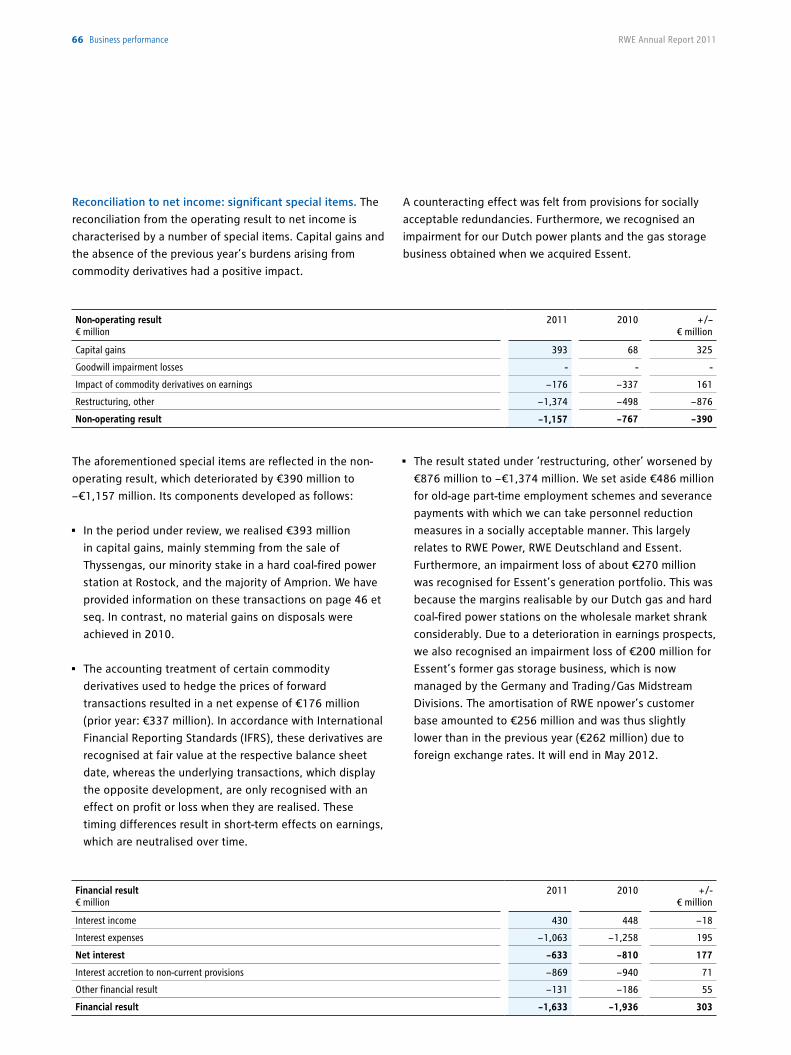
Non-operating result€ million
2011 2010 + /– € million
Capital gains 393 68 325
Goodwill impairment losses - - -
Impact of commodity derivatives on earnings − 176 − 337 161
Restructuring, other − 1,374 − 498 − 876
Non-operating result − 1,157 − 767 − 390
The aforementioned special items are reflected in the non-
operating result, which deteriorated by €390 million to
− €1,157 million. Its components developed as follows:
• In the period under review, we realised €393 million
in capital gains, mainly stemming from the sale of
Thyssengas, our minority stake in a hard coal-fired power
station at Rostock, and the majority of Amprion. We have
provided information on these transactions on page 46 et
seq. In contrast, no material gains on disposals were
achieved in 2010.
• The accounting treatment of certain commodity
derivatives used to hedge the prices of forward
transactions resulted in a net expense of €176 million
(prior year: €337 million). In accordance with International
Financial Reporting Standards (IFRS), these derivatives are
recognised at fair value at the respective balance sheet
date, whereas the underlying transactions, which display
the opposite development, are only recognised with an
effect on profit or loss when they are realised. These
timing differences result in short-term effects on earnings,
which are neutralised over time.
• The result stated under ‘restructuring, other’ worsened by
€876 million to − €1,374 million. We set aside €486 million
for old-age part-time employment schemes and severance
payments with which we can take personnel reduction
measures in a socially acceptable manner. This largely
relates to RWE Power, RWE Deutschland and Essent.
Furthermore, an impairment loss of about €270 million
was recognised for Essent’s generation portfolio. This was
because the margins realisable by our Dutch gas and hard
coal-fired power stations on the wholesale market shrank
considerably. Due to a deterioration in earnings prospects,
we also recognised an impairment loss of €200 million for
Essent’s former gas storage business, which is now
managed by the Germany and Trading /Gas Midstream
Divisions. The amortisation of RWE npower’s customer
base amounted to €256 million and was thus slightly
lower than in the previous year (€262 million) due to
foreign exchange rates. It will end in May 2012.
Financial result€ million
2011 2010 + /- € million
Interest income 430 448 − 18
Interest expenses − 1,063 − 1,258 195
Net interest − 633 − 810 177
Interest accretion to non-current provisions − 869 − 940 71
Other financial result − 131 − 186 55
Financial result − 1,633 − 1,936 303
Reconciliation to net income: significant special items. The
reconciliation from the operating result to net income is
characterised by a number of special items. Capital gains and
the absence of the previous year’s burdens arising from
commodity derivatives had a positive impact.
A counteracting effect was felt from provisions for socially
acceptable redundancies. Furthermore, we recognised an
impairment for our Dutch power plants and the gas storage
business obtained when we acquired Essent.
66 business performance RWE Annual Report 2011
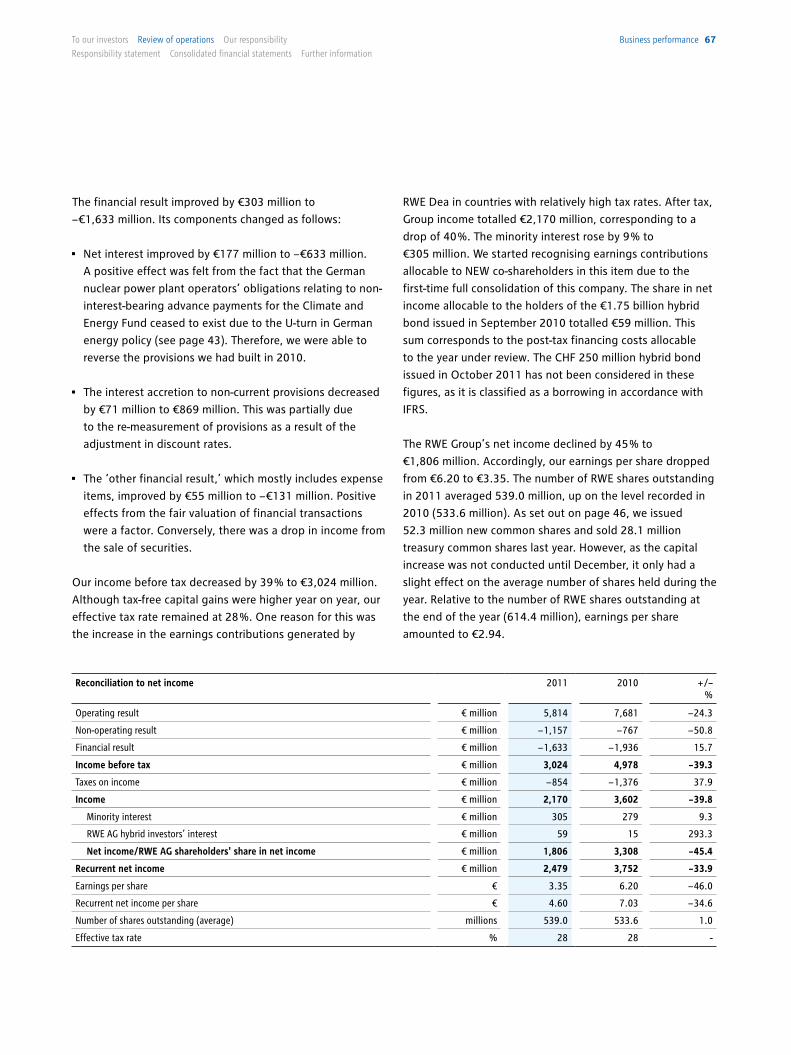
Reconciliation to net income 2011 2010 + /– %
Operating result € million 5,814 7,681 − 24.3
Non-operating result € million − 1,157 − 767 − 50.8
Financial result € million − 1,633 − 1,936 15.7
Income before tax € million 3,024 4,978 − 39.3
Taxes on income € million − 854 − 1,376 37.9
Income € million 2,170 3,602 − 39.8
Minority interest € million 305 279 9.3
RWE AG hybrid investors’ interest € million 59 15 293.3
Net income/RWE AG shareholders' share in net income € million 1,806 3,308 − 45.4
Recurrent net income € million 2,479 3,752 − 33.9
Earnings per share € 3.35 6.20 − 46.0
Recurrent net income per share € 4.60 7.03 − 34.6
Number of shares outstanding (average) millions 539.0 533.6 1.0
Effective tax rate % 28 28 -
The financial result improved by €303 million to
− €1,633 million. Its components changed as follows:
• Net interest improved by €177 million to − €633 million.
A positive effect was felt from the fact that the German
nuclear power plant operators’ obligations relating to non-
interest-bearing advance payments for the Climate and
Energy Fund ceased to exist due to the U-turn in German
energy policy (see page 43). Therefore, we were able to
reverse the provisions we had built in 2010.
• The interest accretion to non-current provisions decreased
by €71 million to €869 million. This was partially due
to the re-measurement of provisions as a result of the
adjustment in discount rates.
• The ‘other financial result,’ which mostly includes expense
items, improved by €55 million to − €131 million. Positive
effects from the fair valuation of financial transactions
were a factor. Conversely, there was a drop in income from
the sale of securities.
Our income before tax decreased by 39 % to €3,024 million.
Although tax-free capital gains were higher year on year, our
effective tax rate remained at 28 %. One reason for this was
the increase in the earnings contributions generated by
RWE Dea in countries with relatively high tax rates. After tax,
Group income totalled €2,170 million, corresponding to a
drop of 40 %. The minority interest rose by 9 % to
€305 million. We started recognising earnings contributions
allocable to NEW co-shareholders in this item due to the
first-time full consolidation of this company. The share in net
income allocable to the holders of the €1.75 billion hybrid
bond issued in September 2010 totalled €59 million. This
sum corresponds to the post-tax financing costs allocable
to the year under review. The CHF 250 million hybrid bond
issued in October 2011 has not been considered in these
figures, as it is classified as a borrowing in accordance with
IFRS.
The RWE Group’s net income declined by 45 % to
€1,806 million. Accordingly, our earnings per share dropped
from €6.20 to €3.35. The number of RWE shares outstanding
in 2011 averaged 539.0 million, up on the level recorded in
2010 (533.6 million). As set out on page 46, we issued
52.3 million new common shares and sold 28.1 million
treasury common shares last year. However, as the capital
increase was not conducted until December, it only had a
slight effect on the average number of shares held during the
year. Relative to the number of RWE shares outstanding at
the end of the year (614.4 million), earnings per share
amounted to €2.94.
business performance 67To our investors Review of operations our responsibility
Responsibility statement consolidated financial statements Further information
Efficiency enhancements compared to 2006€ million (accumulated) 2007 2008 2009 2010 2011
Target2012
Contribution to earnings 100 200 450 700 >900 1,500
Recurrent net income down 34 % year on year. The yardstick
for determining the dividend is recurrent net income, which
does not include the non-operating result or the tax on it. If
major non-recurrent effects in the financial result and income
taxes occur, these are also excluded.
In the period under review, recurrent net income totalled
€2,479 million, 34 % down year on year. The earnings outlook
we issued in August 2011, which predicted a decline of
some 35 %, was therefore roughly confirmed. Conversely, in
February 2011, we had forecast a drop of about 30 %.
Recurrent net income per share amounted to €4.60, which
was much less than in 2010 (€7.03). Based on the number of
shares outstanding at the end of 2011, the figure totalled
€4.03. Holders of the RWE shares issued in December will
already bear full dividend entitlements at the next dividend
payment date, which is 20 April 2012. Given the dividend of
€2.00 per share proposed by the Executive and Supervisory
Boards of RWE, the payout ratio will be 50 %.
Efficiency-enhancement programme: target for 2011
exceeded. We are making good progress with the efficiency-
improvement programme we initiated in 2007. By taking
measures to reduce costs and increase revenue, we aim to
tap additional earnings potential – and do so more and more
every year. One of the project’s goals is to enhance the
performance of our German electricity and gas network
business, which should limit the impact on our earnings
from tariff cuts mandated by the network regulator. Further
savings will be achieved through improvements in IT services
and purchasing as well as the pooling of back-office
functions. Moreover, we intend to increase revenue by
improving the availability of our power plants.
We wanted to achieve a positive effect on earnings of
€900 million through the programme by the end of 2011,
compared to 2006, the baseline year. By the balance sheet
date, we had actually achieved even more than originally
intended. The efficiency-enhancement programme will run
until the end of 2012 and we want to increase the positive
impact on earnings to €1.5 billion compared to 2006. We
had originally aimed for €1.2 billion. We were able to raise
this target because we identified additional potential for
savings, especially in terms of project and material costs.
On conclusion of the ongoing efficiency-enhancement
programme, we will launch a new one in 2013 (see page 98).
68 business performance RWE Annual Report 2011
Capital expenditure on property, plant and equipment and on intangible assets€ million
2011 2010 + /– € million
Germany 2,374 2,410 − 36
Power Generation 1,168 1,180 − 12
Supply/Distribution Networks 1,206 1,230 − 24
Netherlands/Belgium 971 1,144 − 173
United Kingdom 416 876 − 460
Central Eastern and South Eastern Europe 852 430 422
Renewables 825 614 211
Upstream Gas & Oil 701 507 194
Trading/Gas Midstream 20 4 16
Other, consolidation 194 394 − 200
RWE Group 6,353 6,379 − 26
Capital expenditure on financial assets€ million
2011 2010 + /– € million
Germany 19 45 − 26
Power Generation - 2 − 2
Supply/Distribution Networks 19 43 − 24
Netherlands/Belgium 431 3 428
United Kingdom 184 23 161
Central Eastern and South Eastern Europe 6 8 − 2
Renewables 66 95 − 29
Upstream Gas & Oil - - -
Trading/Gas Midstream 6 61 − 55
Other, consolidation 7 29 − 22
RWE Group 719 264 455
Capital expenditure up 6 % year on year. We spent
€7,072 million in capital in the year under review. This
exceeded the 2010 level (€6,643 million) by 6 %. The
acquisition of Energy Resources Holding B.V., on which we
reported on page 47, was a contributing factor. This
transaction was the main reason why capital spending on
financial assets rose by €455 million to €719 million. Our
capital expenditure on property, plant and equipment and
intangible assets totalled €6,353 million, roughly equalling
the previous year’s record level. Capex focused on
expanding and modernising our electricity generation
capacity. However, we spent fewer funds in the year being
reviewed than expected, in part because power plant and
wind energy projects were delayed.
• Germany: Capital expenditure by this division amounted
to €2,393 million, 3 % less than in the preceding year.
Its business areas displayed the following development:
Power Generation: This business area spent €1,168 million
in capital, just below the year-earlier level. All of it was
dedicated to property, plant and equipment, including the
new 2,100 MW dual-block lignite-fired power station at
Neurath near Cologne. The plant has been completed, but
we were unable to adhere to our original schedule owing
to quality-related problems caused by suppliers and a
serious accident on the construction site in 2007. The two
units are set to commence commercial operation at the
business performance 69To our investors Review of operations our responsibility
Responsibility statement consolidated financial statements Further information
end of March 2012. We spent a total of €2.6 billion on the
station. RWE Power’s second large-scale project is a twin-
unit hard coal facility at Hamm, with a net installed
capacity of 1,528 MW. Again, suppliers caused delays. The
power station will therefore probably not go online until
the second half of 2013. Based on current planning, a
total of approximately €2.4 billion in capital will be spent
on this facility. These new builds will help us achieve
significant improvements in terms of efficiency and
emission reductions.
Sales /Distribution Networks: We spent €1,225 million in
capital on this business area, which was also slightly less
than in 2010. Capital expenditure on property, plant and
equipment decreased marginally to €1,206 million. These
funds were mainly allocated to upgrades to and the
expansion of the network infrastructure. In addition, we
invested in new gas storage capacity. At €19 million, our
capital expenditure on financial assets was immaterial.
• Netherlands /Belgium: At €1,402 million, capital
expenditure by this division was 22 % up on the previous
year’s figure. This was mainly due to the acquisition of
Energy Resources Holding B.V., which had an impact
of €429 million. Almost all of the spending on financial
assets was allocated to this transaction. In contrast,
capital expenditure on property, plant and equipment was
down year on year, amounting to €971 million. The
division’s largest undertaking is a hard coal twin-unit
facility at Eemshaven, which has a net installed capacity of
1,560 MW and is scheduled to go online in 2014. Further
investment magnets in the year under review were the
Claus C and Moerdijk 2 combined-cycle gas turbine (CCGT)
power plants. Claus C started commercial production in
January 2012, four months ahead of schedule. It has a
net installed capacity of 1,304 MW and replaces the
Claus B (640 MW) gas-fired power station. Associated
capital expenditure totalled €1.1 billion. Moerdijk 2 was
commissioned in February 2012. The CCGT facility is
located at the site of the existing Moerdijk power station
and has an installed capacity of 426 MW. We spent a total
of €0.4 billion on it.
• United Kingdom: RWE npower invested €600 million, a
third less than in 2010. There was a considerable drop in
capital expenditure on property, plant and equipment.
At €416 million, it was less than half the level posted in
2010 when we completed the Staythorpe CCGT power
station. The largest project in the period being reviewed
was the gas-fired power plant at Pembroke. It will have a
net installed capacity of 2,188 MW and is scheduled to
begin commercial operation in the second half of 2012.
Additional funds were dedicated to converting our three
hard coal units at Tilbury in order to fire them with
biomass. Furthermore, we invested in a new customer
billing system. Capital expenditure on financial assets
totalled €184 million, clearly up on the preceding year.
Part of these funds was allocated to land at Wylfa (Wales),
which we purchased together with E.ON in order to
develop it into a potential nuclear energy site. We had
obtained the land in an auction as early as 2009. However,
only a downpayment had to be made at the time. At the
same auction, together with E.ON, we managed to secure
a second site, which is also earmarked for the construction
of a nuclear power plant and is located at Oldbury. We
paid the purchase price at the beginning of 2012.
• Central Eastern and South Eastern Europe: At
€858 million, capital spent by this division was nearly
twice as high as in the previous year. It was almost
exclusively used on property, plant and equipment. The
focus continues to be on measures to improve electricity
and gas network infrastructure. For instance, in 2011,
construction work began on a new gas transit pipeline in
the west of the Czech Republic. Additional funds were
dedicated to expanding our gas storage capacity. We
made good progress with building our 775 MW CCGT
power station in the Turkish town of Denizli, which is
scheduled for completion by the end of 2012. We will
allocate a total of €0.5 billion to this project. About half of
this sum was spent in the financial year that just ended.
• Renewables: RWE Innogy increased capital expenditure
by 26 % to €891 million, with €825 million going to
property, plant and equipment, up 34 % on 2010. The
construction of new wind power capacity took centre
stage. Our largest project is the Gwynt y Môr wind farm
70 business performance RWE Annual Report 2011
off the coast of North Wales. It will have a total installed
capacity of 576 MW, of which we own 60 %. At the end of
2011, we began laying the first foundations for a total of
160 wind turbines, with completion scheduled for 2014.
Another investment is the planned Nordsee Ost wind farm
north of the German Isle of Heligoland, which will have an
aggregate installed capacity of 295 MW. Construction is
due to be completed in 2013. To build the Gwynt y Môr
and Nordsee Ost wind farms, we will use our own special
construction ships, to which we allocated substantial
funds in the year under review. Furthermore, RWE Innogy
granted loans to associated companies, but these are not
stated as capital expenditure: in 2011, €120 million
(previous year: €300 million) was allocated to the Greater
Gabbard Offshore Winds Ltd. joint venture, which is
erecting the namesake wind farm off the UK coast. We
own 50 % of the company. In addition, we invested in
onshore wind energy, for example at sites in the United
Kingdom, Poland, Germany and Italy. Besides wind power,
biomass plays a role for us. The main undertaking in this
field is a 45 MW combined heat and power plant in the
Scottish town of Markinch, which should take up
production in 2013. Moreover, in December 2011, we
commissioned a small biomass-fired thermal power station
in Kehl on the Rhine, Germany. In addition, we finished
building a wood pellet manufacturing plant in the US state
of Georgia in May 2011. With an annual production
capacity of 750,000 metric tons, the factory is one of the
biggest worldwide. Capital spent by RWE Innogy on
financial assets declined by 31 % to €66 million. We
dedicated €26 million of this sum to doubling our stake in
the Spanish wind farm operator Explotaciones Eólicas de
Aldehuelas to 95 %. As a result, our Spanish installed
wind power capacity rose by 47 MW to 447 MW.
• Upstream Gas & Oil: Capital expenditure at RWE Dea
increased by 38 % to €701 million, all of which was
allocated to property, plant and equipment. In the year
being reviewed, we focused on the development of oil and
gas fields in preparation for production. Major funds were
dedicated to the construction of a rig in the Breagh North
Sea field and of its pipeline connection to the UK
mainland.
• Trading /Gas Midstream: RWE Supply & Trading spent
€26 million in capital, which was 60 % less than in the
preceding year. Capital expenditure on property,
plant and equipment of €20 million was allocated to
construction work at our trading floors, among other
things, which made workflow more efficient. Spending on
financial assets totalled €6 million, accounting for just one
tenth of the year-earlier figure, which included transfers
of internal funds to the US-based liquefied natural gas
company Excelerate Energy.
The ‘other, consolidation’ item includes €201 million in
capital expenditure for 2011, largely relating to property,
plant and equipment. Most of the funds were used by
Amprion to modernise and expand the electricity
transmission network.
RWE creates new jobs. As of the balance sheet date, the
RWE Group employed 72,068 people, 41,632, or 58 %,
of whom worked at German sites. Part-time positions
were calculated in these figures on a pro-rata basis.
The headcount was up by 1,212 personnel compared to
31 December 2010, corresponding to a rise of 1.7 %.
Operating changes were responsible for 1,172 of the
additional positions, while 40 were due to consolidation
effects. For the first time, our figures include the 1,154 staff
members of NEW, which belongs to the Germany Division.
Conversely, the sale of Thyssengas and of the majority of
Amprion removed 289 and 816 employees from the Group’s
payroll, respectively. This explains the significant decline
in the ‘other’ line item. As in previous years, we trained
far more people than required to cover our own needs.
By 31 December 2011, 3,020 young adults were in a
professional training programme at RWE. Staff figures
do not include trainees.
business performance 71To our investors Review of operations our responsibility
Responsibility statement consolidated financial statements Further information
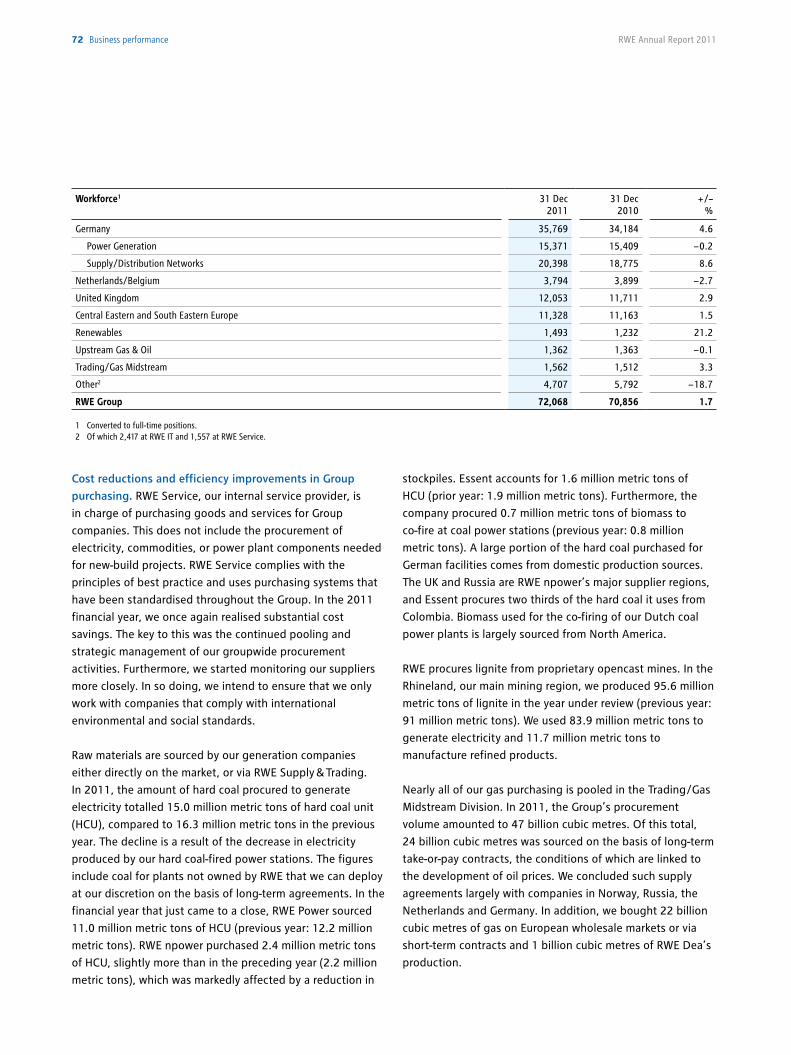
Workforce 1 31 Dec 2011
31 Dec 2010
+ /– %
Germany 35,769 34,184 4.6
Power Generation 15,371 15,409 − 0.2
Supply/Distribution Networks 20,398 18,775 8.6
Netherlands/Belgium 3,794 3,899 − 2.7
United Kingdom 12,053 11,711 2.9
Central Eastern and South Eastern Europe 11,328 11,163 1.5
Renewables 1,493 1,232 21.2
Upstream Gas & Oil 1,362 1,363 − 0.1
Trading/Gas Midstream 1,562 1,512 3.3
Other2 4,707 5,792 − 18.7
RWE Group 72,068 70,856 1.7
1 Converted to full-time positions. 2 Of which 2,417 at RWE IT and 1,557 at RWE Service.
Cost reductions and efficiency improvements in Group
purchasing. RWE Service, our internal service provider, is
in charge of purchasing goods and services for Group
companies. This does not include the procurement of
electricity, commodities, or power plant components needed
for new-build projects. RWE Service complies with the
principles of best practice and uses purchasing systems that
have been standardised throughout the Group. In the 2011
financial year, we once again realised substantial cost
savings. The key to this was the continued pooling and
strategic management of our groupwide procurement
activities. Furthermore, we started monitoring our suppliers
more closely. In so doing, we intend to ensure that we only
work with companies that comply with international
environmental and social standards.
Raw materials are sourced by our generation companies
either directly on the market, or via RWE Supply & Trading.
In 2011, the amount of hard coal procured to generate
electricity totalled 15.0 million metric tons of hard coal unit
(HCU), compared to 16.3 million metric tons in the previous
year. The decline is a result of the decrease in electricity
produced by our hard coal-fired power stations. The figures
include coal for plants not owned by RWE that we can deploy
at our discretion on the basis of long-term agreements. In the
financial year that just came to a close, RWE Power sourced
11.0 million metric tons of HCU (previous year: 12.2 million
metric tons). RWE npower purchased 2.4 million metric tons
of HCU, slightly more than in the preceding year (2.2 million
metric tons), which was markedly affected by a reduction in
stockpiles. Essent accounts for 1.6 million metric tons of
HCU (prior year: 1.9 million metric tons). Furthermore, the
company procured 0.7 million metric tons of biomass to
co-fire at coal power stations (previous year: 0.8 million
metric tons). A large portion of the hard coal purchased for
German facilities comes from domestic production sources.
The UK and Russia are RWE npower’s major supplier regions,
and Essent procures two thirds of the hard coal it uses from
Colombia. Biomass used for the co-firing of our Dutch coal
power plants is largely sourced from North America.
RWE procures lignite from proprietary opencast mines. In the
Rhineland, our main mining region, we produced 95.6 million
metric tons of lignite in the year under review (previous year:
91 million metric tons). We used 83.9 million metric tons to
generate electricity and 11.7 million metric tons to
manufacture refined products.
Nearly all of our gas purchasing is pooled in the Trading /Gas
Midstream Division. In 2011, the Group’s procurement
volume amounted to 47 billion cubic metres. Of this total,
24 billion cubic metres was sourced on the basis of long-term
take-or-pay contracts, the conditions of which are linked to
the development of oil prices. We concluded such supply
agreements largely with companies in Norway, Russia, the
Netherlands and Germany. In addition, we bought 22 billion
cubic metres of gas on European wholesale markets or via
short-term contracts and 1 billion cubic metres of RWE Dea’s
production.
72 business performance RWE Annual Report 2011
To our investors Review of operations our responsibility
Responsibility statement consolidated financial statements Further information
Financial position and net worth 73
Central financing through RWE AG. The RWE Group’s
financing is the responsibility of RWE AG, a task in which it is
assisted by RWE Finance B.V. This is the company through
which we usually issue bonds, which are backed by RWE AG.
Only in specific cases do other subsidiaries raise capital
directly, especially if it is more advantageous economically
to make use of local credit and capital markets. Furthermore,
RWE AG acts as co-ordinator when Group companies assume
a liability: the company decides on the scope of warranties
issued and letters of comfort signed. Pooling these activities
is a basic prerequisite for managing and monitoring financial
risks centrally. Moreover, this strengthens our position when
negotiating with banks, business partners, suppliers and
customers.
Flexible tools available for raising debt capital. We primarily
meet our financing needs with the high and stable cash
flows from our operating activities. In addition, we have
access to a number of flexible financing instruments. One of
our major tools is the Debt Issuance Programme (DIP) for
long-term refinancing on the capital market. The maximum
counter value of the bonds that we can issue through the
DIP totals €30 billion. Last but not least, a commercial paper
programme gives us a maximum of US$5 billion in headroom
for short-term financing on the money market. An unused
€4.0 billion credit line serves as an additional liquidity
reserve. Its tenor expires in November 2016. In November
2012, RWE has the option to file for a one-year extension of
the credit line.
Neither the aforementioned financing instruments, nor the
current credit facilities, contain specific financial covenants
such as interest coverage, leverage or capitalisation ratios
that could trigger actions, such as acceleration of
repayment, provision of additional collateral, or higher
interest payments. Likewise, they do not contain rating
triggers.
RWE issues hybrid bond in Switzerland. We have become
the first German industrial enterprise to issue a hybrid bond
in Switzerland, which also contributed to further improving
our capital structure. The issuance totalled CHF 250 million.
The RWE bond has a 5.25 % annual coupon at an issue rate
of 100 %, with a tenor of slightly more than 60 years. We can
redeem it no earlier than April 2017. Eligible subscribers
were exclusively private investors domiciled in Switzerland as
well as institutional investors. Hybrid bonds are a mix of
equity and debt financing. They are recognised in our net
debt on a 50 % basis. This is in line with the procedure
followed by the rating agencies. Deviating from this,
International Financial Reporting Standards (IFRS) may
stipulate that the bonds be fully classified as equity or debt,
depending on the terms and conditions. Due to its limited
tenor, our Swiss hybrid bond must be fully recognised as
debt on the IFRS balance sheet. Conversely, the €1.75 billion
hybrid bond we issued in September 2010 is classified as
equity due to its theoretically perpetual tenor.
€16.9 billion in bonds were outstanding at the end of 2011.
Apart from the Swiss hybrid bond, RWE did not issue any
bonds in 2011. We redeemed €1.5 billion in bonds. In the
financial year being reviewed, the total volume of our bonds
outstanding thus declined by €1.1 billion to €16.9 billion
(including hybrid bonds). Currency effects played a role in
addition to the hybrid issuance and the redemptions. Our
bonds outstanding are denominated in euros, sterling, Swiss
francs, US dollars and Japanese yen. We concluded hedges to
manage our currency exposure. Taking such transactions into
account, at the balance sheet date, our debt broke down into
72 % in euros and 28 % in sterling. This means that we did not
have any currency exposure from capital market debt in
US dollars, Swiss francs or in yen. Our bonds’ initial tenors
1.7 FiNaNCial pOSiTiON aNd NET wOrTH
Companies seeking to grow in difficult times need robust financing. Thanks to our good creditworthiness, we can procure
debt capital at favourable conditions. To safeguard this position, we intend to secure our financial power. In view of the
heavy burdens resulting from the resolutions passed by the German government on nuclear energy, we conducted a capital
increase in December 2011. The most important mainstay of our financing is and will continue to be our high cash flows
from operating activities, which amounted to €5.5 billion in 2011, matching the good level posted in the previous year.
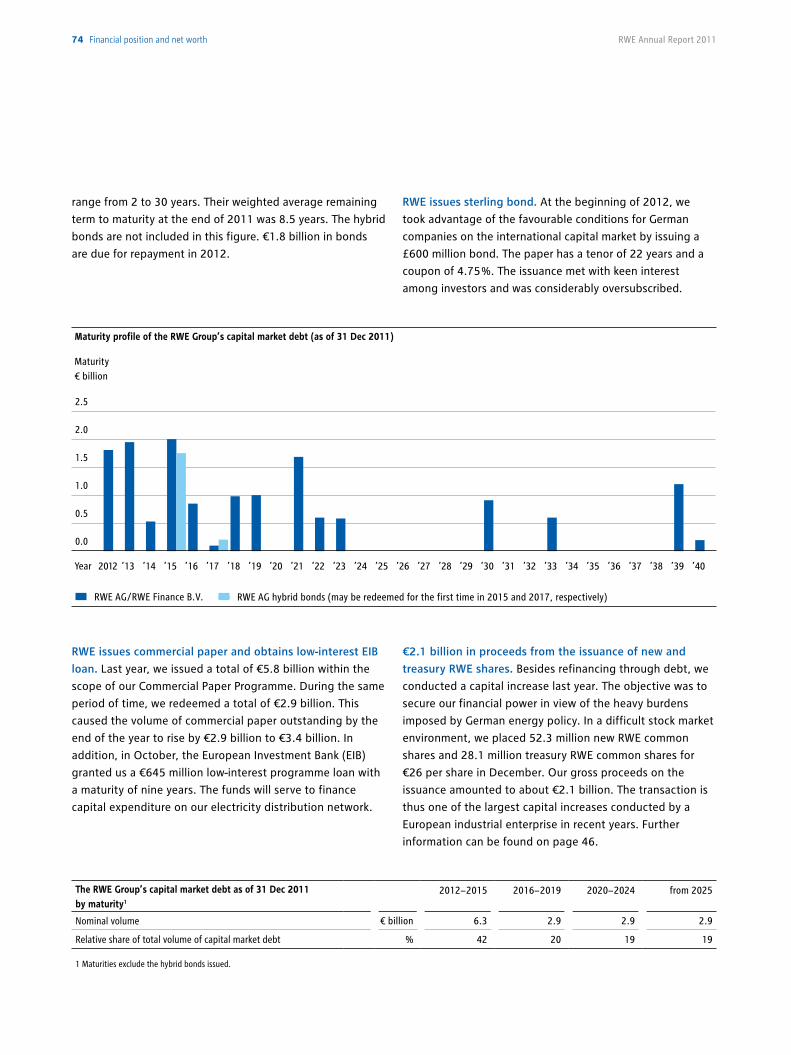
RWE Annual Report 201174 Financial position and net worth
The RWE Group’s capital market debt as of 31 Dec 2011by maturity1
2012− 2015 2016− 2019 2020− 2024 from 2025
Nominal volume € billion 6.3 2.9 2.9 2.9
Relative share of total volume of capital market debt % 42 20 19 19
1 Maturities exclude the hybrid bonds issued.
RWE issues commercial paper and obtains low-interest EIB
loan. Last year, we issued a total of €5.8 billion within the
scope of our Commercial Paper Programme. During the same
period of time, we redeemed a total of €2.9 billion. This
caused the volume of commercial paper outstanding by the
end of the year to rise by €2.9 billion to €3.4 billion. In
addition, in October, the European Investment Bank (EIB)
granted us a €645 million low-interest programme loan with
a maturity of nine years. The funds will serve to finance
capital expenditure on our electricity distribution network.
€2.1 billion in proceeds from the issuance of new and
treasury RWE shares. Besides refinancing through debt, we
conducted a capital increase last year. The objective was to
secure our financial power in view of the heavy burdens
imposed by German energy policy. In a difficult stock market
environment, we placed 52.3 million new RWE common
shares and 28.1 million treasury RWE common shares for
€26 per share in December. Our gross proceeds on the
issuance amounted to about €2.1 billion. The transaction is
thus one of the largest capital increases conducted by a
European industrial enterprise in recent years. Further
information can be found on page 46.
range from 2 to 30 years. Their weighted average remaining
term to maturity at the end of 2011 was 8.5 years. The hybrid
bonds are not included in this figure. €1.8 billion in bonds
are due for repayment in 2012.
RWE issues sterling bond. At the beginning of 2012, we
took advantage of the favourable conditions for German
companies on the international capital market by issuing a
£600 million bond. The paper has a tenor of 22 years and a
coupon of 4.75 %. The issuance met with keen interest
among investors and was considerably oversubscribed.
Maturity profile of the RWE Group’s capital market debt (as of 31 Dec 2011)
Maturity€ billion
Year
RWE AG/RWE Finance B.V.
2.5
2.0
1.5
1.0
0.5
0.0
2012 ’13 ’14 ’15 ’16 ’17 ’18 ’19 ’20 ’21 ’22 ’23 ’24 ’25 ’26 ’27 ’28 ’29 ’30 ’31 ’32 ’33 ’34 ’35 ’36 ’37 ’38 ’39 ’40
RWE AG hybrid bonds (may be redeemed for the first time in 2015 and 2017, respectively)
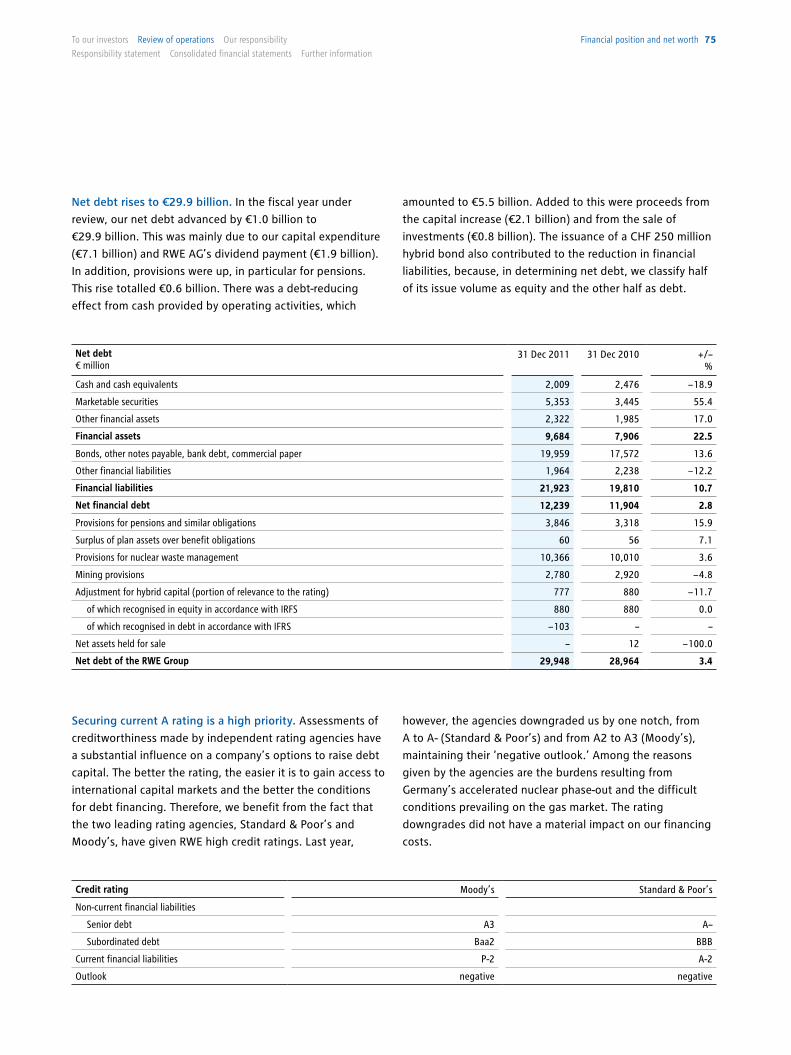
To our investors Review of operations our responsibility
Responsibility statement consolidated financial statements Further information
Financial position and net worth 75
Net debt € million
31 Dec 2011 31 Dec 2010 +/– %
Cash and cash equivalents 2,009 2,476 − 18.9
Marketable securities 5,353 3,445 55.4
Other financial assets 2,322 1,985 17.0
Financial assets 9,684 7,906 22.5
Bonds, other notes payable, bank debt, commercial paper 19,959 17,572 13.6
Other financial liabilities 1,964 2,238 − 12.2
Financial liabilities 21,923 19,810 10.7
Net financial debt 12,239 11,904 2.8
Provisions for pensions and similar obligations 3,846 3,318 15.9
Surplus of plan assets over benefit obligations 60 56 7.1
Provisions for nuclear waste management 10,366 10,010 3.6
Mining provisions 2,780 2,920 − 4.8
Adjustment for hybrid capital (portion of relevance to the rating) 777 880 − 11.7
of which recognised in equity in accordance with IRFS 880 880 0.0
of which recognised in debt in accordance with IFRS − 103 – –
Net assets held for sale – 12 − 100.0
Net debt of the RWE Group 29,948 28,964 3.4
Securing current A rating is a high priority. Assessments of
creditworthiness made by independent rating agencies have
a substantial influence on a company’s options to raise debt
capital. The better the rating, the easier it is to gain access to
international capital markets and the better the conditions
for debt financing. Therefore, we benefit from the fact that
the two leading rating agencies, Standard & Poor’s and
Moody’s, have given RWE high credit ratings. Last year,
Net debt rises to €29.9 billion. In the fiscal year under
review, our net debt advanced by €1.0 billion to
€29.9 billion. This was mainly due to our capital expenditure
(€7.1 billion) and RWE AG’s dividend payment (€1.9 billion).
In addition, provisions were up, in particular for pensions.
This rise totalled €0.6 billion. There was a debt-reducing
effect from cash provided by operating activities, which
however, the agencies downgraded us by one notch, from
A to A- (Standard & Poor’s) and from A2 to A3 (Moody’s),
maintaining their ‘negative outlook.’ Among the reasons
given by the agencies are the burdens resulting from
Germany’s accelerated nuclear phase-out and the difficult
conditions prevailing on the gas market. The rating
downgrades did not have a material impact on our financing
costs.
amounted to €5.5 billion. Added to this were proceeds from
the capital increase (€2.1 billion) and from the sale of
investments (€0.8 billion). The issuance of a CHF 250 million
hybrid bond also contributed to the reduction in financial
liabilities, because, in determining net debt, we classify half
of its issue volume as equity and the other half as debt.
Credit rating Moody’s Standard & Poor’s
Non-current financial liabilities
Senior debt A3 A–
Subordinated debt Baa2 BBB
Current financial liabilities P-2 A-2
Outlook negative negative
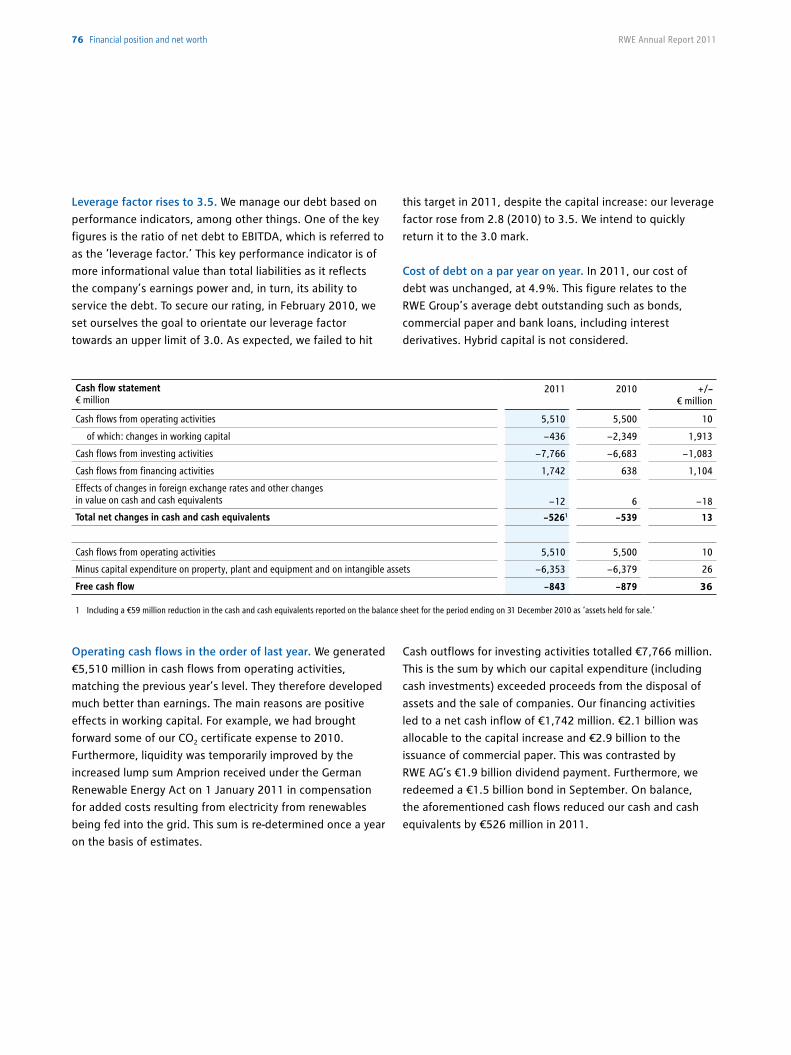
RWE Annual Report 201176 Financial position and net worth
Operating cash flows in the order of last year. We generated
€5,510 million in cash flows from operating activities,
matching the previous year’s level. They therefore developed
much better than earnings. The main reasons are positive
effects in working capital. For example, we had brought
forward some of our CO2 certificate expense to 2010.
Furthermore, liquidity was temporarily improved by the
increased lump sum Amprion received under the German
Renewable Energy Act on 1 January 2011 in compensation
for added costs resulting from electricity from renewables
being fed into the grid. This sum is re-determined once a year
on the basis of estimates.
Cash outflows for investing activities totalled €7,766 million.
This is the sum by which our capital expenditure (including
cash investments) exceeded proceeds from the disposal of
assets and the sale of companies. Our financing activities
led to a net cash inflow of €1,742 million. €2.1 billion was
allocable to the capital increase and €2.9 billion to the
issuance of commercial paper. This was contrasted by
RWE AG’s €1.9 billion dividend payment. Furthermore, we
redeemed a €1.5 billion bond in September. On balance,
the aforementioned cash flows reduced our cash and cash
equivalents by €526 million in 2011.
Leverage factor rises to 3.5. We manage our debt based on
performance indicators, among other things. One of the key
figures is the ratio of net debt to EBITDA, which is referred to
as the ‘leverage factor.’ This key performance indicator is of
more informational value than total liabilities as it reflects
the company’s earnings power and, in turn, its ability to
service the debt. To secure our rating, in February 2010, we
set ourselves the goal to orientate our leverage factor
towards an upper limit of 3.0. As expected, we failed to hit
this target in 2011, despite the capital increase: our leverage
factor rose from 2.8 (2010) to 3.5. We intend to quickly
return it to the 3.0 mark.
Cost of debt on a par year on year. In 2011, our cost of
debt was unchanged, at 4.9 %. This figure relates to the
RWE Group’s average debt outstanding such as bonds,
commercial paper and bank loans, including interest
derivatives. Hybrid capital is not considered.
Cash flow statement€ million
2011 2010 +/– € million
Cash flows from operating activities 5,510 5,500 10
of which: changes in working capital − 436 − 2,349 1,913
Cash flows from investing activities − 7,766 − 6,683 − 1,083
Cash flows from financing activities 1,742 638 1,104
Effects of changes in foreign exchange rates and other changes in value on cash and cash equivalents − 12 6 − 18
Total net changes in cash and cash equivalents − 5261 − 539 13
Cash flows from operating activities 5,510 5,500 10
Minus capital expenditure on property, plant and equipment and on intangible assets − 6,353 − 6,379 26
Free cash flow − 843 − 879 36
1 Including a €59 million reduction in the cash and cash equivalents reported on the balance sheet for the period ending on 31 December 2010 as ‘assets held for sale.‘
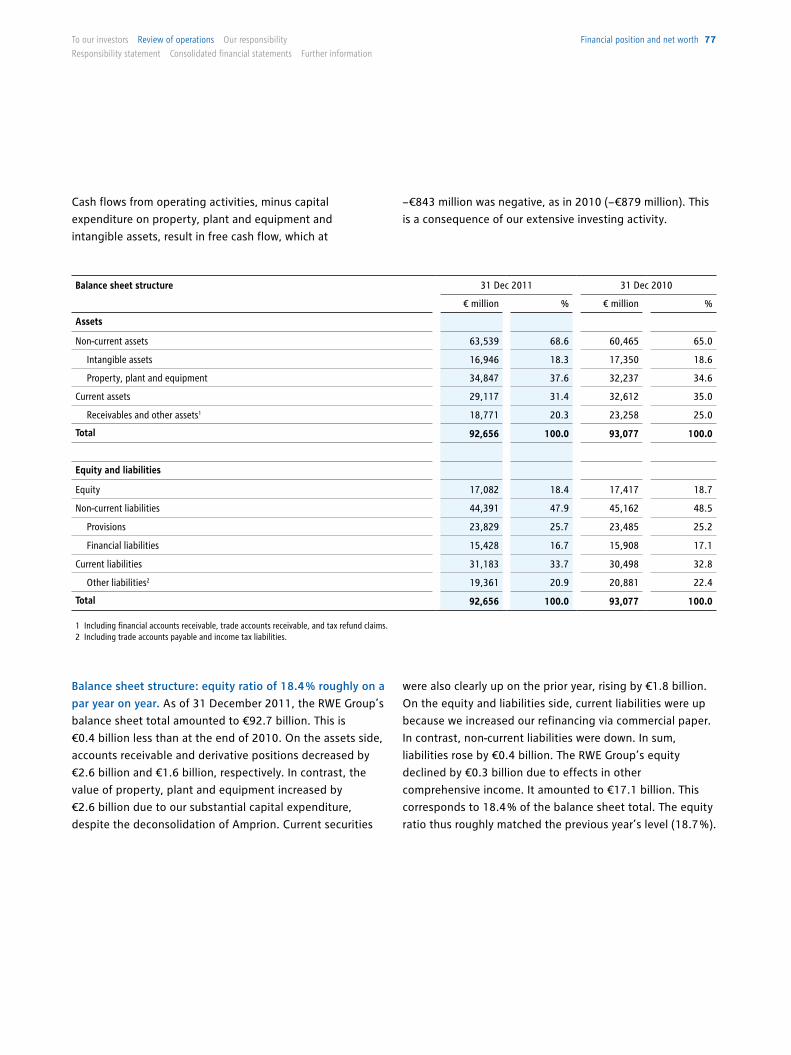
To our investors Review of operations our responsibility
Responsibility statement consolidated financial statements Further information
Financial position and net worth 77
Balance sheet structure 31 Dec 2011 31 Dec 2010
€ million % € million %
Assets
Non-current assets 63,539 68.6 60,465 65.0
Intangible assets 16,946 18.3 17,350 18.6
Property, plant and equipment 34,847 37.6 32,237 34.6
Current assets 29,117 31.4 32,612 35.0
Receivables and other assets1 18,771 20.3 23,258 25.0
Total 92,656 100.0 93,077 100.0
Equity and liabilities
Equity 17,082 18.4 17,417 18.7
Non-current liabilities 44,391 47.9 45,162 48.5
Provisions 23,829 25.7 23,485 25.2
Financial liabilities 15,428 16.7 15,908 17.1
Current liabilities 31,183 33.7 30,498 32.8
Other liabilities2 19,361 20.9 20,881 22.4
Total 92,656 100.0 93,077 100.0
1 Including financial accounts receivable, trade accounts receivable, and tax refund claims. 2 Including trade accounts payable and income tax liabilities.
Balance sheet structure: equity ratio of 18.4 % roughly on a
par year on year. As of 31 December 2011, the RWE Group’s
balance sheet total amounted to €92.7 billion. This is
€0.4 billion less than at the end of 2010. On the assets side,
accounts receivable and derivative positions decreased by
€2.6 billion and €1.6 billion, respectively. In contrast, the
value of property, plant and equipment increased by
€2.6 billion due to our substantial capital expenditure,
despite the deconsolidation of Amprion. Current securities
were also clearly up on the prior year, rising by €1.8 billion.
On the equity and liabilities side, current liabilities were up
because we increased our refinancing via commercial paper.
In contrast, non-current liabilities were down. In sum,
liabilities rose by €0.4 billion. The RWE Group’s equity
declined by €0.3 billion due to effects in other
comprehensive income. It amounted to €17.1 billion. This
corresponds to 18.4 % of the balance sheet total. The equity
ratio thus roughly matched the previous year’s level (18.7 %).
Cash flows from operating activities, minus capital
expenditure on property, plant and equipment and
intangible assets, result in free cash flow, which at
− €843 million was negative, as in 2010 (− €879 million). This
is a consequence of our extensive investing activity.
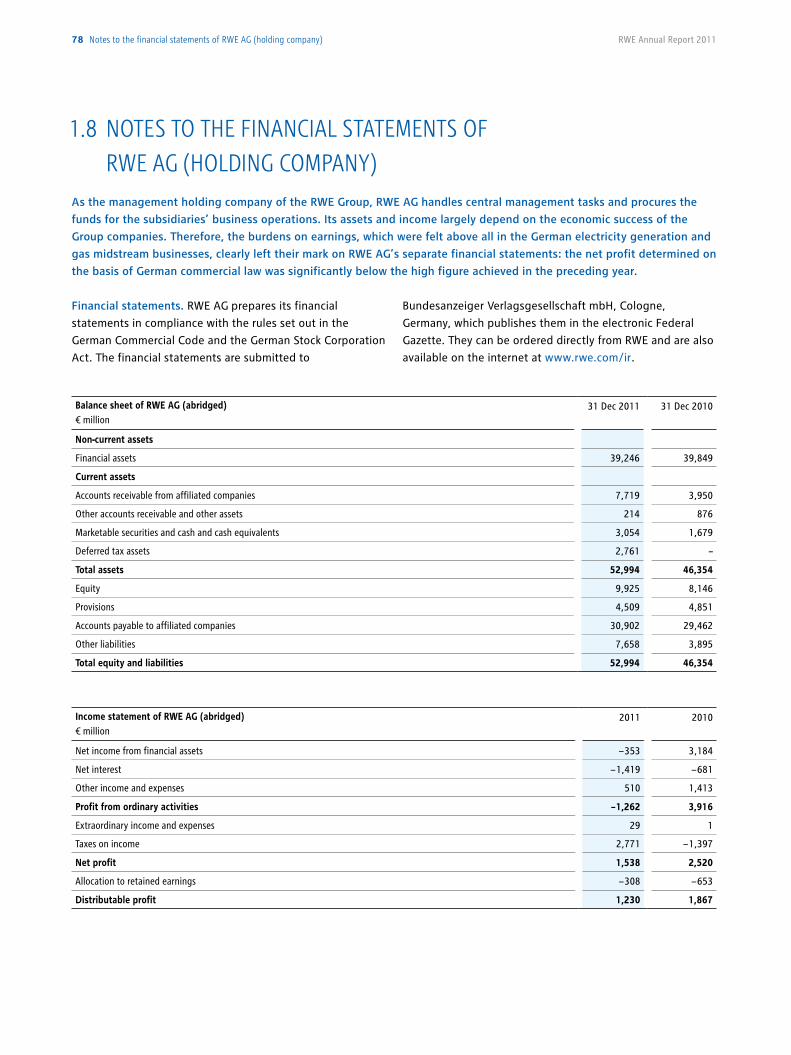
Financial statements. RWE AG prepares its financial
statements in compliance with the rules set out in the
German Commercial Code and the German Stock Corporation
Act. The financial statements are submitted to
As the management holding company of the RWE Group, RWE AG handles central management tasks and procures the
funds for the subsidiaries’ business operations. Its assets and income largely depend on the economic success of the
Group companies. Therefore, the burdens on earnings, which were felt above all in the German electricity generation and
gas midstream businesses, clearly left their mark on RWE AG’s separate financial statements: the net profit determined on
the basis of German commercial law was significantly below the high figure achieved in the preceding year.
Bundesanzeiger Verlagsgesellschaft mbH, Cologne,
Germany, which publishes them in the electronic Federal
Gazette. They can be ordered directly from RWE and are also
available on the internet at www.rwe.com/ir .
1.8 NOTES TO THE FiNaNCial STaTEMENTS OF rwE ag (HOldiNg COMpaNY)
Balance sheet of RWE AG (abridged)€ million
31 Dec 2011 31 Dec 2010
Non-current assets
Financial assets 39,246 39,849
Current assets
Accounts receivable from affiliated companies 7,719 3,950
Other accounts receivable and other assets 214 876
Marketable securities and cash and cash equivalents 3,054 1,679
Deferred tax assets 2,761 –
Total assets 52,994 46,354
Equity 9,925 8,146
Provisions 4,509 4,851
Accounts payable to affiliated companies 30,902 29,462
Other liabilities 7,658 3,895
Total equity and liabilities 52,994 46,354
Income statement of RWE AG (abridged)€ million
2011 2010
Net income from financial assets − 353 3,184
Net interest − 1,419 − 681
Other income and expenses 510 1,413
Profit from ordinary activities − 1,262 3,916
Extraordinary income and expenses 29 1
Taxes on income 2,771 − 1,397
Net profit 1,538 2,520
Allocation to retained earnings − 308 − 653
Distributable profit 1,230 1,867
78 notes to the financial statements of RWe aG (holding company) RWE Annual Report 2011
Assets. RWE AG had €53.0 billion in total assets as of
31 December 2011, up 14 % year on year. This is in part
due to the fact that several Group companies had an
increased need for financial resources, which resulted in
a rise in accounts receivable by the holding company
from these entities. In 2011, the holding company
increasingly refinanced itself through the issuance of
commercial paper. This was reflected in a rise in other
liabilities. Another reason for the growth in total assets
was that we exercised our discretionary right to capitalise
deferred taxes in 2011. Furthermore, there was a rise
in marketable securities and cash and cash equivalents.
The backdrop to this is that we conducted a capital
increase and sold RWE treasury shares in December.
As of 31 December 2011, the equity ratio was 18.7 %,
compared to 17.6 % in the preceding year.
Financial position. To raise funds on the bond market, RWE
usually uses the services of its subsidiary RWE Finance B.V.,
which conducts issuances backed by RWE AG. Besides the
aforementioned issuance of new and treasury RWE shares,
which generated gross proceeds of €2.1 billion, the issuance
of a hybrid bond in October had a positive effect on the
financial position. The issuance totalled CHF 250 million,
and the bond has a tenor of slightly over 60 years. As of
31 December 2011, there was a total of €16.9 billion and
€3.4 billion in bonds and commercial paper outstanding,
compared to €18.1 billion and €0.5 billion in the preceding
year. In January 2012, a further bond was placed on the
market, with an issue volume of £600 million and a term to
maturity of 22 years. In addition, a €4.0 billion syndicated
credit line granted us by a group of banks, which we have
not made use of so far, serves as a liquidity reserve.
Earnings position. At €1,538 million, net profit was
markedly lower than in the prior year. Net income from
financial assets declined substantially. The contribution
made by RWE Power was much smaller than in 2010. The
decisive factors were the reduction in the lifetimes of our
German nuclear power plants, the new nuclear fuel tax, the
decline in margins in the electricity generation business
and the effects on earnings from hedges. An unusually weak
performance in energy trading and heavy burdens in the
gas midstream business caused RWE AG to appropriate
substantial losses from RWE Supply & Trading. The declines in
earnings recorded by RWE Power and RWE Supply & Trading
were more significant in the separate financial statements
complying with the German Commercial Code than in the
consolidated financial statements according to IFRS. This is
due to differing accounting standards.
Net interest also decreased. The main reason for this was
losses on securities used to hedge pension obligations. In
the previous year, we had generated income from such
securities. The ‘other income and expenses’ item also
deteriorated, especially due to a reduction in income tax
apportionments from subsidiaries. The fact that the current
tax expense also dropped and that deferred taxes were
capitalised for the first time, in the amount of €2.8 billion,
had a positive effect.
Appropriation of distributable profit. The Supervisory and
Executive Boards of RWE AG will propose to the Annual
General Meeting on 19 April 2012 that a dividend of €2
per share be paid for fiscal 2011. Relative to the Group’s
recurrent net income, this equates to a payout ratio of 50 %.
Corporate Governance Declaration in accordance with
Sec. 289a of the German Commercial Code. The Executive
Board of RWE Aktiengesellschaft issued a corporate
governance statement in accordance with Sec. 289a of the
German Commercial Code on 16 February 2012 and
published it on the internet at www.rwe.com/corporate-
governance-declaration-sec-289a-HGB .
notes to the financial statements of RWe aG (holding company) 79To our investors Review of operations our responsibility
Responsibility statement consolidated financial statements Further information
Composition of the subscribed capital. Since the capital
increase was entered in the Commercial Register on
7 December 2011, RWE AG’s subscribed capital has
consisted of 575,745,499 no-par-value common shares in
the name of the bearer and 39,000,000 no-par-value
preferred shares in the name of the bearer without voting
rights. They account for 93.66 % and 6.34 % of the
subscribed capital, respectively. Holders of preferred shares
are given priority when distributable profit is distributed.
Pursuant to the Articles of Incorporation, it is appropriated
in the following order: 1) to make back payments on shares
of the profit allocable to preferred shares from preceding
years; 2) to pay a preferred share of the profit of €0.13 per
preferred share; 3) to pay the share of the profit allocable to
common shares of up to €0.13 per common share; and 4) to
make consistent payments of potential further portions of
the profit allocable to common and preferred shares unless
the Annual General Meeting decides in favour of a different
appropriation. The composition of the subscribed capital
and the rights and obligations of the shareholders comply
with the requirements of the law and the Articles of
Incorporation.
Shares in capital accounting for more than 10 % of the
voting rights. As of 31 December 2011, one holding in
RWE AG exceeded 10 % of the voting rights. It is held by
RW Energie-Beteiligungsgesellschaft mbH & Co. KG, which
is headquartered in Dortmund. In compliance with Sec. 21,
Para. 1 of the German Securities Trading Act, on
21 December 2007, the company informed us that it
held 16.089 % of RWE AG’s voting stock at the time.
Within the scope of the capital increase conducted in
December 2011, Deutsche Bank AG, headquartered in
Frankfurt am Main, temporarily held a stake exceeding the
10 % threshold. Pursuant to the German Securities Trading
Act, Deutsche Bank informed us on 12 December 2011
that it held 71,416,748 voting rights on 7 December,
corresponding to 12.4 % of the voting rights. At the same
time, the bank informed us that its share of voting rights
had fallen back under the 10 % threshold on 8 December.
The following disclosure is in accordance with Sec. 315, Para. 4 and Sec. 289, Para. 4 of the German Commercial Code as
well as with Sec. 176, Para. 1, Sentence 1 of the German Stock Corporation Act. The information relates, among other
things, to issues that may play a role in obtaining control over a company as well as executive board authorisations to
change a company’s capital structure. All of the rules are in line with the standards generally accepted by German listed
companies.
In accordance with Sec. 27a, Para. 1 of the German Securities
Trading Act, Deutsche Bank declared that the technical
implementation of RWE AG’s capital increase was the only
reason for the purchase of voting stock, which temporarily
caused it to exceed the reportable threshold of 10 %.
Appointment and dismissal of Executive Board members /
amendments to the Articles of Incorporation. Executive
Board members are appointed and dismissed in accordance
with Sec. 84 et seq. of the German Stock Corporation Act in
connection with Sec. 31 of the German Co-Determination
Act. Amendments to the Articles of Incorporation are made
pursuant to Sec. 179 et seqq. of the German Stock
Corporation Act in connection with Art. 16, Para. 6 of the
Articles of Incorporation of RWE AG. According to Art. 16,
Para. 6 of the Articles of Incorporation, unless otherwise
required by law or in the Articles of Incorporation, the
Annual General Meeting shall adopt all resolutions with a
simple majority of the votes cast; if a majority of the capital
stock represented is required, the simple majority shall
suffice. The legal right to determine a majority of the capital
required to amend the Articles of Incorporation that differs
from the majority required by law was thus exercised.
Pursuant to Art. 10, Para. 9 of the Articles of Incorporation,
the Supervisory Board is authorised to pass resolutions to
amend the Articles of Incorporation that only concern the
wording, without changing the content.
Executive Board authorisations to conduct share buybacks.
Pursuant to the resolution passed by the Annual General
Meeting on 20 April 2011, the Executive Board was
authorised to purchase shares of any class in the company
until 19 October 2012, totalling up to 10 % of the share
capital when the Annual General Meeting passed the
resolution or – if the following is lower – when the
authorisation is exercised. The purchase may be limited to
shares of a single class. It is at the Executive Board’s
discretion to purchase the shares on the stock market or by
making a public call for shares. This can be done through the
use of put or call options. The treasury shares may then be
called in.
1.9 diSClOSurE rElaTiNg TO gErMaN TakEOvEr law
80 disclosure relating to German takeover law RWE Annual Report 2011
If common shares are bought back, they can also be
transferred to third parties within the scope of mergers or
acquisitions of companies, parts of companies or stakes in
companies, or sold in another manner. A sale not conducted
on the stock exchange or via a tender to all shareholders
may only be made in exchange for cash. Moreover, the price
at the time of sale may not be significantly lower than the
stock-market price for common shares bearing the same
rights. The company may use common shares bought back
to redeem convertible and option bonds issued on the basis
of the resolutions passed by the Annual General Meeting
held on 22 April 2009. The company may also use the
common shares bought back to meet obligations arising
from employee stock ownership plans. The authorisations
may be exercised in full or in part and also for partial
amounts. Within the scope of the capital increase conducted
in December 2011, 28,105,327 treasury shares were sold on
the basis of the authorisations in effect. This corresponds to
4.57 % of the company’s subscribed capital.
Executive Board authorisation for the issuance of option
and convertible bonds. Pursuant to the resolution passed by
the Annual General Meeting on 22 April 2009, the Executive
Board is authorised to issue option or convertible bonds
until 21 April 2014. The bonds’ combined nominal value is
limited to €6 billion. The shareholders’ subscription rights
can be excluded if the bonds are issued at a price in line
with the market and the new shares do not account for more
than 10 % of the share capital when the Annual General
Meeting passed the resolution or – if the following is lower –
when the authorisation is exercised. The 10 % limit is
calculated taking into account other cash capital measures
under exclusion of subscription rights, such as the cash
capital increase from authorised capital conducted in
December 2011. The Executive Board may also exclude the
shareholders’ subscription rights in order to prevent the
number of shares allocated from the subscription resulting in
fractional amounts (fractions of shares). Furthermore, the
subscription rights of holders of convertible or option bonds
already issued may be excluded. They may be granted
subscription rights commensurate to the rights to which they
would be entitled as shareholders on conversion of the bond
or on exercise of the option. Pursuant to Art. 4, Paras. 3a
and 3b of the Articles of Incorporation, €143,975,680 in
conditional capital, divided among 56,240,500 common
shares in the name of the bearer, may be used to exercise
conversion or option rights.
Executive Board authorisations for the issuance of new
shares. In December 2011, RWE AG issued 52,340,499 new
common shares in the name of the bearer from authorised
capital in exchange for a cash contribution and excluding
shareholders’ subscription rights. As a result, the capital
stock was increased by €133,991,677.44 to
€1,573,748,477.44. The Executive Board is now authorised
to increase the company’s capital stock with the Supervisory
Board’s approval by up to €153,959,682.56 until 16 April
2013 either at once or in several increments through the
issuance of common shares in the name of the bearer in
exchange for contributions in cash or in kind (authorised
capital). The shareholders’ subscription rights can be
excluded with the Supervisory Board’s approval, in order to
avoid allocating fractions of shares as a result of the
subscription. The subscription rights can also be excluded in
order to issue shares in exchange for contributions in kind
within the scope of mergers or for the purpose of acquiring
stakes in companies. Subscription rights can also be
excluded in the event of a cash capital increase if the price
at which the new shares are issued is not significantly lower
than the price at which shares outstanding are traded on the
stock market, and if the portion of the capital stock
accounted for by the new shares, for which subscription
rights are excluded, does not exceed 10 % of the share
capital in total. We already made use of most of this
amount by implementing the cash capital increase in
December 2011.
The Executive Board shall be empowered, subject to the
consent of the Supervisory Board, to determine the further
details and conditions of the share issuance. Shares from
authorised capital are added to shares from conditional
capital in cases where they are both issued excluding the
shareholders’ subscription rights.
Effects of a change of control on debt financing. RWE AG’s
syndicated credit line has a change of control clause
including the following main provisions: in the event of a
change of control or majority at RWE, further drawings are
suspended until further notice. The lenders shall enter into
disclosure relating to German takeover law 81To our investors Review of operations our responsibility
Responsibility statement consolidated financial statements Further information
negotiations with us on a continuation of the credit line.
Should we fail to reach an agreement with the majority of
them within 30 days from such a change of control, the
lenders may cancel the line of credit.
RWE’s non-subordinated bonds also have a change of
control clause: in the event of a change of control in
conjunction with a drop in RWE AG’s credit rating below
investment-grade status, creditors may demand immediate
redemption. The redemption amount is calculated on the
basis of the corresponding bond conditions. Our
€1.75 billion and CHF 250 million hybrid bonds also have
change of control clauses. We have the right to cancel and
redeem them within the defined change of control period. If
they are not redeemed and the credit rating drops below
investment-grade status during the change of control
period, the annual compensation payable on the hybrid
bonds increases by 500 basis points.
Effects of a change of control on Executive Board and
executive compensation. Members of the Executive Board
of RWE AG have a special right of termination in the event
of a change of control. On exercise of this right, they
receive a one-off payment covering the contract’s agreed
term, which shall correspond to at least twice and no more
than three times their annual contractual compensation.
This is in line with the requirements of the German Corporate
Governance Code, which has been in force since 2008.
Dr. Jürgen Großmann was granted a special right of
termination before these Code rules became effective. His
employment contract provides for a one-off payment that
covers all of the remuneration due until the end of the
contractual term as well as the sum contractually agreed
instead of a pension commitment.
Furthermore, in the event of a change of control, retained
Executive Board bonuses are prematurely valued and
possibly paid. This is done on the basis of the average bonus
malus factor of the three preceding years. This is what
determines whether retained bonuses are paid out and the
amount of the payout. You will find detailed information on
this topic on page 109 et seq.
The 2005 long-term incentive plan (Beat) and the 2010 RWE
performance share plan (Beat 2010) for the Executive Board
and executives of RWE AG and of affiliated companies
include a provision for a change of control. In such events,
all holders of performance shares receive a compensatory
payment. It is determined by multiplying the price paid for
RWE shares as part of the takeover by the final number of
performance shares as of the date of the takeover offer, in
line with the corresponding plan conditions.
Provisions are in line with generally accepted standards.
The authorisation to conduct share buybacks and the
authorised capital are in line with standards generally
accepted by German listed companies. The same applies to
the provisions governing changes of control, in particular
clauses included in the contracts governing the syndicated
credit line, the RWE bonds and Executive Board
compensation.
82 disclosure relating to German takeover law RWE Annual Report 2011
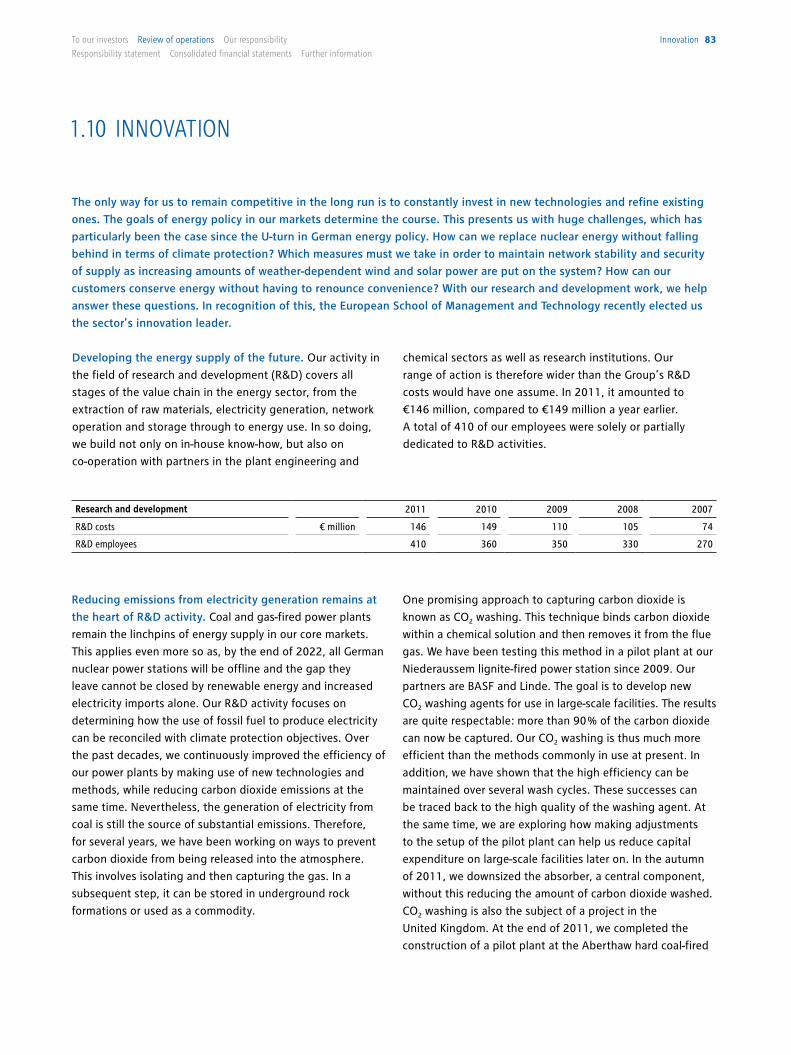
Developing the energy supply of the future. Our activity in
the field of research and development (R&D) covers all
stages of the value chain in the energy sector, from the
extraction of raw materials, electricity generation, network
operation and storage through to energy use. In so doing,
we build not only on in-house know-how, but also on
co-operation with partners in the plant engineering and
chemical sectors as well as research institutions. Our
range of action is therefore wider than the Group’s R&D
costs would have one assume. In 2011, it amounted to
€146 million, compared to €149 million a year earlier.
A total of 410 of our employees were solely or partially
dedicated to R&D activities.
Reducing emissions from electricity generation remains at
the heart of R&D activity. Coal and gas-fired power plants
remain the linchpins of energy supply in our core markets.
This applies even more so as, by the end of 2022, all German
nuclear power stations will be offline and the gap they
leave cannot be closed by renewable energy and increased
electricity imports alone. Our R&D activity focuses on
determining how the use of fossil fuel to produce electricity
can be reconciled with climate protection objectives. Over
the past decades, we continuously improved the efficiency of
our power plants by making use of new technologies and
methods, while reducing carbon dioxide emissions at the
same time. Nevertheless, the generation of electricity from
coal is still the source of substantial emissions. Therefore,
for several years, we have been working on ways to prevent
carbon dioxide from being released into the atmosphere.
This involves isolating and then capturing the gas. In a
subsequent step, it can be stored in underground rock
formations or used as a commodity.
1.10 iNNOvaTiON
Research and development 2011 2010 2009 2008 2007
R&D costs € million 146 149 110 105 74
R&D employees 410 360 350 330 270
One promising approach to capturing carbon dioxide is
known as CO2 washing. This technique binds carbon dioxide
within a chemical solution and then removes it from the flue
gas. We have been testing this method in a pilot plant at our
Niederaussem lignite-fired power station since 2009. Our
partners are BASF and Linde. The goal is to develop new
CO2 washing agents for use in large-scale facilities. The results
are quite respectable: more than 90 % of the carbon dioxide
can now be captured. Our CO2 washing is thus much more
efficient than the methods commonly in use at present. In
addition, we have shown that the high efficiency can be
maintained over several wash cycles. These successes can
be traced back to the high quality of the washing agent. At
the same time, we are exploring how making adjustments
to the setup of the pilot plant can help us reduce capital
expenditure on large-scale facilities later on. In the autumn
of 2011, we downsized the absorber, a central component,
without this reducing the amount of carbon dioxide washed.
CO2 washing is also the subject of a project in the
United Kingdom. At the end of 2011, we completed the
construction of a pilot plant at the Aberthaw hard coal-fired
The only way for us to remain competitive in the long run is to constantly invest in new technologies and refine existing
ones. The goals of energy policy in our markets determine the course. This presents us with huge challenges, which has
particularly been the case since the U-turn in German energy policy. How can we replace nuclear energy without falling
behind in terms of climate protection? Which measures must we take in order to maintain network stability and security
of supply as increasing amounts of weather-dependent wind and solar power are put on the system? How can our
customers conserve energy without having to renounce convenience? With our research and development work, we help
answer these questions. In recognition of this, the European School of Management and Technology recently elected us
the sector’s innovation leader.
innovation 83To our investors Review of operations our responsibility
Responsibility statement consolidated financial statements Further information
power station where we will test detergents that are
different than the ones in use in Niederaussem. Within the
scope of another project, we have already tested the entire
process, from capture via transport to the storage of carbon
dioxide. We assisted in operating an American Electric Power
demonstration plant at the Mountaineer site in New Haven
(USA) for nearly two years, using technology developed
by Alstom. The project provided us with valuable knowledge.
Our goal is to be in a position to use CO2 washing
commercially no later than 2020.
Carbon dioxide – from pollutant to commodity. Capturing
the carbon dioxide is only the first step. In addition, the gas
must be kept from the atmosphere permanently. Germany
still lacks a sufficient legal basis for storing the gas, for
example in rock formations deep under the surface of the
earth. Another obstacle is the lack of acceptance that exists
in and outside Germany. Therefore, we are taking another
step forward: we are investigating how to turn a harmful
greenhouse gas into a valuable commodity in times of
increasingly scarce resources, although the emission
reduction potential of this method is much lower than
through storage. Our ideas centre on how to use carbon
dioxide as an alternative to oil as a source of carbon for
chemical intermediates and in energy conversion. Three
projects which we launched in 2010 are dedicated to this.
The first undertaking involves using micro-organisms to
convert carbon dioxide to biomass, bio-plastics and chemical
intermediates. Our co-operation partner BRAIN is a leader in
the field of ‘white biotechnology,’ the term that designates
the use of biotech methods in industrial production. The first
important finding from the project is that micro-organisms
absorb carbon dioxide from flue gas even under the
conditions that prevail in power plants.
In a second project, entitled Dream Production, we have
joined forces with Bayer and RWTH Aachen University to
look into ways to manufacture high-quality plastics from
CO2. To supply our project partners with carbon dioxide, in
2011, we expanded the pilot plant at Niederaussem to
include units for processing and liquefying CO2 as well as
storing it in containers. We received special recognition for
our pioneering work: the German Sustainability Award
Foundation ranked Dream Production among the top 3 in
the Germany’s Most Sustainable Initiative category.
Our third project is called CO2RRECT, which we are
developing in conjunction with experts from Siemens and
Bayer as well as several universities and research institutes.
Centre stage is taken by the concept of making use of an
oversupply of electricity from renewables in order to
permanently integrate carbon dioxide into chemical
intermediates. To this end, hydrogen is produced from water
through electrolysis and is then brought into contact with
CO2. The result is hydrocarbons that serve as a basis for
chemical intermediates such as carbon monoxide. In this
manner, carbon dioxide can be used as a starting material
for producing household goods and CDs. One of
CO2RRECT’s special features is that it aims to flexibly adapt
production to the availability of electricity from renewables.
Siemens will build a highly flexible electrolysis unit in the
Niederaussem power station this year.
Construction of an ocean current power generation plant in
Scotland. Our R&D activity in the field of electricity
production also addresses energy from renewables. We are
taking various approaches in this area, such as making
commercial use of the energy of the sea. Together with the
hydroelectric power specialist Voith Hydro, we are installing
a 1 megawatt (MW) ocean current turbine in the waters of
the Orkney Islands (Scotland). We have already anchored the
turbine’s foundation in the seabed. The facility is scheduled
to begin a two-year test phase starting in 2012. We hope
that this will provide us with new findings on the operation
of ocean current power generation facilities.
84 innovation RWE Annual Report 2011
Improved noise abatement for porpoises during
construction of offshore wind farms. Another focal point of
research activity is the development of noise abatement
methods when building wind farms at sea. To this end, we
began co-operating with seven other offshore investors in
May 2011. At the centre of the initiative are German wind
farms which are often built in very deep waters far offshore,
in order to comply with statutory regulations. Therefore, the
foundations have to be anchored in the seabed using driven
steel piles. The project partners want to reduce the noise
produced by this significantly, particularly in order to protect
harbour porpoises. Findings gained from this undertaking
will be shared with the entire offshore industry, including
manufacturers of noise abatement systems and approval
authorities.
Highly efficient electricity storage facility supports
renewable energy. Due to the rapid rise in the number of
wind turbines and photovoltaic units, electricity on the
system is increasingly influenced by weather conditions.
However, the supply of electricity must always meet demand
in order for the mains frequency to remain stable. Striking
this balance is becoming an ever-more ambitious task, which
cannot be accomplished without new electricity storage
facilities. Against this backdrop, we, the German Aerospace
Centre as well as General Electric Group and Züblin jointly
developed an ‘adiabatic pressurised-air storage facility.’
When electricity supply is high, air is compressed and forced
into subterranean cavities, where it is stored. This
compressed air can be used to generate electricity when
needed. We are considering the construction of a
demonstration plant in Stassfurt (Saxony-Anhalt) capable of
storing 360 megawatt hours (MWh) with an electrical
capacity of up to 90 MW. It should have an efficiency of
70 %. We intend to accomplish this by capturing the heat
generated during the compression process and returning it
to the facility’s energy cycle. It would be the very first time
this method was used on a large scale.
In view of the key role played by storage technologies in the
transformation of the energy sector, in September 2011,
RWE as well as twelve research and energy companies
founded the European Association for Storage of Energy
(EASE). The association will serve as a platform for expert
exchange on technical, economic and regulatory issues.
Smart electricity network in practice. Historically, electricity
was produced almost exclusively by large-scale power plants,
whereas the role assumed by homes was limited to that of
consumer. Since then, the situation has changed. More and
more households are equipped with solar panels and
produce electricity themselves, feeding their surplus energy
into the system. This translates into additional co-ordination
work, particularly for operators of medium and low-voltage
networks. Smart equalising mechanisms have to be
developed using new technologies in order to prevent the
grid from falling out of balance. One such example is the use
of flexible transformers that automatically adjust voltage
depending on the grid’s state. Another option is to store
biogas and use it to generate electricity, for example when
the sun is not shining. Aiming to test and refine such
techniques in practice, in June 2011, RWE Deutschland
launched one of Germany’s first smart electricity networks
as the consortium leader of Smart Country – Networks for
the Electricity Supply of the Future, a smart grid model
experiment subsidised by the German Ministry of Economics
and Technology. The goal is to gain knowledge of the
operation of this type of network in a region in Bitburg-Prüm
County over a period of three years. Together with our
partners ABB, Consentec and Dortmund Technical University,
we want to demonstrate how to ensure security of supply,
especially in rural regions, despite fluctuations in electricity
fed into the grid from renewable sources.
innovation 85To our investors Review of operations our responsibility
Responsibility statement consolidated financial statements Further information
Power plant for domestic use. The transformation of
Germany’s energy industry is not just taking place among
utilities and network operators – it also involves customers.
Together with Vaillant, we developed and brought to market
a ‘home power plant.’ It consists of a gas motor that
generates both electricity and heat. What is special about
this is that customers can make use of the electricity
themselves or feed it into the grid. In the future, it should
also be possible to fit the unit with an ecological heating rod
that enables the production of heat with electricity from a
wall socket. In this case, the motor is switched off. This is
worthwhile especially when electricity is affordable, for
instance during periods in which large amounts of electricity
are put on the system by wind turbines and solar panels. A
smart control developed by RWE ensures that the system’s
operating mode is ideally matched to the situation on the
market and consumption.
Heating with green electricity. Another way of optimising
domestic energy usage involves the use of the ‘wind heater’
which we are in the process of developing and testing. The
term describes a novel electrical storage heater, the charging
times of which can be flexibly adapted to fluctuations in
electricity produced from renewables. To date, electric
heaters have generally been charged overnight. In March
2011, RWE Effizienz GmbH teamed up with Siemens and
tekmar GmbH to launch an R&D project for managing loads
and making wind heaters economically feasible. Fifty of
RWE Vertrieb AG’s customers are also participating in the
pilot project. Initial results are expected by the end of the
2011 /2012 heating period.
RWE recognised as innovation leader. We rank first in
the 2010 Innovation Index of the European School of
Management and Technology (ESMT). The ESMT assessed
the innovative capabilities of Europe’s 15 largest energy
utilities from 2007 to 2010. The Innovation Leader among
European Energy Utilities Award is particularly in recognition
of our wide range of R&D activity: we cover 14 of 15 fields
of research classified as important by ESMT – more than
any of our competitors. The jury members also honoured our
relatively high R&D expenditure and large number of patent
applications.
86 innovation RWE Annual Report 2011
Organisation of risk management in the RWE Group.
Overall responsibility for the groupwide risk management
system sits with the Executive Board of RWE AG. It
establishes the rules and minimum standards, defines the
caps for the aggregated market and credit risks and takes
decisions on individual transactions that can result in
substantial risks.
The Corporate Controlling Department, which reports
to the CFO, bears responsibility for the control, steering
and co-ordination of the risk management system. This
organisational unit regularly reports on the Group’s risk
situation to the Executive Board and the Risk Management
Committee of RWE AG.
The Risk Management Committee is in charge of
monitoring and refining the risk management system.
It is composed of the heads of the following RWE AG
departments: Commodity Management, Compliance &
Management Board Office, Corporate Controlling, Finance,
Accounting, Legal/Board Affairs, Audit and Corporate
Development & Strategy. The Committee is chaired by
the head of the Corporate Controlling Department.
In addition, the following organisational units have
been entrusted with corporate risk management tasks:
The Executive Board mandate relating to commercial
management, to which the Commodity Management
Department is assigned, controls commodity positions.
Within a framework determined by the entire Executive
Board, this Executive Board mandate grants approvals
for hedging strategies and large commodity transactions
which are not covered by limits. Decisions concerning
hedging strategies are prepared by the Commodity
Management Committee, to which the Executive Board
1.11 dEvElOpMENT OF riSkS aNd OppOrTuNiTiES
member in charge of commercial management and the
Head of the Commodity Management Department as
well as representatives of the Board of Directors of
RWE Supply & Trading belong.
Limits for the commodity risks of operating companies are
defined by the Commodity Management Department. The
basis for these are the risk caps established by the entire
Executive Board.
The CFO of RWE AG monitors commodity risks. In fulfilling
this task, he is assisted by the CFOs and managing directors
in charge of finance of our major Group companies. The
Risk Controlling Unit, which belongs to the Corporate
Controlling Department, establishes groupwide performance
targets for risk measurement, tracks commodity risks and
reports on this to the Executive Board. By using dual
controls, we ensure that major risks are closely monitored
and that guidelines are implemented uniformly throughout
the Group.
The controlling of the RWE Group’s credit risks is handled by
the Credit Risk Controlling Unit, which also belongs to the
Corporate Controlling Department.
Monitoring financial risks at the RWE AG level is the
responsibility of the Financial Controlling Unit, which belongs
to the Finance Department. Its tasks include reporting on
currency, interest and liquidity risks.
The strategic guidelines for the management of our financial
assets (including the funds of RWE Pensionstreuhand e.V.
and RWE Pensionsfonds AG) are determined by RWE AG’s
Asset Management Committee. It weighs the earnings
prospects and risks against each other, selects suitable asset
classes (bonds, stocks, etc.) and decides on the allocation of
The U-turn in German energy policy demonstrates how suddenly the framework conditions in the energy sector can
change. However, political interventions are not the only risks to which utilities such as RWE are exposed today. Changing
market structures and fluctuating electricity and fuel prices also bring major commercial challenges, making professional
risk management indispensable. To us, the early systematic recording, assessment and control of risks is a key element of
solid business management. It is equally important to identify – and take advantage of – opportunities.
development of risks and opportunities 87To our investors Review of operations our responsibility
Responsibility statement consolidated financial statements Further information
the company’s funds to them. The members of the Asset
Management Committee are the CFO of RWE AG, the Head
of Group Finance and the CFOs of the following Group
companies: RWE Dea, RWE Power, RWE npower, enviaM,
Süwag Energie and Lechwerke.
Risks associated with financial reporting are monitored
by RWE AG’s Corporate Accounting Department. This
department also reports directly to the CFO. It uses an
internal control system, which is described in detail on
page 94 et seq.
In addition, the Corporate Compliance Department
monitors compliance with RWE’s Code of Conduct, paying
special attention to the avoidance of corruption risks. It
reports to the President and CEO of RWE AG or, if members
of the Executive Board are affected, directly to the Chairman
of the Supervisory Board and the Chairman of the Audit
Committee.
Under the expert management of the aforementioned
areas, our Group companies ensure that the risk
management guidelines are implemented throughout
the Group.
Risk management as a continuous process. Risk
management is an integral part of our operating workflow
as a continuous process. Risks and opportunities, defined
as negative or positive deviations from target figures,
are identified and classified early on. We evaluate risks
according to their probability of occurrence and damage
potential and aggregate them at the Group company or
Group level. Our analysis covers the three-year horizon of our
medium-term planning. It may extend beyond that for
material strategic risks. Risks that share the same cause are
aggregated to one position. If a risk can be reduced, the
residual risk is reported together with the countermeasures
already taken. The damage potential is defined in relation to
the operating result and equity of the business unit
concerned and the Group as a whole. We analyse risks using
a matrix, in which the risks as well as their probability of
occurrence and potential damage are represented. We can
derive from this whether there is a need for action and the
scope of such action. Risks with a high probability of
occurrence or damage potential are mitigated by taking
operational measures. Where necessary, we account for
them by taking precautionary steps on the balance sheet,
e.g. provisions. We evaluate and manage opportunities as
part of our regular planning process.
We prepare standardised reports on our risks and
opportunities for our management and supervisory
committees on a quarterly basis. The Executive Board of
RWE AG is immediately informed of unforeseen material
changes to the risk situation. Our Group Audit Department
regularly appraises the quality and functionality of our risk
management system. Nevertheless, we cannot guarantee
with absolute certainty that all relevant risks are identified
early on and that the controls work. For example, human
error can never be ruled out completely.
Overall assessment of the risk and opportunity situation by
executive management. As an energy company with a long-
term investment strategy, RWE is especially dependent on
reliable political framework conditions. However, we are
witnessing a rising trend towards regulatory intervention in
the energy market. Proof of this is the nuclear fuel tax levied
in Germany since 2011, against which we have filed lawsuits.
The sudden change of course in German nuclear energy
policy after the reactor accident at Fukushima is further
evidence of the fact that political risks have risen in the
utility sector. We have taken legal recourse here as well,
in order to limit financial damage.
In addition to energy policy, the development of supply and
demand on electricity and gas markets affects our earnings
in particular. Should the Eurozone’s sovereign debt crisis
lead to a recession, a decline in energy consumption and
energy prices may be the consequence. Furthermore, we are
witnessing structural changes on energy markets. For
instance, the continued rise in the number of wind turbines
and solar panels is crowding out gas and coal-based
generation, the margins of which have come under pressure.
If they continue to deteriorate, a curtailment of the
profitability of our large-scale new-build projects may be one
of the consequences.
88 development of risks and opportunities RWE Annual Report 2011
The gas market is also undergoing change. The increasing
significance of liquid gas trading points and the expansion
of shale gas production in the USA have made a major
contribution to prices in gas trading decoupling themselves
from those set in long-term agreements indexed to the price
of oil, with the former being much lower than the latter since
2009. We procure parts of our gas based on contracts linked
to the price of oil. We entered into renegotiations with our
suppliers to obtain conditions that are adapted to the
market’s development. A large number of them have since
entered the arbitration phase.
In view of all the issues mentioned above – be it contract
renegotiations, legal proceedings, commodity price changes
or political intervention – we are exposed to substantial risks,
but are also presented with opportunities. In sum, the
imponderables in our business have grown. Nevertheless,
there are no identifiable risks that jeopardise the continued
operation of RWE AG or the RWE Group.
Major risk and opportunity categories. The following
illustrates the risks and opportunities which may have a
substantial impact on our asset, financial and earnings
positions. They belong to the following categories, the first
four of which are particularly important to us at present.
• Risks and opportunities arising from the volatility of
commodity prices: The development of prices on
commodity markets greatly influences our earnings,
especially in the field of electricity generation. For
example, decreasing electricity prices or rising fuel costs
may lead to a decline in margins and reduce the value of
our power plants. RWE Dea’s upstream business is also
exposed to price risks. Moreover, unfavourable market
developments can cause the costs we incur purchasing
electricity and gas to exceed the prices we can realise
through sales to end-customers and distributors. This
primarily relates to those of our gas procurement contracts
which are linked to the price of oil. However, the
aforementioned risks are contrasted by the possibility that
the prices may develop in RWE’s favour. We assess the
price risks to which we are exposed on the procurement
and supply markets taking account of current forward
prices and expected price volatility. Commodity and
credit risks faced by generation and sales companies are
managed by following hedging rules established by
RWE AG. As already mentioned, in the generation
business, we limit risks by selling most of our electricity
early on, via forward contracts, and hedging the price
of the required fuel and emission certificates. We also
make use of forward markets to limit risks in RWE Dea’s
upstream business and in RWE Supply & Trading’s gas
midstream business.
RWE Supply & Trading plays a central role when it comes
to managing commodity price risks. This is the company
in which we pool our commodity transaction expertise
as well as the associated risks. RWE Supply & Trading is the
RWE Group’s interface to the world’s wholesale markets
for electricity and energy commodities. The company
markets large portions of the Group’s generation position
and purchases the fossil fuels and CO2 emission
certificates needed to produce electricity. Its role as
internal transaction partner makes it easier for us to limit
the earnings risks for the generation and supply
businesses stemming from price swings on energy
markets. RWE Supply & Trading also uses commodity
derivatives to minimise risk in the procurement and supply
businesses. However, the trading activities are not
exclusively orientated towards reducing risks. RWE
Supply & Trading undertakes proprietary trading to a
strictly limited extent in order to take advantage of
changes in prices on energy markets.
The RWE Group’s risk management system for energy
trading is firmly aligned with best practice as applied to
the trading transactions of banks. Transactions are
concluded with third parties only if credit risks are within
approved limits. Groupwide guidelines provide structures
and processes for the treatment of commodity price risks
and associated credit risks. The commodity positions in
our subsidiaries are constantly monitored, and findings are
reported to the responsible committees. Furthermore, the
Executive Board of RWE AG receives detailed updates on
development of risks and opportunities 89To our investors Review of operations our responsibility
Responsibility statement consolidated financial statements Further information
our consolidated commodity risk positions on a quarterly
basis. The Group companies inform the Corporate Risk
Controlling Department about their positions, which
consolidates them. This procedure is not followed for
market risks arising in connection with the proprietary
trades conducted by RWE Supply & Trading. Such risks are
monitored daily and stated separately.
The upper risk limits in the energy trading business are
set by the Executive Board of RWE AG. The Value at Risk
(VaR) is of central significance. It quantifies the potential
loss resulting from a risk position that will not be
exceeded with a predetermined probability and within a
predetermined time period. In principle, the VaR figures
within the RWE Group are based on a confidence interval
of 95 % and a holding period of one day. This means that,
with a probability of 95 %, the maximum daily loss will not
exceed the VaR. The central risk controlling parameter for
commodity positions is the Global VaR that relates to the
trading business of RWE Supply & Trading and may not
exceed €40 million. In fiscal 2011, it averaged €14 million,
and the daily maximum was €27 million. In addition, we
have set limits for each trading desk. Furthermore, we
factor extreme scenarios into stress tests, determine the
influence they can have on liquidity and earnings, and
take countermeasures whenever the risks are too high.
• Risks and opportunities resulting from gas procurement
contract renegotiations: We source gas on liquid
wholesale gas markets such as the TTF (Netherlands) and
the NBP (United Kingdom) as well as based on long-term
purchase agreements linked to the price of oil. Prices at
the aforementioned trading points have been decoupled
from those of contracts linked to the price of oil since
2009, temporarily falling significantly below it. As a result,
due to contractual provisions, some of the gas we buy is
much more expensive than on the market, causing
declines in margins and customer losses. This primarily
affects our German and Czech activities. To obtain
purchase conditions adapted to the development of the
market, we entered into contract renegotiations with our
gas suppliers, a large number of which have already
turned into arbitration proceedings. The outcomes of the
renegotiations will have a substantial influence on our
medium-term earnings. We have already reached
agreements with respect to some long-term contracts:
large parts of them were either converted to wholesale
gas price indexation or terminated prematurely by mutual
consent. Nevertheless, there is a risk that the outcomes of
the ongoing renegotiations may lag behind the original
expectations we had based on detailed legal assessments.
However, we may be able to enforce conditions that are
more favourable than assumed initially.
• Risks resulting from CO2 emissions: Lignite and hard coal
power plants account for a significant proportion of our
electricity generation portfolio. Our specific carbon
dioxide emissions are thus far above the sector average.
In December 2008, the EU member states agreed that
the Western European electricity sector will hardly be
allocated any free certificates in the third emissions
trading period, which starts in 2013. This will cause our
annual spending on emission allowances to again be much
higher than in the current trading period, which ends in
2012. By 2020, we intend to reduce our specific carbon
dioxide emissions by more than 20 % compared to 2005
by modernising our power stations and expanding
renewable energy. Furthermore, we limit our CO2 risk by
participating in climate-protection projects within the
scope of the Kyoto Clean Development Mechanism and
Joint Implementation programme. Another measure
involves the virtual swapping of power plant capacity with
other generators. In addition, we conclude long-term
electricity supply agreements, in which the CO2 price risk
is borne by the customer. Furthermore, we have already
purchased a certain number of CO2 certificates for the
third emissions trading period.
90 development of risks and opportunities RWE Annual Report 2011
• Regulatory and political risks: As a utility, we plan our
capital expenditure for periods extending over decades,
making us especially dependent on reliable political
framework conditions. However, we are witnessing an
increasing trend towards regulatory intervention in
the energy market. Due to the budgetary difficulties of
numerous European countries, there is now an increased
risk of governments imposing new burdens on the
economy. This could particularly affect companies that are
bound to certain locations, such as utilities. An example of
this is the German nuclear fuel tax, which curtails our
earnings considerably. As its legality is questionable, we
filed lawsuits with the appropriate fiscal courts to have the
enforcement of the tax repealed. Ultimately, the German
Constitutional Court – or if necessary the European Court
of Justice – will rule on the admissibility of the nuclear fuel
tax. However, this is unlikely to happen until several years
from now. Until then, there will be substantial uncertainty,
which will make our planning difficult.
The sudden change of course in German energy policy
following the reactor catastrophe at Fukushima also proves
that the political risks in the utility sector have risen. The
13th amendment to the German Nuclear Energy Act (NEA),
which became effective at the beginning of August 2011,
nullified the lifetime extension for German nuclear power
plants introduced in 2010 and required the immediate
shutdown of eight of the country’s 17 reactors. Staggered
decommissioning dates were established for the remaining
units (see page 43). The risk concerning the nuclear
power stations that are still online is that they may not
be able to make full use of the transferable electricity
generation allotments which they are entitled to according
to the NEA. We believe the 13th amendment to the
NEA is unconstitutional because the operators of the
reactors affected will not be compensated and the
decommissioning dates were established without sound
justification. Therefore, in February 2012, we filed an
appeal with the German Constitutional Court. Prior to this,
in April 2011, we had brought lawsuits before the Hessian
Administrative Court of Justice in Kassel against the
nuclear moratorium imposed on Biblis A and B from
March to June 2011.
The rise in political risks in the field of nuclear energy
is also reflected in the current debate on the selection of
a final storage site in Germany. The final storage facility
is to be used to dispose of highly radioactive waste
produced by nuclear power stations. We believe that a
new law will lead to the risk of a further delay in the
selection process and impose additional financial burdens
on utilities.
Risks also arise from the monitoring of anti-competitive
pricing practices, the legal framework of which became
stricter at the end of 2007. In addition, legislative
initiatives have been launched at the European level,
which aim to increase the regulation of energy trading
transactions. One of the objectives is to oblige utilities to
trade commodity derivatives at clearing points, pledging
more financial collateral than previously in cases in which
the derivative positions exceed a financial cap that is yet
to be determined.
The incentive-based regulation of electricity and gas
networks in Germany introduced in 2009 also harbours
earnings risks. The regulator has yet to determine the
maximum revenue each company is allowed to earn in the
second five-year regulatory period, which begins on
1 January 2013 for gas and 1 January 2014 for electricity.
Furthermore, it has not yet assessed the efficiency of the
network operators. Should shortcomings be identified,
the companies shall be obliged to eliminate them by the
end of the regulatory period by cutting costs. Irrespective
of whether they succeed in doing so, the regulator will
gradually reduce the earnings caps of the affected
companies. In general, there is a risk that our network
companies may be subjected to revenue caps that are too
low and that these may actually be reduced further on
grounds of alleged inefficiencies. However, we also see an
opportunity, as the regulator may establish parameters
that are favourable to our network companies. Moreover,
we are confident that the framework conditions for
network investments will be improved.
We are exposed to risks associated with approvals when
building and operating production facilities. This
particularly affects our wind farms, opencast mines and
development of risks and opportunities 91To our investors Review of operations our responsibility
Responsibility statement consolidated financial statements Further information
power plants. If their operation is interrupted or curtailed,
this can result in significant production and earnings
shortfalls. Furthermore, there is a danger of new-
build projects either receiving late or no approval, or
of granted approvals being withdrawn. Depending
on the construction progress made and the contractual
obligations to suppliers, this can have a significant
negative financial impact. We take precautionary measures
against this by preparing our applications for approval
with great care and ensuring that approval processes are
handled competently.
We are following the political upheaval in North Africa
very closely. RWE Dea is active in this region, where it is
conducting upstream projects. We already produce oil and
gas in Egypt. Furthermore, we are planning activities in
Libya. As in all non-OECD countries, we have backed our
capital expenditure there largely through federal
guarantees and will also do this for future projects.
• Other legal and arbitration procedures: Individual RWE
Group companies are involved in litigation and arbitration
proceedings due to their operations or the sale of
companies. Out-of-court claims have been filed against
some of them. Furthermore, Group companies are directly
involved in various procedures with public authorities or
are at least affected by their results. However, we do not
expect any material effects on the RWE Group.
Some conciliation proceedings in connection with the
legal restructuring of companies are still pending.
They were initiated by outside shareholders in order to
examine the appropriateness of conversion ratios or cash
compensation. Since these figures were calculated by
independent experts and several first-instance decisions
have been in our favour, we believe the associated
risks are low. If different legally enforceable decisions
are reached, we will pay compensation to all affected
shareholders, including those who are not directly
involved in the conciliation proceedings.
• Financial risks and opportunities: The volatility of foreign
exchange rates, interest rates and share prices can also
have a significant effect on our earnings. We attach
significant importance to currency risk management, due
to our international presence. Furthermore, energy
commodities such as coal and oil are traded in US dollars.
Group companies are generally obliged to limit their
currency risks via RWE AG. The parent company
determines the net financial position for each currency
and hedges it if necessary. The VaR concept is one of
the tools used to measure and limit risk. In 2011, the
average VaR for RWE AG’s foreign currency position was
less than €1 million.
We differentiate between two categories of interest rate
risks. On the one hand, rises in interest rates can lead to
reductions in the price of securities held by RWE. This
primarily relates to fixed-interest bonds. On the other
hand, interest rate increases also cause our financing costs
to rise. The VaR for the securities price risk of our capital
investments in 2011 averaged €7 million (previous year:
€9 million). We measure the sensitivity of the interest
expense with respect to rises in market interest rates using
the Cash Flow at Risk. We apply a confidence level of 95 %
and a holding period of one year. In 2011, the average
Cash Flow at Risk was €19 million.
The securities we hold in our portfolio include shares.
The VaR for the risk associated with changes in share
prices averaged €12 million (previous year: €11 million).
Risks and opportunities from changes in the price of
securities are controlled by a professional fund
management system. The Group’s financial transactions
are recorded centrally using special software and are
monitored by RWE AG. This enables us to balance risks
across individual companies. Range of action,
responsibilities and controls are set out in internal
guidelines, to which our Group companies are obliged
to adhere.
92 development of risks and opportunities RWE Annual Report 2011
• Creditworthiness of business partners: Our business
relations with financial institutions, trading partners,
customers and suppliers expose us to credit risks. These
may increase considerably if the Eurozone’s sovereign
debt crisis becomes more serious. We counter them with
widely diversified financing sources, cash investments
and bank partners across various currencies, jurisdictions
and maturities.
We track the creditworthiness of our counterparties
closely. In addition, we ensure compliance with
groupwide standards when measuring and managing
credit risks. We manage credit risks by setting limits
and by adjusting them, especially in the event of
changes in creditworthiness. If necessary, we request
cash collateral or bank guarantees. We also take out
credit insurance policies or make use of credit default
swaps as far as economically feasible.
Most of the banks and trading partners with which we
have credit relationships are of good creditworthiness.
We assess their credit standing based on external ratings.
If no such ratings are available, we apply internal
assessment methods. In addition, for banks, we use an
early warning indicator, which we developed in light of
the financial market crisis in 2008. We sell a significant
portion of our electricity generation on exchanges. The
credit risk for these sales is assumed by a clearing unit. As
a rule, over-the-counter energy trading transactions are
concluded on the basis of framework agreements, e.g.
those prescribed by the European Federation of Energy
Traders (EFET). In addition, we agree on collateral. For
financial derivatives, we make use of the German master
agreement or the master agreement of the International
Swaps and Derivatives Association (ISDA). We measure our
credit risk exposure in the trading and finance sectors on
a daily basis.
• Liquidity risk: Liquidity risks consist of the danger of
our liquidity reserves no longer being sufficient to meet
our financial obligations in a timely manner. At RWE,
such obligations result above all from the refinancing of
financial liabilities due. Furthermore, we must put up
collateral if trading contracts marked to market result in a
loss. We classify our liquidity risk as low. The basis for this
is our solid financing. We have strong cash flows from
operating activities, substantial cash and cash equivalents,
unused credit lines and further financial latitude thanks to
our Commercial Paper and Debt Issuance Programmes.
Our careful planning ensures that we are liquid at all
times. Among other things, we make use of a groupwide
notification system, which records the Group companies’
short, medium and long-term need for financial resources.
• Risks and opportunities associated with corporate
strategy: Decisions on capital expenditure on property,
plant and equipment and acquisitions are associated with
major risks and opportunities, due to the amount of
capital employed and the fact that it is tied up long term.
When a company is acquired, problems can arise in
relation to the integration of employees, processes and
technologies. RWE has specific accountability provisions
and approval processes in place to prepare and implement
strategic decisions concerning capital expenditure on
property, plant and equipment as well as acquisitions.
Closely monitoring both our markets and competitors
helps us record and assess strategic risks and
opportunities early on.
• Continuity of business activities: We operate
technologically complex and interconnected production
plants in all parts of our value chain. Uninsured damage
can be incurred by our lignite mining equipment,
production facilities, power stations, power plant
components and networks. There is an increasing risk of
outages in our power plants as their components age. In
addition, the construction of new plants can be delayed
due to accidents, faulty materials, late deliveries or time-
consuming approval procedures. As far as possible, we
mitigate these risks through diligent project management.
Our network business is exposed to the risk of facilities
being damaged by force majeure such as severe weather
conditions. We limit these risks through high safety
standards as well as regular inspection, maintenance and
servicing work. If economically viable, we take out
appropriate insurance policies.
development of risks and opportunities 93To our investors Review of operations our responsibility
Responsibility statement consolidated financial statements Further information
• Information technology: Our business processes are
supported by efficient data processing systems.
Nevertheless, we cannot fully rule out a lack of availability
of IT infrastructure or a breach in the security of our data.
We mitigate these risks by applying high security
standards as well as raising user awareness and limiting
access privileges. In addition, we regularly invest in
hardware and software upgrades. Our IT is largely based
on common market standards. Its operations are run in
modern data centres. We have established a mandatory
groupwide process for managing risks associated with
engineering IT solutions.
• Human resources: Competition for the best talent is
becoming increasingly fierce. To secure and strengthen
our position in this area, when recruiting staff, we
highlight RWE’s attractiveness as an employer. In addition,
we strive to retain experts and executives over the long
term. In addition to performance-based compensation
and progressive employee benefits, we put a great deal
of effort into the varied prospects they are offered
throughout the RWE Group: trainee programmes, cross-
disciplinary career paths, assignments in various European
Group companies as well as attractive continued
education and advanced training offerings. We limit staff
fluctuation risks through replacement arrangements and
early succession planning.
Report on the accounting-related internal control system:
statements in accordance with Sec. 315, Para. 2, No. 5 and
Sec. 289, Para. 5 of the German Commercial Code. Risks
associated with financial reporting reflect the fact that our
annual, consolidated and interim financial statements may
contain misrepresentations that could have a significant
influence on the decisions made by their addressees. Our
accounting-based Internal Control System (ICS) aims to
detect potential sources of error and limit the resulting risks.
It covers the financial reporting of the entire RWE Group.
This enables us to ensure with sufficient certainty that the
parent company and consolidated financial statements are
prepared in compliance with statutory regulations.
The design of the accounting-related ICS largely mirrors
the organisation of our accounting and financial reporting
process. One of the main features of this process is the
control over the Group and its operating units. The basis
is provided by the target parameters determined by the
Executive Board of RWE AG. Building on them and our
expectations concerning the operating business trend, we
develop our medium-term budget once a year. It includes
the figures budgeted for the following fiscal year as
well as the figures planned for subsequent years. We
prepare forecasts in line with the budget for financial
years underway. The Executive Board of RWE AG and the
management boards of its major subsidiaries convene
once a quarter in order to evaluate the interim and annual
financial statements and update the forecasts.
Accounting is mostly organised locally. Occasionally, this
task is performed by Group companies for their subsidiaries.
Certain processing tasks such as payroll accounting are
pooled at internal service providers like RWE Service GmbH
or are at least subject to uniform groupwide quality
standards. As holding company, RWE AG performs central
accounting tasks. These include consolidation, the
accounting treatment of provisions for pensions in Germany,
and goodwill impairment tests. RWE AG is also in charge of
tasks relating to the management and monitoring of
financial instruments, money transactions, cash investments
and tax group accounting. External service providers are
commissioned in certain cases.
The CEOs and CFOs or the managing directors of major
subsidiaries as well as certain RWE AG department heads
must take an internal balance-sheet oath for external half
and full-year reporting. Only then do the members of the
Executive Board of RWE AG take an external half and full-
year balance-sheet oath and sign the responsibility
statement. Thereby, they confirm that the prescribed
accounting standards have been adhered to and that the
figures give a true and fair view of the net assets, financial
position and results of operations.
94 development of risks and opportunities RWE Annual Report 2011
We prepare our financial statements using a groupwide
reporting system that we also use to prepare the budgets
and forecasts. All fully consolidated subsidiaries use this
system. It forms the basis for a standardised data reporting
process within the Group. The financial accounting systems
are largely maintained by RWE IT GmbH.
We identify risks in financial reporting at the divisional
level on the basis of quantitative, qualitative and process-
related criteria. The foundations of the ICS are our generally
binding guidelines and ethical values, which are also set out
in RWE’s Code of Conduct. Building on this, the minimum
requirements of the major processing steps ensure the
integrity of data collection and management. The risks of
individual balance-sheet items resulting from subjective
discretion or complex transactions are recorded in a
groupwide risk and control matrix. Once a year, we prove
that the necessary controls have actually been implemented
and carried out properly. This is done by the Internal Audit
Department, external auditors, or the management in
charge of performing the controls.
When in session, the Audit Committee of the Supervisory
Board regularly concerns itself with the effectiveness of the
accounting-related ICS. Once a year, the CFO of RWE AG
presents to the committee on the risks of financial reporting.
He also explains which control measures were taken and
how the proper implementation of the controls was verified.
Our Corporate Audit Department is certified to the
Quality Management in Internal Auditing Standard
recommended by the German Internal Audit Association.
It reports to the entire Executive Board. For disciplinary
matters, it is assigned to the Deputy Chairman of the
Executive Board, and in functional respects, it reports to
the CFO.
development of risks and opportunities 95To our investors Review of operations our responsibility
Responsibility statement consolidated financial statements Further information
Global economy loses momentum. Based on initial
forecasts, global economic output will increase by 2.5 % in
2012, as long as the Eurozone’s sovereign debt crisis does
not escalate. China will probably remain the economy’s
engine, although the country’s real-estate sector is showing
initial signs of weakening. In the Eurozone, measures to
consolidate the state budgets will dampen growth: its gross
domestic product (GDP) may stagnate in 2012. Germany’s
prospects are a little brighter. Following 3 % growth last
year, the German Council of Economic Experts is of the
opinion that a gain of nearly 1 % is possible. German
investment in fixed assets is expected to drop compared
to 2011. Furthermore, the difficult economic situation in
neighbouring European countries is likely to curtail exports,
whereas consumer spending should inject stabilising
stimulus. GDP in the Netherlands and Belgium is forecast
to rise by about 0.5 %. The same applies to the United
Kingdom. Austerity measures mandated by the government
and the persistently weak property market will probably
curtail consumer spending. Initial estimates for our Central
Eastern European markets also indicate a decline in
economic momentum. Poland’s economy is likely to grow
by more than 2 %, whereas in the Czech Republic, it will
probably expand by a mere 0.5 %. Hungary may see a
decline in economic output.
Weather expected to have positive effect on energy
consumption. The forecast weakening of economic growth
will be reflected in the use of energy. However, weather-
related effects, which are difficult to predict, will outweigh
the economic impact, especially with regard to gas. As
mentioned earlier, 2011 temperatures were much higher
than the ten-year average. A normalisation would thus lead
to an increase in the need for energy.
1.12 OuTlOOk
As regards electricity, we anticipate that consumption in
Germany will demonstrate weak growth at best, advancing
by less than 1 %. Stimulus will probably come primarily
from the service sector, with demand in energy-intensive
branches of industry actually likely to drop. Our forecast for
the United Kingdom and the Netherlands is similar. The
situation in Central Eastern Europe is slightly more disparate.
Poland is likely to post a gain of 2 %, with the Czech Republic
and – above all – Hungary probably lagging far behind.
As far as gas is concerned, we expect to see a weather-
driven rise in demand across all core markets. Disregarding
temperature effects, Germany will probably experience a
decrease in consumption of about 1 %. This estimate is
based on the assumption that the continued expansion of
renewable energy and the currently low price of CO2
emission allowances will result in a further decline in the
deployment of gas-fired power plants. In the Netherlands
and the United Kingdom, gas consumption could actually
drop by more than 1 % if temperatures do not have an
impact. In these countries, gas-fired power stations account
for a fairly large share of electricity generation. Moreover,
the United Kingdom is making substantial progress in the
heat insulation of buildings. Poland will probably be the only
one of our Central Eastern European countries to record a
significant, temperature-adjusted rise in demand for gas.
The country’s good economy is the basis for this.
Commodity prices to maintain high level. Despite the
anticipated deterioration of the economy, we do not expect
prices on commodity markets to decline substantially. Even if
they did, this would not significantly affect our earnings in
the financial year underway as we have sold forward nearly
RWE increasingly reaps the benefits of past investments. When new electricity generation plants are commissioned, they
provide us with additional income. Higher oil and gas production volumes also have a positive effect on our earnings.
Furthermore, we benefit from long-term efficiency improvements. This helps us to cushion the burdens resulting from
declining generation margins and loss-making gas procurement contracts. We expect that our operating result for 2012
and 2013 will be in the order of the level achieved in 2011. Notably, the effects of the ongoing divestment programme
have already been considered in this forecast. Recurrent net income is also expected to display a stable development. The
prospects for keeping our dividend attractive are therefore good.
96 outlook RWE Annual Report 2011
all our 2012 electricity generation and purchased the
necessary fuel or at least secured its price. The electricity
price realised by RWE Power is lower than the comparable
figure for 2011 of €63 per MWh. We also limited the
exposure to price risks of this year’s oil and gas production
by concluding forward sales.
However, 2013 earnings may be significantly influenced by
the future development of commodity quotations. Our
current forecast is largely based on the forward prices
prevailing at the beginning of 2012. At the end of January,
the 2013 forward for Brent crude was trading in London at
US$105 per barrel. The same contract for thermal hard coal
(including freight and insurance) was quoted at US$115 per
metric ton on the Rotterdam market. At the Dutch trading
point, gas cost €27 per MWh, still clearly less than in oil
price-indexed gas purchasing contracts. At the end of
January 2012, CO2 emission allowances traded for €9 per
EUA. The fact that they have recently become much cheaper
is reflected in the price of electricity. The 2013 forward for
base-load deliveries in Germany traded for €52 per MWh
on 31 January. RWE Power has already placed over 50 %
of its 2013 electricity production on the market.
Organic growth despite difficult framework conditions.
Climate protection, resource conservation and organic
growth remain at the very top of our agenda. We are thus
staying on our strategic course, despite adverse economic
and political framework conditions. However, we will slow
down in reaction to the burdens we will face in the coming
years resulting from the cessation of operation of our Biblis
nuclear power plant, the nuclear fuel tax and lower power
plant margins. For the three-year period through to 2014, we
plan to spend a total of €16 billion on property, plant and
equipment. Our capital expenditure is thus likely to exceed
the funds at our disposal after deducting the dividend
payment from cash provided by operating activities. This
should change no later than 2015, on completion of our
ongoing power plant new-build programme. The Dutch
Claus C and Moerdijk 2 combined-cycle gas turbine power
plants took up commercial operation in January and
February 2012, respectively. The dual-block lignite-fired
power station at Neurath near Cologne is scheduled to
follow at the end of March, with commissioning at the
Pembroke (United Kingdom) and Denizli (Turkey) gas-fired
power plants planned for the second half of the year. These
facilities are the most modern of their kind. They consume
less fuel than older comparable power stations, thereby
producing less emissions.
At the centre of our growth strategy is the expansion of
electricity generation from renewables. We intend to
dedicate approximately €4 billion to this in the period from
2012 to 2014. Nearly half of these funds are earmarked for
offshore wind farms. By 2020, the share of our electricity
production capacity accounted for by renewable energy
should have risen to at least 20 %. At the end of 2011, it
totalled 8 %.
RWE Dea’s upstream business is still one of our growth
areas, although we want to sell stakes in projects in this
area. RWE Dea plans to spend a total of €2.7 billion in
capital in 2012 and the two following years. The regions of
focus are the UK North Sea, the offshore areas of Norway, as
well as Germany and North Africa. In 2014, RWE Dea wants
to produce more than 40 million barrels of oil equivalent in
terms of oil and gas and generate an operating result in the
order of €800 million. We have also identified opportunities
for growth in our Central Eastern and South Eastern Europe
Division, especially in the field of electricity generation.
Divesting to preserve financial headroom. In order to
implement the aforementioned growth plans, we will sell
assets. We are considering disposal options for the Czech
gas transmission system operator NET4GAS, our stake in
Berlinwasser, some German sales and network activities,
select power plant capacity and stakes in upstream projects.
We plan to divest up to €7 billion in assets. This is less than
we had originally envisaged. The number and selection
of assets we put up for sale will primarily depend on the
extent to which their disposal improves our leverage factor.
The latter is defined as the ratio of net debt to EBITDA.
The divestments are scheduled to be completed by the end
of 2013.
outlook 97To our investors Review of operations our responsibility
Responsibility statement consolidated financial statements Further information
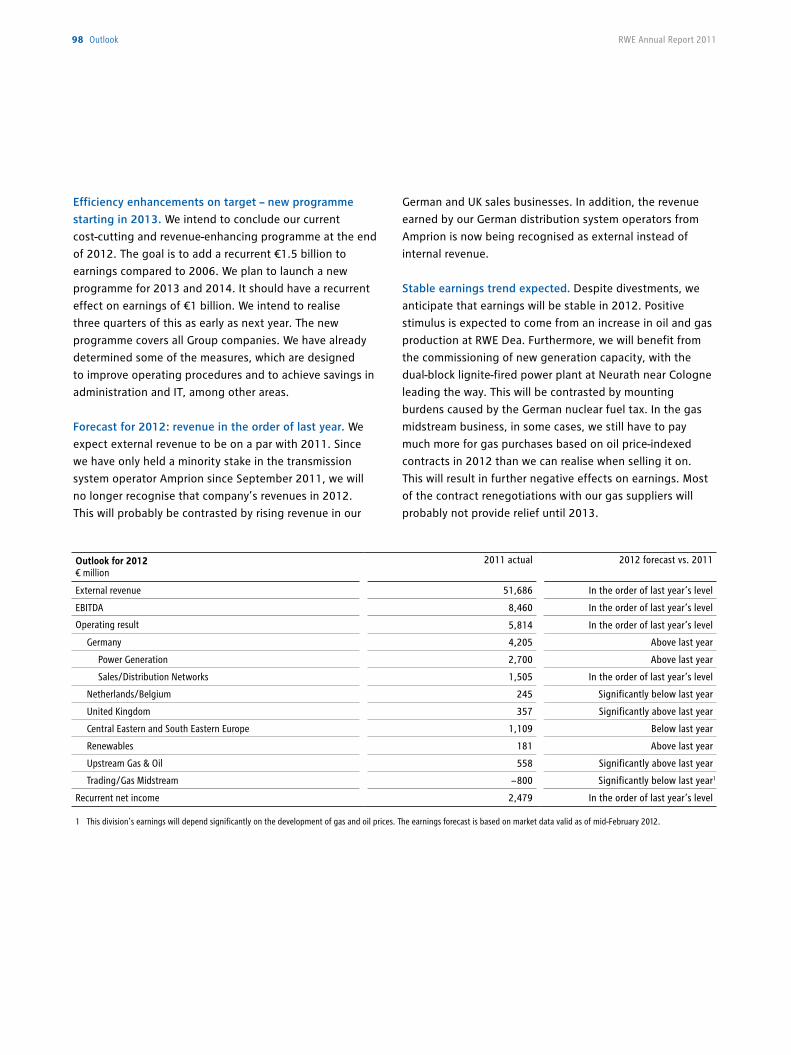
Efficiency enhancements on target – new programme
starting in 2013. We intend to conclude our current
cost-cutting and revenue-enhancing programme at the end
of 2012. The goal is to add a recurrent €1.5 billion to
earnings compared to 2006. We plan to launch a new
programme for 2013 and 2014. It should have a recurrent
effect on earnings of €1 billion. We intend to realise
three quarters of this as early as next year. The new
programme covers all Group companies. We have already
determined some of the measures, which are designed
to improve operating procedures and to achieve savings in
administration and IT, among other areas.
Forecast for 2012: revenue in the order of last year. We
expect external revenue to be on a par with 2011. Since
we have only held a minority stake in the transmission
system operator Amprion since September 2011, we will
no longer recognise that company’s revenues in 2012.
This will probably be contrasted by rising revenue in our
German and UK sales businesses. In addition, the revenue
earned by our German distribution system operators from
Amprion is now being recognised as external instead of
internal revenue.
Stable earnings trend expected. Despite divestments, we
anticipate that earnings will be stable in 2012. Positive
stimulus is expected to come from an increase in oil and gas
production at RWE Dea. Furthermore, we will benefit from
the commissioning of new generation capacity, with the
dual-block lignite-fired power plant at Neurath near Cologne
leading the way. This will be contrasted by mounting
burdens caused by the German nuclear fuel tax. In the gas
midstream business, in some cases, we still have to pay
much more for gas purchases based on oil price-indexed
contracts in 2012 than we can realise when selling it on.
This will result in further negative effects on earnings. Most
of the contract renegotiations with our gas suppliers will
probably not provide relief until 2013.
Outlook for 2012€ million
2011 actual 2012 forecast vs. 2011
External revenue 51,686 In the order of last year‘s level
EBITDA 8,460 In the order of last year‘s level
Operating result 5,814 In the order of last year‘s level
Germany 4,205 Above last year
Power Generation 2,700 Above last year
Sales/Distribution Networks 1,505 In the order of last year‘s level
Netherlands/Belgium 245 Significantly below last year
United Kingdom 357 Significantly above last year
Central Eastern and South Eastern Europe 1,109 Below last year
Renewables 181 Above last year
Upstream Gas & Oil 558 Significantly above last year
Trading/Gas Midstream − 800 Significantly below last year1
Recurrent net income 2,479 In the order of last year‘s level
1 This division’s earnings will depend significantly on the development of gas and oil prices. The earnings forecast is based on market data valid as of mid-February 2012.
RWE Annual Report 201198 outlook
In 2012, the RWE Group’s EBITDA and operating result are
expected to be comparable to 2011. We also anticipate that
recurrent net income will be in the order of last year’s level.
The outlook considers the effects of the ongoing divestment
programme.
• Germany: From our current perspective, the division’s
operating result is expected to be up on last year’s level.
Power Generation: We expect this business area to
improve earnings. RWE Power can make an additional
contribution with the new dual-block lignite-fired power
station at Neurath. Furthermore, we anticipate that nuclear
provisions will have a positive effect, in part because
of the absence of one-off burdens experienced in 2011
from the U-turn in German energy policy. Maintenance
and operating costs will probably be lower than in 2011,
as should the cost of procuring emission allowances.
However, there will also be counteracting effects: the price
of the electricity we generate in Germany this year, nearly
all of which we have placed on the market, is down on last
year’s level (€63 per MWh). In addition, we will incur
additional costs when purchasing fuel and expect the
nuclear fuel tax to place a heavier burden on us.
Sales/Distribution Networks: We anticipate that this
business area will close the reporting period on a par
with last year. On the one hand, we expect to benefit
considerably from efficiency-enhancement measures.
On the other hand, positive exceptional effects in 2011
resulting from the initial full consolidation of NEW will
not recur. In addition, income from investments is likely
to drop.
• Netherlands/Belgium: From our current perspective, the
operating result posted by Essent will decline significantly,
primarily due to the shrinking margins of our Dutch hard
coal and gas-fired power plants. Income from Essent’s
remaining gas midstream business is also likely to be
lower than in 2011. We intend to cushion these effects by
taking comprehensive measures to reduce costs.
• United Kingdom: From our current perspective, RWE
npower will close 2012 significantly up year on year. The
basis for this are additional measures taken to improve
efficiency. We will benefit from this above all in our supply
business, where margins should continue to recover.
RWE npower raised residential electricity and gas tariffs by
an average of 7.2 % and 15.7 % with effect from 1 October
2011. This was followed by a reduction in gas prices by an
average of 5 % as of 1 February 2012 through which we
are passing price-induced relief in wholesale gas
procurement through to our customers. Earnings in the
generation business will probably continue to deteriorate
due to market conditions. However, we will benefit
considerably from the resumption of electricity production
at our Tilbury site after having converted the hard coal-
fired power station to run on biomass. Another positive
impact will be felt from our new gas-fired power plant at
Pembroke beginning commercial operation in the second
half of the year.
• Central Eastern and South Eastern Europe: The division
will probably not be able to match the good operating
result achieved last year. We expect to see declining sales
and distribution margins in the Czech gas business.
However, earnings posted by our local gas transmission
activities should be stable. The same applies to our
Hungarian and Polish electricity businesses.
• Renewables: The commissioning of new renewable
generation capacity will add to revenue, contributing to
an improvement in RWE Innogy’s operating result. In
particular, we will benefit from the fact that our wood
pellet factory in the US state of Georgia, which opened
in May 2011, will be available for the first full year.
Furthermore, we expect the construction of the Greater
Gabbard offshore wind farm to be completed over the
course of the year. However, the income from
compensation for damages received in 2011 for delays in
the construction of the wind farm will not recur this year.
Should weather conditions be normal in 2012, both wind
levels and rainfall should be higher than in 2011, and the
utilisation of our wind turbines and run-of-river power
plants should also rise accordingly. This would have a
positive impact on earnings. A counteracting effect will
come from ongoing investment projects causing
substantial run-up costs. In addition, we expect proceeds
on the sale of projects we developed to drop.
outlook 99To our investors Review of operations our responsibility
Responsibility statement consolidated financial statements Further information
• Upstream Gas & Oil: RWE Dea’s operating result should
improve significantly as we will commence production in
several gas fields which we developed. Furthermore, we
expect that we will be able to realise higher gas prices. We
believe we will experience further relief in terms of
exploration costs. However, as production increases, so do
production costs.
• Trading /Gas Midstream: We expect these activities to
record another operating loss, which from our current
perspective will be much more significant than in 2011.
Burdens in the gas midstream business are the main
reason. Prices linked to the oil market for purchasing gas
for 2012 will continue to be much higher than those
realisable when the gas is re-sold on the market. Our
earnings forecast is based on the market quotations
observed in the middle of February 2012. We are in
renegotiations with our gas suppliers, the outcomes of
which will have a substantial effect on our medium-term
earnings. However, most of the decisions will not be made
until after 2012. We anticipate that the trading business of
RWE Supply & Trading will deliver a much improved
performance compared to last year’s weak level.
Dividend for fiscal 2012. Our dividend proposal for the
current fiscal year will be in line with our usual payout ratio
of 50 % to 60 %. The basis for calculating the dividend is
recurrent net income. As set out earlier, we expect the latter
to be in the order of last year’s level.
Capex of €6 billion planned. Our capital expenditure on
property, plant and equipment in 2012 will total
approximately €6 billion. This would be slightly below the
record levels achieved in the two previous years
(€6.4 billion). The reason is the gradual completion of
facilities as we implement our power plant new-build
programme. However, we anticipate spending more on
expanding renewable capacity than in 2011. We also want to
step up capital expenditure on our upstream gas and oil
activities.
Leverage factor: slight improvement expected. Our net
debt, which amounted to €29.9 billion at the end of 2011,
will decline marginally. Sales proceeds from our divestment
programme will be a contributing factor. If EBITDA remains
stable, this would also cause the leverage factor to decrease
somewhat. However, it will still probably exceed the upper
limit of 3.0 to which we are orientating ourselves. We intend
to return the leverage factor closer to this limit quickly, in
order to support our solid A rating.
Headcount: slightly down year on year. We expect to see
a slight decline in our workforce in the current financial
year. Employee figures in the United Kingdom will drop
significantly. RWE npower intends to reduce staff numbers
by improving sales processes. We also expect positions to
be made redundant in the Germany Division: in the Sales /
Distribution Business Area, the planned divestments will
cause the labour force to shrink. In the Power Generation
Business Area, efficiency-enhancing measures and the
shutdown of the Biblis nuclear power plant will have an
effect. In contrast, RWE Innogy will continue to enlarge its
workforce.
Earnings forecast for 2013. The earnings prospects for 2013
are favourable, although we will face additional burdens in
the field of electricity generation. These will result from
the fact that our power stations will stop receiving free
allocations of CO2 emission allowances from 2013 onwards.
However, this will be contrasted by the positive effects of
the new efficiency-enhancement programme, which should
total an estimated €750 million. In addition, we expect to
be able to conclude most of the ongoing renegotiations
with RWE Supply & Trading’s gas suppliers and that they
will lead to substantial relief. We want to have completed
our divestment programme by the end of 2013. This will
eliminate the earnings contributed by the disposed assets.
Nevertheless, we anticipate that our operating result and
recurrent net income will be of the order achieved in 2011.
EBITDA will probably improve: we expect it to total about
€9 billion in 2013.
Dividend remains attractive. We will maintain our payout
ratio of 50 % to 60 % over the medium term. This means that
we still want to pay out at least half of our recurrent net
income to our shareholders. RWE will therefore continue to
pay an attractive dividend.
100 outlook RWE Annual Report 2011

101
2.0 Our rESpONSibiliTY
€2.9 billion€146 million0.787 mt8 %
41.3 %
Environmental expenditure
Research and development costs
CO2 emissions per megawatt hour
Share of renewables ingeneration capacity
Thermal effi ciency of fossil fuel-fi red power plants
ou
R Re
spo
nsi
bilT
Y
In fiscal 2011, the Supervisory Board fulfilled all of the duties imposed on it by German law and the company’s Articles of
Incorporation. We regularly advised the Executive Board on running the company and monitored its activities. In so doing,
we were consulted on all fundamental decisions. The Executive Board informed us of all the material aspects of business
developments, major events and transactions both verbally and in writing. This was done regularly, extensively and in a
timely fashion. We were kept abreast of the earnings situation, risks and risk management in an equally thorough manner.
The Supervisory Board convened six times in the year under review, including a constituent session following the Annual
General Meeting on 20 April 2011 and an extraordinary session. The average participation rate was 93 %. None of the
Supervisory Board members attended less than half of the meetings. We took our decisions on the basis of detailed reports
and draft resolutions submitted by the Executive Board. We were also informed of projects and transactions of special
importance or urgency between meetings. The Supervisory Board passed the resolutions required of it by law or the Articles
of Incorporation. Where necessary, it also did so in committee meetings. As Chairman of the Supervisory Board, I was
constantly in touch with the Chairman of the Executive Board in order to discuss events of material importance to the
RWE Group’s situation and development.
Main points of debate. One of the focal topics of our discussions in fiscal 2011 was the German government’s U-turn in
energy policy following the reactor incident at Fukushima and its effects on the RWE Group’s earnings. The Executive Board
provided us with detailed reports on the Fukushima events. We were also informed comprehensively about the legal
assessment of the resolutions passed on nuclear energy by the German government and on the lawsuits filed in this context.
The Executive Board also informed us of the political situation in Libya and Egypt, countries in which RWE Dea is active. Also
at the centre of our debates were the sale of a 74.9 % stake in Amprion and of our minority interest in the Rostock hard coal-
fired power station as well as further divestment projects. Moreover, we concerned ourselves with the acquisition of the
Dutch company Energy Resources Holding and progress made in our power plant new-build projects.
At an extraordinary meeting, we directed our attention to the Executive Board’s concept for the RWE Group’s strategic
alignment and the strengthening of its financial power. With regards to the Executive Board’s proposed issuance of new RWE
shares by making use of authorised capital and of treasury shares, we transferred the powers held by the Supervisory Board
to a committee set up for this purpose. The focal points of one of our ordinary sessions included the prospects of generating
electricity from renewables, the expansion of which is a core element of RWE’s strategy.
The Executive Board regularly informed us of the revenue and earnings, measures to reduce costs, and price developments
on energy markets. At our session on 12 December 2011, following in-depth consultations, we adopted the Executive
Board’s planning for 2012 and the forecasts for 2013 and 2014. We received detailed commentary in cases where there were
deviations from plans and goals established previously.
Another item we approved at the meeting on 12 December 2011 was the requirements that have to be met by members of
the Executive and Supervisory Boards. These requirements are designed to ensure that the selection of new Supervisory and
Executive Board members is conducted in an orderly fashion and is based on objective criteria.
2.1 SupErviSOrY bOard rEpOrT
102 supervisory board report RWE Annual Report 2011

Dr. Manfred Schneider, Chairman of the Supervisory Board of RWE AG
Conflicts of interest. Good corporate governance entails the members of the Supervisory Board disclosing potential conflicts
of interest. No such notifications were made in the year under review.
Committees. The Supervisory Board has five regular committees. Their members are listed on page 193. These committees
are charged with preparing for the Supervisory Board meetings, including drafting resolutions. In certain cases, they exercise
decision-making powers conferred on them by the Supervisory Board. The committee chairmen regularly informed the
Supervisory Board of their work.
The Executive Committee convened one extraordinary and one ordinary meeting in the 2011 financial year. Among other
things, it did preparatory work for the Supervisory Board debates regarding the planning for fiscal 2012 and forecasts for
2013 and 2014.
The Audit Committee convened five times. It discussed at length the quarterly financial reports, the half-year financial
statements and the annual financial statements. In addition, it prepared the award of the audit contract to the independent
auditor, including setting the priorities of the audit and the fee agreement. Special attention was paid to the Group’s risk
management and the accounting-related internal control system. Furthermore, the committee dealt with compliance issues
and the audit results of the internal audit department as well as its audit schedule. A large number of other topics were on
the committee’s agenda in fiscal 2011, including the refinement of RWE Supply & Trading’s internal control system, the RWE
Group’s budgeting and controlling system, the state of information safety, sustainability reporting, the ongoing gas contract
supervisory board report 103To our investors Review of operations our responsibility
Responsibility statement consolidated financial statements Further information
renegotiations, the power plant new-build programme, and the economic situation in the German network business as well
as at RWE Innogy. In the meetings on 7 November 2011 and 27 February 2012, the Executive Board reported on the sample
audit of the annual financial statements for the Group and RWE Aktiengesellschaft conducted by the German Financial
Reporting Enforcement Panel (DPR) on 31 December 2010. The sample audit was completed by DPR without it identifying
any errors in our reporting. In addition, the committee discussed the annual and interim financial statements at length with
the Executive Board and the independent auditor before they were published. The independent auditor was present at all of
the committee meetings, participated in the debates, and reported on his audit and /or his audit-like review.
The Personnel Affairs Committee held three meetings. Debates primarily addressed the amount of Executive Board
remuneration and the compensation system. Furthermore, the committee prepared the Supervisory Board’s personnel-
related decisions.
The Nomination Committee was in session once, during which it prepared the candidate proposals for the Annual General
Meeting on 20 April 2011.
In the 2011 financial year, there was again no reason to convene the Mediation Committee, which complies with
Sec. 27, Para. 3 of the German Co-Determination Act.
In August 2011, we established a Financial Structure Improvement Committee, which convened three times. The committee
members concerned themselves in detail with the capital increase implemented in the year under review. In December 2011,
the committee approved the use of authorised capital in exchange for a cash contribution and the price for placing the new
shares and adopted the resulting amendments to the company’s Articles of Incorporation. The committee’s work ended on
completion of the capital increase at the end of 2011.
Financial statements for fiscal 2011. PricewaterhouseCoopers Aktiengesellschaft Wirtschaftsprüfungsgesellschaft
scrutinised and issued an unqualified auditor’s opinion on the 2011 financial statements of RWE Aktiengesellschaft, which
were prepared by the Executive Board in compliance with the German Commercial Code, the financial statements of the
Group, which were prepared in compliance with International Financial Reporting Standards (IFRS) pursuant to Sec. 315a of
the German Commercial Code, the combined review of operations for RWE Aktiengesellschaft and the Group, and the
accounts. In addition, PricewaterhouseCoopers found that the Executive Board had established an appropriate early risk
detection system. The company was elected independent auditor by the Annual General Meeting on 20 April 2011 and
commissioned by the Supervisory Board to audit the financial statements of RWE AG and the Group.
Documents supporting the annual financial statements, the annual report and the audit reports were submitted to the
members of the Supervisory Board in good time. Furthermore, the Executive Board commented on the documents in the
Supervisory Board’s balance sheet meeting of 28 February 2012. The independent auditor reported at this meeting on the
material results of the audit and was available to provide supplementary information. The Audit Committee had previously
concerned itself in depth with the financial statements of RWE Aktiengesellschaft and the Group, as well as audit reports,
during its meeting on 27 February 2012, with the auditor present. It had recommended that the Supervisory Board approve
the financial statements as well as the appropriation of profits proposed by the Executive Board.
At its meeting on 28 February 2012, the Supervisory Board reviewed the financial statements of RWE Aktiengesellschaft and
the Group, the combined review of operations for RWE Aktiengesellschaft and the Group, and the proposed appropriation
of distributable profit. No objections were raised as a result of this review. As recommended by the Audit Committee, the
Board approved the results of the audits of both financial statements and adopted the annual financial statements of
RWE Aktiengesellschaft and the Group. The 2011 annual financial statements are thus adopted. The Supervisory Board
concurs with the proposed appropriation of profits, which envisages a dividend payment of €2 per share.
RWE Annual Report 2011104 supervisory board report
Changes in personnel on the Supervisory and Executive Boards. The tenure of the members of the Supervisory Board
ended on conclusion of the Annual General Meeting on 20 April 2011. The following shareholder representatives were
re-elected to the Board: Ms. Dagmar Mühlenfeld, Dr. Paul Achleitner, Mr. Carl-Ludwig von Boehm-Bezing, Mr. Frithjof Kühn,
Dr. Manfred Schneider, Dr.-Ing. Ekkehard D. Schulz, Dr. Wolfgang Schüssel and Dr. Dieter Zetsche. Dr. Gerhard Langemeyer
and Dr. Wolfgang Reiniger retired from the Supervisory Board. They are succeeded by Messrs. Ullrich Sierau and Roger Graef.
The re-elected employee representatives were Ms. Dagmar Schmeer as well as Messrs. Frank Bsirske, Werner Bischoff, Heinz
Büchel, Dieter Faust, Hans Peter Lafos, Uwe Tigges and Manfred Weber. Messrs. Andreas Henrich and Günter Reppien retired
from the Supervisory Board. They were replaced by Ms. Christine Merkamp and Mr. Manfred Holz. At the Supervisory Board’s
constituent meeting on 20 April 2011, I was confirmed as Chairman of the Supervisory Board and Frank Bsirske as my
deputy. In addition, the committees were re-staffed. In accordance with the German Stock Corporation Act, Carl-Ludwig von
Boehm-Bezing was appointed independent financial expert of the Supervisory Board and of the Audit Committee.
The Supervisory Board thanks its exiting members for their dedicated and constructive work as well as for their commitment
to the company.
At its session on 8 August 2011, the Supervisory Board appointed Mr. Peter Terium Deputy Chairman of the Executive
Board of RWE Aktiengesellschaft with effect from 1 September 2011. As of 1 July 2012, the Supervisory Board appointed
Mr. Terium successor to Dr. Jürgen Großmann as President and CEO and Dr. Rolf Martin Schmitz his deputy. Dr. Großmann’s
tenure was ended with effect from 30 June 2012.
I wish to express my gratitude to the entire workforce for the work it did in the past year. Our employees’ dedication and
expertise made a substantial contribution to RWE being able to master the challenges it faced in 2011, despite the difficult
framework conditions.
On behalf of the Supervisory Board
Dr. Manfred Schneider
Chairman
Essen, 28 February 2012
To our investors Review of operations our responsibility
Responsibility statement consolidated financial statements Further information
supervisory board report 105
Responsible, transparent and long-term corporate governance has always been given substantial significance at RWE.
The latest version of the German Corporate Governance Code introduced in 2002 acts as a guideline for us. In the middle
of 2010, diversity recommendations were included in the Code, which required RWE to do a lot of preparatory work
and thus could not be implemented immediately. We made up this ground in the financial year that just ended. Since
December 2011 we have once again complied with all of the points of the Code’s recommendations.
The German Corporate Governance Code. ‘Corporate
governance’ defines the responsible and transparent
management and monitoring of a company, focused on
long-term commercial success. RWE allows itself to be
judged by this. We use the recommendations of the
German Corporate Governance Code (hereinafter referred
to as the ‘Code’) as the benchmark for this. The Code aims
to increase the confidence placed by investors, customers,
employees and the public in German listed companies.
The Government Commission of the German Corporate
Governance Code submitted the first version of the
Code in February 2002. Since then, the Commission has
reviewed it every year against the backdrop of domestic
and international developments and adapted it whenever
necessary. Last year was the first year in which no changes
were made. The version of the Code announced in the
electronic edition of the German Federal Gazette on
2 July 2010 thus remains valid.
Diversity in supervisory and management boards. In the
fiscal year that just ended, we took measures to follow the
recommendations concerning diversity in supervisory and
management boards, which we were unable to comply with
in the last declaration of compliance we made in February
2011. These recommendations had been included in the
Code in 2010. They require supervisory boards to establish
specific goals regarding their composition (Item 5.4.1).
Taking into account the company‘s situation, the objectives
must consider the company‘s international activity, potential
conflicts of interest of the supervisory board members and
diversity, as well as specifying an age limit. In particular,
women are to be represented appropriately. The Code
further recommends that companies report on their goals
concerning the composition of their supervisory boards and
the status of their implementation in future corporate
governance reports (cf. Item 5.4.1, Para 3). With respect to
the staffing of management boards, supervisory boards are
to ensure compliance with diversity requirements, with due
regard to the appropriate representation of women
(Item 5.1.2). The same recommendation was issued for
management boards in relation to the staffing of
management positions (Item 4.1.5).
In order to comply with the recommendations, at its meeting
on 12 December 2011 the Supervisory Board of RWE AG
adopted the requirements that have to be met by members
of the Executive and Supervisory Boards. The requirements
ensure that new members of these boards are selected in an
orderly fashion and that this selection is based on objective
criteria. The following goals were set with respect to staffing
the Supervisory Board:
• As envisaged by the German Stock Corporation Act and
the German Corporate Governance Code, companies are
to ensure that their supervisory boards provide qualified
supervision and advice. The goal is to have at least one
supervisory board member as a competent contact for
every aspect of supervisory board activity in order for the
necessary knowledge and experience to be represented
comprehensively among all supervisory board members.
• Individuals who may be put up as candidates must have
the integrity, commitment, independence and personality
necessary to perform the tasks of a supervisory board
member in a major stock corporation with international
activities and to maintain the company’s reputation in
public. Proposals for candidates must take account of the
situation specific to the company and of diversity, while in
particular ensuring an appropriate degree of female
representation. Women currently account for 15 % of our
Supervisory Board members. We intend to increase this
ratio to 20 % over the medium term. This would bring it in
2.2 COrpOraTE gOvErNaNCE
RWE Annual Report 2011106 corporate governance
line with the female representation among RWE’s staff in
Germany. We intend to achieve this goal early on, when
re-staffing positions that become vacant through natural
attrition, and no later than the next Supervisory Board
elections in 2016. Furthermore, we want to secure the
international experience of individuals who do not come
from Germany or have worked outside Germany for an
extended period of time.
• Supervisory Board members are expected to know and
understand the RWE Group’s divisions, market
environment, customer needs and strategy. They must
possess all the skills required to perform the tasks of a
Supervisory Board member (e.g. for evaluating Executive
Board reports, business decisions and documents
supporting financial statements) or acquire these where
necessary.
• The requirements also include specific qualifications that
are of importance to business activity. For instance, these
may include experience from international activity or
leadership roles in politics and business as well as
expertise in the fields of energy, worker co-determination,
accounting and financial statement audits as well as
knowledge of the public sector.
• Supervisory boards must have an adequate number of
independent members. Independence is deemed to exist
if there are no business or personal relations with RWE AG
or a Group company which could cause a permanent
conflict of interest. Individuals who advise or sit on a
committee of a major competitor of RWE may not belong
to the Supervisory Board.
• Supervisory board members must have sufficient time to
perform their mandates with the requisite dedication and
care.
• When staffing vacancies, the search for candidates should
focus on those who are capable of providing expertise
that is either lacking or needs to be increased on the
Supervisory Board.
Some of the requirements described above were met when
re-staffing the Supervisory Board at the Annual General
Meeting on 20 April 2011, before the requirements were
adopted. They supplement the provisions already included
in the Supervisory Board’s bylaws, in particular relating to
the age limit.
Since we adopted the requirements for the Executive and
Supervisory Boards in December 2011, we have again
complied with all of the recommendations of the current
version of the Code and take up its suggestions, with a few
exceptions.
Our listed Group company Lechwerke AG is also putting the
Code into practice. However, the specifics of membership in
the Group must be taken into account in this context.
Lechwerke AG has included information on the deviations
from the Code’s recommendations in its statement of
compliance.
Directors’ dealings and potential conflicts of interest.
Transparency is a core element of good corporate
governance. It is indispensable, especially in cases where
transactions concluded by the Executive Board may lead to
conflicts of interest. We would like to highlight the following
aspects of RWE’s corporate governance practice:
• Material transactions concluded between RWE or a Group
company and an Executive Board member or related party
were in line with prevailing market standards. No conflicts
of interest of members of the Executive Board going
above and beyond this were reported. No Supervisory
Board member concluded a contract with an RWE Group
company.
• Executive Board members, related parties and members
of the Supervisory Board purchased RWE shares in the
year under review. No sales were notified to us. We were
notified of transactions in accordance with Sec. 15a of the
German Stock Corporation Act. We published information
on them throughout Europe.
The RWE shares and related financial instruments directly or
indirectly held by members of the Executive and Supervisory
Boards account for less than 1 % of the share capital.
To our investors Review of operations our responsibility
Responsibility statement consolidated financial statements Further information
corporate governance 107
We publish further information on our corporate governance
practices on the internet at www.rwe.com/corporate-
governance . This web page also provides access to our
Articles of Incorporation, the bylaws of the Supervisory
Board and the Executive Board, RWE’s Code of Conduct, all
the corporate governance reports and statements of
compliance as well as the corporate governance declaration
in accordance with Sec. 289a of the German Commercial
Code.
Statement of compliance in accordance with Sec. 161 of
the German Stock Corporation Act. After an orderly audit,
the Executive and Supervisory Boards of RWE AG issued the
following declaration of compliance:
Between its last statement of compliance on 22 February
2011 and 11 December 2011, RWE Aktiengesellschaft
complied with all of the recommendations of the
Government Commission of the German Corporate
Governance Code issued in the 2 July 2010 version of the
Code, with the following exception:
The diversity recommendations set out in Item 5.1.2,
Sentence 2 and Item 5.4.1, Paras. 2 and 3 were not fully
complied with in the past. Ensuring diversity was and is
common practice throughout the Group. Among other
RWE Aktiengesellschaft
On behalf of the Supervisory Board On behalf of the Executive Board
Dr. Manfred Schneider Dr. Jürgen Großmann Peter Terium
Essen, 28 February 2012
things, we have had diversity programmes tailored to
increase the share of women in managerial positions for
quite a while. However, an overall concept for achieving
diversity goals when staffing the Executive Board had
yet to be created. The same applied to the staffing of the
Supervisory Board. As before, the Nomination Committee
and the plenary session of the Supervisory Board considered
the issue of diversity, RWE‘s international operations,
potential conflicts of interest, and the age limit established
for Supervisory Board members when selecting the
candidates for the election of the shareholder
representatives held on 20 April 2011. However, no
specific objectives existed for the staffing of that Board at
that time. The Supervisory Board of RWE AG was of the
opinion that the establishment of such goals and of an
overall concept required extensive preparatory work and
in-depth discussions, which have since been completed.
On 12 December 2011, the Supervisory Board adopted
requirements for its members and for those of the Executive
Board, thus creating a concept for achieving diversity targets.
Since 12 December 2011, RWE Aktiengesellschaft has
complied with all of the recommendations of the
Government Commission of the German Corporate
Governance Code contained in the 2 July 2010 version
of the Code.
RWE Annual Report 2011108 corporate governance
Executive Board compensation
Compensation structure. The structure and amount of
Executive Board member compensation are determined by
the Supervisory Board and reviewed on a regular basis. The
existing compensation system, which was approved by the
2010 Annual General Meeting, ensures that the structure
and amount of Executive Board member compensation is in
line with common practice within the Group and on the
market. It takes into account not only personal performance,
but also RWE’s business situation, performance and
prospects for the future.
The Executive Board’s total remuneration is essentially made
up of short-term components such as the base pay and
bonus as well as a long-term share-based component
(‘performance shares’). With target fulfilment at 100 %, base
pay, the bonus and the performance shares account for
approximately 30 %, 40 % and 30 % of total remuneration,
respectively. The compensation components are presented
in further detail hereinafter.
Short-term compensation components. Executive Board
members receive cash compensation made up of a base
salary, which is independent of performance, as well as a
performance-based bonus, which is therefore variable.
The baseline bonus contractually agreed in addition to the
fixed compensation consists of a company bonus and an
individual component, with a 70:30 split. The company
bonus is based on the degree to which the value added
agreed at the beginning of the fiscal year has been achieved.
If the actual and target figures are identical, the degree to
which the target has been achieved is 100 %, and the
company bonus is identical to the contractually agreed
baseline amount. Depending on the value added, the
company bonus can range between 0 % and 150 % of the
baseline bonus amount. The personal bonus depends on the
degree to which an Executive Board member achieves the
performance goals agreed with the Chairman of the
Supervisory Board at the beginning of the financial year. The
maximum degree to which this target can be achieved is
130 %.
Since fiscal 2010, RWE has been paying only 75 % of the
bonus. The remaining 25 % is withheld for a period of three
years. A review based on what is termed a ‘bonus malus
factor’ is conducted by the Supervisory Board at the end of
the three-year period, in order to determine whether the
Executive Board has managed the company sustainably.
Only if this applies is the retained part of the bonus paid.
The development of the Group’s value added determines
45 % of the bonus malus factor. Another 45 % is determined
on the basis of a company-specific Corporate Responsibility
(CR) Index, which builds on the sustainability reporting
that has been a fixture at RWE for many years and reflects
RWE’s environmental and social activity. The remaining
10 % of the bonus malus factor is determined by the Group’s
internal Motivation Index, which measures employee
commitment and satisfaction. Before the three-year period,
the Supervisory Board establishes binding target figures
for value added, the CR Index, and the Motivation Index. At
the end of the period, these target figures are compared to
the figures actually achieved. The result of this comparison
determines whether the retained part of the bonus is paid as
well as its amount. The better the figures actually achieved,
the higher the bonus malus factor. It may vary between
0 % and 130 %.
2.3 COMpENSaTiON rEpOrT
Part of good corporate governance involves making the remuneration of management and supervisory boards
transparent. The principles of RWE AG’s compensation system as well as its structure and payments are presented on
the following pages. As in preceding years, RWE fully complies with the recommendations of the German Corporate
Governance Code. The compensation report is part of the combined review of operations and the corporate governance
report.
compensation report 109To our investors Review of operations our responsibility
Responsibility statement consolidated financial statements Further information
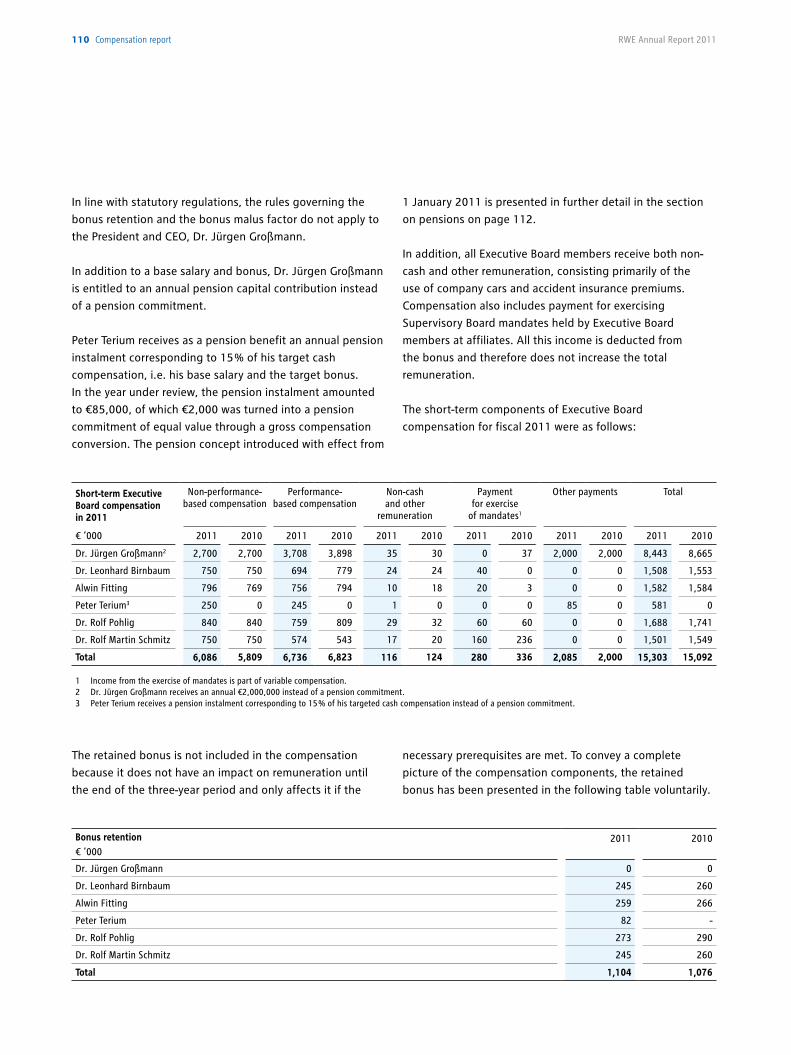
The retained bonus is not included in the compensation
because it does not have an impact on remuneration until
the end of the three-year period and only affects it if the
Short-term Executive Board compensation in 2011
Non-performance-based compensation
Performance-based compensation
Non-cashand other
remuneration
Payment for exercise
of mandates1
Other payments Total
€ ‘000 2011 2010 2011 2010 2011 2010 2011 2010 2011 2010 2011 2010
Dr. Jürgen Großmann2 2,700 2,700 3,708 3,898 35 30 0 37 2,000 2,000 8,443 8,665
Dr. Leonhard Birnbaum 750 750 694 779 24 24 40 0 0 0 1,508 1,553
Alwin Fitting 796 769 756 794 10 18 20 3 0 0 1,582 1,584
Peter Terium3 250 0 245 0 1 0 0 0 85 0 581 0
Dr. Rolf Pohlig 840 840 759 809 29 32 60 60 0 0 1,688 1,741
Dr. Rolf Martin Schmitz 750 750 574 543 17 20 160 236 0 0 1,501 1,549
Total 6,086 5,809 6,736 6,823 116 124 280 336 2,085 2,000 15,303 15,092
1 Income from the exercise of mandates is part of variable compensation. 2 Dr. Jürgen Großmann receives an annual €2,000,000 instead of a pension commitment. 3 Peter Terium receives a pension instalment corresponding to 15 % of his targeted cash compensation instead of a pension commitment.
Bonus retention€ ‘000
2011 2010
Dr. Jürgen Großmann 0 0
Dr. Leonhard Birnbaum 245 260
Alwin Fitting 259 266
Peter Terium 82 -
Dr. Rolf Pohlig 273 290
Dr. Rolf Martin Schmitz 245 260
Total 1,104 1,076
necessary prerequisites are met. To convey a complete
picture of the compensation components, the retained
bonus has been presented in the following table voluntarily.
In line with statutory regulations, the rules governing the
bonus retention and the bonus malus factor do not apply to
the President and CEO, Dr. Jürgen Großmann.
In addition to a base salary and bonus, Dr. Jürgen Großmann
is entitled to an annual pension capital contribution instead
of a pension commitment.
Peter Terium receives as a pension benefit an annual pension
instalment corresponding to 15 % of his target cash
compensation, i.e. his base salary and the target bonus.
In the year under review, the pension instalment amounted
to €85,000, of which €2,000 was turned into a pension
commitment of equal value through a gross compensation
conversion. The pension concept introduced with effect from
1 January 2011 is presented in further detail in the section
on pensions on page 112.
In addition, all Executive Board members receive both non-
cash and other remuneration, consisting primarily of the
use of company cars and accident insurance premiums.
Compensation also includes payment for exercising
Supervisory Board mandates held by Executive Board
members at affiliates. All this income is deducted from
the bonus and therefore does not increase the total
remuneration.
The short-term components of Executive Board
compensation for fiscal 2011 were as follows:
110 compensation report RWE Annual Report 2011
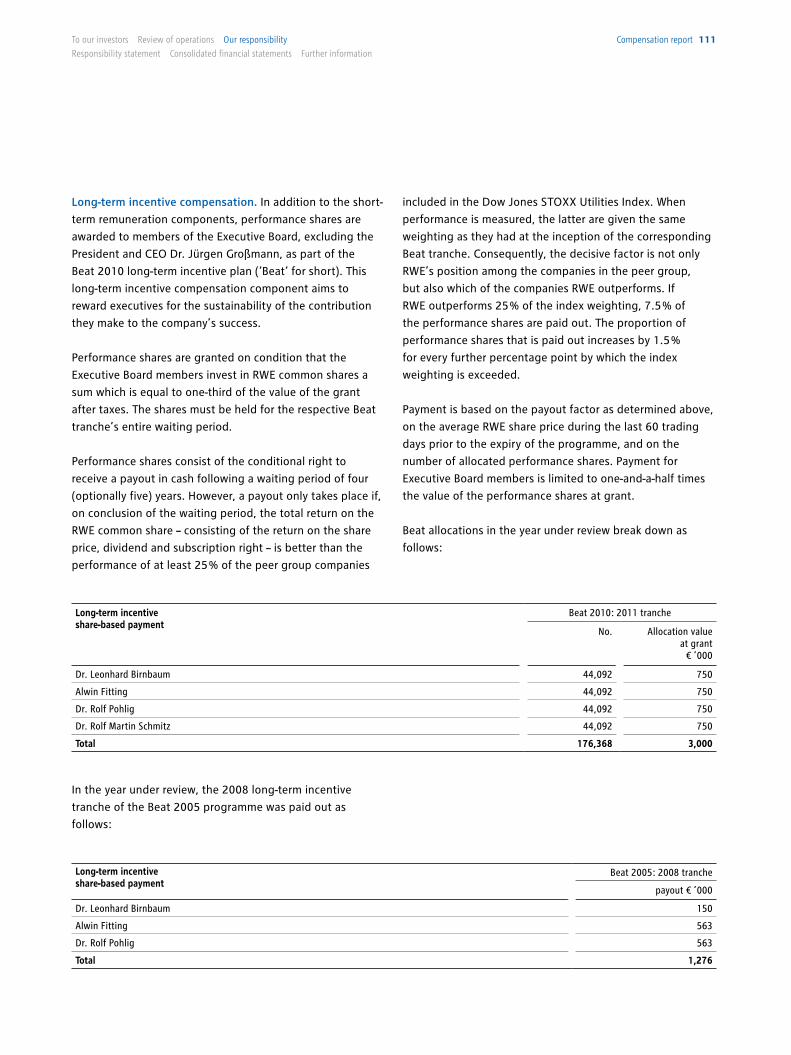
Long-term incentive compensation. In addition to the short-
term remuneration components, performance shares are
awarded to members of the Executive Board, excluding the
President and CEO Dr. Jürgen Großmann, as part of the
Beat 2010 long-term incentive plan (‘Beat‘ for short). This
long-term incentive compensation component aims to
reward executives for the sustainability of the contribution
they make to the company’s success.
Performance shares are granted on condition that the
Executive Board members invest in RWE common shares a
sum which is equal to one-third of the value of the grant
after taxes. The shares must be held for the respective Beat
tranche’s entire waiting period.
Performance shares consist of the conditional right to
receive a payout in cash following a waiting period of four
(optionally five) years. However, a payout only takes place if,
on conclusion of the waiting period, the total return on the
RWE common share – consisting of the return on the share
price, dividend and subscription right – is better than the
performance of at least 25 % of the peer group companies
included in the Dow Jones STOXX Utilities Index. When
performance is measured, the latter are given the same
weighting as they had at the inception of the corresponding
Beat tranche. Consequently, the decisive factor is not only
RWE’s position among the companies in the peer group,
but also which of the companies RWE outperforms. If
RWE outperforms 25 % of the index weighting, 7.5 % of
the performance shares are paid out. The proportion of
performance shares that is paid out increases by 1.5 %
for every further percentage point by which the index
weighting is exceeded.
Payment is based on the payout factor as determined above,
on the average RWE share price during the last 60 trading
days prior to the expiry of the programme, and on the
number of allocated performance shares. Payment for
Executive Board members is limited to one-and-a-half times
the value of the performance shares at grant.
Beat allocations in the year under review break down as
follows:
In the year under review, the 2008 long-term incentive
tranche of the Beat 2005 programme was paid out as
follows:
Long-term incentive share-based payment
Beat 2005: 2008 tranche
payout € ’000
Dr. Leonhard Birnbaum 150
Alwin Fitting 563
Dr. Rolf Pohlig 563
Total 1,276
Long-term incentive share-based payment
Beat 2010: 2011 tranche
No. Allocation value at grant
€ ’000
Dr. Leonhard Birnbaum 44,092 750
Alwin Fitting 44,092 750
Dr. Rolf Pohlig 44,092 750
Dr. Rolf Martin Schmitz 44,092 750
Total 176,368 3,000
compensation report 111To our investors Review of operations our responsibility
Responsibility statement consolidated financial statements Further information
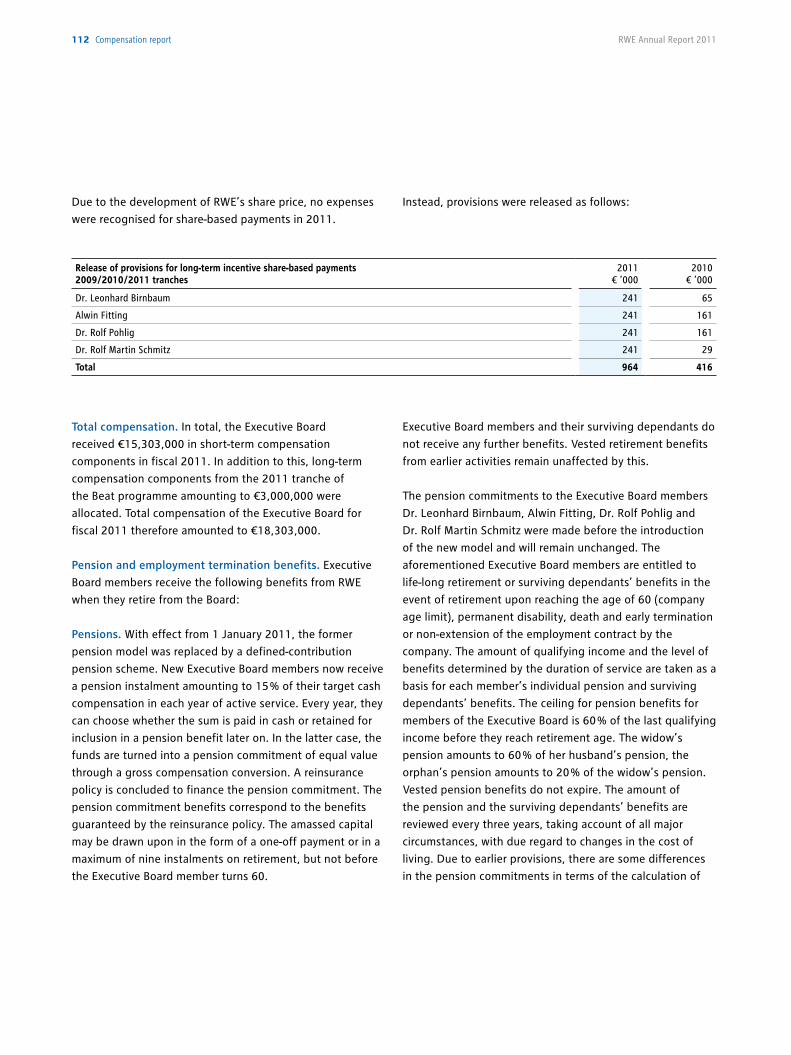
Release of provisions for long-term incentive share-based payments 2009/2010/2011 tranches
2011€ ‘000
2010€ ‘000
Dr. Leonhard Birnbaum 241 65
Alwin Fitting 241 161
Dr. Rolf Pohlig 241 161
Dr. Rolf Martin Schmitz 241 29
Total 964 416
Total compensation. In total, the Executive Board
received €15,303,000 in short-term compensation
components in fiscal 2011. In addition to this, long-term
compensation components from the 2011 tranche of
the Beat programme amounting to €3,000,000 were
allocated. Total compensation of the Executive Board for
fiscal 2011 therefore amounted to €18,303,000.
Pension and employment termination benefits. Executive
Board members receive the following benefits from RWE
when they retire from the Board:
Pensions. With effect from 1 January 2011, the former
pension model was replaced by a defined-contribution
pension scheme. New Executive Board members now receive
a pension instalment amounting to 15 % of their target cash
compensation in each year of active service. Every year, they
can choose whether the sum is paid in cash or retained for
inclusion in a pension benefit later on. In the latter case, the
funds are turned into a pension commitment of equal value
through a gross compensation conversion. A reinsurance
policy is concluded to finance the pension commitment. The
pension commitment benefits correspond to the benefits
guaranteed by the reinsurance policy. The amassed capital
may be drawn upon in the form of a one-off payment or in a
maximum of nine instalments on retirement, but not before
the Executive Board member turns 60.
Due to the development of RWE’s share price, no expenses
were recognised for share-based payments in 2011.
Instead, provisions were released as follows:
Executive Board members and their surviving dependants do
not receive any further benefits. Vested retirement benefits
from earlier activities remain unaffected by this.
The pension commitments to the Executive Board members
Dr. Leonhard Birnbaum, Alwin Fitting, Dr. Rolf Pohlig and
Dr. Rolf Martin Schmitz were made before the introduction
of the new model and will remain unchanged. The
aforementioned Executive Board members are entitled to
life-long retirement or surviving dependants’ benefits in the
event of retirement upon reaching the age of 60 (company
age limit), permanent disability, death and early termination
or non-extension of the employment contract by the
company. The amount of qualifying income and the level of
benefits determined by the duration of service are taken as a
basis for each member’s individual pension and surviving
dependants’ benefits. The ceiling for pension benefits for
members of the Executive Board is 60 % of the last qualifying
income before they reach retirement age. The widow’s
pension amounts to 60 % of her husband’s pension, the
orphan’s pension amounts to 20 % of the widow’s pension.
Vested pension benefits do not expire. The amount of
the pension and the surviving dependants’ benefits are
reviewed every three years, taking account of all major
circumstances, with due regard to changes in the cost of
living. Due to earlier provisions, there are some differences
in the pension commitments in terms of the calculation of
112 compensation report RWE Annual Report 2011
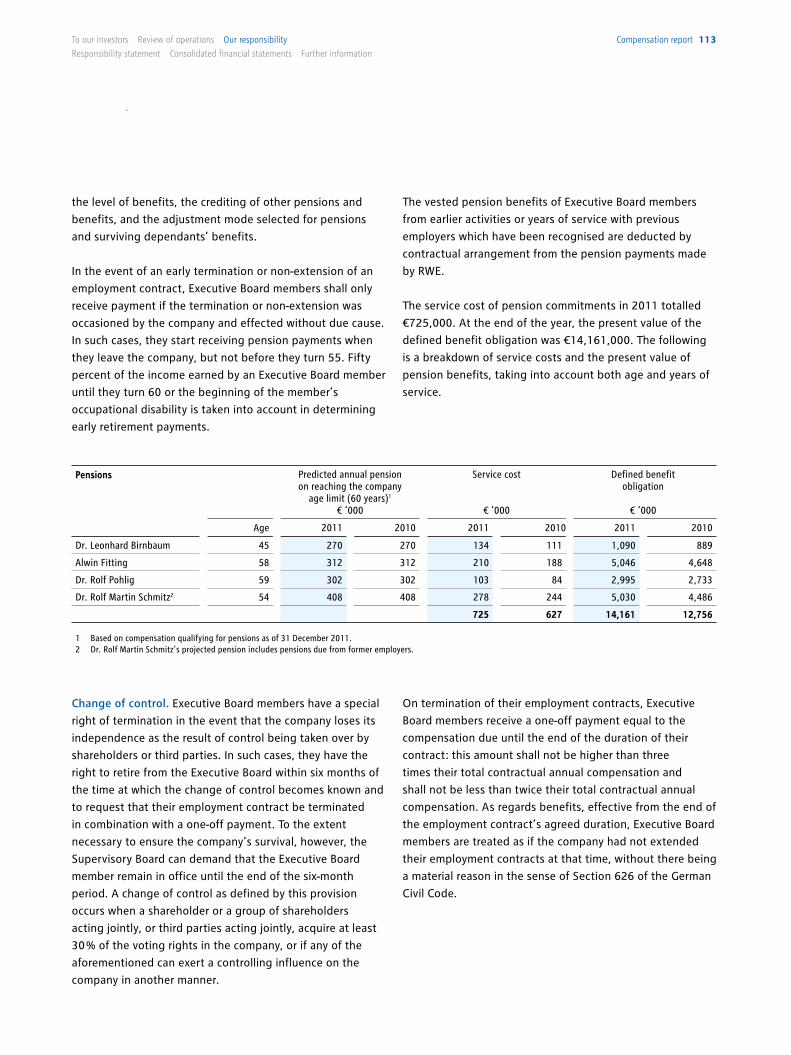
the level of benefits, the crediting of other pensions and
benefits, and the adjustment mode selected for pensions
and surviving dependants’ benefits.
In the event of an early termination or non-extension of an
employment contract, Executive Board members shall only
receive payment if the termination or non-extension was
occasioned by the company and effected without due cause.
In such cases, they start receiving pension payments when
they leave the company, but not before they turn 55. Fifty
percent of the income earned by an Executive Board member
until they turn 60 or the beginning of the member’s
occupational disability is taken into account in determining
early retirement payments.
Change of control. Executive Board members have a special
right of termination in the event that the company loses its
independence as the result of control being taken over by
shareholders or third parties. In such cases, they have the
right to retire from the Executive Board within six months of
the time at which the change of control becomes known and
to request that their employment contract be terminated
in combination with a one-off payment. To the extent
necessary to ensure the company’s survival, however, the
Supervisory Board can demand that the Executive Board
member remain in office until the end of the six-month
period. A change of control as defined by this provision
occurs when a shareholder or a group of shareholders
acting jointly, or third parties acting jointly, acquire at least
30 % of the voting rights in the company, or if any of the
aforementioned can exert a controlling influence on the
company in another manner.
The vested pension benefits of Executive Board members
from earlier activities or years of service with previous
employers which have been recognised are deducted by
contractual arrangement from the pension payments made
by RWE.
The service cost of pension commitments in 2011 totalled
€725,000. At the end of the year, the present value of the
defined benefit obligation was €14,161,000. The following
is a breakdown of service costs and the present value of
pension benefits, taking into account both age and years of
service.
On termination of their employment contracts, Executive
Board members receive a one-off payment equal to the
compensation due until the end of the duration of their
contract: this amount shall not be higher than three
times their total contractual annual compensation and
shall not be less than twice their total contractual annual
compensation. As regards benefits, effective from the end of
the employment contract’s agreed duration, Executive Board
members are treated as if the company had not extended
their employment contracts at that time, without there being
a material reason in the sense of Section 626 of the German
Civil Code.
Pensions Predicted annual pension on reaching the company
age limit (60 years)1
€ ‘000
Service cost
€ ‘000
Defined benefitobligation
€ ‘000
Age 2011 2010 2011 2010 2011 2010
Dr. Leonhard Birnbaum 45 270 270 134 111 1,090 889
Alwin Fitting 58 312 312 210 188 5,046 4,648
Dr. Rolf Pohlig 59 302 302 103 84 2,995 2,733
Dr. Rolf Martin Schmitz2 54 408 408 278 244 5,030 4,486
725 627 14,161 12,756
1 Based on compensation qualifying for pensions as of 31 December 2011. 2 Dr. Rolf Martin Schmitz’s projected pension includes pensions due from former employers.
compensation report 113To our investors Review of operations our responsibility
Responsibility statement consolidated financial statements Further information
The Chairman of the Executive Board, Dr. Jürgen Großmann,
was granted a special right of termination before the
amendment to the German Corporate Governance Code with
effect from 6 June 2008. On exercise of his contractually
secured special right of termination, Dr. Großmann shall
receive a one-off payment that covers all of the
remuneration due until the expiry of his employment
contract, including the amount contractually agreed instead
of a pension commitment.
In the event of a change of control, all the performance
shares granted to the Executive Board and entitled
executives shall expire. Instead, a compensatory payment
shall be made, which shall be determined when the takeover
offer is made. The amount shall be in line with the price
paid for RWE shares at the time of the takeover. This shall
then be multiplied by the final number of performance
shares. Performance shares shall also expire in the event
of a merger with another company. In this case, the
compensatory payment shall be calculated based on the
expected value of the performance shares at the time of
the merger. This expected value shall be multiplied by
the number of performance shares granted, pro-rated
up to the date of the merger.
In the event of a change of control, the Executive Board’s
retained bonuses are valued early and, if applicable, paid
out. The amount shall be in line with the average bonus
malus factor for the three preceding years.
Severance cap. If an Executive Board mandate is otherwise
terminated early without due cause, Executive Board
members shall receive a severance payment of no more than
two total annual compensations and no more than the
compensation due until the end of the employment
contract.
Other commitments. In agreement with the company,
Dr. Jürgen Großmann’s positions as member of the Executive
Board and its Chairman, which were scheduled to expire
as of 30 September 2012, will end early with effect from
30 June 2012. He will receive his base salary, bonus
and pension capital for the period from 1 July 2012 to
30 September 2012 in sums corresponding to those
established in his contract. Dr. Jürgen Großmann will not
receive a pension.
Supervisory Board compensation
The compensation of the Supervisory Board is set out in the
Articles of Incorporation and is determined by the Annual
General Meeting. Supervisory Board members receive a fixed
compensation of €40,000 per fiscal year for their services
after each fiscal year. The compensation increases by €225
for every €0.01 by which the dividend exceeds €0.10 per
common share.
The Chairperson of the Supervisory Board receives three
times and the Deputy Chairperson receives twice the
aforementioned amount. If a committee has been active
at least once in a fiscal year, committee members are
awarded one-and-a-half times the compensation and the
committee chairperson twice the compensation. If a
member of the Supervisory Board holds several offices on
the Supervisory Board of RWE AG concurrently, he or she
receives compensation only for the highest-paid position.
Out-of-pocket expenses are refunded.
114 compensation report RWE Annual Report 2011
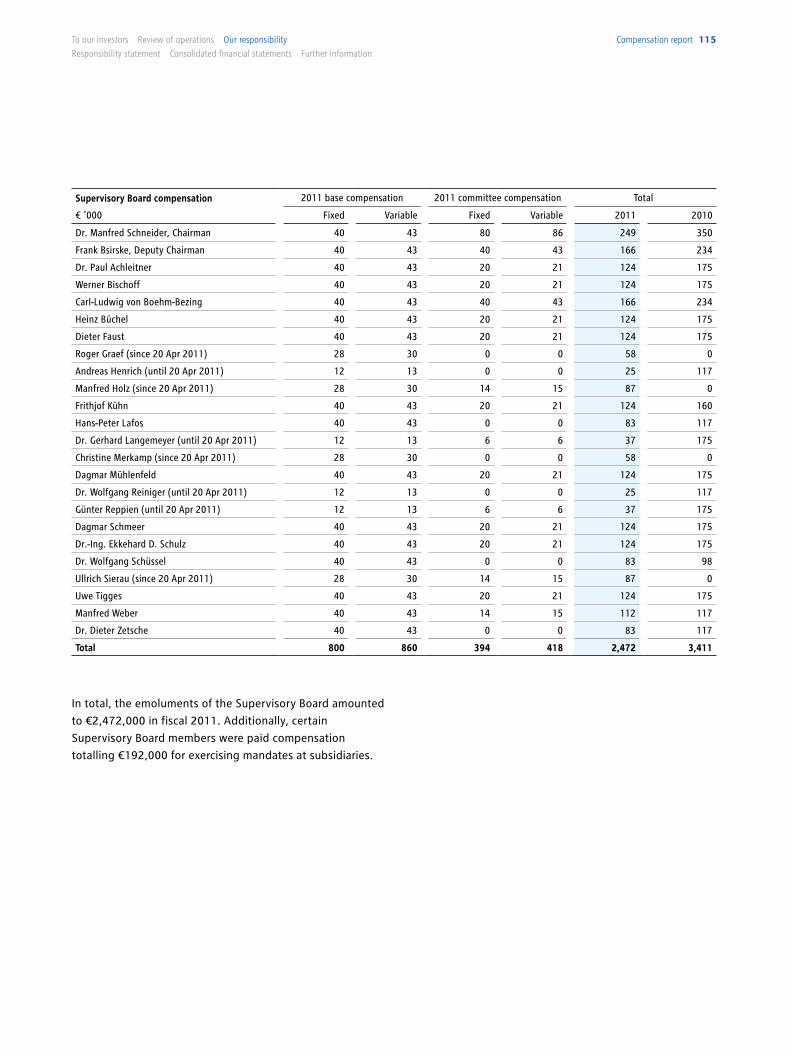
In total, the emoluments of the Supervisory Board amounted
to €2,472,000 in fiscal 2011. Additionally, certain
Supervisory Board members were paid compensation
totalling €192,000 for exercising mandates at subsidiaries.
Supervisory Board compensation 2011 base compensation 2011 committee compensation Total
€ ‘000 Fixed Variable Fixed Variable 2011 2010
Dr. Manfred Schneider, Chairman 40 43 80 86 249 350
Frank Bsirske, Deputy Chairman 40 43 40 43 166 234
Dr. Paul Achleitner 40 43 20 21 124 175
Werner Bischoff 40 43 20 21 124 175
Carl-Ludwig von Boehm-Bezing 40 43 40 43 166 234
Heinz Büchel 40 43 20 21 124 175
Dieter Faust 40 43 20 21 124 175
Roger Graef (since 20 Apr 2011) 28 30 0 0 58 0
Andreas Henrich (until 20 Apr 2011) 12 13 0 0 25 117
Manfred Holz (since 20 Apr 2011) 28 30 14 15 87 0
Frithjof Kühn 40 43 20 21 124 160
Hans-Peter Lafos 40 43 0 0 83 117
Dr. Gerhard Langemeyer (until 20 Apr 2011) 12 13 6 6 37 175
Christine Merkamp (since 20 Apr 2011) 28 30 0 0 58 0
Dagmar Mühlenfeld 40 43 20 21 124 175
Dr. Wolfgang Reiniger (until 20 Apr 2011) 12 13 0 0 25 117
Günter Reppien (until 20 Apr 2011) 12 13 6 6 37 175
Dagmar Schmeer 40 43 20 21 124 175
Dr.-Ing. Ekkehard D. Schulz 40 43 20 21 124 175
Dr. Wolfgang Schüssel 40 43 0 0 83 98
Ullrich Sierau (since 20 Apr 2011) 28 30 14 15 87 0
Uwe Tigges 40 43 20 21 124 175
Manfred Weber 40 43 14 15 112 117
Dr. Dieter Zetsche 40 43 0 0 83 117
Total 800 860 394 418 2,472 3,411
compensation report 115To our investors Review of operations our responsibility
Responsibility statement consolidated financial statements Further information
of our about 400 senior executives. In addition, we create
candidate pools for specific fields of activity. The basis for
this is the regular assessment of the potential of those of
our employees who demonstrate leadership skills. In 2011,
for the fourth time we used a method tailored to RWE’s
needs that measures skills such as entrepreneurial thinking
and ability to motivate employees to this end. Candidates
identified for possible succession are prepared for their
future tasks. This approach enabled us to staff about 90 % of
executive positions that became vacant last financial year
with people from within our own ranks.
Promoting diversity. Society increasingly demands that we
promote diversity. This is an area in which RWE is pursuing a
number of goals. In line with the international reach of our
business, we promote cross-country mobility within the
RWE Group and respect for people from all cultural
backgrounds. Moreover, we want to hire more women at
RWE. Our aim is also to have more female representation in
executive positions. At the end of 2011, 11 % of all executive
staff at RWE were women. We intend to double this ratio to
22 % by the end of 2018. One of the initiatives we have in
place for this purpose is a mentoring programme, which has
already been used by over 80 participants since it was
launched in 2007. In addition, we have created an
international network for women in managerial positions
and offer them specific training.
Work-life balance. It is a dream situation for many working
parents: the day care centre is close to the office, open from
early morning to evening, and offers individual care for
children, including the very youngest. By opening its doors
in the summer of 2011 in Essen, our Lumiland Day Care
Centre turned this dream into reality for the employees of
Attractive training offerings and scholarships. To meet
our long-term requirement for qualified employees, we are
training young adults in more than 30 commercial and
technical professions. RWE’s offering goes far above and
beyond imparting expert skills. Apprentices can participate
in ambitious projects or spend part of their apprenticeship
in Group companies outside Germany. In addition, we
enable them to combine an apprenticeship with studies.
By the end of 2011, some 3,000 young adults were
learning a profession at RWE. We offer significantly more
apprenticeships than we need to cover our own needs.
Our academic support programmes are designed to attract
young students to the Group early on. We are currently
supporting 64 students and doctoral candidates for about
four semesters through a scholarship within the scope of our
RWE Fellows programme. They are also provided with a
mentor from among our executives, who gives them insight
into the daily work at our company while promoting their
skills and providing them with practical experience. By
offering internships, we give students an opportunity to link
academic theory to business practice early on. Retaining
high performers is something we place special importance
on at RWE. Upon completion of their internship, they can be
recommended for an attractive programme that supports
participants in their personal and professional development
through continued-education seminars and networking
events, for example.
Early succession planning. Every entrepreneur wants to
hand over his or her ‘house’ in good order. What is a matter
of course for medium-sized enterprises also applies to large
corporations such as RWE. This is why, every year, we
identify employees who have the potential to succeed one
In most of RWE’s core markets, low birth rates cause skilled workers to become an increasingly scarce resource, and
competition for them fiercer. Our long-term success will therefore largely depend on how we manage to recruit,
promote and retain talent at RWE. We make sure that RWE is an attractive place to work: excellent training schemes,
support programmes for high-potential individuals, and flexible working opportunities are but a few of the numerous
assets which help us prevail when vying for the best talent.
2.4 wOrkFOrCE
116 Workforce RWE Annual Report 2011
RWE Group headquarters. More than 100 children are looked
after in Lumiland: the children of both RWE staff and families
living in the neighbourhood. We have undertaken to set up
company-sponsored nursery schools at major RWE sites in
Germany, in order to help as many employees as possible to
strike a healthy work-life balance. Children and careers
should not be mutually exclusive at RWE, neither for women
nor for men. The fact that the latter gender is increasingly
dedicated to family life is a pleasing development, which
we support. Last year, 246 fathers went on paternity leave,
more than ever before.
Ideas management. Employees who come up with ideas and
develop initiatives on top of performing their daily tasks at
work are a benefit to any company. We encourage this with
our groupwide ideas management system. This provides our
employees with an incentive to capitalise on their experience
and creativity in order to improve work processes. The result
is commendable: in the last fiscal year alone, some 6,800
ideas were submitted. We estimate the commercial benefit
to exceed €50 million per year. For example, an idea
submitted to improve cost transparency in IT led to six-digit
savings in just a few months. In the year under review,
we rewarded our employees for their suggestions for
improvement with about €2.6 million in bonuses. We are
building a new database system to facilitate the recording
and sharing of ideas, while saving costs.
Jump!2011, RWE’s start-up initiative. Last year, we took an
entirely new approach to leveraging the entrepreneurial and
innovative thinking of our employees, by launching the
Jump!2011 start-up initiative. The concept: staff members
develop new business models for RWE’s fields of activity,
either alone or in small teams. Employees who present
outstanding ideas can market these on their own behalf with
RWE’s support. Jump!2011 was started in May and ended in
February 2012 with the winners’ award ceremony. More than
300 employees from across the Group entered 223 ideas
into the contest. One in ten of these drafts was turned into a
bona fide business model with the assistance of experienced
RWE managers. Five teams presented their concepts to a
jury in the last project phase. Some of the ideas – not only
those of the winners – are so convincing that they are to be
put into practice with the support of RWE’s Executive Board.
Employee shares – participating in success. RWE’s
commercial success should benefit our employees as well.
Part of their compensation is linked to it. Through our
employee stock ownership plan, we give our personnel the
opportunity to take a direct stake in the company at
favourable conditions. In 2011, a total of 25,783 staff
members subscribed 442,692 shares. The take-up thus
amounted to 57 % of those eligible to participate. As the
shares were issued below their market price, this resulted in
an expense of €8.1 million. Our workforce currently owns
approximately 1 % of RWE’s subscribed capital.
HR Cockpit. We have created the HR Cockpit, a modern
information platform which helps our executives obtain a
better picture of their teams. The Cockpit provides data on
age structure, continued education, qualifications, and days
missed due to illness. Team managers receive this
information condensed into key figures (e.g. average age or
health ratio) or can run their own analyses. The HR Cockpit
particularly benefits executives with large teams. It supports
their staff management efforts and helps to identify any
need for action early. Following a pilot phase, we began
introducing the HR Cockpit throughout the Group in October
2011. It is already being used by some 1,000 executives.
Our 2011 Personnel Report, available at www.rwe.com ,
contains further information on our HR work.
Workforce 117To our investors Review of operations our responsibility
Responsibility statement consolidated financial statements Further information
(1) Climate protection. Generating electricity while
constantly reducing carbon dioxide emission levels is an
essential building block of our Group strategy. To this end,
we invest billions of euros. A large proportion of this
expenditure is used to expand our renewable generation
base. Furthermore, we are building state-of-the-art gas and
coal-fired power stations and taking plants with higher
emissions offline. Our objective is to reduce the carbon
dioxide emissions of our power plant fleet per MWh by more
than 20 % by 2020 compared to 2005. In the baseline year,
we emitted 0.79 metric tons of CO2 per MWh. We have
set ourselves a target of 0.62 metric tons. Initially, we
wanted to reduce the emission factor by 2020 even more.
However, Germany’s accelerated nuclear phase-out made
it necessary for us to adjust our objectives. Last year, we
had to shut down 2.4 GW in capacity which generates
electricity nearly free of carbon dioxide (the Biblis A and B
units). Consequently, our emission factor for 2011 was
0.79 metric tons of carbon dioxide per MWh, which is
clearly above the 0.73 recorded in 2010. Another RWE
nuclear power plant will be taken offline at the end of
2017 (Gundremmingen B). This affects our CO2 reduction
path through to 2020 significantly. Nevertheless, we are
continuing to transform our generation portfolio with
resolve: by 2020, we intend to increase the share of
renewables in our electricity production capacity, which
was about 8 % at the end of 2011, to at least 20 %.
(2) Energy efficiency. By modernising our power plants, we
are not only protecting the climate, but also conserving
limited resources such as coal and gas, as our new stations
have a higher degree of energy utilisation. On conclusion of
our ongoing power plant new-build programme in 2014, the
Ten fields of sustainable action. To us, sustainable business
operations are not an abstract concept. Our strategy in the
area of Corporate Responsibility (CR) covers ten fields of
action which we believe harbour the most important
challenges for RWE. Following in-depth dialogue with our
stakeholders, we identified the fields of action in 2007. We
have established goals for each of them, the achievement of
which we measure based on key performance indicators.
This gives our sustainability strategy a binding character.
Moreover, this makes our performance and progress both
transparent and measureable.
Whether and the degree to which we reach our CR targets
also affects the compensation of the members of the
Executive Board of RWE AG. Since 2010, 25 % of their annual
bonus has been retained for three years. At the end of this
period, the Supervisory Board decides, based on a bonus
malus factor, whether the Executive Board has run the
company in a sustainable manner. Only in such an event is
the retained bonus also paid out. The bonus malus factor
depends on several aspects, one of which is the
development of an index specific to RWE, which bears a
weighting of 45 %. This index measures the degree to which
we have achieved RWE’s sustainability objectives based on
the key performance indicators established for our CR action
fields.
In the following passages, we will present our goals and
measures in the ten CR action fields and demonstrate the
key performance indicators we use to gauge our success.
Further information can be found in the report entitled
‘Our Responsibility,’ which can be accessed on the internet
at www.rwe.com/cr-report .
When we invest in power stations or networks, we invest for decades. Sustainability is therefore at the centre of the
business model. In order to be successful in the long run, we need the acceptance of society, ranging from
policymakers and associations to employees and conservation organisations. In dialogue with these stakeholder
groups, we defined ten fields of action that are pivotal to RWE in terms of sustainability. In each action field, we pursue
specific, measureable goals. In addition, parts of Executive Board compensation are dependent on whether and the
degree to which these goals are achieved.
2.5 SuSTaiNabiliTY
118 sustainability RWE Annual Report 2011
degree of energy utilisation of our fossil fuel-fired power
plants should amount to 42 %. Last year, it was 41.3 %. We
also intend to further reduce the energy consumption of our
vehicle fleet and buildings. Moreover, we help our customers
to make more efficient use of energy in order to protect the
climate and save money while increasing quality of life. We
are doing this in various ways, including the use of smart
meters, automated domestic consumption (smart homes)
and the promotion of electric cars. Our German website at
www.energiewelt.de includes in-depth advice on how to
save energy as well as information on subsidy programmes
and manufacturer offers. We also put our expertise in the
field of energy efficiency at the disposal of commercial and
small industrial enterprises. Using cutting-edge measuring
technology and RWE’s energy controlling system, our
experts detect the weak points in a company and develop
business-specific optimisation measures. We have already
helped over 300 medium-sized enterprises in a wide range of
sectors to make more efficient use of energy, thereby
increasing their economic success.
(3) Innovation. Secure, affordable and environmentally
friendly energy supplies are unattainable without
technological progress. Therefore, we accord major
importance to research and development (R&D). We are
conducting over 200 projects along the entire value chain –
from raw material extraction and the conversion, distribution
and storage of energy to its use by the customer (see page
83 et seqq.). To manage our R&D activities, we set up a
groupwide innovation management system. We identify the
most strategically important issues for R&D work at the
beginning of every year. We measure our success by the
degree to which we have taken specific measures in these
areas and informed the public about our activities. Last year,
we addressed 95 % of the major R&D areas. We intend to
maintain this high coverage.
(4) Security of supply. Energy must be available whenever
it is needed. Our customers rely on us to ensure this – both
today and tomorrow. Therefore, RWE places great
importance on a widely diversified generation portfolio,
including nuclear, coal, gas and renewables. The availability
of coal and nuclear fuel has been secured long term. We
cover our need for gas with long-term agreements with
various producers, through purchases on liquid wholesale
markets and, to a small extent, through in-house production.
At present, however, the debate on security of supply is
focusing on another aspect: the stability of electricity
networks. Supply and demand must constantly be balanced
in order to keep network frequency stable. We aim to keep
the average annual system availability interruption duration
indicator (SAIDI) in Germany below 30 minutes per customer
from 2013 onwards. Based on the latest available statistics,
at just under 22 minutes, it was clearly below this mark in
2010. Nevertheless, we believe our goal is ambitious,
because the requirements placed on the capabilities and
operation of networks are rising due to the expansion of
renewable energy and the increasing use of decentralised
power generation units. Interruptions in the supply of gas
are much shorter, because the gas network acts as a buffer.
In 2010, they averaged under one minute per customer.
(5) Supply chain. When purchasing goods and services,
we always make sure that the price is right. However, it is
equally important that our contractual partners comply with
basic work and social standards and do business sustainably.
Our groupwide Code of Conduct forbids us to work with
companies which are known to infringe fundamental ethical
principles formulated by the UN Global Compact Initiative.
We therefore gather information about such violations.
For example, in 2011, we created the Bettercoal initiative
together with other major coal-based electricity generators
to gain more insight into working conditions in hard coal
mines. Within the scope of this initiative, independent
sustainability 119To our investors Review of operations our responsibility
Responsibility statement consolidated financial statements Further information
(7) Demographic change. In view of the low birth rates,
especially in Germany, we must see to it early on that RWE
retains access to adequately qualified staff over the long
term. This also involves avoiding disruption among the
workforce as well as losing know-how when significantly
represented age groups retire. We already take advantage
of many ways to attract young talent to our company and
create a working environment that meets their expectations.
In addition, we project our need for personnel over the long
term, determining by analysis whether there are manpower
shortage threats in the professions represented within the
Group. One of the tools we use in this analysis is a
demographic index, which measures the RWE Group’s age
structure. The higher the index score, the more evenly
the age groups are represented in our Group companies.
The best possible ranking is 100. In the financial year under
review, we achieved a score of 84 points. We intend to
maintain this level.
(8) Occupational health and safety management. We want
our employees to return home as healthy as when they
arrive at work. In order to do the best possible justice to this
ambition, we constantly work on improving occupational
health and safety. The measures taken as part of the
company health management system are tailored to
maintain staff performance. For example, we launched the
Finding a Balance initiative in 2011 to help our employees
prevent stress and better cope with the demands placed on
them at work and at home. This includes being of assistance
in looking after their children and relatives in need of care.
A nationwide campaign we also launched last year is Staying
Healthy: With All Your Heart for the prevention of
cardiovascular diseases.
experts will audit production sites worldwide from 2012
onwards. To ensure the sustainable cultivation of biomass
used to fire our power plants, we rely on independent
certification systems such as the Green Gold Label, which
was developed with the help of our Dutch Group company
Essent.
Our contracts for procuring staple goods and services
include provisions that oblige our suppliers to comply with
minimum international standards in relation to work
conditions and environmental protection. These include the
principles of the UN Global Compact. When purchasing
energy commodities, we undertake a risk assessment of our
business partners. Our goal for 2013 is for at least 95 % of
our purchasing volume to be covered by such minimum
standards and risk assessments. In 2011, the ratio was 93 %.
We have set up a quality management system for
purchases of plant and complex components. Last year,
RWE Technology, which is in charge of our conventional
power plant new builds, obtained ISO 9001 certification. As
a result, the company is obliged to verify compliance with
occupational and environmental standards by partner
companies and their vendors, for example by visiting their
premises.
(6) Pricing and marketplace. Competition on our electricity
and gas markets has become fiercer. Increasing numbers of
customers are willing to switch suppliers. In so doing, they
are primarily guided by price. We aim to have satisfied
customers whom we can retain over the long term because
they are convinced of the quality and value for money of our
product range. In 2010, we started measuring our success in
this respect in Germany using a loyalty index. It is based on
surveys of the residential and commercial customers we
supply with electricity. The index moves on a scale of
0 to 100 points. A score below 70 designates low satis-
faction, with values from 70 to 79 indicating mediocre satis-
faction and 80 points or more representing high satisfaction.
In the year under review, we improved from 71 (2010) to
73 points. Our current score is the minimum goal we set
ourselves for 2013.
120 sustainability RWE Annual Report 2011
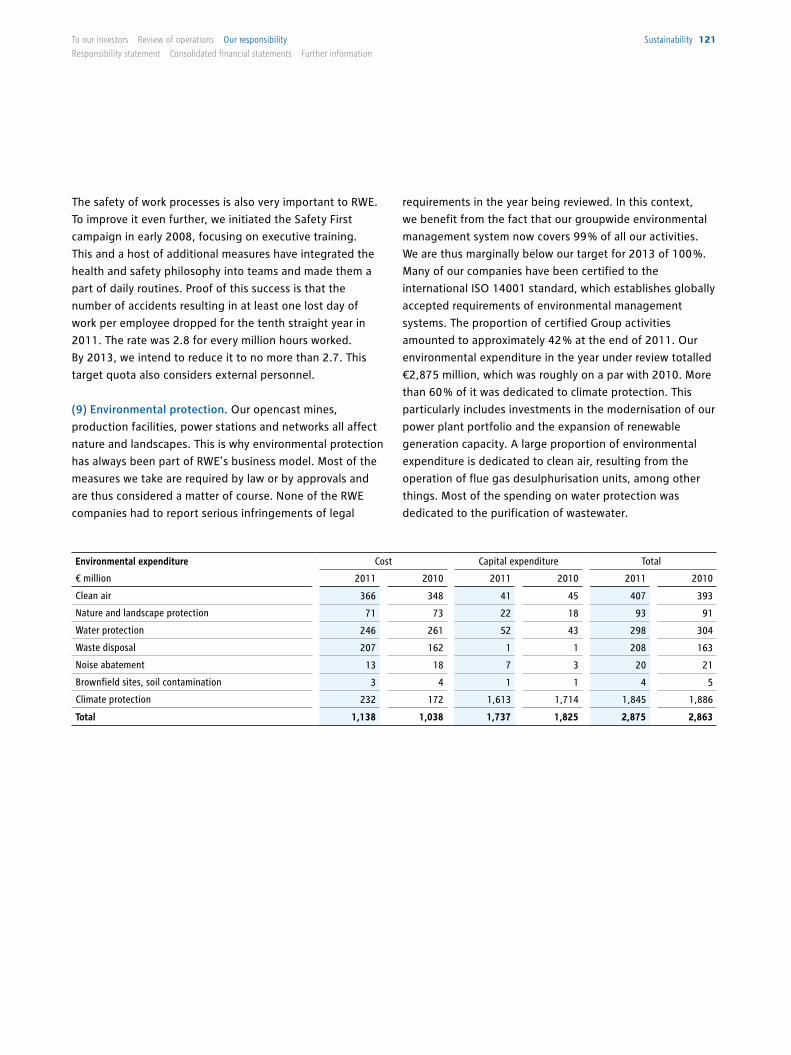
Environmental expenditure Cost Capital expenditure Total
€ million 2011 2010 2011 2010 2011 2010
Clean air 366 348 41 45 407 393
Nature and landscape protection 71 73 22 18 93 91
Water protection 246 261 52 43 298 304
Waste disposal 207 162 1 1 208 163
Noise abatement 13 18 7 3 20 21
Brownfield sites, soil contamination 3 4 1 1 4 5
Climate protection 232 172 1,613 1,714 1,845 1,886
Total 1,138 1,038 1,737 1,825 2,875 2,863
The safety of work processes is also very important to RWE.
To improve it even further, we initiated the Safety First
campaign in early 2008, focusing on executive training.
This and a host of additional measures have integrated the
health and safety philosophy into teams and made them a
part of daily routines. Proof of this success is that the
number of accidents resulting in at least one lost day of
work per employee dropped for the tenth straight year in
2011. The rate was 2.8 for every million hours worked.
By 2013, we intend to reduce it to no more than 2.7. This
target quota also considers external personnel.
(9) Environmental protection. Our opencast mines,
production facilities, power stations and networks all affect
nature and landscapes. This is why environmental protection
has always been part of RWE’s business model. Most of the
measures we take are required by law or by approvals and
are thus considered a matter of course. None of the RWE
companies had to report serious infringements of legal
requirements in the year being reviewed. In this context,
we benefit from the fact that our groupwide environmental
management system now covers 99 % of all our activities.
We are thus marginally below our target for 2013 of 100 %.
Many of our companies have been certified to the
international ISO 14001 standard, which establishes globally
accepted requirements of environmental management
systems. The proportion of certified Group activities
amounted to approximately 42 % at the end of 2011. Our
environmental expenditure in the year under review totalled
€2,875 million, which was roughly on a par with 2010. More
than 60 % of it was dedicated to climate protection. This
particularly includes investments in the modernisation of our
power plant portfolio and the expansion of renewable
generation capacity. A large proportion of environmental
expenditure is dedicated to clean air, resulting from the
operation of flue gas desulphurisation units, among other
things. Most of the spending on water protection was
dedicated to the purification of wastewater.
sustainability 121To our investors Review of operations our responsibility
Responsibility statement consolidated financial statements Further information
RWE qualifies for renowned sustainability index. Our
strategy in the field of sustainability and our high degree
of transparency were recognised once again in 2011.
In September, we were included in the Dow Jones
Sustainability Index (DJSI) for yet another year – for the
13th time in a row. Selections are made based on economic,
ecological and social criteria. RWE is represented in the
DJSI World and the DJSI Europe. DJSI is widely recognised as
the world’s prime index group for corporate performance in
the field of sustainability. It is established and published
by Sustainable Asset Management (SAM) in co-operation
with Dow Jones Indexes. We are one of the few German
companies to have belonged to it without interruption since
its inception in 1999.
Sustainability indicators reflect responsible action. Our
success in the field of corporate responsibility is reflected by
numerous indicators, and not only those used to determine
Executive Board compensation. The following is an overview
of the development of some key performance indicators
which we believe are particularly informative. They are
divided into categories, i.e. environment, society and
corporate governance. The selection of indicators is
orientated towards the recommendations of the Society of
Investment Professionals in Germany (DVFA).
(10) Community engagement. As we are an energy
company, we have strong links with the communities at our
sites: some of the relationships have been in existence for
decades. We are a reliable employer and principal in these
communities, where we work on social issues. Our charitable
activities are pooled in the RWE Foundation, which began
its work in 2009. It is endowed with a capital stock of
€56 million and promotes the education, culture and social
integration of children and teenagers. In the financial year
that just ended, it spent €1.4 million on this. Furthermore,
we support the strong effort put in by RWE employees for
social causes through the RWE Companius initiative. In 2011,
a total of €2.3 million was spent supporting more than
1,900 projects. All these measures benefit RWE, as they
improve our acceptance. Once a year, we commission an
opinion survey institute to identify how RWE is perceived
by the public in Germany when compared to its major
competitors. The most recent poll confirmed that, as in
2010, we had the best reputation in our peer group, a
position we intend to maintain.
122 sustainability RWE Annual Report 2011
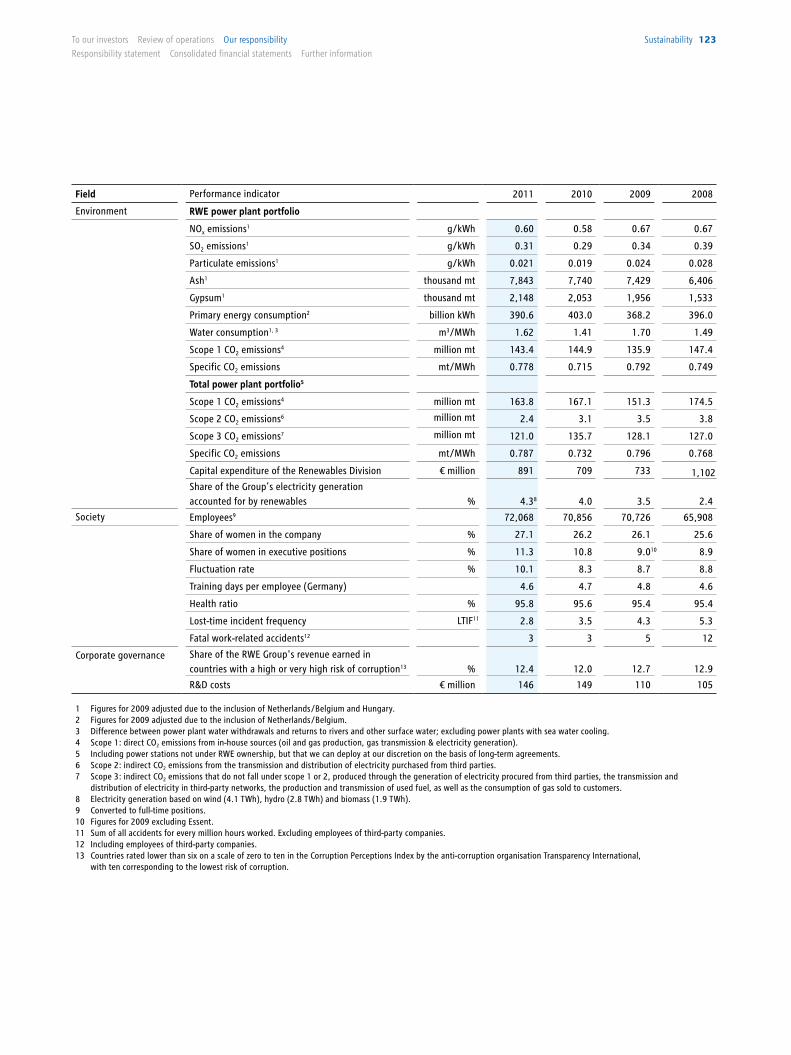
Field Performance indicator 2011 2010 2009 2008
Environment RWE power plant portfolio
NOx emissions1 g/kWh 0.60 0.58 0.67 0.67
SO2 emissions1 g/kWh 0.31 0.29 0.34 0.39
Particulate emissions1 g/kWh 0.021 0.019 0.024 0.028
Ash1 thousand mt 7,843 7,740 7,429 6,406
Gypsum1 thousand mt 2,148 2,053 1,956 1,533
Primary energy consumption2 billion kWh 390.6 403.0 368.2 396.0
Water consumption1, 3 m3/MWh 1.62 1.41 1.70 1.49
Scope 1 CO2 emissions4 million mt 143.4 144.9 135.9 147.4
Specific CO2 emissions mt/MWh 0.778 0.715 0.792 0.749
Total power plant portfolio5
Scope 1 CO2 emissions4 million mt 163.8 167.1 151.3 174.5
Scope 2 CO2 emissions6 million mt 2.4 3.1 3.5 3.8
Scope 3 CO2 emissions7 million mt 121.0 135.7 128.1 127.0
Specific CO2 emissions mt/MWh 0.787 0.732 0.796 0.768
Capital expenditure of the Renewables Division € million 891 709 733 1,102Share of the Group’s electricity generation accounted for by renewables % 4.38 4.0 3.5 2.4
Society Employees9 72,068 70,856 70,726 65,908
Share of women in the company % 27.1 26.2 26.1 25.6
Share of women in executive positions % 11.3 10.8 9.0 8.9
Fluctuation rate % 10.1 8.3 8.7 8.8
Training days per employee (Germany) 4.6 4.7 4.8 4.6
Health ratio % 95.8 95.6 95.4 95.4
Lost-time incident frequency LTIF11 2.8 3.5 4.3 5.3
Fatal work-related accidents12 3 3 5 12
Corporate governance Share of the RWE Group's revenue earned in countries with a high or very high risk of corruption13 % 12.4 12.0 12.7 12.9
R&D costs € million 146 149 110 105
1 Figures for 2009 adjusted due to the inclusion of Netherlands /Belgium and Hungary. 2 Figures for 2009 adjusted due to the inclusion of Netherlands /Belgium. 3 Difference between power plant water withdrawals and returns to rivers and other surface water; excluding power plants with sea water cooling. 4 Scope 1: direct CO2 emissions from in-house sources (oil and gas production, gas transmission & electricity generation). 5 Including power stations not under RWE ownership, but that we can deploy at our discretion on the basis of long-term agreements. 6 Scope 2: indirect CO2 emissions from the transmission and distribution of electricity purchased from third parties. 7 Scope 3: indirect CO2 emissions that do not fall under scope 1 or 2, produced through the generation of electricity procured from third parties, the transmission and
distribution of electricity in third-party networks, the production and transmission of used fuel, as well as the consumption of gas sold to customers. 8 Electricity generation based on wind (4.1 TWh), hydro (2.8 TWh) and biomass (1.9 TWh). 9 Converted to full-time positions. 10 Figures for 2009 excluding Essent. 11 Sum of all accidents for every million hours worked. Excluding employees of third-party companies. 12 Including employees of third-party companies. 13 Countries rated lower than six on a scale of zero to ten in the Corruption Perceptions Index by the anti-corruption organisation Transparency International,
with ten corresponding to the lowest risk of corruption.
10
sustainability 123To our investors Review of operations our responsibility
Responsibility statement consolidated financial statements Further information
RWE Annual Report 2011124 Responsibility statement
To the best of our knowledge, and in accordance with the applicable reporting principles, the consolidated financial statements give a true and fair view of the assets, liabilities, financial position and profit or loss of the Group, and the Group review of operations includes a fair review of the development and performance of the business and the position of the Group, together with a description of the principal opportunities and risks associated with the expected development of the Group.
Essen, 17 February 2012
The Executive Board
rESpONSibiliTY STaTEMENT3.0
Großmann
PohligFitting Schmitz
BirnbaumTerium
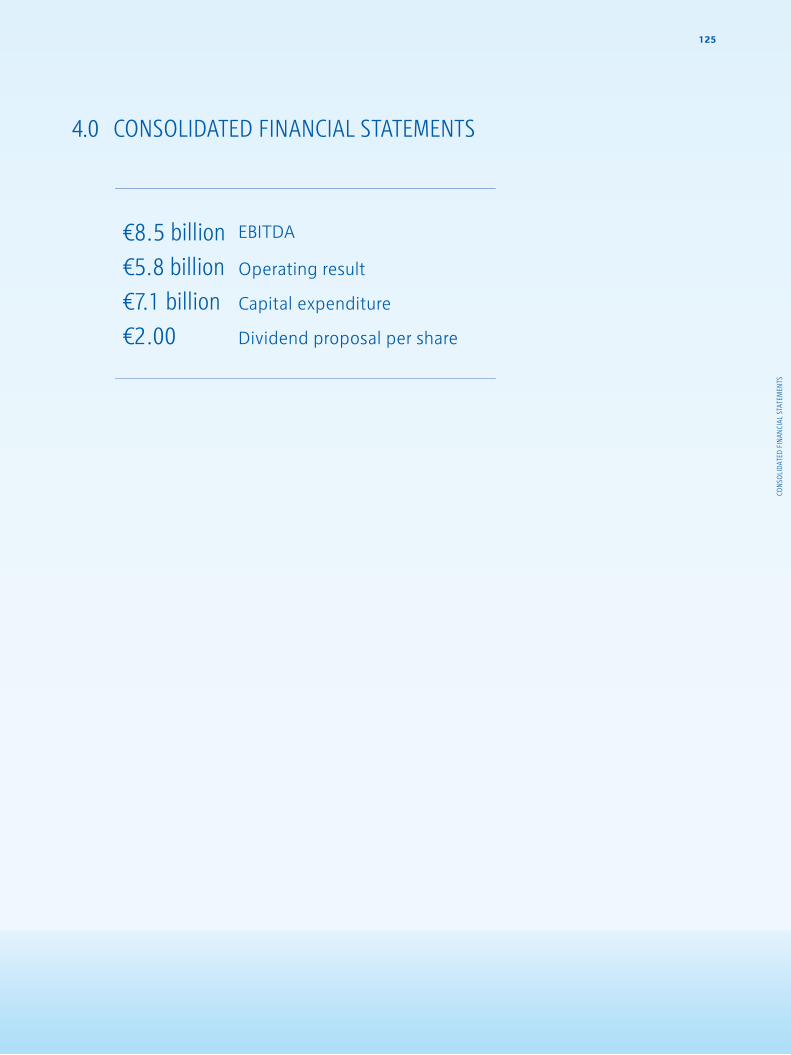
125
4.0 CONSOlidaTEd FiNaNCial STaTEMENTS
€8.5 billion€5.8 billion€7.1 billion€2.00
EBITDA
Operating result
Capital expenditure
Dividend proposal per share
con
soli
daTe
d F
inan
cial
sTa
TeM
enTs
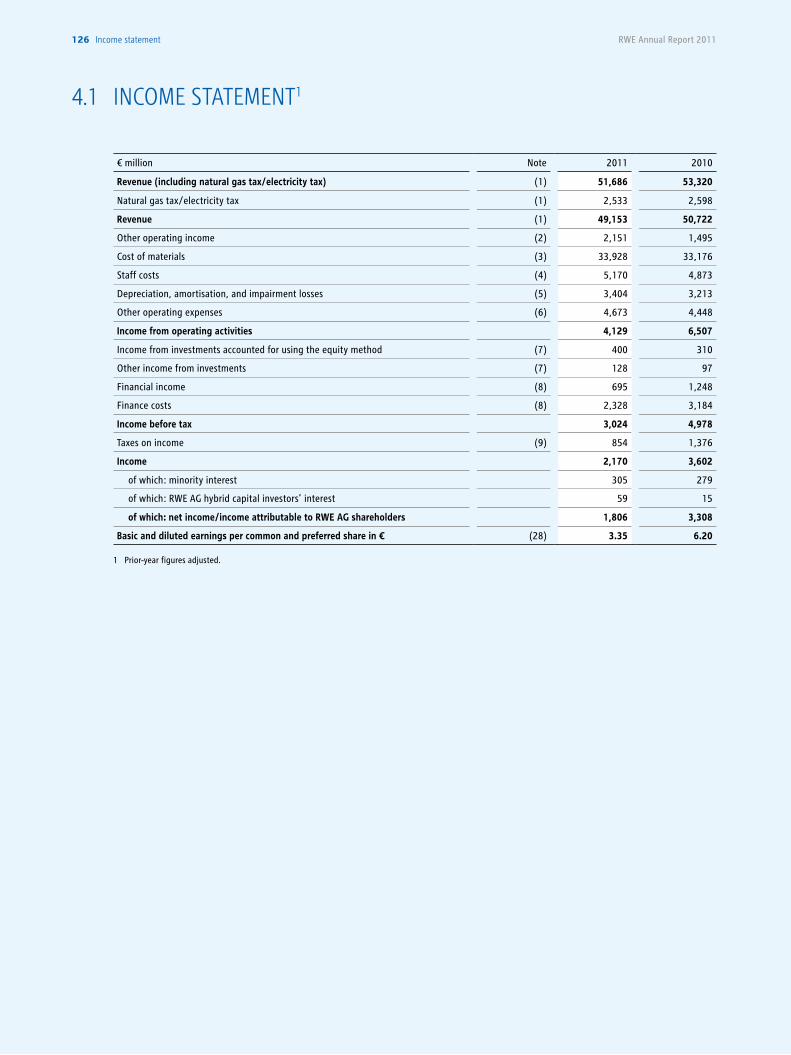
RWE Annual Report 2011126 income statement
4.1 iNCOME STaTEMENT1
€ million Note 2011 2010
Revenue (including natural gas tax/electricity tax) (1) 51,686 53,320
Natural gas tax/electricity tax (1) 2,533 2,598
Revenue (1) 49,153 50,722
Other operating income (2) 2,151 1,495
Cost of materials (3) 33,928 33,176
Staff costs (4) 5,170 4,873
Depreciation, amortisation, and impairment losses (5) 3,404 3,213
Other operating expenses (6) 4,673 4,448
Income from operating activities 4,129 6,507
Income from investments accounted for using the equity method (7) 400 310
Other income from investments (7) 128 97
Financial income (8) 695 1,248
Finance costs (8) 2,328 3,184
Income before tax 3,024 4,978
Taxes on income (9) 854 1,376
Income 2,170 3,602
of which: minority interest 305 279
of which: RWE AG hybrid capital investors’ interest 59 15
of which: net income/income attributable to RWE AG shareholders 1,806 3,308
Basic and diluted earnings per common and preferred share in € (28) 3.35 6.20
1 Prior-year figures adjusted.
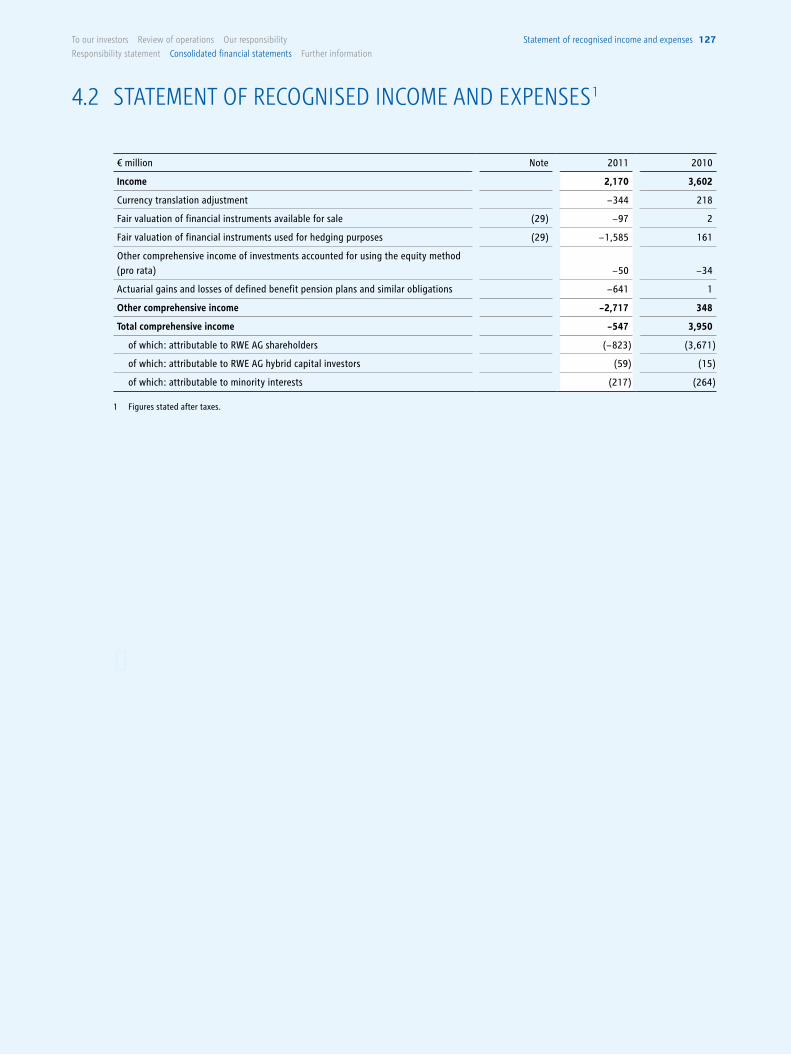
To our investors Review of operations our responsibility
Responsibility statement consolidated financial statements Further information
statement of recognised income and expenses 127
4.2 STaTEMENT OF rECOgNiSEd iNCOME aNd ExpENSES 1
€ million Note 2011 2010
Income 2,170 3,602
Currency translation adjustment − 344 218
Fair valuation of financial instruments available for sale (29) − 97 2
Fair valuation of financial instruments used for hedging purposes (29) − 1,585 161
Other comprehensive income of investments accounted for using the equity method (pro rata) − 50 − 34
Actuarial gains and losses of defined benefit pension plans and similar obligations − 641 1
Other comprehensive income − 2,717 348
Total comprehensive income − 547 3,950
of which: attributable to RWE AG shareholders (− 823) (3,671)
of which: attributable to RWE AG hybrid capital investors (59) (15)
of which: attributable to minority interests (217) (264)
1 Figures stated after taxes.
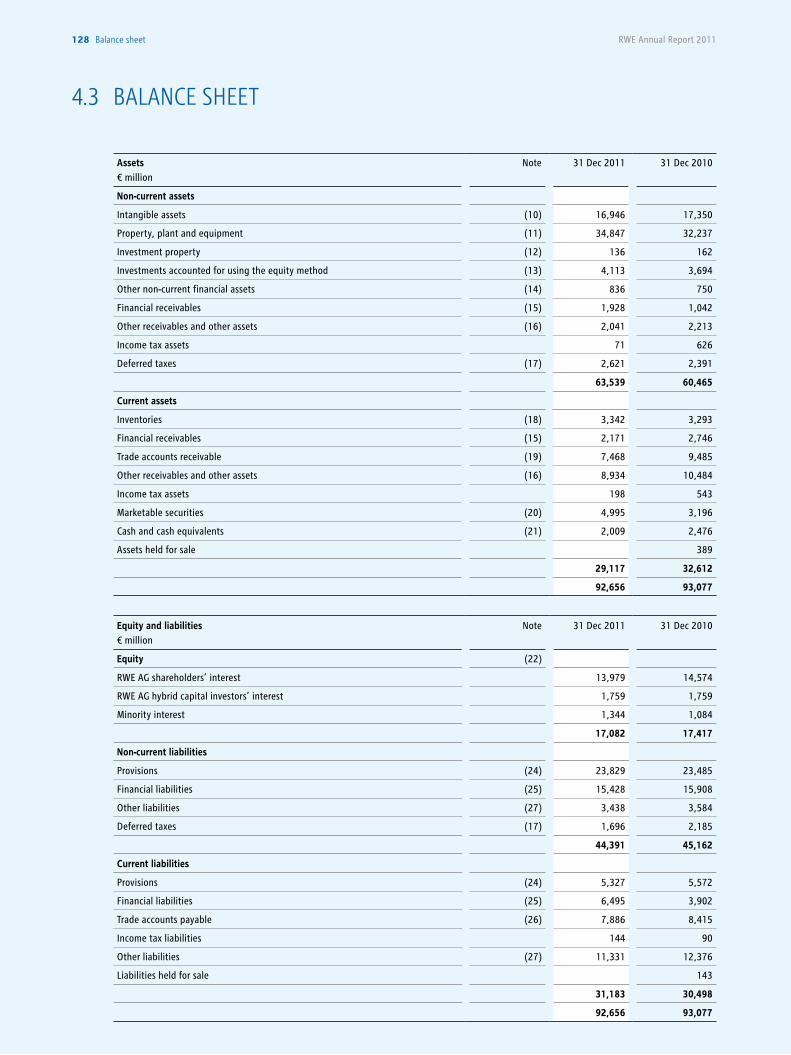
RWE Annual Report 2011128 balance sheet
Assets € million
Note 31 Dec 2011 31 Dec 2010
Non-current assets
Intangible assets (10) 16,946 17,350
Property, plant and equipment (11) 34,847 32,237
Investment property (12) 136 162
Investments accounted for using the equity method (13) 4,113 3,694
Other non-current financial assets (14) 836 750
Financial receivables (15) 1,928 1,042
Other receivables and other assets (16) 2,041 2,213
Income tax assets 71 626
Deferred taxes (17) 2,621 2,391
63,539 60,465
Current assets
Inventories (18) 3,342 3,293
Financial receivables (15) 2,171 2,746
Trade accounts receivable (19) 7,468 9,485
Other receivables and other assets (16) 8,934 10,484
Income tax assets 198 543
Marketable securities (20) 4,995 3,196
Cash and cash equivalents (21) 2,009 2,476
Assets held for sale 389
29,117 32,612
92,656 93,077
4.3 balaNCE SHEET
Equity and liabilities € million
Note 31 Dec 2011 31 Dec 2010
Equity (22)
RWE AG shareholders’ interest 13,979 14,574
RWE AG hybrid capital investors’ interest 1,759 1,759
Minority interest 1,344 1,084
17,082 17,417
Non-current liabilities
Provisions (24) 23,829 23,485
Financial liabilities (25) 15,428 15,908
Other liabilities (27) 3,438 3,584
Deferred taxes (17) 1,696 2,185
44,391 45,162
Current liabilities
Provisions (24) 5,327 5,572
Financial liabilities (25) 6,495 3,902
Trade accounts payable (26) 7,886 8,415
Income tax liabilities 144 90
Other liabilities (27) 11,331 12,376
Liabilities held for sale 143
31,183 30,498
92,656 93,077
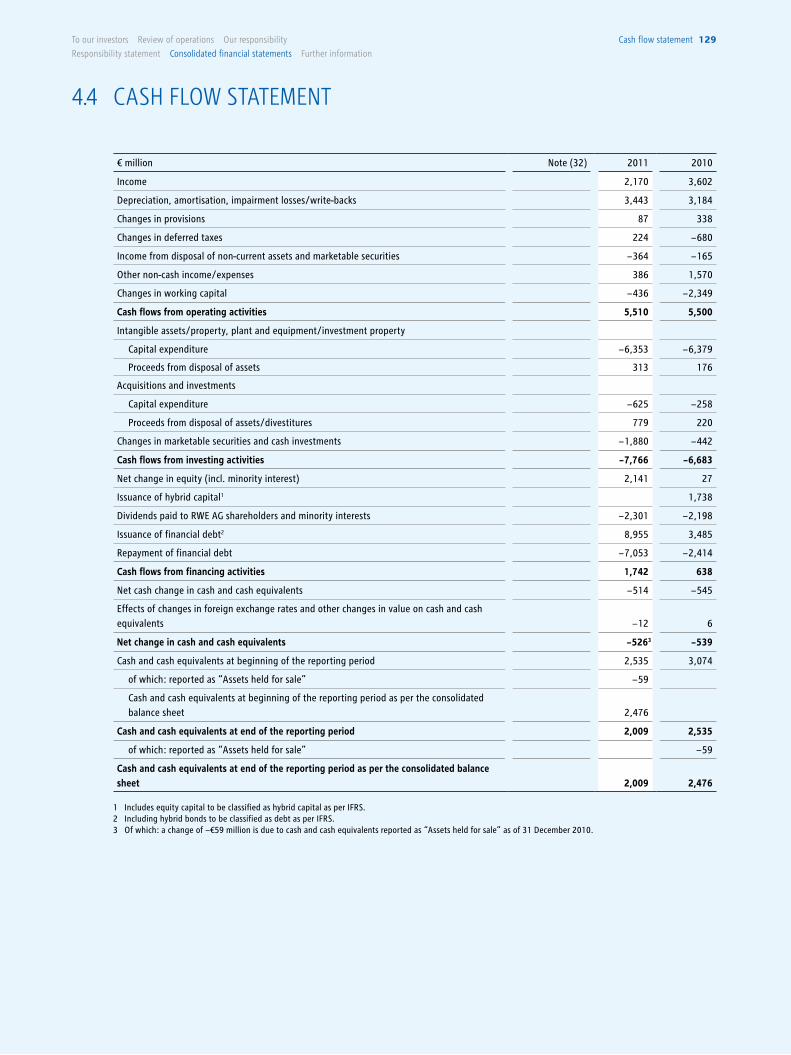
To our investors Review of operations our responsibility
Responsibility statement consolidated financial statements Further information
cash flow statement 129
4.4 CaSH FlOw STaTEMENT
€ million Note (32) 2011 2010
Income 2,170 3,602
Depreciation, amortisation, impairment losses/write-backs 3,443 3,184
Changes in provisions 87 338
Changes in deferred taxes 224 − 680
Income from disposal of non-current assets and marketable securities − 364 − 165
Other non-cash income/expenses 386 1,570
Changes in working capital − 436 − 2,349
Cash flows from operating activities 5,510 5,500
Intangible assets/property, plant and equipment/investment property
Capital expenditure − 6,353 − 6,379
Proceeds from disposal of assets 313 176
Acquisitions and investments
Capital expenditure − 625 − 258
Proceeds from disposal of assets/divestitures 779 220
Changes in marketable securities and cash investments − 1,880 − 442
Cash flows from investing activities − 7,766 − 6,683
Net change in equity (incl. minority interest) 2,141 27
Issuance of hybrid capital1 1,738
Dividends paid to RWE AG shareholders and minority interests − 2,301 − 2,198
Issuance of financial debt2 8,955 3,485
Repayment of financial debt − 7,053 − 2,414
Cash flows from financing activities 1,742 638
Net cash change in cash and cash equivalents − 514 − 545
Effects of changes in foreign exchange rates and other changes in value on cash and cash equivalents − 12 6
Net change in cash and cash equivalents − 5263 − 539
Cash and cash equivalents at beginning of the reporting period 2,535 3,074
of which: reported as “Assets held for sale” − 59
Cash and cash equivalents at beginning of the reporting period as per the consolidated balance sheet 2,476
Cash and cash equivalents at end of the reporting period 2,009 2,535
of which: reported as “Assets held for sale” − 59
Cash and cash equivalents at end of the reporting period as per the consolidated balance sheet 2,009 2,476
1 Includes equity capital to be classified as hybrid capital as per IFRS.2 Including hybrid bonds to be classified as debt as per IFRS.3 Of which: a change of −€59 million is due to cash and cash equivalents reported as “Assets held for sale” as of 31 December 2010.
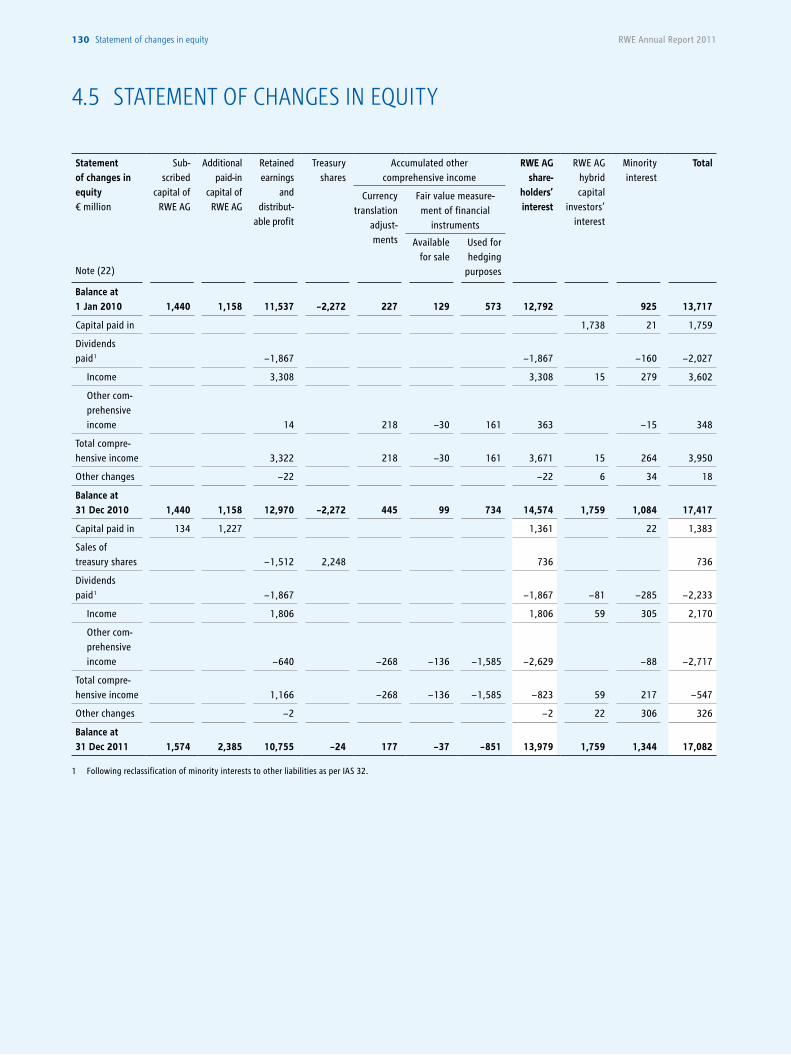
RWE Annual Report 2011130 statement of changes in equity
4.5 STaTEMENT OF CHaNgES iN EquiTY
Statement of changes in equity € million
Note (22)
Sub-scribed
capital of RWE AG
Additionalpaid-in
capital of RWE AG
Retainedearnings
anddistribut-
able profit
Treasury shares
Accumulated other comprehensive income
RWE AGshare-
holders’ interest
RWE AG hybrid capital
investors’ interest
Minority interest
Total
Currency translation
adjust-ments
Fair value measure-ment of financial
instruments
Available for sale
Used for hedging
purposes
Balance at 1 Jan 2010 1,440 1,158 11,537 − 2,272 227 129 573 12,792 925 13,717
Capital paid in 1,738 21 1,759
Dividends paid 1 − 1,867 − 1,867 − 160 − 2,027
Income 3,308 3,308 15 279 3,602
Other com-prehensive income 14 218 −30 161 363 − 15 348
Total compre-hensive income 3,322 218 −30 161 3,671 15 264 3,950
Other changes − 22 − 22 6 34 18
Balance at 31 Dec 2010 1,440 1,158 12,970 − 2,272 445 99 734 14,574 1,759 1,084 17,417
Capital paid in 134 1,227 1,361 22 1,383
Sales of treasury shares − 1,512 2,248 736 736
Dividends paid 1 − 1,867 − 1,867 − 81 − 285 − 2,233
Income 1,806 1,806 59 305 2,170
Other com-prehensive income − 640 − 268 − 136 − 1,585 − 2,629 − 88 − 2,717
Total compre-hensive income 1,166 − 268 − 136 − 1,585 − 823 59 217 − 547
Other changes − 2 − 2 22 306 326
Balance at 31 Dec 2011 1,574 2,385 10,755 − 24 177 − 37 − 851 13,979 1,759 1,344 17,082
1 Following reclassification of minority interests to other liabilities as per IAS 32.
To our investors Review of operations our responsibility
Responsibility statement consolidated financial statements Further information
notes 131
4.6 NOTES
RWE AG, headquartered at Opernplatz 1, 45128 Essen,
Germany, is the parent company of the RWE Group (“RWE”
or “Group”).
The consolidated financial statements for the period ended
31 December 2011 were approved for publication on 17 Febru-
ary 2012 by the Executive Board of RWE AG. The statements
were prepared in accordance with the International Financial
Reporting Standards (IFRSs) applicable in the EU, as well as in
accordance with the supplementary accounting regulations
applicable pursuant to Sec. 315a, Para. 1 of the German Com-
mercial Code (HGB). The previous year’s figures were calculated
according to the same principles.
A statement of changes in equity has been disclosed in addition
to the income statement, the statement of recognised income
and expenses, the balance sheet and the cash flow statement.
The Notes to the financial statements also include segment
reporting.
Several balance sheet and income statement items have been
combined in the interests of clarity. These items are stated and
explained separately in the Notes to the financial statements.
The income statement is structured according to the nature of
expense method.
The consolidated financial statements have been prepared
in euros. Unless specified otherwise, all amounts are stated in
millions of euros (€ million). Due to calculation procedures,
rounding differences may occur.
These consolidated financial statements were prepared for the
2011 fiscal year (1 January to 31 December).
The Executive Board of RWE AG is responsible for the complete-
ness and accuracy of the consolidated financial statements and
the Group review of operations, which is combined with the
review of operations of RWE AG.
We employ internal control systems, uniform groupwide direc-
tives, and programmes for basic and advanced staff training to
ensure that the consolidated financial statements and combined
review of operations are adequately prepared. Compliance with
legal regulations and the internal guidelines as well as the relia-
bility and viability of the control systems are continuously moni-
tored throughout the Group.
In line with the requirements of the German Corporate Control
and Transparency Act (KonTraG), the Group’s risk management
system enables the Executive Board to identify risks at an early
stage and take countermeasures, if necessary.
The consolidated financial statements, the combined review of
operations and the independent auditors’ report are discussed
in detail by the Audit Committee and at the Supervisory Board’s
meeting on financial statements with the independent auditors
present. The results of the Supervisory Board’s examination are
presented in the report of the Supervisory Board (pages 102 et
seqq. of this Annual Report).
Basis of presentation
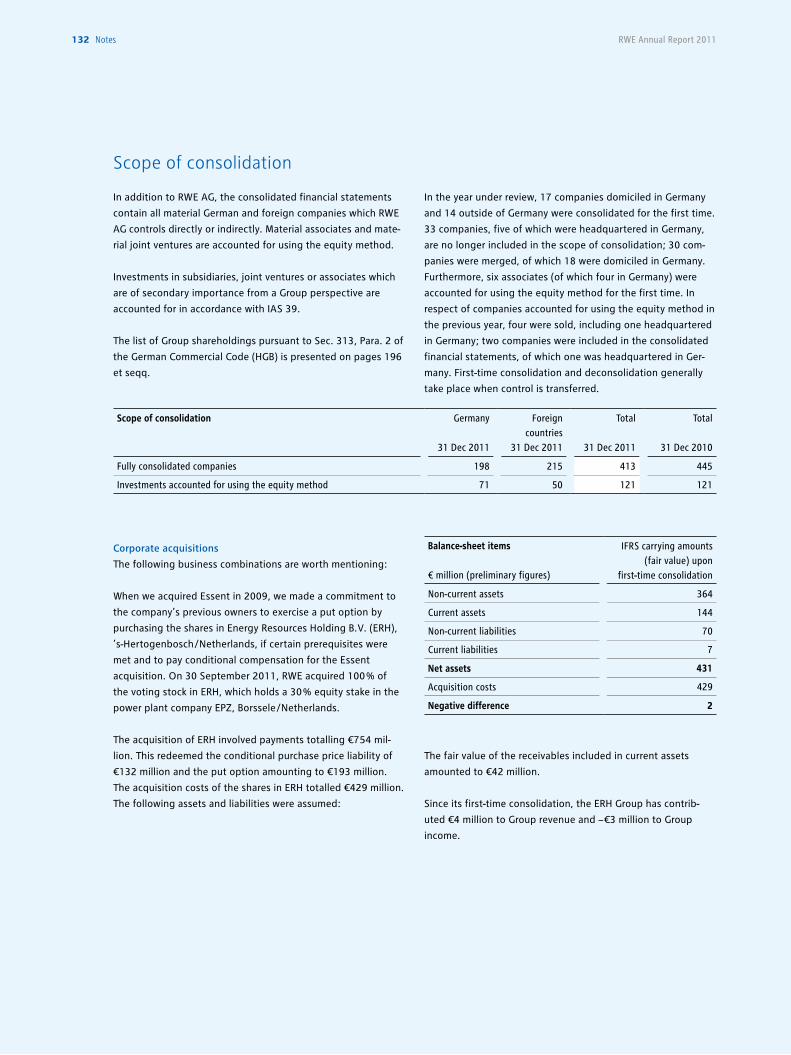
RWE Annual Report 2011132 notes
In addition to RWE AG, the consolidated financial statements
contain all material German and foreign companies which RWE
AG controls directly or indirectly. Material associates and mate-
rial joint ventures are accounted for using the equity method.
Investments in subsidiaries, joint ventures or associates which
are of secondary importance from a Group perspective are
accounted for in accordance with IAS 39.
The list of Group shareholdings pursuant to Sec. 313, Para. 2 of
the German Commercial Code (HGB) is presented on pages 196
et seqq.
In the year under review, 17 companies domiciled in Germany
and 14 outside of Germany were consolidated for the first time.
33 companies, five of which were headquartered in Germany,
are no longer included in the scope of consolidation; 30 com-
panies were merged, of which 18 were domiciled in Germany.
Furthermore, six associates (of which four in Germany) were
accounted for using the equity method for the first time. In
respect of companies accounted for using the equity method in
the previous year, four were sold, including one headquartered
in Germany; two companies were included in the consolidated
financial statements, of which one was headquartered in Ger-
many. First-time consolidation and deconsolidation generally
take place when control is transferred.
Corporate acquisitions
The following business combinations are worth mentioning:
When we acquired Essent in 2009, we made a commitment to
the company’s previous owners to exercise a put option by
purchasing the shares in Energy Resources Holding B.V. (ERH),
’s-Hertogenbosch /Netherlands, if certain prerequisites were
met and to pay conditional compensation for the Essent
acquisition. On 30 September 2011, RWE acquired 100 % of
the voting stock in ERH, which holds a 30 % equity stake in the
power plant company EPZ, Borssele /Netherlands.
The acquisition of ERH involved payments totalling €754 mil-
lion. This redeemed the conditional purchase price liability of
€132 million and the put option amounting to €193 million.
The acquisition costs of the shares in ERH totalled €429 million.
The following assets and liabilities were assumed:
Scope of consolidation
Scope of consolidation Germany
31 Dec 2011
Foreign countries
31 Dec 2011
Total
31 Dec 2011
Total
31 Dec 2010
Fully consolidated companies 198 215 413 445
Investments accounted for using the equity method 71 50 121 121
The fair value of the receivables included in current assets
amounted to €42 million.
Since its first-time consolidation, the ERH Group has contrib-
uted €4 million to Group revenue and − €3 million to Group
income.
Balance-sheet items
€ million (preliminary figures)
IFRS carrying amounts (fair value) upon
first-time consolidation
Non-current assets 364
Current assets 144
Non-current liabilities 70
Current liabilities 7
Net assets 431
Acquisition costs 429
Negative difference 2
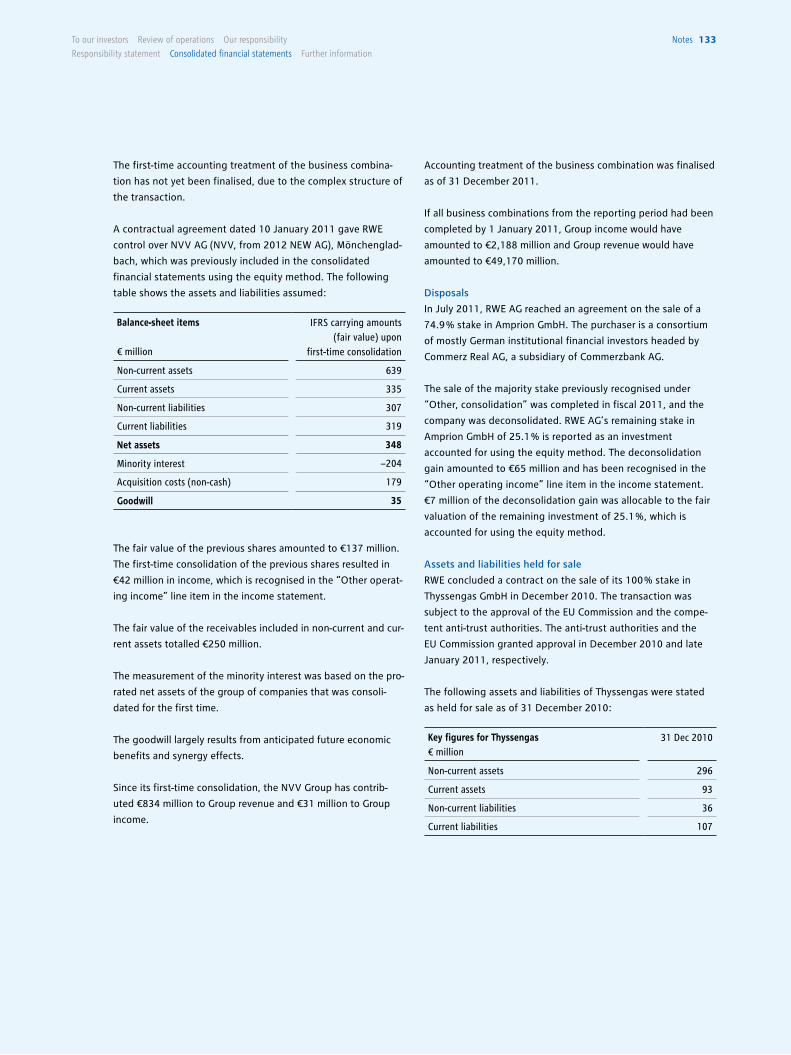
To our investors Review of operations our responsibility
Responsibility statement consolidated financial statements Further information
notes 133
The first-time accounting treatment of the business combina-
tion has not yet been finalised, due to the complex structure of
the transaction.
A contractual agreement dated 10 January 2011 gave RWE
control over NVV AG (NVV, from 2012 NEW AG), Mönchenglad-
bach, which was previously included in the consolidated
financial statements using the equity method. The following
table shows the assets and liabilities assumed: Disposals
In July 2011, RWE AG reached an agreement on the sale of a
74.9 % stake in Amprion GmbH. The purchaser is a consortium
of mostly German institutional financial investors headed by
Commerz Real AG, a subsidiary of Commerzbank AG.
The sale of the majority stake previously recognised under
“Other, consolidation” was completed in fiscal 2011, and the
company was deconsolidated. RWE AG’s remaining stake in
Amprion GmbH of 25.1 % is reported as an investment
accounted for using the equity method. The deconsolidation
gain amounted to €65 million and has been recognised in the
“Other operating income” line item in the income statement.
€7 million of the deconsolidation gain was allocable to the fair
valuation of the remaining investment of 25.1 %, which is
accounted for using the equity method.
Assets and liabilities held for sale
RWE concluded a contract on the sale of its 100 % stake in
Thyssengas GmbH in December 2010. The transaction was
subject to the approval of the EU Commission and the compe-
tent anti-trust authorities. The anti-trust authorities and the
EU Commission granted approval in December 2010 and late
January 2011, respectively.
The following assets and liabilities of Thyssengas were stated
as held for sale as of 31 December 2010:
Accounting treatment of the business combination was finalised
as of 31 December 2011.
If all business combinations from the reporting period had been
completed by 1 January 2011, Group income would have
amounted to €2,188 million and Group revenue would have
amounted to €49,170 million.
The fair value of the previous shares amounted to €137 million.
The first-time consolidation of the previous shares resulted in
€42 million in income, which is recognised in the “Other operat-
ing income” line item in the income statement.
The fair value of the receivables included in non-current and cur-
rent assets totalled €250 million.
The measurement of the minority interest was based on the pro-
rated net assets of the group of companies that was consoli-
dated for the first time.
The goodwill largely results from anticipated future economic
benefits and synergy effects.
Since its first-time consolidation, the NVV Group has contrib-
uted €834 million to Group revenue and €31 million to Group
income.
Key figures for Thyssengas€ million
31 Dec 2010
Non-current assets 296
Current assets 93
Non-current liabilities 36
Current liabilities 107
Balance-sheet items
€ million
IFRS carrying amounts (fair value) upon
first-time consolidation
Non-current assets 639
Current assets 335
Non-current liabilities 307
Current liabilities 319
Net assets 348
Minority interest −204
Acquisition costs (non-cash) 179
Goodwill 35
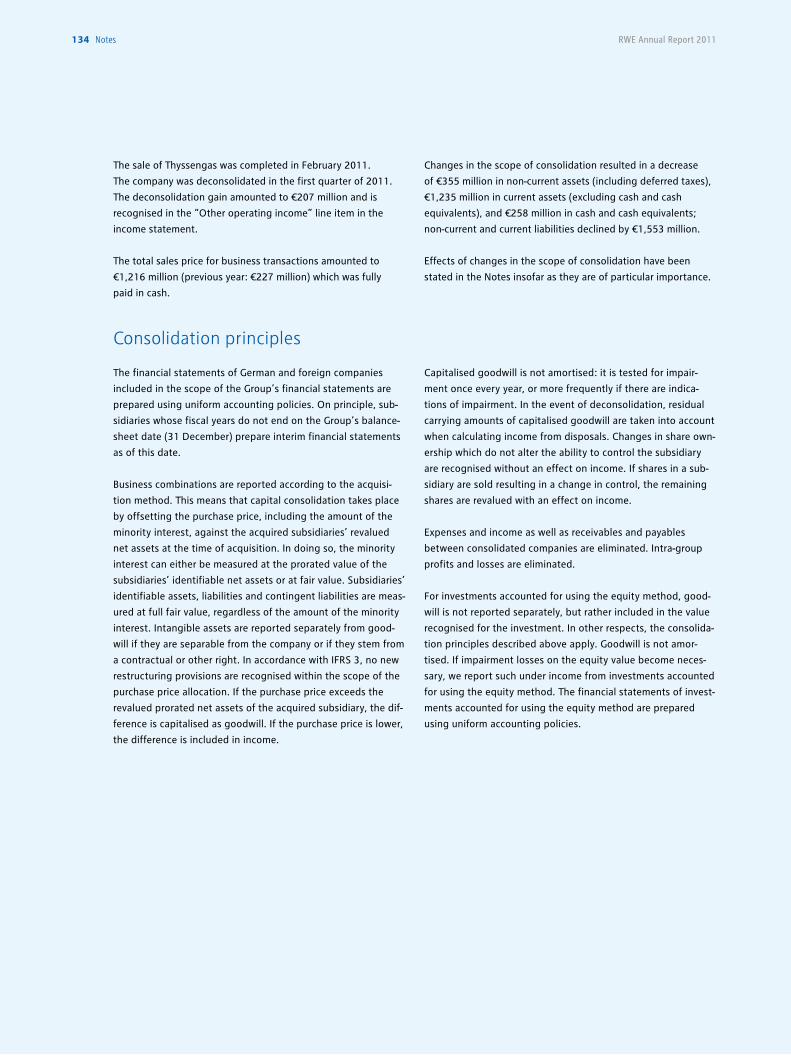
RWE Annual Report 2011134 notes
The financial statements of German and foreign companies
included in the scope of the Group’s financial statements are
prepared using uniform accounting policies. On principle, sub-
sidiaries whose fiscal years do not end on the Group’s balance-
sheet date (31 December) prepare interim financial statements
as of this date.
Business combinations are reported according to the acquisi-
tion method. This means that capital consolidation takes place
by offsetting the purchase price, including the amount of the
minority interest, against the acquired subsidiaries’ revalued
net assets at the time of acquisition. In doing so, the minority
interest can either be measured at the prorated value of the
subsidiaries’ identifiable net assets or at fair value. Subsidiaries’
identifiable assets, liabilities and contingent liabilities are meas-
ured at full fair value, regardless of the amount of the minority
interest. Intangible assets are reported separately from good-
will if they are separable from the company or if they stem from
a contractual or other right. In accordance with IFRS 3, no new
restructuring provisions are recognised within the scope of the
purchase price allocation. If the purchase price exceeds the
revalued prorated net assets of the acquired subsidiary, the dif-
ference is capitalised as goodwill. If the purchase price is lower,
the difference is included in income.
Capitalised goodwill is not amortised: it is tested for impair-
ment once every year, or more frequently if there are indica-
tions of impairment. In the event of deconsolidation, residual
carrying amounts of capitalised goodwill are taken into account
when calculating income from disposals. Changes in share own-
ership which do not alter the ability to control the subsidiary
are recognised without an effect on income. If shares in a sub-
sidiary are sold resulting in a change in control, the remaining
shares are revalued with an effect on income.
Expenses and income as well as receivables and payables
between consolidated companies are eliminated. Intra-group
profits and losses are eliminated.
For investments accounted for using the equity method, good-
will is not reported separately, but rather included in the value
recognised for the investment. In other respects, the consolida-
tion principles described above apply. Goodwill is not amor-
tised. If impairment losses on the equity value become neces-
sary, we report such under income from investments accounted
for using the equity method. The financial statements of invest-
ments accounted for using the equity method are prepared
using uniform accounting policies.
Consolidation principles
The sale of Thyssengas was completed in February 2011.
The company was deconsolidated in the first quarter of 2011.
The deconsolidation gain amounted to €207 million and is
recognised in the “Other operating income” line item in the
income statement.
The total sales price for business transactions amounted to
€1,216 million (previous year: €227 million) which was fully
paid in cash.
Changes in the scope of consolidation resulted in a decrease
of €355 million in non-current assets (including deferred taxes),
€1,235 million in current assets (excluding cash and cash
equivalents), and €258 million in cash and cash equivalents;
non-current and current liabilities declined by €1,553 million.
Effects of changes in the scope of consolidation have been
stated in the Notes insofar as they are of particular importance.
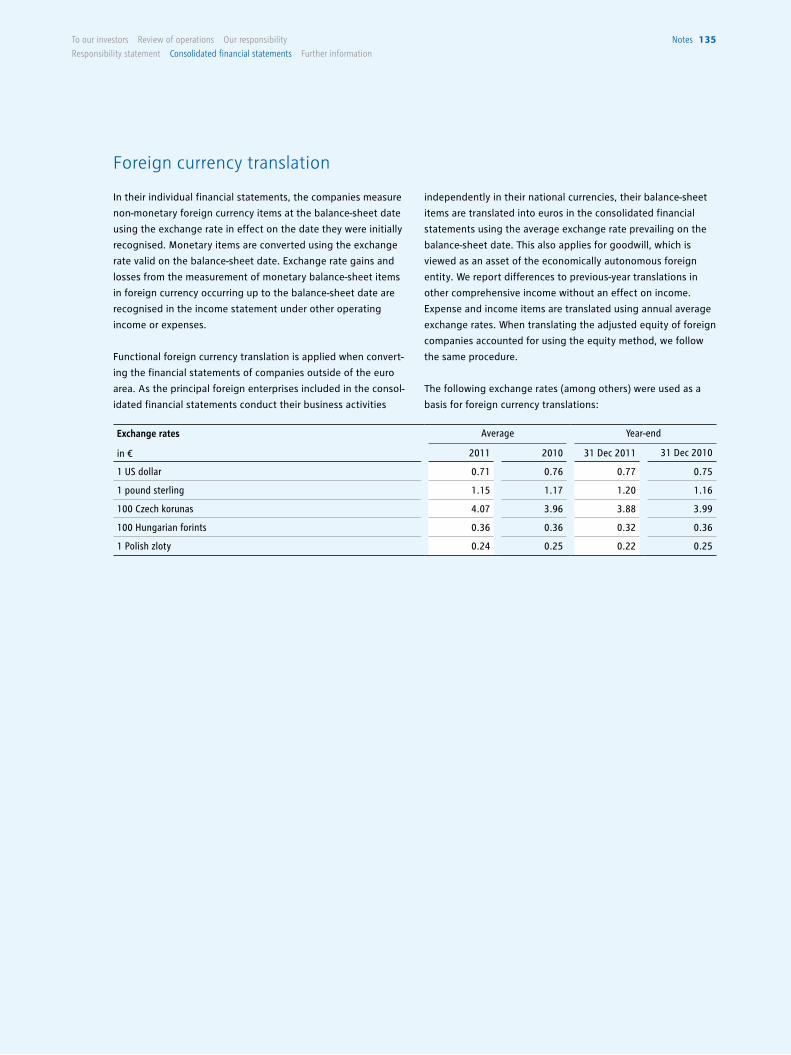
To our investors Review of operations our responsibility
Responsibility statement consolidated financial statements Further information
notes 135
In their individual financial statements, the companies measure
non-monetary foreign currency items at the balance-sheet date
using the exchange rate in effect on the date they were initially
recognised. Monetary items are converted using the exchange
rate valid on the balance-sheet date. Exchange rate gains and
losses from the measurement of monetary balance-sheet items
in foreign currency occurring up to the balance-sheet date are
recognised in the income statement under other operating
income or expenses.
Functional foreign currency translation is applied when convert-
ing the financial statements of companies outside of the euro
area. As the principal foreign enterprises included in the consol-
idated financial statements conduct their business activities
independently in their national currencies, their balance-sheet
items are translated into euros in the consolidated financial
statements using the average exchange rate prevailing on the
balance-sheet date. This also applies for goodwill, which is
viewed as an asset of the economically autonomous foreign
entity. We report differences to previous-year translations in
other comprehensive income without an effect on income.
Expense and income items are translated using annual average
exchange rates. When translating the adjusted equity of foreign
companies accounted for using the equity method, we follow
the same procedure.
The following exchange rates (among others) were used as a
basis for foreign currency translations:
Foreign currency translation
Exchange rates
in €
Average Year-end
2011 2010 31 Dec 2011 31 Dec 2010
1 US dollar 0.71 0.76 0.77 0.75
1 pound sterling 1.15 1.17 1.20 1.16
100 Czech korunas 4.07 3.96 3.88 3.99
100 Hungarian forints 0.36 0.36 0.32 0.36
1 Polish zloty 0.24 0.25 0.22 0.25
RWE Annual Report 2011136 notes
Intangible assets are accounted for at amortised cost. With the
exception of goodwill, all intangible assets have finite useful
lives and are amortised using the straight-line method. Useful
lives and methods of amortisation are reviewed on an annual
basis.
Software for commercial and technical applications is amortised
over three to five years. “Operating rights” refer to the entirety
of the permits and approvals required for the operation of a
power plant. Such rights are generally amortised over the eco-
nomic life of the power plant, using the straight-line method.
Easement agreements in the electricity and gas business, and
other easement rights, generally have useful lives of up to 20
years. Concessions in the water business generally have terms
of up to 25 years. Capitalised customer relations are amortised
over a maximum period of up to ten years. Useful lives and
methods of amortisation are reviewed on an annual basis.
Goodwill is not amortised; instead it is subjected to an impair-
ment test once every year, or more frequently if there are indi-
cations of impairment.
Development costs are capitalised if a newly developed prod-
uct or process can be clearly defined, is technically feasible and
it is the company’s intention to either use the product or proc-
ess itself or market it. Furthermore, asset recognition requires
that there be a sufficient level of certainty that the develop-
ment costs lead to future cash inflows. Capitalised develop-
ment costs are amortised over the time period during which the
products are expected to be sold. Research expenditures are
recognised as expenses in the period in which they are
incurred.
An impairment loss is recognised for an intangible asset if the
recoverable amount of the asset is less than its carrying
amount. A special regulation applies for cases when the asset is
part of a cash-generating unit. Such units are defined as the
smallest identifiable group of assets which generates cash
inflows; these inflows must be largely independent of cash
inflows from other assets or groups of assets. If the intangible
asset is a part of a cash-generating unit, the impairment loss is
calculated based on the recoverable amount of this unit. If
goodwill was allocated to a cash-generating unit and the carry-
ing amount of the unit exceeds the recoverable amount, the
allocated goodwill is initially written down by the difference.
Impairment losses which must be recognised in addition to this
are taken into account by reducing the carrying amount of the
other assets of the cash-generating unit on a prorated basis. If
the reason for an impairment loss recognised in prior periods
has ceased to exist, a write-back is performed. The increased
carrying amount resulting from the write-back may not, how-
ever, exceed the amortised cost. Impairment losses on goodwill
are not reversed.
Property, plant and equipment is stated at depreciated cost.
Borrowing costs are capitalised as part of the asset’s cost, if
they are incurred directly in connection with the acquisition or
production of a “qualified asset” for which a considerable
period of time is required to prepare the asset for use or sale. If
necessary, the cost of property, plant and equipment may con-
tain the estimated expenses for the decommissioning of plants
or site restoration. Maintenance and repair costs are recognised
as expenses.
Exploratory wells are accounted for at cost, according to the
successful efforts method, meaning that expenses for explora-
tion activities are only capitalised for successful projects, for
example when wells specifically lead to the discovery of crude
oil or natural gas. Seismology and geology expenditures are
recognised as expenses. Within the framework of the unit-of-
production method, we do not depreciate or amortise capital-
ised exploration expenses in the exploration phase, but rather
after production begins. Exploration assets are tested for
impairment as soon as facts and information indicate that the
carrying value exceeds the recoverable amount.
With the exception of land and leasehold rights, as a rule, prop-
erty, plant and equipment is depreciated using the straight-line
method, unless in exceptional cases another depreciation
method is better suited to the usage pattern. We calculate the
depreciation of RWE’s typical property, plant and equipment
according to the following useful lives, which apply throughout
the Group:
Accounting policies
To our investors Review of operations our responsibility
Responsibility statement consolidated financial statements Further information
notes 137
Property, plant and equipment held under a finance lease is
capitalised at the fair value of the leased asset or the present
value of the minimum lease payments, depending on which is
lower. They are depreciated using the straight-line method over
the expected useful life or the lease term, whichever is shorter.
Impairment losses and write-backs on property, plant and
equipment are recognised according to the principles described
for intangible assets.
Investment property consists of all real property held to earn
rental income or for long-term capital appreciation rather than
for use in production or for administrative purposes. This prop-
erty is measured at depreciated cost. Transaction costs are also
included in the initial measurement. Depreciable investment
property is depreciated over 12 to 50 years using the straight-
line method. Fair values of investment property are stated in
the Notes and are determined using internationally accepted
valuation methods such as the discounted cash flow method or
are derived from the current market prices of comparable real
estate.
Impairment losses and write-backs for investment property are
also recognised according to the principles described for intan-
gible assets.
Investments accounted for using the equity method are ini-
tially accounted for at cost and thereafter based on the carrying
amount of their prorated net assets. The carrying amounts are
increased or reduced annually by prorated profits or losses, div-
idends and all other changes in equity. Goodwill is not reported
separately, but rather included in the recognised value of the
investment. Goodwill is not amortised. An impairment loss is
recognised for investments accounted for using the equity
method, if the recoverable amount is less than the carrying
amount.
Other financial assets are comprised of shares in non-consoli-
dated subsidiaries and in associates /joint ventures not
accounted for using the equity method, as well as other invest-
ments and non-current marketable securities; these assets are
shown in the category “Available for sale”. This category
includes financial instruments which are neither loans or receiv-
ables, nor financial investments held to maturity, and which are
not measured at fair value through profit or loss. Initially and in
the following periods, they are recognised at fair value as long
as such can be determined reliably. They are initially measured
on their settlement date; unrealised gains and losses are stated
as other comprehensive income, with due consideration of any
deferred taxes. Gains or losses are recognised in the income
statement upon sale of the financial instruments. If there are
objective, material indications of a reduction in the value of an
asset, an impairment loss is recognised with an effect on
income. If a debtor is experiencing significant financial difficul-
ties, or is delinquent on payments of interest or principal, this
can be an indication of impairment of the financial asset in
question. The same is true when there is no longer an active
market for a financial asset.
Receivables are comprised of financial receivables, trade
accounts receivable and other receivables. With the exception
of financial derivatives, receivables and other assets are stated
at amortised cost. Allowances for doubtful accounts are based
on the actual default risk. As a rule, the amounts of receivables
are corrected through the use of an allowance account, in
accordance with internal Group guidelines. Prepayments
received from customers for consumption which is yet to be
metered and billed are netted out against trade accounts
receivable of the utilities.
Loans reported under financial receivables are stated at amor-
tised cost. Loans with interest rates common in the market are
shown on the balance sheet at nominal value; as a rule, how-
ever, non-interest or low-interest loans are disclosed at their
present value discounted using an interest rate commensurate
with the risks involved.
Useful life in years
Buildings 12 − 75
Technical plants
Thermal power plants 10 − 43
Wind turbines up to 20
Electricity grids 20 − 45
Water main networks 20 − 80
Gas and water storage facilities 15 − 60
Gas distribution facilities 15 − 40
Mining facilities 3 − 25
Mining developments 33 − 35
Wells in Upstream Gas & Oil up to 27
RWE Annual Report 2011138 notes
CO2 emission allowances are accounted for as intangible assets
and reported under other assets. Allowances which are pur-
chased and allowances allocated free of charge are both stated
at cost and are not amortised.
Deferred taxes result from temporary differences in the carry-
ing amount in the separate IFRS financial statements and tax
bases, and from consolidation procedures. Deferred tax assets
also include tax reduction claims resulting from the expected
utilisation of existing loss carryforwards in subsequent years.
Deferred taxes are capitalised if it is sufficiently certain that the
related economic advantages can be used. Their amount is
assessed with regard to the tax rates applicable or expected to
be applicable in the specific country at the time of realisation.
The tax regulations valid or adopted as of the balance-sheet
date are key considerations in this regard. The tax rate used to
calculate deferred taxes in Germany is 31.2 %, as in the previ-
ous year. This is derived from the prevailing 15 % corporate tax
rate, the 5.5 % solidarity surcharge, and the Group’s average
local trade tax rate in Germany. Deferred tax assets and
deferred tax liabilities are netted out for each company and /or
tax group.
Inventories are assets which are held for sale in the ordinary
course of business (finished goods and goods for resale), which
are in the process of production (work in progress – goods and
services) or which are consumed in the production process or in
the rendering of services (raw materials including nuclear fuel
assemblies and excavated earth for lignite mining).
Insofar as inventories are not acquired primarily for the purpose
of realising a profit on a short-term resale transaction, they are
carried at the lower of cost or net realisable value. Production
costs reflect the full costs directly related to production; they
are determined based on normal capacity utilisation and, in
addition to directly allocable costs, they also include adequate
portions of required materials and production overheads,
including production-related depreciation. Borrowing costs,
however, are not capitalised as part of the cost. The valuation is
generally based on average values. The usage of excavated
earth for lignite mining is calculated using the FIFO (first in –
first out) method.
If the net realisable value of inventories written down in earlier
periods has increased, the reversal of the write-down is recog-
nised as a reduction of the cost of materials.
Nuclear fuel assemblies are stated at depreciated cost. Depreci-
ation is determined by operation and capacity, based on con-
sumption and the reactor’s useful life.
Inventories which are acquired primarily for the purpose of real-
ising a profit on a short-term resale transaction are recognised
at their net realisable value less distribution costs. Changes in
value are recognised with an effect on income.
Securities classified as current marketable securities essentially
consist of marketable securities held in special funds as well as
fixed-interest securities which have a maturity of more than
three months and less than one year from the date of acquisi-
tion. All of these securities are classified as “Available for sale”
and are stated at fair value. The transaction costs directly asso-
ciated with the acquisition of these securities are included in
the initial measurement; they are initially measured on their set-
tlement date. Unrealised gains and losses are included in other
comprehensive income without an effect on income, with due
consideration of any deferred taxes. If there are objective,
material indications of a reduction in value, an impairment loss
is recognised with an effect on income. The result of sales of
securities are also recognised in the income statement.
Financial assets are derecognised when the contractual rights
to cash flows from the asset expire or if the entity transfers the
financial asset. The latter applies when substantially all the risks
and rewards of ownership of the asset are transferred, or the
entity no longer has control of the asset.
Cash and cash equivalents consist of cash on hand, demand
deposits and current fixed-interest securities with a maturity of
three months or less from the date of acquisition.
Assets are stated under Assets held for sale if they can be sold
in their present condition and their sale is highly probable. Such
assets may be certain non-current assets, asset groups (“dis-
posal groups”) or operations (“discontinued operations”). Lia-
To our investors Review of operations our responsibility
Responsibility statement consolidated financial statements Further information
notes 139
bilities intended to be sold in a transaction together with assets
are a part of a disposal group or discontinued operations, and
are reported separately under Liabilities held for sale.
Non-current assets held for sale are no longer depreciated or
amortised. They are recognised at fair value less costs to sell, as
long as this amount is lower than the carrying amount.
Gains or losses on the valuation of specific assets held for sale
and of disposal groups are stated under income from continu-
ing operations until final completion of the sale.
The groupwide stock option plans are accounted for as cash-
settled share-based payment. At the balance-sheet date, a pro-
vision is recognised in the amount of the prorated fair value of
the payment obligation. Changes in the fair value are recog-
nised with an effect on income. The fair value of options is
determined using generally accepted valuation methodologies.
Provisions are recognised for all legal or constructive obliga-
tions to third parties which exist on the balance-sheet date and
relate to past events which will probably lead to an outflow of
resources, and the amount of which can be reliably estimated.
Provisions are carried at the their prospective settlement
amount and are not offset against reimbursement claims. If the
provision to be measured involves a large number of items, the
obligation is estimated by weighting all possible outcomes by
their probability of occurrence (expected value method).
All non-current provisions are recognised at their prospective
settlement amount, which is discounted as of the balance-sheet
date. In the determination of the settlement amount, any cost
increases likely to occur up until the time of settlement are
taken into account.
If necessary, the cost of property, plant and equipment may
contain the estimated expenses for the decommissioning of
plants or site restoration, for which decommissioning, restora-
tion and similar provisions are recognised. If changes in the dis-
count rate or changes in the estimated timing or amount of the
payments result in changes in the provisions, the carrying
amount of the respective asset is adjusted by the same
amount. If the decrease in the provision exceeds the carrying
amount of the underlying asset, the excess is recognised imme-
diately through profit or loss.
As a rule, releases of provisions are credited to the expense
account on which the provision was originally recognised.
Provisions for pensions and similar obligations are recognised
for defined benefit plans. These are obligations of the company
to pay future and ongoing post-employment benefits to enti-
tled current and former employees and their surviving depend-
ents. In particular, the obligations refer to retirement pensions.
Individual commitments are generally oriented to the employ-
ees’ length of service and compensation.
Provisions for defined benefit plans are based on the actuarial
present value of the respective obligation. This is measured
using the projected unit credit method. This benefit /years-of-
service method not only takes into account the pension bene-
fits and benefit entitlements known as of the balance-sheet
date, but also anticipated future increases in salaries and pen-
sion benefits. The calculation is based on actuarial reports, tak-
ing into account appropriate biometric parameters (for Ger-
many, in particular the “Richttafeln 2005 G” by Klaus Heubeck).
The provision derives from the balance of actuarial present
value of the obligations and the fair value of the plan assets.
The service cost is disclosed in staff costs. The interest cost and
expected return on plan assets are included in the financial
result.
Actuarial gains and losses are fully recognised in the fiscal year
in which they occur. They are reported as a component of other
comprehensive income outside of profit or loss in the state-
ment of recognised income and expenses and immediately
assigned to retained earnings. They remain outside profit or
loss in subsequent periods as well.
In the case of defined contribution plans, the enterprise’s
obligation is limited to the amount it contributes to the plan.
Contributions to the plan are reported under staff costs.
Waste management provisions in the nuclear energy sector are
based on obligations under public law, in particular the German
Atomic Energy Act, and on restrictions stipulated in operating
140 notes RWE Annual Report 2011
licenses. These provisions are measured using estimates, which
are based on and defined in contracts, on information from
internal and external specialists and expert opinions, as well as
on data from the German Federal Office for Radiation Protec-
tion (BfS).
Obligations existing as of the balance-sheet date and identifia-
ble when the balance sheet is being prepared are recognised as
provisions for mining damage to cover land recultivation and
remediation of mining damage that has already occurred or
been caused. The provisions must be recognised due to obliga-
tions under public law, such as the German Federal Mining Act,
and formulated, above all, in operating schedules and water
law permits. Provisions are generally recognised based on the
increase in the obligation, e.g. in line with lignite production.
Such provisions are measured at full expected cost or according
to estimated compensation payments.
Furthermore, provisions are made owing to obligations under
public law to dismantle production facilities and fill wells. The
amount of these provisions is determined on the basis of total
cost estimates, which reflect past experience and the compara-
tive rates determined by the German Association of Oil and
Natural Gas Production Industry. An analogous approach is
taken for foreign subsidiaries.
A provision is recognised to cover the obligation to deliver CO2
emission allowances to the respective authorities; this provision
is measured at the carrying amount of the CO2 allowances capi-
talised for this purpose. If a portion of the obligation is not cov-
ered with the available allowances, the provision for this por-
tion is measured using the market price of the emission
allowances on the reporting date.
Liabilities consist of financial liabilities, trade accounts payable
and other liabilities. Upon initial recognition, liabilities are
stated at fair value including transaction costs and are carried
at amortised cost in the periods thereafter (except for deriva-
tive financial instruments). Liabilities from finance lease agree-
ments are measured at the lower of fair value of the leased
asset or the present value of minimum lease payments.
Deferred income and prepayments from customers are recog-
nised as liabilities under other liabilities. Deferred income
includes advances and contributions in aid of construction and
building connection that are carried as liabilities by the utilities
and which are generally amortised and included in income over
the useful life of the corresponding asset. Deferred income also
includes taxable and non-taxable government grants for capital
expenditure on non-current assets, which are generally recog-
nised as other operating income in line with the assets’
depreciation.
Certain minority interests are also presented under other liabili-
ties. Specifically, this pertains to purchase price obligations
from rights to tender minority interests (put options).
Derivative financial instruments are recognised as assets or lia-
bilities and measured at fair value, regardless of their purpose.
Changes in this value are recognised with an effect on income,
unless the instruments are used for hedge accounting pur-
poses. In such cases, recognition of changes in the fair value
depends on the type of hedging transaction.
Fair value hedges are used to hedge assets or liabilities carried
on the balance sheet against the risk of a change in their fair
value. Hedges of unrecognised firm commitments are also rec-
ognised as fair value hedges. For fair value hedges, changes in
the fair value of the hedging instrument as well as the fair value
of the respective underlying transactions are recognised in the
income statement. This means that gains and losses from the
fair valuation of the hedging instrument are allocated to the
same line items of the income statement as the gains or losses
from the underlying hedged transaction or portions thereof. In
the event that unrecognised firm commitments are hedged,
changes in the fair value of the firm commitments with regard
to the hedged risk result in the recognition of an asset or liabil-
ity with an effect on income.
Cash flow hedges are used to hedge the risk of variability in
cash flows related to an asset or liability carried on the balance
sheet or related to a highly probable forecast transaction. If a
cash flow hedge exists, unrealised gains and losses from the
hedging instrument are initially stated as other comprehensive
income. Such gains or losses are only included in the income
statement when the hedged underlying transaction has an
effect on income. If forecast transactions are hedged and such
transactions lead to the recognition of a financial asset or finan-
To our investors Review of operations our responsibility
Responsibility statement consolidated financial statements Further information
notes 141
cial liability in subsequent periods, the amounts that were rec-
ognised in equity until this point in time are recognised in the
income statement in the period during which the asset or liabil-
ity affects the income statement. If the transactions result in
the recognition of non-financial assets or liabilities, for example
the acquisition of property, plant and equipment, the amounts
recognised in equity without an effect on income are included
in the initial cost of the asset or liability.
The purpose of hedges of a net investment in foreign entities is
to hedge the currency risk from investments with foreign func-
tional currencies. Unrealised gains and losses from such hedges
are recognised in other comprehensive income until disposal of
the foreign unit.
IAS 39 stipulates the conditions for the recognition of hedging
relationships. Amongst other things, the hedging relationship
must be documented in detail and be effective. According to
IAS 39, a hedging relationship is effective when the changes in
the fair value of the hedging instrument are within 80 % to
125 %, both prospectively and retrospectively, of the opposite
change in the fair value of the hedged item. Only the effective
portion of a hedge is recognised in accordance with the preced-
ing rules. The ineffective portion is recognised immediately in
the income statement with an effect on income.
Contracts on the receipt or delivery of non-financial items in
accordance with the company’s expected purchase, sale or
usage requirements (own-use contracts) are not accounted for
as derivative financial instruments, but rather as executory con-
tracts. If the contracts contain embedded derivatives, the deriv-
atives are accounted separately from the host contract, insofar
as the economic characteristics and risks of the embedded
derivatives are not closely related to the economic characteris-
tics and risks of the host contract. Written options to buy or sell
a non-financial item which can be settled in cash are not own-
use contracts.
Fiscal 2011 is the first time that Changes in finished goods and
work in progress and Other own work capitalised are not
reported as separate items in the income statement, on the
basis of materiality. Changes in finished goods and work in
progress are disclosed in the items “Other operating income”
and “Other operating expenses”, whilst other own work capital-
ised is reported in the item “Other operating income”. Prior-
year figures have been adjusted accordingly.
Contingent liabilities are possible obligations to third parties
or existing obligations which will probably not lead to outflow
of economic benefits or the amount of which cannot be meas-
ured reliably. Contingent liabilities are only recognised on the
balance sheet, if they were assumed within the framework of
a business combination. The amounts disclosed in the Notes
correspond to the exposure at the balance-sheet date.
Management judgements in the application of accounting
policies. Management judgements are required in the applica-
tion of accounting policies. In particular, this pertains to the
following aspects:
• With regard to certain contracts a decision must be made as
to whether they are to be treated as derivatives or as so-
called own-use contracts, and be accounted for as executory
contracts.
• Financial assets must be allocated to the categories “Held to
maturity investments”, “Loans and receivables”, “Financial
assets available for sale”, and “Financial assets at fair value
through profit or loss”.
• With regard to “Financial assets available for sale” a decision
must be made as to if and when reductions in value are to be
recognised as impairments with an impact on income.
• With regard to assets held for sale, it must be determined if
they can be sold in their current condition and if the sale of
such is highly probable. If both conditions apply, the assets
and any related liabilities must be reported and measured as
“Assets held for sale” or “Liabilities held for sale”, respec-
tively.
Management estimates and judgements. Preparation of
consolidated financial statements pursuant to IFRS requires
assumptions and estimates to be made, which have an impact
on the recognised value of the assets and liabilities carried
on the balance sheet, on income and expenses and on the dis-
closure of contingent liabilities.
Amongst other things, these assumptions and estimates relate
to the accounting and measurement of provisions. With regard
to pension provisions and similar obligations, the discount fac-
tor and the expected return on plan assets are important esti-
RWE Annual Report 2011142 notes
mates. The discount factor for pension obligations is deter-
mined on the basis of yields on high quality, fixed-rate
corporate bonds on the financial markets as of the balance-
sheet date. In Germany, an increase or decrease of one percent-
age point in the discount factor would result in a reduction of
€1,378 million (previous year: €1,314 million) or an increase of
€1,754 million (previous year: €1,672 million), respectively, in
the present value of the obligations of the pension plans. For
the Group companies in the UK, identical changes in the dis-
count factor would reduce or increase pension obligations by
€679 million (previous year: €627 million) or €867 million (pre-
vious year: €798 million), respectively.
However, as the commitments stemming from company pen-
sion plans are primarily covered by funds and the value of most
plan assets typically exhibits negative correlation with the mar-
ket yields of fixed-interest securities, the pension provisions −
as determined taking into account the existing plan assets −
only depend on the prevailing level of market interest rates to a
limited degree.
For the accounting of business combinations, the identifiable
assets, liabilities and contingent liabilities are recognised at fair
value as of the date of acquisition. In this regard, the most
important estimates relate to the determination of the fair
value of these items as of the acquisition date. These estimates
are calculated on the basis of reports of independent external
valuation experts or internal analyses using suitable valuation
techniques. Amongst other things, special attention is paid in
this regard to the projection of future cash flows and determi-
nation of the discount rate.
The impairment test for goodwill is based on certain assump-
tions pertaining to the future, which are regularly adjusted.
Deferred tax assets are recognised if realisation of future tax
benefits is probable. Actual future income for tax purposes and
hence the actual realisability of deferred tax assets, however,
may deviate from the estimation made when the deferred taxes
are capitalised.
Further information on the assumptions and estimates upon
which these consolidated financial statements are based can be
found in the explanations of the individual items.
All assumptions and estimates are based on the circumstances
and forecasts prevailing on the balance-sheet date. Further-
more, as of the balance-sheet date realistic assessments of
overall economic conditions in the sectors and regions in which
RWE conducts operations are taken into consideration with
regard to the prospective development of business. Actual
amounts may deviate from the estimated amounts if the overall
conditions develop differently than expected. In such cases, the
assumptions, and, if necessary, the carrying amounts of the
affected assets and liabilities are adjusted.
As of the date of preparation of the consolidated financial
statements, it is not presumed that there will be a material
change in the assumptions and estimates.
Capital management. RWE’s capital management is deter-
mined by the Group’s strategic objectives and focuses on
increasing the value of the business over the long term. To
achieve this goal, the RWE Group endeavours to constantly
optimise its existing operations, to safeguard its market posi-
tion by offering competitive products and services and, if nec-
essary, to optimise its portfolio via value-creating acquisitions
and divestitures.
RWE manages its capital structure on the basis of financial indi-
cators. One key indicator is the “debt factor” (leverage factor),
which is calculated using net debt. Net debt is calculated by
adding material non-current provisions to net financial debt,
subtracting the surplus of plan assets over benefit obligations
and adjusting for one half of the issued hybrid capital. The debt
factor is the ratio of net debt to EBITDA. For the year under
review, this factor was 3.5 (previous year: 2.8). The debt factor
is not to exceed 3.0 over the long term. With this target, we
support our strong credit rating. We ascribe great importance
to securing this rating and thus maintaining financial flexibility.
The credit rating is influenced by a number of qualitative
and quantitative factors. These include aspects such as
the amount of cash flows and debt as well as market condi-
tions, competition, and the political framework. The issuance
of a €1.75 billion hybrid bond in September 2010 and a
CHF250 million hybrid bond in October 2011 also helped to
stabilise this rating. One half of the hybrid capital is classified
as equity by the two leading rating agencies, Moody’s and
Standard & Poor’s. As a result, the debt indicators relevant to
the rating are better than they would be if a traditional bond
had been issued.
At present, Moody’s and Standard & Poor’s assign the ratings
A3 and A-, both with a negative outlook, to the non-subordi-
nated bonds issued by RWE AG and by RWE Finance B.V. with
To our investors Review of operations our responsibility
Responsibility statement consolidated financial statements Further information
notes 143
The International Accounting Standards Board (IASB) and the
IFRS Interpretations Committee (IFRS IC) have approved several
amendments to existing International Financial Reporting
Standards (IFRSs) and adopted several new IFRSs and interpre-
tations, which became effective for the RWE Group as of fiscal
2011:
• Improvements to International Financial Reporting Standards
(2010)
• Amendment to IFRS 1 (2010) – Limited exemption from Com-
parative IFRS 7 Disclosures for First-time Adopters
• IAS 24 (2009) – Related Party Disclosures
• Amendment to IAS 32 (2009) – Classification of Rights Issues
• Amendment to IFRIC 14 (2009) – Prepayments of a Minimum
Funding Requirement
• IFRIC 19 (2009) – Extinguishing Financial Liabilities with
Equity Instruments
The standards and interpretations as well as amendments to
standards and interpretations applicable for the first time have
no material effects on the RWE Group’s consolidated financial
statements.
Changes in accounting policies
a guarantee by RWE AG. RWE thus continues to have invest-
ment-grade ratings. The short-term credit ratings are P− 2 and
A− 2. We are committed to maintaining a solid A rating.
144 notes RWE Annual Report 2011
New accounting policies
The IASB has adopted further standards and amendments to
standards, which are not yet mandatory in the European Union
(EU) in fiscal 2011. The most important changes are presented
below. EU endorsement is still pending in some cases.
IFRS 9 (2011) “Financial Instruments” replaces the previous
regulations of IAS 39 for the classification and measurement of
financial assets and contains minor changes in relation to the
measurement of financial liabilities. The adopted amendments
primarily relate to the reduction in the number of measurement
categories for financial assets. IFRS 9 (2011) becomes effective
for the first time for fiscal years starting on or after 1 January
2015.
IFRS 10 (2011) “Consolidated Financial Statements” replaces
the previous regulations of IAS 27 and of SIC− 12 for consolida-
tion. According to IFRS 10 (2011), the following three require-
ments must be cumulatively fulfilled in order for control to
exist: power over the relevant activities, a right to variable
returns from the investee, and the ability to use power over the
investee to affect the amount of the variable returns. IFRS 10
(2011) becomes effective for the first time for fiscal years start-
ing on or after 1 January 2013.
IFRS 11 (2011) “Joint Arrangements” replaces the previous
regulations of IAS 31 and of SIC− 13 for the accounting treat-
ment of joint ventures. IFRS 11 (2011) regulates the accounting
treatment of cases in which a company is managed jointly or an
activity is carried out jointly. A further amendment is that in the
future proportionate consolidation is no longer allowed. RWE
had not exercised this option in the past anyway. IFRS 11
(2011) becomes effective for the first time for fiscal years start-
ing on or after 1 January 2013.
IFRS 12 (2011) “Disclosure of Interests in Other Entities”
encompasses the disclosure obligations resulting from the
application of IFRS 10, IFRS 11 and IAS 28. The mandatory dis-
closures are to enable users of financial statements to evaluate
the risks and financial effects resulting from subsidiaries, joint
ventures and joint operations, associated companies and
unconsolidated structured entities. IFRS 12 (2011) becomes
effective for the first time for fiscal years starting on or after
1 January 2013.
IFRS 13 (2011) “Fair Value Measurement” defines a single
framework for measuring fair value across all standards. Fur-
thermore, IFRS 13 (2011) introduces extensive disclosure on
fair valuations in the notes. IFRS 13 (2011) becomes effective
for the first time for fiscal years starting on or after 1 January
2013.
IAS 28 (2011) “Investments in Associates and Joint Ventures”
was supplemented with regulations for the accounting treat-
ment of investments in joint ventures when it was revised. IAS
28 (2011) becomes effective for the first time for fiscal years
starting on or after 1 January 2013.
“Presentation of Other Comprehensive Income” (Amendments
of IAS 1) (2011) relates to the presentation of items included
in the statement of recognised income and expenses. In the
future, these must be divided into two categories, depending
on how they are to be recognised in the income statement in
the future (“recycling”). These amendments become effective
for the first time for fiscal years starting on or after 1 July 2012.
Amendments to IAS 19 (2011) “Employee Benefits” abolish
options to recognise actuarial gains and losses. New regula-
tions on considering the expected return on plan assets
are also introduced. In addition, the disclosure obligations
in the notes are expanded. These amendments become effec-
tive for the first time for fiscal years starting on or after
1 January 2013.
To our investors Review of operations our responsibility
Responsibility statement consolidated financial statements Further information
notes 145
Offsetting Financial Assets and Financial Liabilities (Amend-
ments to IAS 32) (2011) and Disclosures – Offsetting Financial
Assets and Financial Liabilities (Amendments to IFRS 7)
(2011) regulate the offsetting of financial assets and financial
liabilities and the related reporting requirements. While the
requirements for offsetting are only detailed by application
guidances, the scope of reporting requirements is expanded
considerably. These amendments related to IFRS 7 become
effective for the first time for fiscal years starting on or after
1 January 2013, the amendments related to IAS 32 for fiscal
years starting on or after 1 January 2014.
The effects of the amendments to the standards on the RWE
Group’s consolidated financial statements are currently being
reviewed.
The following standards, amendments to standards, and inter-
pretations are not expected to have any material effects on the
RWE Group’s consolidated financial statements:
• IAS 27 (2011) – Separate Financial Statements
• Amendment to IFRS 1 (2010) – Severe Hyperinflation and
Removal of Fixed Dates for First-time Adopters
• Amendment to IFRS 7 (2010) – Financial Instruments: Disclo-
sures – Transfers of Financial Assets
• Amendment to IAS 12 (2010) – Deferred Tax: Recovery of
Underlying Assets
• IFRIC 20 (2011) – Stripping Costs in the Production Phase of a
Surface Mine
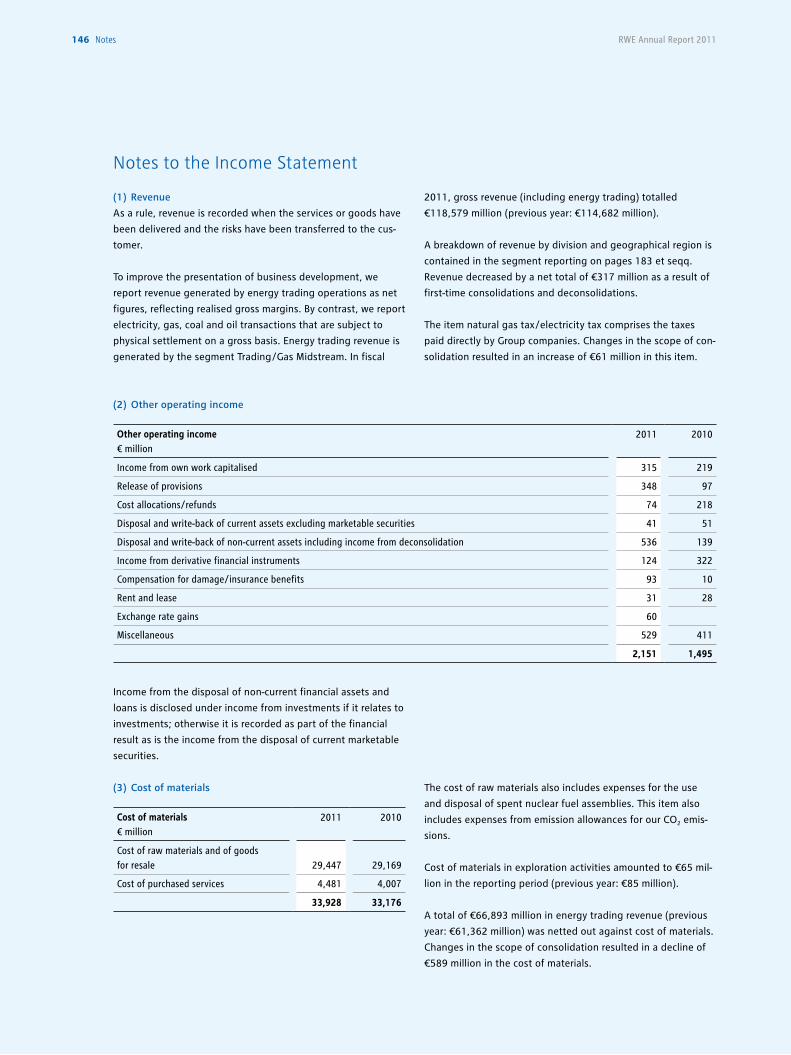
RWE Annual Report 2011146 notes
(1) Revenue
As a rule, revenue is recorded when the services or goods have
been delivered and the risks have been transferred to the cus-
tomer.
To improve the presentation of business development, we
report revenue generated by energy trading operations as net
figures, reflecting realised gross margins. By contrast, we report
electricity, gas, coal and oil transactions that are subject to
physical settlement on a gross basis. Energy trading revenue is
generated by the segment Trading /Gas Midstream. In fiscal
2011, gross revenue (including energy trading) totalled
€118,579 million (previous year: €114,682 million).
A breakdown of revenue by division and geographical region is
contained in the segment reporting on pages 183 et seqq.
Revenue decreased by a net total of €317 million as a result of
first-time consolidations and deconsolidations.
The item natural gas tax /electricity tax comprises the taxes
paid directly by Group companies. Changes in the scope of con-
solidation resulted in an increase of €61 million in this item.
Income from the disposal of non-current financial assets and
loans is disclosed under income from investments if it relates to
investments; otherwise it is recorded as part of the financial
result as is the income from the disposal of current marketable
securities.
(2) Other operating income
Notes to the Income Statement
Other operating income€ million
2011 2010
Income from own work capitalised 315 219
Release of provisions 348 97
Cost allocations/refunds 74 218
Disposal and write-back of current assets excluding marketable securities 41 51
Disposal and write-back of non-current assets including income from deconsolidation 536 139
Income from derivative financial instruments 124 322
Compensation for damage/insurance benefits 93 10
Rent and lease 31 28
Exchange rate gains 60
Miscellaneous 529 411
2,151 1,495
Cost of materials€ million
2011 2010
Cost of raw materials and of goods for resale 29,447 29,169
Cost of purchased services 4,481 4,007
33,928 33,176
(3) Cost of materials The cost of raw materials also includes expenses for the use
and disposal of spent nuclear fuel assemblies. This item also
includes expenses from emission allowances for our CO2 emis-
sions.
Cost of materials in exploration activities amounted to €65 mil-
lion in the reporting period (previous year: €85 million).
A total of €66,893 million in energy trading revenue (previous
year: €61,362 million) was netted out against cost of materials.
Changes in the scope of consolidation resulted in a decline of
€589 million in the cost of materials.
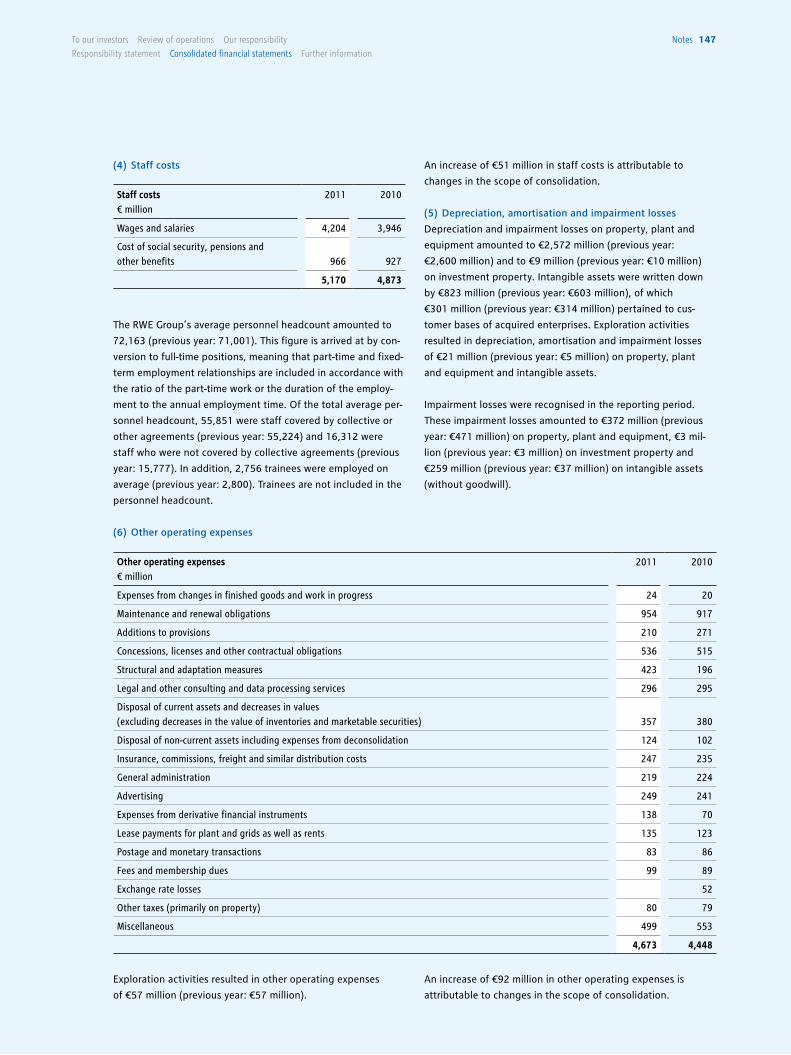
To our investors Review of operations our responsibility
Responsibility statement consolidated financial statements Further information
notes 147
Exploration activities resulted in other operating expenses
of €57 million (previous year: €57 million).
(6) Other operating expenses
Other operating expenses€ million
2011 2010
Expenses from changes in finished goods and work in progress 24 20
Maintenance and renewal obligations 954 917
Additions to provisions 210 271
Concessions, licenses and other contractual obligations 536 515
Structural and adaptation measures 423 196
Legal and other consulting and data processing services 296 295
Disposal of current assets and decreases in values (excluding decreases in the value of inventories and marketable securities) 357 380
Disposal of non-current assets including expenses from deconsolidation 124 102
Insurance, commissions, freight and similar distribution costs 247 235
General administration 219 224
Advertising 249 241
Expenses from derivative financial instruments 138 70
Lease payments for plant and grids as well as rents 135 123
Postage and monetary transactions 83 86
Fees and membership dues 99 89
Exchange rate losses 52
Other taxes (primarily on property) 80 79
Miscellaneous 499 553
4,673 4,448
An increase of €51 million in staff costs is attributable to
changes in the scope of consolidation.
(5) Depreciation, amortisation and impairment losses
Depreciation and impairment losses on property, plant and
equipment amounted to €2,572 million (previous year:
€2,600 million) and to €9 million (previous year: €10 million)
on investment property. Intangible assets were written down
by €823 million (previous year: €603 million), of which
€301 million (previous year: €314 million) pertained to cus-
tomer bases of acquired enterprises. Exploration activities
resulted in depreciation, amortisation and impairment losses
of €21 million (previous year: €5 million) on property, plant
and equipment and intangible assets.
Impairment losses were recognised in the reporting period.
These impairment losses amounted to €372 million (previous
year: €471 million) on property, plant and equipment, €3 mil-
lion (previous year: €3 million) on investment property and
€259 million (previous year: €37 million) on intangible assets
(without goodwill).
An increase of €92 million in other operating expenses is
attributable to changes in the scope of consolidation.
The RWE Group’s average personnel headcount amounted to
72,163 (previous year: 71,001). This figure is arrived at by con-
version to full-time positions, meaning that part-time and fixed-
term employment relationships are included in accordance with
the ratio of the part-time work or the duration of the employ-
ment to the annual employment time. Of the total average per-
sonnel headcount, 55,851 were staff covered by collective or
other agreements (previous year: 55,224) and 16,312 were
staff who were not covered by collective agreements (previous
year: 15,777). In addition, 2,756 trainees were employed on
average (previous year: 2,800). Trainees are not included in the
personnel headcount.
Staff costs€ million
2011 2010
Wages and salaries 4,204 3,946
Cost of social security, pensions and other benefits 966 927
5,170 4,873
(4) Staff costs
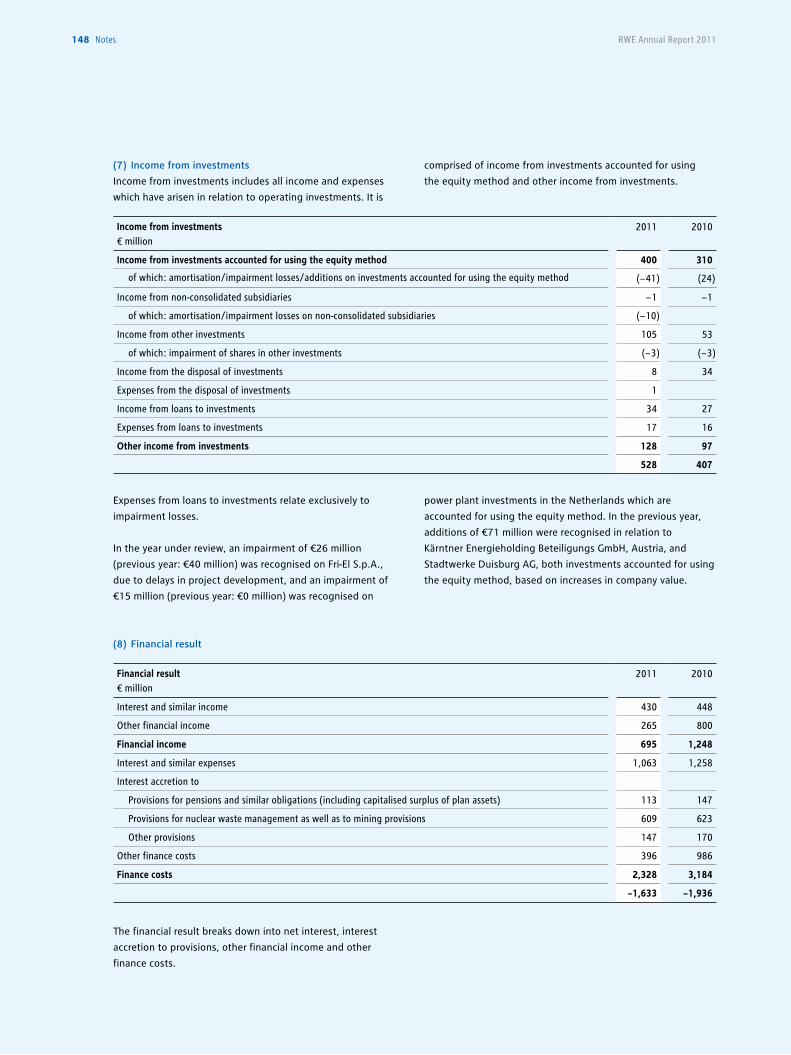
148 notes RWE Annual Report 2011
(7) Income from investments
Income from investments includes all income and expenses
which have arisen in relation to operating investments. It is
comprised of income from investments accounted for using
the equity method and other income from investments.
Expenses from loans to investments relate exclusively to
impairment losses.
In the year under review, an impairment of €26 million
(previous year: €40 million) was recognised on Fri-El S.p.A.,
due to delays in project development, and an impairment of
€15 million (previous year: €0 million) was recognised on
The financial result breaks down into net interest, interest
accretion to provisions, other financial income and other
finance costs.
power plant investments in the Netherlands which are
accounted for using the equity method. In the previous year,
additions of €71 million were recognised in relation to
Kärntner Energieholding Beteiligungs GmbH, Austria, and
Stadtwerke Duisburg AG, both investments accounted for using
the equity method, based on increases in company value.
Income from investments€ million
2011 2010
Income from investments accounted for using the equity method 400 310
of which: amortisation/impairment losses/additions on investments accounted for using the equity method (− 41) (24)
Income from non-consolidated subsidiaries − 1 − 1
of which: amortisation/impairment losses on non-consolidated subsidiaries (− 10)
Income from other investments 105 53
of which: impairment of shares in other investments (− 3) (− 3)
Income from the disposal of investments 8 34
Expenses from the disposal of investments 1
Income from loans to investments 34 27
Expenses from loans to investments 17 16
Other income from investments 128 97
528 407
Financial result€ million
2011 2010
Interest and similar income 430 448
Other financial income 265 800
Financial income 695 1,248
Interest and similar expenses 1,063 1,258
Interest accretion to
Provisions for pensions and similar obligations (including capitalised surplus of plan assets) 113 147
Provisions for nuclear waste management as well as to mining provisions 609 623
Other provisions 147 170
Other finance costs 396 986
Finance costs 2,328 3,184
− 1,633 − 1,936
(8) Financial result
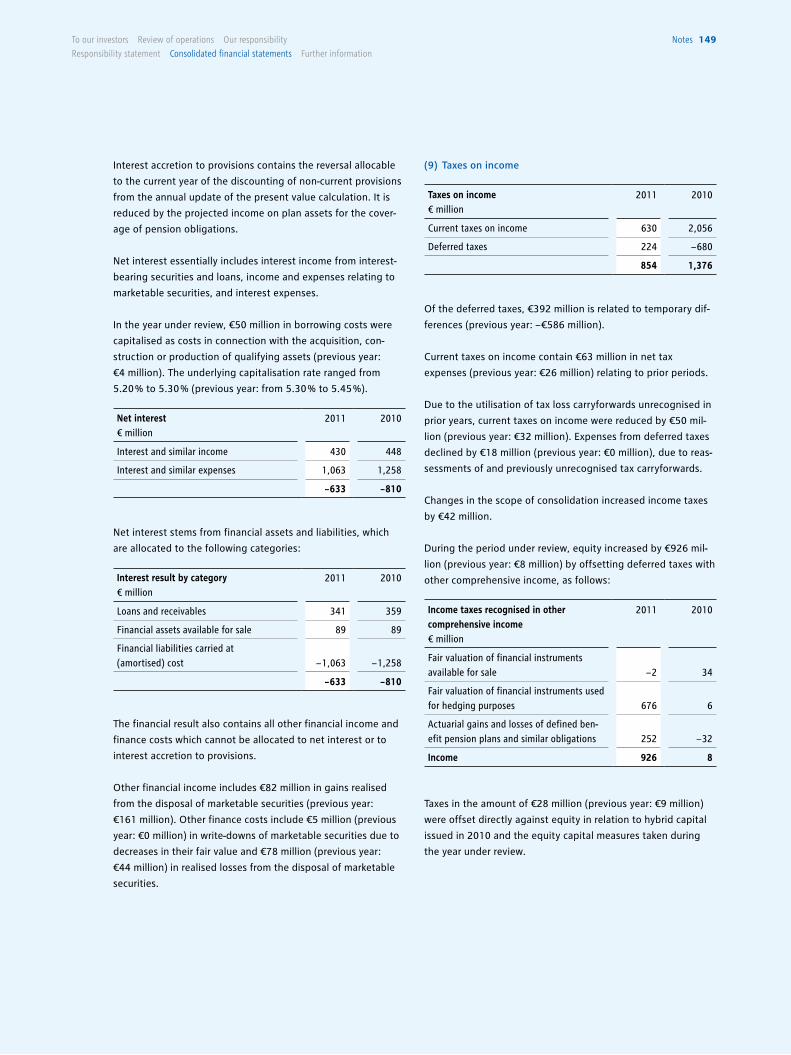
To our investors Review of operations our responsibility
Responsibility statement consolidated financial statements Further information
notes 149
Net interest stems from financial assets and liabilities, which
are allocated to the following categories:
Taxes in the amount of €28 million (previous year: €9 million)
were offset directly against equity in relation to hybrid capital
issued in 2010 and the equity capital measures taken during
the year under review.
The financial result also contains all other financial income and
finance costs which cannot be allocated to net interest or to
interest accretion to provisions.
Other financial income includes €82 million in gains realised
from the disposal of marketable securities (previous year:
€161 million). Other finance costs include €5 million (previous
year: €0 million) in write-downs of marketable securities due to
decreases in their fair value and €78 million (previous year:
€44 million) in realised losses from the disposal of marketable
securities.
Of the deferred taxes, €392 million is related to temporary dif-
ferences (previous year: − €586 million).
Current taxes on income contain €63 million in net tax
expenses (previous year: €26 million) relating to prior periods.
Due to the utilisation of tax loss carryforwards unrecognised in
prior years, current taxes on income were reduced by €50 mil-
lion (previous year: €32 million). Expenses from deferred taxes
declined by €18 million (previous year: €0 million), due to reas-
sessments of and previously unrecognised tax carryforwards.
Changes in the scope of consolidation increased income taxes
by €42 million.
During the period under review, equity increased by €926 mil-
lion (previous year: €8 million) by offsetting deferred taxes with
other comprehensive income, as follows:Interest result by category€ million
2011 2010
Loans and receivables 341 359
Financial assets available for sale 89 89
Financial liabilities carried at (amortised) cost − 1,063 − 1,258
− 633 − 810
Taxes on income€ million
2011 2010
Current taxes on income 630 2,056
Deferred taxes 224 − 680
854 1,376
Income taxes recognised in other comprehensive income€ million
2011 2010
Fair valuation of financial instruments available for sale − 2 34
Fair valuation of financial instruments used for hedging purposes 676 6
Actuarial gains and losses of defined ben-efit pension plans and similar obligations 252 − 32
Income 926 8
Net interest€ million
2011 2010
Interest and similar income 430 448
Interest and similar expenses 1,063 1,258
− 633 − 810
Interest accretion to provisions contains the reversal allocable
to the current year of the discounting of non-current provisions
from the annual update of the present value calculation. It is
reduced by the projected income on plan assets for the cover-
age of pension obligations.
Net interest essentially includes interest income from interest-
bearing securities and loans, income and expenses relating to
marketable securities, and interest expenses.
In the year under review, €50 million in borrowing costs were
capitalised as costs in connection with the acquisition, con-
struction or production of qualifying assets (previous year:
€4 million). The underlying capitalisation rate ranged from
5.20 % to 5.30 % (previous year: from 5.30 % to 5.45 %).
(9) Taxes on income
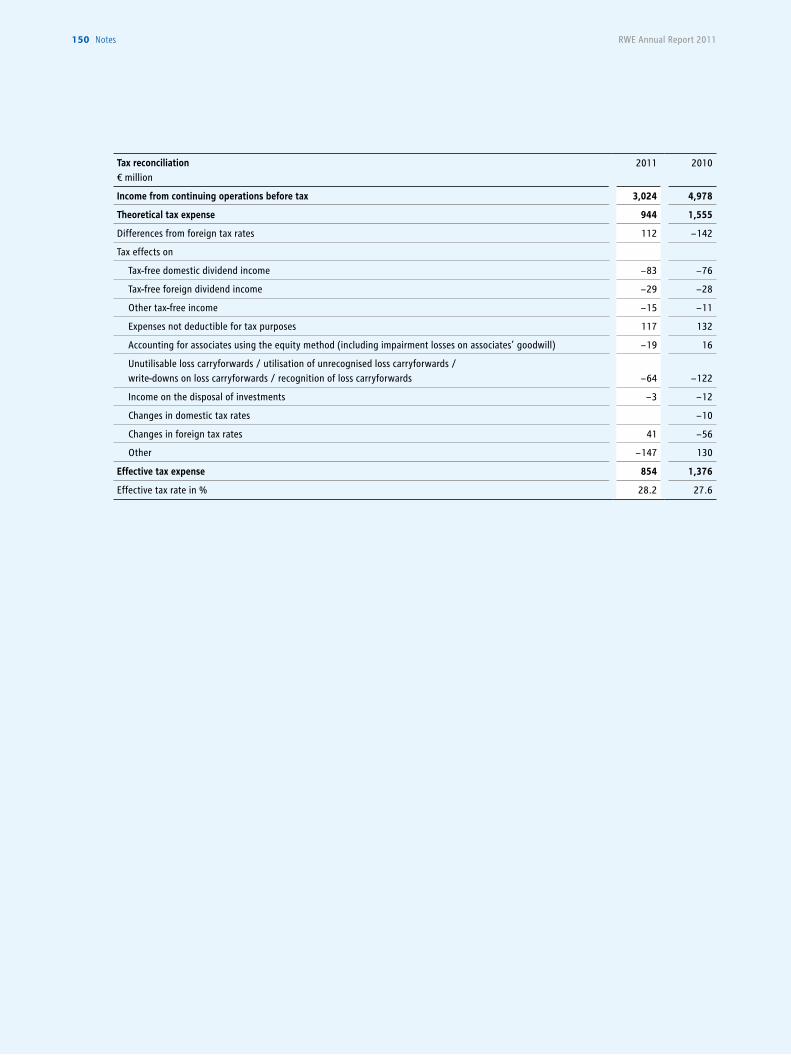
150 notes RWE Annual Report 2011
Tax reconciliation€ million
2011 2010
Income from continuing operations before tax 3,024 4,978
Theoretical tax expense 944 1,555
Differences from foreign tax rates 112 − 142
Tax effects on
Tax-free domestic dividend income − 83 − 76
Tax-free foreign dividend income − 29 − 28
Other tax-free income − 15 − 11
Expenses not deductible for tax purposes 117 132
Accounting for associates using the equity method (including impairment losses on associates’ goodwill) − 19 16
Unutilisable loss carryforwards / utilisation of unrecognised loss carryforwards / write-downs on loss carryforwards / recognition of loss carryforwards − 64 − 122
Income on the disposal of investments − 3 − 12
Changes in domestic tax rates − 10
Changes in foreign tax rates 41 − 56
Other − 147 130
Effective tax expense 854 1,376
Effective tax rate in % 28.2 27.6
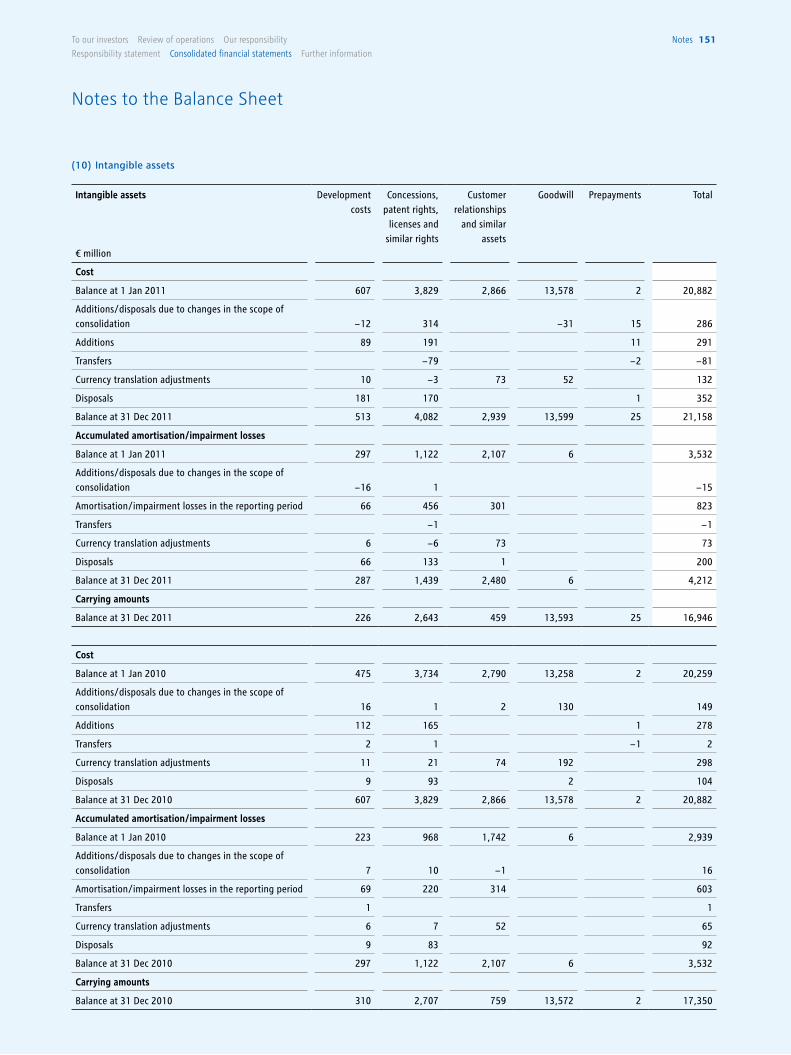
To our investors Review of operations our responsibility
Responsibility statement consolidated financial statements Further information
notes 151
(10) Intangible assets
Notes to the Balance Sheet
Intangible assets
€ million
Developmentcosts
Concessions, patent rights,
licenses and similar rights
Customerrelationships
and similar assets
Goodwill Prepayments Total
Cost
Balance at 1 Jan 2011 607 3,829 2,866 13,578 2 20,882
Additions/disposals due to changes in the scope of consolidation − 12 314 − 31 15 286
Additions 89 191 11 291
Transfers − 79 − 2 − 81
Currency translation adjustments 10 − 3 73 52 132
Disposals 181 170 1 352
Balance at 31 Dec 2011 513 4,082 2,939 13,599 25 21,158
Accumulated amortisation/impairment losses
Balance at 1 Jan 2011 297 1,122 2,107 6 3,532
Additions/disposals due to changes in the scope of consolidation − 16 1 − 15
Amortisation/impairment losses in the reporting period 66 456 301 823
Transfers − 1 − 1
Currency translation adjustments 6 − 6 73 73
Disposals 66 133 1 200
Balance at 31 Dec 2011 287 1,439 2,480 6 4,212
Carrying amounts
Balance at 31 Dec 2011 226 2,643 459 13,593 25 16,946
Cost
Balance at 1 Jan 2010 475 3,734 2,790 13,258 2 20,259
Additions/disposals due to changes in the scope of consolidation 16 1 2 130 149
Additions 112 165 1 278
Transfers 2 1 − 1 2
Currency translation adjustments 11 21 74 192 298
Disposals 9 93 2 104
Balance at 31 Dec 2010 607 3,829 2,866 13,578 2 20,882
Accumulated amortisation/impairment losses
Balance at 1 Jan 2010 223 968 1,742 6 2,939
Additions/disposals due to changes in the scope of consolidation 7 10 − 1 16
Amortisation/impairment losses in the reporting period 69 220 314 603
Transfers 1 1
Currency translation adjustments 6 7 52 65
Disposals 9 83 92
Balance at 31 Dec 2010 297 1,122 2,107 6 3,532
Carrying amounts
Balance at 31 Dec 2010 310 2,707 759 13,572 2 17,350
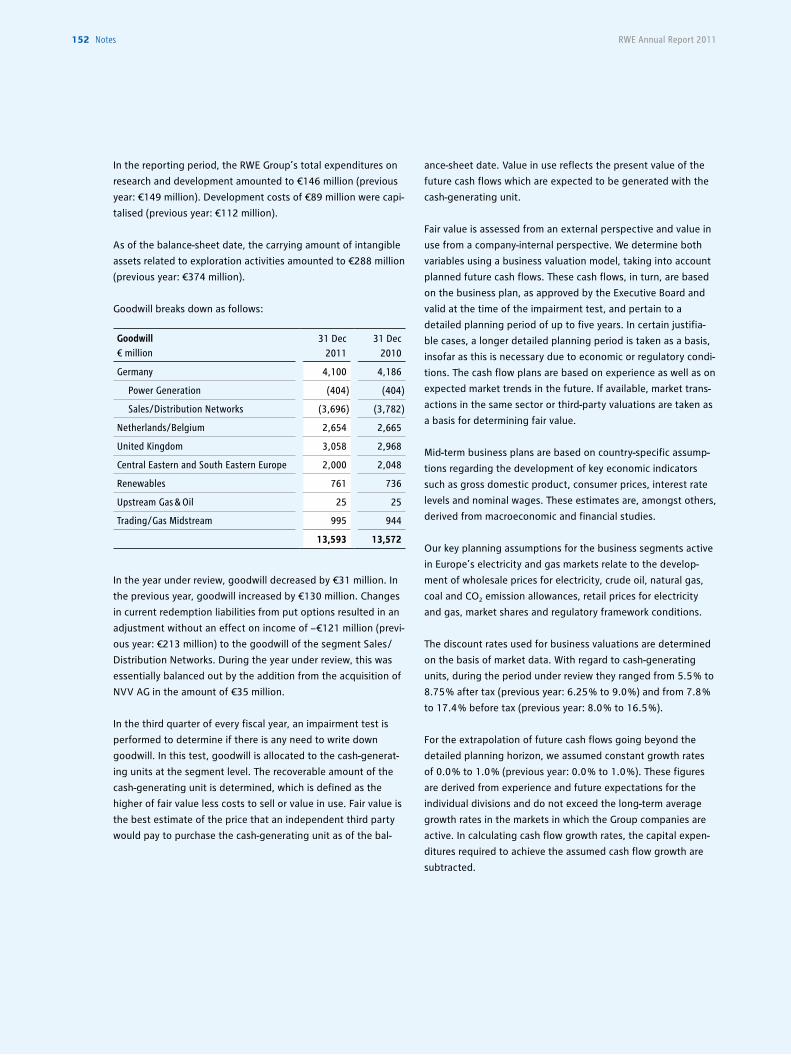
RWE Annual Report 2011152 notes
In the reporting period, the RWE Group’s total expenditures on
research and development amounted to €146 million (previous
year: €149 million). Development costs of €89 million were capi-
talised (previous year: €112 million).
As of the balance-sheet date, the carrying amount of intangible
assets related to exploration activities amounted to €288 million
(previous year: €374 million).
Goodwill breaks down as follows:
In the year under review, goodwill decreased by €31 million. In
the previous year, goodwill increased by €130 million. Changes
in current redemption liabilities from put options resulted in an
adjustment without an effect on income of − €121 million (previ-
ous year: €213 million) to the goodwill of the segment Sales /
Distribution Networks. During the year under review, this was
essentially balanced out by the addition from the acquisition of
NVV AG in the amount of €35 million.
In the third quarter of every fiscal year, an impairment test is
performed to determine if there is any need to write down
goodwill. In this test, goodwill is allocated to the cash-generat-
ing units at the segment level. The recoverable amount of the
cash-generating unit is determined, which is defined as the
higher of fair value less costs to sell or value in use. Fair value is
the best estimate of the price that an independent third party
would pay to purchase the cash-generating unit as of the bal-
ance-sheet date. Value in use reflects the present value of the
future cash flows which are expected to be generated with the
cash-generating unit.
Fair value is assessed from an external perspective and value in
use from a company-internal perspective. We determine both
variables using a business valuation model, taking into account
planned future cash flows. These cash flows, in turn, are based
on the business plan, as approved by the Executive Board and
valid at the time of the impairment test, and pertain to a
detailed planning period of up to five years. In certain justifia-
ble cases, a longer detailed planning period is taken as a basis,
insofar as this is necessary due to economic or regulatory condi-
tions. The cash flow plans are based on experience as well as on
expected market trends in the future. If available, market trans-
actions in the same sector or third-party valuations are taken as
a basis for determining fair value.
Mid-term business plans are based on country-specific assump-
tions regarding the development of key economic indicators
such as gross domestic product, consumer prices, interest rate
levels and nominal wages. These estimates are, amongst others,
derived from macroeconomic and financial studies.
Our key planning assumptions for the business segments active
in Europe’s electricity and gas markets relate to the develop-
ment of wholesale prices for electricity, crude oil, natural gas,
coal and CO2 emission allowances, retail prices for electricity
and gas, market shares and regulatory framework conditions.
The discount rates used for business valuations are determined
on the basis of market data. With regard to cash-generating
units, during the period under review they ranged from 5.5 % to
8.75 % after tax (previous year: 6.25 % to 9.0 %) and from 7.8 %
to 17.4 % before tax (previous year: 8.0 % to 16.5 %).
For the extrapolation of future cash flows going beyond the
detailed planning horizon, we assumed constant growth rates
of 0.0 % to 1.0 % (previous year: 0.0 % to 1.0 %). These figures
are derived from experience and future expectations for the
individual divisions and do not exceed the long-term average
growth rates in the markets in which the Group companies are
active. In calculating cash flow growth rates, the capital expen-
ditures required to achieve the assumed cash flow growth are
subtracted.
Goodwill € million
31 Dec 2011
31 Dec 2010
Germany 4,100 4,186
Power Generation (404) (404)
Sales/Distribution Networks (3,696) (3,782)
Netherlands/Belgium 2,654 2,665
United Kingdom 3,058 2,968
Central Eastern and South Eastern Europe 2,000 2,048
Renewables 761 736
Upstream Gas & Oil 25 25
Trading/Gas Midstream 995 944
13,593 13,572
notes 153To our investors Review of operations our responsibility
Responsibility statement consolidated financial statements Further information
As of the balance-sheet date, both the fair values less costs to
sell and the values in use were higher than the carrying
amounts of the cash-generating units. These surpluses react
especially sensitively to changes in the discount rate, the
growth rate and the operating result after taxes in terminal
value.
Of all the segments, United Kingdom, Netherlands /Belgium and
Trading /Gas Midstream exhibited the smallest surpluses of
recoverable amount over carrying amount.
The goodwill allocated to the segment United Kingdom
amounted to €3.1 billion (£2.6 billion) as of 31 December 2011.
The impairment test showed a recoverable amount which
exceeded the carrying amount by £1.2 billion. Valuation of the
segment United Kingdom was calculated using an after-tax dis-
count rate of 6.75 % and a growth rate of 1.0 %. An increase in
the after-tax discount rate by more than 1.31 percentage points
to above 8.06 %, the assumption of a negative growth rate
higher than 1.76 % or a decrease of more than £92 million in
the operating result after taxes in terminal value would result in
the recoverable amount being lower than the carrying amount
of the cash-generating unit United Kingdom.
The goodwill allocated to the segment Netherlands /Belgium
amounted to €2.7 billion. The recoverable amount exceeded the
carrying amount by €1.4 billion. Impairment would have been
necessary if the calculations had used an after-tax discount rate
increased by more than 0.78 percentage points to above
7.03 %, a growth rate decreased by more than 1.38 percentage
points to below − 0.38 % or an operating result reduced by more
than €97 million in terminal value.
The goodwill allocated to the segment Trading /Gas Midstream
amounted to €1.0 billion. The recoverable amount exceeded the
carrying amount by €0.9 billion. Impairment would have been
necessary if the calculations had used an after-tax discount rate
increased by more than 1.95 percentage points to above
8.70 %, a growth rate decreased by more than 2.88 percentage
points to below − 2.88 % or an operating result reduced by more
than €78 million in terminal value.
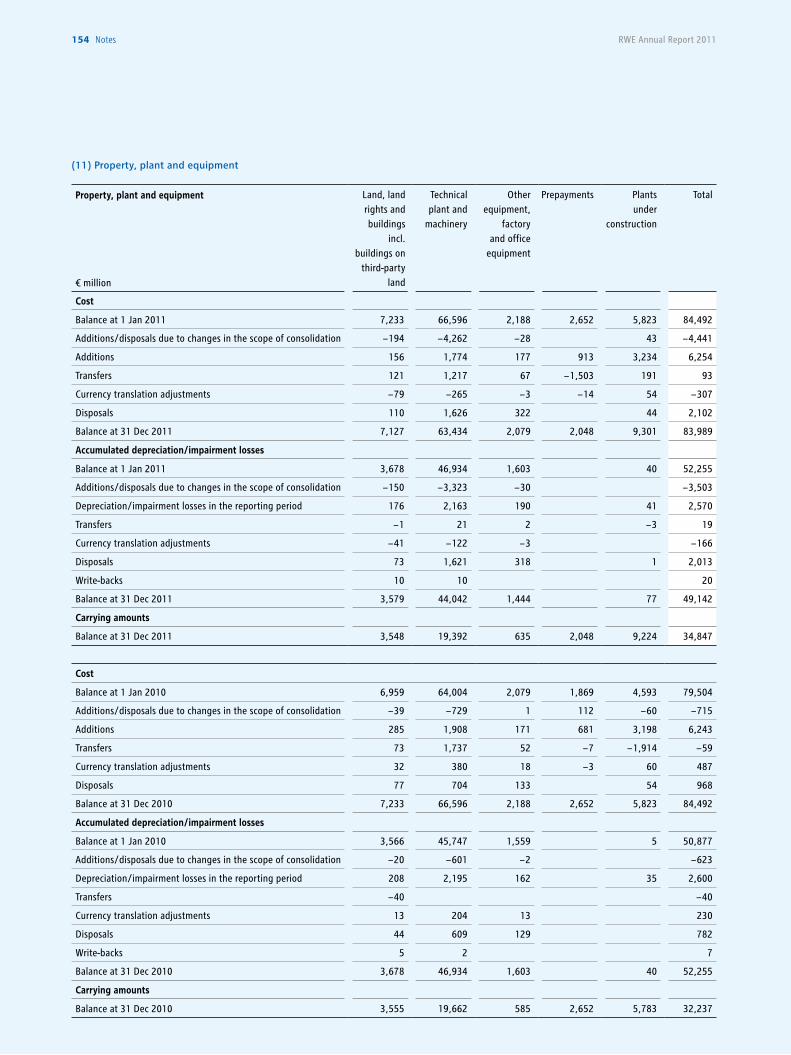
RWE Annual Report 2011154 notes
Property, plant and equipment
€ million
Land, landrights andbuildings
incl.buildings on
third-party land
Technicalplant and
machinery
Other equipment,
factoryand office
equipment
Prepayments Plantsunder
con struction
Total
Cost
Balance at 1 Jan 2011 7,233 66,596 2,188 2,652 5,823 84,492
Additions/disposals due to changes in the scope of consolidation − 194 − 4,262 − 28 43 − 4,441
Additions 156 1,774 177 913 3,234 6,254
Transfers 121 1,217 67 − 1,503 191 93
Currency translation adjustments − 79 − 265 − 3 − 14 54 − 307
Disposals 110 1,626 322 44 2,102
Balance at 31 Dec 2011 7,127 63,434 2,079 2,048 9,301 83,989
Accumulated depreciation/impairment losses
Balance at 1 Jan 2011 3,678 46,934 1,603 40 52,255
Additions/disposals due to changes in the scope of consolidation − 150 − 3,323 − 30 − 3,503
Depreciation/impairment losses in the reporting period 176 2,163 190 41 2,570
Transfers − 1 21 2 − 3 19
Currency translation adjustments − 41 − 122 − 3 − 166
Disposals 73 1,621 318 1 2,013
Write-backs 10 10 20
Balance at 31 Dec 2011 3,579 44,042 1,444 77 49,142
Carrying amounts
Balance at 31 Dec 2011 3,548 19,392 635 2,048 9,224 34,847
Cost
Balance at 1 Jan 2010 6,959 64,004 2,079 1,869 4,593 79,504
Additions/disposals due to changes in the scope of consolidation − 39 − 729 1 112 − 60 − 715
Additions 285 1,908 171 681 3,198 6,243
Transfers 73 1,737 52 − 7 − 1,914 − 59
Currency translation adjustments 32 380 18 − 3 60 487
Disposals 77 704 133 54 968
Balance at 31 Dec 2010 7,233 66,596 2,188 2,652 5,823 84,492
Accumulated depreciation/impairment losses
Balance at 1 Jan 2010 3,566 45,747 1,559 5 50,877
Additions/disposals due to changes in the scope of consolidation − 20 − 601 − 2 − 623
Depreciation/impairment losses in the reporting period 208 2,195 162 35 2,600
Transfers − 40 − 40
Currency translation adjustments 13 204 13 230
Disposals 44 609 129 782
Write-backs 5 2 7
Balance at 31 Dec 2010 3,678 46,934 1,603 40 52,255
Carrying amounts
Balance at 31 Dec 2010 3,555 19,662 585 2,652 5,783 32,237
(11) Property, plant and equipment
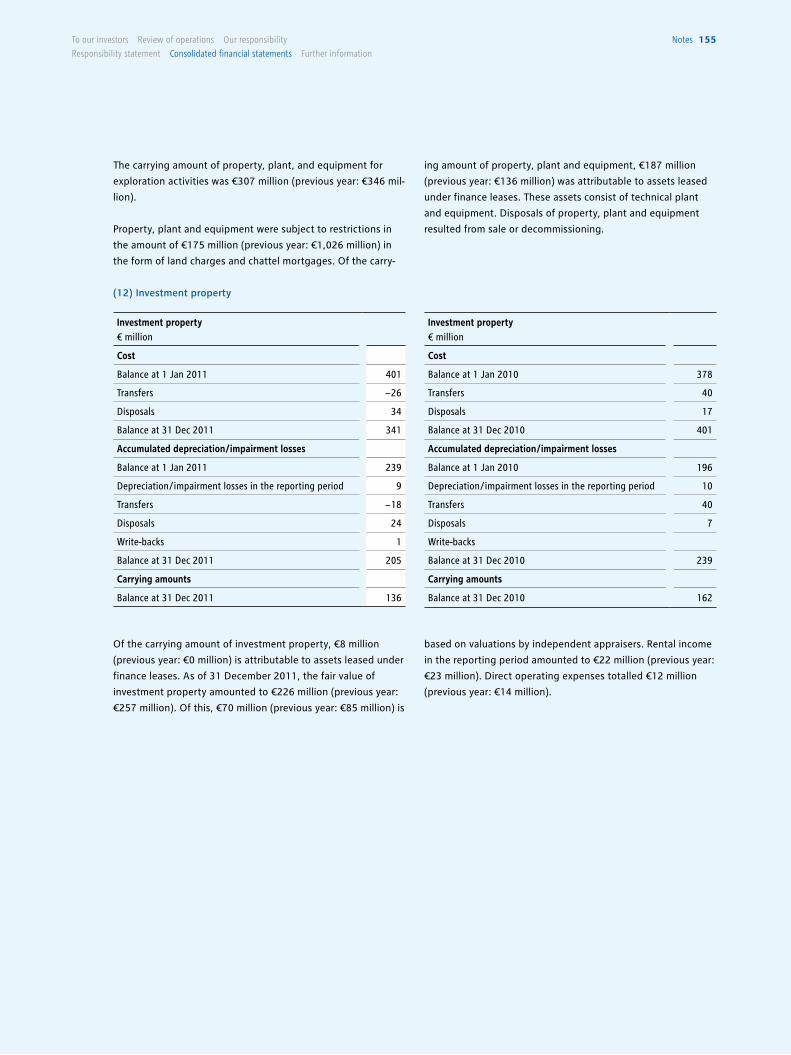
To our investors Review of operations our responsibility
Responsibility statement consolidated financial statements Further information
notes 155
The carrying amount of property, plant, and equipment for
exploration activities was €307 million (previous year: €346 mil-
lion).
Property, plant and equipment were subject to restrictions in
the amount of €175 million (previous year: €1,026 million) in
the form of land charges and chattel mortgages. Of the carry-
Of the carrying amount of investment property, €8 million
(previous year: €0 million) is attributable to assets leased under
finance leases. As of 31 December 2011, the fair value of
investment property amounted to €226 million (previous year:
€257 million). Of this, €70 million (previous year: €85 million) is
ing amount of property, plant and equipment, €187 million
(previous year: €136 million) was attributable to assets leased
under finance leases. These assets consist of technical plant
and equipment. Disposals of property, plant and equipment
resulted from sale or decommissioning.
based on valuations by independent appraisers. Rental income
in the reporting period amounted to €22 million (previous year:
€23 million). Direct operating expenses totalled €12 million
(previous year: €14 million).
Investment property€ million
Cost
Balance at 1 Jan 2010 378
Transfers 40
Disposals 17
Balance at 31 Dec 2010 401
Accumulated depreciation/impairment losses
Balance at 1 Jan 2010 196
Depreciation/impairment losses in the reporting period 10
Transfers 40
Disposals 7
Write-backs
Balance at 31 Dec 2010 239
Carrying amounts
Balance at 31 Dec 2010 162
(12) Investment property
Investment property€ million
Cost
Balance at 1 Jan 2011 401
Transfers − 26
Disposals 34
Balance at 31 Dec 2011 341
Accumulated depreciation/impairment losses
Balance at 1 Jan 2011 239
Depreciation/impairment losses in the reporting period 9
Transfers − 18
Disposals 24
Write-backs 1
Balance at 31 Dec 2011 205
Carrying amounts
Balance at 31 Dec 2011 136
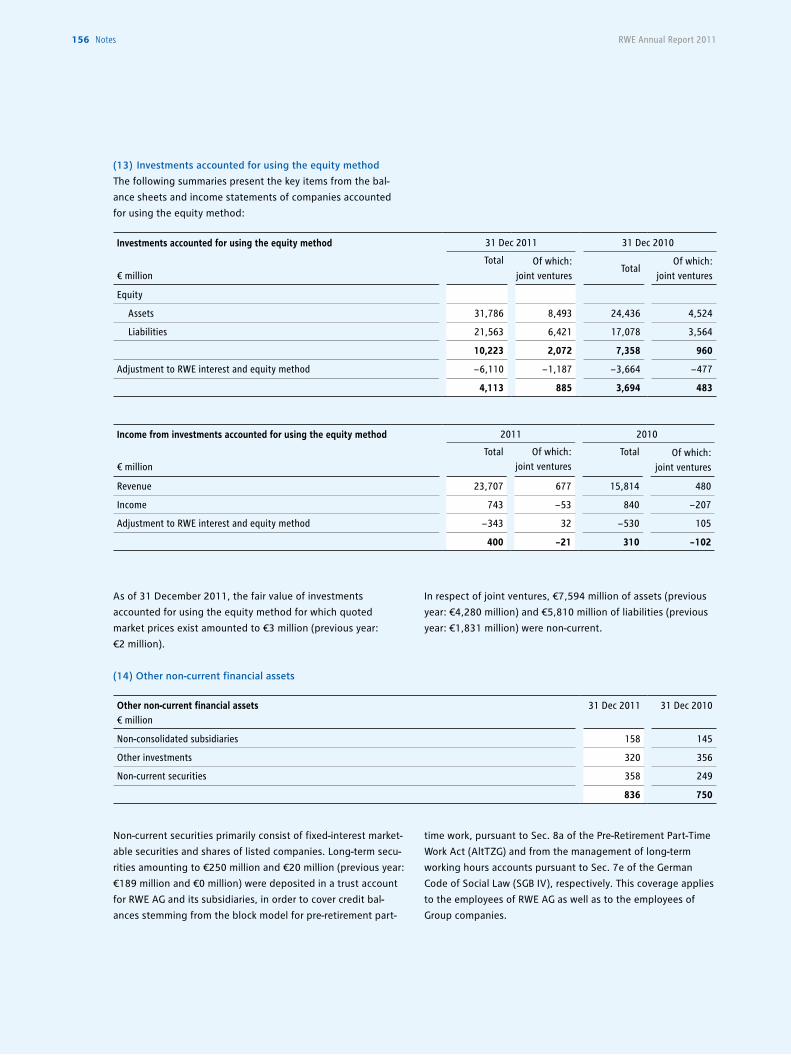
156 notes RWE Annual Report 2011
(13) Investments accounted for using the equity method
The following summaries present the key items from the bal-
ance sheets and income statements of companies accounted
for using the equity method:
(14) Other non-current financial assets
As of 31 December 2011, the fair value of investments
accounted for using the equity method for which quoted
market prices exist amounted to €3 million (previous year:
€2 million).
Non-current securities primarily consist of fixed-interest market-
able securities and shares of listed companies. Long-term secu-
rities amounting to €250 million and €20 million (previous year:
€189 million and €0 million) were deposited in a trust account
for RWE AG and its subsidiaries, in order to cover credit bal-
ances stemming from the block model for pre-retirement part-
time work, pursuant to Sec. 8a of the Pre-Retirement Part-Time
Work Act (AltTZG) and from the management of long-term
working hours accounts pursuant to Sec. 7e of the German
Code of Social Law (SGB IV), respectively. This coverage applies
to the employees of RWE AG as well as to the employees of
Group companies.
In respect of joint ventures, €7,594 million of assets (previous
year: €4,280 million) and €5,810 million of liabilities (previous
year: €1,831 million) were non-current.
Investments accounted for using the equity method
€ million
31 Dec 2011 31 Dec 2010
Total Of which: joint ventures
TotalOf which:
joint ventures
Equity
Assets 31,786 8,493 24,436 4,524
Liabilities 21,563 6,421 17,078 3,564
10,223 2,072 7,358 960
Adjustment to RWE interest and equity method − 6,110 − 1,187 − 3,664 − 477
4,113 885 3,694 483
Income from investments accounted for using the equity method
€ million
2011 2010
Total Of which: joint ventures
Total Of which: joint ventures
Revenue 23,707 677 15,814 480
Income 743 − 53 840 − 207
Adjustment to RWE interest and equity method − 343 32 − 530 105
400 − 21 310 − 102
Other non-current financial assets€ million
31 Dec 2011 31 Dec 2010
Non-consolidated subsidiaries 158 145
Other investments 320 356
Non-current securities 358 249
836 750
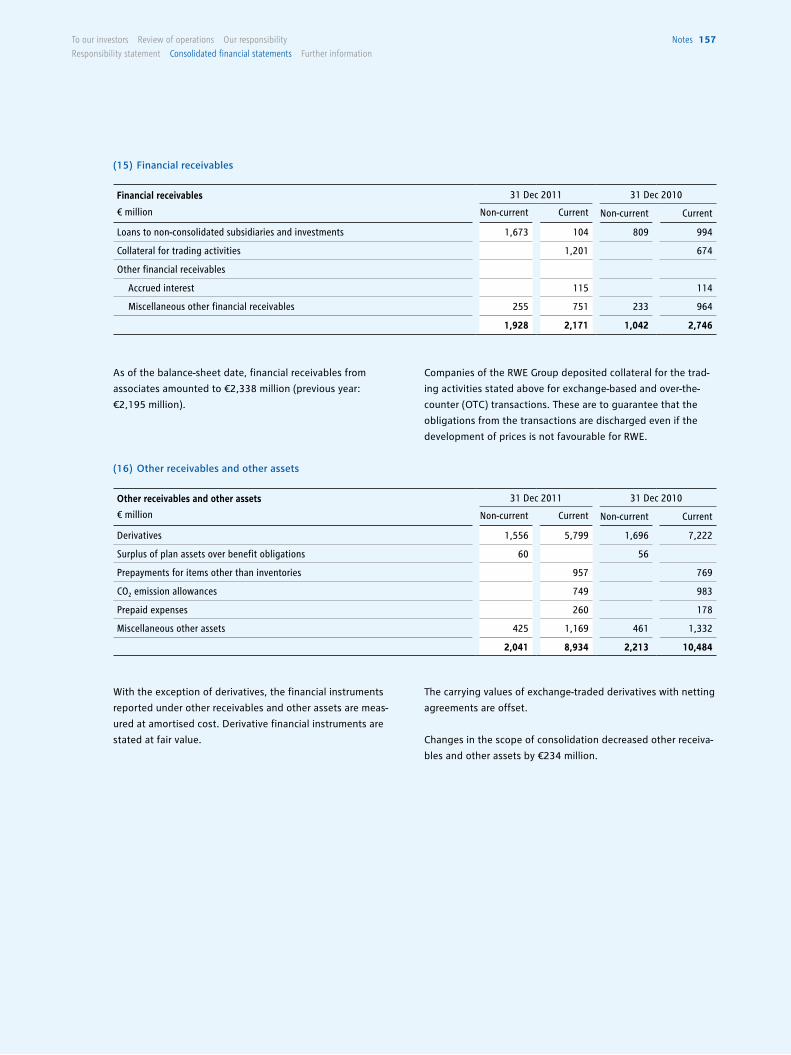
notes 157To our investors Review of operations our responsibility
Responsibility statement consolidated financial statements Further information
The carrying values of exchange-traded derivatives with netting
agreements are offset.
Changes in the scope of consolidation decreased other receiva-
bles and other assets by €234 million.
(15) Financial receivables
Financial receivables
€ million
31 Dec 2011 31 Dec 2010
Non-current Current Non-current Current
Loans to non-consolidated subsidiaries and investments 1,673 104 809 994
Collateral for trading activities 1,201 674
Other financial receivables
Accrued interest 115 114
Miscellaneous other financial receivables 255 751 233 964
1,928 2,171 1,042 2,746
As of the balance-sheet date, financial receivables from
associates amounted to €2,338 million (previous year:
€2,195 million).
With the exception of derivatives, the financial instruments
reported under other receivables and other assets are meas-
ured at amortised cost. Derivative financial instruments are
stated at fair value.
Companies of the RWE Group deposited collateral for the trad-
ing activities stated above for exchange-based and over-the-
counter (OTC) transactions. These are to guarantee that the
obligations from the transactions are discharged even if the
development of prices is not favourable for RWE.
(16) Other receivables and other assets
Other receivables and other assets
€ million
31 Dec 2011 31 Dec 2010
Non-current Current Non-current Current
Derivatives 1,556 5,799 1,696 7,222
Surplus of plan assets over benefit obligations 60 56
Prepayments for items other than inventories 957 769
CO2 emission allowances 749 983
Prepaid expenses 260 178
Miscellaneous other assets 425 1,169 461 1,332
2,041 8,934 2,213 10,484
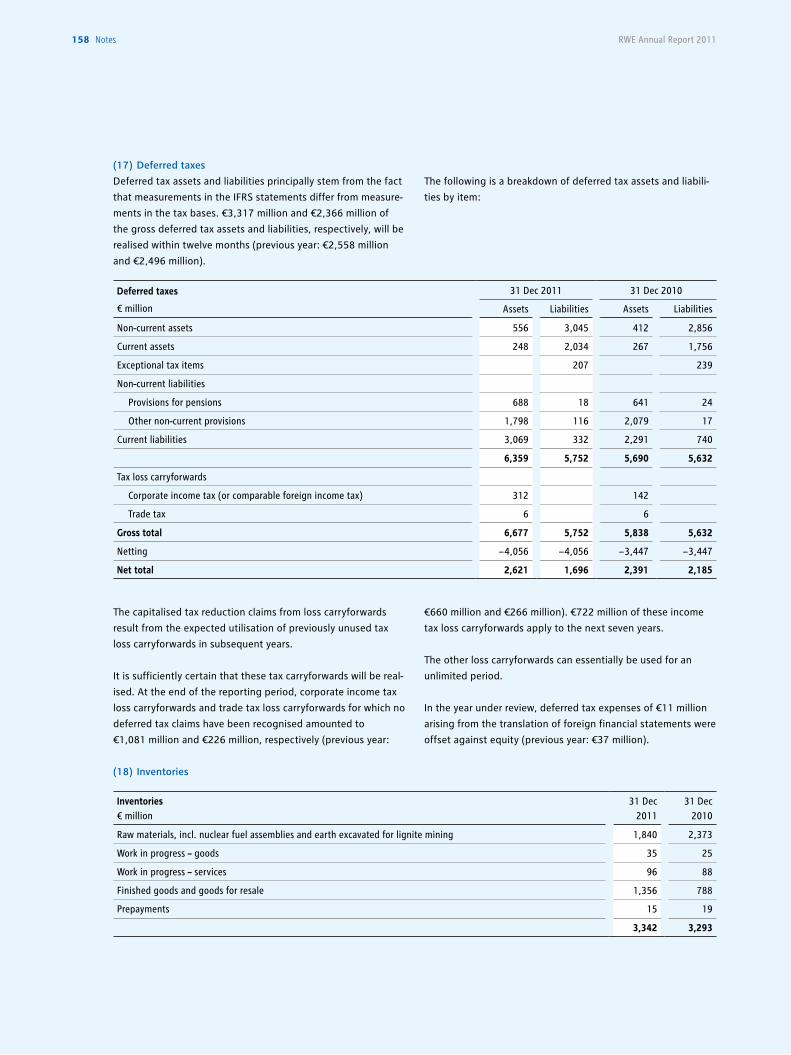
158 notes RWE Annual Report 2011
The capitalised tax reduction claims from loss carryforwards
result from the expected utilisation of previously unused tax
loss carryforwards in subsequent years.
It is sufficiently certain that these tax carryforwards will be real-
ised. At the end of the reporting period, corporate income tax
loss carryforwards and trade tax loss carryforwards for which no
deferred tax claims have been recognised amounted to
€1,081 million and €226 million, respectively (previous year:
€660 million and €266 million). €722 million of these income
tax loss carryforwards apply to the next seven years.
The other loss carryforwards can essentially be used for an
unlimited period.
In the year under review, deferred tax expenses of €11 million
arising from the translation of foreign financial statements were
offset against equity (previous year: €37 million).
(17) Deferred taxes
Deferred tax assets and liabilities principally stem from the fact
that measurements in the IFRS statements differ from measure-
ments in the tax bases. €3,317 million and €2,366 million of
the gross deferred tax assets and liabilities, respectively, will be
realised within twelve months (previous year: €2,558 million
and €2,496 million).
The following is a breakdown of deferred tax assets and liabili-
ties by item:
Deferred taxes
€ million
31 Dec 2011 31 Dec 2010
Assets Liabilities Assets Liabilities
Non-current assets 556 3,045 412 2,856
Current assets 248 2,034 267 1,756
Exceptional tax items 207 239
Non-current liabilities
Provisions for pensions 688 18 641 24
Other non-current provisions 1,798 116 2,079 17
Current liabilities 3,069 332 2,291 740
6,359 5,752 5,690 5,632
Tax loss carryforwards
Corporate income tax (or comparable foreign income tax) 312 142
Trade tax 6 6
Gross total 6,677 5,752 5,838 5,632
Netting − 4,056 − 4,056 − 3,447 − 3,447
Net total 2,621 1,696 2,391 2,185
(18) Inventories
Inventories€ million
31 Dec 2011
31 Dec 2010
Raw materials, incl. nuclear fuel assemblies and earth excavated for lignite mining 1,840 2,373
Work in progress – goods 35 25
Work in progress – services 96 88
Finished goods and goods for resale 1,356 788
Prepayments 15 19
3,342 3,293
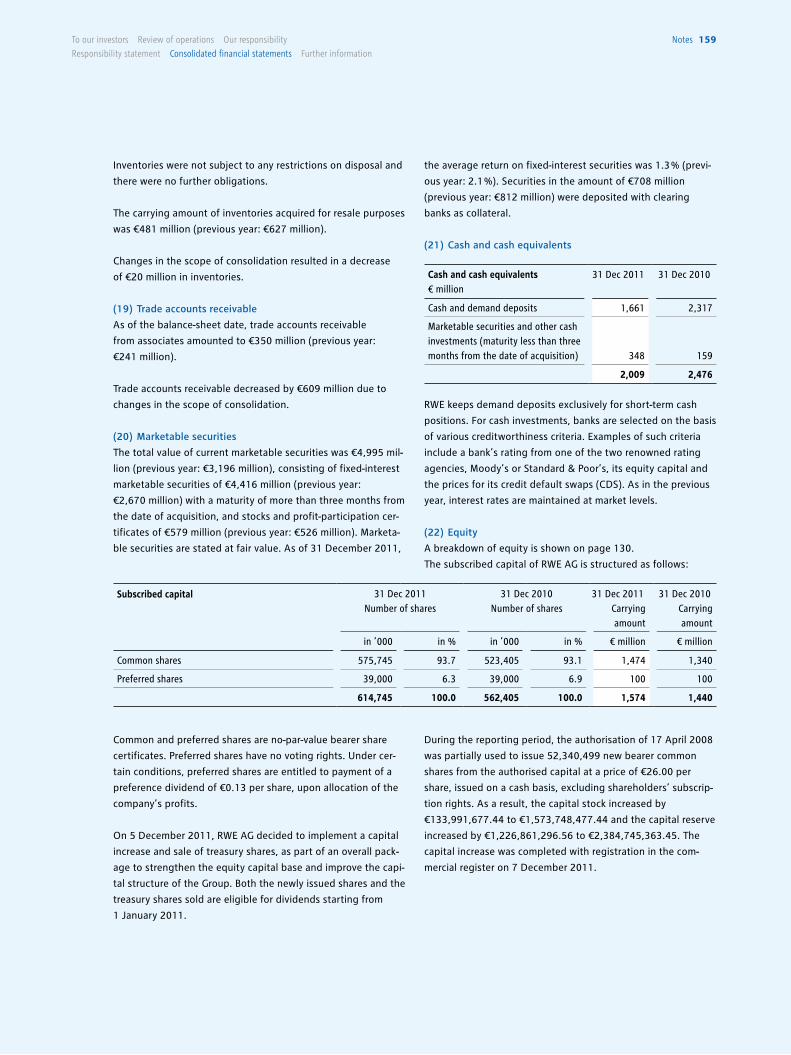
notes 159To our investors Review of operations our responsibility
Responsibility statement consolidated financial statements Further information
Inventories were not subject to any restrictions on disposal and
there were no further obligations.
The carrying amount of inventories acquired for resale purposes
was €481 million (previous year: €627 million).
Changes in the scope of consolidation resulted in a decrease
of €20 million in inventories.
(19) Trade accounts receivable
As of the balance-sheet date, trade accounts receivable
from associates amounted to €350 million (previous year:
€241 million).
Trade accounts receivable decreased by €609 million due to
changes in the scope of consolidation.
(20) Marketable securities
The total value of current marketable securities was €4,995 mil-
lion (previous year: €3,196 million), consisting of fixed-interest
marketable securities of €4,416 million (previous year:
€2,670 million) with a maturity of more than three months from
the date of acquisition, and stocks and profit-participation cer-
tificates of €579 million (previous year: €526 million). Marketa-
ble securities are stated at fair value. As of 31 December 2011,
the average return on fixed-interest securities was 1.3 % (previ-
ous year: 2.1 %). Securities in the amount of €708 million
(previous year: €812 million) were deposited with clearing
banks as collateral.
(21) Cash and cash equivalents
RWE keeps demand deposits exclusively for short-term cash
positions. For cash investments, banks are selected on the basis
of various creditworthiness criteria. Examples of such criteria
include a bank’s rating from one of the two renowned rating
agencies, Moody’s or Standard & Poor’s, its equity capital and
the prices for its credit default swaps (CDS). As in the previous
year, interest rates are maintained at market levels.
(22) Equity
A breakdown of equity is shown on page 130.
The subscribed capital of RWE AG is structured as follows:
Cash and cash equivalents€ million
31 Dec 2011 31 Dec 2010
Cash and demand deposits 1,661 2,317
Marketable securities and other cash investments (maturity less than three months from the date of acquisition) 348 159
2,009 2,476
Subscribed capital 31 Dec 2011Number of shares
31 Dec 2010Number of shares
31 Dec 2011Carrying amount
31 Dec 2010Carrying amount
in ’000 in % in ’000 in % € million € million
Common shares 575,745 93.7 523,405 93.1 1,474 1,340
Preferred shares 39,000 6.3 39,000 6.9 100 100
614,745 100.0 562,405 100.0 1,574 1,440
Common and preferred shares are no-par-value bearer share
certificates. Preferred shares have no voting rights. Under cer-
tain conditions, preferred shares are entitled to payment of a
preference dividend of €0.13 per share, upon allocation of the
company’s profits.
On 5 December 2011, RWE AG decided to implement a capital
increase and sale of treasury shares, as part of an overall pack-
age to strengthen the equity capital base and improve the capi-
tal structure of the Group. Both the newly issued shares and the
treasury shares sold are eligible for dividends starting from
1 January 2011.
During the reporting period, the authorisation of 17 April 2008
was partially used to issue 52,340,499 new bearer common
shares from the authorised capital at a price of €26.00 per
share, issued on a cash basis, excluding shareholders’ subscrip-
tion rights. As a result, the capital stock increased by
€133,991,677.44 to €1,573,748,477.44 and the capital reserve
increased by €1,226,861,296.56 to €2,384,745,363.45. The
capital increase was completed with registration in the com-
mercial register on 7 December 2011.
notes 159To our investors Review of operations our responsibility
Responsibility statement consolidated financial statements Further information
160 notes RWE Annual Report 2011
Above and beyond this, the company also sold 28,105,327 of
its treasury shares. This amounted to €71,949,637.12 of the
capital stock (4.57 % of subscribed capital, following the capital
increase). Proceeds from the capital increase amounted to
€730,738,502.00.
Within the framework of the staff programme, 442,692 treasury
shares were sold to employees of RWE AG and its subsidiaries
for capital formation; this is equivalent to €1,133,291.52 of the
capital stock (0.08 % of the subscribed capital). Proceeds
amounted to €16,396,747.18.
During the year under review, transaction costs of €16 million
(previous year: €12 million) were recorded as a deduction from
equity.
Pursuant to a resolution passed by the Annual General
Meeting on 17 April 2008, the Executive Board was authorised
to increase the company’s capital stock, subject to the Super-
visory Board’s approval, by up to €287,951,360.00 until
16 April 2013, through the issuance of new, bearer common
shares in return for contributions in cash or in kind (authorised
capital). In certain cases, the subscription rights of sharehold-
ers can be excluded, with the approval of the Supervisory
Board. During the reporting period, this authorisation was used
to the extent of the capital increase, leaving €153,959,682.56
in authorised capital.
Pursuant to a resolution passed by the Annual General
Meeting on 22 April 2009, the Executive Board was authorised
to issue option or convertible bonds until 21 April 2014. The
total nominal value of the bonds is limited to €6,000 million.
Shareholders’ subscription rights may be excluded under cer-
tain conditions. The Annual General Meeting decided to estab-
lish €143,975,680 in conditional capital divided into
56,240,500 bearer common shares, in order to redeem the
bonds. Shares from the authorised capital are to be deducted
from the shares from the conditional capital, insofar as they are
both issued with an exclusion of shareholders’ subscription
rights.
Pursuant to a resolution passed by the Annual General Meeting
on 20 April 2011, the company was authorised until 19 Octo-
ber 2012 to buy back any kind of the company’s shares total-
ling up to 10 % of the capital stock as of the date upon which
the resolution was passed by the Annual General Meeting ,
or – if such amount is lower – of the capital stock on the date of
exercising such authorisation; share buy-backs may also be car-
ried out using put or call options. Based on the authorisation,
the Executive Board is also entitled to cancel the treasury
shares without a further resolution by the Annual General Meet-
ing. Moreover, the Executive Board is also authorised to transfer
or sell such shares to third parties, under certain conditions and
excluding shareholders’ subscription rights. The Executive
Board was furthermore authorised to use the treasury shares to
discharge obligations from future employee share schemes; in
this regard, shareholders’ subscription rights shall be excluded.
As of 31 December 2011, RWE AG held 298,454 no-par-value
common shares in RWE AG (31 December 2010: 28,846,473),
equivalent to €764,042.24 of the share capital (0.05 % of sub-
scribed capital) . The acquisition costs of treasury shares
amounting to €24 million (31 December 2010: €2,272 million)
were deducted from the carrying amount of equity. The compa-
ny’s shares were acquired during the period from 21 February
to 16 May 2008, on the basis of the resolutions of the Annual
General Meeting of 18 April 2007 and 17 April 2008. These
shares can be used for all purposes of treasury shares deter-
mined by the Annual General Meeting.
In September 2010, RWE AG issued a hybrid bond with a nomi-
nal volume of €1.75 billion. The bond, which is subordinated to
all other creditor securities, is a perpetual and may be called
only by RWE AG on specific, contractually agreed call dates or
occasions. It bears an interest rate of 4.625 % p.a. until the first
call date, which is in 2015. If the bond is not called as of this
date, its interest rate until the next call date, which is in 2020,
will be the sum of the then applicable five-year interbank rate
and a credit spread of 265 basis points. If it is not called as of
that date, either, it will be converted into a variable-interest
bond with an annual call right and an interest rate equalling
the 12-month EURIBOR plus 365 basis points. Interest pay-
ments may be deferred under certain conditions, especially if
the Executive and Supervisory Boards propose to the Annual
General Meeting that a dividend not be paid. Deferred interest
payments must be made up for when payment of a dividend is
proposed again. After ten years, the hybrid bond may only be
redeemed by issuing equity or equity-like financial instruments,
for example new hybrid bonds. At the first call date, which is
after five years, the hybrid bond may be redeemed without
restrictions with respect to the follow-up financing.
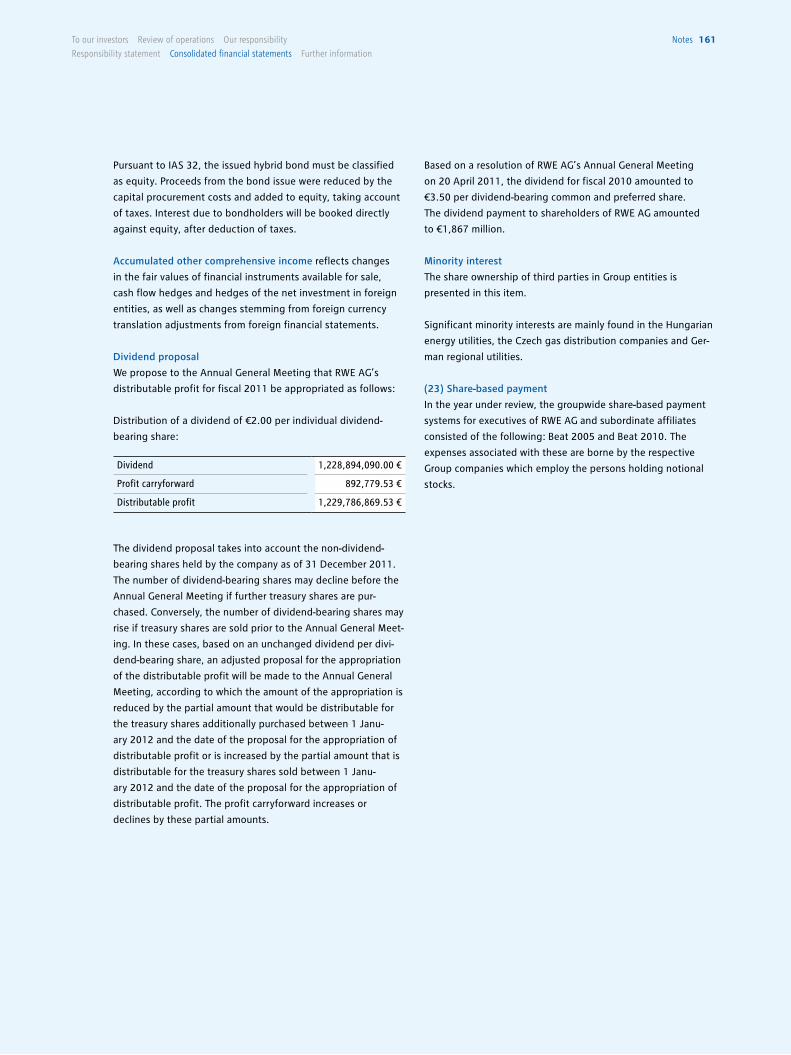
notes 161To our investors Review of operations our responsibility
Responsibility statement consolidated financial statements Further information
Pursuant to IAS 32, the issued hybrid bond must be classified
as equity. Proceeds from the bond issue were reduced by the
capital procurement costs and added to equity, taking account
of taxes. Interest due to bondholders will be booked directly
against equity, after deduction of taxes.
Accumulated other comprehensive income reflects changes
in the fair values of financial instruments available for sale,
cash flow hedges and hedges of the net investment in foreign
entities, as well as changes stemming from foreign currency
translation adjustments from foreign financial statements.
Dividend proposal
We propose to the Annual General Meeting that RWE AG’s
distributable profit for fiscal 2011 be appropriated as follows:
Distribution of a dividend of €2.00 per individual dividend-
bearing share:
The dividend proposal takes into account the non-dividend-
bearing shares held by the company as of 31 December 2011.
The number of dividend-bearing shares may decline before the
Annual General Meeting if further treasury shares are pur-
chased. Conversely, the number of dividend-bearing shares may
rise if treasury shares are sold prior to the Annual General Meet-
ing. In these cases, based on an unchanged dividend per divi-
dend-bearing share, an adjusted proposal for the appropriation
of the distributable profit will be made to the Annual General
Meeting, according to which the amount of the appropriation is
reduced by the partial amount that would be distributable for
the treasury shares additionally purchased between 1 Janu-
ary 2012 and the date of the proposal for the appropriation of
distributable profit or is increased by the partial amount that is
distributable for the treasury shares sold between 1 Janu-
ary 2012 and the date of the proposal for the appropriation of
distributable profit. The profit carryforward increases or
declines by these partial amounts.
Based on a resolution of RWE AG’s Annual General Meeting
on 20 April 2011, the dividend for fiscal 2010 amounted to
€3.50 per dividend-bearing common and preferred share.
The dividend payment to shareholders of RWE AG amounted
to €1,867 million.
Minority interest
The share ownership of third parties in Group entities is
presented in this item.
Significant minority interests are mainly found in the Hungarian
energy utilities, the Czech gas distribution companies and Ger-
man regional utilities.
(23) Share-based payment
In the year under review, the groupwide share-based payment
systems for executives of RWE AG and subordinate affiliates
consisted of the following: Beat 2005 and Beat 2010. The
expenses associated with these are borne by the respective
Group companies which employ the persons holding notional
stocks.
Dividend 1,228,894,090.00 €
Profit carryforward 892,779.53 €
Distributable profit 1,229,786,869.53 €
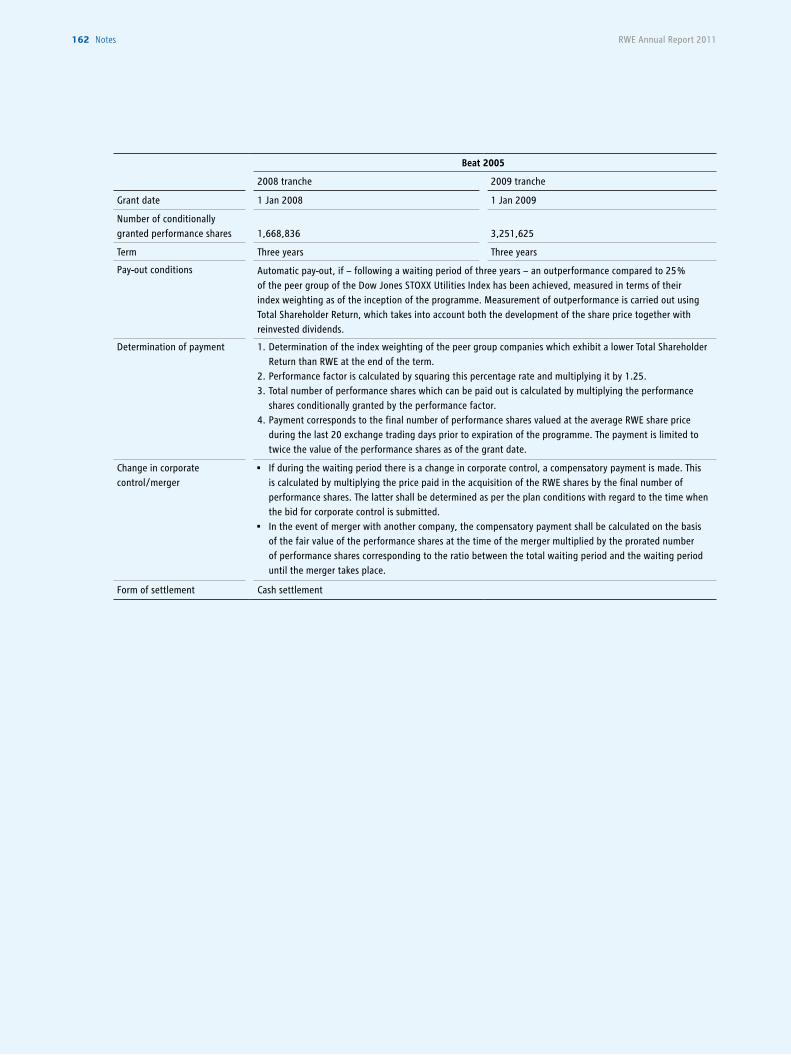
RWE Annual Report 2011162 notes
Beat 2005
2008 tranche 2009 tranche
Grant date 1 Jan 2008 1 Jan 2009
Number of conditionally granted performance shares
1,668,836 3,251,625
Term Three years Three years
Pay-out conditions Automatic pay-out, if − following a waiting period of three years − an outperformance compared to 25 % of the peer group of the Dow Jones STOXX Utilities Index has been achieved, measured in terms of their index weighting as of the inception of the programme. Measurement of outperformance is carried out using Total Shareholder Return, which takes into account both the development of the share price together with reinvested dividends.
Determination of payment 1. Determination of the index weighting of the peer group companies which exhibit a lower Total Shareholder Return than RWE at the end of the term.
2. Performance factor is calculated by squaring this percentage rate and multiplying it by 1.25.3. Total number of performance shares which can be paid out is calculated by multiplying the performance
shares conditionally granted by the performance factor.4. Payment corresponds to the final number of performance shares valued at the average RWE share price
during the last 20 exchange trading days prior to expiration of the programme. The payment is limited to twice the value of the performance shares as of the grant date.
Change in corporatecontrol/merger
• If during the waiting period there is a change in corporate control, a compensatory payment is made. This is calculated by multiplying the price paid in the acquisition of the RWE shares by the final number of performance shares. The latter shall be determined as per the plan conditions with regard to the time when the bid for corporate control is submitted.
• In the event of merger with another company, the compensatory payment shall be calculated on the basis of the fair value of the performance shares at the time of the merger multiplied by the prorated number of performance shares corresponding to the ratio between the total waiting period and the waiting period until the merger takes place.
Form of settlement Cash settlement
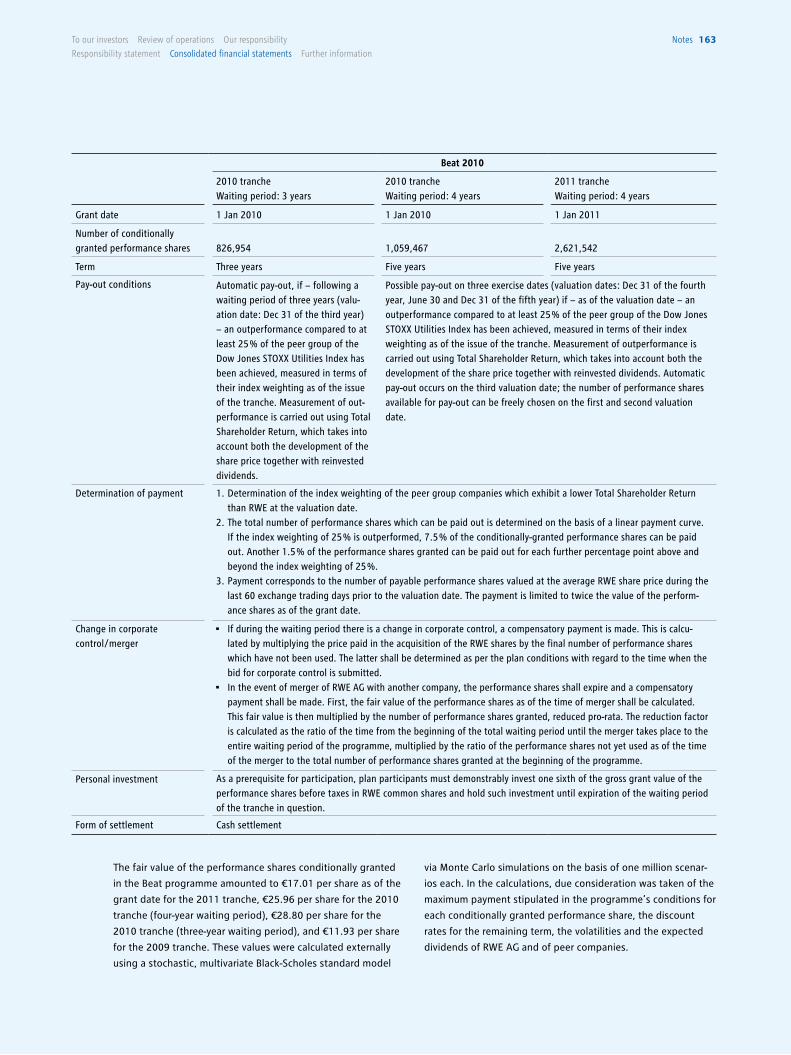
notes 163To our investors Review of operations our responsibility
Responsibility statement consolidated financial statements Further information
Beat 2010
2010 tranche Waiting period: 3 years
2010 tranche Waiting period: 4 years
2011 tranche Waiting period: 4 years
Grant date 1 Jan 2010 1 Jan 2010 1 Jan 2011
Number of conditionally granted performance shares
826,954 1,059,467 2,621,542
Term Three years Five years Five years
Pay-out conditions Automatic pay-out, if − following a waiting period of three years (valu-ation date: Dec 31 of the third year) − an outperformance compared to at least 25 % of the peer group of the Dow Jones STOXX Utilities Index has been achieved, measured in terms of their index weighting as of the issue of the tranche. Measurement of out-performance is carried out using Total Shareholder Return, which takes into account both the development of the share price together with reinvested dividends.
Possible pay-out on three exercise dates (valuation dates: Dec 31 of the fourth year, June 30 and Dec 31 of the fifth year) if − as of the valuation date − an outperformance compared to at least 25 % of the peer group of the Dow Jones STOXX Utilities Index has been achieved, measured in terms of their index weighting as of the issue of the tranche. Measurement of outperformance is carried out using Total Shareholder Return, which takes into account both the development of the share price together with reinvested dividends. Automatic pay-out occurs on the third valuation date; the number of performance shares available for pay-out can be freely chosen on the first and second valuation date.
Determination of payment 1. Determination of the index weighting of the peer group companies which exhibit a lower Total Shareholder Return than RWE at the valuation date.
2. The total number of performance shares which can be paid out is determined on the basis of a linear payment curve. If the index weighting of 25 % is outperformed, 7.5 % of the conditionally-granted performance shares can be paid out. Another 1.5 % of the performance shares granted can be paid out for each further percentage point above and beyond the index weighting of 25 %.
3. Payment corresponds to the number of payable performance shares valued at the average RWE share price during the last 60 exchange trading days prior to the valuation date. The payment is limited to twice the value of the perform-ance shares as of the grant date.
Change in corporatecontrol/merger
• If during the waiting period there is a change in corporate control, a compensatory payment is made. This is calcu-lated by multiplying the price paid in the acquisition of the RWE shares by the final number of performance shares which have not been used. The latter shall be determined as per the plan conditions with regard to the time when the bid for corporate control is submitted.
• In the event of merger of RWE AG with another company, the performance shares shall expire and a compensatory payment shall be made. First, the fair value of the performance shares as of the time of merger shall be calculated. This fair value is then multiplied by the number of performance shares granted, reduced pro-rata. The reduction factor is calculated as the ratio of the time from the beginning of the total waiting period until the merger takes place to the entire waiting period of the programme, multiplied by the ratio of the performance shares not yet used as of the time of the merger to the total number of performance shares granted at the beginning of the programme.
Personal investment As a prerequisite for participation, plan participants must demonstrably invest one sixth of the gross grant value of the performance shares before taxes in RWE common shares and hold such investment until expiration of the waiting period of the tranche in question.
Form of settlement Cash settlement
The fair value of the performance shares conditionally granted
in the Beat programme amounted to €17.01 per share as of the
grant date for the 2011 tranche, €25.96 per share for the 2010
tranche (four-year waiting period), €28.80 per share for the
2010 tranche (three-year waiting period), and €11.93 per share
for the 2009 tranche. These values were calculated externally
using a stochastic, multivariate Black-Scholes standard model
via Monte Carlo simulations on the basis of one million scenar-
ios each. In the calculations, due consideration was taken of the
maximum payment stipulated in the programme’s conditions for
each conditionally granted performance share, the discount
rates for the remaining term, the volatilities and the expected
dividends of RWE AG and of peer companies.
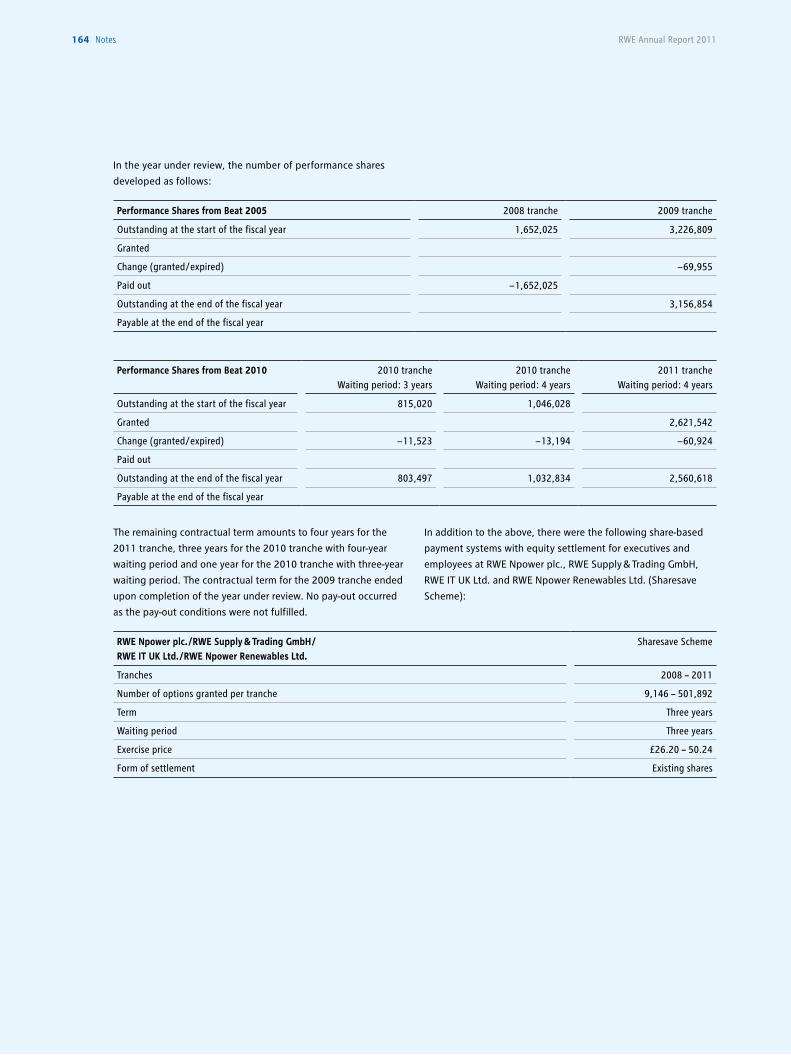
164 notes RWE Annual Report 2011
Performance Shares from Beat 2005 2008 tranche 2009 tranche
Outstanding at the start of the fiscal year 1,652,025 3,226,809
Granted
Change (granted/expired) − 69,955
Paid out − 1,652,025
Outstanding at the end of the fiscal year 3,156,854
Payable at the end of the fiscal year
Performance Shares from Beat 2010 2010 tranche Waiting period: 3 years
2010 tranche Waiting period: 4 years
2011 tranche Waiting period: 4 years
Outstanding at the start of the fiscal year 815,020 1,046,028
Granted 2,621,542
Change (granted/expired) − 11,523 − 13,194 − 60,924
Paid out
Outstanding at the end of the fiscal year 803,497 1,032,834 2,560,618
Payable at the end of the fiscal year
In the year under review, the number of performance shares
developed as follows:
The remaining contractual term amounts to four years for the
2011 tranche, three years for the 2010 tranche with four-year
waiting period and one year for the 2010 tranche with three-year
waiting period. The contractual term for the 2009 tranche ended
upon completion of the year under review. No pay-out occurred
as the pay-out conditions were not fulfilled.
In addition to the above, there were the following share-based
payment systems with equity settlement for executives and
employees at RWE Npower plc., RWE Supply & Trading GmbH,
RWE IT UK Ltd. and RWE Npower Renewables Ltd. (Sharesave
Scheme):
RWE Npower plc. /RWE Supply & Trading GmbH / RWE IT UK Ltd. /RWE Npower Renewables Ltd.
Sharesave Scheme
Tranches 2008 – 2011
Number of options granted per tranche 9,146 – 501,892
Term Three years
Waiting period Three years
Exercise price £26.20 – 50.24
Form of settlement Existing shares
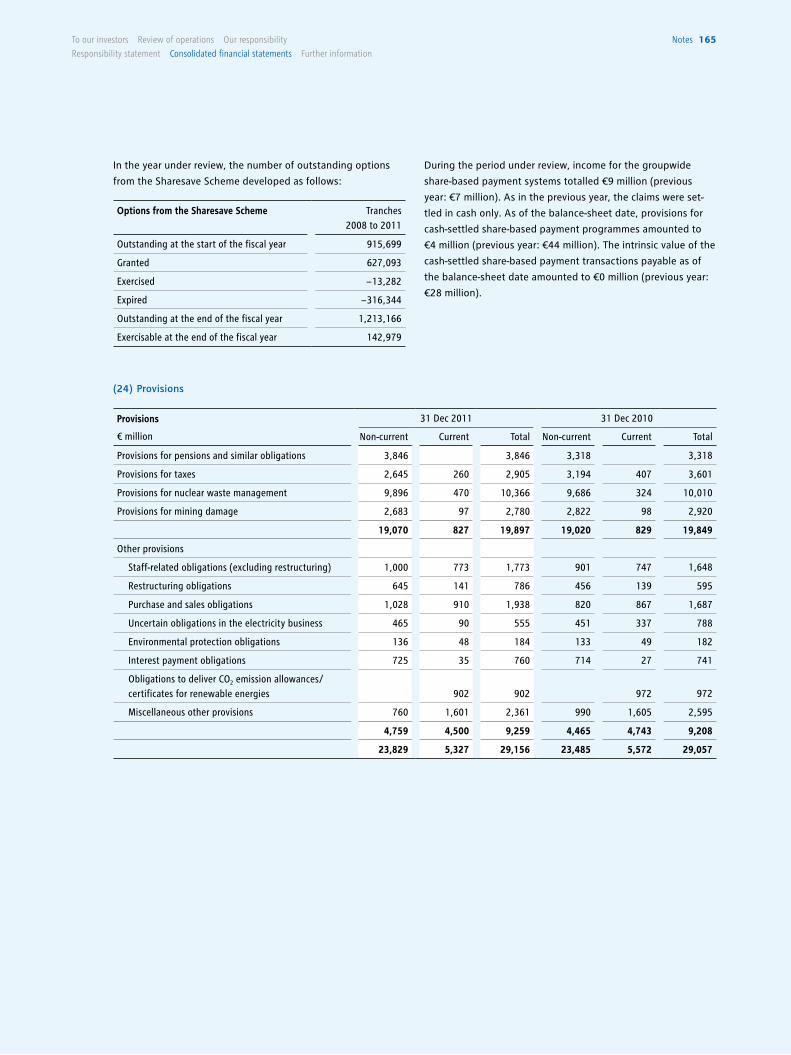
notes 165To our investors Review of operations our responsibility
Responsibility statement consolidated financial statements Further information
In the year under review, the number of outstanding options
from the Sharesave Scheme developed as follows:
Options from the Sharesave Scheme Tranches 2008 to 2011
Outstanding at the start of the fiscal year 915,699
Granted 627,093
Exercised − 13,282
Expired − 316,344
Outstanding at the end of the fiscal year 1,213,166
Exercisable at the end of the fiscal year 142,979
During the period under review, income for the groupwide
share-based payment systems totalled €9 million (previous
year: €7 million). As in the previous year, the claims were set-
tled in cash only. As of the balance-sheet date, provisions for
cash-settled share-based payment programmes amounted to
€4 million (previous year: €44 million). The intrinsic value of the
cash-settled share-based payment transactions payable as of
the balance-sheet date amounted to €0 million (previous year:
€28 million).
(24) Provisions
Provisions
€ million
31 Dec 2011 31 Dec 2010
Non-current Current Total Non-current Current Total
Provisions for pensions and similar obligations 3,846 3,846 3,318 3,318
Provisions for taxes 2,645 260 2,905 3,194 407 3,601
Provisions for nuclear waste management 9,896 470 10,366 9,686 324 10,010
Provisions for mining damage 2,683 97 2,780 2,822 98 2,920
19,070 827 19,897 19,020 829 19,849
Other provisions
Staff-related obligations (excluding restructuring) 1,000 773 1,773 901 747 1,648
Restructuring obligations 645 141 786 456 139 595
Purchase and sales obligations 1,028 910 1,938 820 867 1,687
Uncertain obligations in the electricity business 465 90 555 451 337 788
Environmental protection obligations 136 48 184 133 49 182
Interest payment obligations 725 35 760 714 27 741
Obligations to deliver CO2 emission allowances/ certificates for renewable energies 902 902 972 972
Miscellaneous other provisions 760 1,601 2,361 990 1,605 2,595
4,759 4,500 9,259 4,465 4,743 9,208
23,829 5,327 29,156 23,485 5,572 29,057
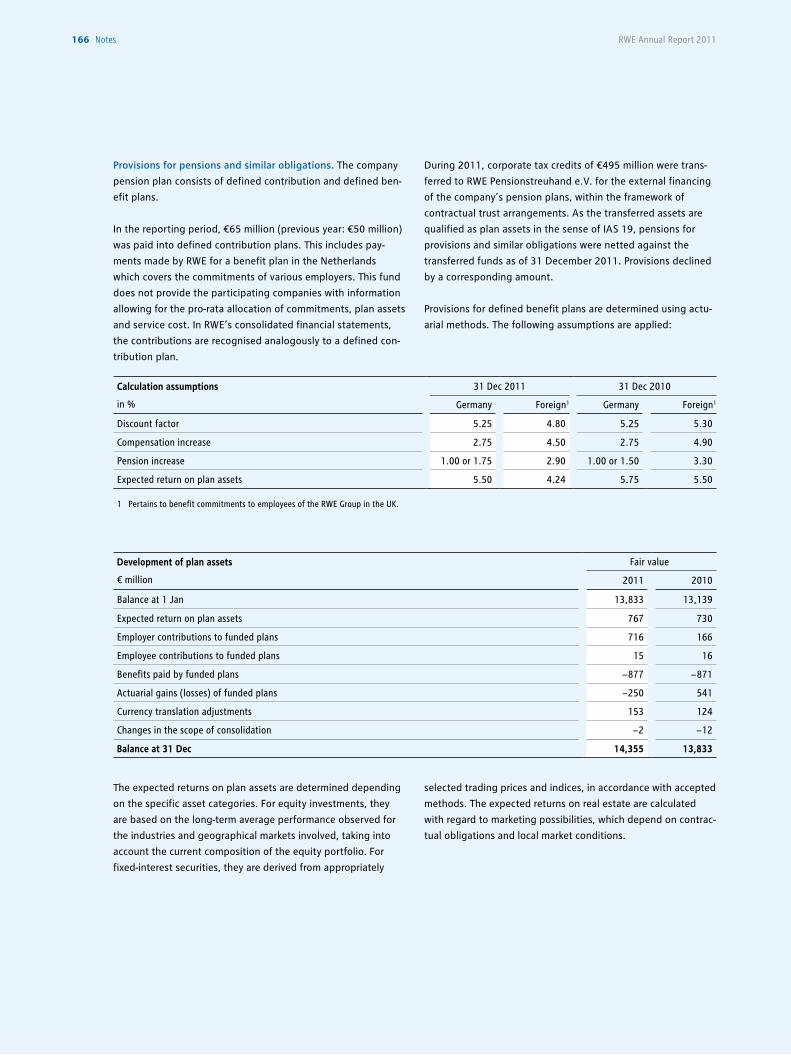
166 notes RWE Annual Report 2011
The expected returns on plan assets are determined depending
on the specific asset categories. For equity investments, they
are based on the long-term average performance observed for
the industries and geographical markets involved, taking into
account the current composition of the equity portfolio. For
fixed-interest securities, they are derived from appropriately
selected trading prices and indices, in accordance with accepted
methods. The expected returns on real estate are calculated
with regard to marketing possibilities, which depend on contrac-
tual obligations and local market conditions.
Calculation assumptions
in %
31 Dec 2011 31 Dec 2010
Germany Foreign1 Germany Foreign1
Discount factor 5.25 4.80 5.25 5.30
Compensation increase 2.75 4.50 2.75 4.90
Pension increase 1.00 or 1.75 2.90 1.00 or 1.50 3.30
Expected return on plan assets 5.50 4.24 5.75 5.50
1 Pertains to benefit commitments to employees of the RWE Group in the UK.
Development of plan assets
€ million
Fair value
2011 2010
Balance at 1 Jan 13,833 13,139
Expected return on plan assets 767 730
Employer contributions to funded plans 716 166
Employee contributions to funded plans 15 16
Benefits paid by funded plans − 877 − 871
Actuarial gains (losses) of funded plans − 250 541
Currency translation adjustments 153 124
Changes in the scope of consolidation − 2 − 12
Balance at 31 Dec 14,355 13,833
Provisions for pensions and similar obligations. The company
pension plan consists of defined contribution and defined ben-
efit plans.
In the reporting period, €65 million (previous year: €50 million)
was paid into defined contribution plans. This includes pay-
ments made by RWE for a benefit plan in the Netherlands
which covers the commitments of various employers. This fund
does not provide the participating companies with information
allowing for the pro-rata allocation of commitments, plan assets
and service cost. In RWE’s consolidated financial statements,
the contributions are recognised analogously to a defined con-
tribution plan.
During 2011, corporate tax credits of €495 million were trans-
ferred to RWE Pensionstreuhand e.V. for the external financing
of the company’s pension plans, within the framework of
contractual trust arrangements. As the transferred assets are
qualified as plan assets in the sense of IAS 19, pensions for
provisions and similar obligations were netted against the
transferred funds as of 31 December 2011. Provisions declined
by a corresponding amount.
Provisions for defined benefit plans are determined using actu-
arial methods. The following assumptions are applied:
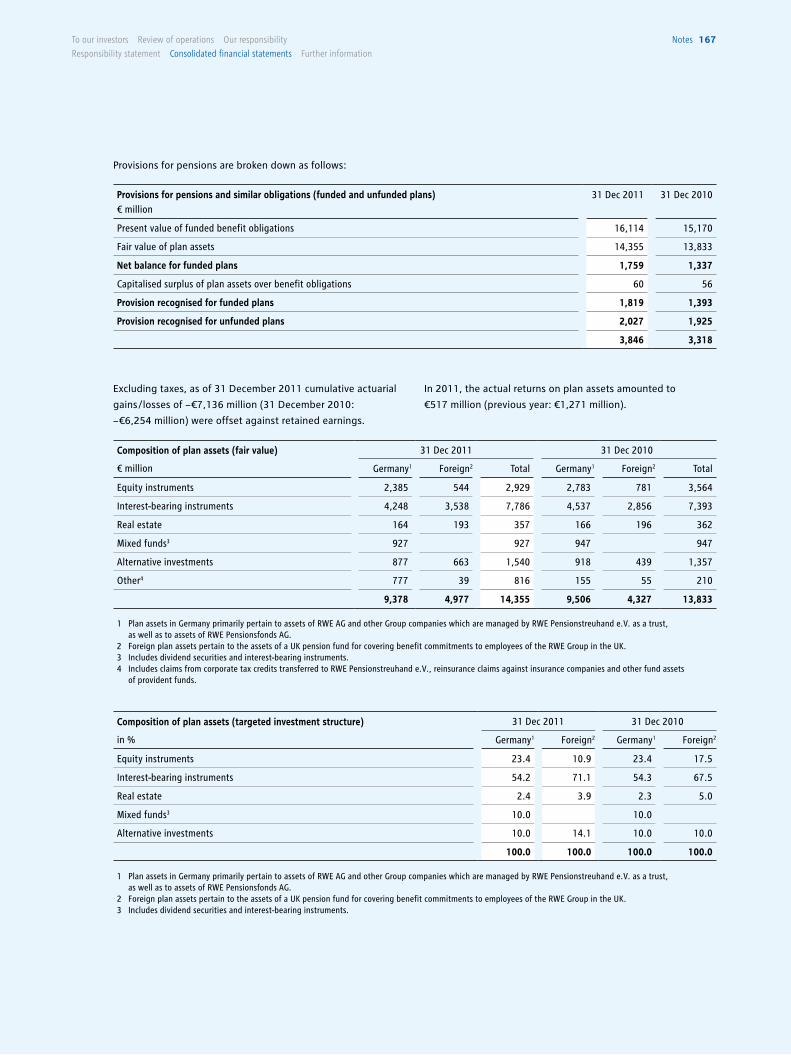
notes 167To our investors Review of operations our responsibility
Responsibility statement consolidated financial statements Further information
Excluding taxes, as of 31 December 2011 cumulative actuarial
gains /losses of − €7,136 million (31 December 2010:
− €6,254 million) were offset against retained earnings.
In 2011, the actual returns on plan assets amounted to
€517 million (previous year: €1,271 million).
Provisions for pensions and similar obligations (funded and unfunded plans)€ million
31 Dec 2011 31 Dec 2010
Present value of funded benefit obligations 16,114 15,170
Fair value of plan assets 14,355 13,833
Net balance for funded plans 1,759 1,337
Capitalised surplus of plan assets over benefit obligations 60 56
Provision recognised for funded plans 1,819 1,393
Provision recognised for unfunded plans 2,027 1,925
3,846 3,318
Composition of plan assets (fair value)
€ million
31 Dec 2011 31 Dec 2010
Germany1 Foreign2 Total Germany1 Foreign2 Total
Equity instruments 2,385 544 2,929 2,783 781 3,564
Interest-bearing instruments 4,248 3,538 7,786 4,537 2,856 7,393
Real estate 164 193 357 166 196 362
Mixed funds3 927 927 947 947
Alternative investments 877 663 1,540 918 439 1,357
Other4 777 39 816 155 55 210
9,378 4,977 14,355 9,506 4,327 13,833
1 Plan assets in Germany primarily pertain to assets of RWE AG and other Group companies which are managed by RWE Pensionstreuhand e.V. as a trust, as well as to assets of RWE Pensionsfonds AG.
2 Foreign plan assets pertain to the assets of a UK pension fund for covering benefit commitments to employees of the RWE Group in the UK.3 Includes dividend securities and interest-bearing instruments.4 Includes claims from corporate tax credits transferred to RWE Pensionstreuhand e.V., reinsurance claims against insurance companies and other fund assets
of provident funds.
Composition of plan assets (targeted investment structure)
in %
31 Dec 2011 31 Dec 2010
Germany1 Foreign2 Germany1 Foreign2
Equity instruments 23.4 10.9 23.4 17.5
Interest-bearing instruments 54.2 71.1 54.3 67.5
Real estate 2.4 3.9 2.3 5.0
Mixed funds3 10.0 10.0
Alternative investments 10.0 14.1 10.0 10.0
100.0 100.0 100.0 100.0
1 Plan assets in Germany primarily pertain to assets of RWE AG and other Group companies which are managed by RWE Pensionstreuhand e.V. as a trust, as well as to assets of RWE Pensionsfonds AG.
2 Foreign plan assets pertain to the assets of a UK pension fund for covering benefit commitments to employees of the RWE Group in the UK.3 Includes dividend securities and interest-bearing instruments.
Provisions for pensions are broken down as follows:
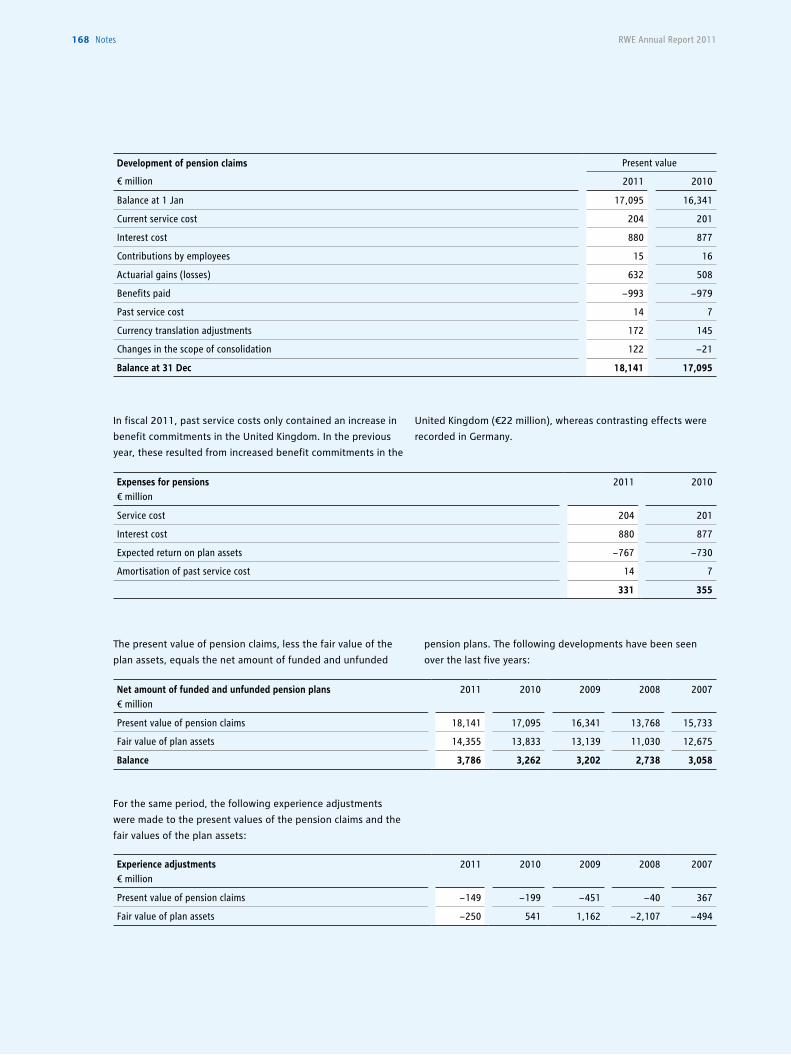
RWE Annual Report 2011168 notes
In fiscal 2011, past service costs only contained an increase in
benefit commitments in the United Kingdom. In the previous
year, these resulted from increased benefit commitments in the
United Kingdom (€22 million), whereas contrasting effects were
recorded in Germany.
The present value of pension claims, less the fair value of the
plan assets, equals the net amount of funded and unfunded
pension plans. The following developments have been seen
over the last five years:
For the same period, the following experience adjustments
were made to the present values of the pension claims and the
fair values of the plan assets:
Expenses for pensions€ million
2011 2010
Service cost 204 201
Interest cost 880 877
Expected return on plan assets − 767 − 730
Amortisation of past service cost 14 7
331 355
Experience adjustments€ million
2011 2010 2009 2008 2007
Present value of pension claims − 149 − 199 − 451 − 40 367
Fair value of plan assets − 250 541 1,162 − 2,107 − 494
Net amount of funded and unfunded pension plans € million
2011 2010 2009 2008 2007
Present value of pension claims 18,141 17,095 16,341 13,768 15,733
Fair value of plan assets 14,355 13,833 13,139 11,030 12,675
Balance 3,786 3,262 3,202 2,738 3,058
Development of pension claims
€ million
Present value
2011 2010
Balance at 1 Jan 17,095 16,341
Current service cost 204 201
Interest cost 880 877
Contributions by employees 15 16
Actuarial gains (losses) 632 508
Benefits paid − 993 − 979
Past service cost 14 7
Currency translation adjustments 172 145
Changes in the scope of consolidation 122 − 21
Balance at 31 Dec 18,141 17,095
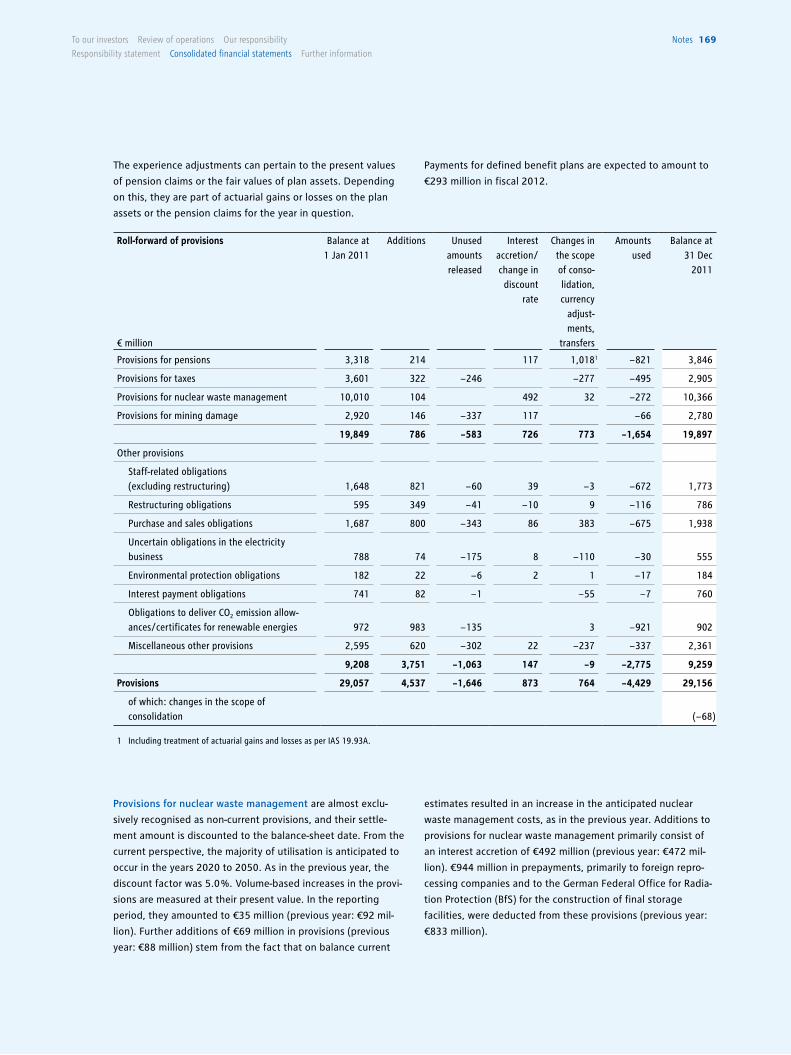
notes 169To our investors Review of operations our responsibility
Responsibility statement consolidated financial statements Further information
The experience adjustments can pertain to the present values
of pension claims or the fair values of plan assets. Depending
on this, they are part of actuarial gains or losses on the plan
assets or the pension claims for the year in question.
Payments for defined benefit plans are expected to amount to
€293 million in fiscal 2012.
Roll-forward of provisions
€ million
Balance at 1 Jan 2011
Additions Unusedamountsreleased
Interestaccretion/change in
discountrate
Changes inthe scopeof conso- lidation,currency
adjust-ments,
transfers
Amountsused
Balance at 31 Dec
2011
Provisions for pensions 3,318 214 117 1,0181 − 821 3,846
Provisions for taxes 3,601 322 − 246 − 277 − 495 2,905
Provisions for nuclear waste management 10,010 104 492 32 − 272 10,366
Provisions for mining damage 2,920 146 − 337 117 − 66 2,780
19,849 786 − 583 726 773 − 1,654 19,897
Other provisions
Staff-related obligations (excluding restructuring) 1,648 821 − 60 39 − 3 − 672 1,773
Restructuring obligations 595 349 − 41 − 10 9 − 116 786
Purchase and sales obligations 1,687 800 − 343 86 383 − 675 1,938
Uncertain obligations in the electricity business 788 74 − 175 8 − 110 − 30 555
Environmental protection obligations 182 22 − 6 2 1 − 17 184
Interest payment obligations 741 82 − 1 − 55 − 7 760
Obligations to deliver CO2 emission allow-ances/certificates for renewable energies 972 983 − 135 3 − 921 902
Miscellaneous other provisions 2,595 620 − 302 22 − 237 − 337 2,361
9,208 3,751 − 1,063 147 − 9 − 2,775 9,259
Provisions 29,057 4,537 − 1,646 873 764 − 4,429 29,156
of which: changes in the scope of c onsolidation (− 68)
1 Including treatment of actuarial gains and losses as per IAS 19.93A.
Provisions for nuclear waste management are almost exclu-
sively recognised as non-current provisions, and their settle-
ment amount is discounted to the balance-sheet date. From the
current perspective, the majority of utilisation is anticipated to
occur in the years 2020 to 2050. As in the previous year, the
discount factor was 5.0 %. Volume-based increases in the provi-
sions are measured at their present value. In the reporting
period, they amounted to €35 million (previous year: €92 mil-
lion). Further additions of €69 million in provisions (previous
year: €88 million) stem from the fact that on balance current
estimates resulted in an increase in the anticipated nuclear
waste management costs, as in the previous year. Additions to
provisions for nuclear waste management primarily consist of
an interest accretion of €492 million (previous year: €472 mil-
lion). €944 million in prepayments, primarily to foreign repro-
cessing companies and to the German Federal Office for Radia-
tion Protection (BfS) for the construction of final storage
facilities, were deducted from these provisions (previous year:
€833 million).
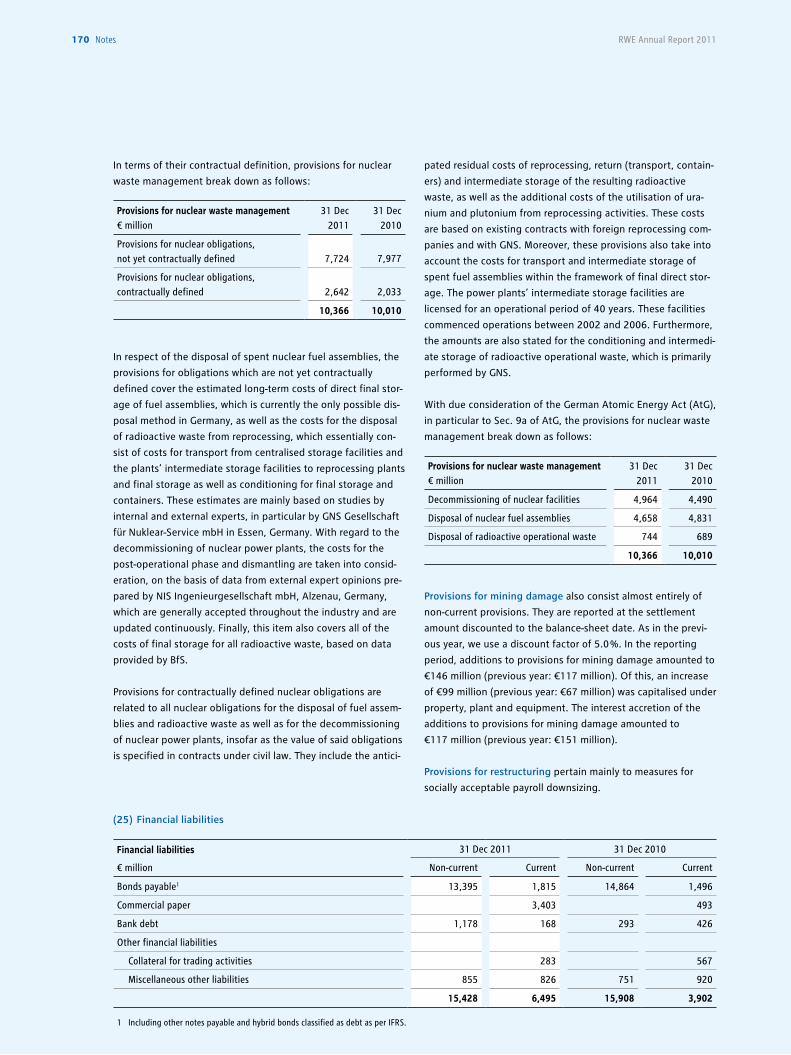
170 notes RWE Annual Report 2011
In respect of the disposal of spent nuclear fuel assemblies, the
provisions for obligations which are not yet contractually
defined cover the estimated long-term costs of direct final stor-
age of fuel assemblies, which is currently the only possible dis-
posal method in Germany, as well as the costs for the disposal
of radioactive waste from reprocessing, which essentially con-
sist of costs for transport from centralised storage facilities and
the plants’ intermediate storage facilities to reprocessing plants
and final storage as well as conditioning for final storage and
containers. These estimates are mainly based on studies by
internal and external experts, in particular by GNS Gesellschaft
für Nuklear-Service mbH in Essen, Germany. With regard to the
decommissioning of nuclear power plants, the costs for the
post-operational phase and dismantling are taken into consid-
eration, on the basis of data from external expert opinions pre-
pared by NIS Ingenieurgesellschaft mbH, Alzenau, Germany,
which are generally accepted throughout the industry and are
updated continuously. Finally, this item also covers all of the
costs of final storage for all radioactive waste, based on data
provided by BfS.
Provisions for contractually defined nuclear obligations are
related to all nuclear obligations for the disposal of fuel assem-
blies and radioactive waste as well as for the decommissioning
of nuclear power plants, insofar as the value of said obligations
is specified in contracts under civil law. They include the antici-
pated residual costs of reprocessing, return (transport, contain-
ers) and intermediate storage of the resulting radioactive
waste, as well as the additional costs of the utilisation of ura-
nium and plutonium from reprocessing activities. These costs
are based on existing contracts with foreign reprocessing com-
panies and with GNS. Moreover, these provisions also take into
account the costs for transport and intermediate storage of
spent fuel assemblies within the framework of final direct stor-
age. The power plants’ intermediate storage facilities are
licensed for an operational period of 40 years. These facilities
commenced operations between 2002 and 2006. Furthermore,
the amounts are also stated for the conditioning and intermedi-
ate storage of radioactive operational waste, which is primarily
performed by GNS.
With due consideration of the German Atomic Energy Act (AtG),
in particular to Sec. 9a of AtG, the provisions for nuclear waste
management break down as follows:
Provisions for mining damage also consist almost entirely of
non-current provisions. They are reported at the settlement
amount discounted to the balance-sheet date. As in the previ-
ous year, we use a discount factor of 5.0 %. In the reporting
period, additions to provisions for mining damage amounted to
€146 million (previous year: €117 million). Of this, an increase
of €99 million (previous year: €67 million) was capitalised under
property, plant and equipment. The interest accretion of the
additions to provisions for mining damage amounted to
€117 million (previous year: €151 million).
Provisions for restructuring pertain mainly to measures for
socially acceptable payroll downsizing.
Provisions for nuclear waste management€ million
31 Dec 2011
31 Dec 2010
Decommissioning of nuclear facilities 4,964 4,490
Disposal of nuclear fuel assemblies 4,658 4,831
Disposal of radioactive operational waste 744 689
10,366 10,010
(25) Financial liabilities
Financial liabilities
€ million
31 Dec 2011 31 Dec 2010
Non-current Current Non-current Current
Bonds payable1 13,395 1,815 14,864 1,496
Commercial paper 3,403 493
Bank debt 1,178 168 293 426
Other financial liabilities
Collateral for trading activities 283 567
Miscellaneous other liabilities 855 826 751 920
15,428 6,495 15,908 3,902
1 Including other notes payable and hybrid bonds classified as debt as per IFRS.
In terms of their contractual definition, provisions for nuclear
waste management break down as follows:
Provisions for nuclear waste management€ million
31 Dec 2011
31 Dec 2010
Provisions for nuclear obligations, not yet contractually defined 7,724 7,977
Provisions for nuclear obligations, contractually defined 2,642 2,033
10,366 10,010
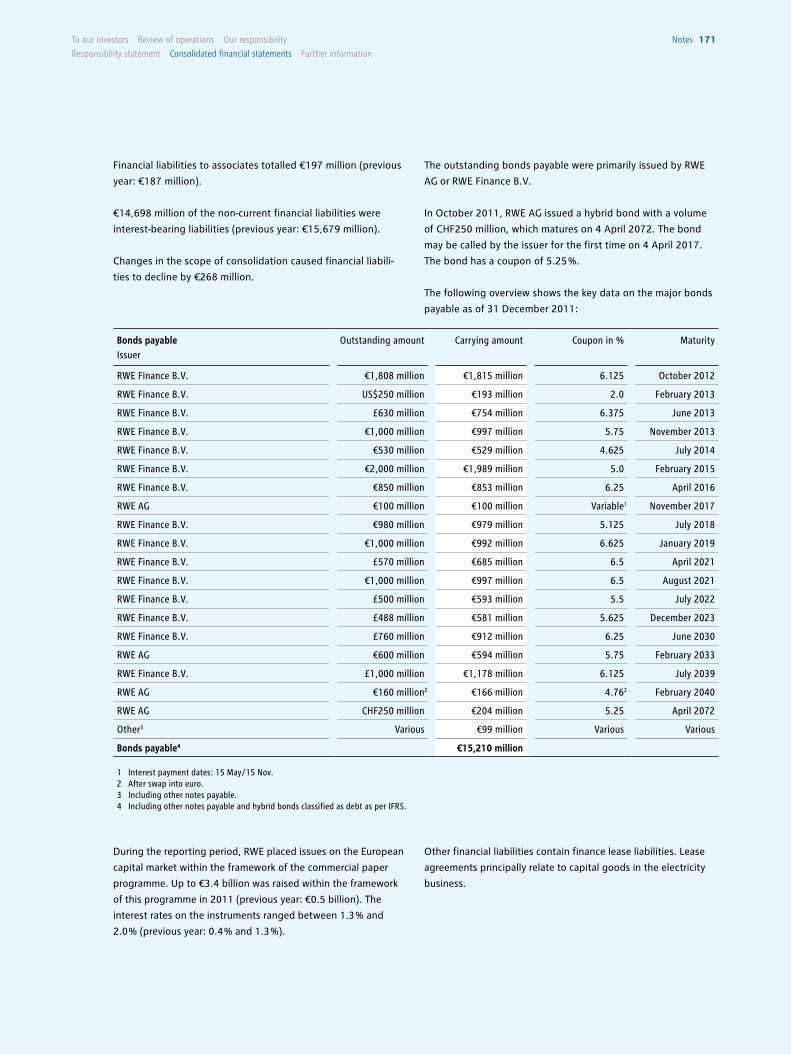
notes 171To our investors Review of operations our responsibility
Responsibility statement consolidated financial statements Further information
Financial liabilities to associates totalled €197 million (previous
year: €187 million).
€14,698 million of the non-current financial liabilities were
interest-bearing liabilities (previous year: €15,679 million).
Changes in the scope of consolidation caused financial liabili-
ties to decline by €268 million.
The outstanding bonds payable were primarily issued by RWE
AG or RWE Finance B.V.
In October 2011, RWE AG issued a hybrid bond with a volume
of CHF250 million, which matures on 4 April 2072. The bond
may be called by the issuer for the first time on 4 April 2017.
The bond has a coupon of 5.25 %.
The following overview shows the key data on the major bonds
payable as of 31 December 2011:
Bonds payableIssuer
Outstanding amount Carrying amount Coupon in % Maturity
RWE Finance B.V. €1,808 million €1,815 million 6.125 October 2012
RWE Finance B.V. US$250 million €193 million 2.0 February 2013
RWE Finance B.V. £630 million €754 million 6.375 June 2013
RWE Finance B.V. €1,000 million €997 million 5.75 November 2013
RWE Finance B.V. €530 million €529 million 4.625 July 2014
RWE Finance B.V. €2,000 million €1,989 million 5.0 February 2015
RWE Finance B.V. €850 million €853 million 6.25 April 2016
RWE AG €100 million €100 million Variable1 November 2017
RWE Finance B.V. €980 million €979 million 5.125 July 2018
RWE Finance B.V. €1,000 million €992 million 6.625 January 2019
RWE Finance B.V. £570 million €685 million 6.5 April 2021
RWE Finance B.V. €1,000 million €997 million 6.5 August 2021
RWE Finance B.V. £500 million €593 million 5.5 July 2022
RWE Finance B.V. £488 million €581 million 5.625 December 2023
RWE Finance B.V. £760 million €912 million 6.25 June 2030
RWE AG €600 million €594 million 5.75 February 2033
RWE Finance B.V. £1,000 million €1,178 million 6.125 July 2039
RWE AG €160 million2 €166 million 4.762 February 2040
RWE AG CHF250 million €204 million 5.25 April 2072
Other3 Various €99 million Various Various
Bonds payable4 €15,210 million
1 Interest payment dates: 15 May/15 Nov.2 After swap into euro.3 Including other notes payable.4 Including other notes payable and hybrid bonds classified as debt as per IFRS.
During the reporting period, RWE placed issues on the European
capital market within the framework of the commercial paper
programme. Up to €3.4 billion was raised within the framework
of this programme in 2011 (previous year: €0.5 billion). The
interest rates on the instruments ranged between 1.3 % and
2.0 % (previous year: 0.4 % and 1.3 %).
Other financial liabilities contain finance lease liabilities. Lease
agreements principally relate to capital goods in the electricity
business.
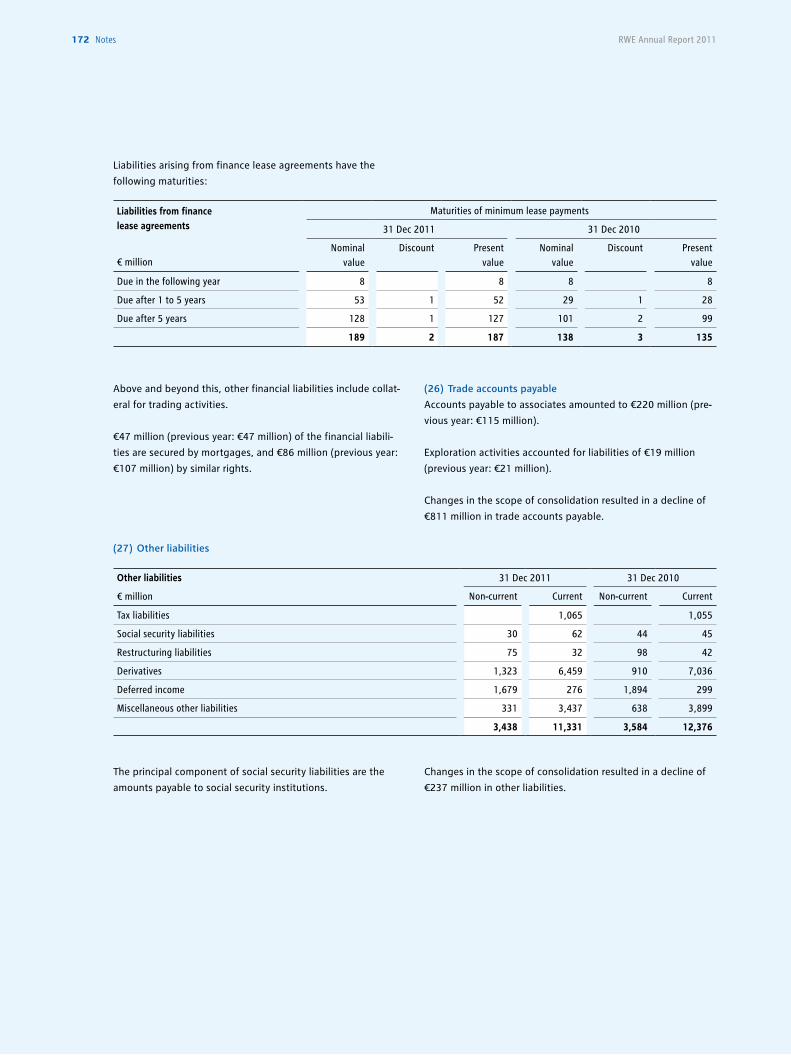
RWE Annual Report 2011172 notes
Liabilities arising from finance lease agreements have the
following maturities:
Above and beyond this, other financial liabilities include collat-
eral for trading activities.
€47 million (previous year: €47 million) of the financial liabili-
ties are secured by mortgages, and €86 million (previous year:
€107 million) by similar rights.
The principal component of social security liabilities are the
amounts payable to social security institutions.
Changes in the scope of consolidation resulted in a decline of
€237 million in other liabilities.
(26) Trade accounts payable
Accounts payable to associates amounted to €220 million (pre-
vious year: €115 million).
Exploration activities accounted for liabilities of €19 million
(previous year: €21 million).
Changes in the scope of consolidation resulted in a decline of
€811 million in trade accounts payable.
Liabilities from financelease agreements
€ million
Maturities of minimum lease payments
31 Dec 2011 31 Dec 2010
Nominalvalue
Discount Present value
Nominalvalue
Discount Present value
Due in the following year 8 8 8 8
Due after 1 to 5 years 53 1 52 29 1 28
Due after 5 years 128 1 127 101 2 99
189 2 187 138 3 135
(27) Other liabilities
Other liabilities
€ million
31 Dec 2011 31 Dec 2010
Non-current Current Non-current Current
Tax liabilities 1,065 1,055
Social security liabilities 30 62 44 45
Restructuring liabilities 75 32 98 42
Derivatives 1,323 6,459 910 7,036
Deferred income 1,679 276 1,894 299
Miscellaneous other liabilities 331 3,437 638 3,899
3,438 11,331 3,584 12,376
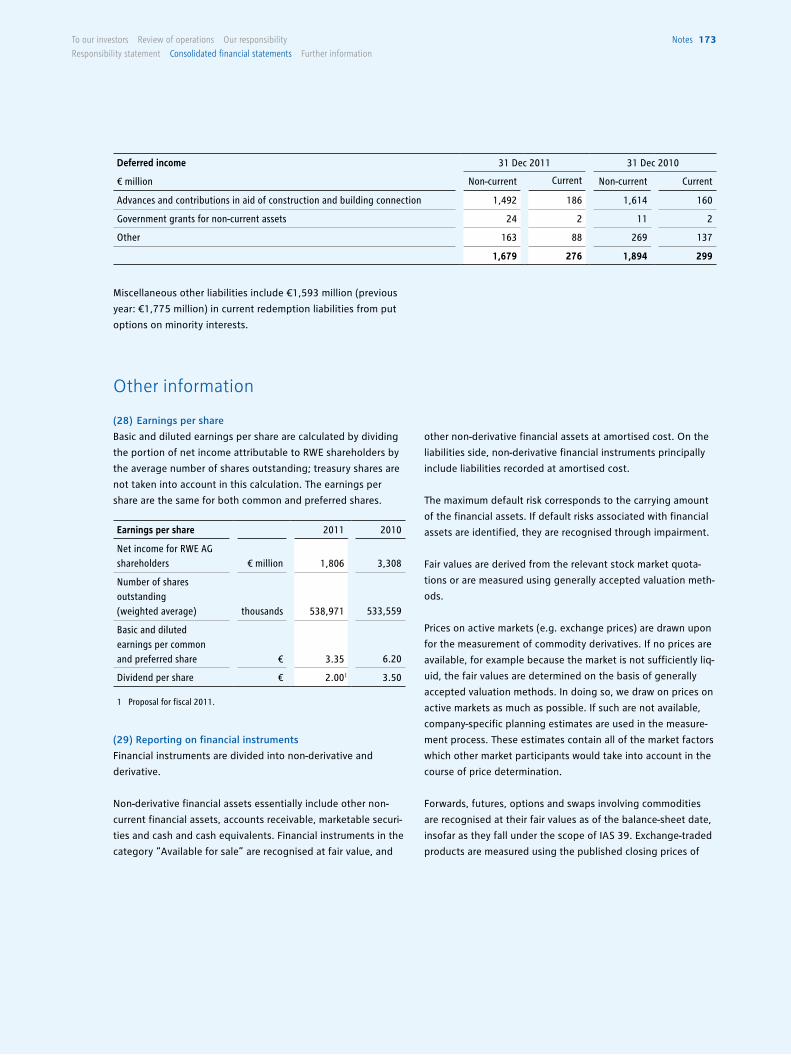
notes 173To our investors Review of operations our responsibility
Responsibility statement consolidated financial statements Further information
Miscellaneous other liabilities include €1,593 million (previous
year: €1,775 million) in current redemption liabilities from put
options on minority interests.
(28) Earnings per share
Basic and diluted earnings per share are calculated by dividing
the portion of net income attributable to RWE shareholders by
the average number of shares outstanding; treasury shares are
not taken into account in this calculation. The earnings per
share are the same for both common and preferred shares.
(29) Reporting on financial instruments
Financial instruments are divided into non-derivative and
derivative.
Non-derivative financial assets essentially include other non-
current financial assets, accounts receivable, marketable securi-
ties and cash and cash equivalents. Financial instruments in the
category “Available for sale” are recognised at fair value, and
other non-derivative financial assets at amortised cost. On the
liabilities side, non-derivative financial instruments principally
include liabilities recorded at amortised cost.
The maximum default risk corresponds to the carrying amount
of the financial assets. If default risks associated with financial
assets are identified, they are recognised through impairment.
Fair values are derived from the relevant stock market quota-
tions or are measured using generally accepted valuation meth-
ods.
Prices on active markets (e.g. exchange prices) are drawn upon
for the measurement of commodity derivatives. If no prices are
available, for example because the market is not sufficiently liq-
uid, the fair values are determined on the basis of generally
accepted valuation methods. In doing so, we draw on prices on
active markets as much as possible. If such are not available,
company-specific planning estimates are used in the measure-
ment process. These estimates contain all of the market factors
which other market participants would take into account in the
course of price determination.
Forwards, futures, options and swaps involving commodities
are recognised at their fair values as of the balance-sheet date,
insofar as they fall under the scope of IAS 39. Exchange-traded
products are measured using the published closing prices of
Deferred income
€ million
31 Dec 2011 31 Dec 2010
Non-current Current Non-current Current
Advances and contributions in aid of construction and building connection 1,492 186 1,614 160
Government grants for non-current assets 24 2 11 2
Other 163 88 269 137
1,679 276 1,894 299
Other information
Earnings per share 2011 2010
Net income for RWE AG shareholders € million 1,806 3,308
Number of shares outstanding (weighted average) thousands 538,971 533,559
Basic and diluted earnings per common and preferred share € 3.35 6.20
Dividend per share € 2.001 3.50
1 Proposal for fiscal 2011.
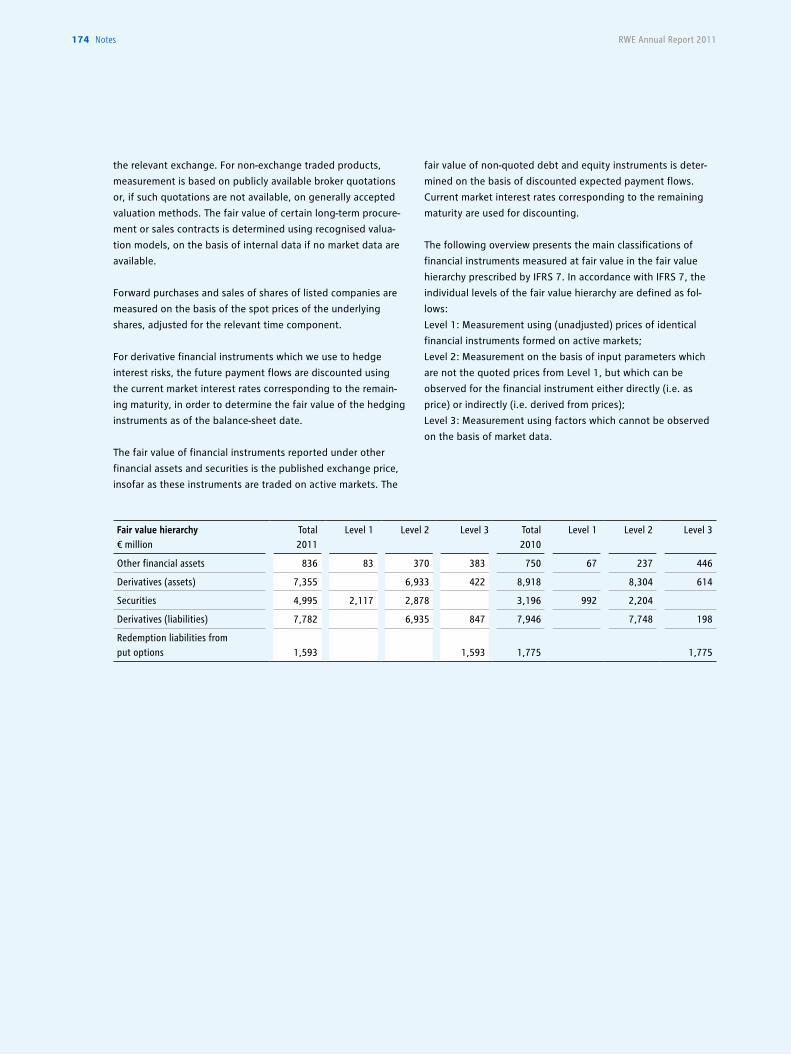
174 notes RWE Annual Report 2011
Fair value hierarchy € million
Total 2011
Level 1 Level 2 Level 3 Total 2010
Level 1 Level 2 Level 3
Other financial assets 836 83 370 383 750 67 237 446
Derivatives (assets) 7,355 6,933 422 8,918 8,304 614
Securities 4,995 2,117 2,878 3,196 992 2,204
Derivatives (liabilities) 7,782 6,935 847 7,946 7,748 198
Redemption liabilities from put options 1,593 1,593 1,775 1,775
the relevant exchange. For non-exchange traded products,
measurement is based on publicly available broker quotations
or, if such quotations are not available, on generally accepted
valuation methods. The fair value of certain long-term procure-
ment or sales contracts is determined using recognised valua-
tion models, on the basis of internal data if no market data are
available.
Forward purchases and sales of shares of listed companies are
measured on the basis of the spot prices of the underlying
shares, adjusted for the relevant time component.
For derivative financial instruments which we use to hedge
interest risks, the future payment flows are discounted using
the current market interest rates corresponding to the remain-
ing maturity, in order to determine the fair value of the hedging
instruments as of the balance-sheet date.
The fair value of financial instruments reported under other
financial assets and securities is the published exchange price,
insofar as these instruments are traded on active markets. The
fair value of non-quoted debt and equity instruments is deter-
mined on the basis of discounted expected payment flows.
Current market interest rates corresponding to the remaining
maturity are used for discounting.
The following overview presents the main classifications of
financial instruments measured at fair value in the fair value
hierarchy prescribed by IFRS 7. In accordance with IFRS 7, the
individual levels of the fair value hierarchy are defined as fol-
lows:
Level 1: Measurement using (unadjusted) prices of identical
financial instruments formed on active markets;
Level 2: Measurement on the basis of input parameters which
are not the quoted prices from Level 1, but which can be
observed for the financial instrument either directly (i.e. as
price) or indirectly (i.e. derived from prices);
Level 3: Measurement using factors which cannot be observed
on the basis of market data.
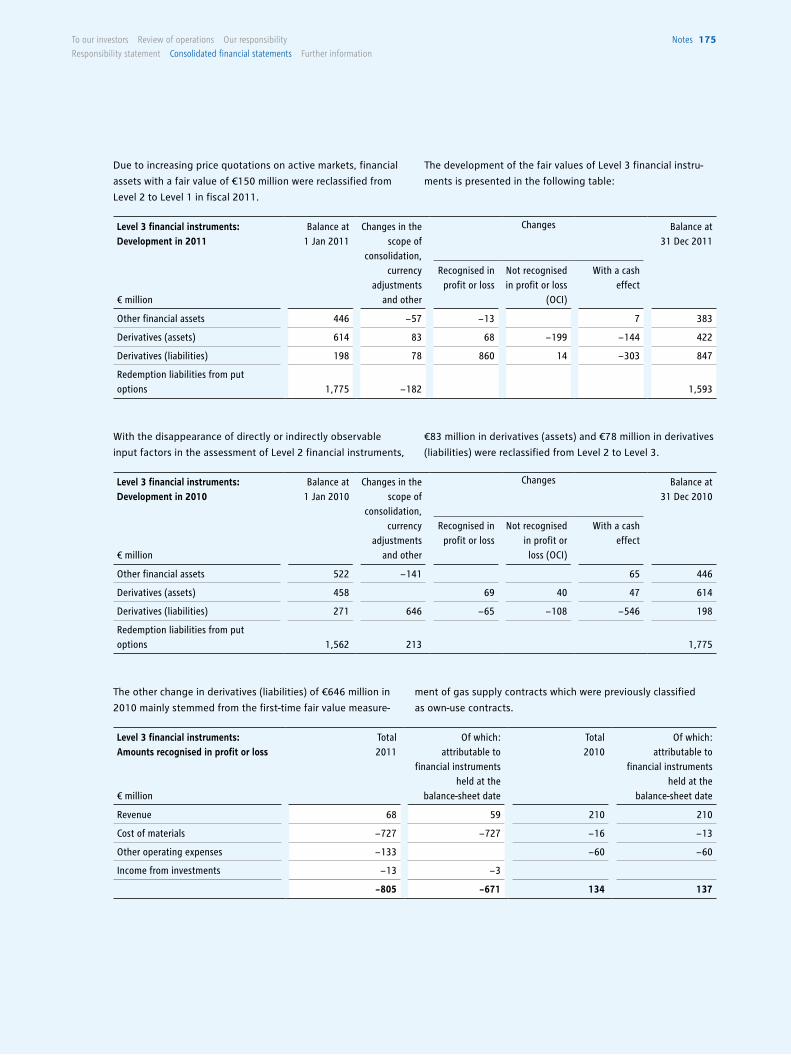
notes 175To our investors Review of operations our responsibility
Responsibility statement consolidated financial statements Further information
Due to increasing price quotations on active markets, financial
assets with a fair value of €150 million were reclassified from
Level 2 to Level 1 in fiscal 2011.
The development of the fair values of Level 3 financial instru-
ments is presented in the following table:
The other change in derivatives (liabilities) of €646 million in
2010 mainly stemmed from the first-time fair value measure-
ment of gas supply contracts which were previously classified
as own-use contracts.
Level 3 financial instruments: Development in 2011
€ million
Balance at 1 Jan 2011
Changes in the scope of
consolidation, currency
adjustments and other
Changes Balance at 31 Dec 2011
Recognised in profit or loss
Not recognised in profit or loss
(OCI)
With a cash effect
Other financial assets 446 − 57 − 13 7 383
Derivatives (assets) 614 83 68 − 199 − 144 422
Derivatives (liabilities) 198 78 860 14 − 303 847
Redemption liabilities from put options 1,775 − 182 1,593
Level 3 financial instruments: Development in 2010
€ million
Balance at 1 Jan 2010
Changes in the scope of
consolidation, currency
adjustments and other
Changes Balance at 31 Dec 2010
Recognised in profit or loss
Not recognised in profit or loss (OCI)
With a cash effect
Other financial assets 522 − 141 65 446
Derivatives (assets) 458 69 40 47 614
Derivatives (liabilities) 271 646 − 65 − 108 − 546 198
Redemption liabilities from put options 1,562 213 1,775
Level 3 financial instruments: Amounts recognised in profit or loss
€ million
Total2011
Of which: attributable to
financial instruments held at the
balance-sheet date
Total 2010
Of which: attributable to
financial instruments held at the
balance-sheet date
Revenue 68 59 210 210
Cost of materials − 727 − 727 − 16 − 13
Other operating expenses − 133 − 60 − 60
Income from investments − 13 − 3
− 805 − 671 134 137
With the disappearance of directly or indirectly observable
input factors in the assessment of Level 2 financial instruments,
€83 million in derivatives (assets) and €78 million in derivatives
(liabilities) were reclassified from Level 2 to Level 3.
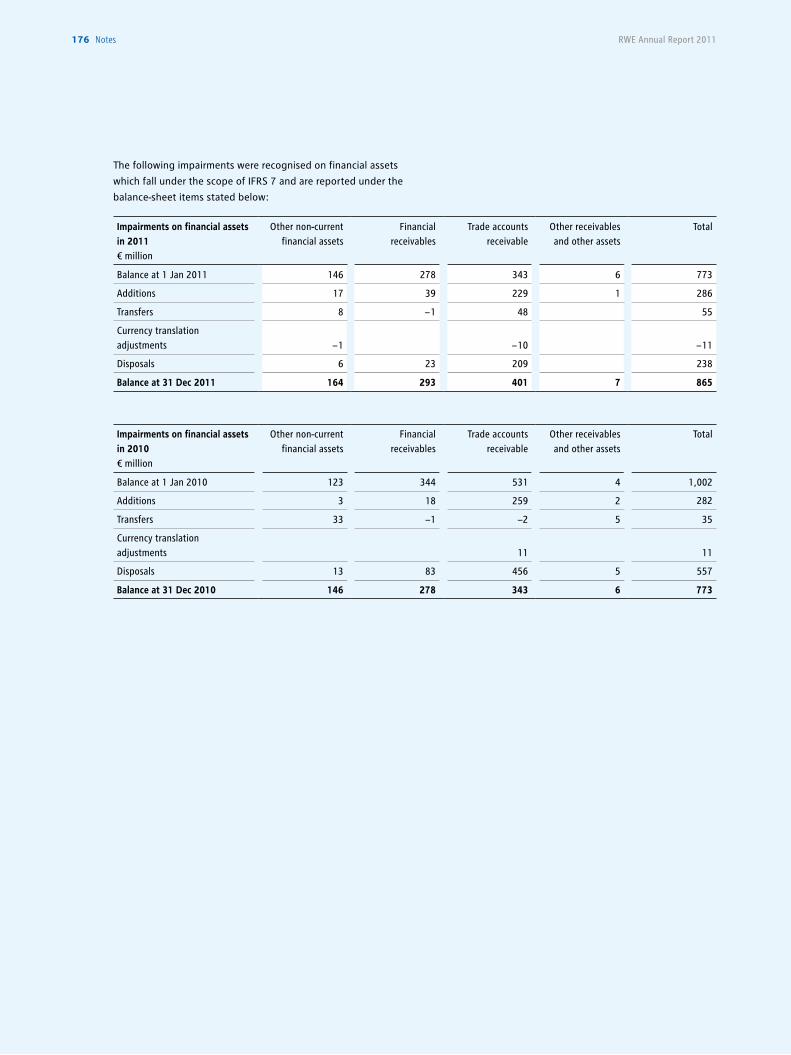
RWE Annual Report 2011176 notes
The following impairments were recognised on financial assets
which fall under the scope of IFRS 7 and are reported under the
balance-sheet items stated below:
Impairments on financial assets in 2011 € million
Other non-current financial assets
Financial receivables
Trade accounts receivable
Other receivables and other assets
Total
Balance at 1 Jan 2011 146 278 343 6 773
Additions 17 39 229 1 286
Transfers 8 − 1 48 55
Currency translation adjustments − 1 − 10 − 11
Disposals 6 23 209 238
Balance at 31 Dec 2011 164 293 401 7 865
Impairments on financial assets in 2010€ million
Other non-current financial assets
Financial receivables
Trade accounts receivable
Other receivables and other assets
Total
Balance at 1 Jan 2010 123 344 531 4 1,002
Additions 3 18 259 2 282
Transfers 33 −1 −2 5 35
Currency translation adjustments 11 11
Disposals 13 83 456 5 557
Balance at 31 Dec 2010 146 278 343 6 773
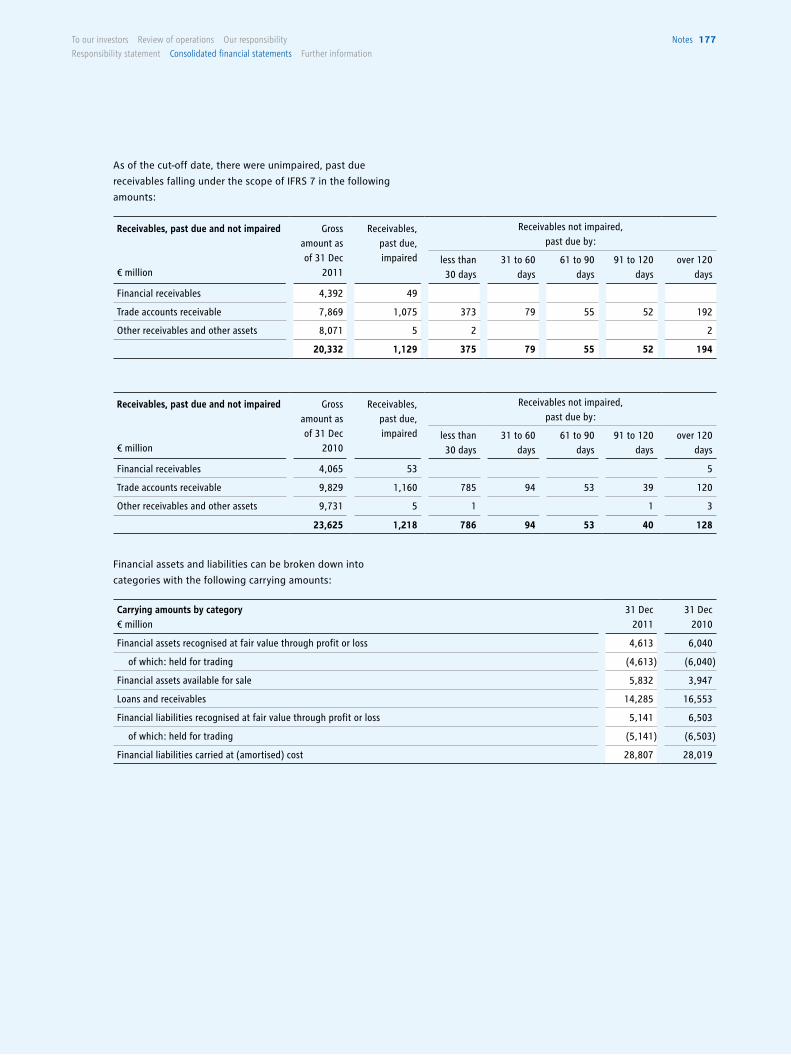
notes 177To our investors Review of operations our responsibility
Responsibility statement consolidated financial statements Further information
As of the cut-off date, there were unimpaired, past due
receivables falling under the scope of IFRS 7 in the following
amounts:
Financial assets and liabilities can be broken down into
categories with the following carrying amounts:
Receivables, past due and not impaired
€ million
Gross amount as of 31 Dec
2011
Receivables, past due, impaired
Receivables not impaired, past due by:
less than 30 days
31 to 60 days
61 to 90 days
91 to 120 days
over 120 days
Financial receivables 4,392 49
Trade accounts receivable 7,869 1,075 373 79 55 52 192
Other receivables and other assets 8,071 5 2 2
20,332 1,129 375 79 55 52 194
Receivables, past due and not impaired
€ million
Gross amount as of 31 Dec
2010
Receivables, past due, impaired
Receivables not impaired, past due by:
less than 30 days
31 to 60 days
61 to 90 days
91 to 120 days
over 120 days
Financial receivables 4,065 53 5
Trade accounts receivable 9,829 1,160 785 94 53 39 120
Other receivables and other assets 9,731 5 1 1 3
23,625 1,218 786 94 53 40 128
Carrying amounts by category€ million
31 Dec 2011
31 Dec 2010
Financial assets recognised at fair value through profit or loss 4,613 6,040
of which: held for trading (4,613) (6,040)
Financial assets available for sale 5,832 3,947
Loans and receivables 14,285 16,553
Financial liabilities recognised at fair value through profit or loss 5,141 6,503
of which: held for trading (5,141) (6,503)
Financial liabilities carried at (amortised) cost 28,807 28,019
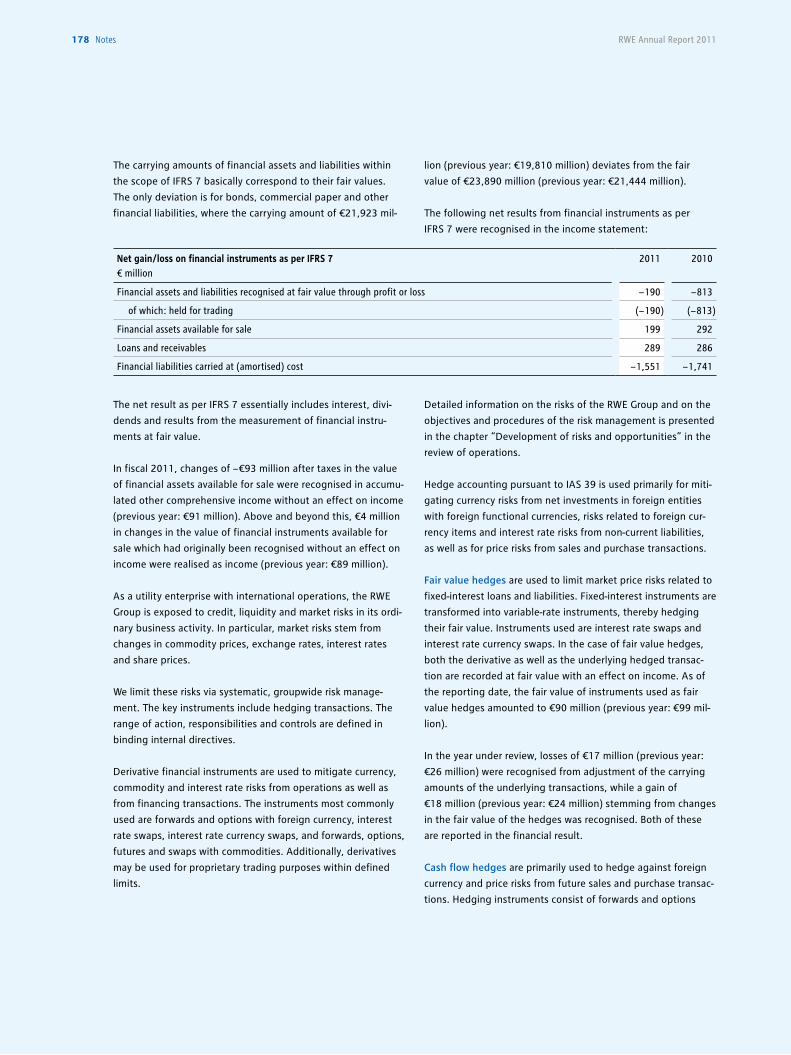
178 notes RWE Annual Report 2011
The carrying amounts of financial assets and liabilities within
the scope of IFRS 7 basically correspond to their fair values.
The only deviation is for bonds, commercial paper and other
financial liabilities, where the carrying amount of €21,923 mil-
The net result as per IFRS 7 essentially includes interest, divi-
dends and results from the measurement of financial instru-
ments at fair value.
In fiscal 2011, changes of − €93 million after taxes in the value
of financial assets available for sale were recognised in accumu-
lated other comprehensive income without an effect on income
(previous year: €91 million). Above and beyond this, €4 million
in changes in the value of financial instruments available for
sale which had originally been recognised without an effect on
income were realised as income (previous year: €89 million).
As a utility enterprise with international operations, the RWE
Group is exposed to credit, liquidity and market risks in its ordi-
nary business activity. In particular, market risks stem from
changes in commodity prices, exchange rates, interest rates
and share prices.
We limit these risks via systematic, groupwide risk manage-
ment. The key instruments include hedging transactions. The
range of action, responsibilities and controls are defined in
binding internal directives.
Derivative financial instruments are used to mitigate currency,
commodity and interest rate risks from operations as well as
from financing transactions. The instruments most commonly
used are forwards and options with foreign currency, interest
rate swaps, interest rate currency swaps, and forwards, options,
futures and swaps with commodities. Additionally, derivatives
may be used for proprietary trading purposes within defined
limits.
lion (previous year: €19,810 million) deviates from the fair
value of €23,890 million (previous year: €21,444 million).
The following net results from financial instruments as per
IFRS 7 were recognised in the income statement:
Detailed information on the risks of the RWE Group and on the
objectives and procedures of the risk management is presented
in the chapter “Development of risks and opportunities” in the
review of operations.
Hedge accounting pursuant to IAS 39 is used primarily for miti-
gating currency risks from net investments in foreign entities
with foreign functional currencies, risks related to foreign cur-
rency items and interest rate risks from non-current liabilities,
as well as for price risks from sales and purchase transactions.
Fair value hedges are used to limit market price risks related to
fixed-interest loans and liabilities. Fixed-interest instruments are
transformed into variable-rate instruments, thereby hedging
their fair value. Instruments used are interest rate swaps and
interest rate currency swaps. In the case of fair value hedges,
both the derivative as well as the underlying hedged transac-
tion are recorded at fair value with an effect on income. As of
the reporting date, the fair value of instruments used as fair
value hedges amounted to €90 million (previous year: €99 mil-
lion).
In the year under review, losses of €17 million (previous year:
€26 million) were recognised from adjustment of the carrying
amounts of the underlying transactions, while a gain of
€18 million (previous year: €24 million) stemming from changes
in the fair value of the hedges was recognised. Both of these
are reported in the financial result.
Cash flow hedges are primarily used to hedge against foreign
currency and price risks from future sales and purchase transac-
tions. Hedging instruments consist of forwards and options
Net gain/loss on financial instruments as per IFRS 7€ million
2011 2010
Financial assets and liabilities recognised at fair value through profit or loss − 190 − 813
of which: held for trading (− 190) (− 813)
Financial assets available for sale 199 292
Loans and receivables 289 286
Financial liabilities carried at (amortised) cost − 1,551 − 1,741
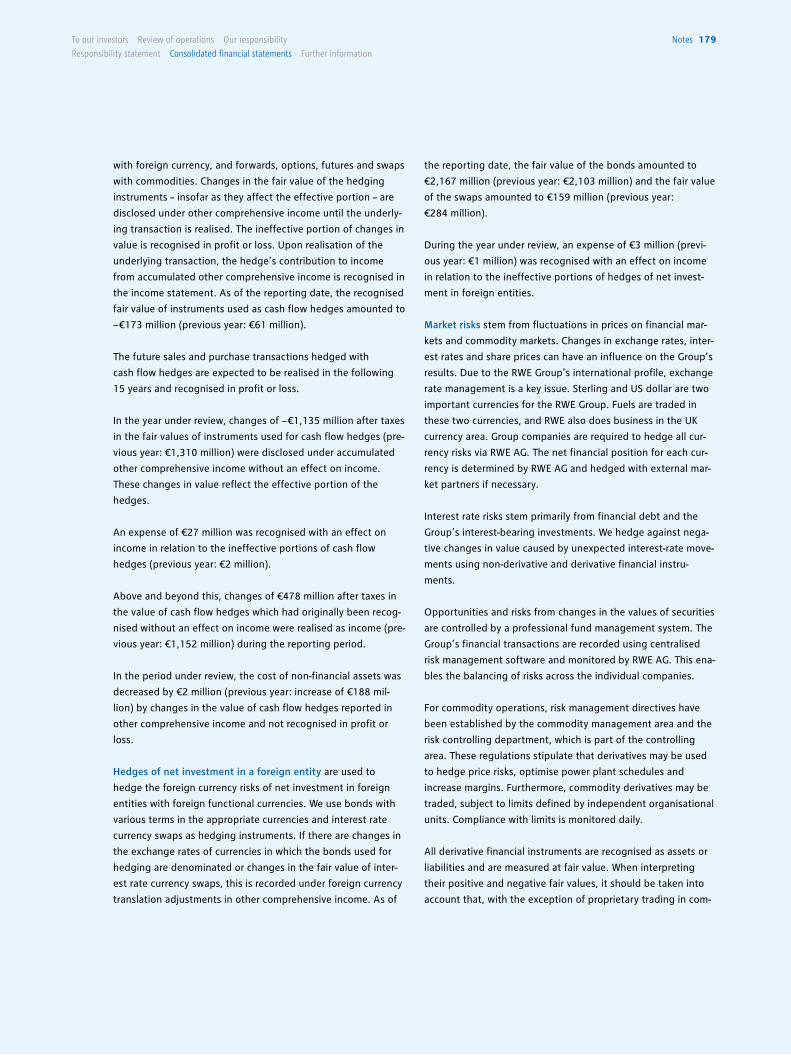
notes 179To our investors Review of operations our responsibility
Responsibility statement consolidated financial statements Further information
with foreign currency, and forwards, options, futures and swaps
with commodities. Changes in the fair value of the hedging
instruments – insofar as they affect the effective portion – are
disclosed under other comprehensive income until the underly-
ing transaction is realised. The ineffective portion of changes in
value is recognised in profit or loss. Upon realisation of the
underlying transaction, the hedge’s contribution to income
from accumulated other comprehensive income is recognised in
the income statement. As of the reporting date, the recognised
fair value of instruments used as cash flow hedges amounted to
− €173 million (previous year: €61 million).
The future sales and purchase transactions hedged with
cash flow hedges are expected to be realised in the following
15 years and recognised in profit or loss.
In the year under review, changes of − €1,135 million after taxes
in the fair values of instruments used for cash flow hedges (pre-
vious year: €1,310 million) were disclosed under accumulated
other comprehensive income without an effect on income.
These changes in value reflect the effective portion of the
hedges.
An expense of €27 million was recognised with an effect on
income in relation to the ineffective portions of cash flow
hedges (previous year: €2 million).
Above and beyond this, changes of €478 million after taxes in
the value of cash flow hedges which had originally been recog-
nised without an effect on income were realised as income (pre-
vious year: €1,152 million) during the reporting period.
In the period under review, the cost of non-financial assets was
decreased by €2 million (previous year: increase of €188 mil-
lion) by changes in the value of cash flow hedges reported in
other comprehensive income and not recognised in profit or
loss.
Hedges of net investment in a foreign entity are used to
hedge the foreign currency risks of net investment in foreign
entities with foreign functional currencies. We use bonds with
various terms in the appropriate currencies and interest rate
currency swaps as hedging instruments. If there are changes in
the exchange rates of currencies in which the bonds used for
hedging are denominated or changes in the fair value of inter-
est rate currency swaps, this is recorded under foreign currency
translation adjustments in other comprehensive income. As of
the reporting date, the fair value of the bonds amounted to
€2,167 million (previous year: €2,103 million) and the fair value
of the swaps amounted to €159 million (previous year:
€284 million).
During the year under review, an expense of €3 million (previ-
ous year: €1 million) was recognised with an effect on income
in relation to the ineffective portions of hedges of net invest-
ment in foreign entities.
Market risks stem from fluctuations in prices on financial mar-
kets and commodity markets. Changes in exchange rates, inter-
est rates and share prices can have an influence on the Group’s
results. Due to the RWE Group’s international profile, exchange
rate management is a key issue. Sterling and US dollar are two
important currencies for the RWE Group. Fuels are traded in
these two currencies, and RWE also does business in the UK
currency area. Group companies are required to hedge all cur-
rency risks via RWE AG. The net financial position for each cur-
rency is determined by RWE AG and hedged with external mar-
ket partners if necessary.
Interest rate risks stem primarily from financial debt and the
Group’s interest-bearing investments. We hedge against nega-
tive changes in value caused by unexpected interest-rate move-
ments using non-derivative and derivative financial instru-
ments.
Opportunities and risks from changes in the values of securities
are controlled by a professional fund management system. The
Group’s financial transactions are recorded using centralised
risk management software and monitored by RWE AG. This ena-
bles the balancing of risks across the individual companies.
For commodity operations, risk management directives have
been established by the commodity management area and the
risk controlling department, which is part of the controlling
area. These regulations stipulate that derivatives may be used
to hedge price risks, optimise power plant schedules and
increase margins. Furthermore, commodity derivatives may be
traded, subject to limits defined by independent organisational
units. Compliance with limits is monitored daily.
All derivative financial instruments are recognised as assets or
liabilities and are measured at fair value. When interpreting
their positive and negative fair values, it should be taken into
account that, with the exception of proprietary trading in com-
RWE Annual Report 2011180 notes
modities, these financial instruments are generally matched
with underlying transactions that carry offsetting risks.
Maturities of derivatives related to interest rates, currencies,
equities, indices and commodities for the purpose of hedging
are based on the maturities of the underlying transactions and
are thus primarily short term and medium term in nature.
Hedges of the foreign currency risks of foreign investments
have maturities of up to 30 years.
Risks stemming from fluctuations in commodity prices and
financial market risks (foreign currency risks, interest rate risks,
securities risks) are monitored and managed by RWE using indi-
cators such as Value at Risk (VaR), amongst other things. In
addition, for the management of interest rate risk, a Cash Flow
at Risk (CFaR) is determined.
Using the VaR method, we determine and monitor the maxi-
mum expected loss arising from changes in market prices with
a specific level of probability during specific periods. Historical
price volatility is taken as a basis in the calculations. With the
exception of the CFaR data, all VaR figures are based on a confi-
dence interval of 95 % and a holding period of one day. For
CFaR, a confidence interval of 95 % and a holding period of one
year is taken as a basis.
In respect of interest rate risks, RWE distinguishes between two
risk categories: on the one hand, increases in interest rates can
result in declines in the prices of securities from RWE’s hold-
ings. This pertains primarily to fixed-rate instruments. On the
other hand, financing costs also increase along with the level of
interest rates. A VaR is determined to quantify securities price
risk. As of 31 December 2011, the VaR for securities price risk
amounted to €7.2 million (previous year: €7.1 million). The sen-
sitivity of interest expenses to increases in market interest rates
is measured with CFaR. As of 31 December 2011 this amounted
to €13.3 million (previous year: €4.9 million).
The companies of the RWE Group are required to hedge their
foreign currency risks via RWE AG. Only RWE AG itself may
maintain open foreign currency positions, subject to predefined
limits. As of 31 December 2011, the VaR for these foreign cur-
rency positions was less than €1 million (previous year: less
than €1 million). This corresponds to the figure used internally,
which also includes the underlying transactions for cash flow
hedges.
As of 31 December 2011, the VaR for risks related to the RWE
share portfolio amounted to €13.1 million (previous year:
€7.7 million).
As of 31 December 2011, VaR for the commodity positions of
the trading business of RWE Supply & Trading amounted to
€6.1 million (previous year: €10.0 million). This corresponds to
the figure actually used for management purposes.
Additionally, stress tests are continuously carried out in relation
to the trading operations of RWE Supply & Trading to model the
impact of commodity price changes on the liquidity and earn-
ings conditions and take risk-mitigating measures if necessary.
In these stress tests, market price curves are modified, and the
commodity position is revalued on this basis. Historical scenar-
ios of extreme prices and realistic, fictitious price scenarios are
modelled. Above and beyond this, possible extreme scenarios
for the major trading desks are assessed on a monthly basis. In
the event that the stress tests exceed internal thresholds, these
scenarios are then analysed in detail in relation to their impact
and probability, and – if necessary – risk-mitigating measures
are considered.
If market liquidity is available, commodity risks of the Group’s
power generation companies are transferred – in accordance
with Group guidelines – at market prices to the segment Trad-
ing /Gas Midstream, where they are hedged. In accordance with
the approach for long-term investments for example, it is not
possible to manage commodity risks from long-term positions
or positions which cannot be hedged due to their size and the
prevailing market liquidity using the VaR concept. As a result,
these positions are not included in the VaR figures. Above and
beyond open production positions which have not yet been
transferred, Group companies are not allowed to maintain sig-
nificant risk positions, according to Group guidelines.
Credit risks. In financial and trading operations, we primarily
have credit relationships with banks and other trading partners
with good creditworthiness. The resulting counterparty risks
are reviewed upon conclusion of the contract and constantly
monitored. We also limit such risks by defining limits for trading
with contractual partners and, if necessary, by requiring addi-
tional collateral, such as cash collateral. Credit risks in trading
and financial operations are monitored on a daily basis.
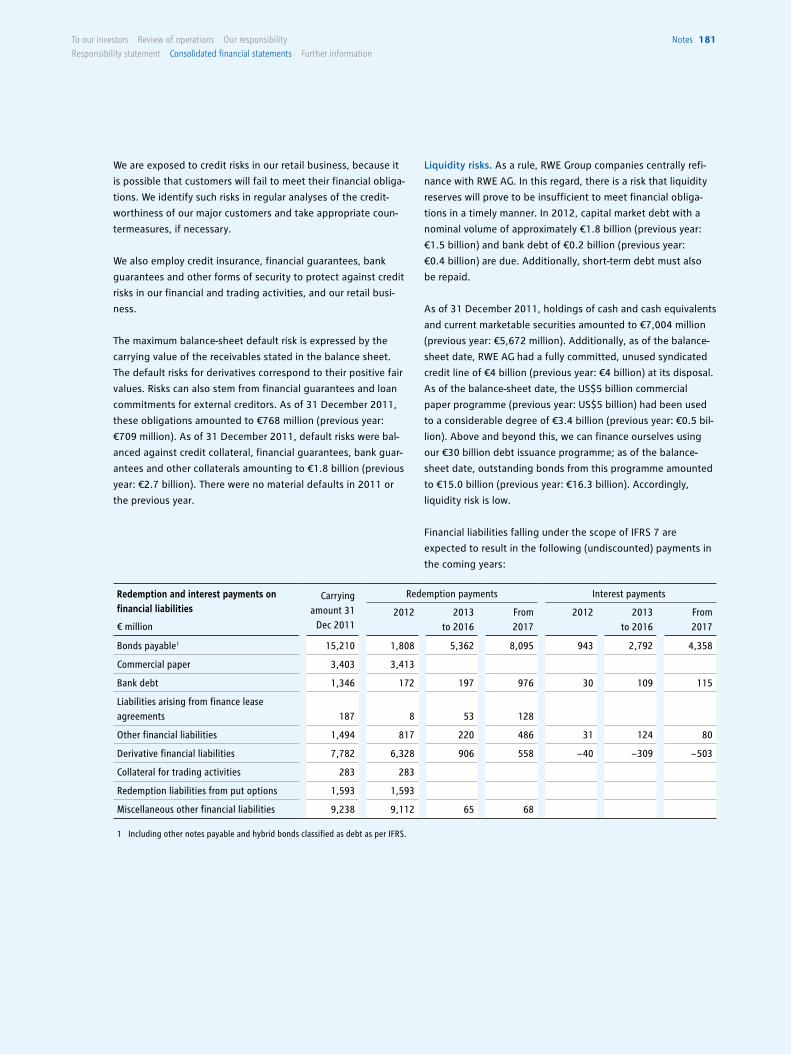
notes 181To our investors Review of operations our responsibility
Responsibility statement consolidated financial statements Further information
We are exposed to credit risks in our retail business, because it
is possible that customers will fail to meet their financial obliga-
tions. We identify such risks in regular analyses of the credit-
worthiness of our major customers and take appropriate coun-
termeasures, if necessary.
We also employ credit insurance, financial guarantees, bank
guarantees and other forms of security to protect against credit
risks in our financial and trading activities, and our retail busi-
ness.
The maximum balance-sheet default risk is expressed by the
carrying value of the receivables stated in the balance sheet.
The default risks for derivatives correspond to their positive fair
values. Risks can also stem from financial guarantees and loan
commitments for external creditors. As of 31 December 2011,
these obligations amounted to €768 million (previous year:
€709 million). As of 31 December 2011, default risks were bal-
anced against credit collateral, financial guarantees, bank guar-
antees and other collaterals amounting to €1.8 billion (previous
year: €2.7 billion). There were no material defaults in 2011 or
the previous year.
Liquidity risks. As a rule, RWE Group companies centrally refi-
nance with RWE AG. In this regard, there is a risk that liquidity
reserves will prove to be insufficient to meet financial obliga-
tions in a timely manner. In 2012, capital market debt with a
nominal volume of approximately €1.8 billion (previous year:
€1.5 billion) and bank debt of €0.2 billion (previous year:
€0.4 billion) are due. Additionally, short-term debt must also
be repaid.
As of 31 December 2011, holdings of cash and cash equivalents
and current marketable securities amounted to €7,004 million
(previous year: €5,672 million). Additionally, as of the balance-
sheet date, RWE AG had a fully committed, unused syndicated
credit line of €4 billion (previous year: €4 billion) at its disposal.
As of the balance-sheet date, the US$5 billion commercial
paper programme (previous year: US$5 billion) had been used
to a considerable degree of €3.4 billion (previous year: €0.5 bil-
lion). Above and beyond this, we can finance ourselves using
our €30 billion debt issuance programme; as of the balance-
sheet date, outstanding bonds from this programme amounted
to €15.0 billion (previous year: €16.3 billion). Accordingly,
liquidity risk is low.
Financial liabilities falling under the scope of IFRS 7 are
expected to result in the following (undiscounted) payments in
the coming years:
Redemption and interest payments on financial liabilities
€ million
Carrying amount 31
Dec 2011
Redemption payments Interest payments
2012 2013 to 2016
From 2017
2012 2013 to 2016
From 2017
Bonds payable1 15,210 1,808 5,362 8,095 943 2,792 4,358
Commercial paper 3,403 3,413
Bank debt 1,346 172 197 976 30 109 115
Liabilities arising from finance lease agreements 187 8 53 128
Other financial liabilities 1,494 817 220 486 31 124 80
Derivative financial liabilities 7,782 6,328 906 558 − 40 − 309 − 503
Collateral for trading activities 283 283
Redemption liabilities from put options 1,593 1,593
Miscellaneous other financial liabilities 9,238 9,112 65 68
1 Including other notes payable and hybrid bonds classified as debt as per IFRS.
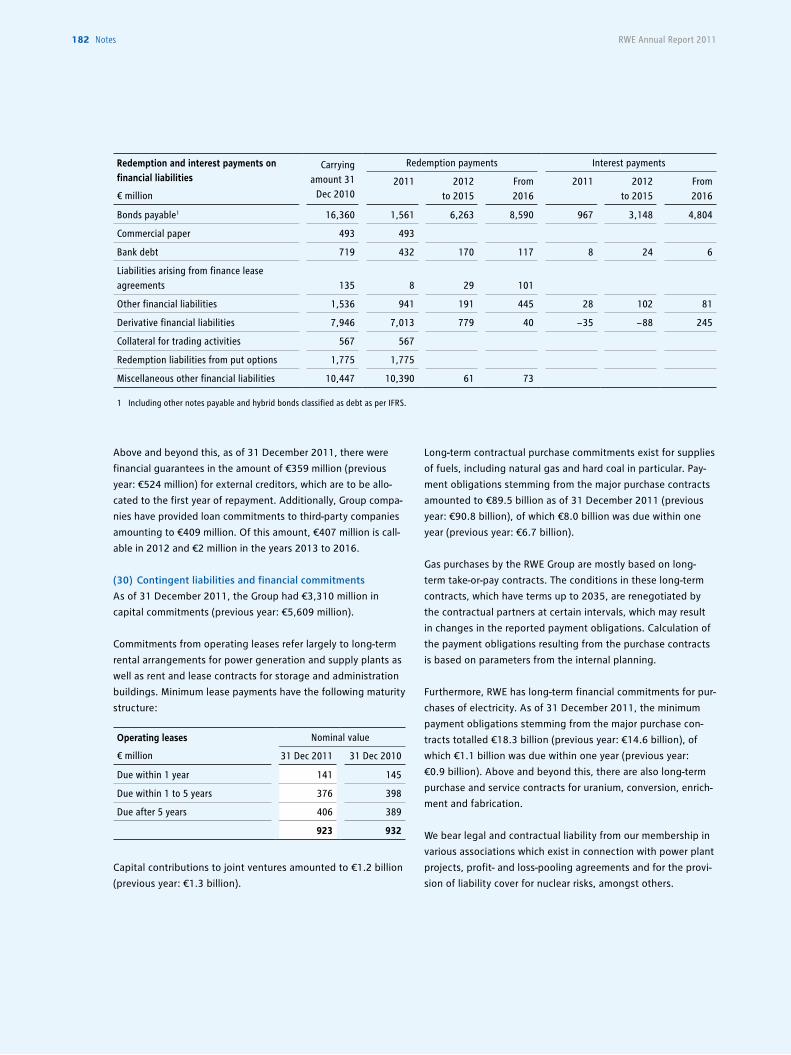
182 notes RWE Annual Report 2011
Above and beyond this, as of 31 December 2011, there were
financial guarantees in the amount of €359 million (previous
year: €524 million) for external creditors, which are to be allo-
cated to the first year of repayment. Additionally, Group compa-
nies have provided loan commitments to third-party companies
amounting to €409 million. Of this amount, €407 million is call-
able in 2012 and €2 million in the years 2013 to 2016.
(30) Contingent liabilities and financial commitments
As of 31 December 2011, the Group had €3,310 million in
capital commitments (previous year: €5,609 million).
Commitments from operating leases refer largely to long-term
rental arrangements for power generation and supply plants as
well as rent and lease contracts for storage and administration
buildings. Minimum lease payments have the following maturity
structure:
Capital contributions to joint ventures amounted to €1.2 billion
(previous year: €1.3 billion).
Redemption and interest payments on financial liabilities
€ million
Carrying amount 31
Dec 2010
Redemption payments Interest payments
2011 2012 to 2015
From 2016
2011 2012 to 2015
From 2016
Bonds payable1 16,360 1,561 6,263 8,590 967 3,148 4,804
Commercial paper 493 493
Bank debt 719 432 170 117 8 24 6
Liabilities arising from finance lease agreements 135 8 29 101
Other financial liabilities 1,536 941 191 445 28 102 81
Derivative financial liabilities 7,946 7,013 779 40 − 35 − 88 245
Collateral for trading activities 567 567
Redemption liabilities from put options 1,775 1,775
Miscellaneous other financial liabilities 10,447 10,390 61 73
1 Including other notes payable and hybrid bonds classified as debt as per IFRS.
Operating leases
€ million
Nominal value
31 Dec 2011 31 Dec 2010
Due within 1 year 141 145
Due within 1 to 5 years 376 398
Due after 5 years 406 389
923 932
Long-term contractual purchase commitments exist for supplies
of fuels, including natural gas and hard coal in particular. Pay-
ment obligations stemming from the major purchase contracts
amounted to €89.5 billion as of 31 December 2011 (previous
year: €90.8 billion), of which €8.0 billion was due within one
year (previous year: €6.7 billion).
Gas purchases by the RWE Group are mostly based on long-
term take-or-pay contracts. The conditions in these long-term
contracts, which have terms up to 2035, are renegotiated by
the contractual partners at certain intervals, which may result
in changes in the reported payment obligations. Calculation of
the payment obligations resulting from the purchase contracts
is based on parameters from the internal planning.
Furthermore, RWE has long-term financial commitments for pur-
chases of electricity. As of 31 December 2011, the minimum
payment obligations stemming from the major purchase con-
tracts totalled €18.3 billion (previous year: €14.6 billion), of
which €1.1 billion was due within one year (previous year:
€0.9 billion). Above and beyond this, there are also long-term
purchase and service contracts for uranium, conversion, enrich-
ment and fabrication.
We bear legal and contractual liability from our membership in
various associations which exist in connection with power plant
projects, profit- and loss-pooling agreements and for the provi-
sion of liability cover for nuclear risks, amongst others.
notes 183To our investors Review of operations our responsibility
Responsibility statement consolidated financial statements Further information
On the basis of a mutual benefit agreement, which was
extended for an additional ten years in 2011, RWE AG and
other parent companies of German nuclear power plant opera-
tors undertook to provide approximately €2,244 million in
funding to liable nuclear power plant operators to ensure that
they are able to meet their payment obligations in the event of
nuclear damages. RWE AG has a 25.851 % contractual share in
the liability, plus 5 % for damage settlement costs.
RWE AG’s payment commitments stemming from the agree-
ment between the power utilities and the German Federal Gov-
ernment ceased to exist, due to rescission of the lifetime exten-
sions for the nuclear power plants.
RWE AG and its subsidiaries are involved in regulatory and anti-
trust proceedings, litigation and arbitration proceedings related
to their operations. However, we do not expect any material
negative repercussions from these proceedings on the RWE
Group’s economic or financial position. Additionally, companies
belonging to the RWE Group are directly involved in various
administrative and regulatory proceedings (including approval
procedures) or are directly affected by their results.
Outside shareholders initiated several legal proceedings to
examine the appropriateness of the conversion ratios and the
amount of cash paid in compensation in connection with com-
pany restructurings pursuant to German company law. We are
convinced that the conversion ratios and cash compensation
calculated on the basis of expert opinions and verified by audi-
tors are adequate. If a different legally enforceable conclusion
is reached, all affected shareholders will be compensated, even
if they are not involved in the conciliation proceedings.
At end-September 2011, the EU Commission conducted reviews
of gas wholesale trading throughout Europe, including at RWE.
The main focus of these investigations was the suspicion that
the Russian gas producer Gazprom had abused its market
power and was concluding anti-competitive agreements with its
customers. It is unclear whether RWE continues to be investi-
gated. These investigations may last for several years.
(31) Segment reporting
Within the RWE Group segments are defined both in accord-
ance with functional and geographical criteria.
The segment “Power Generation“ essentially consists of the
power generation business and lignite production in Germany.
For the most part, the segment “Sales /Distribution Networks”
encompasses sales and distribution networks in Germany.
The segment “Netherlands /Belgium“ comprises the Group’s
electricity and gas business in this region.
The segment “United Kingdom” consists of almost all of the
electricity and gas business in this region.
Central Eastern and South Eastern European power generation
and the supply and the distribution activities in this region are
included in the segment “Central Eastern and South Eastern
Europe”.
Activities for the generation of electricity and heat from renew-
able energy sources are bundled in RWE Innogy and presented
in the segment “Renewables”.
The segment “Upstream Gas & Oil“ covers all of the Group’s gas
and oil production activities.
The segment “Trading /Gas Midstream” covers energy trading
and the commercial optimisation of non-regulated gas activi-
ties. The latter aspect comprises procurement, transport and
storage contracts in Germany, the UK and the Czech Republic,
and the liquefied natural gas (LNG) business. This segment is
also responsible for key account business with major German
and Dutch industrial and commercial customers, as well as the
trading activities of the Essent Group.
“Other, consolidation“ covers consolidation effects, the Group
Centre and the activities of other Group areas which are not
presented separately. Such activities consist primarily of the
cross-segment services provided by RWE Service GmbH, RWE IT
GmbH, and RWE Consulting GmbH, as well as German transmis-
sion grid activities in the electricity and gas business, until such
are sold.
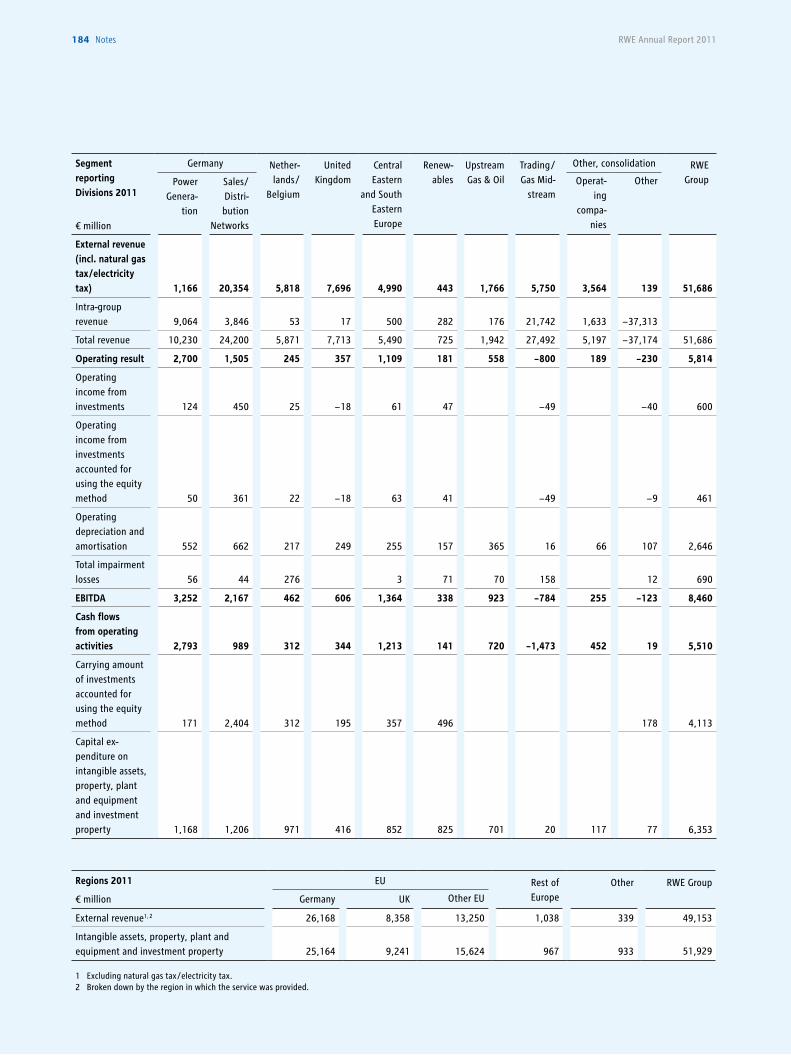
RWE Annual Report 2011184 notes
Segment reportingDivisions 2011
€ million
Germany Nether-lands /
Belgium
United Kingdom
Central Eastern
and South Eastern Europe
Renew-ables
Upstream Gas & Oil
Trading /Gas Mid-
stream
Other, consolidation RWE GroupPower
Genera-tion
Sales/Distri-bution
Networks
Operat-ing
compa-nies
Other
External revenue (incl. natural gas tax /electricity tax) 1,166 20,354 5,818 7,696 4,990 443 1,766 5,750 3,564 139 51,686
Intra-group revenue 9,064 3,846 53 17 500 282 176 21,742 1,633 − 37,313
Total revenue 10,230 24,200 5,871 7,713 5,490 725 1,942 27,492 5,197 − 37,174 51,686
Operating result 2,700 1,505 245 357 1,109 181 558 − 800 189 − 230 5,814
Operating income from investments 124 450 25 − 18 61 47 − 49 − 40 600
Operating income from investments accounted for using the equity method 50 361 22 − 18 63 41 − 49 − 9 461
Operating depreciation and amortisation 552 662 217 249 255 157 365 16 66 107 2,646
Total impairment losses 56 44 276 3 71 70 158 12 690
EBITDA 3,252 2,167 462 606 1,364 338 923 − 784 255 − 123 8,460
Cash flows from operating activities 2,793 989 312 344 1,213 141 720 − 1,473 452 19 5,510
Carrying amount of investments accounted for using the equity method 171 2,404 312 195 357 496 178 4,113
Capital ex-penditure on intangible assets, property, plant and equipment and investment property 1,168 1,206 971 416 852 825 701 20 117 77 6,353
Regions 2011
€ million
EU Rest of Europe
Other RWE Group
Germany UK Other EU
External revenue1, 2 26,168 8,358 13,250 1,038 339 49,153
Intangible assets, property, plant and equipment and investment property 25,164 9,241 15,624 967 933 51,929
1 Excluding natural gas tax /electricity tax.2 Broken down by the region in which the service was provided.
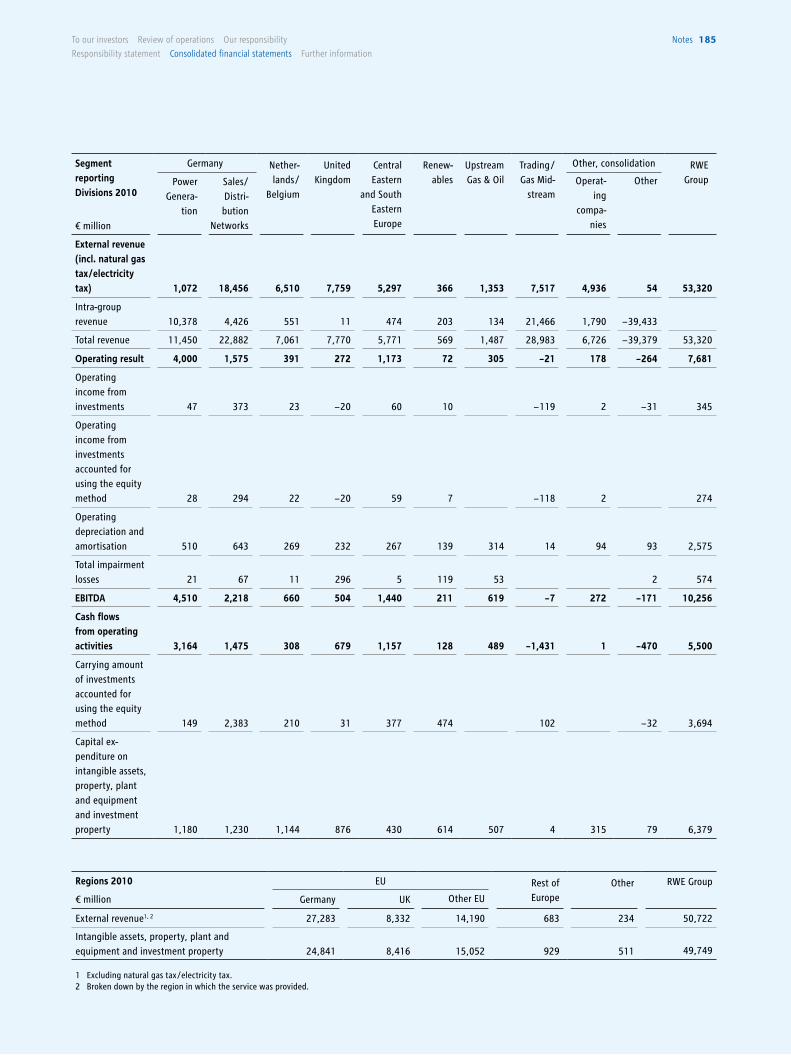
notes 185To our investors Review of operations our responsibility
Responsibility statement consolidated financial statements Further information
Segment reportingDivisions 2010
€ million
Germany Nether-lands /
Belgium
United Kingdom
Central Eastern
and South Eastern Europe
Renew-ables
Upstream Gas & Oil
Trading /Gas Mid-
stream
Other, consolidation RWE GroupPower
Genera-tion
Sales/Distri-bution
Networks
Operat-ing
compa-nies
Other
External revenue (incl. natural gas tax /electricity tax) 1,072 18,456 6,510 7,759 5,297 366 1,353 7,517 4,936 54 53,320
Intra-group revenue 10,378 4,426 551 11 474 203 134 21,466 1,790 − 39,433
Total revenue 11,450 22,882 7,061 7,770 5,771 569 1,487 28,983 6,726 − 39,379 53,320
Operating result 4,000 1,575 391 272 1,173 72 305 − 21 178 − 264 7,681
Operating income from investments 47 373 23 − 20 60 10 − 119 2 − 31 345
Operating income from investments accounted for using the equity method 28 294 22 − 20 59 7 − 118 2 274
Operating depreciation and amortisation 510 643 269 232 267 139 314 14 94 93 2,575
Total impairment losses 21 67 11 296 5 119 53 2 574
EBITDA 4,510 2,218 660 504 1,440 211 619 − 7 272 − 171 10,256
Cash flows from operating activities 3,164 1,475 308 679 1,157 128 489 − 1,431 1 − 470 5,500
Carrying amount of investments accounted for using the equity method 149 2,383 210 31 377 474 102 − 32 3,694
Capital ex-penditure on intangible assets, property, plant and equipment and investment property 1,180 1,230 1,144 876 430 614 507 4 315 79 6,379
Regions 2010
€ million
EU Rest of Europe
Other RWE Group
Germany UK Other EU
External revenue1, 2 27,283 8,332 14,190 683 234 50,722
Intangible assets, property, plant and equipment and investment property 24,841 8,416 15,052 929 511 49,749
1 Excluding natural gas tax /electricity tax.2 Broken down by the region in which the service was provided.
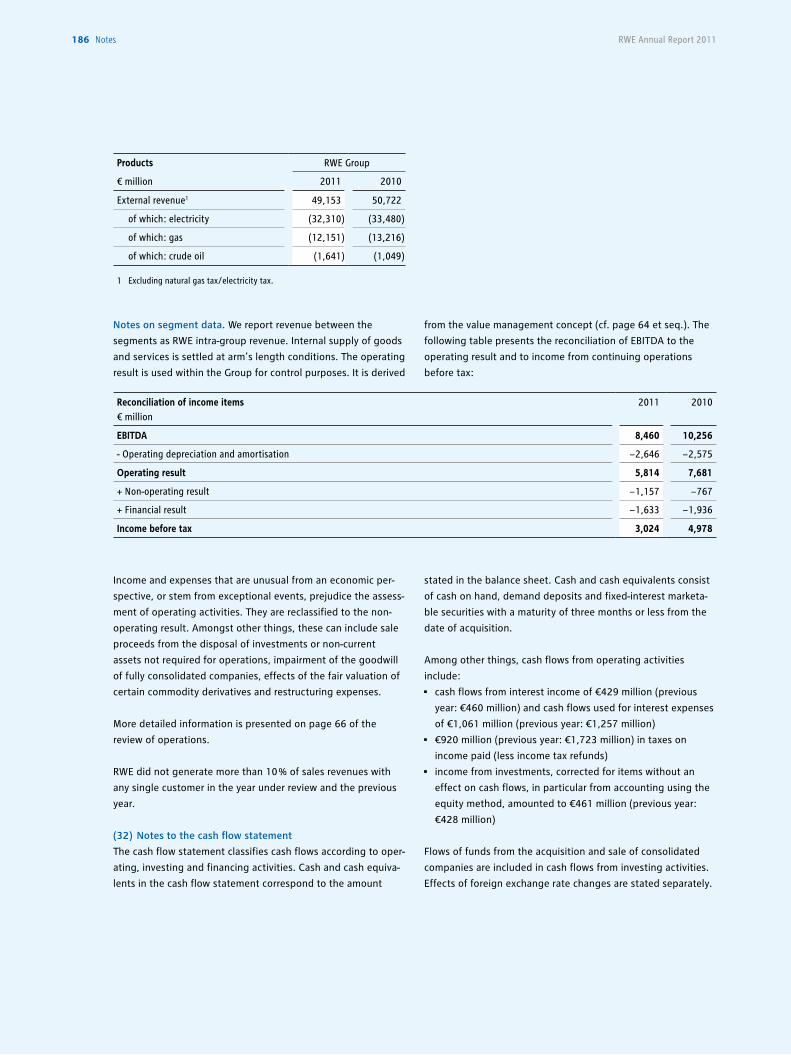
186 notes RWE Annual Report 2011
Products
€ million
RWE Group
2011 2010
External revenue1 49,153 50,722
of which: electricity (32,310) (33,480)
of which: gas (12,151) (13,216)
of which: crude oil (1,641) (1,049)
1 Excluding natural gas tax/electricity tax.
Reconciliation of income items€ million
2011 2010
EBITDA 8,460 10,256
- Operating depreciation and amortisation − 2,646 − 2,575
Operating result 5,814 7,681
+ Non-operating result − 1,157 − 767
+ Financial result − 1,633 − 1,936
Income before tax 3,024 4,978
Notes on segment data. We report revenue between the
segments as RWE intra-group revenue. Internal supply of goods
and services is settled at arm’s length conditions. The operating
result is used within the Group for control purposes. It is derived
Income and expenses that are unusual from an economic per-
spective, or stem from exceptional events, prejudice the assess-
ment of operating activities. They are reclassified to the non-
operating result. Amongst other things, these can include sale
proceeds from the disposal of investments or non-current
assets not required for operations, impairment of the goodwill
of fully consolidated companies, effects of the fair valuation of
certain commodity derivatives and restructuring expenses.
More detailed information is presented on page 66 of the
review of operations.
RWE did not generate more than 10 % of sales revenues with
any single customer in the year under review and the previous
year.
(32) Notes to the cash flow statement
The cash flow statement classifies cash flows according to oper-
ating, investing and financing activities. Cash and cash equiva-
lents in the cash flow statement correspond to the amount
from the value management concept (cf. page 64 et seq.). The
following table presents the reconciliation of EBITDA to the
operating result and to income from continuing operations
before tax:
stated in the balance sheet. Cash and cash equivalents consist
of cash on hand, demand deposits and fixed-interest marketa-
ble securities with a maturity of three months or less from the
date of acquisition.
Among other things, cash flows from operating activities
include:
• cash flows from interest income of €429 million (previous
year: €460 million) and cash flows used for interest expenses
of €1,061 million (previous year: €1,257 million)
• €920 million (previous year: €1,723 million) in taxes on
income paid (less income tax refunds)
• income from investments, corrected for items without an
effect on cash flows, in particular from accounting using the
equity method, amounted to €461 million (previous year:
€428 million)
Flows of funds from the acquisition and sale of consolidated
companies are included in cash flows from investing activities.
Effects of foreign exchange rate changes are stated separately.
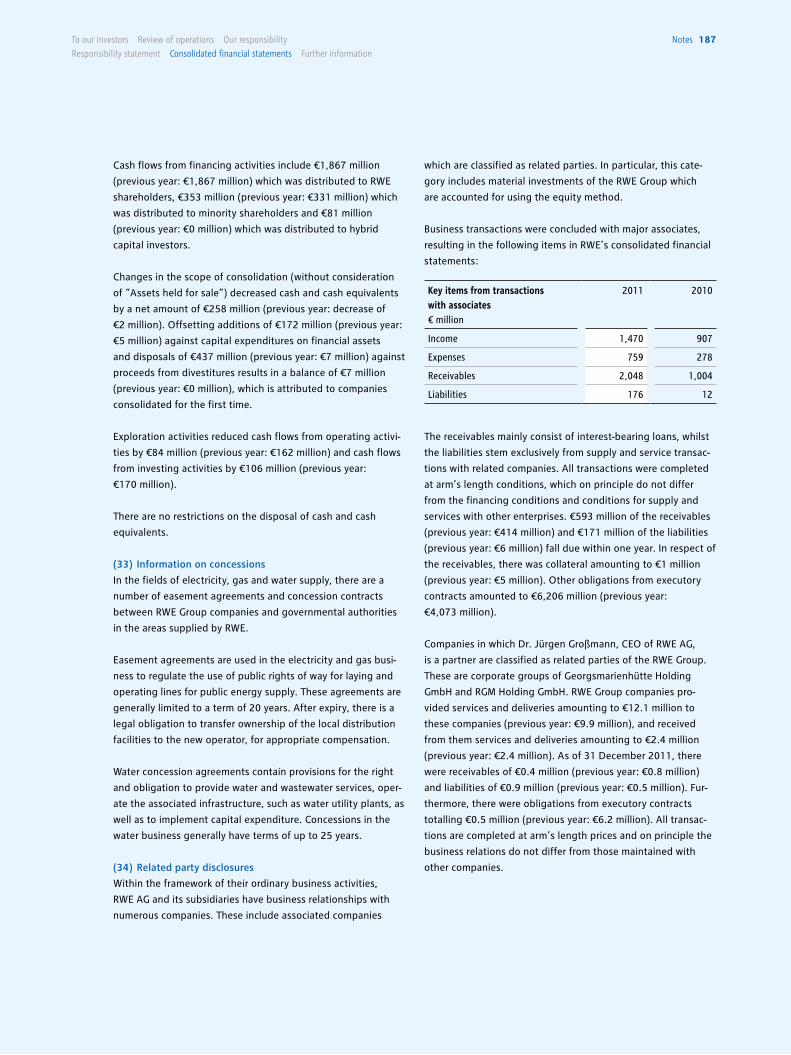
notes 187To our investors Review of operations our responsibility
Responsibility statement consolidated financial statements Further information
which are classified as related parties. In particular, this cate-
gory includes material investments of the RWE Group which
are accounted for using the equity method.
Business transactions were concluded with major associates,
resulting in the following items in RWE’s consolidated financial
statements:
The receivables mainly consist of interest-bearing loans, whilst
the liabilities stem exclusively from supply and service transac-
tions with related companies. All transactions were completed
at arm’s length conditions, which on principle do not differ
from the financing conditions and conditions for supply and
services with other enterprises. €593 million of the receivables
(previous year: €414 million) and €171 million of the liabilities
(previous year: €6 million) fall due within one year. In respect of
the receivables, there was collateral amounting to €1 million
(previous year: €5 million). Other obligations from executory
contracts amounted to €6,206 million (previous year:
€4,073 million).
Companies in which Dr. Jürgen Großmann, CEO of RWE AG,
is a partner are classified as related parties of the RWE Group.
These are corporate groups of Georgsmarienhütte Holding
GmbH and RGM Holding GmbH. RWE Group companies pro-
vided services and deliveries amounting to €12.1 million to
these companies (previous year: €9.9 million), and received
from them services and deliveries amounting to €2.4 million
(previous year: €2.4 million). As of 31 December 2011, there
were receivables of €0.4 million (previous year: €0.8 million)
and liabilities of €0.9 million (previous year: €0.5 million). Fur-
thermore, there were obligations from exe cutory contracts
totalling €0.5 million (previous year: €6.2 million). All transac-
tions are completed at arm’s length prices and on principle the
business relations do not differ from those maintained with
other companies.
Key items from transactions with associates€ million
2011 2010
Income 1,470 907
Expenses 759 278
Receivables 2,048 1,004
Liabilities 176 12
Cash flows from financing activities include €1,867 million
(previous year: €1,867 million) which was distributed to RWE
shareholders, €353 million (previous year: €331 million) which
was distributed to minority shareholders and €81 million
(previous year: €0 million) which was distributed to hybrid
capital investors.
Changes in the scope of consolidation (without consideration
of “Assets held for sale”) decreased cash and cash equivalents
by a net amount of €258 million (previous year: decrease of
€2 million). Offsetting additions of €172 million (previous year:
€5 million) against capital expenditures on financial assets
and disposals of €437 million (previous year: €7 million) against
proceeds from divestitures results in a balance of €7 million
(previous year: €0 million), which is attributed to companies
consolidated for the first time.
Exploration activities reduced cash flows from operating activi-
ties by €84 million (previous year: €162 million) and cash flows
from investing activities by €106 million (previous year:
€170 million).
There are no restrictions on the disposal of cash and cash
equivalents.
(33) Information on concessions
In the fields of electricity, gas and water supply, there are a
number of easement agreements and concession contracts
between RWE Group companies and governmental authorities
in the areas supplied by RWE.
Easement agreements are used in the electricity and gas busi-
ness to regulate the use of public rights of way for laying and
operating lines for public energy supply. These agreements are
generally limited to a term of 20 years. After expiry, there is a
legal obligation to transfer ownership of the local distribution
facilities to the new operator, for appropriate compensation.
Water concession agreements contain provisions for the right
and obligation to provide water and wastewater services, oper-
ate the associated infrastructure, such as water utility plants, as
well as to implement capital expenditure. Concessions in the
water business generally have terms of up to 25 years.
(34) Related party disclosures
Within the framework of their ordinary business activities,
RWE AG and its subsidiaries have business relationships with
numerous companies. These include associated companies
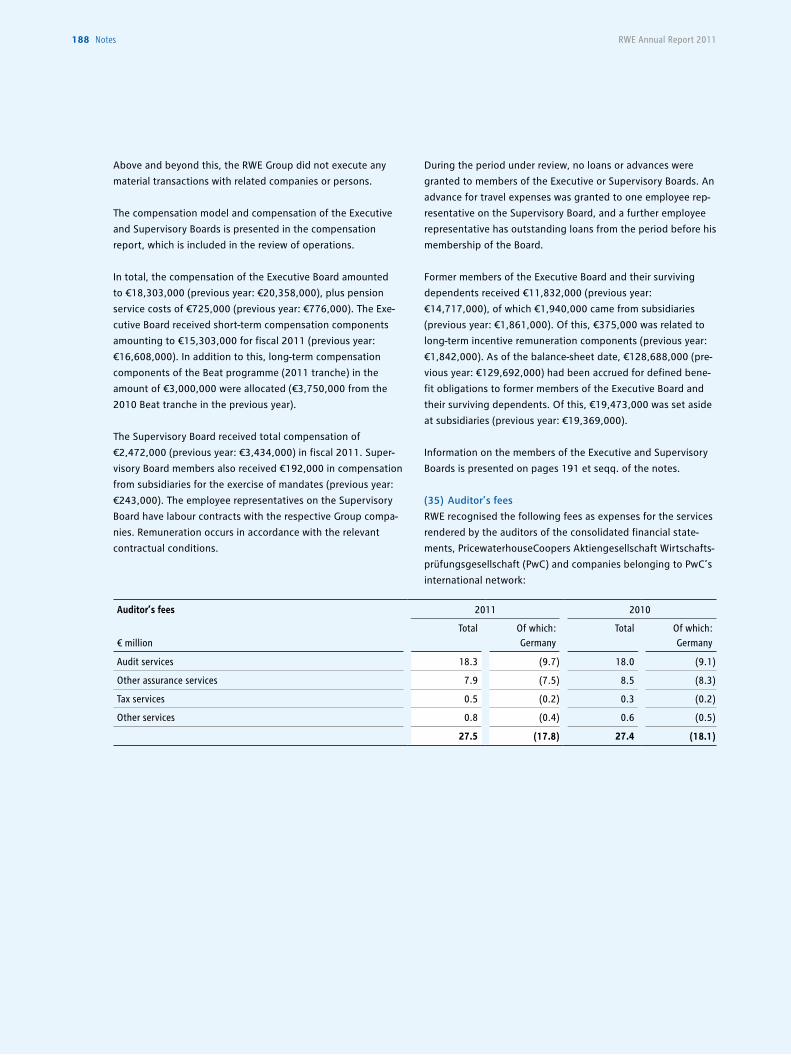
RWE Annual Report 2011188 notes
Above and beyond this, the RWE Group did not execute any
material transactions with related companies or persons.
The compensation model and compensation of the Executive
and Supervisory Boards is presented in the compensation
report, which is included in the review of operations.
In total, the compensation of the Executive Board amounted
to €18,303,000 (previous year: €20,358,000), plus pension
service costs of €725,000 (previous year: €776,000). The Exe-
cutive Board received short-term compensation components
amounting to €15,303,000 for fiscal 2011 (previous year:
€16,608,000). In addition to this, long-term compensation
components of the Beat programme (2011 tranche) in the
amount of €3,000,000 were allocated (€3,750,000 from the
2010 Beat tranche in the previous year).
The Supervisory Board received total compensation of
€2,472,000 (previous year: €3,434,000) in fiscal 2011. Super-
visory Board members also received €192,000 in compensation
from subsidiaries for the exercise of mandates (previous year:
€243,000). The employee representatives on the Supervisory
Board have labour contracts with the respective Group compa-
nies. Remuneration occurs in accordance with the relevant
contractual conditions.
During the period under review, no loans or advances were
granted to members of the Executive or Supervisory Boards. An
advance for travel expenses was granted to one employee rep-
resentative on the Supervisory Board, and a further employee
representative has outstanding loans from the period before his
membership of the Board.
Former members of the Executive Board and their surviving
dependents received €11,832,000 (previous year:
€14,717,000), of which €1,940,000 came from subsidiaries
(previous year: €1,861,000). Of this, €375,000 was related to
long-term incentive remuneration components (previous year:
€1,842,000). As of the balance-sheet date, €128,688,000 (pre-
vious year: €129,692,000) had been accrued for defined bene-
fit obligations to former members of the Executive Board and
their surviving dependents. Of this, €19,473,000 was set aside
at subsidiaries (previous year: €19,369,000).
Information on the members of the Executive and Supervisory
Boards is presented on pages 191 et seqq. of the notes.
(35) Auditor’s fees
RWE recognised the following fees as expenses for the services
rendered by the auditors of the consolidated financial state-
ments, PricewaterhouseCoopers Aktiengesellschaft Wirtschafts-
prüfungsgesellschaft (PwC) and companies belonging to PwC’s
international network:
Auditor’s fees
€ million
2011 2010
Total Of which: Germany
Total Of which: Germany
Audit services 18.3 (9.7) 18.0 (9.1)
Other assurance services 7.9 (7.5) 8.5 (8.3)
Tax services 0.5 (0.2) 0.3 (0.2)
Other services 0.8 (0.4) 0.6 (0.5)
27.5 (17.8) 27.4 (18.1)
notes 189To our investors Review of operations our responsibility
Responsibility statement consolidated financial statements Further information
The fees for audit services primarily contain the fees for the
audit of the consolidated financial statements and for the audit
of the financial statements of RWE AG and its subsidiaries.
Other assurance services include fees for the review of interim
reports, review of the internal controlling system, in particular
the IT systems and due diligence audits, as well as expenses
related to statutory or court ordered requirements. In particu-
lar, the fees for tax services include compensation for consulta-
tion in the preparation of tax returns and review of resolutions
of the tax authorities as well as other national and international
tax-related matters.
Amprion GmbH recognised fees amounting to €0.1 million
(previous year: €0.1 million) in relation to services rendered by
the auditor BDO Deutsche Warentreuhand AG in fiscal 2011
until the time of its sale.
(36) Application of Sec. 264, Para. 3 and Sec. 264b of the
German Commercial Code
In fiscal 2011, the following German subsidiaries made partial
use of the exemption clause included in Sec. 264, Para. 3
and Sec. 264b of the German Commercial Code (HGB):
• BGE Beteiligungs-Gesellschaft für Energieunternehmen mbH,
Essen
• eprimo GmbH, Neu-Isenburg
• GBV Dreizehnte Gesellschaft für Beteiligungsverwaltung
mbH & Co. KG, Gundremmingen
• GBV Fünfte Gesellschaft für Beteiligungsverwaltung mbH,
Essen
• GBV Siebte Gesellschaft für Beteiligungsverwaltung mbH,
Essen
• OIE Aktiengesellschaft, Idar-Oberstein
• Rheinische Baustoffwerke GmbH, Bergheim
• Rhein-Ruhr Verteilnetz GmbH, Wesel
• rhenag Beteiligungs GmbH, Cologne
• RWE Aqua GmbH, Berlin
• RWE Aqua Holdings GmbH, Essen
• RWE Beteiligungsgesellschaft mbH, Essen
• RWE Beteiligungsverwaltung Ausland GmbH, Essen
• RWE Consulting GmbH, Essen
• RWE Dea AG, Hamburg
• RWE Dea North Africa /Middle East GmbH, Hamburg
• RWE Dea Suez GmbH, Hamburg
• RWE Deutschland Aktiengesellschaft, Essen
• RWE Effizienz GmbH, Dortmund
• RWE Energiedienstleistungen GmbH, Dortmund
• RWE FiberNet GmbH, Essen
• RWE Gasspeicher GmbH, Dortmund
• RWE Innogy Brise Windparkbetriebsgesellschaft mbH,
Hannover
• RWE Innogy Cogen GmbH, Dortmund
• RWE Innogy GmbH, Essen
• RWE Innogy Nordost Windparkbetriebsgesellschaft mbH,
Marienfließ
• RWE Innogy Windpower Hannover GmbH, Hanover
• RWE IT GmbH, Essen
• RWE Kundenservice GmbH, Bochum
• RWE Metering GmbH, Essen
• RWE Offshore Logistics Company GmbH, Hamburg
• RWE Power Aktiengesellschaft, Cologne and Essen
• RWE Rheinhessen Beteiligungs GmbH, Essen
• RWE Rhein-Ruhr Netzservice GmbH, Siegen
• RWE RWN Beteiligungsgesellschaft Mitte mbH, Essen
• RWE Service GmbH, Dortmund
• RWE Supply & Trading GmbH, Essen
• RWE Technology GmbH, Essen
• RWE Vertrieb Aktiengesellschaft, Dortmund
• RWE Westfalen-Weser-Ems Netzservice GmbH, Dortmund
• Westfalen-Weser-Ems Verteilnetz GmbH, Recklinghausen
(37) Events after the balance-sheet date
Information on events after the balance-sheet date is presented
in the review of operations.
190 notes RWE Annual Report 2011
(38) Declaration according to Sec. 161 of the German Stock
Corporation Act
The declarations on the German Corporate Governance Code
prescribed by Sec. 161 of the German Stock Corporation Act
(AktG) have been submitted for RWE AG and its publicly traded
German subsidiaries and have been made accessible to the
shareholders on the Internet pages of RWE AG and its publicly
traded German subsidiaries.
Essen, 17 February 2012
The Executive Board
Großmann
PohligFitting Schmitz
BirnbaumTerium
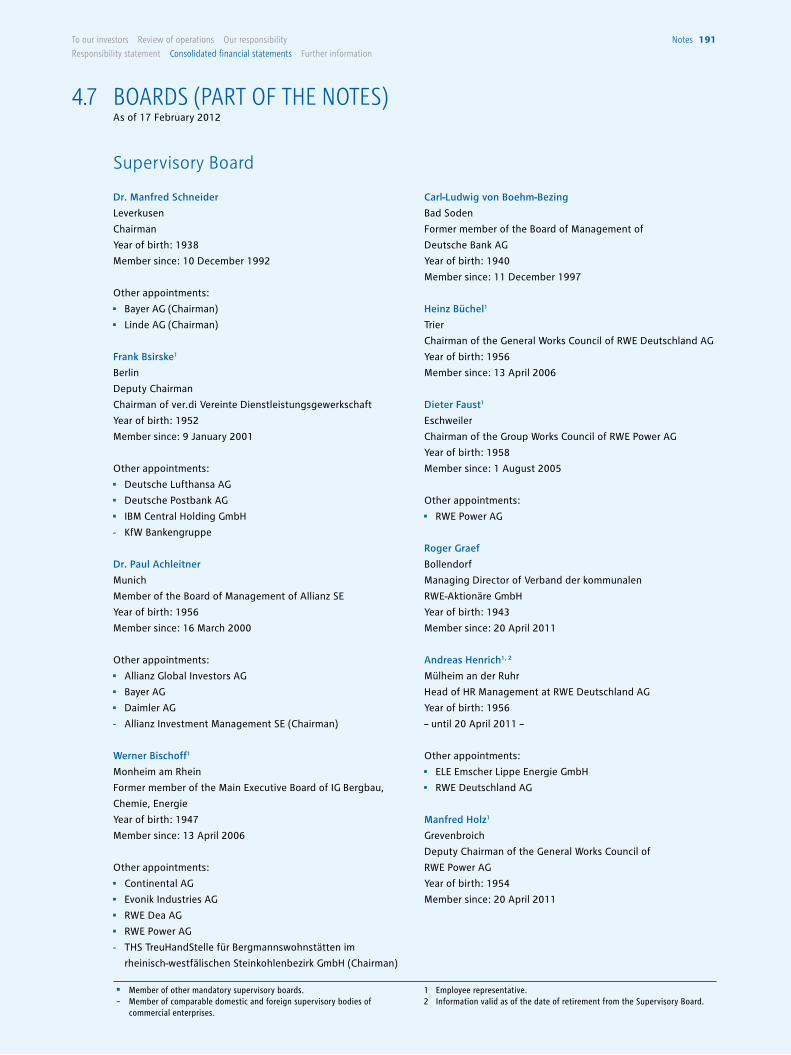
To our investors Review of operations our responsibility
Responsibility statement consolidated financial statements Further information
notes 191
Supervisory Board
Carl-Ludwig von Boehm-Bezing
Bad Soden
Former member of the Board of Management of
Deutsche Bank AG
Year of birth: 1940
Member since: 11 December 1997
Heinz Büchel1
Trier
Chairman of the General Works Council of RWE Deutschland AG
Year of birth: 1956
Member since: 13 April 2006
Dieter Faust1
Eschweiler
Chairman of the Group Works Council of RWE Power AG
Year of birth: 1958
Member since: 1 August 2005
Other appointments:
• RWE Power AG
Roger Graef
Bollendorf
Managing Director of Verband der kommunalen
RWE-Aktionäre GmbH
Year of birth: 1943
Member since: 20 April 2011
Andreas Henrich1, 2
Mülheim an der Ruhr
Head of HR Management at RWE Deutschland AG
Year of birth: 1956
– until 20 April 2011 –
Other appointments:
• ELE Emscher Lippe Energie GmbH
• RWE Deutschland AG
Manfred Holz1
Grevenbroich
Deputy Chairman of the General Works Council of
RWE Power AG
Year of birth: 1954
Member since: 20 April 2011
Dr. Manfred Schneider
Leverkusen
Chairman
Year of birth: 1938
Member since: 10 December 1992
Other appointments:
• Bayer AG (Chairman)
• Linde AG (Chairman)
Frank Bsirske1
Berlin
Deputy Chairman
Chairman of ver.di Vereinte Dienstleistungsgewerkschaft
Year of birth: 1952
Member since: 9 January 2001
Other appointments:
• Deutsche Lufthansa AG
• Deutsche Postbank AG
• IBM Central Holding GmbH
- KfW Bankengruppe
Dr. Paul Achleitner
Munich
Member of the Board of Management of Allianz SE
Year of birth: 1956
Member since: 16 March 2000
Other appointments:
• Allianz Global Investors AG
• Bayer AG
• Daimler AG
- Allianz Investment Management SE (Chairman)
Werner Bischoff1
Monheim am Rhein
Former member of the Main Executive Board of IG Bergbau,
Chemie, Energie
Year of birth: 1947
Member since: 13 April 2006
Other appointments:
• Continental AG
• Evonik Industries AG
• RWE Dea AG
• RWE Power AG
- THS TreuHandStelle für Bergmannswohnstätten im
rheinisch-westfälischen Steinkohlenbezirk GmbH (Chairman)
• Member of other mandatory supervisory boards.- Member of comparable domestic and foreign supervisory bodies of commercial enterprises.
1 Employee representative.2 Information valid as of the date of retirement from the Supervisory Board.
bOardS (parT OF THE NOTES)As of 17 February 2012
4.7
RWE Annual Report 2011192 notes
Dagmar Mühlenfeld
Mülheim an der Ruhr
Mayor of the City of Mülheim an der Ruhr
Year of birth: 1951
Member since: 4 January 2005
Other appointments:
• RW Holding AG
- Beteiligungsholding Mülheim an der Ruhr GmbH
- Flughafen Essen /Mülheim GmbH (Chairwoman)
- medl GmbH (Chairwoman)
- Mülheim & Business GmbH (Chairwoman)
Dr. Wolfgang Reiniger2
Essen
Lawyer
Year of birth: 1944
– until 20 April 2011 –
Günter Reppien1, 2
Lingen
Former Chairman of the General Works Council
of RWE Power AG
Year of birth: 1951
– until 20 April 2011 –
Other appointments:
- Stadtwerke Lingen GmbH
Dagmar Schmeer1
Saarbrücken
Chairwoman of the Works Council of VSE AG
Year of birth: 1967
Member since: 9 August 2006
Other appointments:
• VSE AG
Prof. Dr.-Ing. Dr.-Ing. E.h. Dr. h.c. Ekkehard D. Schulz
Krefeld
Former member of the Supervisory Board of ThyssenKrupp AG
Year of birth: 1941
Member since: 13 April 2006
Other appointments:
• AXA Konzern AG
• Bayer AG
• MAN SE
Frithjof Kühn
Sankt Augustin
Chief Administrative Officer, Rhein Sieg Rural District
Year of birth: 1943
Member since: 1 February 2010
Other appointments:
• RW Holding AG (Chairman)
- Elektrische Bahnen der Stadt Bonn und des
Rhein-Sieg-Kreises oHG
- Energie- und Wasserversorgung Bonn/Rhein-Sieg GmbH
- Gemeinnützige Wohnungsbaugesellschaft für den
Rhein-Sieg-Kreis GmbH
- Kreissparkasse Köln
- Rhein-Sieg-Abfallwirtschaftsgesellschaft mbH
- Rhein-Sieg-Verkehrsgesellschaft mbH
Hans Peter Lafos1
Bergheim
Regional District Sector Head, Utilities and Disposal (Sector 2),
ver.di Vereinte Dienstleistungsgewerkschaft, District of NRW
Year of birth: 1954
Member since: 28 October 2009
Other appointments:
• GEW Köln AG
• RWE Power AG
• RWE Vertrieb AG
Dr. Gerhard Langemeyer2
Dortmund
Former Mayor of the City of Dortmund
Year of birth: 1944
– until 20 April 2011 –
Christine Merkamp1
Cologne
Head of Controlling, Upgrading, RWE Power AG
Year of birth: 1967
Member since: 20 April 2011
• Member of other mandatory supervisory boards.- Member of comparable domestic and foreign supervisory bodies of commercial enterprises.
1 Employee representative.2 Information valid as of the date of retirement from the Supervisory Board.
notes 193To our investors Review of operations our responsibility
Responsibility statement consolidated financial statements Further information
Supervisory Board Committees
• Member of other mandatory supervisory boards.- Member of comparable domestic and foreign supervisory bodies of commercial enterprises.
1 Employee representative.
Executive Committee of the Supervisory Board
Dr. Manfred Schneider (Chairman)
Frank Bsirske
Dr. Paul Achleitner
Heinz Büchel – until 20 April 2011 –
Dieter Faust – until 20 April 2011 –
Manfred Holz – since 20 April 2011 –
Dagmar Mühlenfeld
Dagmar Schmeer
Prof. Dr.-Ing. Dr.-Ing. E.h. Dr. h.c. Ekkehard D. Schulz
Manfred Weber – since 20 April 2011 –
Mediation Committee in accordance with Sec. 27 Para. 3 of
the German Co-Determination Act (MitbestG)
Dr. Manfred Schneider (Chairman)
Frank Bsirske
Werner Bischoff
Prof. Dr.-Ing. Dr.-Ing. E.h. Dr. h.c. Ekkehard D. Schulz
Personnel Affairs Committee
Dr. Manfred Schneider (Chairman)
Frank Bsirske
Dr. Paul Achleitner
Heinz Büchel – since 20 April 2011 –
Frithjof Kühn
Günter Reppien – until 20 April 2011 –
Uwe Tigges
Audit Committee
Carl-Ludwig von Boehm-Bezing (Chairman)
Werner Bischoff
Dieter Faust – since 20 April 2011 –
Dr. Gerhard Langemeyer – until 20 April 2011 –
Günter Reppien – until 20 April 2011 –
Prof. Dr.-Ing. Dr.-Ing. E.h. Dr. h.c. Ekkehard D. Schulz
Ullrich Sierau – since 20 April 2011 –
Uwe Tigges
Nomination Committee
Dr. Manfred Schneider (Chairman)
Dr. Paul Achleitner
Frithjof Kühn
Dr. Wolfgang Schüssel
Vienna
Former Federal Chancellor of Austria
Year of birth: 1945
Member since: 1 March 2010
Other appointments:
- Bertelsmann Stiftung
Ullrich Sierau
Dortmund
Mayor of the City of Dortmund
Year of birth: 1956
Member since: 20 April 2011
Other appointments:
• Dortmunder Stadtwerke AG (Chairman)
- Emschergenossenschaft
- KEB Holding AG (Chairman)
- Klinikum Dortmund gGmbH (Chairman)
- KSBG Kommunale Verwaltungsgesellschaft GmbH
- Medicos Holding GmbH & Co. KG
- Schüchtermann-Schiller‘sche Kliniken
Bad Rothenfelde GmbH & Co. KG
- Sparkasse Dortmund (Chairman)
Uwe Tigges1
Bochum
Chairman of the Group Works Council of RWE AG
Year of birth: 1960
Member since: 1 December 2003
Other appointments:
• RWE Vertrieb AG
Manfred Weber1
Wietze
Chairman of the General Works Council of RWE Dea AG
Year of birth: 1947
Member since: 1 December 2008
Other appointments:
• RWE Dea AG
Dr. Dieter Zetsche
Stuttgart
Chairman of the Executive Board of Daimler AG
Year of birth: 1953
Member since: 16 July 2009
194 notes RWE Annual Report 2011
Executive Board
• Member of other mandatory supervisory boards.- Member of comparable domestic and foreign supervisory bodies of commercial enterprises.
Peter Terium
Deputy Chairman of the Executive Board of RWE AG,
appointed until 30 June 2012,
appointed as Chief Executive Officer of RWE AG from
1 July 2012 until 31 August 2016
Born in 1963 in Nederweert, Netherlands, trained as a
chartered accountant at Nederlands Institut voor Register-
accountants; Audit Supervisor at KPMG from 1985 to 1990;
various positions at Schmalbach-Lubeca AG from 1990 to 2002;
joined as Head of Group Controlling at RWE AG in 2003;
Chief Executive Officer of RWE Supply & Trading GmbH from
2005 to 2009; CEO of Essent N.V. from 2009 to 2011; member
of the Executive Board and Deputy Chairman of the Board of
RWE AG since 1 September 2011.
Group-level responsibilities: Public Affairs/Energy Politics,
Legal/Board Affairs, Corporate Development & Strategy, Audit,
and Corporate Responsibility/Environmental Protection
Other appointments:
• RWE IT GmbH (Chairman)
• RWE Supply & Trading GmbH
- NET4GAS, s.r.o.
- N.V. KEMA
Dr. Jürgen Großmann
President and CEO of RWE AG,
appointed until 30 June 2012
Born in 1952 in Mülheim an der Ruhr; studied ferrous
metallurgy and economics; doctorate in ferrous metallurgy;
active within the Klöckner Group from 1980 to 1993, exit-
ing as member of the Executive Board of Klöckner-Werke AG;
acquired Georgsmarienhütte in 1993; Owner and Managing
Director of Georgsmarienhütte Holding GmbH from 1993 to
2006; joined RWE AG as President and CEO with effect from
1 October 2007.
Group-level responsibilities: Compliance & Management Board
Office, Communication, Executive Management
Other appointments:
• BATIG Gesellschaft für Beteiligungen mbH
• British American Tobacco (Industrie) GmbH
• British American Tobacco (Germany) GmbH
• Deutsche Bahn AG
• SURTECO SE (Chairman)
- Hanover Acceptances Limited
notes 195To our investors Review of operations our responsibility
Responsibility statement consolidated financial statements Further information
Dr. Rolf Pohlig
Member of the Executive Board of RWE AG,
appointed until 31 December 2012
Born in 1952 in Solingen; doctorate in economics; Executive
Vice-President Finance and Accounting of VEBA AG from 1993
to 2000; Executive Vice-President Mergers & Acquisitions of
E.ON AG from 2000 to 2006; member of the Executive Board
of RWE AG since January 2007 and Chief Financial Officer of
RWE AG since May 2007.
Group-level responsibilities: Controlling, Finance, Investor
Relations, Accounting and Tax
Other appointments:
• RWE Dea AG
• RWE Pensionsfonds AG (Chairman)
• RWE Power AG
• RWE Deutschland AG
- Essent N.V.
- RWE Transgas, a.s.
Dr. Rolf Martin Schmitz
Member of the Executive Board of RWE AG,
appointed until 30 April 2014
Born in 1957 in Mönchengladbach; doctorate in engineering;
i.a. in charge of corporate development and economic policy
at VEBA AG from 1988 to 1998; Executive Vice-President of
rhenag Rheinische Energie AG from 1998 to 2001; Member
of the Board of Management of Thüga AG from 2000 to
2004; Chairman of the Board of Directors of E.ON Kraftwerke
GmbH from 2004 to 2005; Chairman of the Executive Board of
RheinEnergie AG and Managing Director of Stadtwerke Köln
from 2006 to 2009; Chief Operating Officer National of RWE AG
from May 2009 to September 2010; since 1 October 2010 Chief
Operating Officer of RWE AG.
Group-level responsibilities: Participation Management,
Municipalities and Generation/Networks/Sales Coordination
Other appointments:
• RWE Power AG (Chairman)
• RWE Deutschland AG (Chairman)
• Süwag Energie AG (Chairman)
- Essent N.V.
- KELAG-Kärntner Elektrizitäts-AG
- RWE Transgas, a.s. (Chairman)
- RWE Turkey Holding A.S.
Dr. Leonhard Birnbaum
Member of the Executive Board of RWE AG,
appointed until 30 September 2013
Born in 1967 in Ludwigshafen on the Rhine; doctorate in
chemical engineering; consultant at McKinsey & Company Inc.
from 1996 to 2008; promoted to partner (principal) in 2000
and to senior partner (director) at McKinsey in 2006, exiting as
member of McKinsey’s global management team for the energy
sector; joined RWE AG as Head of Corporate Strategy and
Business Development with effect from 7 April 2008; member
of the Executive Board since 1 October 2008; Chief Strategy
Officer of RWE AG from January 2009 to September 2010;
Chief Commercial Officer of RWE AG since 1 October 2010.
Group-level responsibilities: Commodity Management, Mergers
& Acquisitions, Research & Development
Other appointments:
• RWE Dea AG (Chairman)
• RWE Supply & Trading GmbH (Chairman)
- RWE Turkey Holding A.S.
Alwin Fitting
Member of the Executive Board of RWE AG,
appointed until 31 March 2013
Born in 1953 in Westhofen (Rhine-Hesse); joined the RWE
Group in 1974; trained master electrician; Executive Board
member and Labour Director of RWE Power AG from October
2000 to July 2005; member of the Executive Board and Labour
Director of RWE AG since August 2005.
Group-level responsibilities: Security, HR Management & Labour
Law, Diversity Office
Other appointments:
• Amprion GmbH
• RWE Pensionsfonds AG
• RWE Service GmbH (Chairman)
• Member of other mandatory supervisory boards.- Member of comparable domestic and foreign supervisory bodies of commercial enterprises.
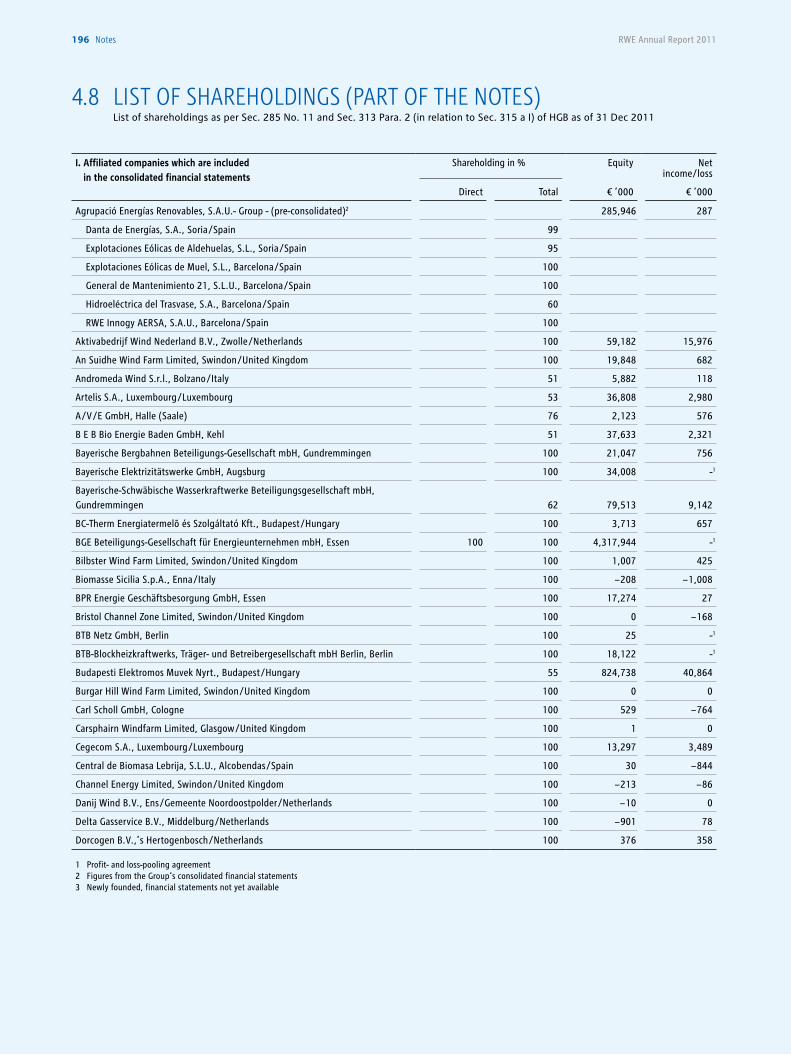
RWE Annual Report 2011196 notes
List of shareholdings as per Sec. 285 No. 11 and Sec. 313 Para. 2 (in relation to Sec. 315 a I) of HGB as of 31 Dec 2011
4.8 liST OF SHarEHOldiNgS (parT OF THE NOTES)
I. Affiliated companies which are included in the consolidated financial statements
Shareholding in % Equity Net income/loss
Direct Total € ’000 € ’000
Agrupació Energías Renovables, S.A.U.- Group - (pre-consolidated)2 285,946 287
Danta de Energías, S.A., Soria /Spain 99
Explotaciones Eólicas de Aldehuelas, S.L., Soria /Spain 95
Explotaciones Eólicas de Muel, S.L., Barcelona /Spain 100
General de Mantenimiento 21, S.L.U., Barcelona /Spain 100
Hidroeléctrica del Trasvase, S.A., Barcelona /Spain 60
RWE Innogy AERSA, S.A.U., Barcelona /Spain 100
Aktivabedrijf Wind Nederland B.V., Zwolle /Netherlands 100 59,182 15,976
An Suidhe Wind Farm Limited, Swindon /United Kingdom 100 19,848 682
Andromeda Wind S.r.l., Bolzano /Italy 51 5,882 118
Artelis S.A., Luxembourg /Luxembourg 53 36,808 2,980
A /V /E GmbH, Halle (Saale) 76 2,123 576
B E B Bio Energie Baden GmbH, Kehl 51 37,633 2,321
Bayerische Bergbahnen Beteiligungs-Gesellschaft mbH, Gundremmingen 100 21,047 756
Bayerische Elektrizitätswerke GmbH, Augsburg 100 34,008 -1
Bayerische-Schwäbische Wasserkraftwerke Beteiligungsgesellschaft mbH, Gundremmingen 62 79,513 9,142
BC-Therm Energiatermelõ és Szolgáltató Kft., Budapest /Hungary 100 3,713 657
BGE Beteiligungs-Gesellschaft für Energieunternehmen mbH, Essen 100 100 4,317,944 -1
Bilbster Wind Farm Limited, Swindon /United Kingdom 100 1,007 425
Biomasse Sicilia S.p.A., Enna /Italy 100 − 208 − 1,008
BPR Energie Geschäftsbesorgung GmbH, Essen 100 17,274 27
Bristol Channel Zone Limited, Swindon /United Kingdom 100 0 − 168
BTB Netz GmbH, Berlin 100 25 -1
BTB-Blockheizkraftwerks, Träger- und Betreibergesellschaft mbH Berlin, Berlin 100 18,122 -1
Budapesti Elektromos Muvek Nyrt., Budapest /Hungary 55 824,738 40,864
Burgar Hill Wind Farm Limited, Swindon /United Kingdom 100 0 0
Carl Scholl GmbH, Cologne 100 529 − 764
Carsphairn Windfarm Limited, Glasgow /United Kingdom 100 1 0
Cegecom S.A., Luxembourg /Luxembourg 100 13,297 3,489
Central de Biomasa Lebrija, S.L.U., Alcobendas /Spain 100 30 − 844
Channel Energy Limited, Swindon /United Kingdom 100 − 213 − 86
Danij Wind B.V., Ens /Gemeente Noordoostpolder /Netherlands 100 − 10 0
Delta Gasservice B.V., Middelburg /Netherlands 100 − 901 78
Dorcogen B.V.,’s Hertogenbosch /Netherlands 100 376 358
1 Profit- and loss-pooling agreement2 Figures from the Group‘s consolidated financial statements3 Newly founded, financial statements not yet available
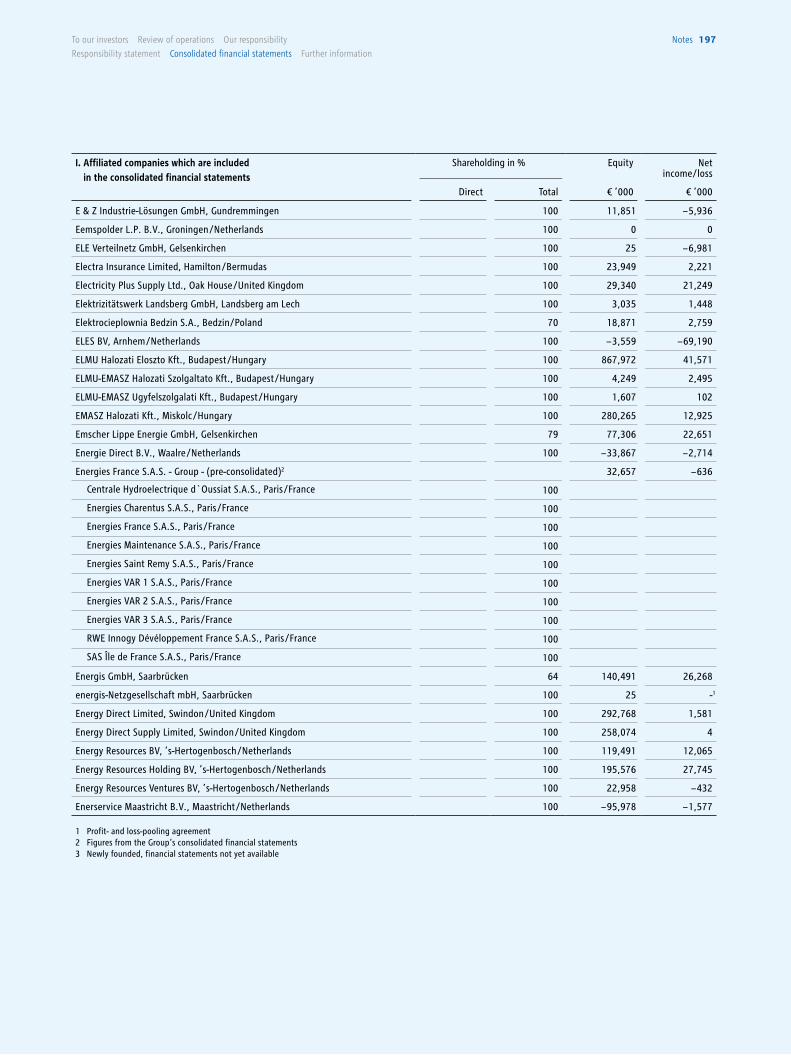
To our investors Review of operations our responsibility
Responsibility statement consolidated financial statements Further information
notes 197
I. Affiliated companies which are included in the consolidated financial statements
Shareholding in % Equity Net income/loss
Direct Total € ’000 € ’000
E & Z Industrie-Lösungen GmbH, Gundremmingen 100 11,851 − 5,936
Eemspolder L.P. B.V., Groningen /Netherlands 100 0 0
ELE Verteilnetz GmbH, Gelsenkirchen 100 25 − 6,981
Electra Insurance Limited, Hamilton /Bermudas 100 23,949 2,221
Electricity Plus Supply Ltd., Oak House /United Kingdom 100 29,340 21,249
Elektrizitätswerk Landsberg GmbH, Landsberg am Lech 100 3,035 1,448
Elektrocieplownia Bedzin S.A., Bedzin/Poland 70 18,871 2,759
ELES BV, Arnhem /Netherlands 100 − 3,559 − 69,190
ELMU Halozati Eloszto Kft., Budapest /Hungary 100 867,972 41,571
ELMU-EMASZ Halozati Szolgaltato Kft., Budapest /Hungary 100 4,249 2,495
ELMU-EMASZ Ugyfelszolgalati Kft., Budapest /Hungary 100 1,607 102
EMASZ Halozati Kft., Miskolc /Hungary 100 280,265 12,925
Emscher Lippe Energie GmbH, Gelsenkirchen 79 77,306 22,651
Energie Direct B.V., Waalre /Netherlands 100 − 33,867 − 2,714
Energies France S.A.S. - Group - (pre-consolidated)2 32,657 − 636
Centrale Hydroelectrique d`Oussiat S.A.S., Paris /France 100
Energies Charentus S.A.S., Paris /France 100
Energies France S.A.S., Paris /France 100
Energies Maintenance S.A.S., Paris /France 100
Energies Saint Remy S.A.S., Paris /France 100
Energies VAR 1 S.A.S., Paris /France 100
Energies VAR 2 S.A.S., Paris /France 100
Energies VAR 3 S.A.S., Paris /France 100
RWE Innogy Dévéloppement France S.A.S., Paris /France 100
SAS Île de France S.A.S., Paris /France 100
Energis GmbH, Saarbrücken 64 140,491 26,268
energis-Netzgesellschaft mbH, Saarbrücken 100 25 -1
Energy Direct Limited, Swindon /United Kingdom 100 292,768 1,581
Energy Direct Supply Limited, Swindon /United Kingdom 100 258,074 4
Energy Resources BV, ’s-Hertogenbosch /Netherlands 100 119,491 12,065
Energy Resources Holding BV, ’s-Hertogenbosch /Netherlands 100 195,576 27,745
Energy Resources Ventures BV, ’s-Hertogenbosch /Netherlands 100 22,958 − 432
Enerservice Maastricht B.V., Maastricht /Netherlands 100 − 95,978 − 1,577
1 Profit- and loss-pooling agreement2 Figures from the Group‘s consolidated financial statements3 Newly founded, financial statements not yet available
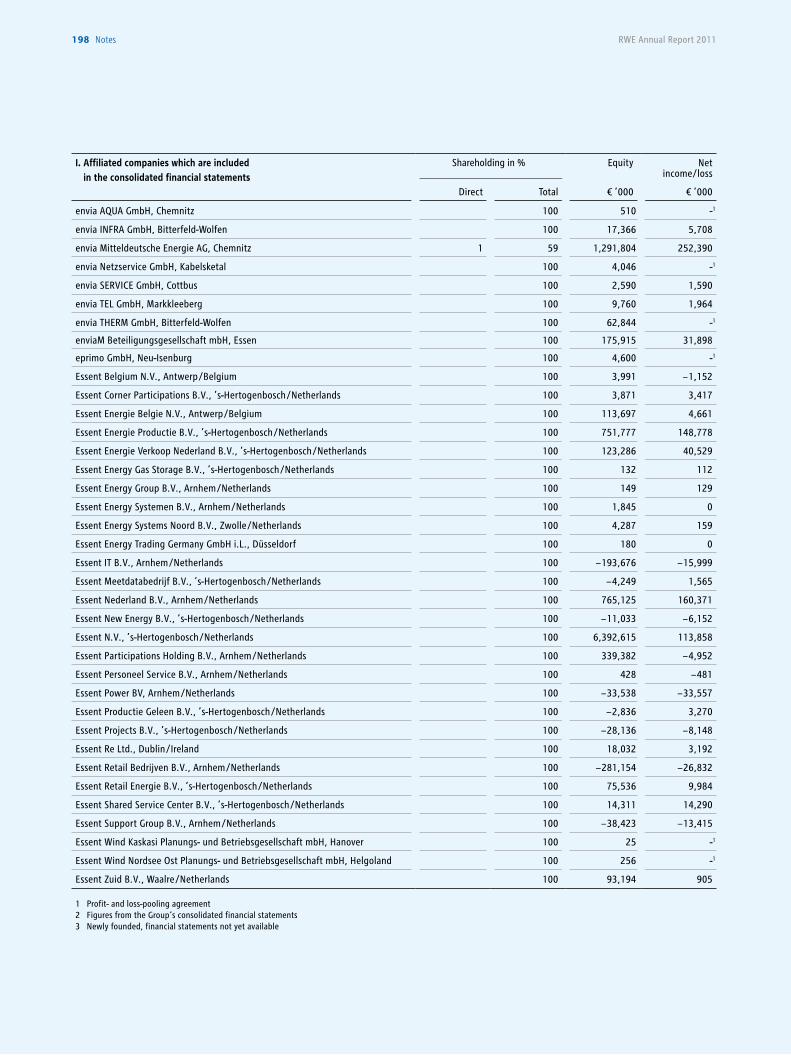
RWE Annual Report 2011198 notes
I. Affiliated companies which are included in the consolidated financial statements
Shareholding in % Equity Net income/loss
Direct Total € ’000 € ’000
envia AQUA GmbH, Chemnitz 100 510 -1
envia INFRA GmbH, Bitterfeld-Wolfen 100 17,366 5,708
envia Mitteldeutsche Energie AG, Chemnitz 1 59 1,291,804 252,390
envia Netzservice GmbH, Kabelsketal 100 4,046 -1
envia SERVICE GmbH, Cottbus 100 2,590 1,590
envia TEL GmbH, Markkleeberg 100 9,760 1,964
envia THERM GmbH, Bitterfeld-Wolfen 100 62,844 -1
enviaM Beteiligungsgesellschaft mbH, Essen 100 175,915 31,898
eprimo GmbH, Neu-Isenburg 100 4,600 -1
Essent Belgium N.V., Antwerp /Belgium 100 3,991 − 1,152
Essent Corner Participations B.V., ’s-Hertogenbosch /Netherlands 100 3,871 3,417
Essent Energie Belgie N.V., Antwerp /Belgium 100 113,697 4,661
Essent Energie Productie B.V., ’s-Hertogenbosch /Netherlands 100 751,777 148,778
Essent Energie Verkoop Nederland B.V., ’s-Hertogenbosch /Netherlands 100 123,286 40,529
Essent Energy Gas Storage B.V., ’s-Hertogenbosch /Netherlands 100 132 112
Essent Energy Group B.V., Arnhem /Netherlands 100 149 129
Essent Energy Systemen B.V., Arnhem /Netherlands 100 1,845 0
Essent Energy Systems Noord B.V., Zwolle /Netherlands 100 4,287 159
Essent Energy Trading Germany GmbH i.L., Düsseldorf 100 180 0
Essent IT B.V., Arnhem /Netherlands 100 − 193,676 − 15,999
Essent Meetdatabedrijf B.V., ’s-Hertogenbosch /Netherlands 100 − 4,249 1,565
Essent Nederland B.V., Arnhem /Netherlands 100 765,125 160,371
Essent New Energy B.V., ’s-Hertogenbosch /Netherlands 100 − 11,033 − 6,152
Essent N.V., ’s-Hertogenbosch /Netherlands 100 6,392,615 113,858
Essent Participations Holding B.V., Arnhem /Netherlands 100 339,382 − 4,952
Essent Personeel Service B.V., Arnhem /Netherlands 100 428 − 481
Essent Power BV, Arnhem /Netherlands 100 − 33,538 − 33,557
Essent Productie Geleen B.V., ’s-Hertogenbosch /Netherlands 100 − 2,836 3,270
Essent Projects B.V., ’s-Hertogenbosch /Netherlands 100 − 28,136 − 8,148
Essent Re Ltd., Dublin /Ireland 100 18,032 3,192
Essent Retail Bedrijven B.V., Arnhem /Netherlands 100 − 281,154 − 26,832
Essent Retail Energie B.V., ’s-Hertogenbosch /Netherlands 100 75,536 9,984
Essent Shared Service Center B.V., ’s-Hertogenbosch /Netherlands 100 14,311 14,290
Essent Support Group B.V., Arnhem /Netherlands 100 − 38,423 − 13,415
Essent Wind Kaskasi Planungs- und Betriebsgesellschaft mbH, Hanover 100 25 -1
Essent Wind Nordsee Ost Planungs- und Betriebsgesellschaft mbH, Helgoland 100 256 -1
Essent Zuid B.V., Waalre /Netherlands 100 93,194 905
1 Profit- and loss-pooling agreement2 Figures from the Group‘s consolidated financial statements3 Newly founded, financial statements not yet available
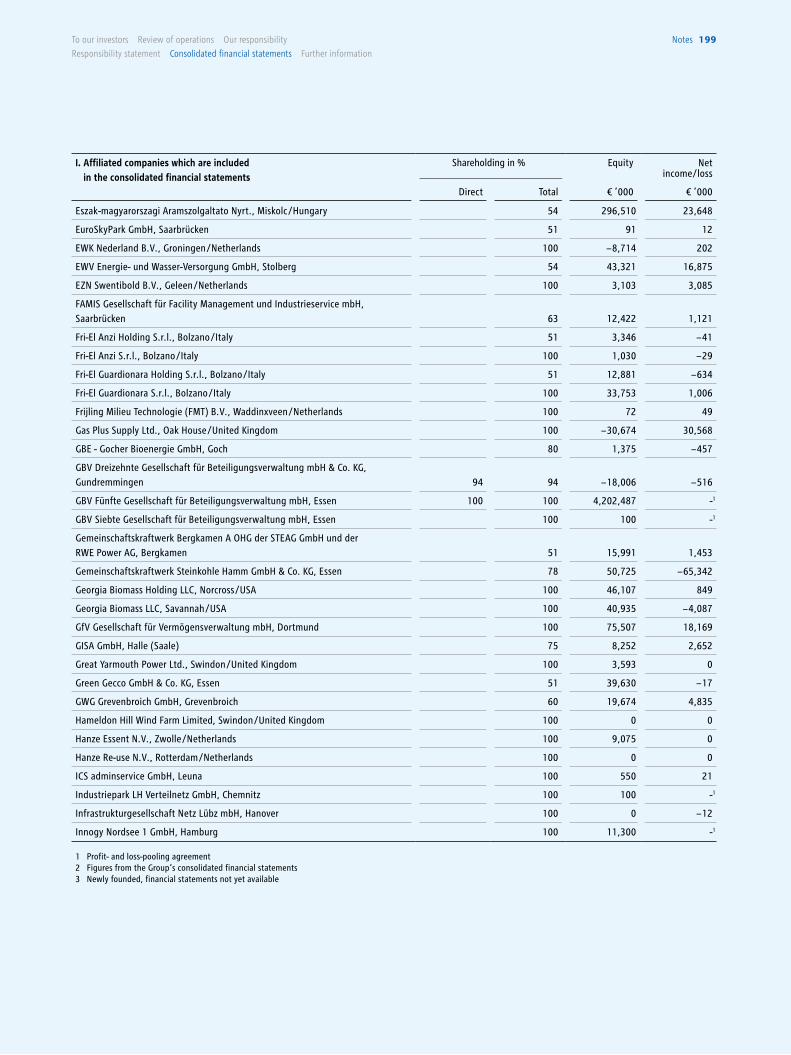
To our investors Review of operations our responsibility
Responsibility statement consolidated financial statements Further information
notes 199
I. Affiliated companies which are included in the consolidated financial statements
Shareholding in % Equity Net income/loss
Direct Total € ’000 € ’000
Eszak-magyarorszagi Aramszolgaltato Nyrt., Miskolc /Hungary 54 296,510 23,648
EuroSkyPark GmbH, Saarbrücken 51 91 12
EWK Nederland B.V., Groningen /Netherlands 100 − 8,714 202
EWV Energie- und Wasser-Versorgung GmbH, Stolberg 54 43,321 16,875
EZN Swentibold B.V., Geleen /Netherlands 100 3,103 3,085
FAMIS Gesellschaft für Facility Management und Industrieservice mbH, Saarbrücken 63 12,422 1,121
Fri-El Anzi Holding S.r.l., Bolzano /Italy 51 3,346 − 41
Fri-El Anzi S.r.l., Bolzano /Italy 100 1,030 − 29
Fri-El Guardionara Holding S.r.l., Bolzano /Italy 51 12,881 − 634
Fri-El Guardionara S.r.l., Bolzano /Italy 100 33,753 1,006
Frijling Milieu Technologie (FMT) B.V., Waddinxveen /Netherlands 100 72 49
Gas Plus Supply Ltd., Oak House /United Kingdom 100 − 30,674 30,568
GBE - Gocher Bioenergie GmbH, Goch 80 1,375 − 457
GBV Dreizehnte Gesellschaft für Beteiligungsverwaltung mbH & Co. KG, Gundremmingen 94 94 − 18,006 − 516
GBV Fünfte Gesellschaft für Beteiligungsverwaltung mbH, Essen 100 100 4,202,487 -1
GBV Siebte Gesellschaft für Beteiligungsverwaltung mbH, Essen 100 100 -1
Gemeinschaftskraftwerk Bergkamen A OHG der STEAG GmbH und der RWE Power AG, Bergkamen 51 15,991 1,453
Gemeinschaftskraftwerk Steinkohle Hamm GmbH & Co. KG, Essen 78 50,725 − 65,342
Georgia Biomass Holding LLC, Norcross /USA 100 46,107 849
Georgia Biomass LLC, Savannah /USA 100 40,935 − 4,087
GfV Gesellschaft für Vermögensverwaltung mbH, Dortmund 100 75,507 18,169
GISA GmbH, Halle (Saale) 75 8,252 2,652
Great Yarmouth Power Ltd., Swindon /United Kingdom 100 3,593 0
Green Gecco GmbH & Co. KG, Essen 51 39,630 − 17
GWG Grevenbroich GmbH, Grevenbroich 60 19,674 4,835
Hameldon Hill Wind Farm Limited, Swindon /United Kingdom 100 0 0
Hanze Essent N.V., Zwolle /Netherlands 100 9,075 0
Hanze Re-use N.V., Rotterdam /Netherlands 100 0 0
ICS adminservice GmbH, Leuna 100 550 21
Industriepark LH Verteilnetz GmbH, Chemnitz 100 100 -1
Infrastrukturgesellschaft Netz Lübz mbH, Hanover 100 0 − 12
Innogy Nordsee 1 GmbH, Hamburg 100 11,300 -1
1 Profit- and loss-pooling agreement2 Figures from the Group‘s consolidated financial statements3 Newly founded, financial statements not yet available
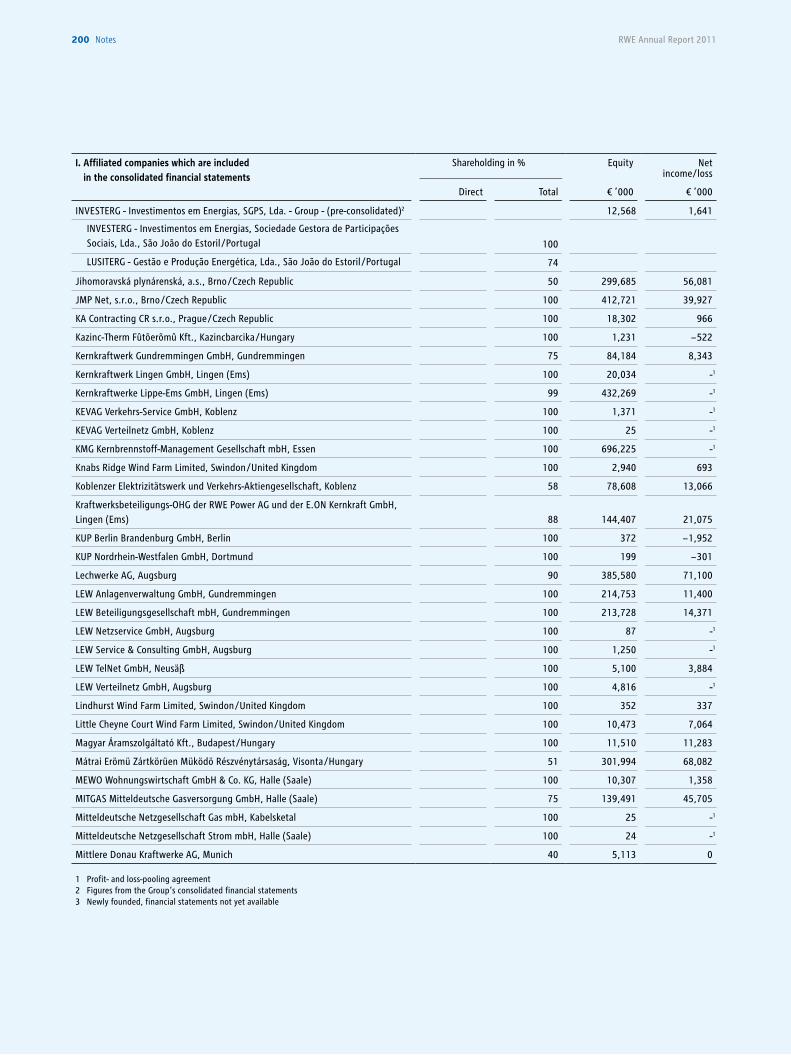
RWE Annual Report 2011200 notes
I. Affiliated companies which are included in the consolidated financial statements
Shareholding in % Equity Net income/loss
Direct Total € ’000 € ’000
INVESTERG - Investimentos em Energias, SGPS, Lda. - Group - (pre-consolidated)2 12,568 1,641
INVESTERG - Investimentos em Energias, Sociedade Gestora de Participações Sociais, Lda., São João do Estoril /Portugal 100
LUSITERG - Gestão e Produção Energética, Lda., São João do Estoril /Portugal 74
Jihomoravská plynárenská, a.s., Brno /Czech Republic 50 299,685 56,081
JMP Net, s.r.o., Brno /Czech Republic 100 412,721 39,927
KA Contracting CR s.r.o., Prague /Czech Republic 100 18,302 966
Kazinc-Therm Fûtõerõmû Kft., Kazincbarcika /Hungary 100 1,231 − 522
Kernkraftwerk Gundremmingen GmbH, Gundremmingen 75 84,184 8,343
Kernkraftwerk Lingen GmbH, Lingen (Ems) 100 20,034 -1
Kernkraftwerke Lippe-Ems GmbH, Lingen (Ems) 99 432,269 -1
KEVAG Verkehrs-Service GmbH, Koblenz 100 1,371 -1
KEVAG Verteilnetz GmbH, Koblenz 100 25 -1
KMG Kernbrennstoff-Management Gesellschaft mbH, Essen 100 696,225 -1
Knabs Ridge Wind Farm Limited, Swindon /United Kingdom 100 2,940 693
Koblenzer Elektrizitätswerk und Verkehrs-Aktiengesellschaft, Koblenz 58 78,608 13,066
Kraftwerksbeteiligungs-OHG der RWE Power AG und der E.ON Kernkraft GmbH, Lingen (Ems) 88 144,407 21,075
KUP Berlin Brandenburg GmbH, Berlin 100 372 − 1,952
KUP Nordrhein-Westfalen GmbH, Dortmund 100 199 − 301
Lechwerke AG, Augsburg 90 385,580 71,100
LEW Anlagenverwaltung GmbH, Gundremmingen 100 214,753 11,400
LEW Beteiligungsgesellschaft mbH, Gundremmingen 100 213,728 14,371
LEW Netzservice GmbH, Augsburg 100 87 -1
LEW Service & Consulting GmbH, Augsburg 100 1,250 -1
LEW TelNet GmbH, Neusäß 100 5,100 3,884
LEW Verteilnetz GmbH, Augsburg 100 4,816 -1
Lindhurst Wind Farm Limited, Swindon /United Kingdom 100 352 337
Little Cheyne Court Wind Farm Limited, Swindon /United Kingdom 100 10,473 7,064
Magyar Áramszolgáltató Kft., Budapest /Hungary 100 11,510 11,283
Mátrai Erömü Zártkörüen Müködö Részvénytársaság, Visonta /Hungary 51 301,994 68,082
MEWO Wohnungswirtschaft GmbH & Co. KG, Halle (Saale) 100 10,307 1,358
MITGAS Mitteldeutsche Gasversorgung GmbH, Halle (Saale) 75 139,491 45,705
Mitteldeutsche Netzgesellschaft Gas mbH, Kabelsketal 100 25 -1
Mitteldeutsche Netzgesellschaft Strom mbH, Halle (Saale) 100 24 -1
Mittlere Donau Kraftwerke AG, Munich 40 5,113 0
1 Profit- and loss-pooling agreement2 Figures from the Group‘s consolidated financial statements3 Newly founded, financial statements not yet available
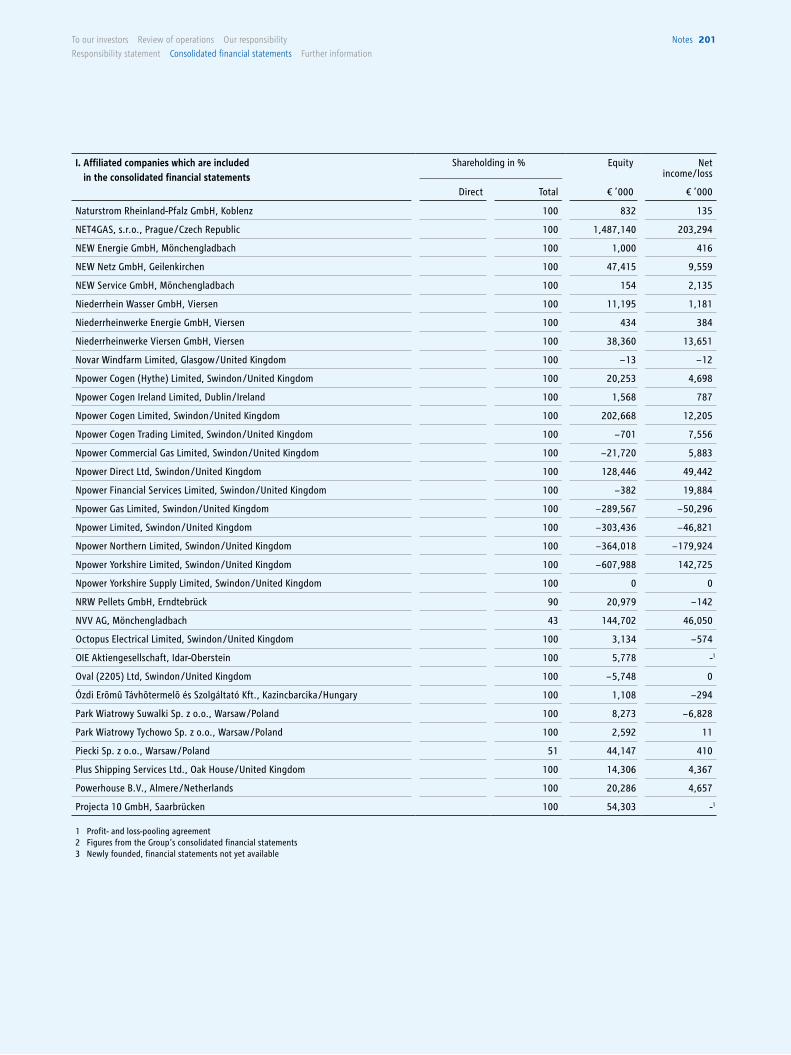
To our investors Review of operations our responsibility
Responsibility statement consolidated financial statements Further information
notes 201
I. Affiliated companies which are included in the consolidated financial statements
Shareholding in % Equity Net income/loss
Direct Total € ’000 € ’000
Naturstrom Rheinland-Pfalz GmbH, Koblenz 100 832 135
NET4GAS, s.r.o., Prague /Czech Republic 100 1,487,140 203,294
NEW Energie GmbH, Mönchengladbach 100 1,000 416
NEW Netz GmbH, Geilenkirchen 100 47,415 9,559
NEW Service GmbH, Mönchengladbach 100 154 2,135
Niederrhein Wasser GmbH, Viersen 100 11,195 1,181
Niederrheinwerke Energie GmbH, Viersen 100 434 384
Niederrheinwerke Viersen GmbH, Viersen 100 38,360 13,651
Novar Windfarm Limited, Glasgow /United Kingdom 100 − 13 − 12
Npower Cogen (Hythe) Limited, Swindon /United Kingdom 100 20,253 4,698
Npower Cogen Ireland Limited, Dublin /Ireland 100 1,568 787
Npower Cogen Limited, Swindon /United Kingdom 100 202,668 12,205
Npower Cogen Trading Limited, Swindon /United Kingdom 100 − 701 7,556
Npower Commercial Gas Limited, Swindon /United Kingdom 100 − 21,720 5,883
Npower Direct Ltd, Swindon /United Kingdom 100 128,446 49,442
Npower Financial Services Limited, Swindon /United Kingdom 100 − 382 19,884
Npower Gas Limited, Swindon /United Kingdom 100 − 289,567 − 50,296
Npower Limited, Swindon /United Kingdom 100 − 303,436 − 46,821
Npower Northern Limited, Swindon /United Kingdom 100 − 364,018 − 179,924
Npower Yorkshire Limited, Swindon /United Kingdom 100 − 607,988 142,725
Npower Yorkshire Supply Limited, Swindon /United Kingdom 100 0 0
NRW Pellets GmbH, Erndtebrück 90 20,979 − 142
NVV AG, Mönchengladbach 43 144,702 46,050
Octopus Electrical Limited, Swindon /United Kingdom 100 3,134 − 574
OIE Aktiengesellschaft, Idar-Oberstein 100 5,778 -1
Oval (2205) Ltd, Swindon /United Kingdom 100 − 5,748 0
Ózdi Erõmû Távhõtermelõ és Szolgáltató Kft., Kazincbarcika /Hungary 100 1,108 − 294
Park Wiatrowy Suwalki Sp. z o.o., Warsaw /Poland 100 8,273 − 6,828
Park Wiatrowy Tychowo Sp. z o.o., Warsaw /Poland 100 2,592 11
Piecki Sp. z o.o., Warsaw /Poland 51 44,147 410
Plus Shipping Services Ltd., Oak House /United Kingdom 100 14,306 4,367
Powerhouse B.V., Almere /Netherlands 100 20,286 4,657
Projecta 10 GmbH, Saarbrücken 100 54,303 -1
1 Profit- and loss-pooling agreement2 Figures from the Group‘s consolidated financial statements3 Newly founded, financial statements not yet available
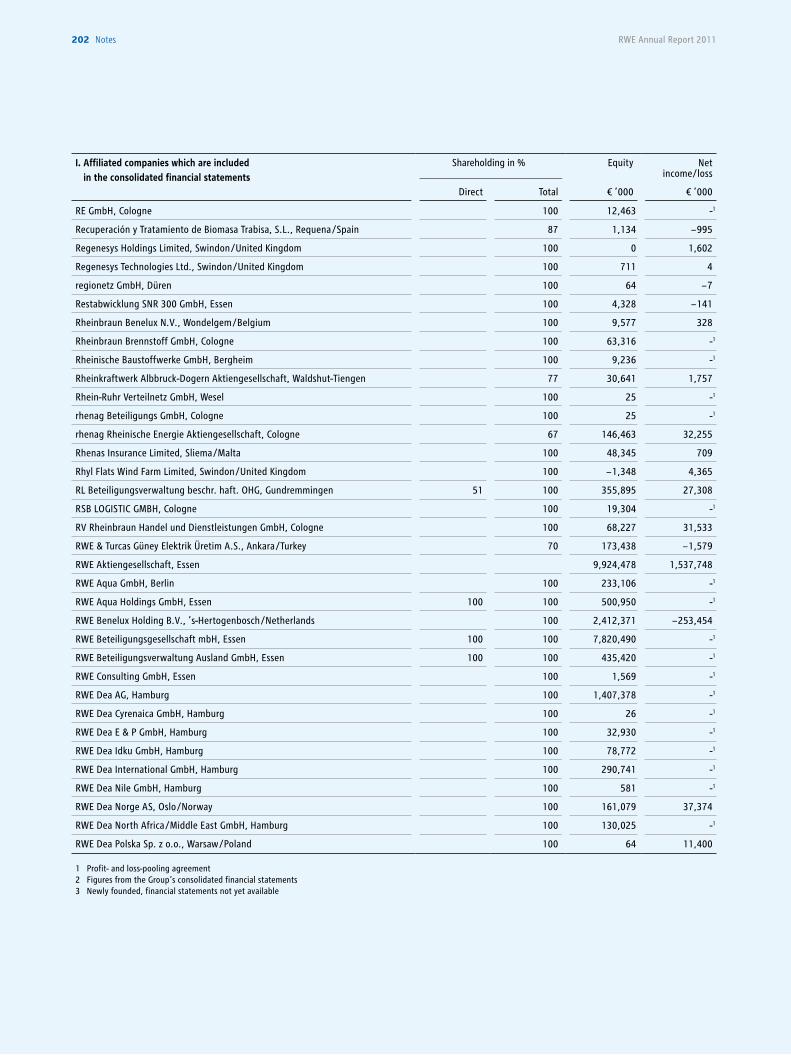
RWE Annual Report 2011202 notes
I. Affiliated companies which are included in the consolidated financial statements
Shareholding in % Equity Net income/loss
Direct Total € ’000 € ’000
RE GmbH, Cologne 100 12,463 -1
Recuperación y Tratamiento de Biomasa Trabisa, S.L., Requena /Spain 87 1,134 − 995
Regenesys Holdings Limited, Swindon /United Kingdom 100 0 1,602
Regenesys Technologies Ltd., Swindon /United Kingdom 100 711 4
regionetz GmbH, Düren 100 64 − 7
Restabwicklung SNR 300 GmbH, Essen 100 4,328 − 141
Rheinbraun Benelux N.V., Wondelgem /Belgium 100 9,577 328
Rheinbraun Brennstoff GmbH, Cologne 100 63,316 -1
Rheinische Baustoffwerke GmbH, Bergheim 100 9,236 -1
Rheinkraftwerk Albbruck-Dogern Aktiengesellschaft, Waldshut-Tiengen 77 30,641 1,757
Rhein-Ruhr Verteilnetz GmbH, Wesel 100 25 -1
rhenag Beteiligungs GmbH, Cologne 100 25 -1
rhenag Rheinische Energie Aktiengesellschaft, Cologne 67 146,463 32,255
Rhenas Insurance Limited, Sliema /Malta 100 48,345 709
Rhyl Flats Wind Farm Limited, Swindon /United Kingdom 100 − 1,348 4,365
RL Beteiligungsverwaltung beschr. haft. OHG, Gundremmingen 51 100 355,895 27,308
RSB LOGISTIC GMBH, Cologne 100 19,304 -1
RV Rheinbraun Handel und Dienstleistungen GmbH, Cologne 100 68,227 31,533
RWE & Turcas Güney Elektrik Üretim A.S., Ankara /Turkey 70 173,438 − 1,579
RWE Aktiengesellschaft, Essen 9,924,478 1,537,748
RWE Aqua GmbH, Berlin 100 233,106 -1
RWE Aqua Holdings GmbH, Essen 100 100 500,950 -1
RWE Benelux Holding B.V., ’s-Hertogenbosch /Netherlands 100 2,412,371 − 253,454
RWE Beteiligungsgesellschaft mbH, Essen 100 100 7,820,490 -1
RWE Beteiligungsverwaltung Ausland GmbH, Essen 100 100 435,420 -1
RWE Consulting GmbH, Essen 100 1,569 -1
RWE Dea AG, Hamburg 100 1,407,378 -1
RWE Dea Cyrenaica GmbH, Hamburg 100 26 -1
RWE Dea E & P GmbH, Hamburg 100 32,930 -1
RWE Dea Idku GmbH, Hamburg 100 78,772 -1
RWE Dea International GmbH, Hamburg 100 290,741 -1
RWE Dea Nile GmbH, Hamburg 100 581 -1
RWE Dea Norge AS, Oslo /Norway 100 161,079 37,374
RWE Dea North Africa /Middle East GmbH, Hamburg 100 130,025 -1
RWE Dea Polska Sp. z o.o., Warsaw /Poland 100 64 11,400
1 Profit- and loss-pooling agreement2 Figures from the Group‘s consolidated financial statements3 Newly founded, financial statements not yet available
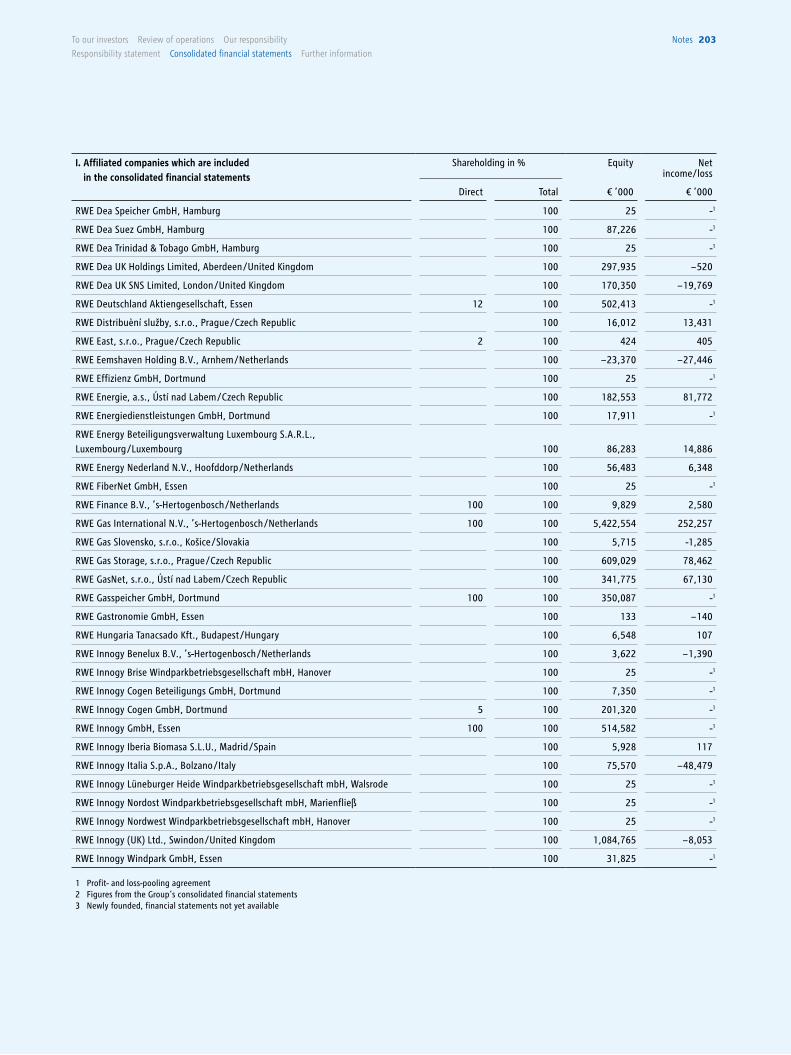
To our investors Review of operations our responsibility
Responsibility statement consolidated financial statements Further information
notes 203
I. Affiliated companies which are included in the consolidated financial statements
Shareholding in % Equity Net income/loss
Direct Total € ’000 € ’000
RWE Dea Speicher GmbH, Hamburg 100 25 -1
RWE Dea Suez GmbH, Hamburg 100 87,226 -1
RWE Dea Trinidad & Tobago GmbH, Hamburg 100 25 -1
RWE Dea UK Holdings Limited, Aberdeen /United Kingdom 100 297,935 − 520
RWE Dea UK SNS Limited, London /United Kingdom 100 170,350 − 19,769
RWE Deutschland Aktiengesellschaft, Essen 12 100 502,413 -1
RWE Distribuèní služby, s.r.o., Prague /Czech Republic 100 16,012 13,431
RWE East, s.r.o., Prague /Czech Republic 2 100 424 405
RWE Eemshaven Holding B.V., Arnhem /Netherlands 100 − 23,370 − 27,446
RWE Effizienz GmbH, Dortmund 100 25 -1
RWE Energie, a.s., Ústí nad Labem /Czech Republic 100 182,553 81,772
RWE Energiedienstleistungen GmbH, Dortmund 100 17,911 -1
RWE Energy Beteiligungsverwaltung Luxembourg S.A.R.L., Luxembourg /Luxembourg 100 86,283 14,886
RWE Energy Nederland N.V., Hoofddorp /Netherlands 100 56,483 6,348
RWE FiberNet GmbH, Essen 100 25 -1
RWE Finance B.V., ’s-Hertogenbosch /Netherlands 100 100 9,829 2,580
RWE Gas International N.V., ’s-Hertogenbosch /Netherlands 100 100 5,422,554 252,257
RWE Gas Slovensko, s.r.o., Košice /Slovakia 100 5,715 -1,285
RWE Gas Storage, s.r.o., Prague /Czech Republic 100 609,029 78,462
RWE GasNet, s.r.o., Ústí nad Labem/Czech Republic 100 341,775 67,130
RWE Gasspeicher GmbH, Dortmund 100 100 350,087 -1
RWE Gastronomie GmbH, Essen 100 133 − 140
RWE Hungaria Tanacsado Kft., Budapest /Hungary 100 6,548 107
RWE Innogy Benelux B.V., ’s-Hertogenbosch /Netherlands 100 3,622 − 1,390
RWE Innogy Brise Windparkbetriebsgesellschaft mbH, Hanover 100 25 -1
RWE Innogy Cogen Beteiligungs GmbH, Dortmund 100 7,350 -1
RWE Innogy Cogen GmbH, Dortmund 5 100 201,320 -1
RWE Innogy GmbH, Essen 100 100 514,582 -1
RWE Innogy Iberia Biomasa S.L.U., Madrid /Spain 100 5,928 117
RWE Innogy Italia S.p.A., Bolzano /Italy 100 75,570 − 48,479
RWE Innogy Lüneburger Heide Windparkbetriebsgesellschaft mbH, Walsrode 100 25 -1
RWE Innogy Nordost Windparkbetriebsgesellschaft mbH, Marienfließ 100 25 -1
RWE Innogy Nordwest Windparkbetriebsgesellschaft mbH, Hanover 100 25 -1
RWE Innogy (UK) Ltd., Swindon /United Kingdom 100 1,084,765 − 8,053
RWE Innogy Windpark GmbH, Essen 100 31,825 -1
1 Profit- and loss-pooling agreement2 Figures from the Group‘s consolidated financial statements3 Newly founded, financial statements not yet available
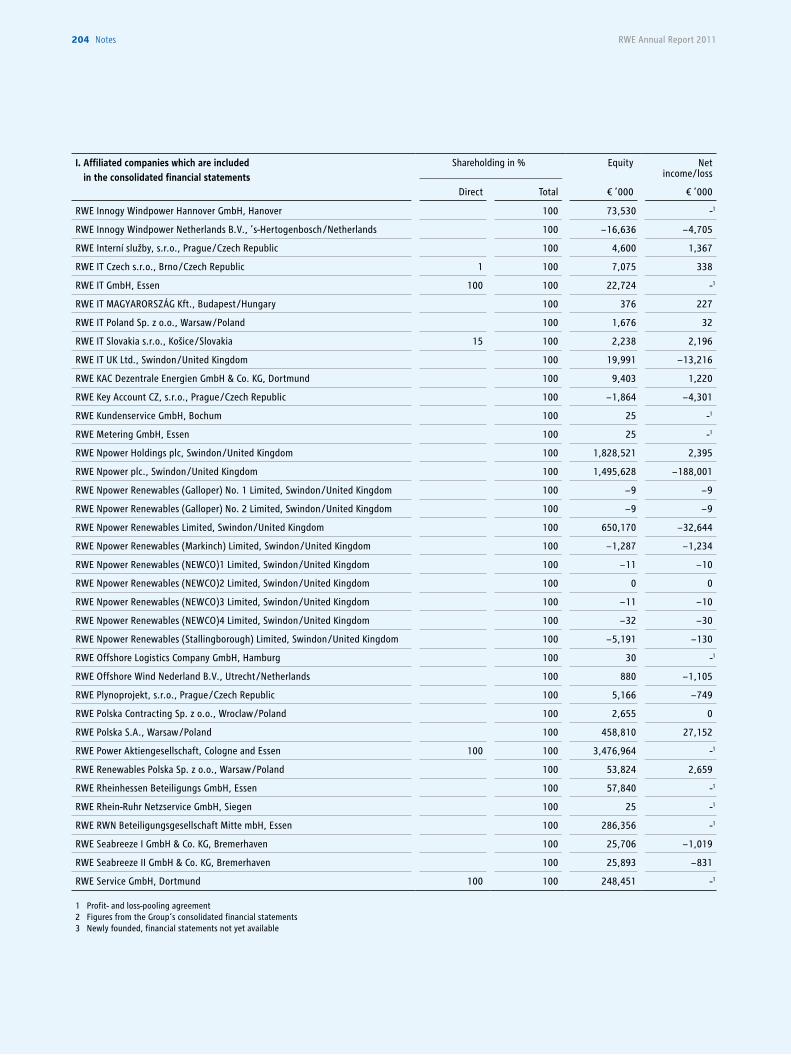
RWE Annual Report 2011204 notes
I. Affiliated companies which are included in the consolidated financial statements
Shareholding in % Equity Net income/loss
Direct Total € ’000 € ’000
RWE Innogy Windpower Hannover GmbH, Hanover 100 73,530 -1
RWE Innogy Windpower Netherlands B.V., ’s-Hertogenbosch /Netherlands 100 − 16,636 − 4,705
RWE Interní služby, s.r.o., Prague /Czech Republic 100 4,600 1,367
RWE IT Czech s.r.o., Brno /Czech Republic 1 100 7,075 338
RWE IT GmbH, Essen 100 100 22,724 -1
RWE IT MAGYARORSZÁG Kft., Budapest /Hungary 100 376 227
RWE IT Poland Sp. z o.o., Warsaw /Poland 100 1,676 32
RWE IT Slovakia s.r.o., Košice /Slovakia 15 100 2,238 2,196
RWE IT UK Ltd., Swindon /United Kingdom 100 19,991 − 13,216
RWE KAC Dezentrale Energien GmbH & Co. KG, Dortmund 100 9,403 1,220
RWE Key Account CZ, s.r.o., Prague /Czech Republic 100 − 1,864 − 4,301
RWE Kundenservice GmbH, Bochum 100 25 -1
RWE Metering GmbH, Essen 100 25 -1
RWE Npower Holdings plc, Swindon /United Kingdom 100 1,828,521 2,395
RWE Npower plc., Swindon /United Kingdom 100 1,495,628 − 188,001
RWE Npower Renewables (Galloper) No. 1 Limited, Swindon /United Kingdom 100 − 9 − 9
RWE Npower Renewables (Galloper) No. 2 Limited, Swindon /United Kingdom 100 − 9 − 9
RWE Npower Renewables Limited, Swindon /United Kingdom 100 650,170 − 32,644
RWE Npower Renewables (Markinch) Limited, Swindon /United Kingdom 100 − 1,287 − 1,234
RWE Npower Renewables (NEWCO)1 Limited, Swindon /United Kingdom 100 − 11 − 10
RWE Npower Renewables (NEWCO)2 Limited, Swindon /United Kingdom 100 0 0
RWE Npower Renewables (NEWCO)3 Limited, Swindon /United Kingdom 100 − 11 − 10
RWE Npower Renewables (NEWCO)4 Limited, Swindon /United Kingdom 100 − 32 − 30
RWE Npower Renewables (Stallingborough) Limited, Swindon /United Kingdom 100 − 5,191 − 130
RWE Offshore Logistics Company GmbH, Hamburg 100 30 -1
RWE Offshore Wind Nederland B.V., Utrecht /Netherlands 100 880 − 1,105
RWE Plynoprojekt, s.r.o., Prague /Czech Republic 100 5,166 − 749
RWE Polska Contracting Sp. z o.o., Wroclaw /Poland 100 2,655 0
RWE Polska S.A., Warsaw /Poland 100 458,810 27,152
RWE Power Aktiengesellschaft, Cologne and Essen 100 100 3,476,964 -1
RWE Renewables Polska Sp. z o.o., Warsaw /Poland 100 53,824 2,659
RWE Rheinhessen Beteiligungs GmbH, Essen 100 57,840 -1
RWE Rhein-Ruhr Netzservice GmbH, Siegen 100 25 -1
RWE RWN Beteiligungsgesellschaft Mitte mbH, Essen 100 286,356 -1
RWE Seabreeze I GmbH & Co. KG, Bremerhaven 100 25,706 − 1,019
RWE Seabreeze II GmbH & Co. KG, Bremerhaven 100 25,893 − 831
RWE Service GmbH, Dortmund 100 100 248,451 -1
1 Profit- and loss-pooling agreement2 Figures from the Group‘s consolidated financial statements3 Newly founded, financial statements not yet available
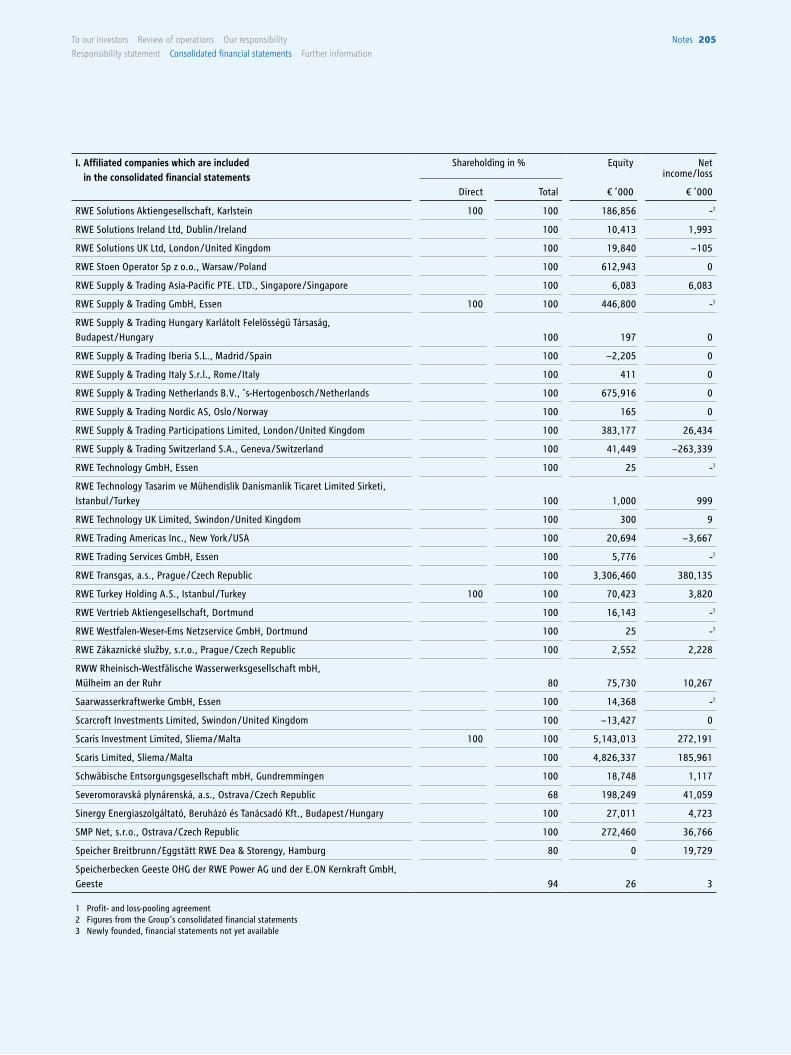
To our investors Review of operations our responsibility
Responsibility statement consolidated financial statements Further information
notes 205
I. Affiliated companies which are included in the consolidated financial statements
Shareholding in % Equity Net income/loss
Direct Total € ’000 € ’000
RWE Solutions Aktiengesellschaft, Karlstein 100 100 186,856 -1
RWE Solutions Ireland Ltd, Dublin /Ireland 100 10,413 1,993
RWE Solutions UK Ltd, London /United Kingdom 100 19,840 − 105
RWE Stoen Operator Sp z o.o., Warsaw /Poland 100 612,943 0
RWE Supply & Trading Asia-Pacific PTE. LTD., Singapore /Singapore 100 6,083 6,083
RWE Supply & Trading GmbH, Essen 100 100 446,800 -1
RWE Supply & Trading Hungary Karlátolt Felelösségü Társaság, Budapest /Hungary 100 197 0
RWE Supply & Trading Iberia S.L., Madrid /Spain 100 − 2,205 0
RWE Supply & Trading Italy S.r.l., Rome /Italy 100 411 0
RWE Supply & Trading Netherlands B.V., ’s-Hertogenbosch /Netherlands 100 675,916 0
RWE Supply & Trading Nordic AS, Oslo /Norway 100 165 0
RWE Supply & Trading Participations Limited, London /United Kingdom 100 383,177 26,434
RWE Supply & Trading Switzerland S.A., Geneva /Switzerland 100 41,449 − 263,339
RWE Technology GmbH, Essen 100 25 -1
RWE Technology Tasarim ve Mühendislik Danismanlik Ticaret Limited Sirketi, Istanbul /Turkey 100 1,000 999
RWE Technology UK Limited, Swindon /United Kingdom 100 300 9
RWE Trading Americas Inc., New York /USA 100 20,694 − 3,667
RWE Trading Services GmbH, Essen 100 5,776 -1
RWE Transgas, a.s., Prague /Czech Republic 100 3,306,460 380,135
RWE Turkey Holding A.S., Istanbul /Turkey 100 100 70,423 3,820
RWE Vertrieb Aktiengesellschaft, Dortmund 100 16,143 -1
RWE Westfalen-Weser-Ems Netzservice GmbH, Dortmund 100 25 -1
RWE Zákaznické služby, s.r.o., Prague /Czech Republic 100 2,552 2,228
RWW Rheinisch-Westfälische Wasserwerksgesellschaft mbH, Mülheim an der Ruhr 80 75,730 10,267
Saarwasserkraftwerke GmbH, Essen 100 14,368 -1
Scarcroft Investments Limited, Swindon /United Kingdom 100 − 13,427 0
Scaris Investment Limited, Sliema /Malta 100 100 5,143,013 272,191
Scaris Limited, Sliema /Malta 100 4,826,337 185,961
Schwäbische Entsorgungsgesellschaft mbH, Gundremmingen 100 18,748 1,117
Severomoravská plynárenská, a.s., Ostrava /Czech Republic 68 198,249 41,059
Sinergy Energiaszolgáltató, Beruházó és Tanácsadó Kft., Budapest /Hungary 100 27,011 4,723
SMP Net, s.r.o., Ostrava /Czech Republic 100 272,460 36,766
Speicher Breitbrunn /Eggstätt RWE Dea & Storengy, Hamburg 80 0 19,729
Speicherbecken Geeste OHG der RWE Power AG und der E.ON Kernkraft GmbH, Geeste 94 26 3
1 Profit- and loss-pooling agreement2 Figures from the Group‘s consolidated financial statements3 Newly founded, financial statements not yet available
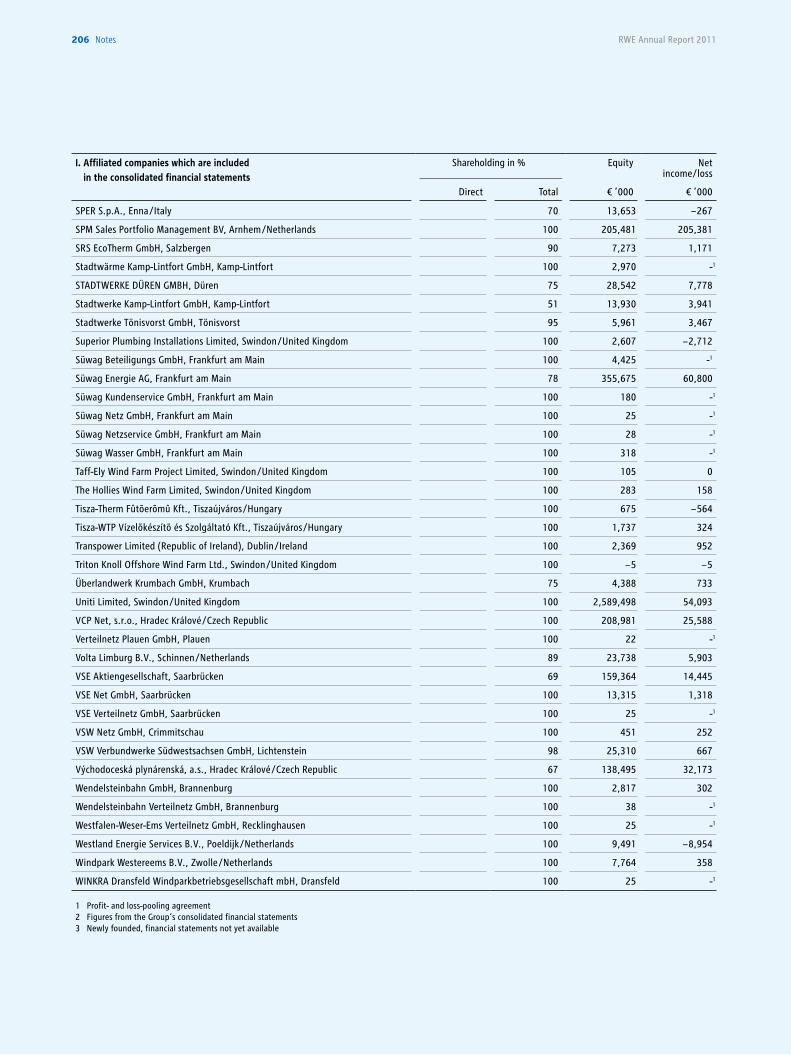
RWE Annual Report 2011206 notes
I. Affiliated companies which are included in the consolidated financial statements
Shareholding in % Equity Net income/loss
Direct Total € ’000 € ’000
SPER S.p.A., Enna /Italy 70 13,653 − 267
SPM Sales Portfolio Management BV, Arnhem /Netherlands 100 205,481 205,381
SRS EcoTherm GmbH, Salzbergen 90 7,273 1,171
Stadtwärme Kamp-Lintfort GmbH, Kamp-Lintfort 100 2,970 -1
STADTWERKE DÜREN GMBH, Düren 75 28,542 7,778
Stadtwerke Kamp-Lintfort GmbH, Kamp-Lintfort 51 13,930 3,941
Stadtwerke Tönisvorst GmbH, Tönisvorst 95 5,961 3,467
Superior Plumbing Installations Limited, Swindon /United Kingdom 100 2,607 − 2,712
Süwag Beteiligungs GmbH, Frankfurt am Main 100 4,425 -1
Süwag Energie AG, Frankfurt am Main 78 355,675 60,800
Süwag Kundenservice GmbH, Frankfurt am Main 100 180 -1
Süwag Netz GmbH, Frankfurt am Main 100 25 -1
Süwag Netzservice GmbH, Frankfurt am Main 100 28 -1
Süwag Wasser GmbH, Frankfurt am Main 100 318 -1
Taff-Ely Wind Farm Project Limited, Swindon /United Kingdom 100 105 0
The Hollies Wind Farm Limited, Swindon /United Kingdom 100 283 158
Tisza-Therm Fûtõerõmû Kft., Tiszaújváros /Hungary 100 675 − 564
Tisza-WTP Vízelõkészítõ és Szolgáltató Kft., Tiszaújváros /Hungary 100 1,737 324
Transpower Limited (Republic of Ireland), Dublin /Ireland 100 2,369 952
Triton Knoll Offshore Wind Farm Ltd., Swindon /United Kingdom 100 − 5 − 5
Überlandwerk Krumbach GmbH, Krumbach 75 4,388 733
Uniti Limited, Swindon /United Kingdom 100 2,589,498 54,093
VCP Net, s.r.o., Hradec Králové /Czech Republic 100 208,981 25,588
Verteilnetz Plauen GmbH, Plauen 100 22 -1
Volta Limburg B.V., Schinnen /Netherlands 89 23,738 5,903
VSE Aktiengesellschaft, Saarbrücken 69 159,364 14,445
VSE Net GmbH, Saarbrücken 100 13,315 1,318
VSE Verteilnetz GmbH, Saarbrücken 100 25 -1
VSW Netz GmbH, Crimmitschau 100 451 252
VSW Verbundwerke Südwestsachsen GmbH, Lichtenstein 98 25,310 667
Východoceská plynárenská, a.s., Hradec Králové /Czech Republic 67 138,495 32,173
Wendelsteinbahn GmbH, Brannenburg 100 2,817 302
Wendelsteinbahn Verteilnetz GmbH, Brannenburg 100 38 -1
Westfalen-Weser-Ems Verteilnetz GmbH, Recklinghausen 100 25 -1
Westland Energie Services B.V., Poeldijk /Netherlands 100 9,491 − 8,954
Windpark Westereems B.V., Zwolle /Netherlands 100 7,764 358
WINKRA Dransfeld Windparkbetriebsgesellschaft mbH, Dransfeld 100 25 -1
1 Profit- and loss-pooling agreement2 Figures from the Group‘s consolidated financial statements3 Newly founded, financial statements not yet available
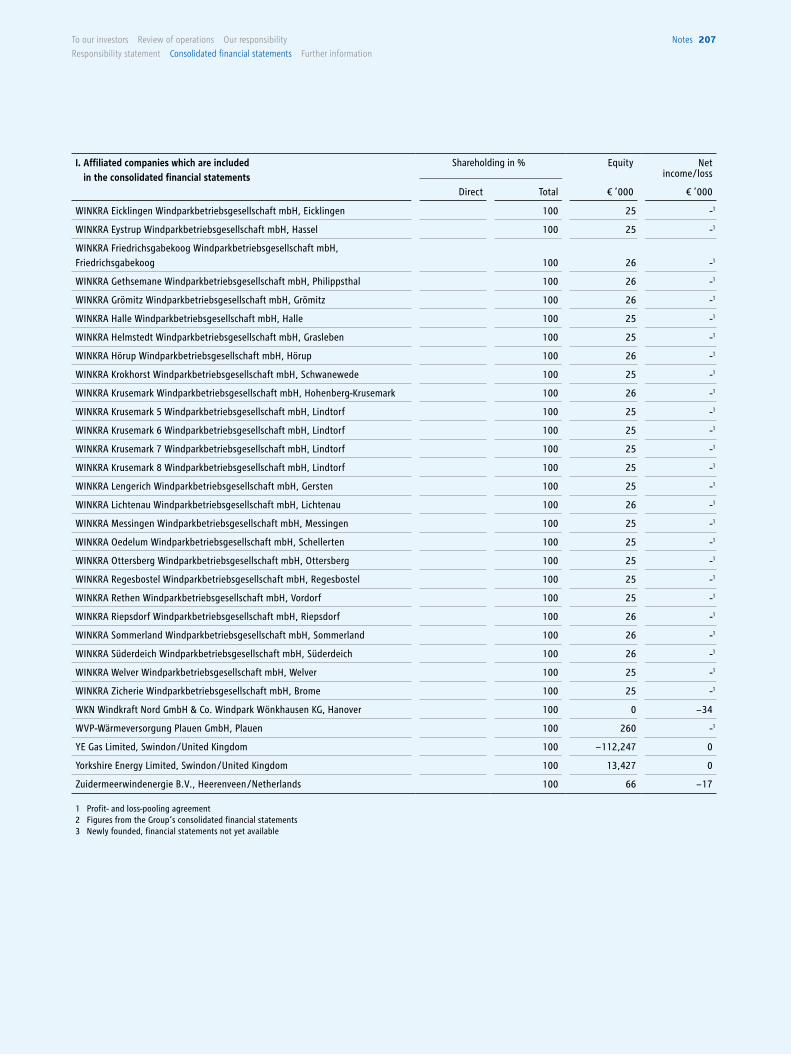
To our investors Review of operations our responsibility
Responsibility statement consolidated financial statements Further information
notes 207
I. Affiliated companies which are included in the consolidated financial statements
Shareholding in % Equity Net income/loss
Direct Total € ’000 € ’000
WINKRA Eicklingen Windparkbetriebsgesellschaft mbH, Eicklingen 100 25 -1
WINKRA Eystrup Windparkbetriebsgesellschaft mbH, Hassel 100 25 -1
WINKRA Friedrichsgabekoog Windparkbetriebsgesellschaft mbH, Friedrichsgabekoog 100 26 -1
WINKRA Gethsemane Windparkbetriebsgesellschaft mbH, Philippsthal 100 26 -1
WINKRA Grömitz Windparkbetriebsgesellschaft mbH, Grömitz 100 26 -1
WINKRA Halle Windparkbetriebsgesellschaft mbH, Halle 100 25 -1
WINKRA Helmstedt Windparkbetriebsgesellschaft mbH, Grasleben 100 25 -1
WINKRA Hörup Windparkbetriebsgesellschaft mbH, Hörup 100 26 -1
WINKRA Krokhorst Windparkbetriebsgesellschaft mbH, Schwanewede 100 25 -1
WINKRA Krusemark Windparkbetriebsgesellschaft mbH, Hohenberg-Krusemark 100 26 -1
WINKRA Krusemark 5 Windparkbetriebsgesellschaft mbH, Lindtorf 100 25 -1
WINKRA Krusemark 6 Windparkbetriebsgesellschaft mbH, Lindtorf 100 25 -1
WINKRA Krusemark 7 Windparkbetriebsgesellschaft mbH, Lindtorf 100 25 -1
WINKRA Krusemark 8 Windparkbetriebsgesellschaft mbH, Lindtorf 100 25 -1
WINKRA Lengerich Windparkbetriebsgesellschaft mbH, Gersten 100 25 -1
WINKRA Lichtenau Windparkbetriebsgesellschaft mbH, Lichtenau 100 26 -1
WINKRA Messingen Windparkbetriebsgesellschaft mbH, Messingen 100 25 -1
WINKRA Oedelum Windparkbetriebsgesellschaft mbH, Schellerten 100 25 -1
WINKRA Ottersberg Windparkbetriebsgesellschaft mbH, Ottersberg 100 25 -1
WINKRA Regesbostel Windparkbetriebsgesellschaft mbH, Regesbostel 100 25 -1
WINKRA Rethen Windparkbetriebsgesellschaft mbH, Vordorf 100 25 -1
WINKRA Riepsdorf Windparkbetriebsgesellschaft mbH, Riepsdorf 100 26 -1
WINKRA Sommerland Windparkbetriebsgesellschaft mbH, Sommerland 100 26 -1
WINKRA Süderdeich Windparkbetriebsgesellschaft mbH, Süderdeich 100 26 -1
WINKRA Welver Windparkbetriebsgesellschaft mbH, Welver 100 25 -1
WINKRA Zicherie Windparkbetriebsgesellschaft mbH, Brome 100 25 -1
WKN Windkraft Nord GmbH & Co. Windpark Wönkhausen KG, Hanover 100 0 − 34
WVP-Wärmeversorgung Plauen GmbH, Plauen 100 260 -1
YE Gas Limited, Swindon /United Kingdom 100 − 112,247 0
Yorkshire Energy Limited, Swindon /United Kingdom 100 13,427 0
Zuidermeerwindenergie B.V., Heerenveen /Netherlands 100 66 − 17
1 Profit- and loss-pooling agreement2 Figures from the Group‘s consolidated financial statements3 Newly founded, financial statements not yet available
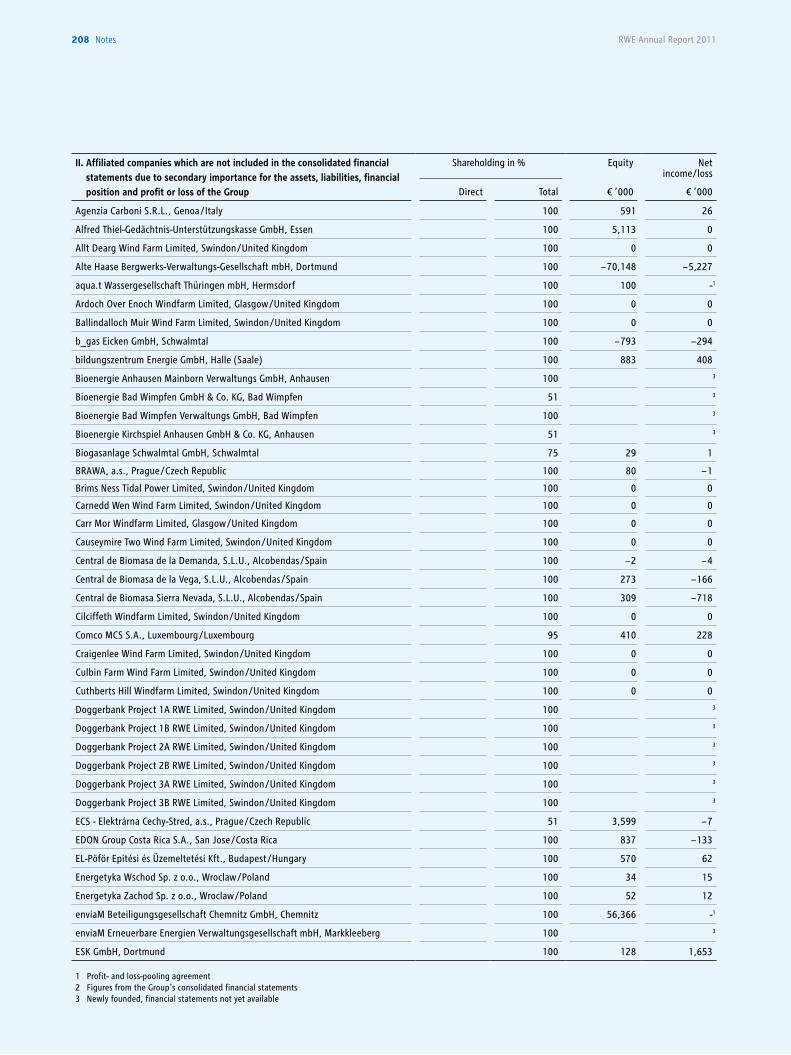
RWE Annual Report 2011208 notes
II. Affiliated companies which are not included in the consolidated financial statements due to secondary importance for the assets, liabilities, financial position and profit or loss of the Group
Shareholding in % Equity Net income/loss
Direct Total € ’000 € ’000
Agenzia Carboni S.R.L., Genoa /Italy 100 591 26
Alfred Thiel-Gedächtnis-Unterstützungskasse GmbH, Essen 100 5,113 0
Allt Dearg Wind Farm Limited, Swindon /United Kingdom 100 0 0
Alte Haase Bergwerks-Verwaltungs-Gesellschaft mbH, Dortmund 100 − 70,148 − 5,227
aqua.t Wassergesellschaft Thüringen mbH, Hermsdorf 100 100 -1
Ardoch Over Enoch Windfarm Limited, Glasgow /United Kingdom 100 0 0
Ballindalloch Muir Wind Farm Limited, Swindon /United Kingdom 100 0 0
b_gas Eicken GmbH, Schwalmtal 100 − 793 − 294
bildungszentrum Energie GmbH, Halle (Saale) 100 883 408
Bioenergie Anhausen Mainborn Verwaltungs GmbH, Anhausen 100 3
Bioenergie Bad Wimpfen GmbH & Co. KG, Bad Wimpfen 51 3
Bioenergie Bad Wimpfen Verwaltungs GmbH, Bad Wimpfen 100 3
Bioenergie Kirchspiel Anhausen GmbH & Co. KG, Anhausen 51 3
Biogasanlage Schwalmtal GmbH, Schwalmtal 75 29 1
BRAWA, a.s., Prague /Czech Republic 100 80 − 1
Brims Ness Tidal Power Limited, Swindon /United Kingdom 100 0 0
Carnedd Wen Wind Farm Limited, Swindon /United Kingdom 100 0 0
Carr Mor Windfarm Limited, Glasgow /United Kingdom 100 0 0
Causeymire Two Wind Farm Limited, Swindon /United Kingdom 100 0 0
Central de Biomasa de la Demanda, S.L.U., Alcobendas /Spain 100 − 2 − 4
Central de Biomasa de la Vega, S.L.U., Alcobendas /Spain 100 273 − 166
Central de Biomasa Sierra Nevada, S.L.U., Alcobendas /Spain 100 309 − 718
Cilciffeth Windfarm Limited, Swindon /United Kingdom 100 0 0
Comco MCS S.A., Luxembourg /Luxembourg 95 410 228
Craigenlee Wind Farm Limited, Swindon /United Kingdom 100 0 0
Culbin Farm Wind Farm Limited, Swindon /United Kingdom 100 0 0
Cuthberts Hill Windfarm Limited, Swindon /United Kingdom 100 0 0
Doggerbank Project 1A RWE Limited, Swindon /United Kingdom 100 3
Doggerbank Project 1B RWE Limited, Swindon /United Kingdom 100 3
Doggerbank Project 2A RWE Limited, Swindon /United Kingdom 100 3
Doggerbank Project 2B RWE Limited, Swindon /United Kingdom 100 3
Doggerbank Project 3A RWE Limited, Swindon /United Kingdom 100 3
Doggerbank Project 3B RWE Limited, Swindon /United Kingdom 100 3
ECS - Elektrárna Cechy-Stred, a.s., Prague /Czech Republic 51 3,599 − 7
EDON Group Costa Rica S.A., San Jose /Costa Rica 100 837 − 133
EL-Pöför Epitési és Üzemeltetési Kft., Budapest /Hungary 100 570 62
Energetyka Wschod Sp. z o.o., Wroclaw /Poland 100 34 15
Energetyka Zachod Sp. z o.o., Wroclaw /Poland 100 52 12
enviaM Beteiligungsgesellschaft Chemnitz GmbH, Chemnitz 100 56,366 -1
enviaM Erneuerbare Energien Verwaltungsgesellschaft mbH, Markkleeberg 100 3
ESK GmbH, Dortmund 100 128 1,653
1 Profit- and loss-pooling agreement2 Figures from the Group‘s consolidated financial statements3 Newly founded, financial statements not yet available
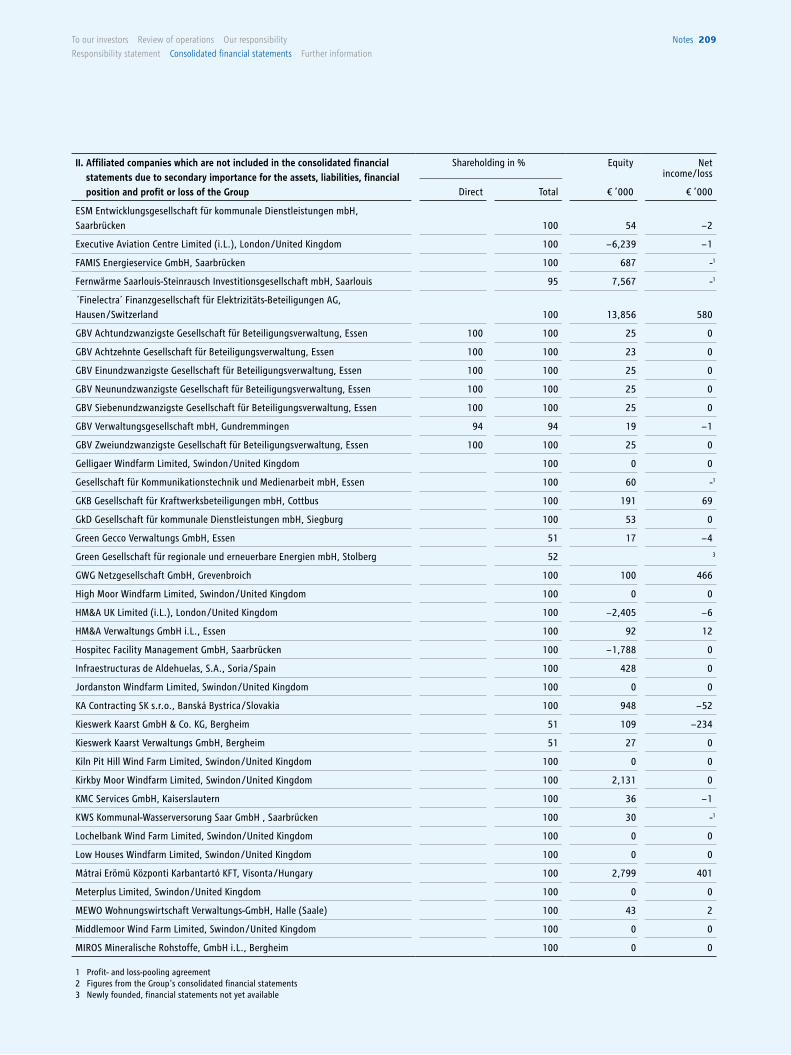
To our investors Review of operations our responsibility
Responsibility statement consolidated financial statements Further information
notes 209
II. Affiliated companies which are not included in the consolidated financial statements due to secondary importance for the assets, liabilities, financial position and profit or loss of the Group
Shareholding in % Equity Net income/loss
Direct Total € ’000 € ’000
ESM Entwicklungsgesellschaft für kommunale Dienstleistungen mbH, Saarbrücken 100 54 − 2
Executive Aviation Centre Limited (i.L.), London /United Kingdom 100 − 6,239 − 1
FAMIS Energieservice GmbH, Saarbrücken 100 687 -1
Fernwärme Saarlouis-Steinrausch Investitionsgesellschaft mbH, Saarlouis 95 7,567 -1
Finelectra Finanzgesellschaft für Elektrizitäts-Beteiligungen AG, Hausen /Switzerland 100 13,856 580
GBV Achtundzwanzigste Gesellschaft für Beteiligungsverwaltung, Essen 100 100 25 0
GBV Achtzehnte Gesellschaft für Beteiligungsverwaltung, Essen 100 100 23 0
GBV Einundzwanzigste Gesellschaft für Beteiligungsverwaltung, Essen 100 100 25 0
GBV Neunundzwanzigste Gesellschaft für Beteiligungsverwaltung, Essen 100 100 25 0
GBV Siebenundzwanzigste Gesellschaft für Beteiligungsverwaltung, Essen 100 100 25 0
GBV Verwaltungsgesellschaft mbH, Gundremmingen 94 94 19 − 1
GBV Zweiundzwanzigste Gesellschaft für Beteiligungsverwaltung, Essen 100 100 25 0
Gelligaer Windfarm Limited, Swindon /United Kingdom 100 0 0
Gesellschaft für Kommunikationstechnik und Medienarbeit mbH, Essen 100 60 -1
GKB Gesellschaft für Kraftwerksbeteiligungen mbH, Cottbus 100 191 69
GkD Gesellschaft für kommunale Dienstleistungen mbH, Siegburg 100 53 0
Green Gecco Verwaltungs GmbH, Essen 51 17 − 4
Green Gesellschaft für regionale und erneuerbare Energien mbH, Stolberg 52 3
GWG Netzgesellschaft GmbH, Grevenbroich 100 100 466
High Moor Windfarm Limited, Swindon /United Kingdom 100 0 0
HM&A UK Limited (i.L.), London /United Kingdom 100 − 2,405 − 6
HM&A Verwaltungs GmbH i.L., Essen 100 92 12
Hospitec Facility Management GmbH, Saarbrücken 100 − 1,788 0
Infraestructuras de Aldehuelas, S.A., Soria /Spain 100 428 0
Jordanston Windfarm Limited, Swindon /United Kingdom 100 0 0
KA Contracting SK s.r.o., Banská Bystrica /Slovakia 100 948 − 52
Kieswerk Kaarst GmbH & Co. KG, Bergheim 51 109 − 234
Kieswerk Kaarst Verwaltungs GmbH, Bergheim 51 27 0
Kiln Pit Hill Wind Farm Limited, Swindon /United Kingdom 100 0 0
Kirkby Moor Windfarm Limited, Swindon /United Kingdom 100 2,131 0
KMC Services GmbH, Kaiserslautern 100 36 − 1
KWS Kommunal-Wasserversorung Saar GmbH , Saarbrücken 100 30 -1
Lochelbank Wind Farm Limited, Swindon/United Kingdom 100 0 0
Low Houses Windfarm Limited, Swindon /United Kingdom 100 0 0
Mátrai Erömü Központi Karbantartó KFT, Visonta /Hungary 100 2,799 401
Meterplus Limited, Swindon /United Kingdom 100 0 0
MEWO Wohnungswirtschaft Verwaltungs-GmbH, Halle (Saale) 100 43 2
Middlemoor Wind Farm Limited, Swindon /United Kingdom 100 0 0
MIROS Mineralische Rohstoffe, GmbH i.L., Bergheim 100 0 0
1 Profit- and loss-pooling agreement2 Figures from the Group‘s consolidated financial statements3 Newly founded, financial statements not yet available
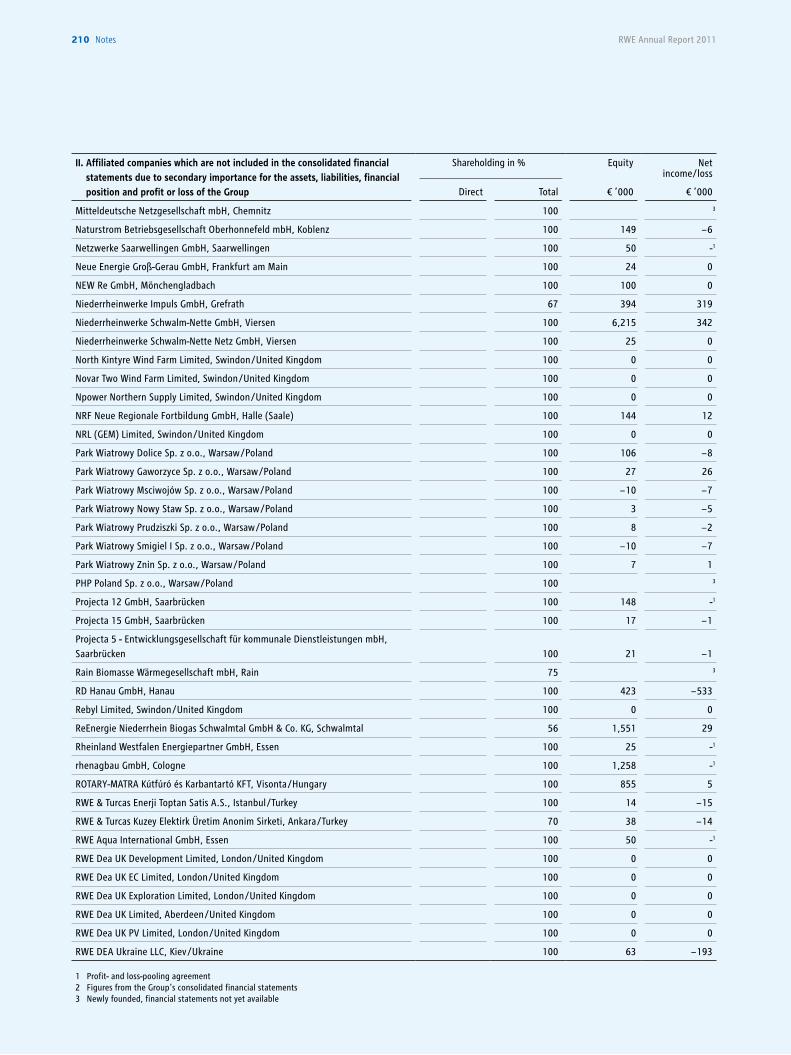
RWE Annual Report 2011210 notes
II. Affiliated companies which are not included in the consolidated financial statements due to secondary importance for the assets, liabilities, financial position and profit or loss of the Group
Shareholding in % Equity Net income/loss
Direct Total € ’000 € ’000
Mitteldeutsche Netzgesellschaft mbH, Chemnitz 100 3
Naturstrom Betriebsgesellschaft Oberhonnefeld mbH, Koblenz 100 149 − 6
Netzwerke Saarwellingen GmbH, Saarwellingen 100 50 -1
Neue Energie Groß-Gerau GmbH, Frankfurt am Main 100 24 0
NEW Re GmbH, Mönchengladbach 100 100 0
Niederrheinwerke Impuls GmbH, Grefrath 67 394 319
Niederrheinwerke Schwalm-Nette GmbH, Viersen 100 6,215 342
Niederrheinwerke Schwalm-Nette Netz GmbH, Viersen 100 25 0
North Kintyre Wind Farm Limited, Swindon /United Kingdom 100 0 0
Novar Two Wind Farm Limited, Swindon /United Kingdom 100 0 0
Npower Northern Supply Limited, Swindon /United Kingdom 100 0 0
NRF Neue Regionale Fortbildung GmbH, Halle (Saale) 100 144 12
NRL (GEM) Limited, Swindon /United Kingdom 100 0 0
Park Wiatrowy Dolice Sp. z o.o., Warsaw /Poland 100 106 − 8
Park Wiatrowy Gaworzyce Sp. z o.o., Warsaw /Poland 100 27 26
Park Wiatrowy Msciwojów Sp. z o.o., Warsaw /Poland 100 − 10 − 7
Park Wiatrowy Nowy Staw Sp. z o.o., Warsaw /Poland 100 3 − 5
Park Wiatrowy Prudziszki Sp. z o.o., Warsaw /Poland 100 8 − 2
Park Wiatrowy Smigiel I Sp. z o.o., Warsaw /Poland 100 − 10 − 7
Park Wiatrowy Znin Sp. z o.o., Warsaw /Poland 100 7 1
PHP Poland Sp. z o.o., Warsaw /Poland 100 3
Projecta 12 GmbH, Saarbrücken 100 148 -1
Projecta 15 GmbH, Saarbrücken 100 17 − 1
Projecta 5 - Entwicklungsgesellschaft für kommunale Dienstleistungen mbH, Saarbrücken 100 21 − 1
Rain Biomasse Wärmegesellschaft mbH, Rain 75 3
RD Hanau GmbH, Hanau 100 423 − 533
Rebyl Limited, Swindon /United Kingdom 100 0 0
ReEnergie Niederrhein Biogas Schwalmtal GmbH & Co. KG, Schwalmtal 56 1,551 29
Rheinland Westfalen Energiepartner GmbH, Essen 100 25 -1
rhenagbau GmbH, Cologne 100 1,258 -1
ROTARY-MATRA Kútfúró és Karbantartó KFT, Visonta /Hungary 100 855 5
RWE & Turcas Enerji Toptan Satis A.S., Istanbul /Turkey 100 14 − 15
RWE & Turcas Kuzey Elektirk Üretim Anonim Sirketi, Ankara /Turkey 70 38 − 14
RWE Aqua International GmbH, Essen 100 50 -1
RWE Dea UK Development Limited, London /United Kingdom 100 0 0
RWE Dea UK EC Limited, London /United Kingdom 100 0 0
RWE Dea UK Exploration Limited, London /United Kingdom 100 0 0
RWE Dea UK Limited, Aberdeen /United Kingdom 100 0 0
RWE Dea UK PV Limited, London /United Kingdom 100 0 0
RWE DEA Ukraine LLC, Kiev /Ukraine 100 63 − 193
1 Profit- and loss-pooling agreement2 Figures from the Group‘s consolidated financial statements3 Newly founded, financial statements not yet available
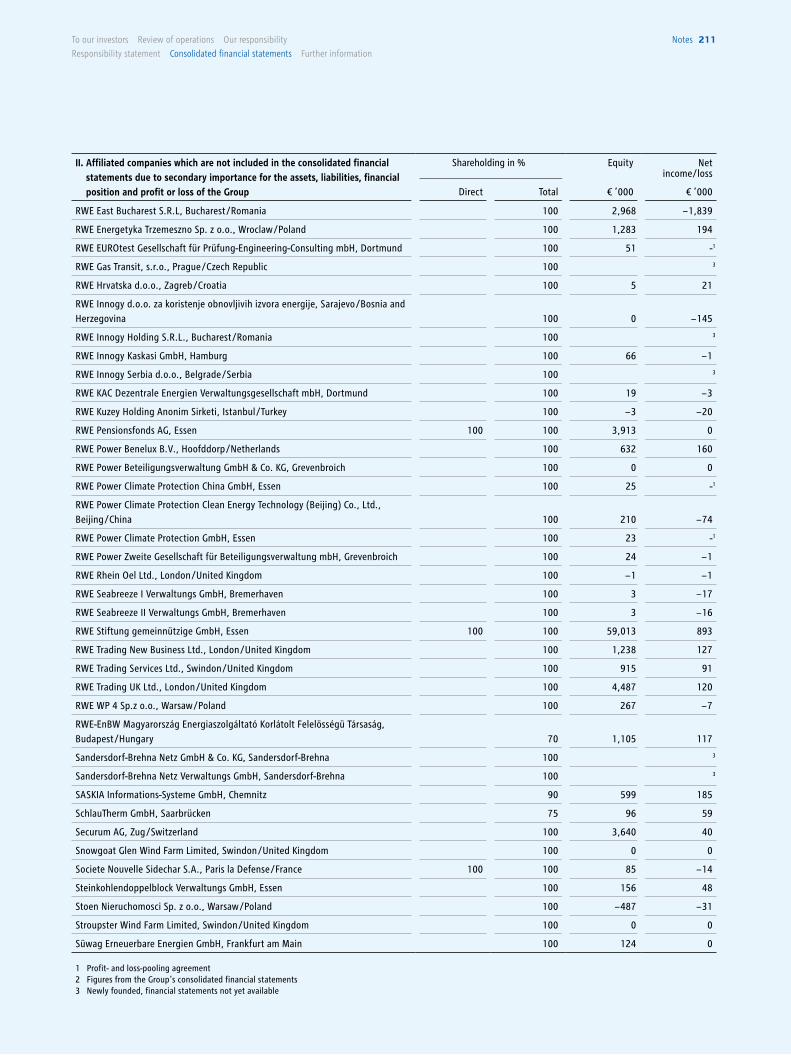
To our investors Review of operations our responsibility
Responsibility statement consolidated financial statements Further information
notes 211
II. Affiliated companies which are not included in the consolidated financial statements due to secondary importance for the assets, liabilities, financial position and profit or loss of the Group
Shareholding in % Equity Net income/loss
Direct Total € ’000 € ’000
RWE East Bucharest S.R.L, Bucharest /Romania 100 2,968 − 1,839
RWE Energetyka Trzemeszno Sp. z o.o., Wroclaw /Poland 100 1,283 194
RWE EUROtest Gesellschaft für Prüfung-Engineering-Consulting mbH, Dortmund 100 51 -1
RWE Gas Transit, s.r.o., Prague /Czech Republic 100 3
RWE Hrvatska d.o.o., Zagreb /Croatia 100 5 21
RWE Innogy d.o.o. za koristenje obnovljivih izvora energije, Sarajevo /Bosnia and Herzegovina 100 0 − 145
RWE Innogy Holding S.R.L., Bucharest /Romania 100 3
RWE Innogy Kaskasi GmbH, Hamburg 100 66 − 1
RWE Innogy Serbia d.o.o., Belgrade /Serbia 100 3
RWE KAC Dezentrale Energien Verwaltungsgesellschaft mbH, Dortmund 100 19 − 3
RWE Kuzey Holding Anonim Sirketi, Istanbul /Turkey 100 − 3 − 20
RWE Pensionsfonds AG, Essen 100 100 3,913 0
RWE Power Benelux B.V., Hoofddorp /Netherlands 100 632 160
RWE Power Beteiligungsverwaltung GmbH & Co. KG, Grevenbroich 100 0 0
RWE Power Climate Protection China GmbH, Essen 100 25 -1
RWE Power Climate Protection Clean Energy Technology (Beijing) Co., Ltd., Beijing /China 100 210 − 74
RWE Power Climate Protection GmbH, Essen 100 23 -1
RWE Power Zweite Gesellschaft für Beteiligungsverwaltung mbH, Grevenbroich 100 24 − 1
RWE Rhein Oel Ltd., London /United Kingdom 100 − 1 − 1
RWE Seabreeze I Verwaltungs GmbH, Bremerhaven 100 3 − 17
RWE Seabreeze II Verwaltungs GmbH, Bremerhaven 100 3 − 16
RWE Stiftung gemeinnützige GmbH, Essen 100 100 59,013 893
RWE Trading New Business Ltd., London /United Kingdom 100 1,238 127
RWE Trading Services Ltd., Swindon /United Kingdom 100 915 91
RWE Trading UK Ltd., London /United Kingdom 100 4,487 120
RWE WP 4 Sp.z o.o., Warsaw /Poland 100 267 − 7
RWE-EnBW Magyarország Energiaszolgáltató Korlátolt Felelösségü Társaság, Budapest /Hungary 70 1,105 117
Sandersdorf-Brehna Netz GmbH & Co. KG, Sandersdorf-Brehna 100 3
Sandersdorf-Brehna Netz Verwaltungs GmbH, Sandersdorf-Brehna 100 3
SASKIA Informations-Systeme GmbH, Chemnitz 90 599 185
SchlauTherm GmbH, Saarbrücken 75 96 59
Securum AG, Zug /Switzerland 100 3,640 40
Snowgoat Glen Wind Farm Limited, Swindon /United Kingdom 100 0 0
Societe Nouvelle Sidechar S.A., Paris la Defense /France 100 100 85 − 14
Steinkohlendoppelblock Verwaltungs GmbH, Essen 100 156 48
Stoen Nieruchomosci Sp. z o.o., Warsaw /Poland 100 − 487 − 31
Stroupster Wind Farm Limited, Swindon /United Kingdom 100 0 0
Süwag Erneuerbare Energien GmbH, Frankfurt am Main 100 124 0
1 Profit- and loss-pooling agreement2 Figures from the Group‘s consolidated financial statements3 Newly founded, financial statements not yet available
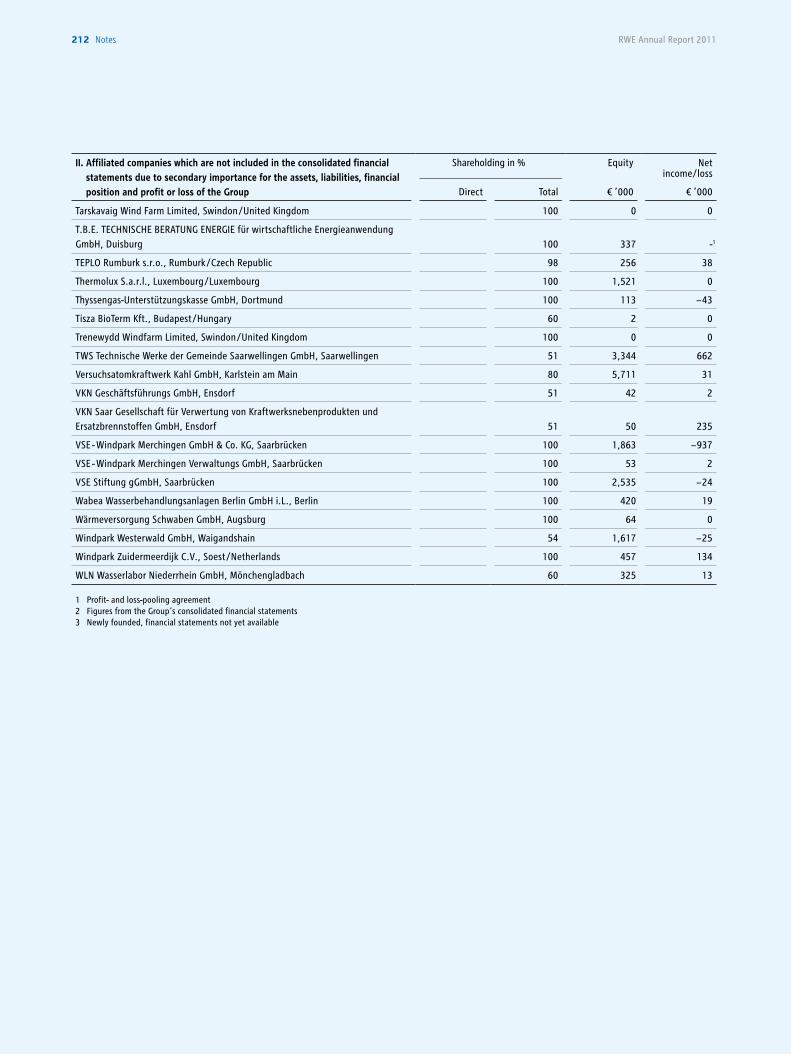
RWE Annual Report 2011212 notes
II. Affiliated companies which are not included in the consolidated financial statements due to secondary importance for the assets, liabilities, financial position and profit or loss of the Group
Shareholding in % Equity Net income/loss
Direct Total € ’000 € ’000
Tarskavaig Wind Farm Limited, Swindon /United Kingdom 100 0 0
T.B.E. TECHNISCHE BERATUNG ENERGIE für wirtschaftliche Energieanwendung GmbH, Duisburg 100 337 -1
TEPLO Rumburk s.r.o., Rumburk /Czech Republic 98 256 38
Thermolux S.a.r.l., Luxembourg /Luxembourg 100 1,521 0
Thyssengas-Unterstützungskasse GmbH, Dortmund 100 113 − 43
Tisza BioTerm Kft., Budapest /Hungary 60 2 0
Trenewydd Windfarm Limited, Swindon /United Kingdom 100 0 0
TWS Technische Werke der Gemeinde Saarwellingen GmbH, Saarwellingen 51 3,344 662
Versuchsatomkraftwerk Kahl GmbH, Karlstein am Main 80 5,711 31
VKN Geschäftsführungs GmbH, Ensdorf 51 42 2
VKN Saar Gesellschaft für Verwertung von Kraftwerksnebenprodukten und Ersatzbrennstoffen GmbH, Ensdorf 51 50 235
VSE - Windpark Merchingen GmbH & Co. KG, Saarbrücken 100 1,863 − 937
VSE - Windpark Merchingen Verwaltungs GmbH, Saarbrücken 100 53 2
VSE Stiftung gGmbH, Saarbrücken 100 2,535 − 24
Wabea Wasserbehandlungsanlagen Berlin GmbH i.L., Berlin 100 420 19
Wärmeversorgung Schwaben GmbH, Augsburg 100 64 0
Windpark Westerwald GmbH, Waigandshain 54 1,617 − 25
Windpark Zuidermeerdijk C.V., Soest /Netherlands 100 457 134
WLN Wasserlabor Niederrhein GmbH, Mönchengladbach 60 325 13
1 Profit- and loss-pooling agreement2 Figures from the Group‘s consolidated financial statements3 Newly founded, financial statements not yet available
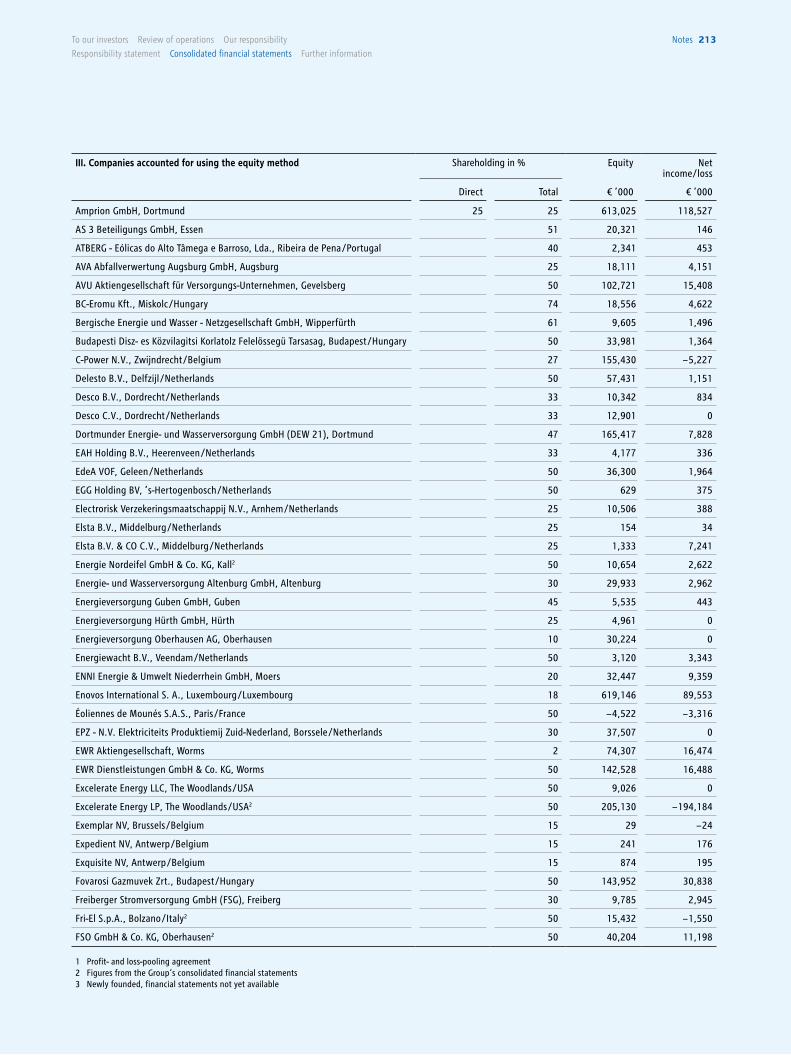
To our investors Review of operations our responsibility
Responsibility statement consolidated financial statements Further information
notes 213
III. Companies accounted for using the equity method Shareholding in % Equity Net income/loss
Direct Total € ’000 € ’000
Amprion GmbH, Dortmund 25 25 613,025 118,527
AS 3 Beteiligungs GmbH, Essen 51 20,321 146
ATBERG - Eólicas do Alto Tâmega e Barroso, Lda., Ribeira de Pena /Portugal 40 2,341 453
AVA Abfallverwertung Augsburg GmbH, Augsburg 25 18,111 4,151
AVU Aktiengesellschaft für Versorgungs-Unternehmen, Gevelsberg 50 102,721 15,408
BC-Eromu Kft., Miskolc /Hungary 74 18,556 4,622
Bergische Energie und Wasser - Netzgesellschaft GmbH, Wipperfürth 61 9,605 1,496
Budapesti Disz- es Közvilagitsi Korlatolz Felelössegü Tarsasag, Budapest /Hungary 50 33,981 1,364
C-Power N.V., Zwijndrecht /Belgium 27 155,430 − 5,227
Delesto B.V., Delfzijl /Netherlands 50 57,431 1,151
Desco B.V., Dordrecht /Netherlands 33 10,342 834
Desco C.V., Dordrecht /Netherlands 33 12,901 0
Dortmunder Energie- und Wasserversorgung GmbH (DEW 21), Dortmund 47 165,417 7,828
EAH Holding B.V., Heerenveen /Netherlands 33 4,177 336
EdeA VOF, Geleen /Netherlands 50 36,300 1,964
EGG Holding BV, ’s-Hertogenbosch /Netherlands 50 629 375
Electrorisk Verzekeringsmaatschappij N.V., Arnhem /Netherlands 25 10,506 388
Elsta B.V., Middelburg /Netherlands 25 154 34
Elsta B.V. & CO C.V., Middelburg /Netherlands 25 1,333 7,241
Energie Nordeifel GmbH & Co. KG, Kall2 50 10,654 2,622
Energie- und Wasserversorgung Altenburg GmbH, Altenburg 30 29,933 2,962
Energieversorgung Guben GmbH, Guben 45 5,535 443
Energieversorgung Hürth GmbH, Hürth 25 4,961 0
Energieversorgung Oberhausen AG, Oberhausen 10 30,224 0
Energiewacht B.V., Veendam /Netherlands 50 3,120 3,343
ENNI Energie & Umwelt Niederrhein GmbH, Moers 20 32,447 9,359
Enovos International S. A., Luxembourg /Luxembourg 18 619,146 89,553
Éoliennes de Mounés S.A.S., Paris /France 50 − 4,522 − 3,316
EPZ - N.V. Elektriciteits Produktiemij Zuid-Nederland, Borssele /Netherlands 30 37,507 0
EWR Aktiengesellschaft, Worms 2 74,307 16,474
EWR Dienstleistungen GmbH & Co. KG, Worms 50 142,528 16,488
Excelerate Energy LLC, The Woodlands /USA 50 9,026 0
Excelerate Energy LP, The Woodlands /USA2 50 205,130 − 194,184
Exemplar NV, Brussels /Belgium 15 29 − 24
Expedient NV, Antwerp /Belgium 15 241 176
Exquisite NV, Antwerp /Belgium 15 874 195
Fovarosi Gazmuvek Zrt., Budapest /Hungary 50 143,952 30,838
Freiberger Stromversorgung GmbH (FSG), Freiberg 30 9,785 2,945
Fri-El S.p.A., Bolzano /Italy2 50 15,432 − 1,550
FSO GmbH & Co. KG, Oberhausen2 50 40,204 11,198
1 Profit- and loss-pooling agreement2 Figures from the Group‘s consolidated financial statements3 Newly founded, financial statements not yet available
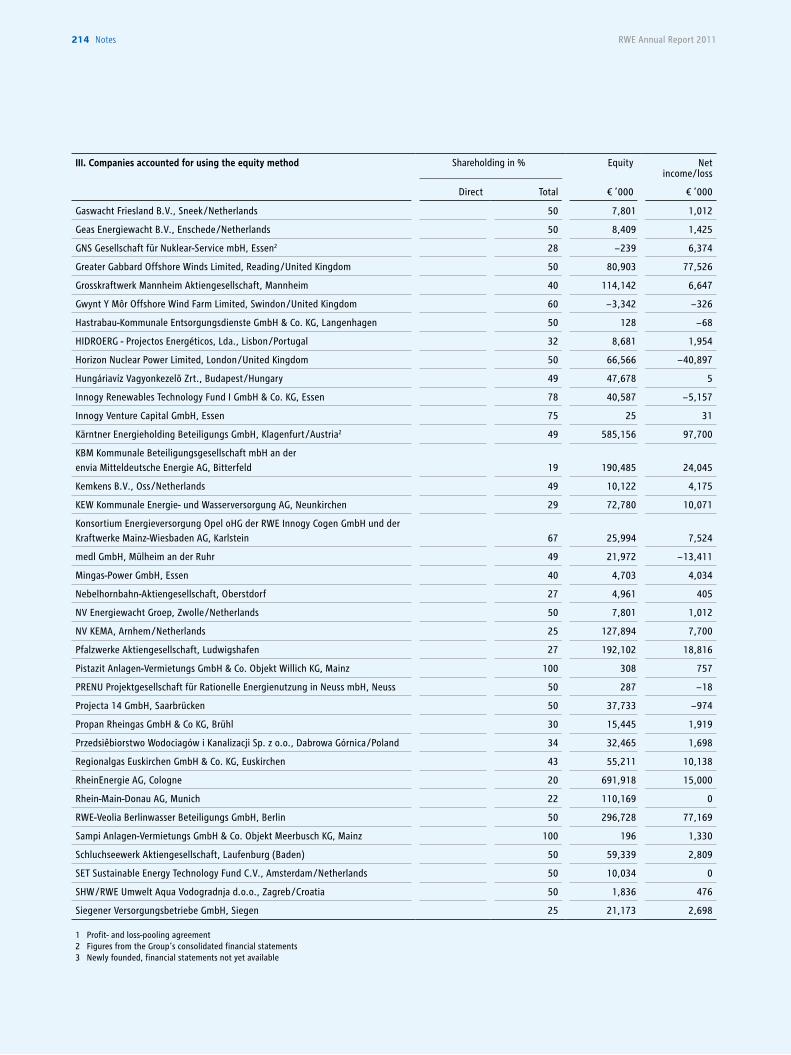
RWE Annual Report 2011214 notes
III. Companies accounted for using the equity method Shareholding in % Equity Net income/loss
Direct Total € ’000 € ’000
Gaswacht Friesland B.V., Sneek /Netherlands 50 7,801 1,012
Geas Energiewacht B.V., Enschede /Netherlands 50 8,409 1,425
GNS Gesellschaft für Nuklear-Service mbH, Essen2 28 − 239 6,374
Greater Gabbard Offshore Winds Limited, Reading /United Kingdom 50 80,903 77,526
Grosskraftwerk Mannheim Aktiengesellschaft, Mannheim 40 114,142 6,647
Gwynt Y Môr Offshore Wind Farm Limited, Swindon /United Kingdom 60 − 3,342 − 326
Hastrabau-Kommunale Entsorgungsdienste GmbH & Co. KG, Langenhagen 50 128 − 68
HIDROERG - Projectos Energéticos, Lda., Lisbon /Portugal 32 8,681 1,954
Horizon Nuclear Power Limited, London /United Kingdom 50 66,566 − 40,897
Hungáriavíz Vagyonkezelõ Zrt., Budapest /Hungary 49 47,678 5
Innogy Renewables Technology Fund I GmbH & Co. KG, Essen 78 40,587 − 5,157
Innogy Venture Capital GmbH, Essen 75 25 31
Kärntner Energieholding Beteiligungs GmbH, Klagenfurt /Austria2 49 585,156 97,700
KBM Kommunale Beteiligungsgesellschaft mbH an der envia Mitteldeutsche Energie AG, Bitterfeld 19 190,485 24,045
Kemkens B.V., Oss /Netherlands 49 10,122 4,175
KEW Kommunale Energie- und Wasserversorgung AG, Neunkirchen 29 72,780 10,071
Konsortium Energieversorgung Opel oHG der RWE Innogy Cogen GmbH und der Kraftwerke Mainz-Wiesbaden AG, Karlstein 67 25,994 7,524
medl GmbH, Mülheim an der Ruhr 49 21,972 − 13,411
Mingas-Power GmbH, Essen 40 4,703 4,034
Nebelhornbahn-Aktiengesellschaft, Oberstdorf 27 4,961 405
NV Energiewacht Groep, Zwolle /Netherlands 50 7,801 1,012
NV KEMA, Arnhem /Netherlands 25 127,894 7,700
Pfalzwerke Aktiengesellschaft, Ludwigshafen 27 192,102 18,816
Pistazit Anlagen-Vermietungs GmbH & Co. Objekt Willich KG, Mainz 100 308 757
PRENU Projektgesellschaft für Rationelle Energienutzung in Neuss mbH, Neuss 50 287 − 18
Projecta 14 GmbH, Saarbrücken 50 37,733 − 974
Propan Rheingas GmbH & Co KG, Brühl 30 15,445 1,919
Przedsiêbiorstwo Wodociagów i Kanalizacji Sp. z o.o., Dabrowa Górnica /Poland 34 32,465 1,698
Regionalgas Euskirchen GmbH & Co. KG, Euskirchen 43 55,211 10,138
RheinEnergie AG, Cologne 20 691,918 15,000
Rhein-Main-Donau AG, Munich 22 110,169 0
RWE-Veolia Berlinwasser Beteiligungs GmbH, Berlin 50 296,728 77,169
Sampi Anlagen-Vermietungs GmbH & Co. Objekt Meerbusch KG, Mainz 100 196 1,330
Schluchseewerk Aktiengesellschaft, Laufenburg (Baden) 50 59,339 2,809
SET Sustainable Energy Technology Fund C.V., Amsterdam /Netherlands 50 10,034 0
SHW /RWE Umwelt Aqua Vodogradnja d.o.o., Zagreb /Croatia 50 1,836 476
Siegener Versorgungsbetriebe GmbH, Siegen 25 21,173 2,698
1 Profit- and loss-pooling agreement2 Figures from the Group‘s consolidated financial statements3 Newly founded, financial statements not yet available
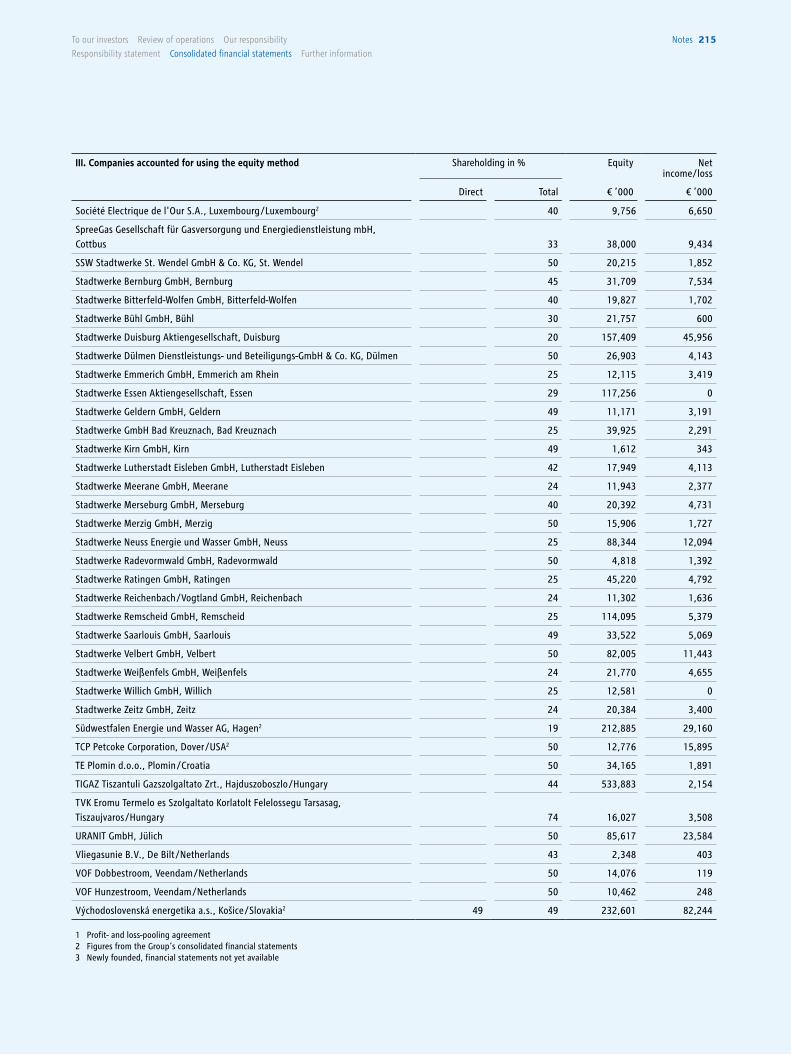
To our investors Review of operations our responsibility
Responsibility statement consolidated financial statements Further information
notes 215
III. Companies accounted for using the equity method Shareholding in % Equity Net income/loss
Direct Total € ’000 € ’000
Société Electrique de l'Our S.A., Luxembourg /Luxembourg2 40 9,756 6,650
SpreeGas Gesellschaft für Gasversorgung und Energiedienstleistung mbH, Cottbus 33 38,000 9,434
SSW Stadtwerke St. Wendel GmbH & Co. KG, St. Wendel 50 20,215 1,852
Stadtwerke Bernburg GmbH, Bernburg 45 31,709 7,534
Stadtwerke Bitterfeld-Wolfen GmbH, Bitterfeld-Wolfen 40 19,827 1,702
Stadtwerke Bühl GmbH, Bühl 30 21,757 600
Stadtwerke Duisburg Aktiengesellschaft, Duisburg 20 157,409 45,956
Stadtwerke Dülmen Dienstleistungs- und Beteiligungs-GmbH & Co. KG, Dülmen 50 26,903 4,143
Stadtwerke Emmerich GmbH, Emmerich am Rhein 25 12,115 3,419
Stadtwerke Essen Aktiengesellschaft, Essen 29 117,256 0
Stadtwerke Geldern GmbH, Geldern 49 11,171 3,191
Stadtwerke GmbH Bad Kreuznach, Bad Kreuznach 25 39,925 2,291
Stadtwerke Kirn GmbH, Kirn 49 1,612 343
Stadtwerke Lutherstadt Eisleben GmbH, Lutherstadt Eisleben 42 17,949 4,113
Stadtwerke Meerane GmbH, Meerane 24 11,943 2,377
Stadtwerke Merseburg GmbH, Merseburg 40 20,392 4,731
Stadtwerke Merzig GmbH, Merzig 50 15,906 1,727
Stadtwerke Neuss Energie und Wasser GmbH, Neuss 25 88,344 12,094
Stadtwerke Radevormwald GmbH, Radevormwald 50 4,818 1,392
Stadtwerke Ratingen GmbH, Ratingen 25 45,220 4,792
Stadtwerke Reichenbach /Vogtland GmbH, Reichenbach 24 11,302 1,636
Stadtwerke Remscheid GmbH, Remscheid 25 114,095 5,379
Stadtwerke Saarlouis GmbH, Saarlouis 49 33,522 5,069
Stadtwerke Velbert GmbH, Velbert 50 82,005 11,443
Stadtwerke Weißenfels GmbH, Weißenfels 24 21,770 4,655
Stadtwerke Willich GmbH, Willich 25 12,581 0
Stadtwerke Zeitz GmbH, Zeitz 24 20,384 3,400
Südwestfalen Energie und Wasser AG, Hagen2 19 212,885 29,160
TCP Petcoke Corporation, Dover /USA2 50 12,776 15,895
TE Plomin d.o.o., Plomin /Croatia 50 34,165 1,891
TIGAZ Tiszantuli Gazszolgaltato Zrt., Hajduszoboszlo /Hungary 44 533,883 2,154
TVK Eromu Termelo es Szolgaltato Korlatolt Felelossegu Tarsasag, Tiszaujvaros /Hungary 74 16,027 3,508
URANIT GmbH, Jülich 50 85,617 23,584
Vliegasunie B.V., De Bilt /Netherlands 43 2,348 403
VOF Dobbestroom, Veendam /Netherlands 50 14,076 119
VOF Hunzestroom, Veendam /Netherlands 50 10,462 248
Východoslovenská energetika a.s., Košice /Slovakia2 49 49 232,601 82,244
1 Profit- and loss-pooling agreement2 Figures from the Group‘s consolidated financial statements3 Newly founded, financial statements not yet available
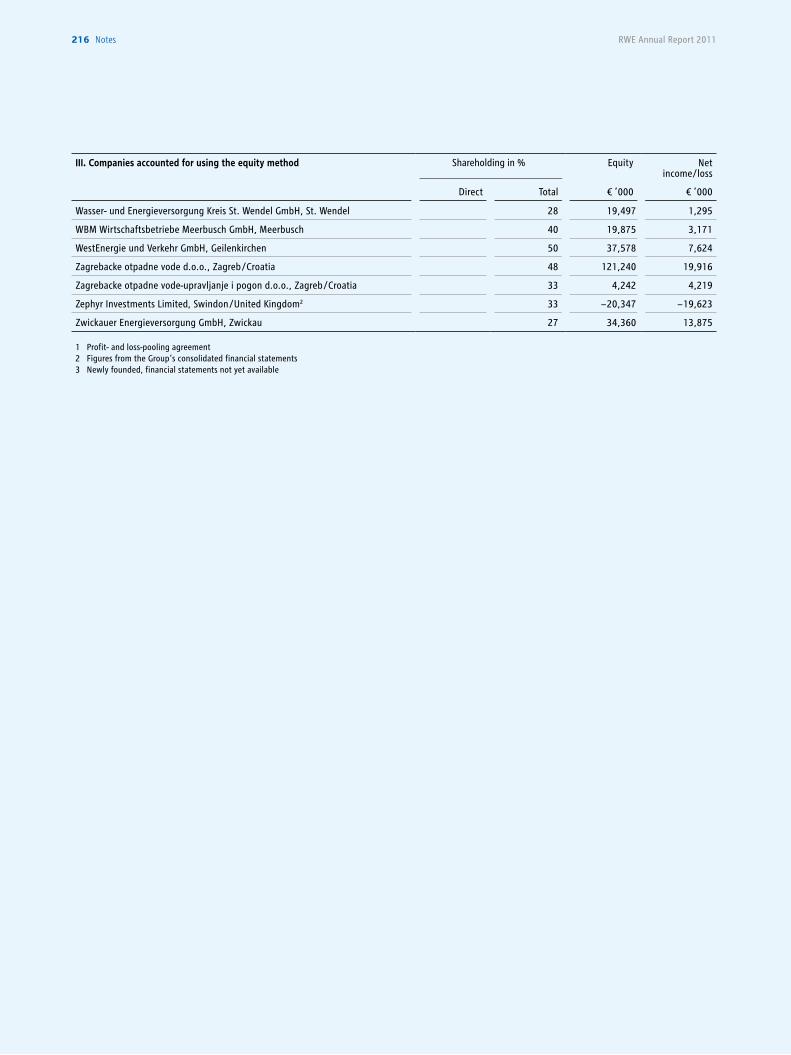
RWE Annual Report 2011216 notes
III. Companies accounted for using the equity method Shareholding in % Equity Net income/loss
Direct Total € ’000 € ’000
Wasser- und Energieversorgung Kreis St. Wendel GmbH, St. Wendel 28 19,497 1,295
WBM Wirtschaftsbetriebe Meerbusch GmbH, Meerbusch 40 19,875 3,171
WestEnergie und Verkehr GmbH, Geilenkirchen 50 37,578 7,624
Zagrebacke otpadne vode d.o.o., Zagreb /Croatia 48 121,240 19,916
Zagrebacke otpadne vode-upravljanje i pogon d.o.o., Zagreb /Croatia 33 4,242 4,219
Zephyr Investments Limited, Swindon /United Kingdom2 33 − 20,347 − 19,623
Zwickauer Energieversorgung GmbH, Zwickau 27 34,360 13,875
1 Profit- and loss-pooling agreement2 Figures from the Group‘s consolidated financial statements3 Newly founded, financial statements not yet available
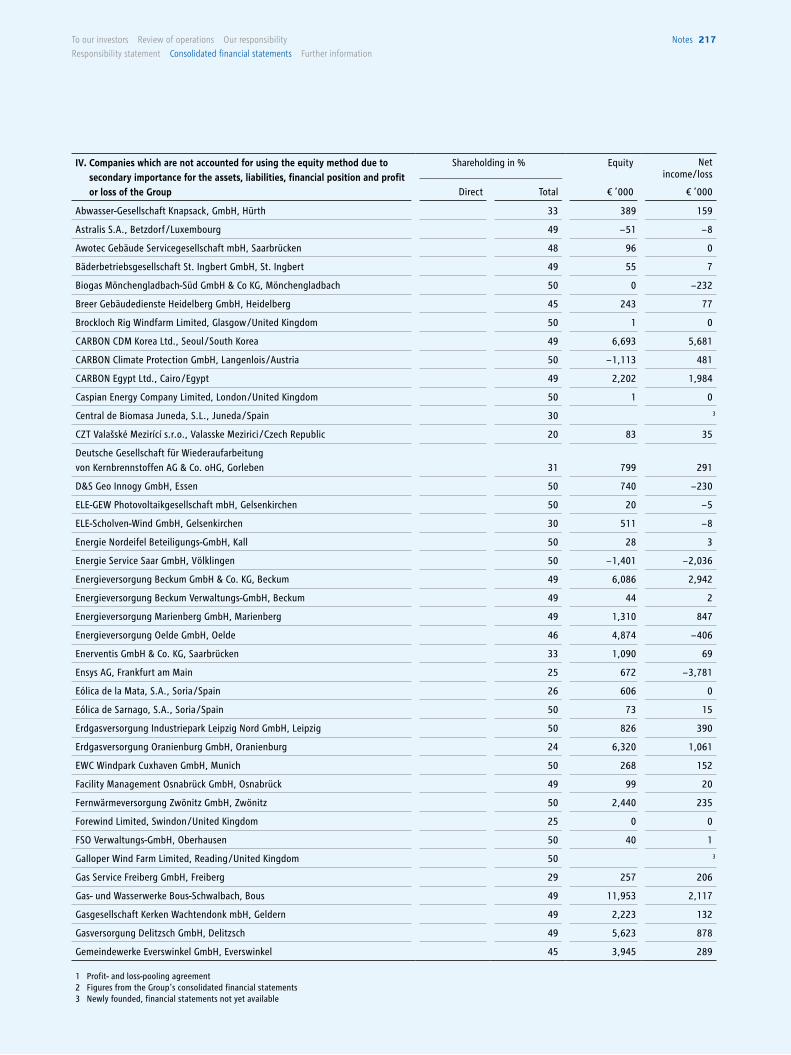
To our investors Review of operations our responsibility
Responsibility statement consolidated financial statements Further information
notes 217
-
IV. Companies which are not accounted for using the equity method due to secondary importance for the assets, liabilities, financial position and profit or loss of the Group
Shareholding in % Equity Net income/loss
Direct Total € ’000 € ’000
Abwasser-Gesellschaft Knapsack, GmbH, Hürth 33 389 159
Astralis S.A., Betzdorf /Luxembourg 49 − 51 − 8
Awotec Gebäude Servicegesellschaft mbH, Saarbrücken 48 96 0
Bäderbetriebsgesellschaft St. Ingbert GmbH, St. Ingbert 49 55 7
Biogas Mönchengladbach-Süd GmbH & Co KG, Mönchengladbach 50 0 − 232
Breer Gebäudedienste Heidelberg GmbH, Heidelberg 45 243 77
Brockloch Rig Windfarm Limited, Glasgow /United Kingdom 50 1 0
CARBON CDM Korea Ltd., Seoul /South Korea 49 6,693 5,681
CARBON Climate Protection GmbH, Langenlois /Austria 50 − 1,113 481
CARBON Egypt Ltd., Cairo /Egypt 49 2,202 1,984
Caspian Energy Company Limited, London /United Kingdom 50 1 0
Central de Biomasa Juneda, S.L., Juneda /Spain 30 3
CZT Valašské Mezirící s.r.o., Valasske Mezirici /Czech Republic 20 83 35
Deutsche Gesellschaft für Wiederaufarbeitung von Kernbrennstoffen AG & Co. oHG, Gorleben 31 799 291
D&S Geo Innogy GmbH, Essen 50 740 − 230
ELE-GEW Photovoltaikgesellschaft mbH, Gelsenkirchen 50 20 − 5
ELE-Scholven-Wind GmbH, Gelsenkirchen 30 511 − 8
Energie Nordeifel Beteiligungs-GmbH, Kall 50 28 3
Energie Service Saar GmbH, Völklingen 50 − 1,401 − 2,036
Energieversorgung Beckum GmbH & Co. KG, Beckum 49 6,086 2,942
Energieversorgung Beckum Verwaltungs-GmbH, Beckum 49 44 2
Energieversorgung Marienberg GmbH, Marienberg 49 1,310 847
Energieversorgung Oelde GmbH, Oelde 46 4,874 − 406
Enerventis GmbH & Co. KG, Saarbrücken 33 1,090 69
Ensys AG, Frankfurt am Main 25 672 − 3,781
Eólica de la Mata, S.A., Soria /Spain 26 606 0
Eólica de Sarnago, S.A., Soria /Spain 50 73 15
Erdgasversorgung Industriepark Leipzig Nord GmbH, Leipzig 50 826 390
Erdgasversorgung Oranienburg GmbH, Oranienburg 24 6,320 1,061
EWC Windpark Cuxhaven GmbH, Munich 50 268 152
Facility Management Osnabrück GmbH, Osnabrück 49 99 20
Fernwärmeversorgung Zwönitz GmbH, Zwönitz 50 2,440 235
Forewind Limited, Swindon /United Kingdom 25 0 0
FSO Verwaltungs-GmbH, Oberhausen 50 40 1
Galloper Wind Farm Limited, Reading /United Kingdom 50 3
Gas Service Freiberg GmbH, Freiberg 29 257 206
Gas- und Wasserwerke Bous-Schwalbach, Bous 49 11,953 2,117
Gasgesellschaft Kerken Wachtendonk mbH, Geldern 49 2,223 132
Gasversorgung Delitzsch GmbH, Delitzsch 49 5,623 878
Gemeindewerke Everswinkel GmbH, Everswinkel 45 3,945 289
1 Profit- and loss-pooling agreement2 Figures from the Group‘s consolidated financial statements3 Newly founded, financial statements not yet available
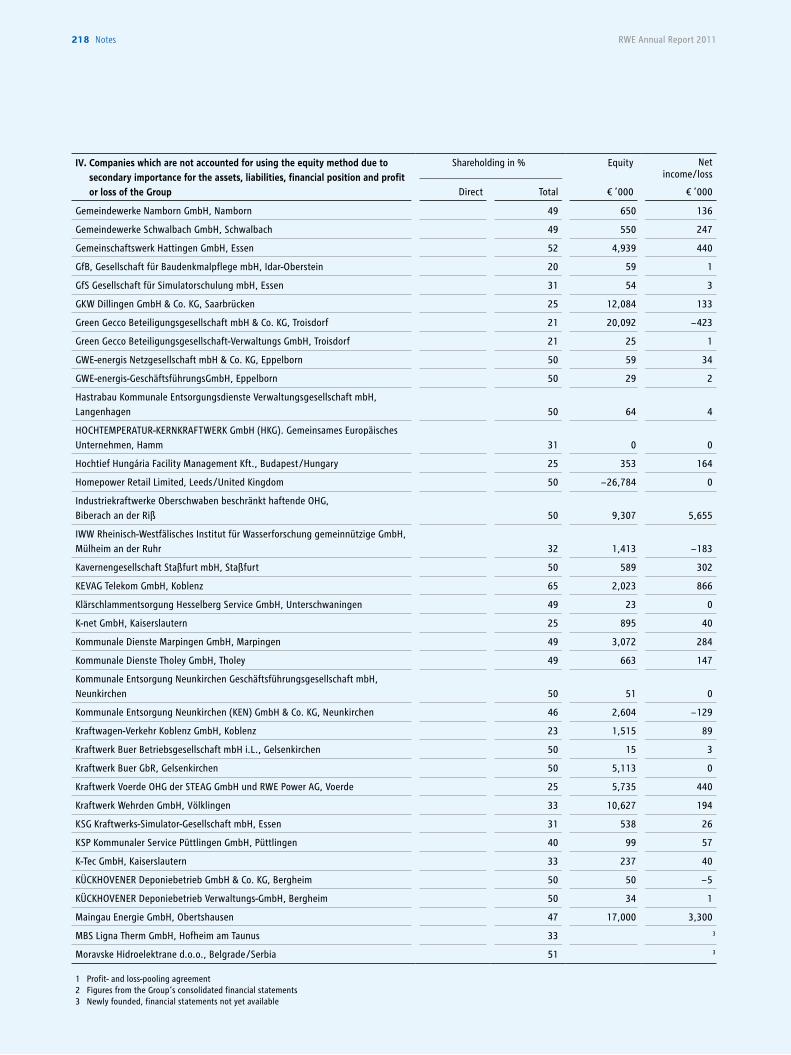
RWE Annual Report 2011218 notes
IV. Companies which are not accounted for using the equity method due to secondary importance for the assets, liabilities, financial position and profit or loss of the Group
Shareholding in % Equity Net income/loss
Direct Total € ’000 € ’000
Gemeindewerke Namborn GmbH, Namborn 49 650 136
Gemeindewerke Schwalbach GmbH, Schwalbach 49 550 247
Gemeinschaftswerk Hattingen GmbH, Essen 52 4,939 440
GfB, Gesellschaft für Baudenkmalpflege mbH, Idar-Oberstein 20 59 1
GfS Gesellschaft für Simulatorschulung mbH, Essen 31 54 3
GKW Dillingen GmbH & Co. KG, Saarbrücken 25 12,084 133
Green Gecco Beteiligungsgesellschaft mbH & Co. KG, Troisdorf 21 20,092 − 423
Green Gecco Beteiligungsgesellschaft-Verwaltungs GmbH, Troisdorf 21 25 1
GWE-energis Netzgesellschaft mbH & Co. KG, Eppelborn 50 59 34
GWE-energis-GeschäftsführungsGmbH, Eppelborn 50 29 2
Hastrabau Kommunale Entsorgungsdienste Verwaltungsgesellschaft mbH, Langenhagen 50 64 4
HOCHTEMPERATUR-KERNKRAFTWERK GmbH (HKG). Gemeinsames Europäisches Unternehmen, Hamm 31 0 0
Hochtief Hungária Facility Management Kft., Budapest /Hungary 25 353 164
Homepower Retail Limited, Leeds /United Kingdom 50 − 26,784 0
Industriekraftwerke Oberschwaben beschränkt haftende OHG, Biberach an der Riß 50 9,307 5,655
IWW Rheinisch-Westfälisches Institut für Wasserforschung gemeinnützige GmbH, Mülheim an der Ruhr 32 1,413 − 183
Kavernengesellschaft Staßfurt mbH, Staßfurt 50 589 302
KEVAG Telekom GmbH, Koblenz 65 2,023 866
Klärschlammentsorgung Hesselberg Service GmbH, Unterschwaningen 49 23 0
K-net GmbH, Kaiserslautern 25 895 40
Kommunale Dienste Marpingen GmbH, Marpingen 49 3,072 284
Kommunale Dienste Tholey GmbH, Tholey 49 663 147
Kommunale Entsorgung Neunkirchen Geschäftsführungsgesellschaft mbH, Neunkirchen 50 51 0
Kommunale Entsorgung Neunkirchen (KEN) GmbH & Co. KG, Neunkirchen 46 2,604 − 129
Kraftwagen-Verkehr Koblenz GmbH, Koblenz 23 1,515 89
Kraftwerk Buer Betriebsgesellschaft mbH i.L., Gelsenkirchen 50 15 3
Kraftwerk Buer GbR, Gelsenkirchen 50 5,113 0
Kraftwerk Voerde OHG der STEAG GmbH und RWE Power AG, Voerde 25 5,735 440
Kraftwerk Wehrden GmbH, Völklingen 33 10,627 194
KSG Kraftwerks-Simulator-Gesellschaft mbH, Essen 31 538 26
KSP Kommunaler Service Püttlingen GmbH, Püttlingen 40 99 57
K-Tec GmbH, Kaiserslautern 33 237 40
KÜCKHOVENER Deponiebetrieb GmbH & Co. KG, Bergheim 50 50 − 5
KÜCKHOVENER Deponiebetrieb Verwaltungs-GmbH, Bergheim 50 34 1
Maingau Energie GmbH, Obertshausen 47 17,000 3,300
MBS Ligna Therm GmbH, Hofheim am Taunus 33 3
Moravske Hidroelektrane d.o.o., Belgrade /Serbia 51 3
1 Profit- and loss-pooling agreement2 Figures from the Group‘s consolidated financial statements3 Newly founded, financial statements not yet available
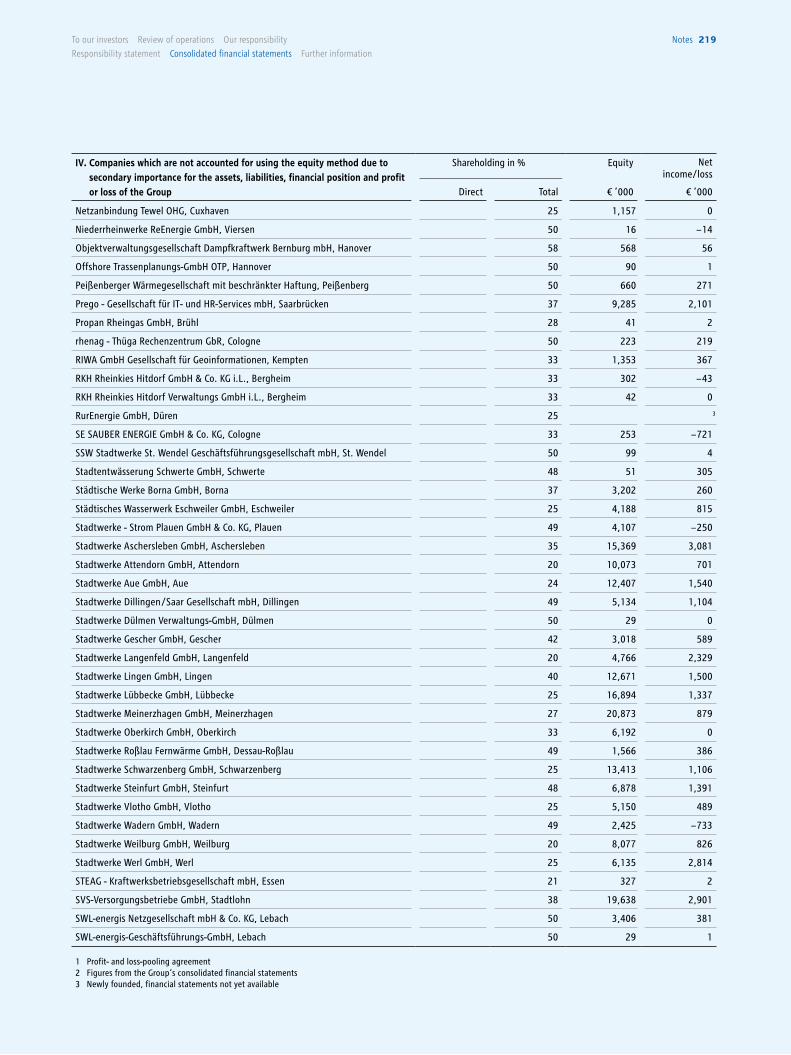
To our investors Review of operations our responsibility
Responsibility statement consolidated financial statements Further information
notes 219
IV. Companies which are not accounted for using the equity method due to secondary importance for the assets, liabilities, financial position and profit or loss of the Group
Shareholding in % Equity Net income/loss
Direct Total € ’000 € ’000
Netzanbindung Tewel OHG, Cuxhaven 25 1,157 0
Niederrheinwerke ReEnergie GmbH, Viersen 50 16 − 14
Objektverwaltungsgesellschaft Dampfkraftwerk Bernburg mbH, Hanover 58 568 56
Offshore Trassenplanungs-GmbH OTP, Hannover 50 90 1
Peißenberger Wärmegesellschaft mit beschränkter Haftung, Peißenberg 50 660 271
Prego - Gesellschaft für IT- und HR-Services mbH, Saarbrücken 37 9,285 2,101
Propan Rheingas GmbH, Brühl 28 41 2
rhenag - Thüga Rechenzentrum GbR, Cologne 50 223 219
RIWA GmbH Gesellschaft für Geoinformationen, Kempten 33 1,353 367
RKH Rheinkies Hitdorf GmbH & Co. KG i.L., Bergheim 33 302 − 43
RKH Rheinkies Hitdorf Verwaltungs GmbH i.L., Bergheim 33 42 0
RurEnergie GmbH, Düren 25 3
SE SAUBER ENERGIE GmbH & Co. KG, Cologne 33 253 − 721
SSW Stadtwerke St. Wendel Geschäftsführungsgesellschaft mbH, St. Wendel 50 99 4
Stadtentwässerung Schwerte GmbH, Schwerte 48 51 305
Städtische Werke Borna GmbH, Borna 37 3,202 260
Städtisches Wasserwerk Eschweiler GmbH, Eschweiler 25 4,188 815
Stadtwerke - Strom Plauen GmbH & Co. KG, Plauen 49 4,107 − 250
Stadtwerke Aschersleben GmbH, Aschersleben 35 15,369 3,081
Stadtwerke Attendorn GmbH, Attendorn 20 10,073 701
Stadtwerke Aue GmbH, Aue 24 12,407 1,540
Stadtwerke Dillingen /Saar Gesellschaft mbH, Dillingen 49 5,134 1,104
Stadtwerke Dülmen Verwaltungs-GmbH, Dülmen 50 29 0
Stadtwerke Gescher GmbH, Gescher 42 3,018 589
Stadtwerke Langenfeld GmbH, Langenfeld 20 4,766 2,329
Stadtwerke Lingen GmbH, Lingen 40 12,671 1,500
Stadtwerke Lübbecke GmbH, Lübbecke 25 16,894 1,337
Stadtwerke Meinerzhagen GmbH, Meinerzhagen 27 20,873 879
Stadtwerke Oberkirch GmbH, Oberkirch 33 6,192 0
Stadtwerke Roßlau Fernwärme GmbH, Dessau-Roßlau 49 1,566 386
Stadtwerke Schwarzenberg GmbH, Schwarzenberg 25 13,413 1,106
Stadtwerke Steinfurt GmbH, Steinfurt 48 6,878 1,391
Stadtwerke Vlotho GmbH, Vlotho 25 5,150 489
Stadtwerke Wadern GmbH, Wadern 49 2,425 − 733
Stadtwerke Weilburg GmbH, Weilburg 20 8,077 826
Stadtwerke Werl GmbH, Werl 25 6,135 2,814
STEAG - Kraftwerksbetriebsgesellschaft mbH, Essen 21 327 2
SVS-Versorgungsbetriebe GmbH, Stadtlohn 38 19,638 2,901
SWL-energis Netzgesellschaft mbH & Co. KG, Lebach 50 3,406 381
SWL-energis-Geschäftsführungs-GmbH, Lebach 50 29 1
1 Profit- and loss-pooling agreement2 Figures from the Group‘s consolidated financial statements3 Newly founded, financial statements not yet available
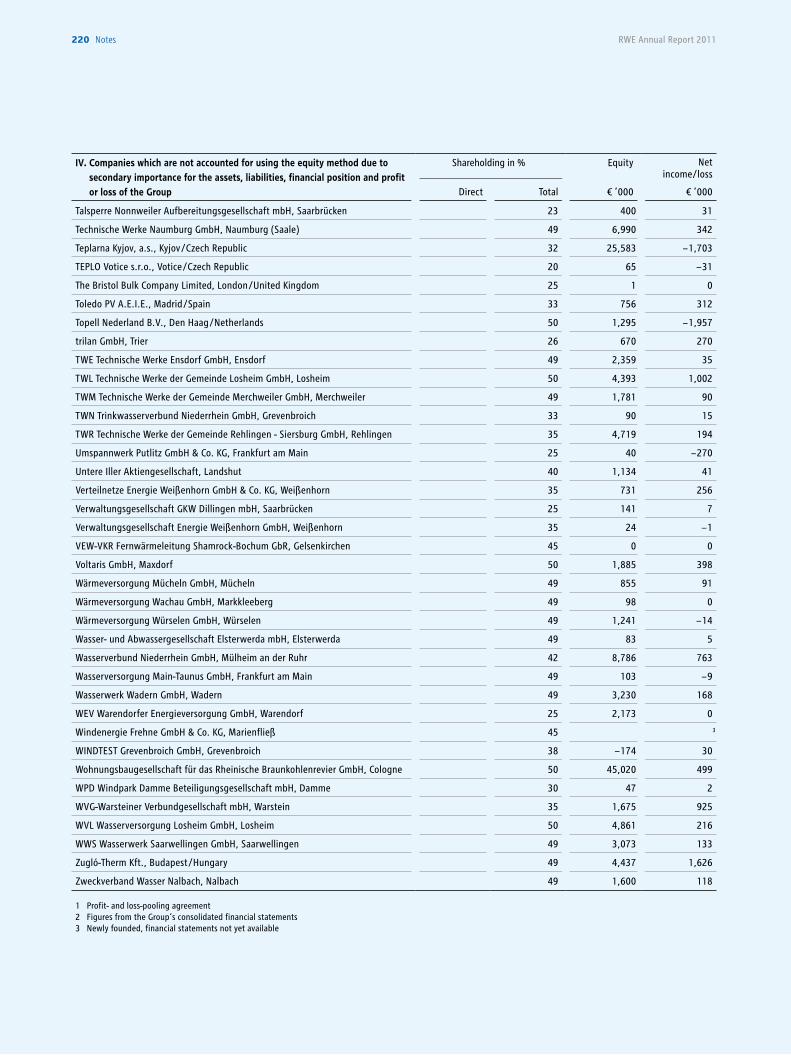
RWE Annual Report 2011220 notes
IV. Companies which are not accounted for using the equity method due to secondary importance for the assets, liabilities, financial position and profit or loss of the Group
Shareholding in % Equity Net income/loss
Direct Total € ’000 € ’000
Talsperre Nonnweiler Aufbereitungsgesellschaft mbH, Saarbrücken 23 400 31
Technische Werke Naumburg GmbH, Naumburg (Saale) 49 6,990 342
Teplarna Kyjov, a.s., Kyjov /Czech Republic 32 25,583 − 1,703
TEPLO Votice s.r.o., Votice /Czech Republic 20 65 − 31
The Bristol Bulk Company Limited, London /United Kingdom 25 1 0
Toledo PV A.E.I.E., Madrid /Spain 33 756 312
Topell Nederland B.V., Den Haag /Netherlands 50 1,295 − 1,957
trilan GmbH, Trier 26 670 270
TWE Technische Werke Ensdorf GmbH, Ensdorf 49 2,359 35
TWL Technische Werke der Gemeinde Losheim GmbH, Losheim 50 4,393 1,002
TWM Technische Werke der Gemeinde Merchweiler GmbH, Merchweiler 49 1,781 90
TWN Trinkwasserverbund Niederrhein GmbH, Grevenbroich 33 90 15
TWR Technische Werke der Gemeinde Rehlingen - Siersburg GmbH, Rehlingen 35 4,719 194
Umspannwerk Putlitz GmbH & Co. KG, Frankfurt am Main 25 40 − 270
Untere Iller Aktiengesellschaft, Landshut 40 1,134 41
Verteilnetze Energie Weißenhorn GmbH & Co. KG, Weißenhorn 35 731 256
Verwaltungsgesellschaft GKW Dillingen mbH, Saarbrücken 25 141 7
Verwaltungsgesellschaft Energie Weißenhorn GmbH, Weißenhorn 35 24 − 1
VEW-VKR Fernwärmeleitung Shamrock-Bochum GbR, Gelsenkirchen 45 0 0
Voltaris GmbH, Maxdorf 50 1,885 398
Wärmeversorgung Mücheln GmbH, Mücheln 49 855 91
Wärmeversorgung Wachau GmbH, Markkleeberg 49 98 0
Wärmeversorgung Würselen GmbH, Würselen 49 1,241 − 14
Wasser- und Abwassergesellschaft Elsterwerda mbH, Elsterwerda 49 83 5
Wasserverbund Niederrhein GmbH, Mülheim an der Ruhr 42 8,786 763
Wasserversorgung Main-Taunus GmbH, Frankfurt am Main 49 103 − 9
Wasserwerk Wadern GmbH, Wadern 49 3,230 168
WEV Warendorfer Energieversorgung GmbH, Warendorf 25 2,173 0
Windenergie Frehne GmbH & Co. KG, Marienfließ 45 3
WINDTEST Grevenbroich GmbH, Grevenbroich 38 − 174 30
Wohnungsbaugesellschaft für das Rheinische Braunkohlenrevier GmbH, Cologne 50 45,020 499
WPD Windpark Damme Beteiligungsgesellschaft mbH, Damme 30 47 2
WVG-Warsteiner Verbundgesellschaft mbH, Warstein 35 1,675 925
WVL Wasserversorgung Losheim GmbH, Losheim 50 4,861 216
WWS Wasserwerk Saarwellingen GmbH, Saarwellingen 49 3,073 133
Zugló-Therm Kft., Budapest /Hungary 49 4,437 1,626
Zweckverband Wasser Nalbach, Nalbach 49 1,600 118
1 Profit- and loss-pooling agreement2 Figures from the Group‘s consolidated financial statements3 Newly founded, financial statements not yet available
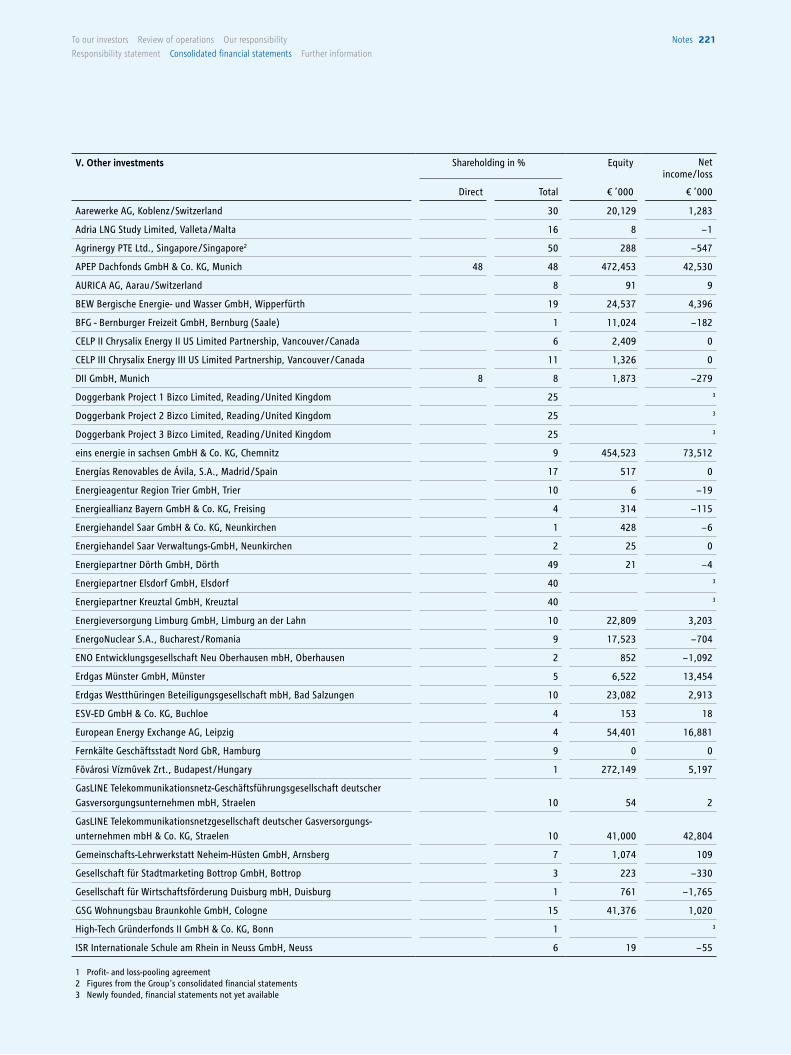
To our investors Review of operations our responsibility
Responsibility statement consolidated financial statements Further information
notes 221
V. Other investments Shareholding in % Equity Net income/loss
Direct Total € ’000 € ’000
Aarewerke AG, Koblenz /Switzerland 30 20,129 1,283
Adria LNG Study Limited, Valleta /Malta 16 8 − 1
Agrinergy PTE Ltd., Singapore /Singapore2 50 288 − 547
APEP Dachfonds GmbH & Co. KG, Munich 48 48 472,453 42,530
AURICA AG, Aarau /Switzerland 8 91 9
BEW Bergische Energie- und Wasser GmbH, Wipperfürth 19 24,537 4,396
BFG - Bernburger Freizeit GmbH, Bernburg (Saale) 1 11,024 − 182
CELP II Chrysalix Energy II US Limited Partnership, Vancouver /Canada 6 2,409 0
CELP III Chrysalix Energy III US Limited Partnership, Vancouver /Canada 11 1,326 0
DII GmbH, Munich 8 8 1,873 − 279
Doggerbank Project 1 Bizco Limited, Reading /United Kingdom 25 3
Doggerbank Project 2 Bizco Limited, Reading /United Kingdom 25 3
Doggerbank Project 3 Bizco Limited, Reading /United Kingdom 25 3
eins energie in sachsen GmbH & Co. KG, Chemnitz 9 454,523 73,512
Energías Renovables de Ávila, S.A., Madrid /Spain 17 517 0
Energieagentur Region Trier GmbH, Trier 10 6 − 19
Energieallianz Bayern GmbH & Co. KG, Freising 4 314 − 115
Energiehandel Saar GmbH & Co. KG, Neunkirchen 1 428 − 6
Energiehandel Saar Verwaltungs-GmbH, Neunkirchen 2 25 0
Energiepartner Dörth GmbH, Dörth 49 21 − 4
Energiepartner Elsdorf GmbH, Elsdorf 40 3
Energiepartner Kreuztal GmbH, Kreuztal 40 3
Energieversorgung Limburg GmbH, Limburg an der Lahn 10 22,809 3,203
EnergoNuclear S.A., Bucharest /Romania 9 17,523 − 704
ENO Entwicklungsgesellschaft Neu Oberhausen mbH, Oberhausen 2 852 − 1,092
Erdgas Münster GmbH, Münster 5 6,522 13,454
Erdgas Westthüringen Beteiligungsgesellschaft mbH, Bad Salzungen 10 23,082 2,913
ESV-ED GmbH & Co. KG, Buchloe 4 153 18
European Energy Exchange AG, Leipzig 4 54,401 16,881
Fernkälte Geschäftsstadt Nord GbR, Hamburg 9 0 0
Fõvárosi Vízmûvek Zrt., Budapest /Hungary 1 272,149 5,197
GasLINE Telekommunikationsnetz-Geschäftsführungsgesellschaft deutscher Gasversorgungsunternehmen mbH, Straelen 10 54 2
GasLINE Telekommunikationsnetzgesellschaft deutscher Gasversorgungs-unternehmen mbH & Co. KG, Straelen 10 41,000 42,804
Gemeinschafts-Lehrwerkstatt Neheim-Hüsten GmbH, Arnsberg 7 1,074 109
Gesellschaft für Stadtmarketing Bottrop GmbH, Bottrop 3 223 − 330
Gesellschaft für Wirtschaftsförderung Duisburg mbH, Duisburg 1 761 − 1,765
GSG Wohnungsbau Braunkohle GmbH, Cologne 15 41,376 1,020
High-Tech Gründerfonds II GmbH & Co. KG, Bonn 1 3
ISR Internationale Schule am Rhein in Neuss GmbH, Neuss 6 19 − 55
1 Profit- and loss-pooling agreement2 Figures from the Group‘s consolidated financial statements3 Newly founded, financial statements not yet available
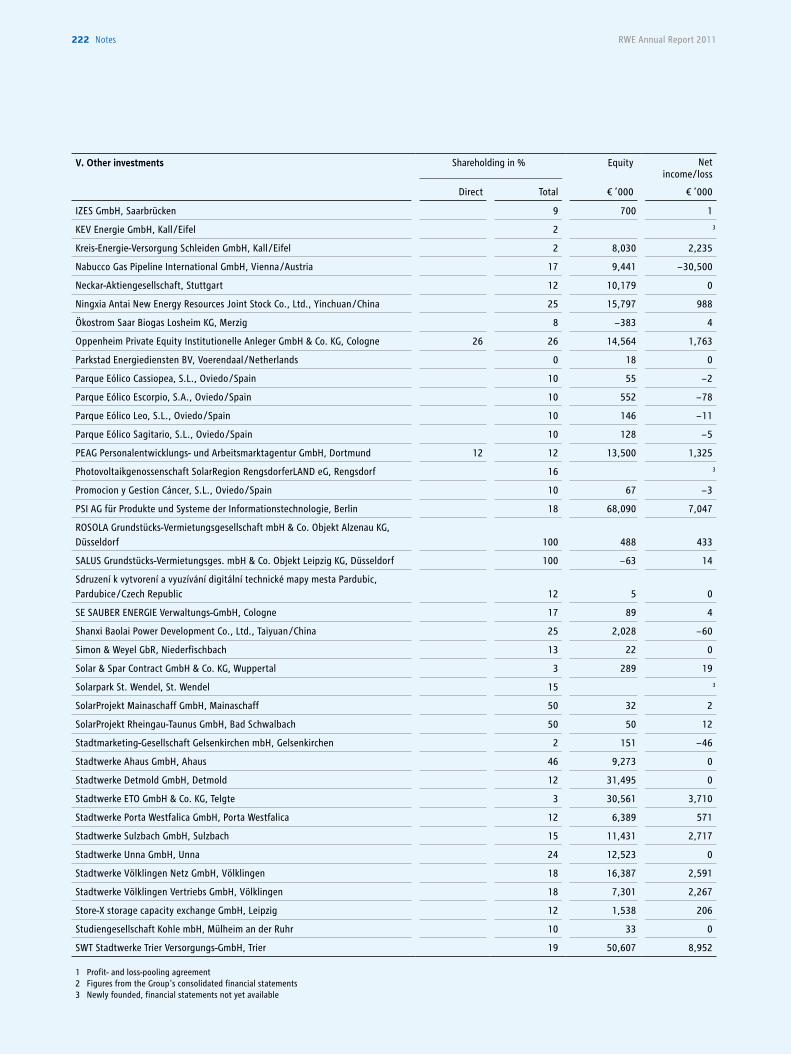
RWE Annual Report 2011222 notes
V. Other investments Shareholding in % Equity Net income/loss
Direct Total € ’000 € ’000
IZES GmbH, Saarbrücken 9 700 1
KEV Energie GmbH, Kall /Eifel 2 3
Kreis-Energie-Versorgung Schleiden GmbH, Kall /Eifel 2 8,030 2,235
Nabucco Gas Pipeline International GmbH, Vienna /Austria 17 9,441 − 30,500
Neckar-Aktiengesellschaft, Stuttgart 12 10,179 0
Ningxia Antai New Energy Resources Joint Stock Co., Ltd., Yinchuan /China 25 15,797 988
Ökostrom Saar Biogas Losheim KG, Merzig 8 − 383 4
Oppenheim Private Equity Institutionelle Anleger GmbH & Co. KG, Cologne 26 26 14,564 1,763
Parkstad Energiediensten BV, Voerendaal /Netherlands 0 18 0
Parque Eólico Cassiopea, S.L., Oviedo /Spain 10 55 − 2
Parque Eólico Escorpio, S.A., Oviedo /Spain 10 552 − 78
Parque Eólico Leo, S.L., Oviedo /Spain 10 146 − 11
Parque Eólico Sagitario, S.L., Oviedo /Spain 10 128 − 5
PEAG Personalentwicklungs- und Arbeitsmarktagentur GmbH, Dortmund 12 12 13,500 1,325
Photovoltaikgenossenschaft SolarRegion RengsdorferLAND eG, Rengsdorf 16 3
Promocion y Gestion Cáncer, S.L., Oviedo /Spain 10 67 − 3
PSI AG für Produkte und Systeme der Informationstechnologie, Berlin 18 68,090 7,047
ROSOLA Grundstücks-Vermietungsgesellschaft mbH & Co. Objekt Alzenau KG, Düsseldorf 100 488 433
SALUS Grundstücks-Vermietungsges. mbH & Co. Objekt Leipzig KG, Düsseldorf 100 − 63 14
Sdruzení k vytvorení a vyuzívání digitální technické mapy mesta Pardubic, Pardubice /Czech Republic 12 5 0
SE SAUBER ENERGIE Verwaltungs-GmbH, Cologne 17 89 4
Shanxi Baolai Power Development Co., Ltd., Taiyuan /China 25 2,028 − 60
Simon & Weyel GbR, Niederfischbach 13 22 0
Solar & Spar Contract GmbH & Co. KG, Wuppertal 3 289 19
Solarpark St. Wendel, St. Wendel 15 3
SolarProjekt Mainaschaff GmbH, Mainaschaff 50 32 2
SolarProjekt Rheingau-Taunus GmbH, Bad Schwalbach 50 50 12
Stadtmarketing-Gesellschaft Gelsenkirchen mbH, Gelsenkirchen 2 151 − 46
Stadtwerke Ahaus GmbH, Ahaus 46 9,273 0
Stadtwerke Detmold GmbH, Detmold 12 31,495 0
Stadtwerke ETO GmbH & Co. KG, Telgte 3 30,561 3,710
Stadtwerke Porta Westfalica GmbH, Porta Westfalica 12 6,389 571
Stadtwerke Sulzbach GmbH, Sulzbach 15 11,431 2,717
Stadtwerke Unna GmbH, Unna 24 12,523 0
Stadtwerke Völklingen Netz GmbH, Völklingen 18 16,387 2,591
Stadtwerke Völklingen Vertriebs GmbH, Völklingen 18 7,301 2,267
Store-X storage capacity exchange GmbH, Leipzig 12 1,538 206
Studiengesellschaft Kohle mbH, Mülheim an der Ruhr 10 33 0
SWT Stadtwerke Trier Versorgungs-GmbH, Trier 19 50,607 8,952
1 Profit- and loss-pooling agreement2 Figures from the Group‘s consolidated financial statements3 Newly founded, financial statements not yet available
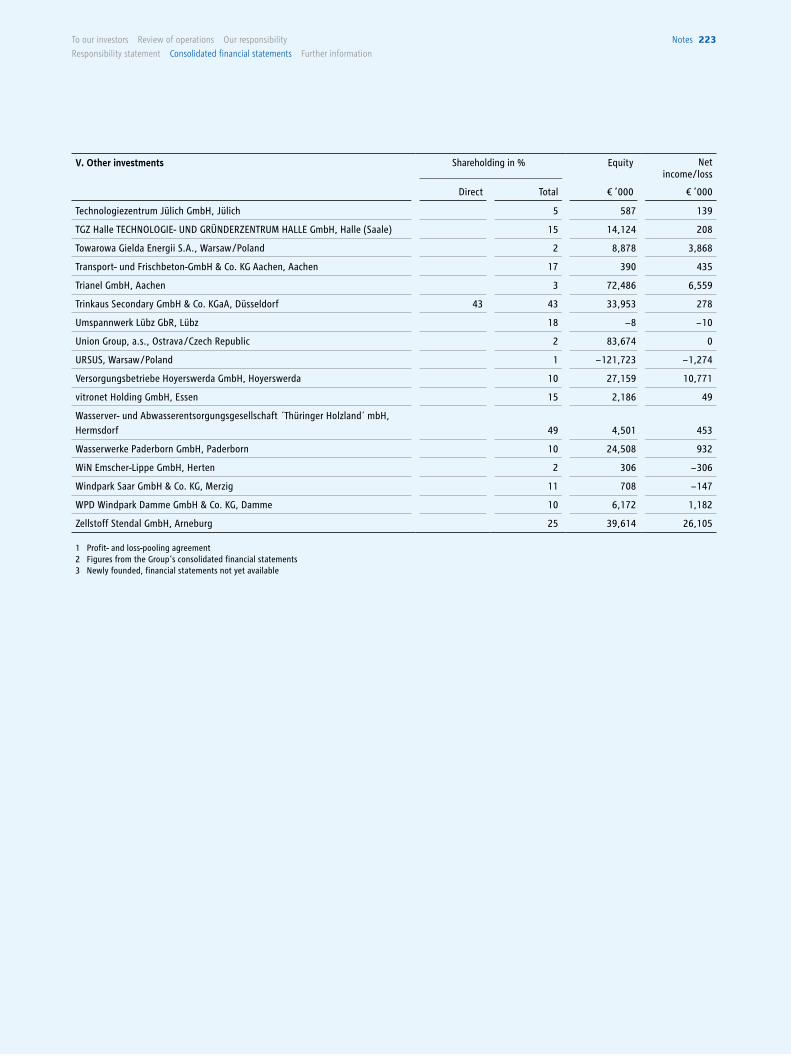
To our investors Review of operations our responsibility
Responsibility statement consolidated financial statements Further information
notes 223
V. Other investments Shareholding in % Equity Net income/loss
Direct Total € ’000 € ’000
Technologiezentrum Jülich GmbH, Jülich 5 587 139
TGZ Halle TECHNOLOGIE- UND GRÜNDERZENTRUM HALLE GmbH, Halle (Saale) 15 14,124 208
Towarowa Gielda Energii S.A., Warsaw /Poland 2 8,878 3,868
Transport- und Frischbeton-GmbH & Co. KG Aachen, Aachen 17 390 435
Trianel GmbH, Aachen 3 72,486 6,559
Trinkaus Secondary GmbH & Co. KGaA, Düsseldorf 43 43 33,953 278
Umspannwerk Lübz GbR, Lübz 18 − 8 − 10
Union Group, a.s., Ostrava /Czech Republic 2 83,674 0
URSUS, Warsaw /Poland 1 − 121,723 − 1,274
Versorgungsbetriebe Hoyerswerda GmbH, Hoyerswerda 10 27,159 10,771
vitronet Holding GmbH, Essen 15 2,186 49
Wasserver- und Abwasserentsorgungsgesellschaft Thüringer Holzland mbH, Hermsdorf 49 4,501 453
Wasserwerke Paderborn GmbH, Paderborn 10 24,508 932
WiN Emscher-Lippe GmbH, Herten 2 306 − 306
Windpark Saar GmbH & Co. KG, Merzig 11 708 − 147
WPD Windpark Damme GmbH & Co. KG, Damme 10 6,172 1,182
Zellstoff Stendal GmbH, Arneburg 25 39,614 26,105
1 Profit- and loss-pooling agreement2 Figures from the Group‘s consolidated financial statements3 Newly founded, financial statements not yet available
RWE Annual Report 2011224 independent auditors’ Report
4.9 iNdEpENdENT audiTOrS’ rEpOrT
To RWE Aktiengesellschaft, Essen
Report on the Consolidated FinancialStatements
We have audited the accompanying consolidated financial
statements of RWE Aktiengesellschaft, Essen, and its subsidia-
ries, which comprise the income statement and statement of
recognised income and expenses, balance sheet, cash flow
statement, statement of changes in equity and the notes to the
financial statements for the business year from 1 January to
31 December 2011.
Executive Board‘s Responsibility for the Consolidated Financial
Statements
The Executive Board of RWE Aktiengesellschaft is responsible
for the preparation of these consolidated financial statements.
This responsibility includes that these consolidated financial
statements are prepared in accordance with International Finan-
cial Reporting Standards, as adopted by the EU, and the additi-
onal requirements of German commercial law pursuant to
§ (Article) 315a Abs. (paragraph) 1 HGB („Handelsgesetzbuch“:
German Commercial Code) and that these consolidated financial
statements give a true and fair view of the net assets, financial
position and results of operations of the Group in accordance
with these requirements. The Executive Board is also respon-
sible for the internal controls as the Executive Board determines
are necessary to enable the preparation of consolidated
financial statements that are free from material misstatement,
whether due to fraud or error.
Auditor’s Responsibility
Our responsibility is to express an opinion on these consolida-
ted financial statements based on our audit. We conducted our
audit in accordance with § 317 HGB and German generally
accepted standards for the audit of financial statements pro-
mulgated by the Institut der Wirtschaftsprüfer (Institute of Pub-
lic Auditors in Germany) (IDW) and additionally observed the
International Standards on Auditing (ISA). Accordingly, we are
required to comply with ethical requirements and plan and per-
form the audit to obtain reasonable assurance about whether
the consolidated financial statements are free from material
misstatement.
An audit involves performing audit procedures to obtain audit
evidence about the amounts and disclosures in the consolida-
ted financial statements. The selection of audit procedures
depends on the auditor’s professional judgment. This includes
the assessment of the risks of material misstatement of the con-
solidated financial statements, whether due to fraud or error. In
assessing those risks, the auditor considers the internal control
system relevant to the entity’s preparation of consolidated
financial statements that give a true and fair view. The aim of
this is to plan and perform audit procedures that are appropri-
ate in the given circumstances, but not for the purpose of
expressing an opinion on the effectiveness of the group‘s inter-
nal control system. An audit also includes evaluating the appro-
priateness of accounting policies used and the reasonableness
of accounting estimates made by the Executive Board, as well
as evaluating the overall presentation of the consolidated finan-
cial statements.
We believe that the audit evidence we have obtained is suffici-
ent and appropriate to provide a basis for our audit opinion.
Audit Opinion
According to § 322 Abs. 3 Satz (sentence) 1 HGB, we state that
our audit of the consolidated financial statements has not led
to any reservations.
In our opinion based on the findings of our audit, the consolida-
ted financial statements comply, in all material respects, with
IFRSs, as adopted by the EU, and the additional requirements of
German commercial law pursuant to § 315a Abs. 1 HGB and
give a true and fair view of the net assets and financial position
of the Group as at 31 December 2011 as well as the results of
operations for the business year then ended, in accordance with
these requirements.
To our investors Review of operations our responsibility
Responsibility statement consolidated financial statements Further information
independent auditors’ Report 225
Report on the Group Management Report
We have audited the accompanying group management report,
which is combined with the management report of RWE Aktien-
gesellschaft, for the business year from 1 January to 31 Decem-
ber 2011. The Executive Board of RWE Aktiengesellschaft is
responsible for the preparation of the combined management
report in accordance with the requirements of German commer-
cial law applicable pursuant to § 315a Abs. 1 HGB. We conduc-
ted our audit in accordance with § 317 Abs. 2 HGB and German
generally accepted standards for the audit of the combined
management report promulgated by the Institut der Wirt-
schaftsprüfer (Institute of Public Auditors in Germany) (IDW).
Accordingly, we are required to plan and perform the audit of
the combined management report to obtain reasonable assu-
rance about whether the combined management report is con-
sistent with the consolidated financial statements and the audit
findings, as a whole provides a suitable view of the Group‘s
position and suitably presents the opportunities and risks of
future development.
According to § 322 Abs. 3 Satz 1 HGB we state, that our audit
of the group management report has not led to any reserva-
tions.
In our opinion based on the findings of our audit of the consoli-
dated financial statements and combined management report,
the combined management report is consistent with the conso-
lidated financial statements, as a whole provides a suitable
view of the Group‘s position and suitably presents the opportu-
nities and risks of future development.
Essen, 20 February 2012
PricewaterhouseCoopers
Aktiengesellschaft
Wirtschaftsprüfungsgesellschaft
Manfred Wiegand Markus Dittmann
Wirtschaftsprüfer Wirtschaftsprüfer
(German Public Auditor) (German Public Auditor)
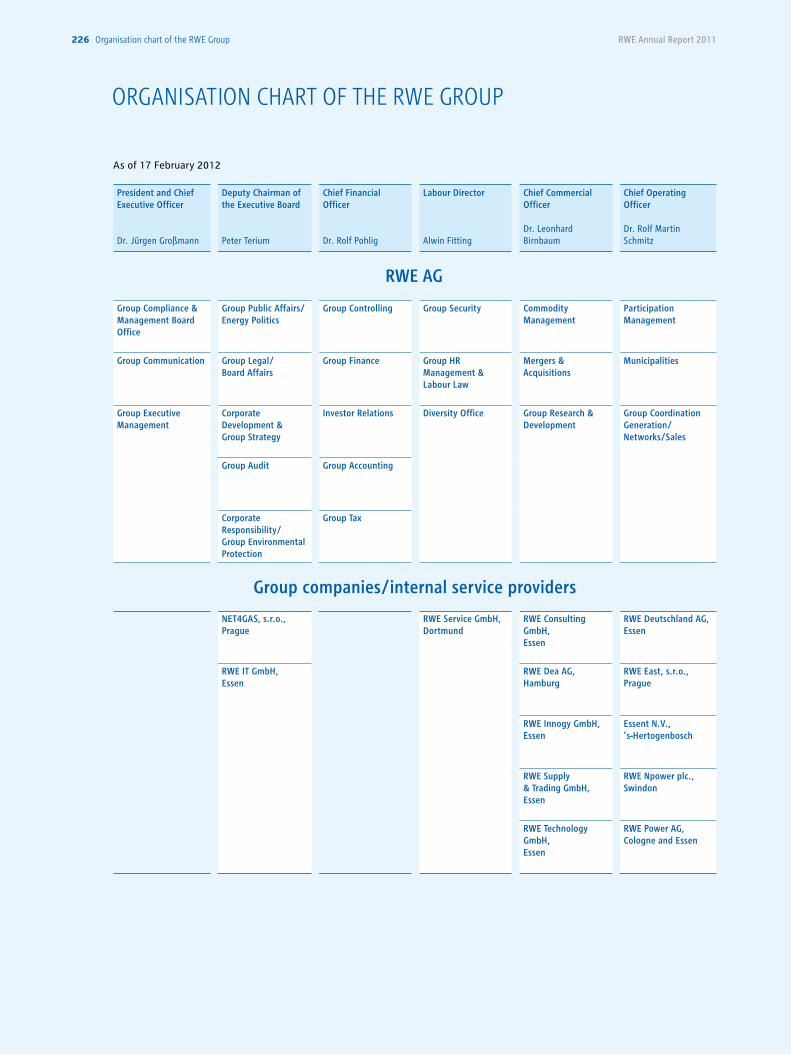
RWE Annual Report 2011226 organisation chart of the RWe Group
OrgaNiSaTiON CHarT OF THE rwE grOup
As of 17 February 2012
President and Chief Executive Officer
Dr. Jürgen Großmann
Deputy Chairman of the Executive Board
Peter Terium
Chief Financial Officer
Dr. Rolf Pohlig
Labour Director
Alwin Fitting
Chief Commercial Officer Dr. Leonhard Birnbaum
Chief Operating Officer
Dr. Rolf Martin Schmitz
RWE AG
Group Compliance & Management Board Office
Group Public Affairs/Energy Politics
Group Controlling Group Security Commodity Management
Participation Management
Group Communication Group Legal/ Board Affairs
Group Finance Group HR Management & Labour Law
Mergers & Acquisitions
Municipalities
Group Executive Management
Corporate Development & Group Strategy
Investor Relations Diversity Office Group Research & Development
Group Coordination Generation/ Networks/Sales
Group Audit Group Accounting
Corporate Responsi bility/Group Environmental Protection
Group Tax
NET4GAS, s.r.o., Prague
RWE Service GmbH, Dortmund
RWE Consulting GmbH, Essen
RWE Deutschland AG, Essen
RWE IT GmbH, Essen
RWE Dea AG, Hamburg
RWE East, s.r.o., Prague
RWE Innogy GmbH, Essen
Essent N.V., ’s-Hertogenbosch
RWE Supply & Trading GmbH, Essen
RWE Npower plc., Swindon
RWE Technology GmbH, Essen
RWE Power AG, Cologne and Essen
Group companies/internal service providers
To our investors Review of operations our responsibility
Responsibility statement consolidated financial statements Further information
Glossary 227
glOSSarY
Asset coverage. Ratio of long-term capital (shareholders’
equity and non-current liabilities) to long-term assets.
BAFA prices. To enable German coal to be sold at competitive
prices, mining companies receive financial support equalling
the difference between their production costs and the price
of coal imported from non-EU countries. In this context,
the German Federal Office of Economics and Export Control
(BAFA) determines free-at-frontier third-country coal prices
as a subsidy parameter. The price of thermal hard coal is
published by BAFA quarterly and annually in shipping tons
and tons of hard coal units.
Barrel. International unit of measurement for trading oil.
A US barrel corresponds to 158.987 litres.
Base load. Constant minimum demand for electricity
irrespective of load fluctuation. This electricity is used by
household appliances running 24 hours a day, industrial
enterprises that operate around the clock, etc. Base-load power
is primarily generated by lignite and nuclear power stations.
These facilities are usually in operation more than 6,000 hours
a year. Run-of-river power stations and biomass plants also
supply base-load power.
Clean Development Mechanism. In accordance with the Kyoto
Protocol, companies and countries can obtain emission
certificates by participating in projects to reduce emissions in
newly industrialising and developing countries, which are not
obliged to reduce emissions themselves. They can use these
certificates to meet their own requirements.
CO2. Chemical formula for carbon dioxide. CO2 is a chemical
compound made of carbon and oxygen.
Combined heat and power generation (CHP). In CHP plants,
heat produced during chemical or physical conversion and the
electric power generated by the energy conversion process are
used. Unlike thermal power stations, which are solely designed
to generate electricity, CHP plants use waste heat, thereby
achieving much higher efficiencies, which result in fuel savings.
Commercial paper. Tradeable, unsecured bearer bond issued
only for short-term debt financing. Commercial paper is a
revolving credit facility, with terms typically ranging from one
day to 24 months.
Commodity. Term for standardised, tradeable goods such as
electricity, oil or gas.
Confidence level. Probability of a value lying within a certain
interval.
Credit default swap (CDS). Financial derivative for trading
default risks associated with debt financing. The party seeking
to hedge such risks generally pays an annual fee to the
principal. In the event that the underlying credit is not repaid,
the hedge-seeking party receives a contractually agreed sum
from the principal.
Current asset intensity of investment. Ratio of current assets
to total assets.
Debt issuance programme (DIP). Contractual master and
model documents for the issuance of bonds. Based on the DIP,
bonds with tenors of one to 30 years can be issued both quickly
and flexibly.
Defined benefit obligation. Net present value of an employee’s
benefit entitlements from a company pension plan as of the
balance-sheet date.
Degree of asset depreciation. Cumulative property, plant and
equipment depreciation-to-cost ratio.
Diluted earnings per share. If a company places new shares on
the financial market as part of a capital increase, the portion of
the company represented by each share decreases. In addition,
the rise in the total number of shares causes earnings per share
to decline. This drop in value is referred to as a dilution.
EBITDA. Earnings before interest, taxes, depreciation and
amortisation.
Thermal efficiency. In energy conversion, the ratio of useful
work performed to total energy expended. In thermal power
stations, the efficiency is the percentage of thermal energy
contained in the fuel which can be converted to electricity.
The higher the efficiency, the lower the loss of the fuel’s energy
content. Modern gas-fired power plants have an efficiency of
up to 60 %. Efficiencies of 46 % and 43 % can currently be
achieved with hard coal and lignite, respectively.
RWE Annual Report 2011228 Glossary
Equity accounting. Method for accounting for entities, the
assets and liabilities of which cannot be entirely included in the
consolidated financial statements by fully consolidating the
entity. In such cases, the carrying amount of the investment is
recorded on the basis of the development of the share held in
the entity’s equity. This change is recorded in the income
statement of the company which owns the share in the entity.
Exploration. Term used for the search for, and prospecting of,
oil and gas resources.
Fixed asset intensity of investments. Ratio of non-current
assets to total assets.
Forward market /forward trading. Contracts for transactions
to be fulfilled at a fixed point in time in the future are traded
on forward markets. Certain conditions, e.g. the price or
settlement date, are established when the contract is agreed.
Full consolidation. Method for including subsidiaries in the
financial statements of a group in cases where the subsidiaries
are controlled by the parent company (through the majority of
the voting rights or by other means).
Hard coal unit (HCU). Unit of measurement for the energy
content of primary energy carriers. One kilogram HCU
corresponds to 29,308 kilojoules.
Hybrid bond. Mixture of debt and equity financing. Hybrid
bonds usually have very long or unlimited tenors and can
usually only be redeemed by the issuer on contractually agreed
dates. Depending on the bond provisions, interest payments
may be suspended if certain contractual conditions are met.
Impairment test. Method of verifying the value of assets,
involving a comparison of the carrying amount to the realisable
amount. The objective is not to account for assets at an amount
higher than their realisable amount. The difference is
recognised as a reduction in value with an effect on the profit
or loss.
Investment grade. Rating category for companies of very good
to average creditworthiness. This category includes the AAA to
BBB and Aaa to Baa rating classes awarded by S&P/Fitch and
Moody’s, respectively. Non-investment-grade companies are at
a much higher risk of not being able to meet their financial
obligations.
Joint implementation. In accordance with the Kyoto Protocol,
countries or companies can obtain emission certificates by
participating in projects to reduce emissions in certain other
countries which are also obliged to reduce emissions. They can
use these certificates to meet their own reduction
requirements.
Kilowatt (kW). Unit of measurement of electric output.
1 megawatt (MW) = 103 kilowatts,
1 gigawatt (GW) = 106 kilowatts,
1 terawatt (TW) = 109 kilowatts.
Leverage factor. Ratio of net debt to EBITDA.
LNG. Acronym for liquefied natural gas. LNG is obtained by
cooling gas until it becomes liquid. It occupies only 1 /600 of
the space filled by natural gas in its gaseous state. In this form,
it is very well suited for transportation and storage.
Peak load. Designates phases in which electricity demand is
especially high, for example, at noon, when meals are prepared
in many factories and homes. Peak-load power plants are often
in service less than 3,000 hours per year. Gas-fired and hydro
storage power stations belong to this category.
Performance shares. Virtual shares, which entitle participants
in the Beat Long-Term Incentive Plan to receive a payment at
the end of the plan period. The prerequisite is that the
predefined performance targets have been met or exceeded.
Put or call options. Options granting their buyer the right to
purchase (call option) or sell (put option) a specific underlying,
for example a share, at a pre-arranged price within a
predetermined period of time.
Rating. Standardised method in international capital markets
for assessing the risk exposure and creditworthiness of debt
issuers. A Single A rating is given to borrowers of strong
creditworthiness.
Service cost. Reflects the increase in the cost associated
with the net present value of an employee’s pension benefit
entitlements in accordance with the employee’s work
performance in the period being reviewed.
Spot market /spot trading. General term for markets where
payment and delivery are usually effected soon after conclusion
of the transaction.
Glossary 229To our investors Review of operations our responsibility
Responsibility statement consolidated financial statements Further information
Syndicated credit line. Credit line offered to companies, backed
by several banks, which can be drawn down in various amounts,
terms and currencies. Generally used to secure liquidity.
Upstream. Term for all activities involved in the exploration and
production of oil and gas. Also includes the processing of these
resources into marketable raw materials meeting generally
accepted quality standards.
Value at Risk (VaR). Measure of risk indicating the maximum
loss that might occur from a risk position (e.g. a securities
portfolio) assuming a certain probability under normal market
conditions and that the position is held for a certain period
of time. A VaR of €1 million with a holding period of one day
and a confidence level of 95 % means that there is a 95 %
probability that the potential loss resulting from the risk
position will not exceed €1 million from one day to the next.
RWE Annual Report 2011
A
Amortisation 126, 136, 147, 148, 151, 154
B
Balance sheet 77, 78, 128, 151
Bonds 23, 28, 73, 79, 81, 142, 171, 181
C
Capacity market 45
Capital expenditure 30, 69, 97, 100, 121
Capital increase 23, 46, 74, 80, 159
Cash and cash equivalents 75, 78, 93, 128, 129, 134, 138, 159
Cash flow 76, 129, 186
Climate protection 30, 43, 83, 97, 118, 121
CO2 emission trading 38, 90
CO2 emissions 30, 45, 53, 83, 90, 118, 123
Commentary on the segments
183
Corporate responsibility 109, 118
Cost of capital 62
Cost of debt 64, 76, 136, 138, 149
D
Debt 73, 100, 128, 142, 181
Depreciation 126, 136, 147, 148, 151, 154
Disclosure relating to German takeover law
80
Dividend 26, 68, 79, 100, 161
E
EBITDA 59, 184, 227
Efficiency enhancement 46, 68, 72, 98
Employees 71, 94, 100, 116, 120, 147
Energy efficiency 32, 118
Equity 46, 77, 78, 128, 130, 159, 196
Executive Board 20, 23, 48, 80, 102, 106, 109, 194, 226
F
Financial assets 69, 78, 87, 128, 137, 156
Financial result 66, 148
G
Group structure 49, 226
H
Hybrid bond 23, 73, 160, 171, 228
I
Impairment losses 66, 126, 136, 147, 148, 151, 154
Income statement 78, 126, 146
Inventories 128, 138, 158
L
Leverage factor 76, 97, 100, 142, 228
Liabilities 75, 128, 140, 170, 181
N
Net income 66, 173
Nuclear energy 43, 46, 51, 75, 91, 169
Nuclear fuel tax 43, 60, 91, 98
Nuclear moratorium 22, 43, 91
Nuclear phase-out 22, 43, 118
O
Operating result 59, 98, 184
P
Property, plant and equipment
69, 100, 128, 136, 154
Provisions 75, 77, 78, 128, 139, 165, 169
R
Rating 46, 73, 75, 142, 228
REA levy 44, 76
Recurrent net income 67, 98
Renewable energy 30, 52, 58, 70, 84, 99
Research and development 83, 119, 152
Revenue 57, 98, 126, 146, 184
Risk management 87, 131, 178
ROCE 62
RWE AG (holding company) 78, 226
S
Share 24, 46, 67, 74, 80, 159, 173
Shareholder structure 27
Strategy 30, 118
Supervisory Board 102, 106, 114, 191
V
Value management 62
iNdEx
230 index
4 To our investors Review of operations our responsibility
Responsibility statement consolidated fi nancial statements Further information
Forward-looking statements. This report contains forward-looking statements regarding the future development of the RWE Group
and its companies as well as economic and political developments. These statements are assessments that we have made based
on information available to us at the time this document was prepared. In the event that the underlying assumptions do not
materialise or additional risks arise, actual performance can deviate from the performance expected at present. Therefore, we
cannot assume responsibility for the correctness of these statements.
Electricity used to only go in one direction: from power plant to customer. However, traffi c on former one-way streets has become more complex. Numerous small solar panels and wind turbines now feed electricity into the grid from distributed points. And they do this irregularly, depending on the weather and time of day. This places completely new demands on network operators.
With the Smart Country project in the District of Bitburg-Prüm in Germany, RWE is demonstrating the advantages to be gained in being properly connected. Thanks to a sophisticated control system,
imprint 231
iMpriNT
Design concept and layout:
Jung von Matt/brand identity, Hamburg
Typesetting, image editing and production:
CHIARI – Agentur für Markenkommunikation, Düsseldorf
Photographs:
Catrin Moritz, Essen
Jann Klee, Hamburg
RWE archive
Printing:
Kunst- und Werbedruck GmbH & Co KG, Bad Oeynhausen
RWE is a member of DIRK –
the German Investor Relations Association.
RWE Aktiengesellschaft
Opernplatz 1
45128 Essen
Germany
Phone +49 201 12-00
Fax +49 201 12-15199
E-mail [email protected]
Investor Relations:
Phone +49 201 12-15025
Fax +49 201 12-15265
E-mail [email protected]
Corporate Communications:
Phone +49 201 12-15250
Fax +49 201 12-15094
For annual reports, interim reports and further information
on RWE, please visit us on the internet at www.rwe.com
This annual report was published on 6 March 2012. This is a
translation of the German annual report. In case of divergence
from the German version, the German version shall prevail.
carbon neutralnatureOffice.com | DE-149-453272
print production
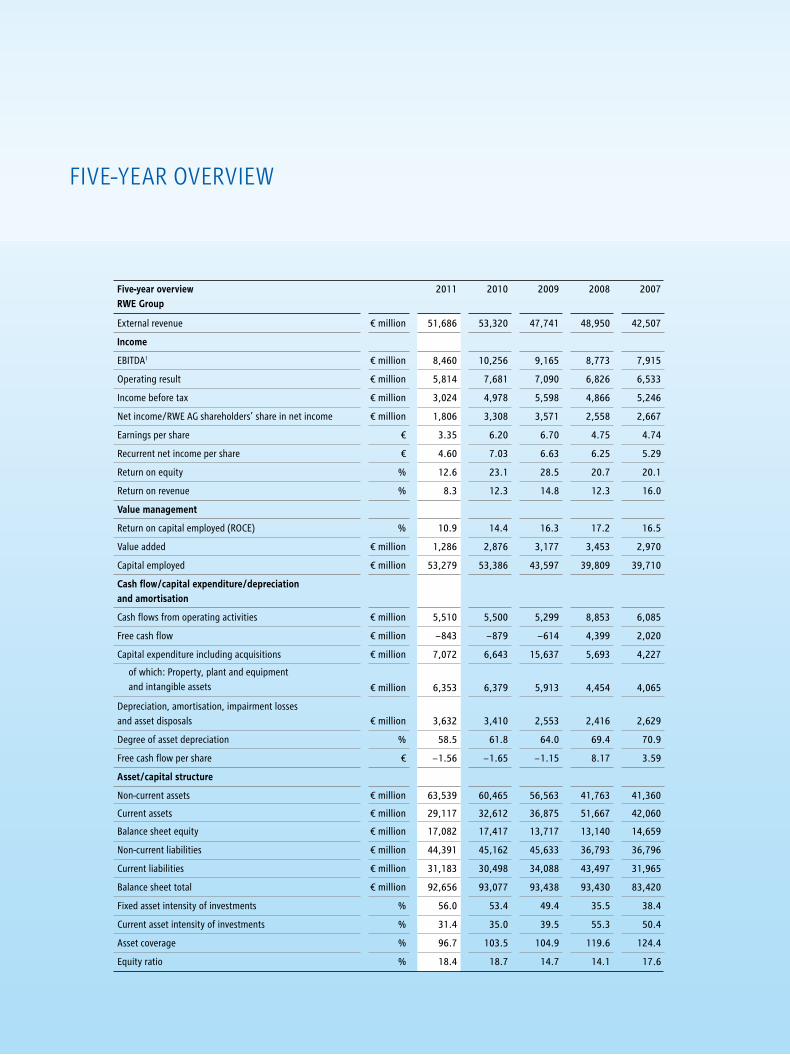
SMarT ENErgY EquaTES TO iNNOvaTivE THiNkiNg aNd FOrward-lOOkiNg aCTiON.
www.vorweggehen.de
Energy drives our lives. It enables us to be mobile, productive and connected. But energy is a limited resource – and its price is rising. For companies and households, this means that making effi cient use of energy pays off. And if this is done intelligently, it does not reduce growth or quality of life.
As one of Europe’s leading utilities, conserving energy is at the centre of our business model. We continuously improve our electricity generation in order to lower fuel consumption and emissions. However, our horizon extends beyond our plant premises. We also want our customers to benefi t from the opportunities offered by making more effi cient use of energy.
With innovative products and services, we help households and companies to reduce costs and protect the environment. From electric cars to home automation, we offer solutions across the board while setting new product standards.
We invite you to begin a new chapter with us and convince yourself fi rst-hand of the benefi ts of smart energy!
Five-year overviewRWE Group
2011 2010 2009 2008 2007
External revenue € million 51,686 53,320 47,741 48,950 42,507
Income
EBITDA1 € million 8,460 10,256 9,165 8,773 7,915
Operating result € million 5,814 7,681 7,090 6,826 6,533
Income before tax € million 3,024 4,978 5,598 4,866 5,246
Net income/RWE AG shareholders’ share in net income € million 1,806 3,308 3,571 2,558 2,667
Earnings per share € 3.35 6.20 6.70 4.75 4.74
Recurrent net income per share € 4.60 7.03 6.63 6.25 5.29
Return on equity % 12.6 23.1 28.5 20.7 20.1
Return on revenue % 8.3 12.3 14.8 12.3 16.0
Value management
Return on capital employed (ROCE) % 10.9 14.4 16.3 17.2 16.5
Value added € million 1,286 2,876 3,177 3,453 2,970
Capital employed € million 53,279 53,386 43,597 39,809 39,710
Cash fl ow/capital expenditure/depreciation and amortisation
Cash fl ows from operating activities € million 5,510 5,500 5,299 8,853 6,085
Free cash fl ow € million − 843 − 879 − 614 4,399 2,020
Capital expenditure including acquisitions € million 7,072 6,643 15,637 5,693 4,227
of which: Property, plant and equipment and intangible assets € million 6,353 6,379 5,913 4,454 4,065
Depreciation, amortisation, impairment losses and asset disposals € million 3,632 3,410 2,553 2,416 2,629
Degree of asset depreciation % 58.5 61.8 64.0 69.4 70.9
Free cash fl ow per share € − 1.56 − 1.65 − 1.15 8.17 3.59
Asset/capital structure
Non-current assets € million 63,539 60,465 56,563 41,763 41,360
Current assets € million 29,117 32,612 36,875 51,667 42,060
Balance sheet equity € million 17,082 17,417 13,717 13,140 14,659
Non-current liabilities € million 44,391 45,162 45,633 36,793 36,796
Current liabilities € million 31,183 30,498 34,088 43,497 31,965
Balance sheet total € million 92,656 93,077 93,438 93,430 83,420
Fixed asset intensity of investments % 56.0 53.4 49.4 35.5 38.4
Current asset intensity of investments % 31.4 35.0 39.5 55.3 50.4
Asset coverage % 96.7 103.5 104.9 119.6 124.4
Equity ratio % 18.4 18.7 14.7 14.1 17.6
Five-YeaR oveRvieW
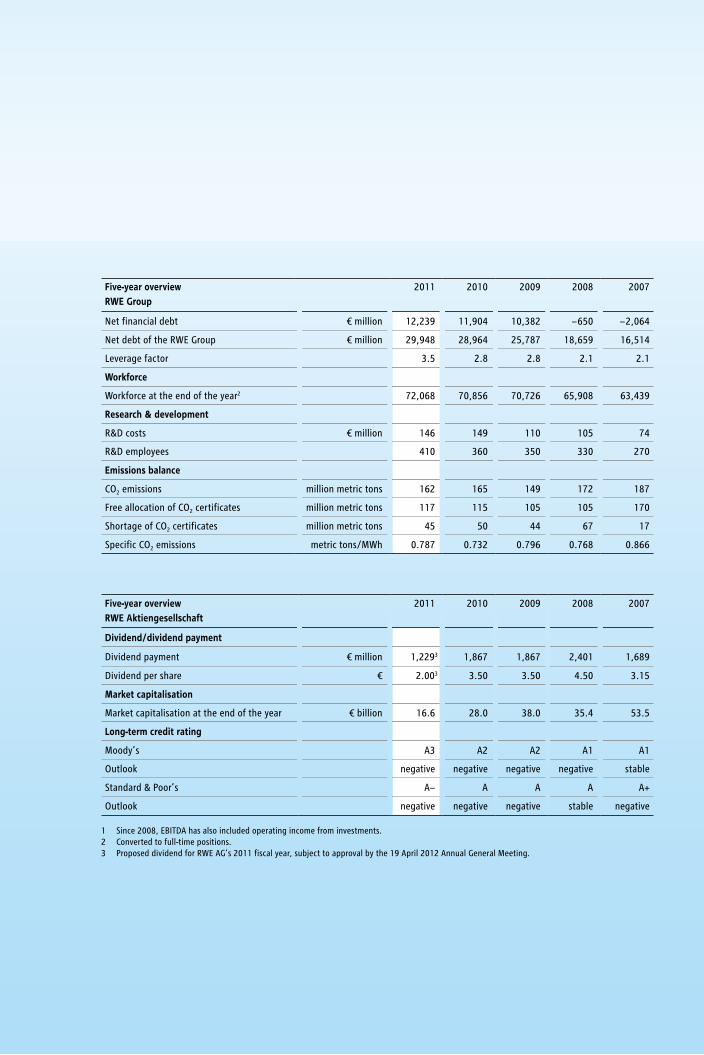
The energy to lead with smart solutions. 1
To our investors
Letter from the CEO 16
The RWE Executive Board 20
2011 in brief 22
RWE on the capital market 24
1.0 Review of operations 29
1.1 Strategy 30
1.2 Economic environment 36
1.3 Political environment 43
1.4 Major events 46
1.5 Commentary on the segments 49
1.6 Business performance 51
1.7 Financial position and net worth 73
1.8 Notes to the financial statements 78
of RWE AG (holding company)
1.9 Disclosure relating to German 80
takeover law
1.10 Innovation 83
1.11 Development of risks and opportunities 87
including the report on the internal
control and risk management system
1.12 Outlook 96
2.0 Our responsibility 101
2.1 Supervisory Board report 102
2.2 Corporate governance 106
2.3 Compensation report 109
(part of the review of operations)
2.4 Workforce 116
2.5 Sustainability 118
3.0 Responsibility statement 124 4.0 Consolidated financial statements 125
4.1 Income statement 126
4.2 Statement of recognised income 127
and expenses
4.3 Balance sheet 128
4. 4 Cash flow statement 129
4.5 Statement of changes in equity 130
4.6 Notes 131
4.7 Boards (part of the notes) 191
4.8 List of shareholdings 196
(part of the notes)
4.9 Independent auditors‘ report 224
Further information
Organisation chart of the RWE Group 226
Glossary 227
Index 230
Imprint 231
Five-year overview
Financial calendar 2012/2013
CONTENTS
Power generation
Conventional generation
Renewableenergy
HOw wE HavE OrgaNiSEd OurSElvES.
THE rwE grOup
The
RWe
GRo
up Five-YeaR o
veRvieW
Fold
-ou
T Table oF co
nTen
Ts
wHaT wE dO.
RWE is one of Europe’s five leading electricity and gas companies. Through our
expertise in oil, gas and lignite production, the construction and operation of
conventional and renewables-based power plants, commodities trading as well as
electricity and gas transmission and sales, we cover the entire energy value chain.
Some 72,000 employees supply almost 17 million customers with electricity and
nearly 8 million customers with gas via our fully consolidated companies. In fiscal
2011, we recorded just below €52 billion in revenue.
Europe is our market: RWE is the No. 1 power producer in Germany, No. 2 in the
Netherlands, and No. 3 in the UK. We continuously expand our position in Central
Eastern and South Eastern Europe.
Our power plant portfolio and our investment programme for building efficient,
environmentally friendly and flexible generation capacity are the main basis
for growing earnings in the future. We invest billions in this every year. Meanwhile,
we are one of Europe’s biggest investors in offshore wind farms. Our leading
position in energy trading helps us make optimal use of our power plants on the
market. We react to changing customer needs by offering new products for homes,
commerce and industry. Climate protection and energy efficiency are becoming
increasingly important for our customers, too.
We operate in a dynamic market environment that is characterised by highly volatile
prices, changing structures, ambitious climate protection goals and increasing
political and regulatory intervention. Our response is a three-dimensional corporate
strategy: RWE is becoming more sustainable, more international, and more robust.
Gas and oil production
Energy trading /gas midstream
Electricity andgas networks
Electricity andgas sales
Customers
ElECTriCiTY aNd gaS: rwE OFFErS EvErYTHiNg FrOM a SiNglE SOurCE.
NET4GASGas transmission system operator in the Czech Republic(unbundled)
Internal servicesRWE ConsultingRWE ITRWE ServiceRWE Technology
Five-year overviewRWE Group
2011 2010 2009 2008 2007
Net financial debt € million 12,239 11,904 10,382 − 650 − 2,064
Net debt of the RWE Group € million 29,948 28,964 25,787 18,659 16,514
Leverage factor 3.5 2.8 2.8 2.1 2.1
Workforce
Workforce at the end of the year2 72,068 70,856 70,726 65,908 63,439
Research & development
R&D costs € million 146 149 110 105 74
R&D employees 410 360 350 330 270
Emissions balance
CO2 emissions million metric tons 162 165 149 172 187
Free allocation of CO2 certificates million metric tons 117 115 105 105 170
Shortage of CO2 certificates million metric tons 45 50 44 67 17
Specific CO2 emissions metric tons/MWh 0.787 0.732 0.796 0.768 0.866
Five-year overviewRWE Aktiengesellschaft
2011 2010 2009 2008 2007
Dividend/dividend payment
Dividend payment € million 1,2293 1,867 1,867 2,401 1,689
Dividend per share € 2.003 3.50 3.50 4.50 3.15
Market capitalisation
Market capitalisation at the end of the year € billion 16.6 28.0 38.0 35.4 53.5
Long-term credit rating
Moody’s A3 A2 A2 A1 A1
Outlook negative negative negative negative stable
Standard & Poor’s A− A A A A+
Outlook negative negative negative stable negative
1 Since 2008, EBITDA has also included operating income from investments.2 Converted to full-time positions.3 Proposed dividend for RWE AG’s 2011 fiscal year, subject to approval by the 19 April 2012 Annual General Meeting.
RWE AGGermany Netherlands /
BelgiumUnited Kingdom
Central Eastern and South Eastern Europe
Renewables Upstream Gas & Oil
Trading /Gas Midstream
Power Generation
Sales / Distribution Networks
RWE Power RWE Deutschland
Essent RWE npower RWE East RWE Innogy RWE Dea RWE Supply & Trading
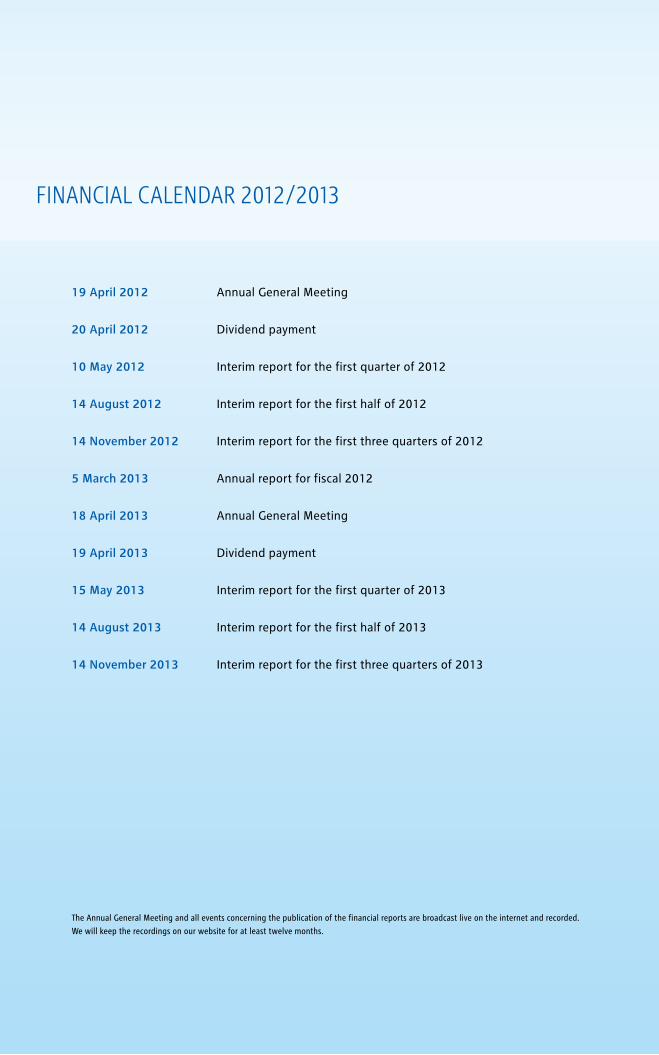
19 April 2012 Annual General Meeting
20 April 2012 Dividend payment
10 May 2012 Interim report for the fi rst quarter of 2012
14 August 2012 Interim report for the fi rst half of 2012
14 November 2012 Interim report for the fi rst three quarters of 2012
5 March 2013 Annual report for fi scal 2012
18 April 2013 Annual General Meeting
19 April 2013 Dividend payment
15 May 2013 Interim report for the fi rst quarter of 2013
14 August 2013 Interim report for the fi rst half of 2013
14 November 2013 Interim report for the fi rst three quarters of 2013
RWE Group 2011 2010 + /−%
External electricity sales volume billion kWh 294.6 311.2 − 5.3
External gas sales volume billion kWh 322.2 395.4 − 18.5
External revenue € million 51,686 53,320 − 3.1
EBITDA € million 8,460 10,256 − 17.5
Operating result € million 5,814 7,681 − 24.3
Income before tax € million 3,024 4,978 − 39.3
Net income/RWE AG shareholders' share in income € million 1,806 3,308 − 45.4
Recurrent net income € million 2,479 3,752 − 33.9
Return on capital employed (ROCE) % 10.9 14.4 -
Weighted average cost of capital (WACC) before tax % 8.5 9.0 -
Value added € million 1,286 2,876 − 55.3
Capital employed € million 53,279 53,386 − 0.2
Cash fl ows from operating activities € million 5,510 5,500 0.2
Capital expenditure € million 7,072 6,643 6.5
Property, plant and equipment and intangible assets € million 6,353 6,379 − 0.4
Financial assets € million 719 264 172.3
Free cash fl ow € million − 843 − 879 4.1
Number of shares outstanding (average) thousands 538,971 533,559 1.0
Earnings per share € 3.35 6.20 − 46.0
Recurrent net income per share € 4.60 7.03 − 34.6
Dividend per share € 2.001 3.50 − 42.9
31 Dec 2011 31 Dec 2010
Net debt of the RWE Group € million 29,948 28,964 3.4
Workforce2 72,068 70,856 1.7
1 Dividend proposal for RWE AG’s 2011 fi scal year, subject to approval by the 19 April 2012 Annual General Meeting. 2 Converted to full-time positions.
RWE
annu
al R
epor
t 201
1 annual RepoRT 2011
RWE Aktiengesellschaft
Opernplatz 145128 EssenGermany
T +49 201 12-00F +49 201 12-15199I www.rwe.com
FiNaNCial CalENdar 2012/2013 2011 kEY FigurES aT a glaNCE.
The Annual General Meeting and all events concerning the publication of the fi nancial reports are broadcast live on the internet and recorded.
We will keep the recordings on our website for at least twelve months.
• Heavy burden on earnings through accelerated nuclear phase-out in Germany
• Operating result of €5.8 billion
• Dividend of €2.00 per share proposed
• First measures for securing fi nancial strength implemented
• Outlook for 2012: Operating result in the order of last year’s level despite divestments
STarTiNg NEw CHapTErS.
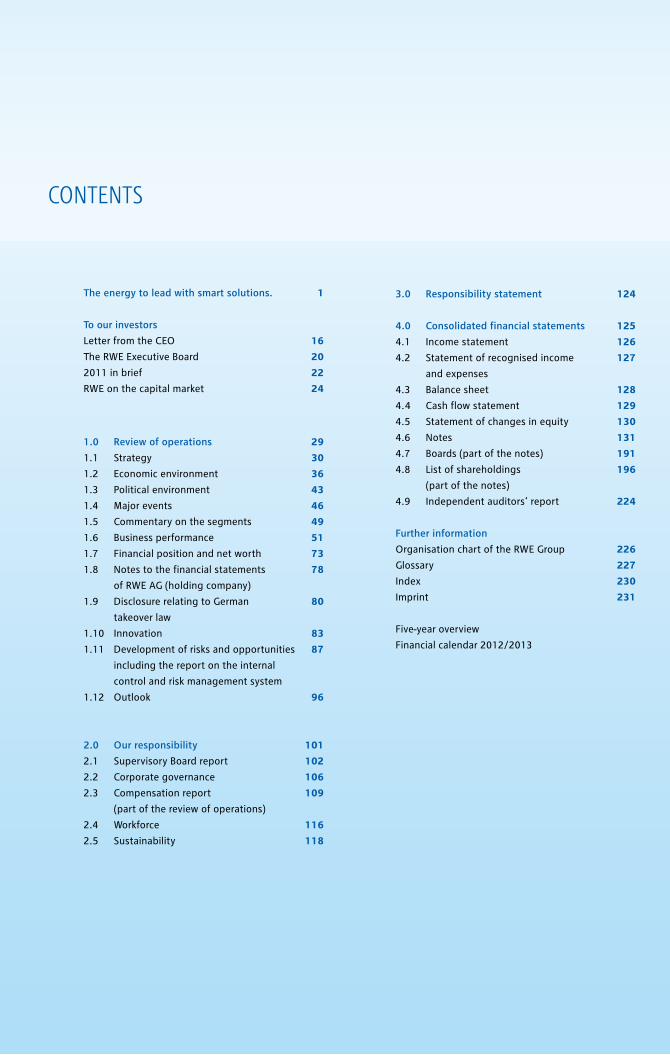
The energy to lead with smart solutions. 1
To our investors
Letter from the CEO 16
The RWE Executive Board 20
2011 in brief 22
RWE on the capital market 24
1.0 Review of operations 29
1.1 Strategy 30
1.2 Economic environment 36
1.3 Political environment 43
1.4 Major events 46
1.5 Commentary on the segments 49
1.6 Business performance 51
1.7 Financial position and net worth 73
1.8 Notes to the financial statements 78
of RWE AG (holding company)
1.9 Disclosure relating to German 80
takeover law
1.10 Innovation 83
1.11 Development of risks and opportunities 87
including the report on the internal
control and risk management system
1.12 Outlook 96
2.0 Our responsibility 101
2.1 Supervisory Board report 102
2.2 Corporate governance 106
2.3 Compensation report 109
(part of the review of operations)
2.4 Workforce 116
2.5 Sustainability 118
3.0 Responsibility statement 124 4.0 Consolidated financial statements 125
4.1 Income statement 126
4.2 Statement of recognised income 127
and expenses
4.3 Balance sheet 128
4. 4 Cash flow statement 129
4.5 Statement of changes in equity 130
4.6 Notes 131
4.7 Boards (part of the notes) 191
4.8 List of shareholdings 196
(part of the notes)
4.9 Independent auditors‘ report 224
Further information
Organisation chart of the RWE Group 226
Glossary 227
Index 230
Imprint 231
Five-year overview
Financial calendar 2012/2013
CONTENTS
Power generation
Conventional generation
Renewableenergy
HOw wE HavE OrgaNiSEd OurSElvES.
THE rwE grOup
The
RWe
GRo
up Five-YeaR o
veRvieW
Fold
-ou
T Table oF co
nTen
Ts
wHaT wE dO.
RWE is one of Europe’s five leading electricity and gas companies. Through our
expertise in oil, gas and lignite production, the construction and operation of
conventional and renewables-based power plants, commodities trading as well as
electricity and gas transmission and sales, we cover the entire energy value chain.
Some 72,000 employees supply almost 17 million customers with electricity and
nearly 8 million customers with gas via our fully consolidated companies. In fiscal
2011, we recorded just below €52 billion in revenue.
Europe is our market: RWE is the No. 1 power producer in Germany, No. 2 in the
Netherlands, and No. 3 in the UK. We continuously expand our position in Central
Eastern and South Eastern Europe.
Our power plant portfolio and our investment programme for building efficient,
environmentally friendly and flexible generation capacity are the main basis
for growing earnings in the future. We invest billions in this every year. Meanwhile,
we are one of Europe’s biggest investors in offshore wind farms. Our leading
position in energy trading helps us make optimal use of our power plants on the
market. We react to changing customer needs by offering new products for homes,
commerce and industry. Climate protection and energy efficiency are becoming
increasingly important for our customers, too.
We operate in a dynamic market environment that is characterised by highly volatile
prices, changing structures, ambitious climate protection goals and increasing
political and regulatory intervention. Our response is a three-dimensional corporate
strategy: RWE is becoming more sustainable, more international, and more robust.
Gas and oil production
Energy trading /gas midstream
Electricity andgas networks
Electricity andgas sales
Customers
ElECTriCiTY aNd gaS: rwE OFFErS EvErYTHiNg FrOM a SiNglE SOurCE.
NET4GASGas transmission system operator in the Czech Republic(unbundled)
Internal servicesRWE ConsultingRWE ITRWE ServiceRWE Technology
Five-year overviewRWE Group
2011 2010 2009 2008 2007
Net financial debt € million 12,239 11,904 10,382 − 650 − 2,064
Net debt of the RWE Group € million 29,948 28,964 25,787 18,659 16,514
Leverage factor 3.5 2.8 2.8 2.1 2.1
Workforce
Workforce at the end of the year2 72,068 70,856 70,726 65,908 63,439
Research & development
R&D costs € million 146 149 110 105 74
R&D employees 410 360 350 330 270
Emissions balance
CO2 emissions million metric tons 162 165 149 172 187
Free allocation of CO2 certificates million metric tons 117 115 105 105 170
Shortage of CO2 certificates million metric tons 45 50 44 67 17
Specific CO2 emissions metric tons/MWh 0.787 0.732 0.796 0.768 0.866
Five-year overviewRWE Aktiengesellschaft
2011 2010 2009 2008 2007
Dividend/dividend payment
Dividend payment € million 1,2293 1,867 1,867 2,401 1,689
Dividend per share € 2.003 3.50 3.50 4.50 3.15
Market capitalisation
Market capitalisation at the end of the year € billion 16.6 28.0 38.0 35.4 53.5
Long-term credit rating
Moody’s A3 A2 A2 A1 A1
Outlook negative negative negative negative stable
Standard & Poor’s A− A A A A+
Outlook negative negative negative stable negative
1 Since 2008, EBITDA has also included operating income from investments.2 Converted to full-time positions.3 Proposed dividend for RWE AG’s 2011 fiscal year, subject to approval by the 19 April 2012 Annual General Meeting.
RWE AGGermany Netherlands /
BelgiumUnited Kingdom
Central Eastern and South Eastern Europe
Renewables Upstream Gas & Oil
Trading /Gas Midstream
Power Generation
Sales / Distribution Networks
RWE Power RWE Deutschland
Essent RWE npower RWE East RWE Innogy RWE Dea RWE Supply & Trading
19 April 2012 Annual General Meeting
20 April 2012 Dividend payment
10 May 2012 Interim report for the fi rst quarter of 2012
14 August 2012 Interim report for the fi rst half of 2012
14 November 2012 Interim report for the fi rst three quarters of 2012
5 March 2013 Annual report for fi scal 2012
18 April 2013 Annual General Meeting
19 April 2013 Dividend payment
15 May 2013 Interim report for the fi rst quarter of 2013
14 August 2013 Interim report for the fi rst half of 2013
14 November 2013 Interim report for the fi rst three quarters of 2013
RWE Group 2011 2010 + /−%
External electricity sales volume billion kWh 294.6 311.2 − 5.3
External gas sales volume billion kWh 322.2 395.4 − 18.5
External revenue € million 51,686 53,320 − 3.1
EBITDA € million 8,460 10,256 − 17.5
Operating result € million 5,814 7,681 − 24.3
Income before tax € million 3,024 4,978 − 39.3
Net income/RWE AG shareholders' share in income € million 1,806 3,308 − 45.4
Recurrent net income € million 2,479 3,752 − 33.9
Return on capital employed (ROCE) % 10.9 14.4 -
Weighted average cost of capital (WACC) before tax % 8.5 9.0 -
Value added € million 1,286 2,876 − 55.3
Capital employed € million 53,279 53,386 − 0.2
Cash fl ows from operating activities € million 5,510 5,500 0.2
Capital expenditure € million 7,072 6,643 6.5
Property, plant and equipment and intangible assets € million 6,353 6,379 − 0.4
Financial assets € million 719 264 172.3
Free cash fl ow € million − 843 − 879 4.1
Number of shares outstanding (average) thousands 538,971 533,559 1.0
Earnings per share € 3.35 6.20 − 46.0
Recurrent net income per share € 4.60 7.03 − 34.6
Dividend per share € 2.001 3.50 − 42.9
31 Dec 2011 31 Dec 2010
Net debt of the RWE Group € million 29,948 28,964 3.4
Workforce2 72,068 70,856 1.7
1 Dividend proposal for RWE AG’s 2011 fi scal year, subject to approval by the 19 April 2012 Annual General Meeting. 2 Converted to full-time positions.
RWE
annu
al R
epor
t 201
1 annual RepoRT 2011
RWE Aktiengesellschaft
Opernplatz 145128 EssenGermany
T +49 201 12-00F +49 201 12-15199I www.rwe.com
FiNaNCial CalENdar 2012/2013 2011 kEY FigurES aT a glaNCE.
The Annual General Meeting and all events concerning the publication of the fi nancial reports are broadcast live on the internet and recorded.
We will keep the recordings on our website for at least twelve months.
• Heavy burden on earnings through accelerated nuclear phase-out in Germany
• Operating result of €5.8 billion
• Dividend of €2.00 per share proposed
• First measures for securing fi nancial strength implemented
• Outlook for 2012: Operating result in the order of last year’s level despite divestments
STarTiNg NEw CHapTErS.
Recommended