Embed Size (px)
Citation preview
RWE Thames Water12th August 2003, London
Bill Alexander, CEO RWE Thames Water & American Water
Chris Bunker, CFO RWE Thames Water
Ellen Wolf, CFO American Water
2
Agenda
n Introduction Harry Roels
n Overall Picture Bill Alexander
n Financial Review Chris Bunker
n Business Reviews
– Germany & Eastern Europe Chris Bunker
– United Kingdom Chris Bunker
– Americas Ellen Wolf
n Future Outlook & Conclusions Bill Alexander
2
The Overall Picture
4
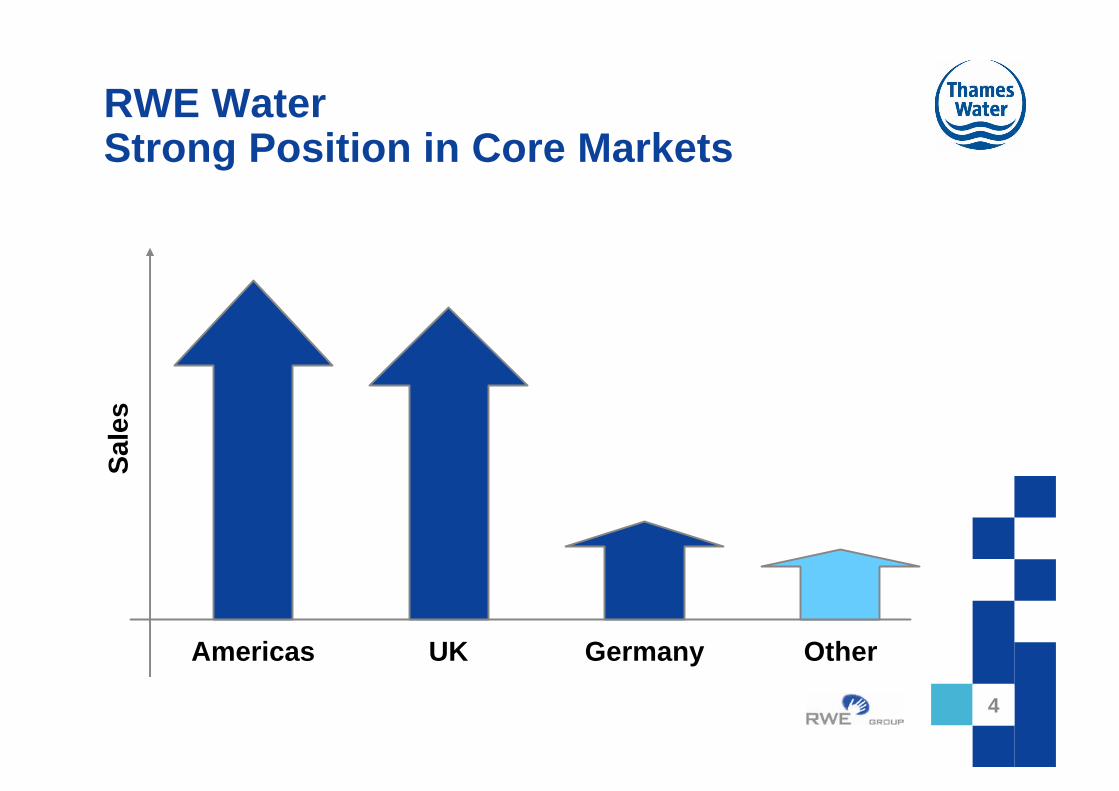
RWE WaterStrong Position in Core Markets
Americas OtherGermanyUK
Sal
es
4
5
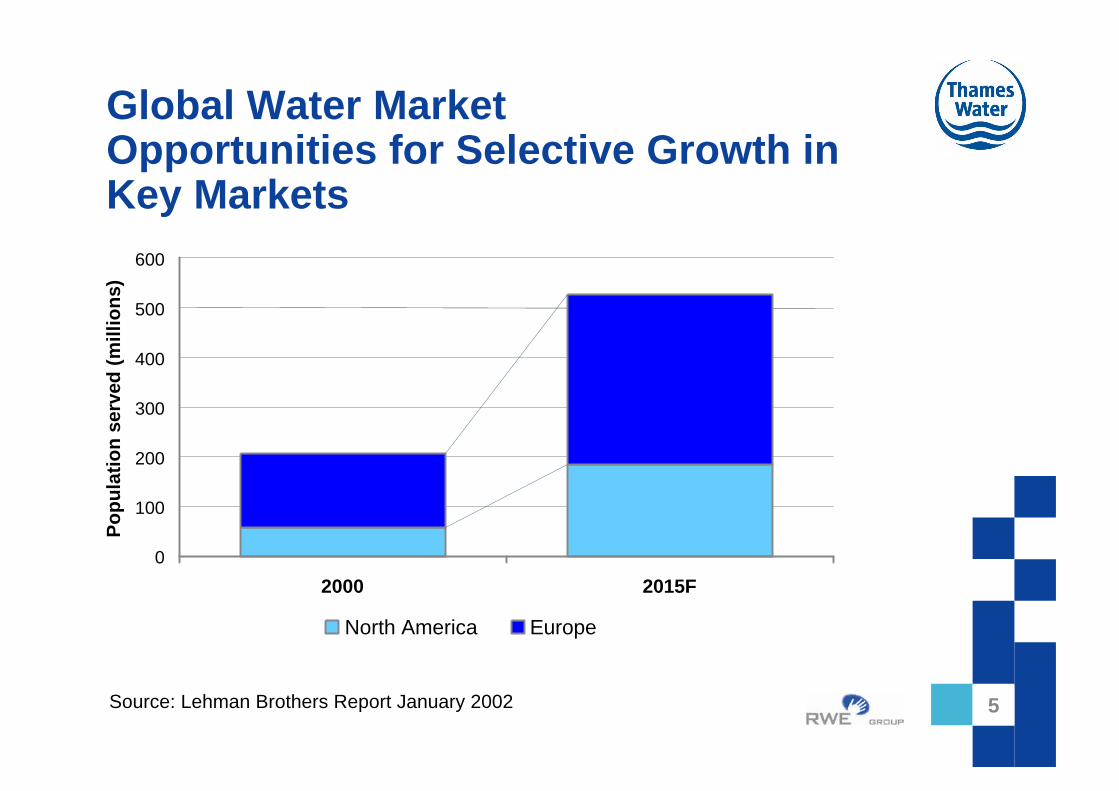
Global Water MarketOpportunities for Selective Growth in Key Markets
Source: Lehman Brothers Report January 2002 5
0
100
200
300
400
500
600
2000 2015F
Po
pu
lati
on
ser
ved
(mill
ion
s)
North America Europe
6
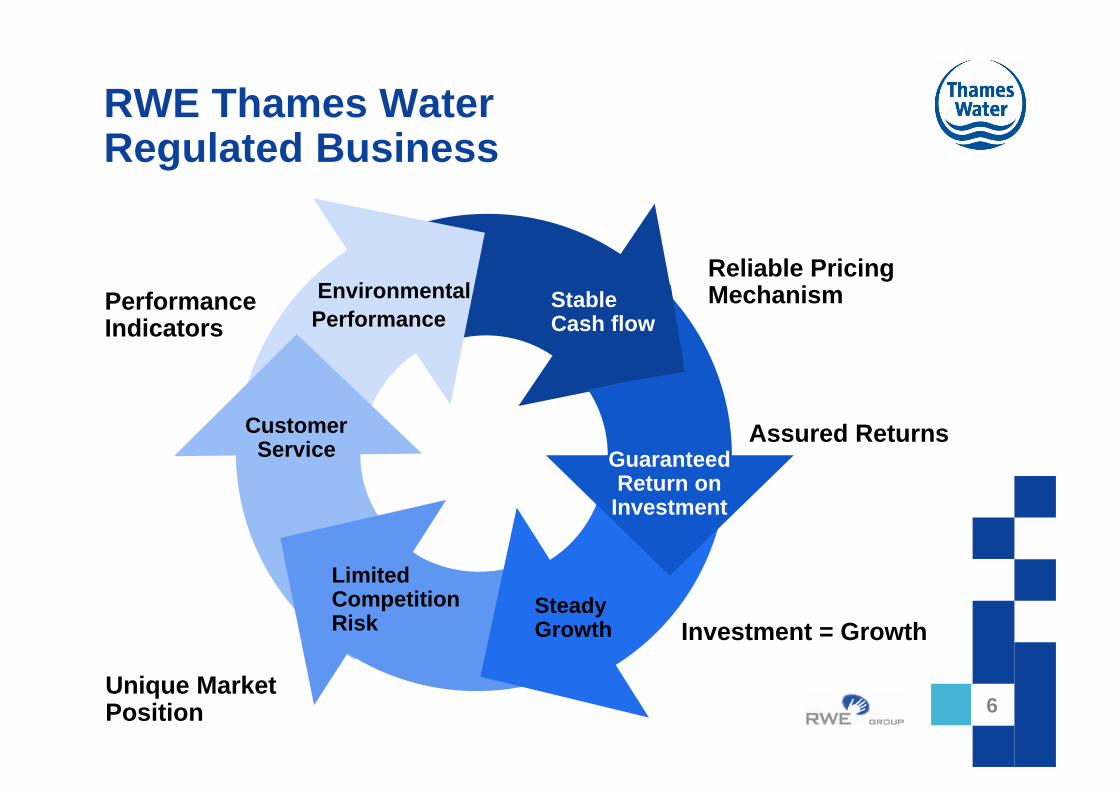
RWE Thames WaterRegulated Business
Assured ReturnsCustomerService
PerformanceIndicators
Investment = GrowthSteadyGrowth
Unique MarketPosition
LimitedCompetitionRisk
Reliable Pricing Mechanism
Guaranteed Return on Investment
Environmental Performance
Stable Cash flow
6
7
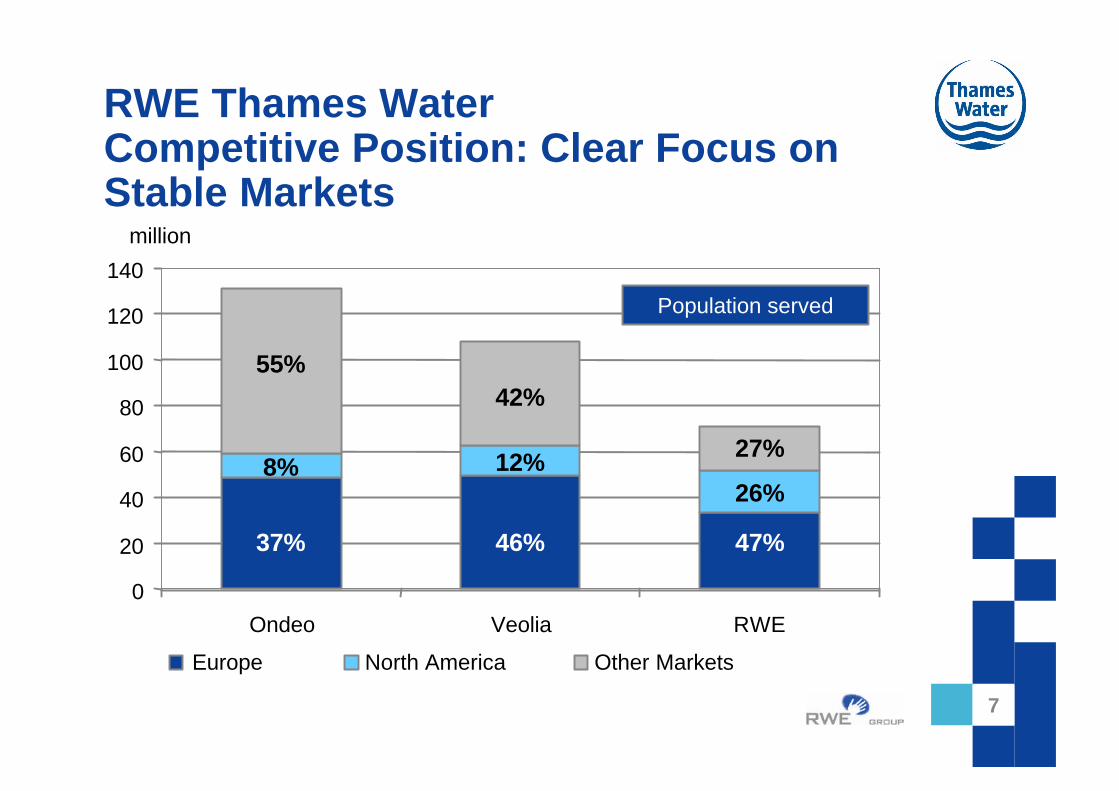
RWE Thames WaterCompetitive Position: Clear Focus on Stable Markets
0
20
40
60
80
100
120
140
Ondeo Veolia RWE
Europe North America Other Markets
55%42%
27%
37%
8%
46%
12%
47%
26%
Population served
7
million
8
RWE Thames WaterEfficiency Opportunities
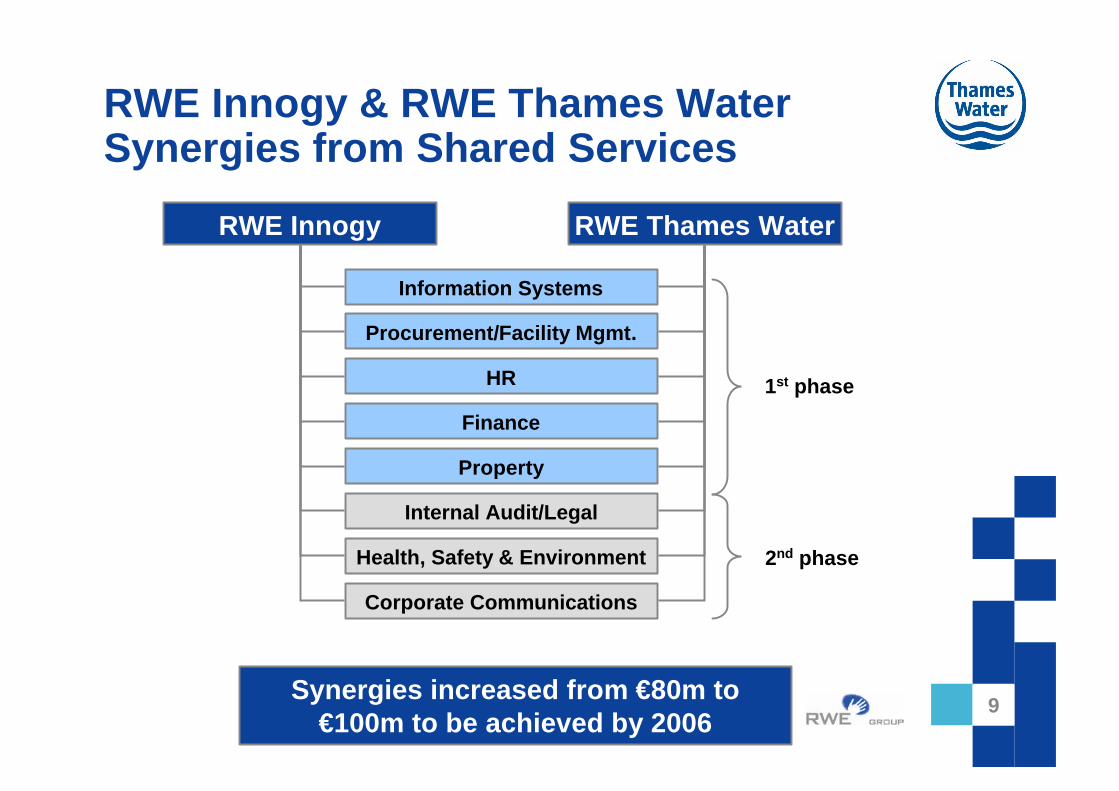
n Business Integration is a core strength and delivers value through
– Combination benefits
– Greater purchasing power in procurement
– Best practice and knowledge transfer
n Further benefits as part of the RWE Group
– Shared Service Centres and Cross-selling initiatives
– Leverage of German business streams through RWE Energy
8
9
RWE Innogy RWE Thames Water
Information Systems
HR
Procurement/Facility Mgmt.
Finance
Property
Internal Audit/Legal
Health, Safety & Environment
Corporate Communications
Synergies increased from €80m to €100m to be achieved by 2006
1st phase
2nd phase
RWE Innogy & RWE Thames WaterSynergies from Shared Services
9

Financial Review
11
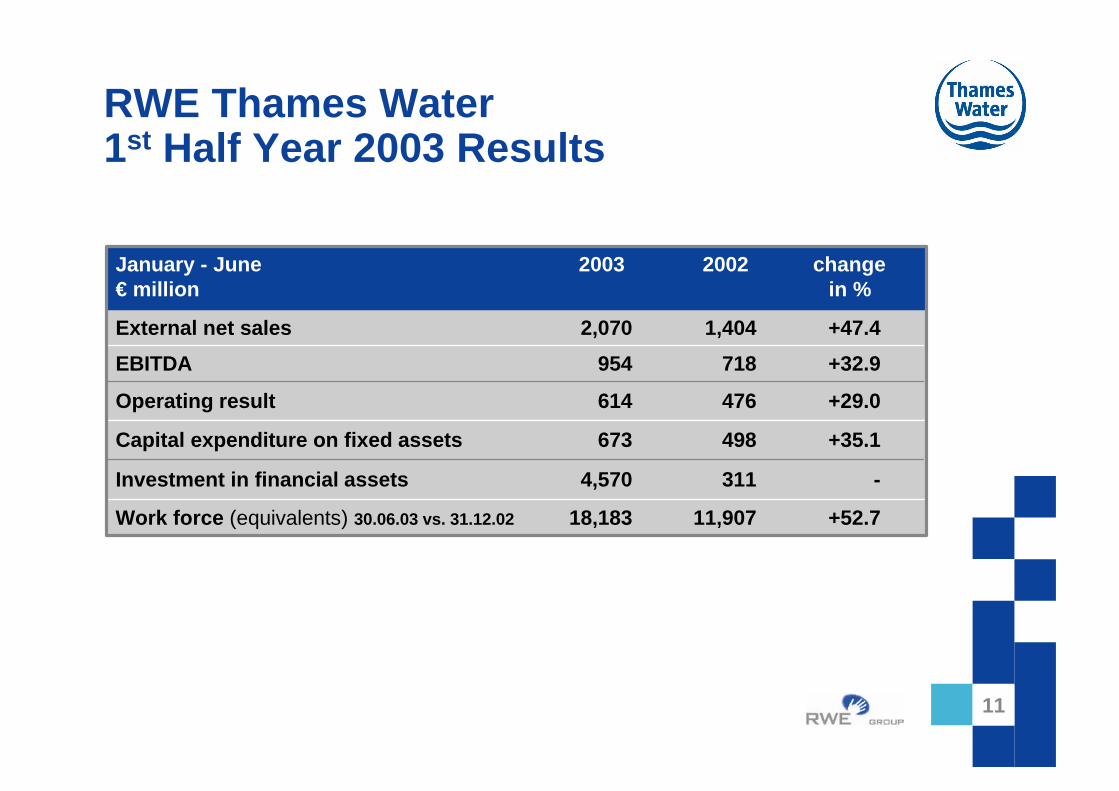
RWE Thames Water1st Half Year 2003 Results
Work force (equivalents) 30.06.03 vs. 31.12.02 18,183 11,907 +52.7
External net sales 2,070 1,404 +47.4
EBITDA 954 718 +32.9
Operating result 614 476 +29.0
January - June 2003 2002 change€ million in %
Investment in financial assets 4,570 311 -
Capital expenditure on fixed assets 673 498 +35.1
11
12
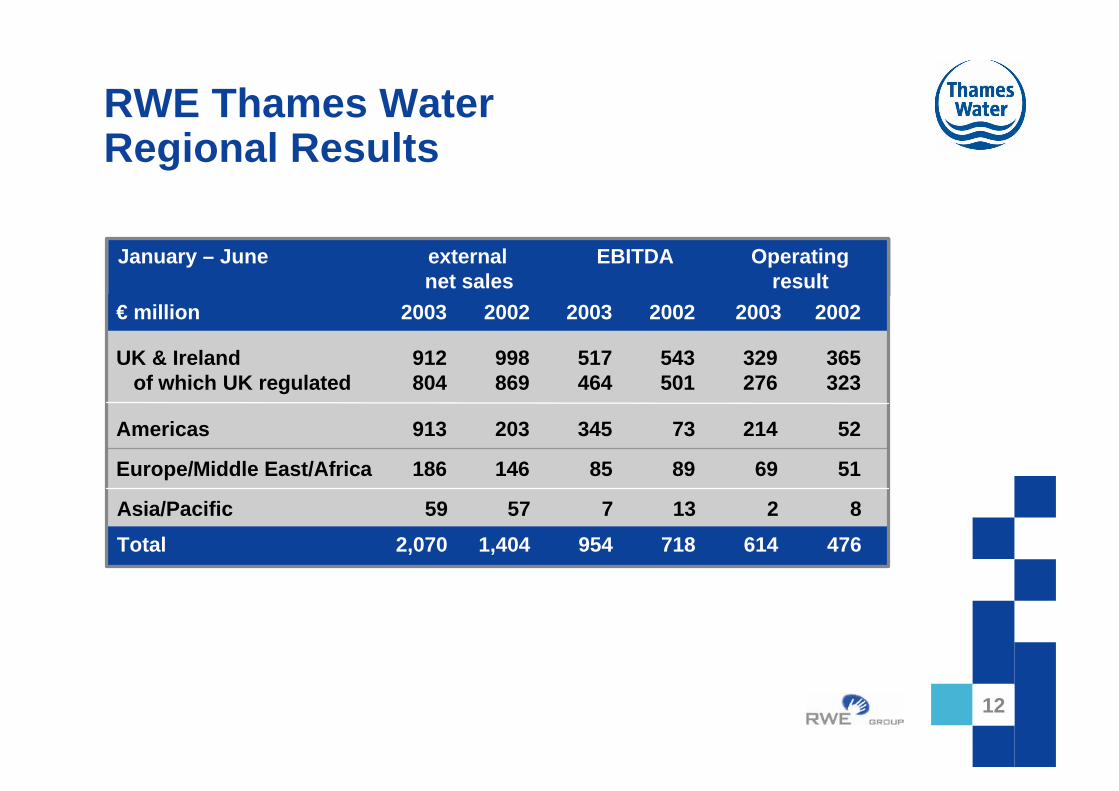
RWE Thames WaterRegional Results
Asia/Pacific 59 57 7 13 2 8
UK & Ireland 912 998 517 543 329 365of which UK regulated 804 869 464 501 276 323
Europe/Middle East/Africa 186 146 85 89 69 51
Americas 913 203 345 73 214 52
January – June external EBITDA Operatingnet sales result
Total 2,070 1,404 954 718 614 476
€ million 2003 2002 2003 2002 2003 2002
12
13
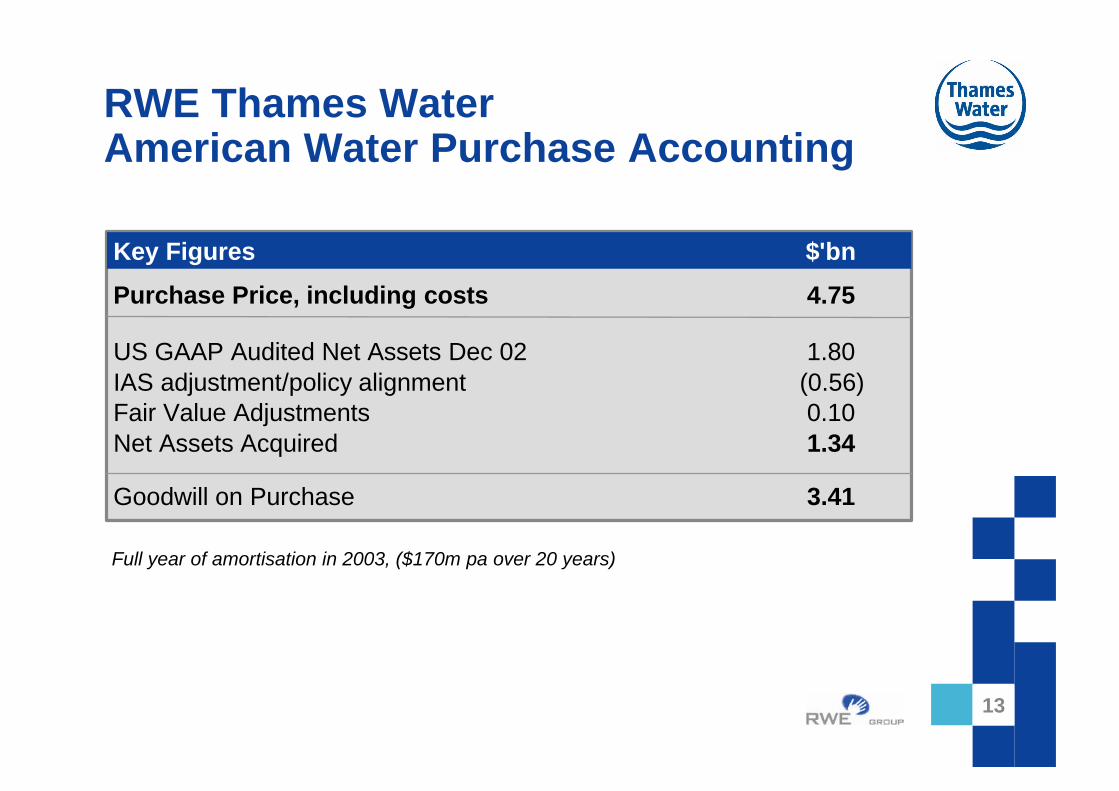
RWE Thames WaterAmerican Water Purchase Accounting
13
Key Figures $'bn
Purchase Price, including costs 4.75
US GAAP Audited Net Assets Dec 02 1.80IAS adjustment/policy alignment (0.56)Fair Value Adjustments 0.10Net Assets Acquired 1.34
Goodwill on Purchase 3.41
Full year of amortisation in 2003, ($170m pa over 20 years)
14
RWE Thames WaterCredit Ratings
n Solid credit ratings recently confirmed
– S&P has confirmed its corporate rating of Thames Water Plc as A+
– S&P has raised its rating of American Water Capital Corporation from A– to A
n Main drivers for decision
– Regulated, monopolistic water operations, providing stable and predictable cash flows
– Ownership and support by RWE
14
Business Review
Germany & Eastern Europe
17
RWE WaterGermany & Eastern Europe
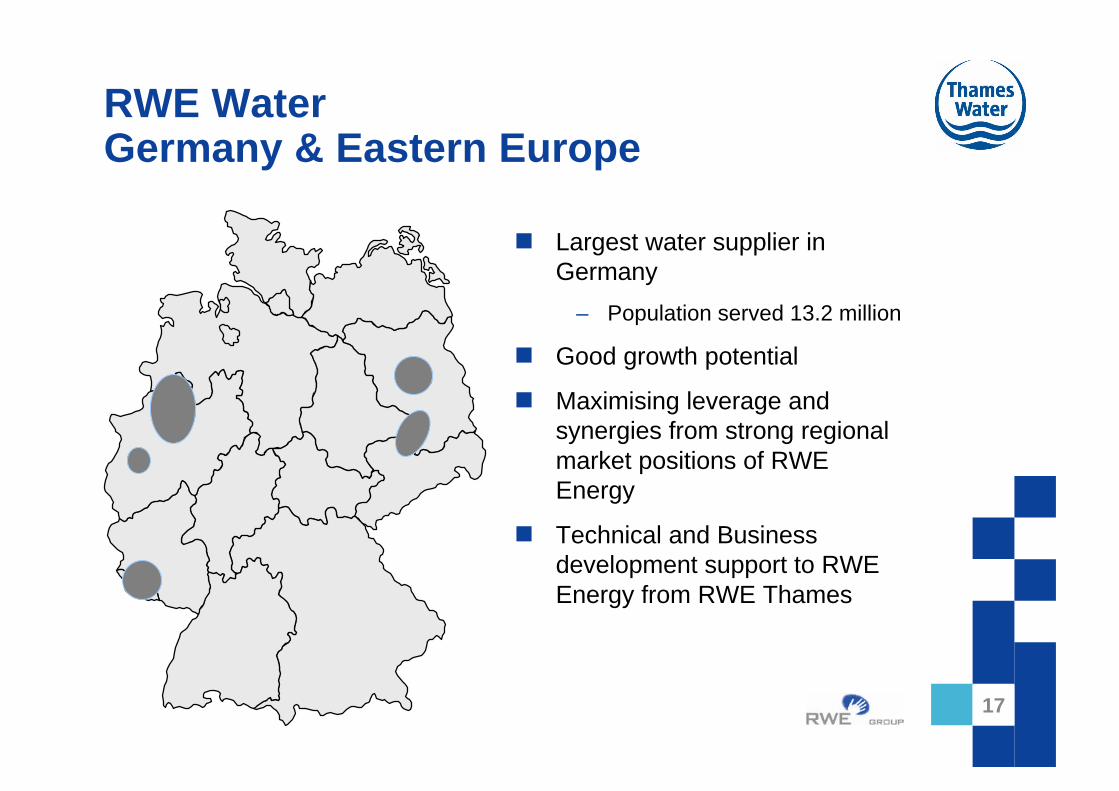
n Largest water supplier in Germany
– Population served 13.2 million
n Good growth potential
n Maximising leverage and synergies from strong regional market positions of RWE Energy
n Technical and Business development support to RWE Energy from RWE Thames
17
18
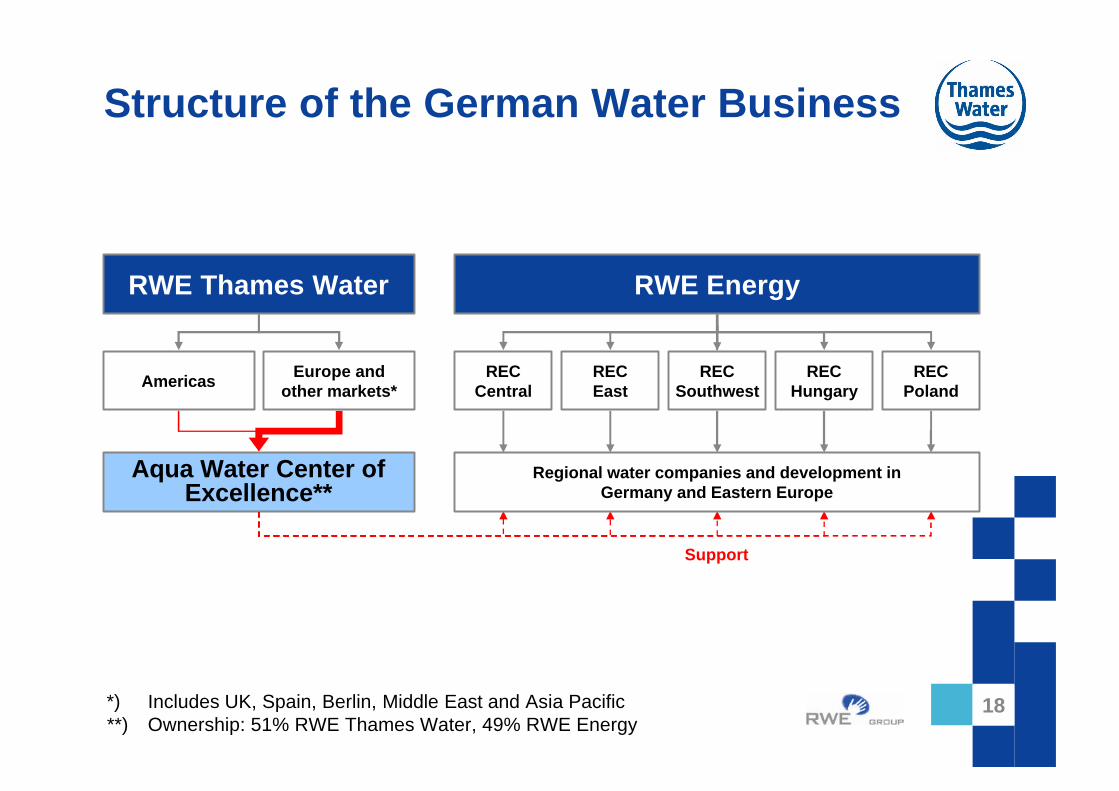
Structure of the German Water Business
*) Includes UK, Spain, Berlin, Middle East and Asia Pacific**) Ownership: 51% RWE Thames Water, 49% RWE Energy
RECCentral
RECEast
RECSouthwest
RECHungary
RECPoland
RWW enviaMaqua
SüwagWater
Budapest Water
DabrowaGornicza
RWE Energy
Americas Europe and other markets*
RWE Thames Water
Aqua Water Center of Excellence**
Support
Regional water companies and development inGermany and Eastern Europe
18
United Kingdom
20
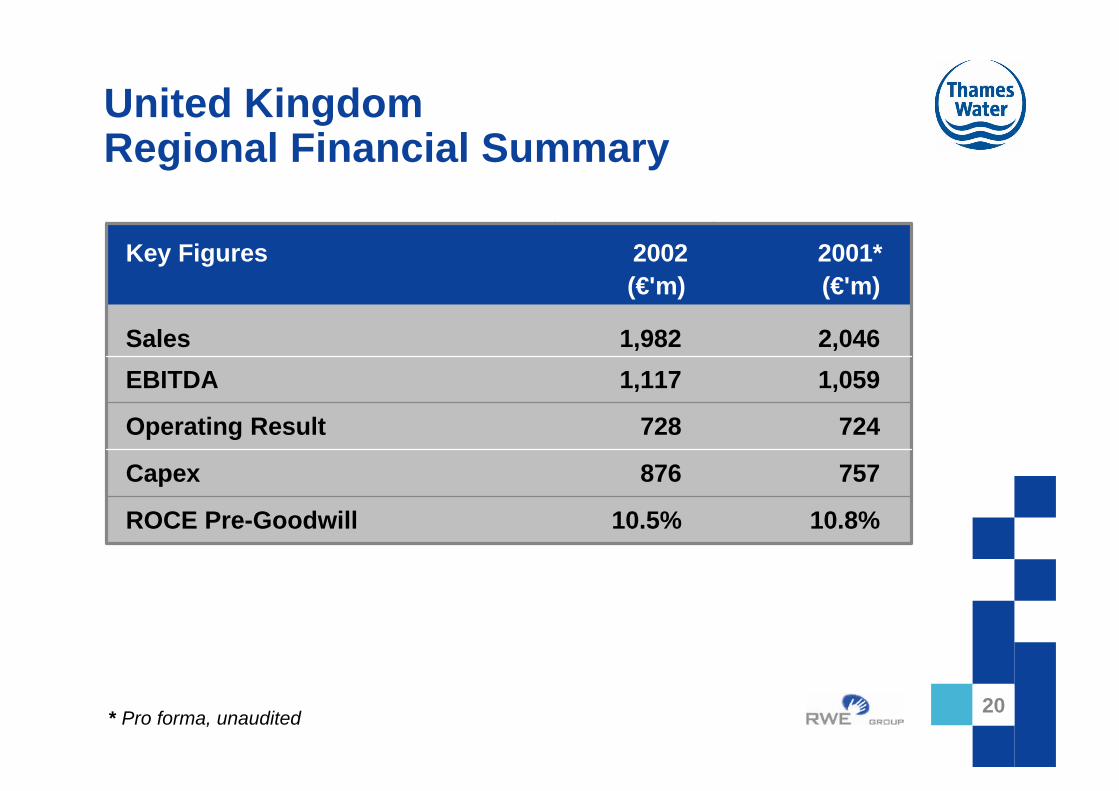
United KingdomRegional Financial Summary
* Pro forma, unaudited20
Key Figures 2002 2001*(€'m) (€'m)
Sales 1,982 2,046
EBITDA 1,117 1,059
Operating Result 728 724
Capex 876 757
ROCE Pre-Goodwill 10.5% 10.8%
21
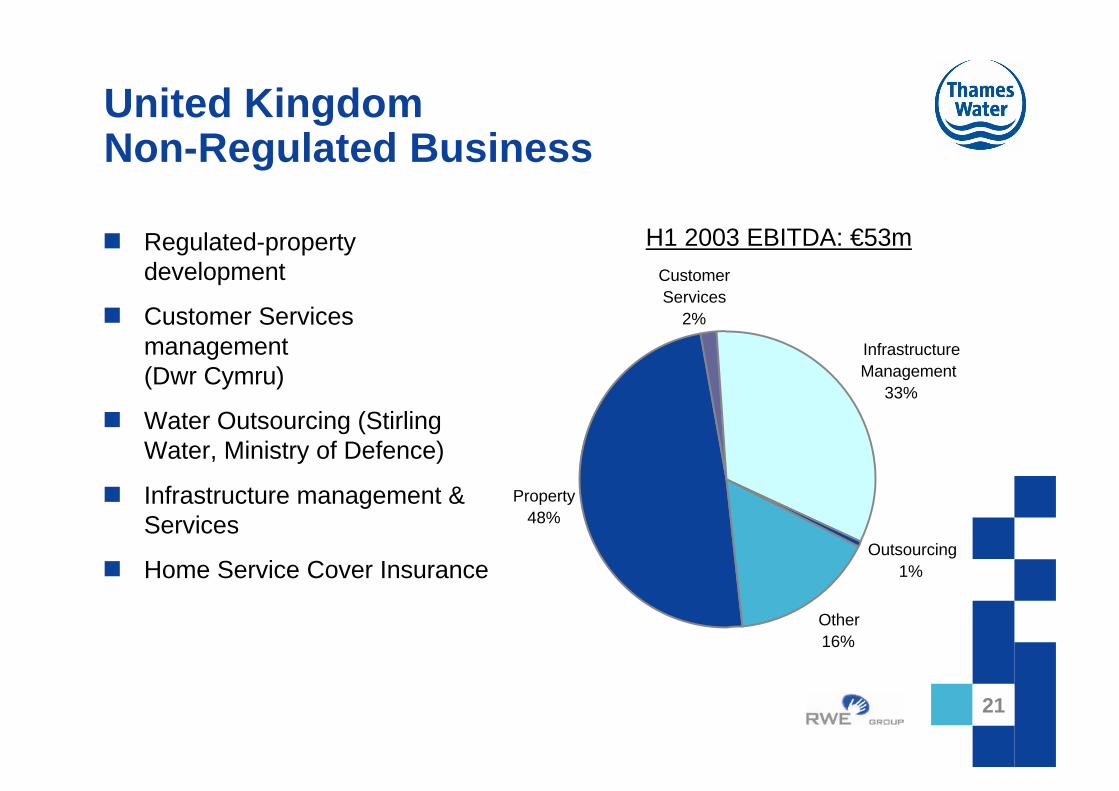
United KingdomNon-Regulated Business
H1 2003 EBITDA: €53mn Regulated-property development
n Customer Services management(Dwr Cymru)
n Water Outsourcing (Stirling Water, Ministry of Defence)
n Infrastructure management & Services
n Home Service Cover Insurance
21
CustomerServices
2%
InfrastructureManagement
33%
Outsourcing1%
Other16%
Property48%
22
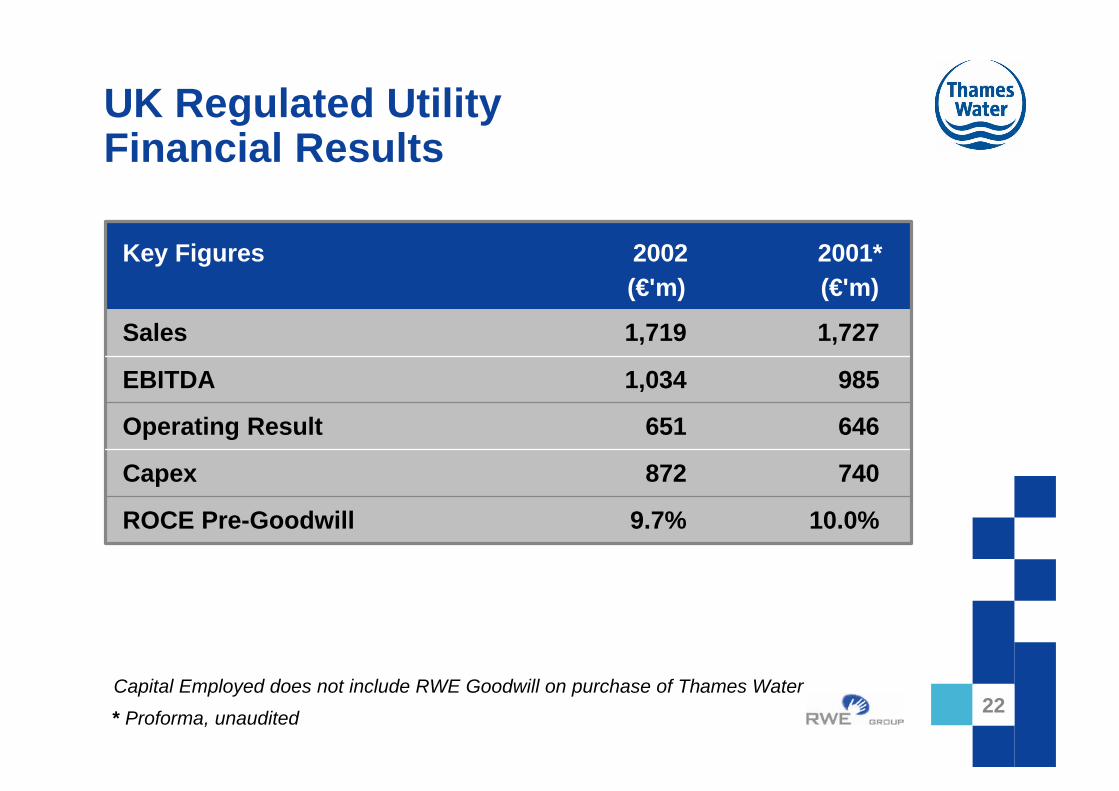
UK Regulated UtilityFinancial Results
* Proforma, unaudited
Capital Employed does not include RWE Goodwill on purchase of Thames Water22
Key Figures 2002 2001*(€'m) (€'m)
Sales 1,719 1,727
EBITDA 1,034 985
Operating Result 651 646
Capex 872 740
ROCE Pre-Goodwill 9.7% 10.0%
23
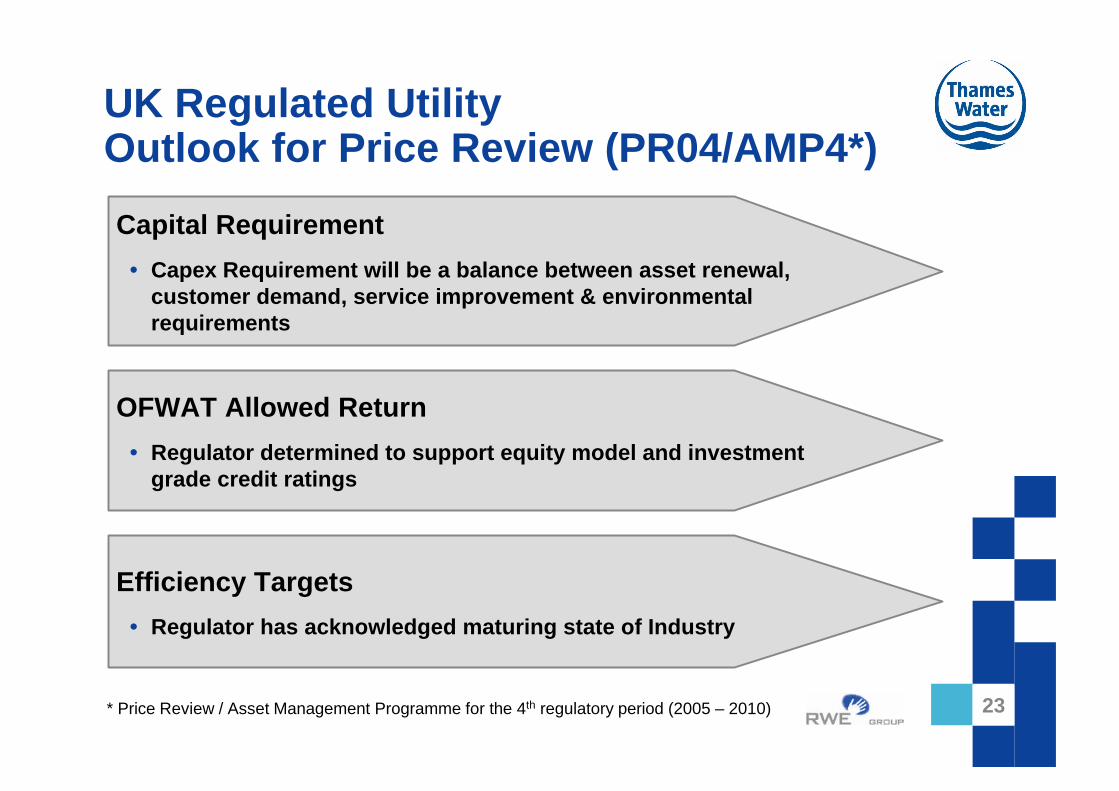
UK Regulated UtilityOutlook for Price Review (PR04/AMP4*)
* Price Review / Asset Management Programme for the 4th regulatory period (2005 – 2010)
Capital Requirement
• Capex Requirement will be a balance between asset renewal, customer demand, service improvement & environmental requirements
OFWAT Allowed Return
• Regulator determined to support equity model and investment grade credit ratings
Efficiency Targets
• Regulator has acknowledged maturing state of Industry
23
24
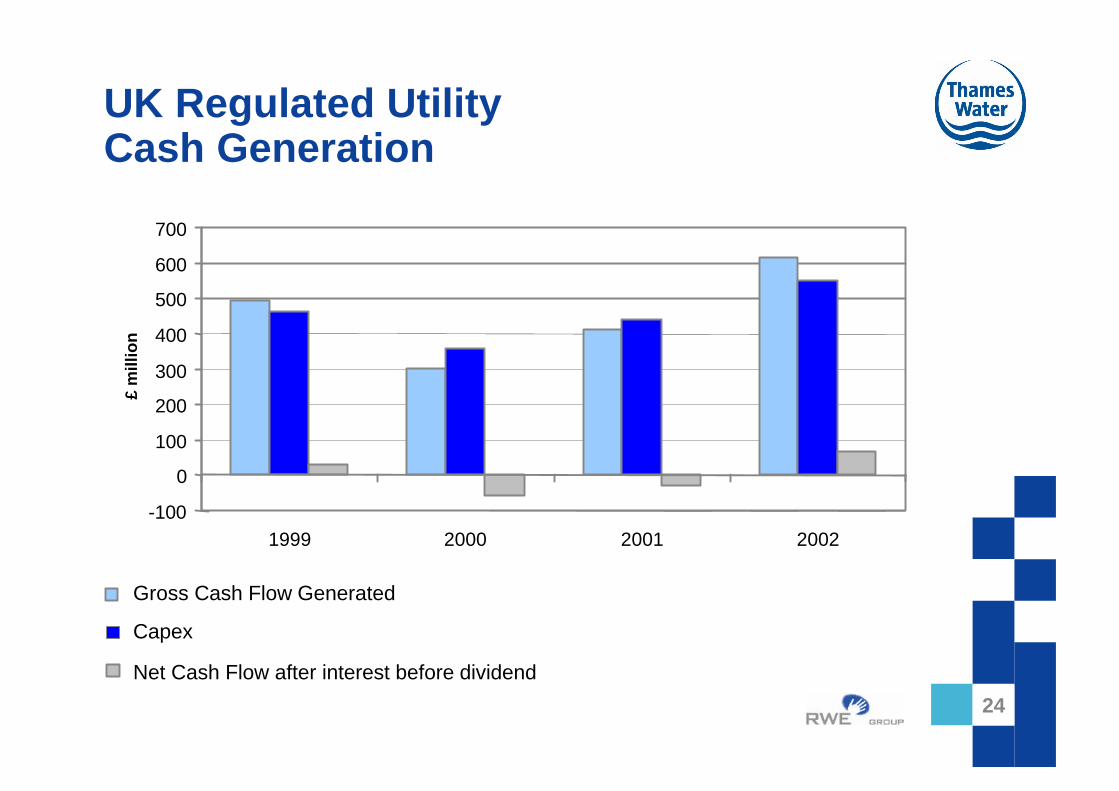
UK Regulated UtilityCash Generation
24
-100
0
100
200
300
400
500
600
700
1999 2000 2001 2002
£m
illio
n
Gross Cash Flow Generated
Capex
Net Cash Flow after interest before dividend
25
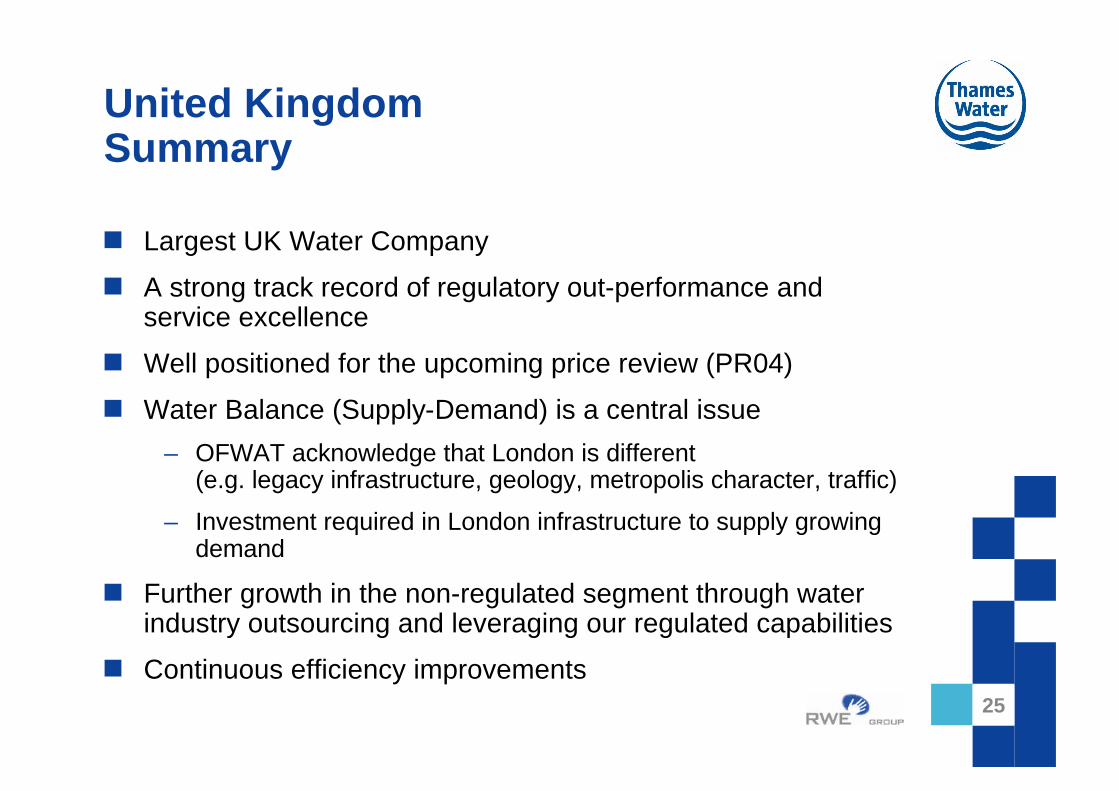
United KingdomSummary
n Largest UK Water Company
n A strong track record of regulatory out-performance and service excellence
n Well positioned for the upcoming price review (PR04)
n Water Balance (Supply-Demand) is a central issue
– OFWAT acknowledge that London is different(e.g. legacy infrastructure, geology, metropolis character, traffic)
– Investment required in London infrastructure to supply growing demand
n Further growth in the non-regulated segment through water industry outsourcing and leveraging our regulated capabilities
n Continuous efficiency improvements25
Americas
27
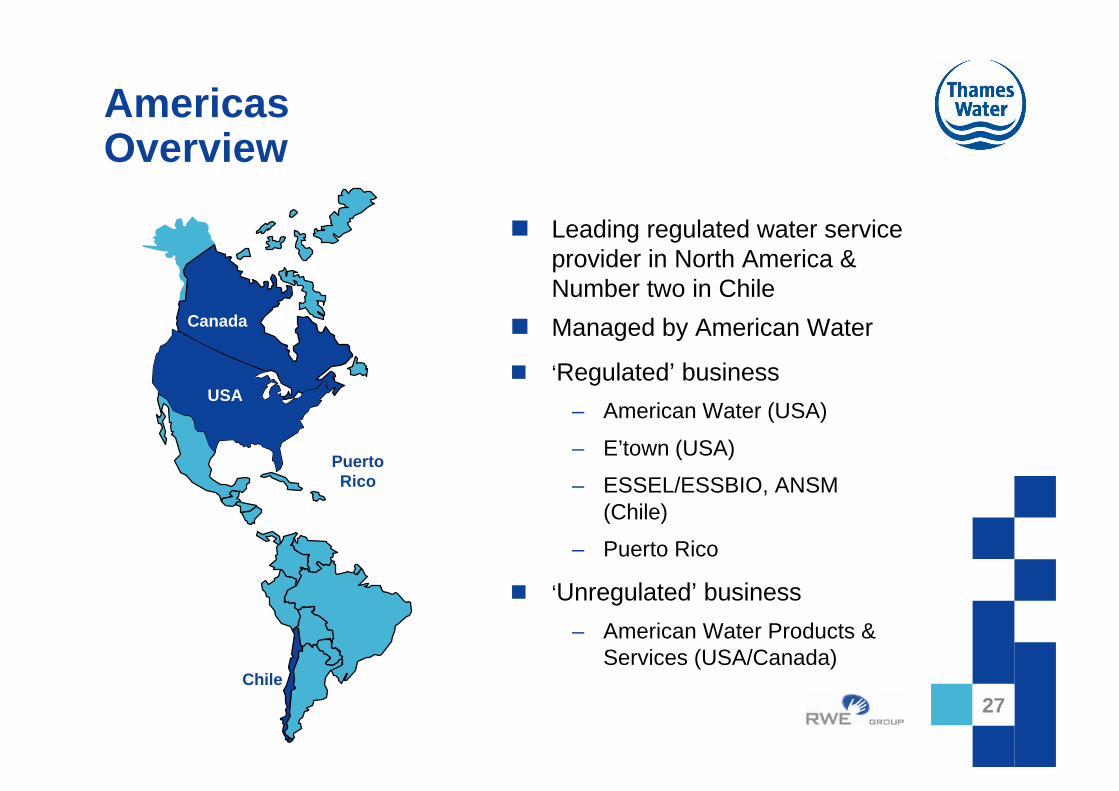
AmericasOverview
n Leading regulated water service provider in North America & Number two in Chile
n Managed by American Water
n ‘Regulated’ business– American Water (USA)
– E’town (USA)
– ESSEL/ESSBIO, ANSM (Chile)
– Puerto Rico
n ‘Unregulated’ business
– American Water Products & Services (USA/Canada)
Chile
USAUSA
PuertoRico
Canada
27
28
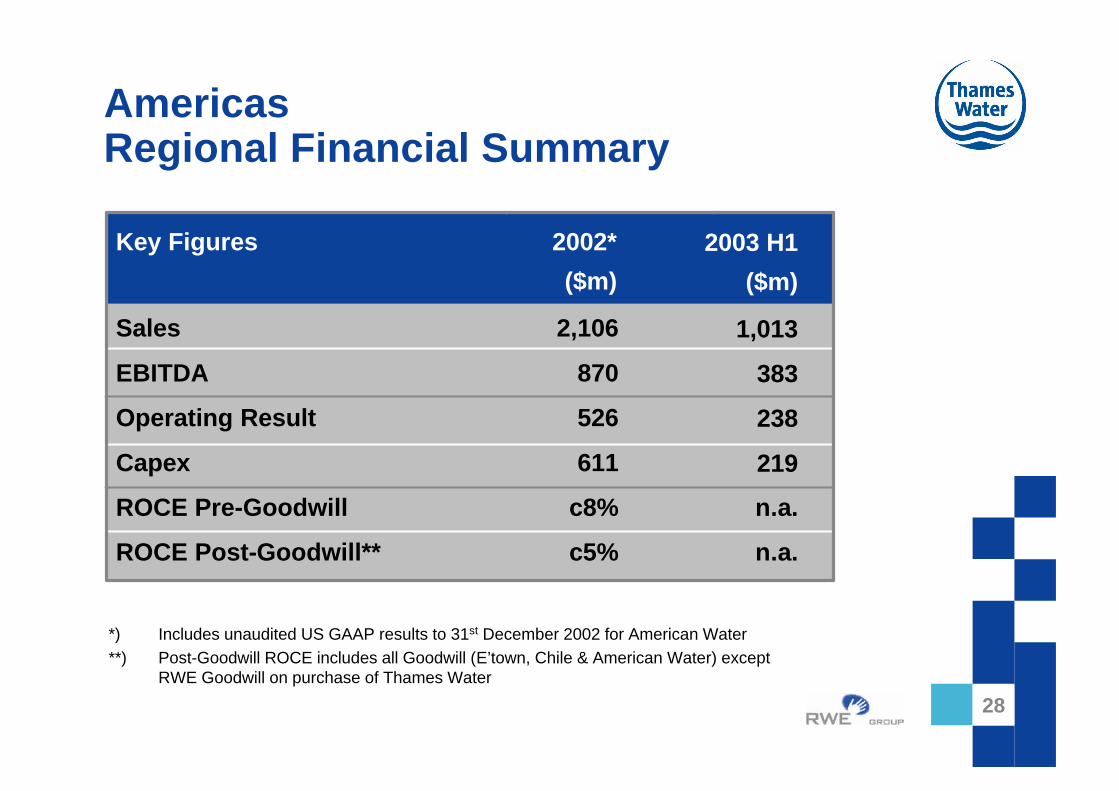
Americas Regional Financial Summary
*) Includes unaudited US GAAP results to 31st December 2002 for American Water**) Post-Goodwill ROCE includes all Goodwill (E’town, Chile & American Water) except
RWE Goodwill on purchase of Thames Water
28
Key Figures 2002*
($m)
Sales 2,106
EBITDA 870
Operating Result 526
Capex 611
ROCE Pre-Goodwill c8%
ROCE Post-Goodwill** c5%
2003 H1
($m)
1,013
383
238
219
n.a.
n.a.
29
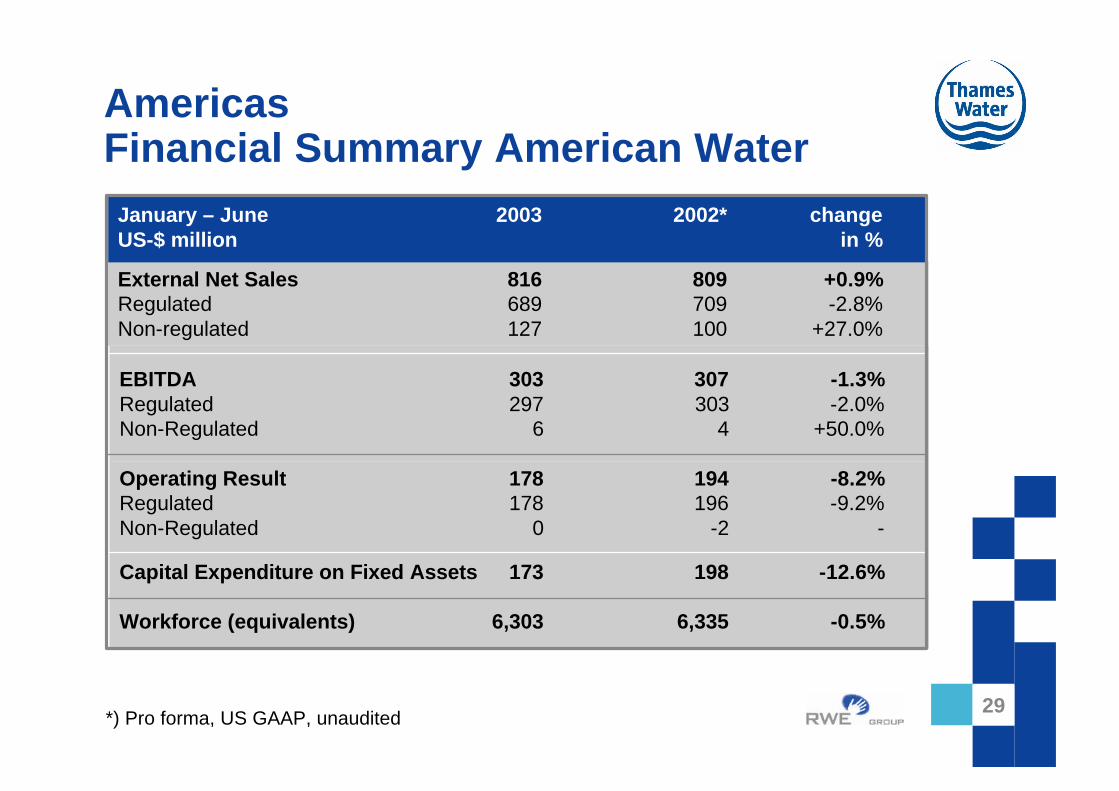
AmericasFinancial Summary American Water
*) Pro forma, US GAAP, unaudited
Capital Expenditure on Fixed Assets 173 198 -12.6%
External Net Sales 816 809 +0.9%Regulated 689 709 -2.8%Non-regulated 127 100 +27.0%
EBITDA 303 307 -1.3%Regulated 297 303 -2.0%Non-Regulated 6 4 +50.0%
January – June 2003 2002* change US-$ million in %
Operating Result 178 194 -8.2%Regulated 178 196 -9.2%Non-Regulated 0 -2 -
Workforce (equivalents) 6,303 6,335 -0.5%
29
30
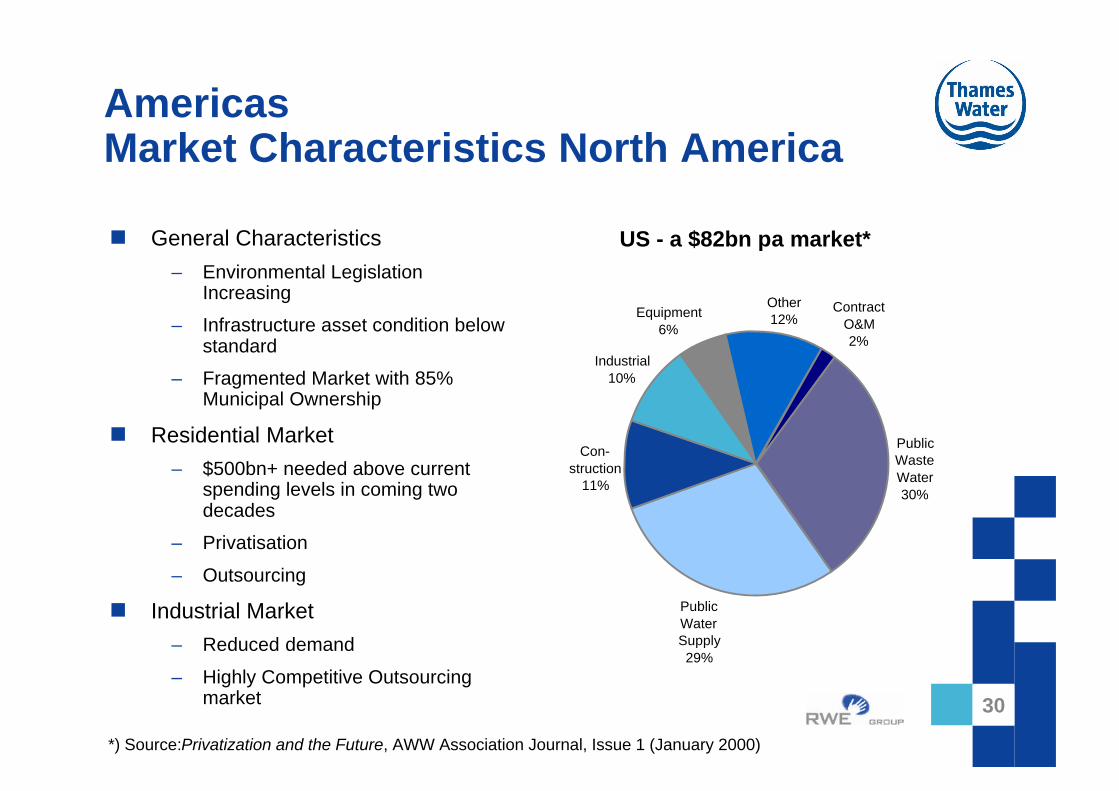
AmericasMarket Characteristics North America
n General Characteristics– Environmental Legislation
Increasing
– Infrastructure asset condition below standard
– Fragmented Market with 85% Municipal Ownership
n Residential Market– $500bn+ needed above current
spending levels in coming two decades
– Privatisation
– Outsourcing
n Industrial Market– Reduced demand
– Highly Competitive Outsourcing market
*) Source:Privatization and the Future, AWW Association Journal, Issue 1 (January 2000)
30
US - a $82bn pa market*
ContractO&M2%
Public WasteWater30%
Public WaterSupply29%
Industrial10%
Equipment6%
Other12%
Con-struction
11%
31
AmericasEconomic Regulation in the US
n Typically, each State Public Utility Commission regulates water utility company rates and tariffs within that state
n Return on Equity model with target returns dependent upon multiple individual state factors
n Rate filings generally at operator’s request and are timed to recoup:
– Capital invested for infrastructure and plant improvements
– Operating cost increases
n Active management of the rate filing process is a key success factor
31
32
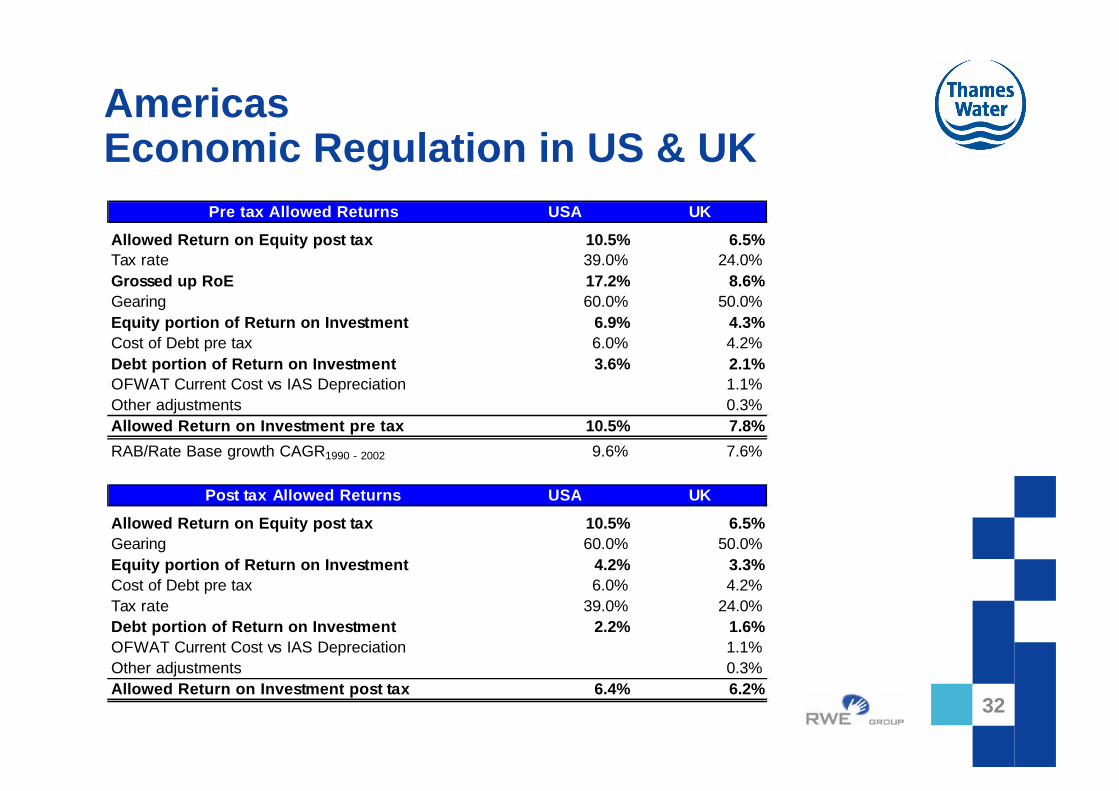
AmericasEconomic Regulation in US & UK
Pre tax Allowed Returns USA UK
Allowed Return on Equity post tax 10.5% 6.5%Tax rate 39.0% 24.0%Grossed up RoE 17.2% 8.6%Gearing 60.0% 50.0%Equity portion of Return on Investment 6.9% 4.3%Cost of Debt pre tax 6.0% 4.2%Debt portion of Return on Investment 3.6% 2.1%OFWAT Current Cost vs IAS Depreciation 1.1%Other adjustments 0.3%Allowed Return on Investment pre tax 10.5% 7.8%
RAB/Rate Base growth CAGR1990 - 2002 9.6% 7.6%
Post tax Allowed Returns USA UK
Allowed Return on Equity post tax 10.5% 6.5%Gearing 60.0% 50.0%Equity portion of Return on Investment 4.2% 3.3%Cost of Debt pre tax 6.0% 4.2%Tax rate 39.0% 24.0%Debt portion of Return on Investment 2.2% 1.6%OFWAT Current Cost vs IAS Depreciation 1.1%Other adjustments 0.3%Allowed Return on Investment post tax 6.4% 6.2%
32
33
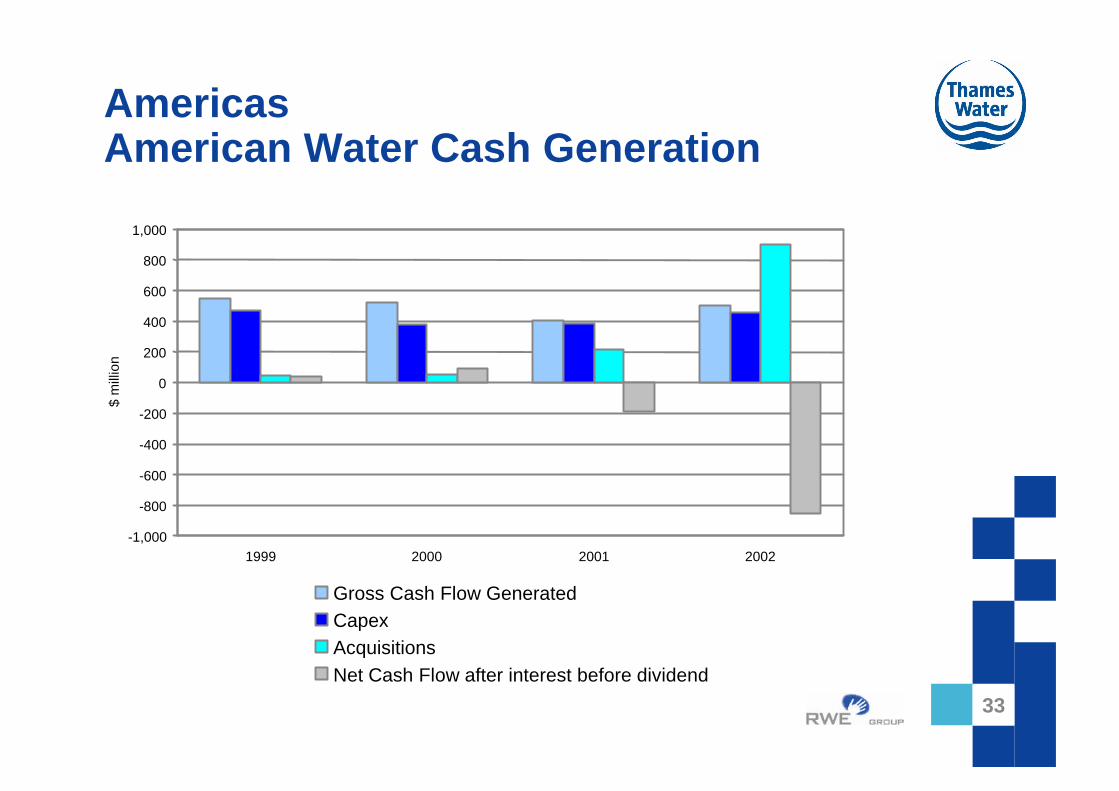
AmericasAmerican Water Cash Generation
33
-1,000
-800
-600
-400
-200
0
200
400
600
800
1,000
1999 2000 2001 2002
$ m
illio
n
Gross Cash Flow GeneratedCapexAcquisitionsNet Cash Flow after interest before dividend
34
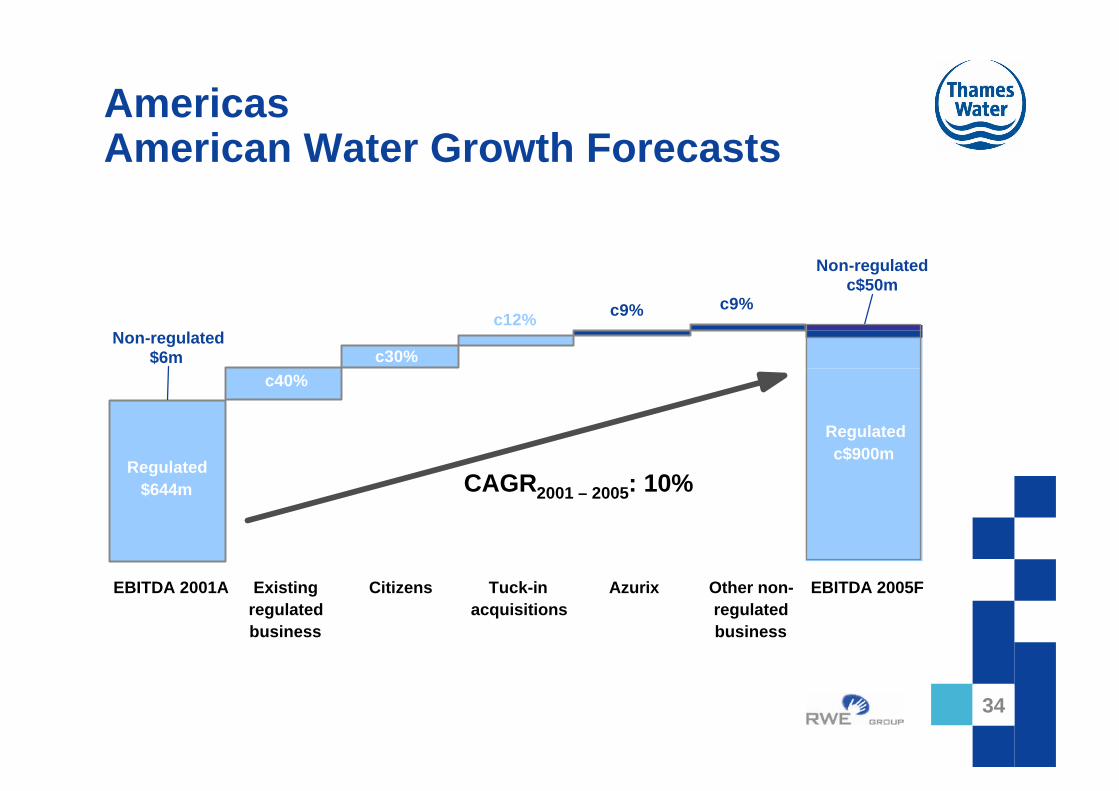
AmericasAmerican Water Growth Forecasts
EBITDA 2001A Existingregulatedbusiness
Citizens Tuck-inacquisitions
Azurix Other non-regulatedbusiness
EBITDA 2005F
c40%c30%
c12% c9% c9%
Non-regulated$6m
Non-regulatedc$50m
Regulated c$900m
CAGR2001 – 2005: 10%Regulated
$644m
34
35
AmericasSummary
n 10% EBITDA growth remains the target for American Water
– Clearing the rate case backlog through focussed rate case programme and managing our relationships with regulators
– Further growth through small tuck-in acquisitions and through opportunities in the municipal O&M market (incl. Military bases)
– Extract value from private sector involvement in the Wastewater segment
n Adding further value through integration
– Best practice transfer and procurement initiatives
– Back-office consolidation across the region
– Value break-even target 2006
– Earnings pre-goodwill accretive in 2003
35
Future Outlook and Conclusions
37
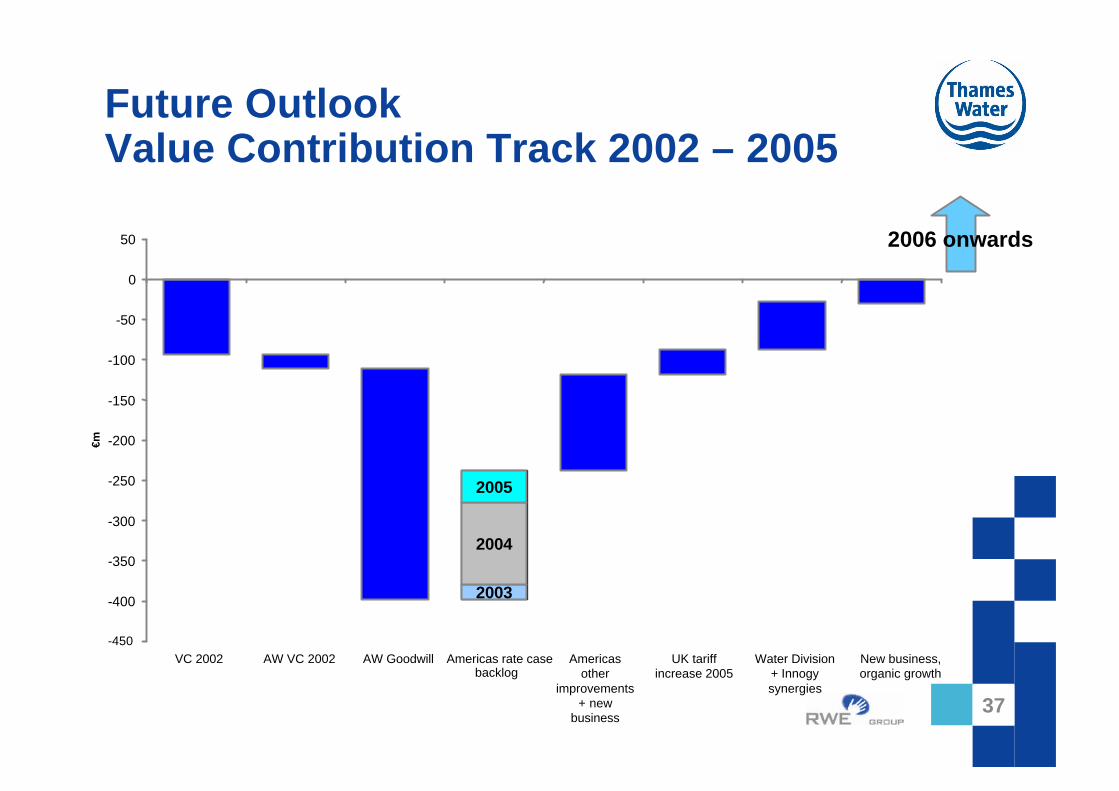
Future OutlookValue Contribution Track 2002 – 2005
2006 onwards
-450
-400
-350
-300
-250
-200
-150
-100
-50
0
50
VC 2002 AW VC 2002 AW Goodwill Americas rate casebacklog
Americas other
improvements + new
business
UK tariff increase 2005
Water Division + Innogy synergies
New business, organic growth
€m
2003
2004
2005
37
38
RWE Thames WaterConclusions
n Water Division is a key component of RWE Group
n Drivers in our core water markets remain strong
n Primary focus is on key markets: USA, UK & Germany
n US market has strong potential for organic growth
n Our core capabilities enable us to extract value from the regulatory framework
n Regulated water provides stable, predictable earnings and steady growth and contributes to the strong, stable RWE credit rating
38


![Thames Region Land Drainage - gov.uk · Thames Water Authority LAND DRAINAGE BYELAWS 1981 [as amended by the Thames Region FLOOD DEFENCE BYELAWS 1991] The Thames Water Authority,](https://img.pdfslide.us/doc/110x75/5ead899913c7690cc165ecc9/thames-region-land-drainage-govuk-thames-water-authority-land-drainage-byelaws.jpg)