Embed Size (px)
Citation preview
Annual Report 2002
Integration: The Key to Success
RWE_GB_EN_US_Einzelseiten.qxd 14.03.2003 19:32 Uhr Seite 3

5Brief portrait
At a glance
€ million
€ million
€ million
€ million
€ million
€ million
€ million
%
%
€ million
€ million
€ million
€
€
€
€
50,366
6,790
3,908
2,194
1,744
1,350
3,560
10.5
9.5
388
37,757
7,560
3.20
2.40
6.33
1.00
46,633
7,241
4,504
2,722
1,355
1,050
5,933
10.4
9.5
395
44,293
16,985
3.25
1.87
10.55
1.102
- 7.4
+ 6.6
+ 15.3
+ 24.1
- 22.3
- 22.2
+ 66.7
- 1.0
—
+ 1.8
+ 17.3
+ 124.7
+ 1.6
- 22.1
+ 66.7
+ 10.0
2001
pro forma1
+/- in %RWE Group 2002
1 See commentary in the review of operations on page 36. 2 Dividend proposal (including bonus) for RWE AG’s 2002 financial year, subject to approval by the May 15, 2003 Annual General Meeting.3 Full time equivalent, according to the percentage of full-time employment.
Workforce 131,765FTE3 123,423 + 6.8
+/- in %
External net sales
EBITDA
Operating result
Income before tax
Income after tax
Net income
Operating cash flow
Return on capital employed (ROCE)
Capital costs (WACC) before taxes
Value added
Capital employed
Capital expenditure
Earnings per share
_excluding goodwill amortization
_including goodwill amortization
Operating cash flow per share
Dividend per share
12/31/02 12/31/01
RWE_GB_EN_US_Einzelseiten.qxd 14.03.2003 19:32 Uhr Seite 4

Slovak electricity market tapped
By acquiring a 49% stake in the East Slovak power
utility VSE, RWE establishes a presence in this
Eastern European growth market. VSE provides
some 600,000 end customers with electricity and
has about 22% of the market. In addition to the
shareholding, RWE also assumes entrepreneurial
control.
RWE becomes a leading provider on Polish
electricity market
RWE signs an agreement with the Polish govern-
ment to acquire an 85% interest in Warsaw-based
electric utility STOEN. The company supplies
electricity to nearly 800,000 customers in the
Polish capital.
RWE implements German Corporate Governance
Code
The Supervisory and Executive Boards issue a
statement of compliance on the implementation
of the recommendations from the “Governmental
Commission for the German Corporate Governance
Code.” Once the required amendments have been
made to its articles of association at the 2003
Annual General Meeting, RWE will comply with all
of the code’s recommendations.
Gas production expanded
RWE Dea acquires UK-based gas producer Highland
Energy, thus increasing its gas reserves by
13 million cubic meters to 76.5 million cubic meters
of oil equivalent. Highland Energy owns production
acreage in the North Sea, RWE Dea’s core region.
Acquisition of one of the largest British energy
companies
With its recommended offer for Innogy Holdings,
RWE sets foot on the UK utility market for the
second time. Innogy is the country’s second-lar-
gest electricity and third-largest gas provider.
By obtaining a premiere position on a second key
market, RWE strengthens its position as one of
Europe’s leading multi-utilities.
Market leadership on German water market
extended
By raising its stake in RWW Rheinisch-Westfälische
Wasserwerksgesellschaft mbH, from 14% to about
80%, RWE widens its lead on the EU’s largest
water market. RWW serves some one million water
customers in the Ruhr Region and in Münsterland.
As a result, RWE now supplies water to 13 million
people in Germany.
Green light for entry into Czech gas market
The Czech Republic’s antitrust authorities approve
the acquisition of Transgas and interests in eight
of the country’s regional gas utilities. RWE thus
advances to the premiere league of European gas
companies.
02_2002 07_2002
03_2002
04_2002
05_2002
Key Events
10_2002
12_2002
RWE_GB_EN_US_Einzelseiten.qxd 14.03.2003 19:32 Uhr Seite 5

The RWE Group—A brief portrait
With 132,000 employees and annual net sales exceeding €46 billion, RWE ranks among Europe’s largest industrial corporations. In implementingour multi-utility strategy, we concentrate on our four core businesses in thefields of electricity, gas, water and environmental services. We are one of theleading players in these industries in Germany, Great Britain, central EasternEurope and the USA. Moreover, our activities give us a portfolio that enablesstability just as much as it does growth. More than 20 million customershave opted for electricity and gas from RWE. Over 16 million householdsutilize our waste-disposal services. And we supply 70 million people world-wide with drinking water and wastewater services.
Electricity
RWE Power Power Generation
RWE Rheinbraun Lignite-Fired PowerGeneration and Mining
RWE Trading Trading
RWE NetNet
RWE Plus Sales and Marketing
RWE Solutions Industrial Services
Innogy HoldingsUK Energy
OthersHarpen
Gas Water
Environ-
mental
Services
Non-Core
Businesses
RWE AG
RWE Gas Midstream/Down-stream
RWE Dea Upstream
Thames Water Water and Sewerage
RWE Umwelt WasteManagement
HeidelbergerDruckmaschinen
HOCHTIEF Construction andCivil Engineering
RWE Systems Corporate Services
Core Businesses
RWE_GB_EN_US_Einzelseiten.qxd 14.03.2003 19:32 Uhr Seite 6

Highlights_Operating result posts another double-digit increase
_Electricity again No. 1 success factor_Internationalization process largely completed_2003—Year of consolidation
Operating result posts another double-digit
increase
Fiscal 2002 was a successful year. We improved our
Group’s operating result by 15%. Even without
taking our large-scale acquisitions into conside-
ration, our core businesses boosted their operating
result by 18%. By contrast, earnings generated by
our non-core businesses were substantially down
on the previous year.
Electricity again No. 1 success factor
Our electricity business continued its dynamic
development. It contributed more than half of the
Group’s operating result. Electricity’s 53% increase
in its operating result was primarily driven by the
sustained upward trend displayed by our German
electricity operations.
Internationalization process largely completed
We put our strong position on the European utility
market on an even broader base with the acquisi-
tion of the British energy utility Innogy and nearly
the entire Czech gas business. In addition, in com-
pleting the acquisition of American Water at the
beginning of 2003, we became the No. 1 player in
the regulated US water business.
2003—Year of consolidation
With a phase of strong external growth behind us,
the rapid integration of our new companies is now
the topmost item on our agenda. At the same
time, we will constantly improve the Group’s
earning power through further cost-cutting and
efficiency enhancements. We will also gradually
reduce our net debt.
RWE_GB_EN_01-16_Neu.qxd 14.03.2003 17:53 Uhr Seite 1
2
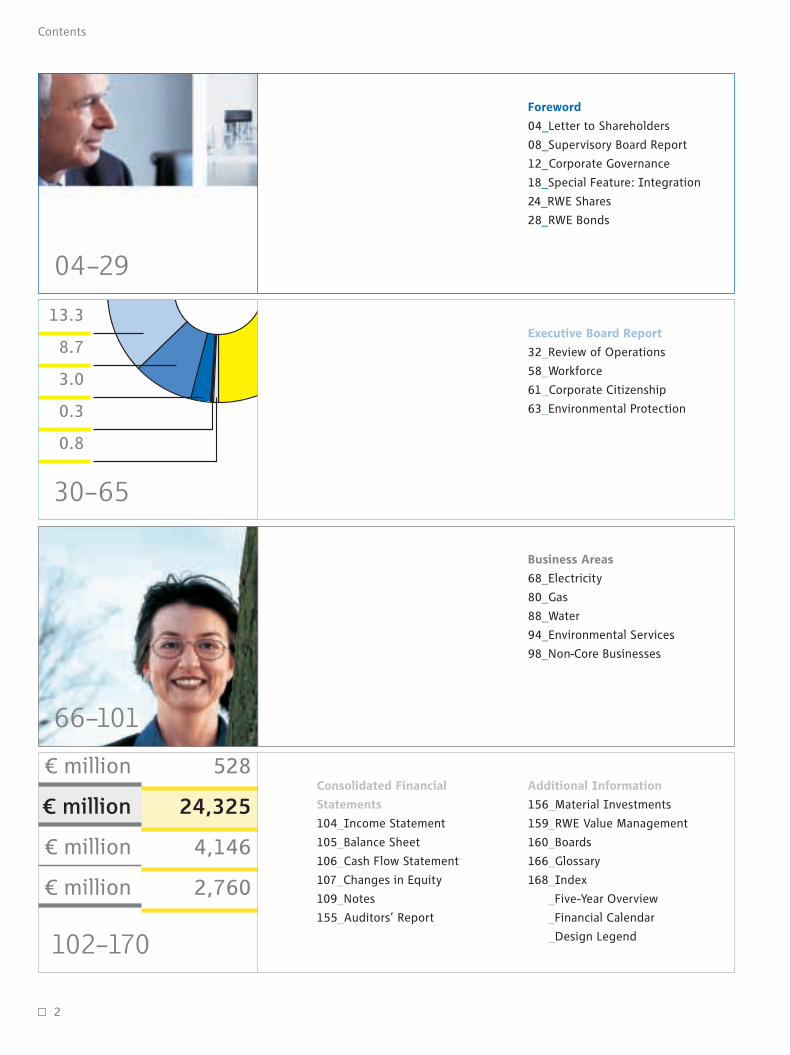
Contents
13.3
8.7
3.0
0.3
0.8
528
24,325
4,146
2,760
¤ million
¤ million
¤ million
¤ million
Executive Board Report
32_Review of Operations
58_Workforce
61_Corporate Citizenship
63_Environmental Protection
Consolidated Financial
Statements
104_Income Statement
105_Balance Sheet
106_Cash Flow Statement
107_Changes in Equity
109_Notes
155_Auditors’ Report
Additional Information
156_Material Investments
159_RWE Value Management
160_Boards
166_Glossary
168_Index
_Five-Year Overview
_Financial Calendar
_Design Legend
Foreword
04_Letter to Shareholders
08_Supervisory Board Report
12_Corporate Governance
18_Special Feature: Integration
24_RWE Shares
28_RWE Bonds
Business Areas
68_Electricity
80_Gas
88_Water
94_Environmental Services
98_Non-Core Businesses
04–29
66–101
102–170
30–65
RWE_GB_EN_01-16_Neu.qxd 14.03.2003 17:53 Uhr Seite 2
3
Contents
Foreword 04–29
Executive Board Report 30–65
Business Areas 66–101
Consolidated Financial Statements, Additional Information 102–170
Integration: The Key to Success
The RWE Group today provides for the needs of
customers far beyond our roots in Germany. In the
UK and central Eastern Europe, we supply communi-
ties with electricity, gas and water. We provide
water to North Americans as well. The RWE Group’s
core businesses—electricity, gas, water and environ-
mental services—are there to serve more than
100 million customers worldwide.
For us, the quality of being international means
working together in a way that transcends borders
to reach common goals in innovative ways. We hold
deep respect for the differences of other cultures,
and strive always to learn from them. That’s why we
believe that integrating people and business is the
key to our success.
As a company, we draw our strength from a broad
array of people and their many talents. Some of
these people are to be seen in the photos
throughout our annual report. With these portraits
we are introducing you to individuals who are
determined to achieve success together at RWE.
Front cover, left:
Minyi Du, Business Development Director,
Thames Water China, Shanghai
Front cover, right:
Jan Heinz Knoop, Storage Manager, Kalle
Natural Gas Storage Facility, RWE Gas
RWE_GB_EN_01-16_Neu.qxd 14.03.2003 17:53 Uhr Seite 3
4
Letter to Shareholders
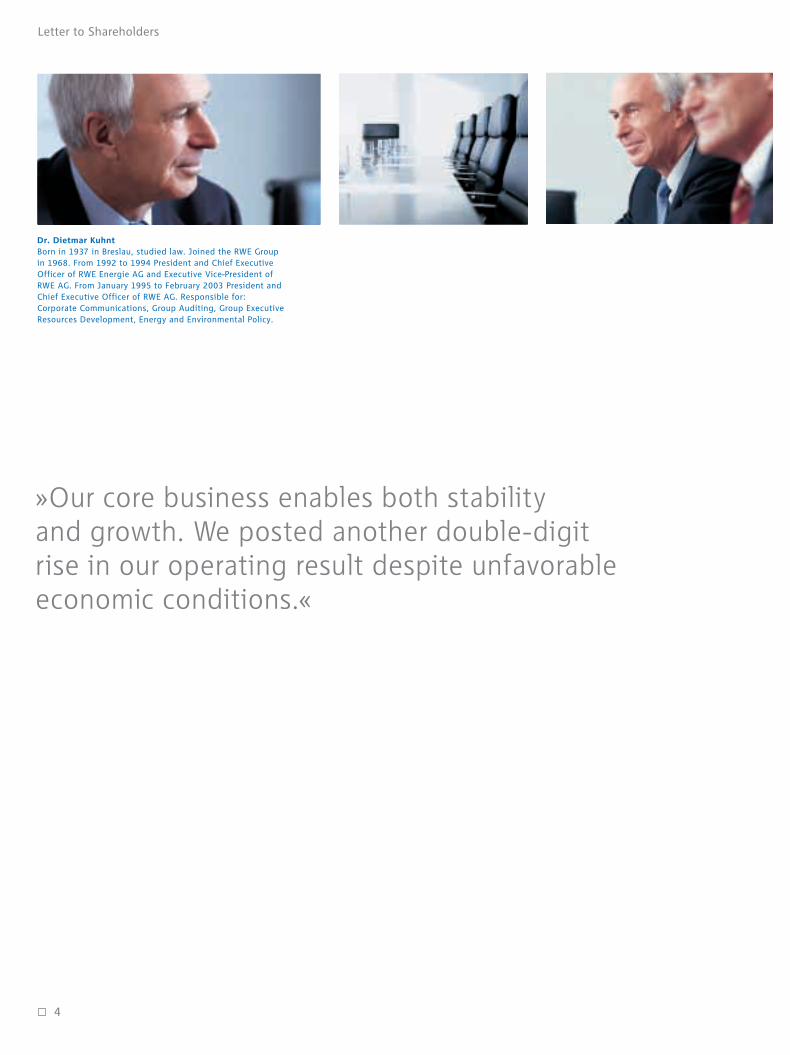
»Our core business enables both stability and growth. We posted another double-digitrise in our operating result despite unfavorableeconomic conditions.«
Dr. Dietmar KuhntBorn in 1937 in Breslau, studied law. Joined the RWE Groupin 1968. From 1992 to 1994 President and Chief ExecutiveOfficer of RWE Energie AG and Executive Vice-President ofRWE AG. From January 1995 to February 2003 President andChief Executive Officer of RWE AG. Responsible for:Corporate Communications, Group Auditing, Group ExecutiveResources Development, Energy and Environmental Policy.
RWE_GB_EN_01-16_Neu.qxd 14.03.2003 17:54 Uhr Seite 4

Dear Shareowners and Friends of the Company,
The year 2002 was a difficult one for the world
economy. The expected upturn never came. Fear of
war and terrorist attacks led to a sustained feeling
of uncertainty. Major stock indices went through
periods of free fall. Even shares commonly known
to be less susceptible to cyclical fluctuations, so-
called “safe havens,”got caught in the downward
spiral. RWE’s shares were unable to counter this
trend. Our common share was down almost as
much as the DAX 30, falling to its lowest quotation
in over seven years.
Solid earnings despite weak non-core businesses
Our operating activities were marked by the weak
economic situation as well. Nevertheless, we are
pleased to be able to give you a report on what
has been a successful fiscal 2002. Consolidated
operating results posted another double-digit
increase, advancing some 15%. This was possible
only because we achieved our ambitious income
goals in our core businesses. At our last Annual
General Meeting, we promised you that we would
generate significant organic earnings growth. And
we kept our promise: Even without taking the
large-scale acquisitions into account, our core
businesses lifted their operating result by 18%.
More than half of the consolidated operating result
was single-handedly generated by our electricity
business. Posting some 53% in earnings growth, it
continued to benefit from the upward trend of our
German power operations. Our Gas and Water
Business Areas also recorded a double-digit im-
provement in their operating results. Environmen-
tal Services, by far the smallest core business area,
was the only division that failed to match the year-
earlier earnings figure. We initiated a far-reaching
restructuring program to counteract this.
Heidelberger Druckmaschinen recorded a surpri-
sing collapse in profits. Our refinery and service-
station businesses posted an operating loss in the
last six months leading up to their divestment.
As a result, on the whole, the non-core businesses
were a substantial burden.
As expected, the Group’s net income reflects the
expenditure in our strong external growth. How-
ever, it was also affected by exceptional charges
due to the weak economic environment and the
difficult situation on the capital market. Therefore,
earnings per share excluding goodwill amortization
were only 1.6% higher year-on-year, and were
some 22% down year-on-year, including goodwill
amortization.
We want you too, our shareholders, to benefit from
the stability of our core businesses even in periods
of economic strain. Therefore, we will propose to
the May 15, 2003 Annual General Meeting that the
dividend remain unchanged at ¤ 1 per share. We
will also propose a ¤ 0.10 bonus per share. This is
our way of letting you partake in the successful
sale of our refinery and service-station activities.
5
Letter to Shareholders
Harry RoelsBorn in 1948 in the Netherlands, obtained a degree inphysical chemistry in 1971. Worked for the Royal Dutch/Shell Group for 30 years. In July 1999 appointed Mana-ging Director of Royal Dutch Petroleum Company andExecutive Vice-President of the Royal Dutch/Shell Group.Since February 1, 2003 President and Chief ExecutiveOfficer of RWE AG. Responsible for: Corporate Commu-nications, Group Auditing, Group Executive ResourcesDevelopment, Energy and Environmental Policy.
RWE_GB_EN_01-16_Neu.qxd 14.03.2003 17:54 Uhr Seite 5
With this 10% dividend increase, RWE’s share is
still one of the DAX’s strongest issues in terms of
payout.
Internationalization process largely completed,
focus sharpened even further
Fiscal 2002 was a year of success also in terms of
our strategy. By taking over almost the entire
Czech gas industry, we gained a foothold in one of
Eastern Europe’s most attractive growth markets.
Our acquisition of Innogy, one of the three largest
energy utilities in the UK, has given us a leading
position in another key European market. Having
completed the acquisition of American Water
Works, which ranks first in the US regulated water
business, right at the beginning of the current
financial year, we have established a strong posi-
tion on the world’s largest water market. In sum,
this gives us a balanced platform for long-term
growth and value creation, with little exposure to
cyclical fluctuation.
Our core businesses will generate about half of
their operating results outside Germany in fiscal
2003. We have not planned any further large-scale
acquisitions.
We also made progress in concentrating on our
core business. Shell acquired our entire refinery
and service-station business as of July 1, 2002—
ahead of schedule. However, due to the unfavor-
able situation of the economy and the stock
markets, we will not be able to adhere to our plan,
which envisioned exiting our remaining non-core
businesses, Heidelberger Druckmaschinen and
HOCHTIEF, by the end of 2003. Nevertheless, RWE
is already a highly focused utility company, when
compared with its peer group. Only 4% of the
Group’s operating result was contributed by non-
core businesses last year.
The four pillars of RWE’s strategy
With three years of realignment behind it, your
company is now on firm footing. We have core busi-
nesses that allow at once for stability and growth.
We have exclusively established ourselves on key
utility markets that hold future promise. Thus, in-
stead of banking on a widely diversified geographic
presence, we have clearly defined the markets in
which we are concentrating our resources regio-
nally. This is the basis on which we will continue to
roll out our strategy in the next few years:
jTailoring market activities to optimize margins
by concentrating on customer groups with high
long-term value-added potential
jMarket and cost leadership with a view to
achieving reasonable value contributions
through volume and cost advantages even in
cases of increased pressure on prices
6
Letter to Shareholders
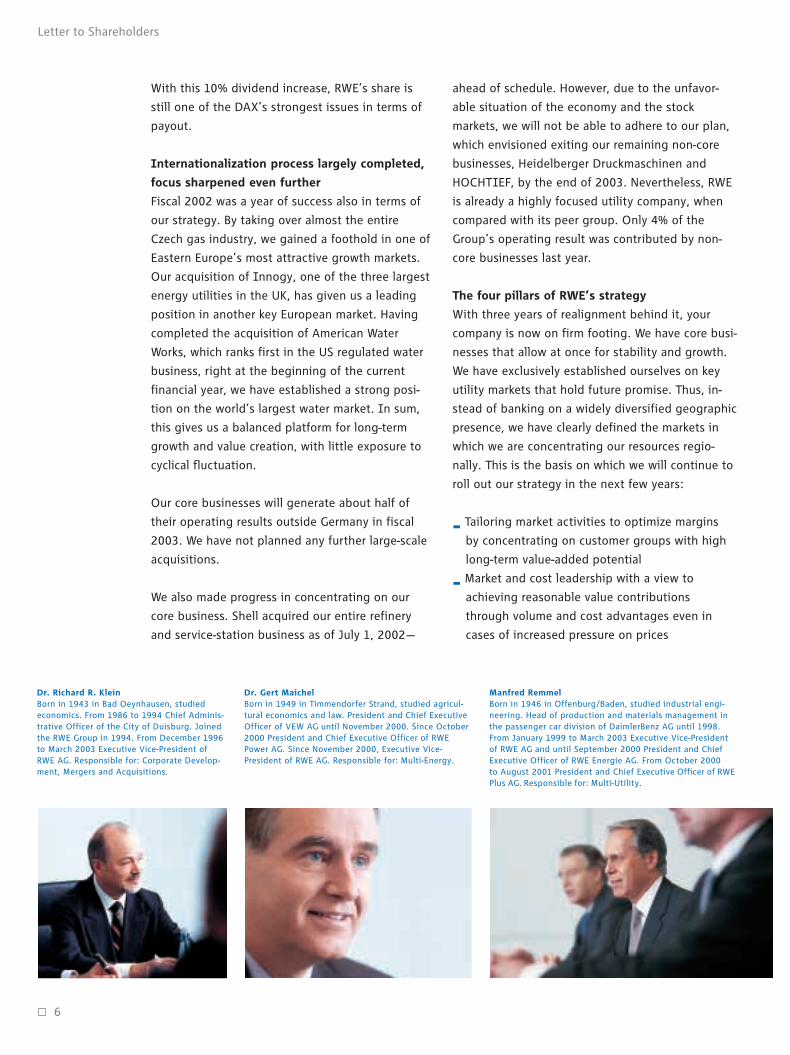
Dr. Richard R. KleinBorn in 1943 in Bad Oeynhausen, studiedeconomics. From 1986 to 1994 Chief Adminis-trative Officer of the City of Duisburg. Joinedthe RWE Group in 1994. From December 1996to March 2003 Executive Vice-President ofRWE AG. Responsible for: Corporate Develop-ment, Mergers and Acquisitions.
Manfred RemmelBorn in 1946 in Offenburg/Baden, studied industrial engi-neering. Head of production and materials management inthe passenger car division of DaimlerBenz AG until 1998.From January 1999 to March 2003 Executive Vice-Presidentof RWE AG and until September 2000 President and ChiefExecutive Officer of RWE Energie AG. From October 2000 to August 2001 President and Chief Executive Officer of RWEPlus AG. Responsible for: Multi-Utility.
Dr. Gert MaichelBorn in 1949 in Timmendorfer Strand, studied agricul-tural economics and law. President and Chief ExecutiveOfficer of VEW AG until November 2000. Since October2000 President and Chief Executive Officer of RWEPower AG. Since November 2000, Executive Vice-President of RWE AG. Responsible for: Multi-Energy.
RWE_GB_EN_01-16_Neu.qxd 14.03.2003 17:54 Uhr Seite 6

jRegional cooperation among our four core
businesses to realize synergies as regards
customers, costs and know-how
jVertical integration along the entire value-added
chain, in order to obtain margin advantages via
networking and compensate for market
fluctuations
2003—Year of consolidation
After a phase, which was characterized by external
growth, consolidation is now topmost on our list of
priorities. We have a three-pronged thrust:
jIntegration: The rapid and efficient incorpo-
ration of acquisitions into the Group structure is
crucial to our achieving the goals we have set in
terms of our position on the market and our
results in the years ahead.
jOperating performance: We will progressively
increase our earning power by further cost
reductions and efficiency enhancements.
jFinancial stability: A strong flow of cash from our
stable core businesses and a healthy balance
sheet are the key success factors for our good
ratings on the capital market. Furthermore, we
will reduce our net debt by scaling back capital
expenditure and by selling off investments in our
core business that are strategically immaterial.
7
Letter to Shareholders
Dr. Klaus SturanyBorn in 1946 in Wehrda/Hesse, studied mathe-matics. From 1997 to 1999 Spokesman of the Boardof Management of GEA AG. Since December 1999Executive Vice-President of RWE AG. Responsiblefor: Finance, Group Controlling, Investor Relations,Accounting, Tax, Insurance.
Jan ZiliusBorn in 1946 in Marburg, studied law. Joined the RWE Groupin 1990. Since April 1998 Executive-Vice President and LaborDirector of RWE AG. Responsible for: Group Human Resour-ces Management, Law/Board Matters.
Harry Roels
President and CEO of RWE AG
We will master these challenges. Therefore, we
have good reason to take an optimistic view of the
future. After all, the dynamics of the changes we
have experienced over the last few years have
enabled us to gain enough momentum to capi-
talize on new opportunities. Our employees have
always dealt with new challenges competently and
autonomously, assuming responsibility for their
own actions. And we will continue to count on
them going forward. It is in this light that we want
to make a special point of thanking them for their
hard work and commitment. To you, our share-
holders and friends of the company, we would like
to extend our gratitude for the trust you have
placed in us. Although our share price doesn’t
reflect it at present, RWE’s staff and management
team are doing everything they can to ensure that
your company remains on its course for success.
Essen, February 25, 2003
Sincerely yours,
Dr. Dietmat Kuhnt
President and CEO of RWE AG
RWE_GB_EN_01-16_Neu.qxd 14.03.2003 17:54 Uhr Seite 7

Dear Shareholders,
For us at RWE, fiscal 2002 centered on external
growth and sharper focus. We passed milestones
en route to expanding our electricity and gas
operations, which are core businesses, with the
acquisitions of UK-based Innogy Holdings plc,
Czech-based Transgas, a.s., and the eight Czech
regional utilities. Now, the task at hand is to firmly
incorporate these companies into the Group by
implementing strategic integration measures. The
sale of our 50% stake in the oil downstream joint
venture with Shell underscores our focus on the
Group’s core businesses.
The Supervisory Board closely monitored measures
taken by the Executive Board in the 2002 fiscal
year. It convened for four ordinary and one extra-
ordinary meeting during which it received reports
on the progress of business as well as issues con-
cerning the continued development of the Group
companies’ strategies and operations. Furthermore,
the members of the Supervisory Board were kept
abreast of the progress of business every quarter
and were informed of specific issues in writing by
the Executive Board. The Supervisory Board passed
resolutions that fall under its scope of responsibi-
lity according to German corporate law as well as
the company’s articles of association and bylaws
on the basis of decision proposals and circular pro-
cedures. Moreover, the Chairman of the Super-
visory Board was promptly and comprehensively
8
Supervisory Board Report
Supervisory Board Report
informed of significant occurrences of material
importance to the assessment of the status,
development and management of the company.
Corporate governance
One of the key subjects of deliberation in the
Supervisory Board was corporate governance. Good
corporate governance standards are indispensable
to a company of RWE’s stature. They play a signi-
ficant role when it comes to gaining the trust of
our investors. RWE has already complied with the
recommendations and suggestions included in the
German Corporate Governance Code to a great
extent. Additionally, the Supervisory Board has
consulted with the Executive Board to develop a
concept for institutionalizing the remaining rules.
In its September session, after in-depth prepa-
rations, the Supervisory Board adopted bylaws to
address this issue, focusing on the organization of
the Supervisory Board and its committees, as well
as on the rights and duties of each and every one
of its members. Furthermore, the Supervisory
Board set up an audit committee, increased its
committees’ scope of action, and defined the
Executive Board’s reporting in concrete terms.
Having implemented these measures, the Super-
visory Board was in a position to issue a statement
of compliance on its behalf in its December
session. The statement has just one technical
limitation, since changing the compensation
scheme for Supervisory Board members who also
RWE_GB_EN_01-16_Neu.qxd 14.03.2003 17:54 Uhr Seite 8
9
Supervisory Board Report
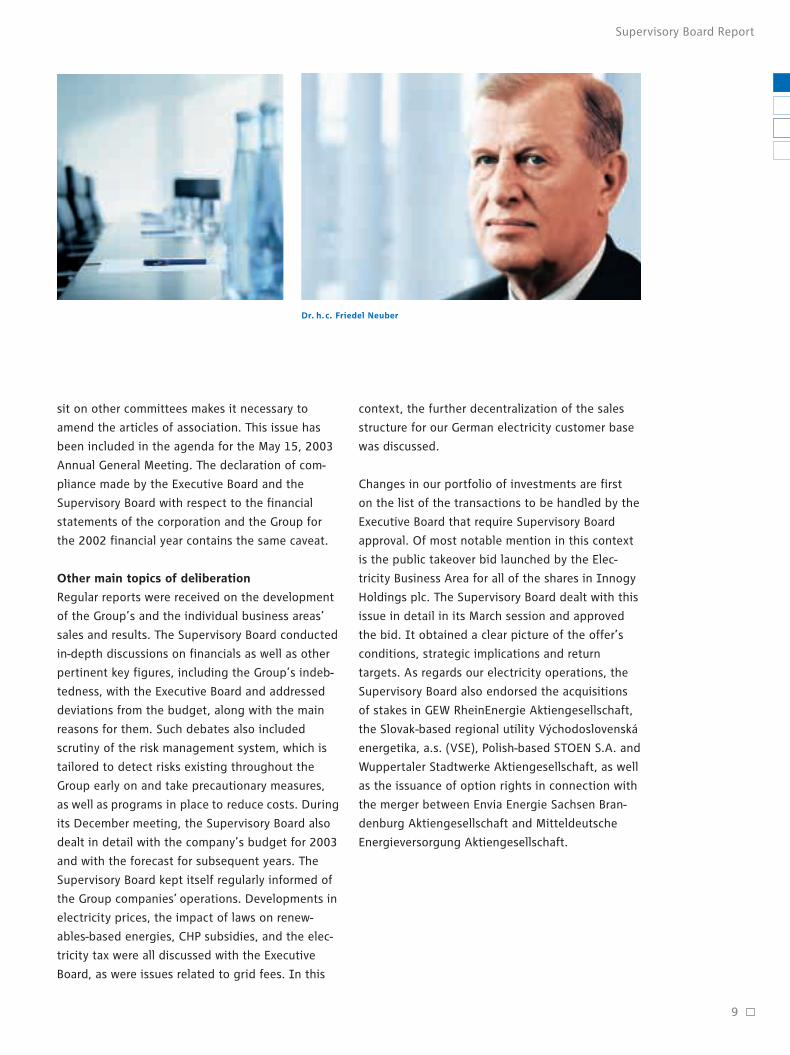
Dr. h.c. Friedel Neuber
sit on other committees makes it necessary to
amend the articles of association. This issue has
been included in the agenda for the May 15, 2003
Annual General Meeting. The declaration of com-
pliance made by the Executive Board and the
Supervisory Board with respect to the financial
statements of the corporation and the Group for
the 2002 financial year contains the same caveat.
Other main topics of deliberation
Regular reports were received on the development
of the Group’s and the individual business areas’
sales and results. The Supervisory Board conducted
in-depth discussions on financials as well as other
pertinent key figures, including the Group’s indeb-
tedness, with the Executive Board and addressed
deviations from the budget, along with the main
reasons for them. Such debates also included
scrutiny of the risk management system, which is
tailored to detect risks existing throughout the
Group early on and take precautionary measures,
as well as programs in place to reduce costs. During
its December meeting, the Supervisory Board also
dealt in detail with the company’s budget for 2003
and with the forecast for subsequent years. The
Supervisory Board kept itself regularly informed of
the Group companies’ operations. Developments in
electricity prices, the impact of laws on renew-
ables-based energies, CHP subsidies, and the elec-
tricity tax were all discussed with the Executive
Board, as were issues related to grid fees. In this
context, the further decentralization of the sales
structure for our German electricity customer base
was discussed.
Changes in our portfolio of investments are first
on the list of the transactions to be handled by the
Executive Board that require Supervisory Board
approval. Of most notable mention in this context
is the public takeover bid launched by the Elec-
tricity Business Area for all of the shares in Innogy
Holdings plc. The Supervisory Board dealt with this
issue in detail in its March session and approved
the bid. It obtained a clear picture of the offer’s
conditions, strategic implications and return
targets. As regards our electricity operations, the
Supervisory Board also endorsed the acquisitions
of stakes in GEW RheinEnergie Aktiengesellschaft,
the Slovak-based regional utility Vychodoslovenská
energetika, a.s. (VSE), Polish-based STOEN S.A. and
Wuppertaler Stadtwerke Aktiengesellschaft, as well
as the issuance of option rights in connection with
the merger between Envia Energie Sachsen Bran-
denburg Aktiengesellschaft and Mitteldeutsche
Energieversorgung Aktiengesellschaft.
RWE_GB_EN_01-16_Neu.qxd 14.03.2003 17:54 Uhr Seite 9

As regards the Gas Business Area, the Supervisory
Board was constantly kept abreast of developments
surrounding the bidding process for the privati-
zation of the Czech gas industry, as well as of
measures considered for integrating the companies
into the Group on conclusion of the agreement
once the deal had closed. The Supervisory Board
had already consented to the submission of the
offer in December 2001.
The Executive Board kept the Supervisory Board
constantly up-to-date on the status of the approval
procedures regarding the acquisition of American
Water Works Company Inc. In addition, the Super-
visory Board approved the acquisition of shares
in Proyectos e Instalaciones de Desalación S.A.
(PRIDESA) and Empresa de Servicios Sanitarios de
Los Lagos S.A. (Ondagua), both of which are
Spanish companies. The same applies to the
acquisition of the remaining 50% shareholding in
Trienekens Aktiengesellschaft in the Environmental
Services Business Area. The restructuring program
that goes hand-in-hand with the purchase was the
topic of intense deliberation between the Super-
visory Board and the Executive Board.
As far as RWE’s non-core business is concerned,
the Supervisory Board gave the go-ahead for the
early exit from the Shell & Dea Oil GmbH down-
stream oil joint venture as well as the associated
sale of the 50% stake in that company to Shell.
Furthermore, the Supervisory Board approved the
sale of HOCHTIEF’s equity interest in Monachia
Grundstücks-Aktiengesellschaft.
Financing requirements have risen steadily, owing
to the acquisitions made in the last few fiscal years.
It is against this backdrop that the Supervisory
Board approved the issuance of bonds under a debt
issuance program and short-term funding through
a global commercial paper program. Moreover, the
Supervisory Board kept itself abreast of the details
of the company’s credit rating.
Committees
The Supervisory Board formed four committees.
Their members are listed in the chapter on
“Boards.”*The Executive Committee convened
three times in the 2002 financial year. It engaged
in preparatory deliberations on the financial state-
ments for the 2001 fiscal year, the consolidated
financial statements for the 2001 truncated fiscal
year from July 1 to December 31, 2001, the cor-
porate budget for the 2003 financial year, and on
the forecast for subsequent years. In every meet-
ing, the Supervisory Board kept itself informed
about key financials and dealt with specific topics
related to the Group’s strategic orientation. Such
issues included the further development of acqui-
sition processes as well as the financing concept.
Another focal point of debate were precautionary
measures necessary in the area of corporate gover-
nance at RWE.
The Human Resources Committee held three
sessions in the 2002 financial year. There was no
need for the Mediation Committee to convene. The
newly established Audit Committee took up work
before the end of fiscal 2002, discussing organiza-
tional issues as well as determining special topics
to be addressed in meetings scheduled for 2003.
Financial statements for the parent company
and the Group
The Executive Board prepared the financial state-
ments of RWE AG and the Group for fiscal 2002,
as well as the combined review of operations for
RWE Aktiengesellschaft and the Group. Since the
consolidated financial statements were prepared
in compliance with International Accounting
Standards, RWE is exempted from preparing
consolidated financial statements in compliance
with German law. These documents—as well as the
accounts—were scrutinized by PwC Deutsche
Revision Aktiengesellschaft Wirtschaftsprüfungs-
gesellschaft, and were issued an unqualified
auditor’s opinion. The auditors were appointed by
the AGM on June 6, 2002, and commissioned by
the Supervisory Board to audit the financial state-
ments of RWE AG and the Group. The auditor’s
audit reports, documents supporting the annual
financial statements, and the annual report were
10
Supervisory Board Report
160
RWE_GB_EN_01-16_Neu.qxd 14.03.2003 17:54 Uhr Seite 10

11
submitted to all the members of the Supervisory
Board in good time before its balance sheet mee-
ting. The submissions were the subject of in-depth
deliberations in the Supervisory Board’s plenary
session, which took the supplementary oral report
presented by the Executive Board into conside-
ration. The auditors, who signed the audit report,
attended the meeting, presented the material
findings of their audit, and were available to
answer questions.
The Audit Committee had scrutinized these docu-
ments exhaustively prior to this meeting and
recommended that the Supervisory Board approve
the financial statements of RWE AG and the Group
as well as the combined review of operations. It
also suggested that the Supervisory Board put PwC
Deutsche Revision Aktiengesellschaft Wirtschaft-
prüfungsgesellschaft up for election as auditors at
the AGM.
The Supervisory Board has reviewed the financial
statements of RWE AG and the Group, the com-
bined review of operations for RWE Aktiengesell-
schaft and the Group, and the proposed appro-
priation of distributable profit. No objections were
raised as a result of this review. The Supervisory
Board approved the results of the auditor’s audit of
both financial statements and thus endorsed the
financial statements of RWE AG and the Group for
the period ended December 31, 2002. The finan-
cial statements for the fiscal year being reviewed
are thus adopted. The Supervisory Board concurs
with the appropriation of profits proposed by the
Executive Board, which envisions a dividend payout
of ¤ 1.00 and a bonus of ¤ 0.10 for each share that
carries dividend entitlements.
Changes in the Supervisory and Executive Boards
The compositions of the Supervisory and Executive
boards did not change in the 2002 financial year.
Supervisory Board Report
Dr. Dietmar Kuhnt retired from his position as
President and Chief Executive Officer of RWE
Aktiengesellschaft at the end of the day on Febru-
ary 28, 2003. Over the last few years, Dr. Kuhnt
steered the company through far-reaching change
processes caused by the deregulation of the
energy market. With a strategy combining focus on
core businesses and acquisitions in these fields of
activity, he charted a clear course for the enter-
prise to follow into the future. The Supervisory
Board has expressed its special gratitude for the
outstanding services that Dr. Kuhnt has rendered
to the RWE Group. It will propose that the May 15,
2003 AGM elect him as shareholder representative
to the Supervisory Board. Dr. Titzrath resigned his
seat effective on conclusion of this Annual General
Meeting. In its extraordinary meeting in May of
2002, the Supervisory Board appointed Mr. Harry
Roels to the Executive Board of RWE Aktiengesell-
schaft as of February 1, 2003 and nominated him
Chairman of the Board.
Dr. Richard R. Klein and Manfred Remmel will
vacate their seats on the Executive Board of RWE
Aktiengesellschaft at the end of the day on March
13, 2003. The Supervisory Board extends its
appreciation to both gentlemen for their successful
performance for the benefit of the company.
The Supervisory Board thanks the RWE Group’s
entire staff and the members of the Executive
Board for their work in the past fiscal year. With
this kind of commitment, we will be able to shape
the future successfully.
Essen, March 13, 2003
The Supervisory Board
Dr. h.c. Friedel Neuber
– Chairman –
RWE_GB_EN_01-16_Neu.qxd 14.03.2003 17:54 Uhr Seite 11

Legal requirements form the basis
What corporate governance entails is simple: reli-
able and efficient management and monitoring of
listed stock corporations. First and foremost, as a
system of company management and monitoring,
RWE AG’s corporate governance must comply with
legal requirements. Here, the division of tasks
between the executive and supervisory boards
according to the German Stock Corporation Act is
of fundamental importance. The Executive Board
runs the company, assuming responsibility for the
company’s management, while monitoring and
consulting are handled by the Supervisory Board
(dual system). Information on the members of the
Executive and Supervisory Boards, including their
memberships in other legally mandated super-
visory boards as well as comparable domestic and
foreign supervisory bodies, along with the compo-
sitions of Supervisory Board committees is presen-
ted in the chapter on “Additional Information.”*The Annual General Meeting, which enables
shareholders to exercise their rights, is another
legally mandated body.
German Corporate Governance Code imposes
additional standards
In 2002, a commission entrusted by Germany’s
federal government presented the German Corpo-
rate Governance Code. It aims to make use of
recognized standards for the management and
monitoring of companies to foster international
trust in the German financial market. In so doing,
the Code largely fell back on statutory requirements
that had already been binding upon RWE AG prior
to the Code. Furthermore, the recommendations
are more stringent than the legal standards, thus
constituting the core of the Code. Their definition
is derived from the legal basis found in Sec. 161 of
the German Stock Corporation Act. According to
this legal foundation, the management and super-
visory boards of listed stock corporations are
obliged to declare every year whether they have
complied with the recommendations issued by the
federal government’s commission. They must
report on all recommendations detailing compli-
ance or non-compliance both in the past and at
present. Deviations from the recommendations
must be disclosed pursuant to Sec. 161 of the Ger-
man Stock Corporation Act and explained in accor-
dance with Item 3.10, Sentence 2 of the Code. In
addition, the Code makes suggestions, which go
above and beyond legal requirements. However,
they differ from the recommendations in that com-
panies are not obliged to make statements on them.
12
Corporate Governance
This is the first time we have dedicated a chapter of our annual report toRWE’s corporate governance. Our intention is to inform our readers on howRWE is implementing the recommendations of the German CorporateGovernance Code (Item 3.10 of the Code). RWE has been meeting highcorporate governance standards for quite a long time already and isrenowned for the high degree of transparency in its reporting. Therefore,necessary adjustments were easily manageable. In December 2002 andMarch 2003, we issued declarations of compliance including what we believewill be a temporary exception.
Corporate governance
162
RWE_GB_EN_01-16_Neu.qxd 14.03.2003 17:54 Uhr Seite 12

13
Corporate Governance
German Corporate Governance Code contains
practical, well-balanced suggestions
The Code itself has always been the basis for the
adjustments to our corporate governance standards
touched upon previously. It describes internatio-
nally recognized standards of good, responsible
company management, which we hold to be well-
balanced and practical. It is for this reason that the
Executive and Supervisory Boards support the Code
and will continue to support it in the long term.
Accordingly, we made a conscious decision against
establishing our own, company-specific basic
principles.
Code requires little action since RWE standards
are already high
RWE had been adhering to high corporate gover-
nance standards that exceed legal requirements
and putting them into practice long before the
Code entered into force. We are of the opinion that
responsible and transparent company management
and monitoring can provide a sustainable increase
in the value of an enterprise. We reviewed our cor-
porate governance guidelines based on the Code
and decided on how best to consider new issues
and improvements as well as put our resulting
findings into practice. In 2002, we took nearly all
the measures required to adjust our policy in cases
where RWE had deviated from the recommen-
dations made by the Code. All in all, there was no
great need for action.
Executive Board bylaws regulate cooperation
Compliance with the Code only led to a few
amendments to the bylaws to which RWE AG’s
Executive Board has subjected itself. The bylaws
have long determined the manner in which
Executive Board members cooperate with one
another. Duties are performed in accordance with
an assignment of responsibilities. Decisions on
transactions classified as being material in RWE’s
Articles of Association are submitted by the
Executive Board to the Supervisory Board for
approval. No Executive Board committees were
formed.
RWE_GB_EN_01-16_Neu.qxd 14.03.2003 17:54 Uhr Seite 13

Supervisory Board bylaws consider major
recommendations made by the Code
One of the steps needed to comply with the Code
was the introduction of bylaws for the Supervisory
Board. In addition to procedural rules that had
already been valid and in practice prior to the
Code entering into force, the bylaws feature a
number of novel aspects that ensure not only that
the Code’s recommendations are followed, but also
that this adherence is documented. This holds true
for the mandatory disclosure of trades in shares as
well as in other securities issued by RWE AG
(directors’ dealings). Since then, security trans-
actions reported by company officers that fall
under this category have been published in line
with the corresponding disclosure duty and have
been made accessible on RWE’s web site. RWE’s
officers did not own any stock subject to disclosure
in the notes to the parent company’s financial
statements pursuant to Item 6.6 of the Code. The
bylaws also include provisions that govern possible
conflicts of interest. Neither the members of the
Executive Board, nor those of the Supervisory
Board had such conflicts of interest in the financial
year that just ended.
Also included in the bylaws is the age limit for
membership on the Supervisory Board defined by
the Code, which is 72 years. Furthermore, it spells
out the Executive Board’s reporting duties in even
more detail.
Supervisory Board committees with enlarged role
In accordance with the German Co-Determination
Act of May 4, 1976, ten of the 20 members of our
Supervisory Board are elected by the shareholders,
with the employees electing the other ten. The
Supervisory Board formed four committees. The
Audit Committee was newly established, taking up
activity in 2002 for the first time. Some of the
other committees were entrusted with additional
tasks in the year being reviewed.
jComprising eight members, the Executive
Committee is the largest body to have been set
up by the Supervisory Board. It is responsible
for providing advice on key issues and preparing
resolutions submitted to the Supervisory Board
for consideration. Moreover, in certain cases,
and above all in matters of urgency, it is
authorized to pass resolutions in place of the
Supervisory Board. The Executive Committee
also concerns itself with the corporate budget.
jThe Human Resources Committee consists of five
members. It prepares succession plans for the
Executive Board as well as personnel-related
decisions to be taken by the Supervisory Board
and issues approval on additional duties fulfilled
by Executive Board members, especially as
regards their exercising supervisory board
mandates. In addition, the Human Resources
Committee handles conflicts of interest and
issues approvals for contracts between Super
visory Board members and the company. There
were no such agreements in the year under
review. Major transactions concluded between a
member of the Executive Board, or a person or
enterprise with which an Executive Board mem-
ber is closely affiliated on the one hand, and the
parent company or one of its subsidiaries on the
other, are also subject to approval by the Human
Resources Committee. No transactions of this
nature were completed in the reporting period,
either.
14
Corporate Governance
RWE_GB_EN_01-16_Neu.qxd 14.03.2003 17:54 Uhr Seite 14
15
Corporate Governance
jMade up of six members, the Audit Committee’s
main tasks involve addressing issues pertaining
to the areas of accounting policies and risk
management (including the internal control and
risk management system) as well as preparing
Supervisory Board resolutions regarding the
annual financial statements and agreements
made with the auditors. The Audit Committee
also deliberates on material events occurring at
companies with which RWE AG has an affiliation
as well as on the inclusion of new and the
relinquishing of existing fields of business in
which RWE AG is directly active. By establishing
the Audit Committee, we have followed one of
the Code’s most significant recommendations.
Additionally, we will take up two further sug-
gestions made by the Code: In the future,
chairmanship of this committee will not be exer-
cised by the Chairman of the Supervisory Board
or a former member of the Executive Board.
jRWE also formed a committee pursuant to
Sec. 27, Para. 3 of the German Co-Determination
Act. The committee comprises four members
and mediates in situations where the majority
vote required to pass a resolution on the
appointment of a member to the Executive
Board cannot be obtained.
With the exception of the Human Resources
Committee, all of the Supervisory Board’s moni-
toring bodies are staffed with an equal number of
shareholder and employee representatives. The
Human Resources Committee consists of three
shareholder-elected and two employee-nominated
members.
Board member compensation
Members of the Executive Board have compensa-
tion packages with fixed and variable components.
Executive Board members are awarded stock
appreciation rights (SARs) based on RWE AG’s Long
Term Incentive Plan (LTIP). The LTIP replaces the
company’s old stock option plan for executives. A
breakdown of the remuneration package into its
individual components is displayed in the Notes to
the Consolidated Financial Statements.
The Supervisory Board members’ compensation
package also includes a fixed and a variable com-
ponent. The old fixed remuneration component
amounted to ¤ 5,000. It increased by ¤450 for
every ¤ 0.01 by which the aggregate distributable
dividend exceeded ¤ 0.10 per common share. Since
the Supervisory Board’s range of activites was
expanded as described above, going forward, it is
justified that a committee chairman receive twice
the rate of pay set forth for committee members in
the Articles of Association, and that Supervisory
Board members, who sit on a committee, receive
one-and-a-half times this amount. Furthermore, the
remuneration of the members of the Supervisory
Board is scheduled for an adjustment, whereby the
fixed component is to be increased. A correspon-
ding proposal will be submitted to the Annual
General Meeting on May 15, 2003.
Once this AGM resolution has been adopted, we
will follow the Code’s recommendation regarding
the compensation of chairmen and members of
Supervisory Board committees as well.
RWE_GB_EN_01-16_Neu.qxd 14.03.2003 17:54 Uhr Seite 15
Use of electronic media—a major contribution
to enhanced transparency
We will maintain the high level of transparency we
have become known for on the capital market. Our
shareholders, financial analysts, shareholder asso-
ciations, the media and the public at large will be
kept abreast of developments via reports and
bulletins on specific events on a regular basis.
Reports will regularly be provided in both German
and English. This is another area in which the
Internet has increasingly established itself as a
channel for the rapid and timely dissemination of
information. Therefore, we enlarged our Web offe-
ring significantly over the last few years. Besides
the aforementioned AGM services, our home page
also provides links to all the latest reports and
news bulletins. In addition, we provide live Inter-
net broadcasts of our analyst conferences, which
we archive as online recordings for later viewing as
well. We thus offer a wide range of information.
RWE Annual General Meeting benefits from
comprehensive Internet offering
The Annual General Meeting serves as a forum for
shareholders. It is convened once a year during
the first six months of the fiscal year as an Ordinary
AGM at which the Executive and Supervisory
Boards account for the preceding financial year as
well as the company’s current developments. The
Annual General Meeting regularly passes resolu-
tions on the appropriation of distri-butable profit,
the approval of the acts of the Executive and Super-
visory Boards, and the appointment of the auditors.
It is also entitled by law to make a number of
other decisions. Shareholders exercise their rights
at the AGM, which primarily consist of their right
to be heard and ask questions, as well as their right
to vote if they hold common shares.
RWE AG makes it easier for its shareholders to
exercise their rights at the AGM by implementing
several measures. For example, shareholders, who
are unable to attend the AGM in person, may com-
mission a proxy, who is obliged to follow the
shareholder’s instructions in voting procedures.
Most noteworthy is the extensive use made of the
Internet in a manner suggested and promoted by
the Code. RWE AG provided a Web broadcast of
the entire June 6, 2002 Annual General Meeting.
Furthermore, we afforded our shareholders the
opportunity to delegate authority and issue in-
structions to their proxies over the Internet for the
first time in 2002. To facilitate such processes even
more, for the first time, RWE will also allow this to
be done in writing for the May 15, 2003 AGM. RWE
has thus assumed a pioneering role among large
German companies with bearer shares.
16
Corporate Governance
RWE_GB_EN_01-16_Neu.qxd 14.03.2003 17:54 Uhr Seite 16
17
Economic Advisory Board
An Economic Advisory Board has been set up to
advise the company on issues of special import.
This committee serves as a platform for expe-
rienced people to share their expertise in other
branches of industry, science, research and the
international arena with us. The competencies of
the Executive Board, Supervisory Board and the
Annual General Meeting remain unaffected by the
Economic Advisory Board’s work.
Codex also implemented in all listed Group
companies
All of the Group companies obligated to issue a
declaration of compliance according to Sec. 161 of
the German Stock Corporation Act met this require-
ment in 2002. Some of their statements of compli-
ance make reference to the peculiarities of their
affiliation with the Group as well as the size of the
enterprises affected.
Declaration of compliance for 2003 still contains
just one exception
On December 16, 2002, the Executive and Super-
visory Boards issued its first statement of com-
pliance, including the aforementioned exception
pursuant to Sec. 161 of the German Stock Corpor-
ation Act and Sec. 15 of the Introductory Law to
the German Stock Corporation Act.
Corporate Governance
Since then, there have not been any new develop-
ments which would have caused the declaration of
conformity to be limited. Having dutifully reviewed
the recommendations of the “German Corporate
Governance Code Government Commission,” the
Executive and Supervisory Boards therefore make
the following statement for 2003, which is per-
manently available to the shareholders* on RWE’s
website.
“RWE Aktiengesellschaft complies with the
recommendations of the “Government Commission
German Corporate Governance Code” announced
by the Federal Ministry of Justice in the Official
Part of the electronic Federal Gazette on November
26, 2002, with the exception that the chairman-
ship and membership in committees of the Super-
visory Board will not be generally remunerated
separately (Para. 5.4. 5, 1st Subpara., Sentence 3
of the Code). The Executive and Supervisory Board
will recommend to the Annual General Meeting
on May 15, 2003, to add a corresponding compen-
sation system to section 12, subsection 3, of the
Articles of Incorporation of RWE Aktiengesell-
schaft”. RWE Aktiengesellschaft has complied with
these recommendations analogously since the last
statement of compliance on December 16, 2002.”
Essen, March 13, 2003
RWE Aktiengesellschaft
On behalf of the Supervisory Board
Dr. Neuber
On behalf of the Executive Board
Roels Zilius
01
+7
05:00
45 +6
06:00
15 45 +5
07:00
15 45 +4
08:00
15 45 +3
09:00
15 45 +2
10:00
15 45 +1
11:00
15 45 0
12:00
15 45 -1
13:00
15 45 -2
14:00
15 45 -3
15:00
15 45
Edinburgh
London BerlinEssen
Budapest
Zagreb
Izmit
Cairo
Lisbon
San Juan
Rancagua
Talca
Concepción
Houston
ElizabethtownPittsburgh
Bilbao
Madrid
Oslo
Swindon
Klagenfurt
Prague
Warsaw
Kosice
Voorhees
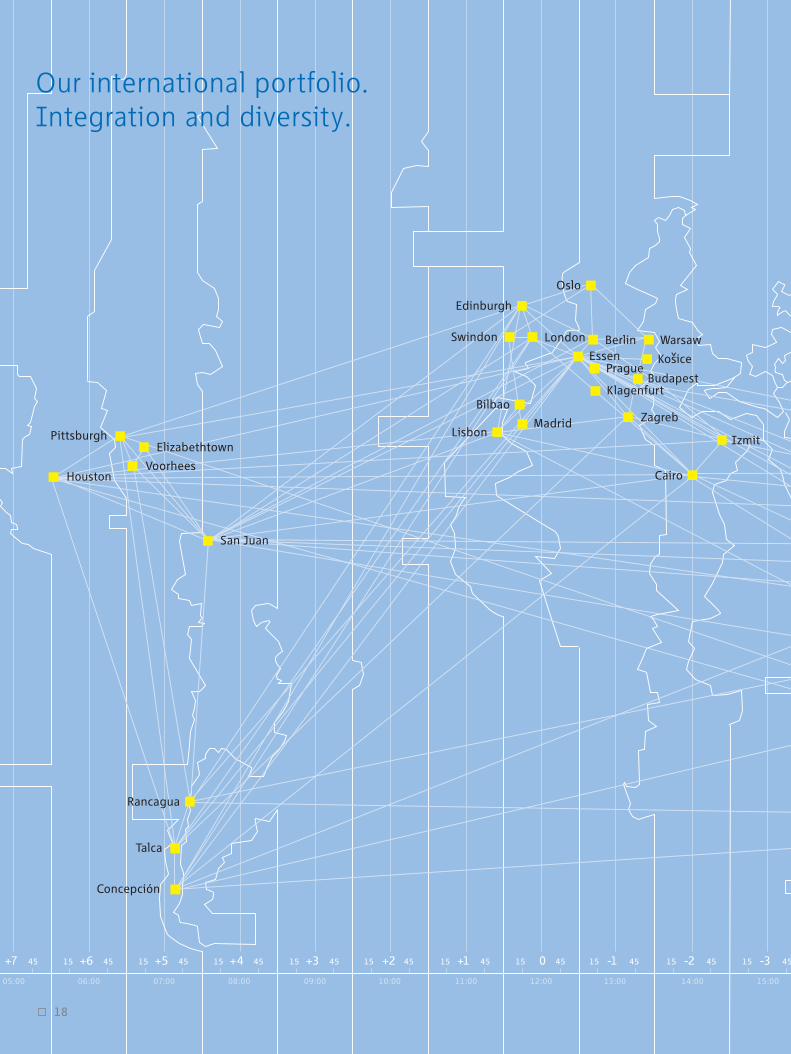
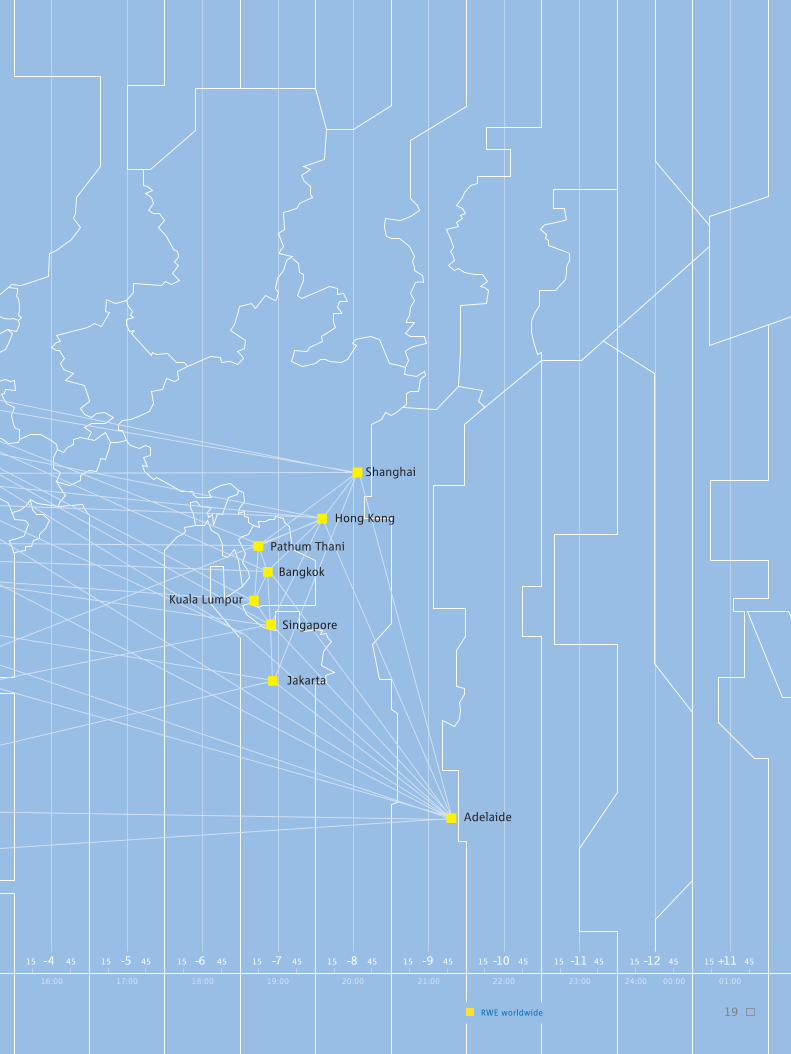
18
Our international portfolio.Integration and diversity.
-4
16:00
15 45 -5
17:00
15 45 -6
18:00
15 45 -7
19:00
15 45 -8
20:00
15 45 -9
21:00
15 45 -10
22:00
15 45 -11
23:00
15 45 -12
24:00
+11
01:00
15 45
00:00
15 45
Shanghai
Hong Kong
Bangkok
Singapore
Kuala Lumpur
Pathum Thani
Jakarta
Adelaide
RWE worldwide 19
Good preparatory work and existing know-how
enable fast results
Acquiring a big company is an incisive strategic
decision that affects an organization’s success as
a whole. Therefore, integration processes are
about more than adapting different bookkeeping
procedures and harmonizing IT systems. Our first
and foremost intermediate goal consists of inter-
meshing the functions and personnel of operating
units as quickly as possible as well as marrying the
various corporate cultures. In so doing, as far as
our strategy, organization and employees are
concerned, meeting the following preconditions is
paramount:
jA clear concept
jRapid decisions on matters of principle
jExtensive communication
jExact time tables
jHigh degree of transparency
jEnough leeway for pragmatic solutions and new
ideas
Moreover, we amassed valuable experience with
the successful integration of VEW and Thames
Water. Thanks in part to our intense preparations
and existing expertise, we were able to initiate the
current integration processes without having to go
through a “warm-up” phase. Most of our three new
companies’ integration teams were ready to go
20
The post-merger phasehas begun. Now thetask at hand is tounleash synergisticpotential and turnvolume growth intosustainable valuegrowth. Every acqui-sition made by RWEmust cover its capitalcosts within a reason-able timeframe.
Integration tops list of priorities
Identifying suitable takeover candidates, conduc-
ting purchase negotiations and closing deals is
just one side of the external growth business.
The integration process is the other. It is above all
the post-merger phase that decides whether such
transactions will be successful over the long term.
The task at hand is to realize synergistic potential
and derive sustainable value growth from volume
growth. This is why integration tops the list of
priorities at RWE. Transgas along with our stakes
in the eight Czech regional utilities, Innogy as our
operating management company for the new
“UK Energy” Division, and US-based water utility
American Water—each one of these acquisitions
must overcome an ambitious hurdle: Their return
on capital employed (ROCE)* must exceed their
capital costs within a reasonable period of time
including the return on the entire goodwill.
Special Feature: Integration
Harnessing power
In just nine months—from May 2002 to January 2003—we made three large-scale acquisitions to turn RWE into an international multi-utilitycompany. Fiscal 2003 will see our core businesses generate about half oftheir operating result in regions outside Germany. Now, integrating ouryoung companies in the UK, the Czech Republic and the USA is one of thekey tasks ahead of us as we strive to secure a successful future for ourorganization. Harnessing our power optimally is the prerequisite for the rapidcreation of added value.
40
before the last approval procedures had been com-
pleted. These teams are generally staffed with exe-
cutives from both sides of the table. They submit
regular reports on their sub-projects to the parent
company’s Executive Board.
Czech gas industry: new structures set the tone
early on
Thanks to the acquisition of nearly the entire Czech
gas industry, our gas operations—one of our core
businesses—finally advanced from being a gas
utility primarily active in Germany to join the
European “gas league.” The acquisition closed on
May 16, 2002, and the Czech operations were
consolidated early for the first time, as of May 1,
2002. We had started to make preparations for the
integration by engaging in an exchange with the
Czech management, insofar as the legal framework
allowed for this. As a consequence, we were able
to make the most important adjustments to our
organizational and management structures only a
few days after the deal closed.
Our Czech gas enterprises have been integrated
into the Group under the umbrella of RWE Gas.
This also involved an executive vice president from
RWE Gas assuming chairmanship of the Executive
Board of Transgas, the Czech gas importer and
pipeline company. We retained the services of the
former chairwoman, which enables us to continue
benefitting from her knowledge of the market and
her know-how in her new capacity as Deputy
Chairwoman of Transgas. We believe that coope-
rating closely with domestic executives is the right
strategy for six of the eight Czech regional utilities
in which we hold majority stakes. We filled the
positions of chief executive with RWE executives,
but operations are being run collaboratively, in
teams including our experienced Czech colleagues.
The management boards of Transgas and the
regional utilities in which RWE holds majority
interests launched an in-depth integration program
as early as the summer of 2002. Administrative
integration, including such issues as the synchro-
nization of reporting systems, had been largely
completed by October 2002. The program’s key
points are:
jPlans exist to implement measures to optimize
domestic gas transportation and distribution for
the Czech regional utilities. Furthermore, these
companies are working in concert with a view to
stepping up their sales activities as well as
improving the efficiency of business processes
and administrative functions.
jFurthermore, the comprehensive management of
RWE Gas’ and Transgas’ pipeline business as well
as the coordination of gas purchasing, trading
and transit agreements entered into by all RWE
Gas Group companies give rise to potential for
improvement.
jOther major activities involve the implemen-
tation of largely uniform IT platforms as well as
the introduction of a more centralized material
procurement system.
We expect to tap € 100 million in annual synergies
from 2007 onwards. We anticipate realizing half of
this target figure even earlier—by the end of fiscal
2005. Our overall goal is to generate ROCE excee-
ding the cost of capital by 2006 at the latest.
Innogy becomes its own operating management
company
Our recommended offer for Innogy, one of Great
Britain’s three leading electric and gas utilities,
took effect on May 27, 2002. The company has
been consolidated in the Group’s accounts since
June 1, 2002.
Once again, decisive fundamental decisions regar-
ding the company’s integration into the Group had
been made early on. Innogy plays the role of ope-
rating management company for the Electricity
Business Area’s new “UK Energy” Division. It was
important to us that Innogy’s established, success-
ful management team remain on board. It has a
very good reputation on the UK energy market.
The management team was rounded off with the
addition of a “chief integration officer,” who is
responsible for the integration process at the
board level. Since it was our intention to intermesh
RWE’s and Innogy’s trading activities from the
start, it was an obvious proposition to appoint one
21
Special Feature: Integration
We have integrated ourCzech gas companiesinto the RWE Groupunder the umbrella ofRWE Gas.
Defined objectives: We expect to realize€ 100 million in annualsynergies from 2007onwards. ROCE is setto exceed capital costsby 2006.
Innogy acts as opera-ting management com-pany for the ElectricityBusiness Area’s new“UK Energy” Division.The experiencedmanagement team stayed on board.

22
Special Feature: Integration
of RWE Trading’s experienced executives to the
Executive Board of Innogy. By the same token,
Innogy’s head of trading assumed additional
managerial responsibilities at RWE Trading.
Besides the benefits to be gained from the combi-
nation of our trading operations in the UK in the
short term, the largest potential is harbored by the
cooperation between Innogy and our UK-based
water utility, Thames Water. Integration teams are
currently working on two projects that are to lead
to almost three-quarters of the total amount of
synergies arising from this transaction.
Firstly, the two operating management companies
are grouping their internal services and administra-
tive functions, e.g. in the fields of IT and purcha-
sing, and placing them in a newly established
“shared service center,” which took up activity as
early as the beginning of 2003.
The second project addresses collaboration in the
area of customer services between Innogy and
Thames Water, e.g. by merging their call and
billing centers. To this end, the integration teams
are working hard to harmonize IT systems. Other
measures taken within the context of the project
aim to tap synergies in sales: Thames Water custo-
mers will be informed of Innogy’s products and
services. Customers who procure both water and
energy from these two RWE companies will be
given a rebate on their energy bill. The benefit for
our two British companies is obvious: sales volu-
mes rise faster than costs per customer. This
enriches the relationship to the customer.
Our systematic integration work will pay off at
Innogy as well. Totaling some € 80 million a year,
synergies are significantly higher than anticipated.
This figure does not yet include the improvements
that may be achieved by sharing best practice*with our German power plant and sales specialists
over the long term.
We intend to realize about half of these synergies
as early as the coming financial year. According to
our forecasts, we should be able to achieve the full
amount of planned savings from 2006 onwards. In
addition, as we integrate Innogy, we benefit from
the integration experience our British energy utility
already has in the field of integration. Innogy
fortified its electricity sales operations by acqui-
ring the Yorkshire Power Group’s and Northern
Electric’s end-customer businesses in 2001. In the
meantime, major inroads have been made in con-
solidating their activities. Roughly 80% of the
more than € 100 million in planned synergies have
already been realized.
Although Innogy has been a part of the RWE
Group for a short time, as we had expected, its ver-
tically integrated business strategy has proven to
be exceptionally advantageous. Thanks to its
balanced ratio of power generated to electricity
sales volumes, Innogy’s business remained rela-
tively unaffected by the considerable decline in
prices on the British wholesale market. We are thus
optimistic about being able to achieve the overall
goal we have envisioned as regards Innogy’s
integration: ensure that ROCE at least matches
capital costs from 2005 onwards.
The largest synergypotential lies in thetrading business aswell as in the coope-ration between Innogyand Thames Water.These two companiesare bundling theirinternal services andwill collaborate in thefield of customerservices.
The goal for Innogy’sintegration is to haveROCE at least matchcapital costs from 2005onwards.
166
23
Special Feature: Integration
American Water rounds off the series
of large-scale acquisitions
On January 10, 2003, we completed the acquisi-
tion of American Water, the largest water utility in
the regulated US water business, which has been
renamed “American Water.” We had to go through
a long, drawn-out process from the signing of the
purchase agreement in September of 2001 to the
completion of the deal, since the US Federal Trade
Commission (FTC) was not the only supervisory
authority from which we had to obtain approval.
In fact, the regulatory authorities in 13 of the 27
US states in which American Water is active requi-
red us to go through comprehensive approval pro-
cedures. However, all in all, the procedures were
completed several months earlier than expected.
We will consolidate American Water in the Group’s
accounts as of January 1, 2003.
As a result, we were again able to implement plans
developed earlier on as we commenced integration
work. We rapidly agreed on a new management
structure here as well: American Water is now part
of our Water Business Area which is managed by
Thames Water. Furthermore, Thames Water’s chief
executive has been placed at the helm of the US
water utility. The company will spearhead RWE’s
entire water business in North and South America.
This constellation also gives rise to synergistic
potential, albeit of smaller scope: Thames Water’s
US activities will be pooled with those of American
Water. One advantage in this context is that
Thames Water’s existing regulated US water opera-
tions were located in the immediate vicinity of an
American Water subsidiary in the state of New
Jersey. Moreover, we believe that American Water
stands to benefit considerably from the extensive
international expertise of Thames Water as well as
from the UK enterprise’s specialized know-how.
Thanks to its constant improvements in efficiency
in the UK, the world’s most strictly regulated water
market, Thames Water is renowned for its high
level of technology and services. In addition,
whereas American Water already supplies drinking
water to 15 million people, the company only pro-
vides wastewater services to one million. We
intend to grow American Water’s wastewater
business significantly by capitalizing on Thames
Water’s experience.
Don’t waste time in the beginning, don’t let up
later on
With the addition of Transgas and the Czech
regional utilities to our business portfolio, we have
tapped an attractive growth market in the gas
business. Innogy, the second-largest electric utility
and third-largest gas utility in the UK, gives us a
leading position on yet another key European
market. And through the completion of the
acquisition of American Water we have become the
No. 1 player in the regulated business in the USA,
the world’s largest water market.
We want to be just as energetic in bringing the
integration processes to an end as we were when
we initiated them, in order to be able to unleash
value-creating potential as quickly as possible.
Here, we intend to stay true to the motto:
“Don’t waste time in the beginning, don’t let up
later on.”
The DAX recorded itsbiggest fall in one yearsince its introduction.RWE’s shares wereunable to counter thistrend.
Record losses on the German stock market
The crisis on the world’s stock markets worsened
in 2002. Germany’s share index (DAX) recorded
especially high losses, falling 43.9% to 2,893
points, and putting in the weakest annual perfor-
mance since its introduction in 1988. It was also
the first time that Germany’s lead index closed the
trading year on a downward trend for the third
time in a row.
Three factors were principally responsible for
driving the bear market. For one, the initial hopes
of economic recovery were dashed. In fact, world
economic growth continued to stall over the course
of the year, with consequences for corporate pro-
fits. Furthermore, investor trust in stock markets
was rattled by a series of accounting scandals in
the USA. In addition, increasing fear of a war with
Iraq dampened the general mood on the stock
markets, causing a number of investors to redistri-
bute their funds, primarily channeling them into
fixed-interest securities.
Utility issues caught in stock markets’
downward spiral too
Last year, the most significant losses were posted
by technology and financial stocks. Utility shares
were caught in the stock markets’ downward spiral
although they are classified as being crisis-proof.
At the end of 2002, RWE’s common share was
listed at € 24.70, closing 41.5% down on its pre-
vious year-end quotation. Including the dividend,
this corresponds to a performance of -40%.
Preferred shares fared a little better, but declined
as well. They were down 33.6% to € 20.75,
equaling a performance*of -31.6% .
24
RWE Shares
Gloomy year on the stock market— RWE fares only slightly better than the DAX
Weakness in the global economy and the Iraq crisis sent the world’s stockmarkets skidding in 2002. Germany’s share index (DAX) was down 44%. RWE shares performed only marginally better. We see this as a challenge.Intensive communication and a high degree of transparency are in especiallyhigh demand when stock markets go through difficult periods.
167
25
RWE Shares
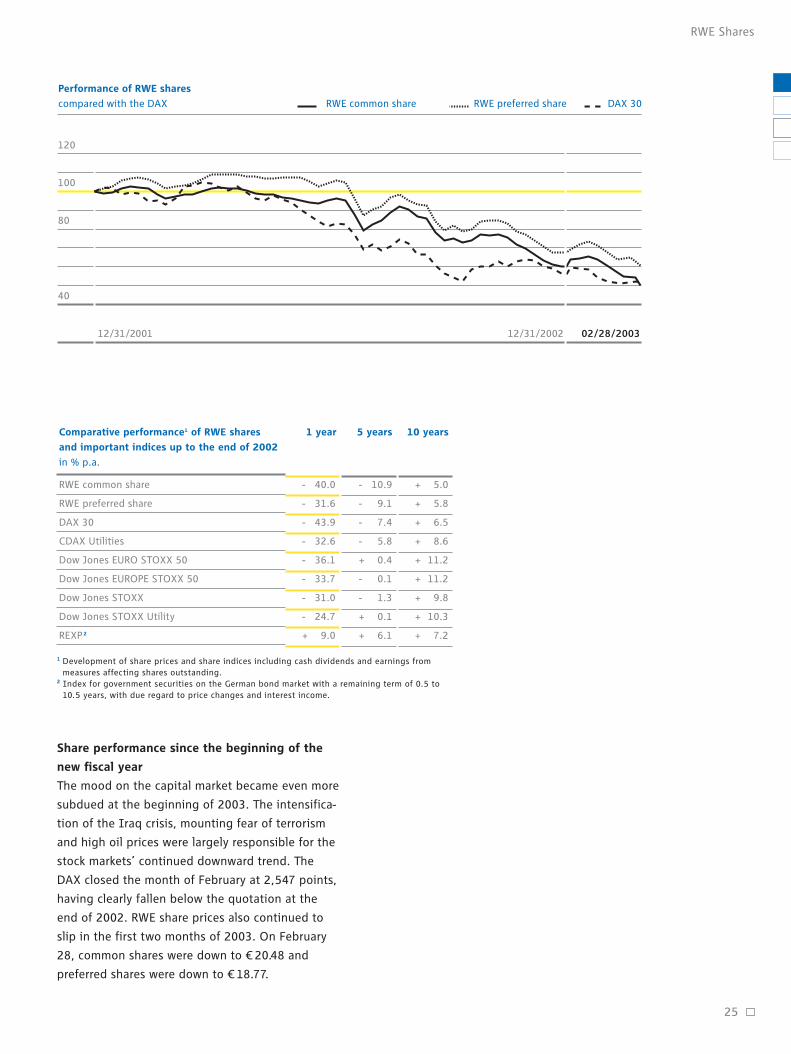
Performance of RWE shares
compared with the DAX
120
100
80
40
12/31/2001 12/31/2002 02/28/2003
RWE common share RWE preferred share DAX 30
RWE common share
RWE preferred share
DAX 30
CDAX Utilities
Dow Jones EURO STOXX 50
Dow Jones EUROPE STOXX 50
Dow Jones STOXX
Dow Jones STOXX Utility
REXP 2
- 10.9
- 9.1
- 7.4
- 5.8
+ 0.4
- 0.1
- 1.3
+ 0.1
+ 6.1
- 40.0
- 31.6
- 43.9
- 32.6
- 36.1
- 33.7
- 31.0
- 24.7
+ 9.0
+ 5.0
+ 5.8
+ 6.5
+ 8.6
+ 11.2
+ 11.2
+ 9.8
+ 10.3
+ 7.2
5 years 10 yearsComparative performance1 of RWE shares
and important indices up to the end of 2002
in % p.a.
1 year
1 Development of share prices and share indices including cash dividends and earnings from measures affecting shares outstanding.
2 Index for government securities on the German bond market with a remaining term of 0.5 to 10.5 years, with due regard to price changes and interest income.
Share performance since the beginning of the
new fiscal year
The mood on the capital market became even more
subdued at the beginning of 2003. The intensifica-
tion of the Iraq crisis, mounting fear of terrorism
and high oil prices were largely responsible for the
stock markets’ continued downward trend. The
DAX closed the month of February at 2,547 points,
having clearly fallen below the quotation at the
end of 2002. RWE share prices also continued to
slip in the first two months of 2003. On February
28, common shares were down to € 20.48 and
preferred shares were down to € 18.77.

Most recent setback in quotation depresses
long-term return on RWE shares
The dramatic collapse of the world’s stock markets
in the year under review has also had an impact on
the long-term return on RWE’s shares. Whereas
RWE’s common and preferred shares had put in an
average performance of +11.0% and +10.5% respec-
tively over the last ten years leading up to the end
of 2001, their performance had dropped to +5.0%
and +5.8% per annum respectively by the end of
2002. This performance is conditional upon divi-
dends and proceeds from subscription rights being
fully reinvested in RWE shares. If you invested
€ 10,000 in RWE in 1992, by the end of 2002, you
would have seen your investment grow to € 16,227
(common shares) or € 17,625 (preferred shares).
10% rise in dividend payout for 2002
RWE is still one of the DAX companies that pays
the highest dividends. The Executive and Super-
visory Boards will propose to the May 15, 2003
Annual General Meeting that the dividend payout
be raised for the 2002 financial year. According to
the proposal, the dividend is to remain unchanged
at € 1.00 with a bonus of € 0.10 per share. This
one-time bonus payment is to enable our share-
holders to partake of our exit from the refinery and
service-station business. Based on the closing
prices on February 28, 2003, this dividend disbur-
sement corresponds to a 5.4% return on common
shares and a 5.9% return on preferred shares.
Investor relations: more important than ever,
given the weak stock-market environment
Crisis situations experienced by US and UK power
utilities last year came as a surprise to the capital
market. This muddied the image that utility stocks
had as being defensive issues on the one hand,
and caused investors to be more critical of com-
panies with high debt levels on the other. As a
result, even utilities such as RWE came under pres-
sure in 2002. Our communication skills were put
even more to the test, due to the fact that
investors have become more sensitive to risks. The
task at hand was to allay unfounded fears and
explain that the RWE Group still has a solid finan-
cial position, despite the increase in outside
financing.
Further highlights of our communication work were
the successful acquisition of the Czech gas industry
and of the British electric and gas utility, Innogy.
The integration of newly acquired companies, their
earnings prospects, and synergistic potential were
the key topics of discussion at 3 analyst and
investor conferences as well as on about 30 road
shows in the financial centers of Europe, North
America and Asia. We were also required to furnish
huge amounts of information concerning the status
of the approval procedures for the acquisition of
the US-based water utility American Water Works.
26
RWE Shares
Investors have becomemore sensitive to risks,putting our communi-cation skills to the testeven more.

27
We provide our insti-tutional investors andprivate shareholdersthe same quality anddetail of up-to-dateinformation.
RWE Shares
per share2
Earnings
_excl. goodwill amortization
_incl. goodwill amortization
Operating cash flow
Dividend
Common shares
_Year-end
_High
_Low
Preferred shares
_Year-end
_High
_Low
Dividends
Payout ratio6
Number of shares at end of fiscal year
_Common shares
_Preferred shares
Weighted average number of shares outstanding
Market capitalization at end of fiscal year
2.62
2.24
5.98
1.00
35.20
46.55
30.50
28.40
34.70
24.95
523
43.2
523.3
473.0
50.3
541.5
18.1
2.90
2.24
6.76
1.005
46.98
51.70
35.00
35.30
38.10
28.50
5635
44.6
570.0
531.0
39.0
564.6
26.3
1.53
1.10
1.82
1.004
42.20
49.95
37.10
31.25
38.50
26.20
5624
45.27
570.0
531.0
39.0
562.4
23.6
3.25
1.87
10.55
1.103
24.70
43.80
24.12
20.75
34.49
20.01
6193
59.0
562.4
523.4
39.0
562.4
13.7
2.31
2.07
8.61
1.00
44.89
55.48
36.20
33.70
40.65
23.50
555
48.3
555.3
473,0
82.3
555.3
24.0
1999/
2000
1998/
1999
2001
TFY1
2002
€
€
€
€
€
€
€
€
€
€
€
€ million
%
million
million
million
million
€ billion
RWE share indicators 2000/
2001
1 Truncated fiscal year for the Group from July to December 2001.2 In relation to the weighted number of shares outstanding.3 Dividend proposed for RWE AG’s 2002 fiscal year, subject to the approval of the May 15, 2003 AGM.4 Dividend for RWE AG’s 2001 fiscal year (January to December).5 Dividend for RWE AG’s 2000 truncated fiscal year (July to December). 6 Payout in relation to the RWE Group’s net income.7 Payout in relation to double the RWE Group’s net income for the truncated fiscal year.
Capital markets honor RWE’s communication
with shareholders
In an investor relations survey conducted by the
German business magazine “Capital,” investors and
analysts throughout Europe placed RWE first in the
Dow Jones EURO STOXX as well as in the top 30
blue-chips represented in the DAX 30. A similar
poll carried out by Reuters had RWE in fourth place
among all European companies and first among
European utilities.
Web-based information offering further
improved
It is above all when stock markets are going
through troubled times that transparency and rapid
access to information are essential. Our goal is to
increasingly do justice to this demand. And the
Internet has become even more important in this
context. Key events such as our analyst confe-
rences have been broadcast live on the Web since
the beginning of 2002. Information is thus avai-
lable to the general public, investors and analysts
alike at the same time. Our Internet service*also
includes an overview of current analyst recommen-
dations pertaining to RWE and will feature a fact
book on the RWE Group in the future.
02

By the end of 2002, we had increased ourbond issuance volumeto finance our largeacquisitions in theCzech Republic and the UK.
Bond issuance now at €13.7 billion
In April 2002, we issued further bonds with a value
of € 6.5 billion in four tranches, after currency
translation. This capital was used to finance the
takeover of the Czech gas industry as well as our
acquisition of UK-based utility Innogy.
RWE AG (including RWE Finance B.V. under the
guarantee of RWE AG) had placed € 13.7 billion in
bonds (including private placements) by the end of
2002. RWE assumed an additional €4.7 billion in
capital market debt, previously issued by the com-
panies we acquired.
We intend to issue additional euro bonds to
finance the acquisition of American Water in the
current financial year. To this end the existing debt
issuance program will be increased from € 15 bil-
lion to € 20 billion. We already issued a private
placement of € 750 million with a term of 30 years
at the end of January 2003. The bonds were
exceptionally well received by the market and were
oversubscribed several times. This was the first
30-year issue by a utility in the euro capital market.
RWE establishes € 5 billion global credit line
Furthermore, we established an additional global
credit line of € 5 billion with an international
underwriting group in November 2002. The syn-
dicated credit facility consists of two € 2.5 billion
tranches with a term of 364 days and five years,
respectively. They are intended to serve as an
additional liquidity reserve and not to finance
further acquisitions. They thus strengthen our
financial profile.
RWE retains high rating despite ratings downg-
rade
Moody’s Investors Service and Standard & Poor’s,
the two leading rating agencies, downgraded their
ratings* for RWE in 2002 to A1 (negative outlook)
and A+ (stable outlook), as expected. This adjust-
ment reflects the increase in our net financial debt
that went hand-in-hand with our planned growth.
RWE’s ratings are still above average compared
with other European utilities.
28
RWE Bonds
Financial structure further improved
Fiscal 2002 marked yet another year in which we financed the internationalexpansion of our business by issuing new bonds. This is the optimal form of financing, given the high and stable flows of funds from our acquisitions.Nevertheless, we intend to reduce our net debt over the next few years. Our aim is to preserve our current strong ratings despite the fact that theagencies’ requirements have become more stringent.
167
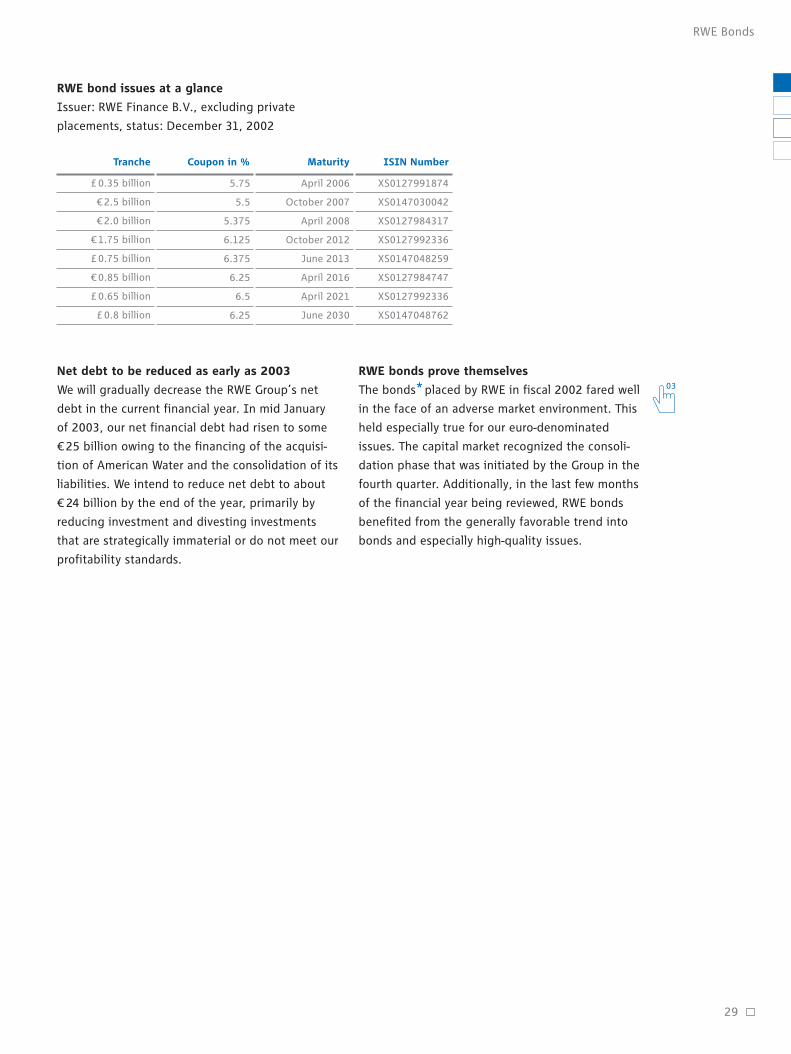
29
RWE bonds prove themselves
The bonds*placed by RWE in fiscal 2002 fared well
in the face of an adverse market environment. This
held especially true for our euro-denominated
issues. The capital market recognized the consoli-
dation phase that was initiated by the Group in the
fourth quarter. Additionally, in the last few months
of the financial year being reviewed, RWE bonds
benefited from the generally favorable trend into
bonds and especially high-quality issues.
RWE Bonds
Coupon in %Tranche
5.75
5.5
5.375
6.125
6.375
6.25
6.5
6.25
£ 0.35 billion
€ 2.5 billion
€ 2.0 billion
€ 1.75 billion
£ 0.75 billion
€ 0.85 billion
£ 0.65 billion
£ 0.8 billion
April 2006
October 2007
April 2008
October 2012
June 2013
April 2016
April 2021
June 2030
XS0127991874
XS0147030042
XS0127984317
XS0127992336
XS0147048259
XS0127984747
XS0127992336
XS0147048762
Maturity ISIN Number
03
RWE bond issues at a glance
Issuer: RWE Finance B.V., excluding private
placements, status: December 31, 2002
Net debt to be reduced as early as 2003
We will gradually decrease the RWE Group’s net
debt in the current financial year. In mid January
of 2003, our net financial debt had risen to some
€ 25 billion owing to the financing of the acquisi-
tion of American Water and the consolidation of its
liabilities. We intend to reduce net debt to about
€ 24 billion by the end of the year, primarily by
reducing investment and divesting investments
that are strategically immaterial or do not meet our
profitability standards.
30
Executive Board Report
Executive Board Report
32_Review of Operations
58_Workforce
61_Corporate Citizenship
63_Environmental Protection
30–65
31
Executive Board Report
Executive Board Report
13.3
8.7

32
Review of Operations
From expansion to integration We completed the international expansion ofour core multi-utility businesses in the fields of electricity, gas, water and environmentalservices for the time being in fiscal 2002.Highlights included the acquisition of Innogyand nearly the entire Czech gas industry aswell as the successful approval procedure forthe acquisition of American Water Works. Atthe same time, we sharpened our focus evenfurther by exiting the refinery and service-station business earlier than planned. OurGerman electricity operations proved to be our most important earnings mainstay onceagain. It made a major contribution to theGroup’s 15% increase in its operating result,despite persistently unfavorable economicconditions in the non-core businesses.
33
German electricitywholesale prices con-tinued to recover. Bycontrast, they weremarkedly down inEngland and Wales.
The regulated waterbusiness displayed astable trend.
Natural gas prices inour core markets inGermany, the CzechRepublic and the UKwere down on theprevious year.
Review of Operations
World economy did not pick up as expected
Following a brief period of stability at the begin-
ning of 2002, the world economy again slowed
down markedly in the second half of the year. Weak
signals of recovery could be seen in the US, thanks
to government spending programs and low interest
rates. Europe’s economy grew at an even slower
pace than North America’s. The cyclical downturn
in the US was primarily reflected in declining invest-
ment. The situation in Southeast Asia as well as
central Eastern Europe was different, with strong
domestic demand driving economic developments.
Latin America’s unfavorable economic climate was
additionally hampered by crises in Argentina and
Venezuela.
The economies of RWE’s two key European markets
—Germany and the UK—continued to cool down as
well. Germany’s economy displayed recessionary
tendencies. Gross domestic product grew a paltry
0.2%, thus virtually stagnating. The slight recovery
in exports was contrasted by a significant decrease
in investment. As a result, Germany’s economic
development was below the EU average once again.
By contrast, Great Britain managed to maintain its
slight lead (just over one percentage point) in
terms of growth over the euro zone. Gross domestic
product rose by 1.7%. This was principally due to
substantial growth in private consumption, whereas
investment and exports declined.
Economic trend of RWE’s business areas:
little growth and predominantly stable prices
Mild weather conditions in Western and Central
Europe dampened demand on our major markets
for electricity and gas. This situation was exacer-
bated by the effects of the weak economy.
Germany’s electricity consumption stagnated, while
gas deliveries slipped 0.5%. Volumes on UK electri-
city and gas markets slipped 0.3% and nearly 2%,
respectively. On the Czech market, 3.3% less gas
was consumed for weather-related reasons.
Hungary, RWE’s most important electricity market
after Germany and Great Britain, saw consumption
rise by roughly 2%, thanks to the country’s more
robust economic trend.
German electricity wholesale prices continued to
recover in 2002. The one-year forward price* for
electricity deliveries in 2003 was up 5.2% for base-
load power* and up 9.7% for peak-load power*.
Prices paid for electricity in the end consumer
market advanced some 4%. This was due to the
price trend in the wholesale sector, the increased
burden imposed by the electricity tax, and the sub-
sidization of renewables-based energies and
combined heat and power generation.
Wholesale prices for electricity in England and
Wales were markedly down. This was a result of the
introduction of the New Electricity Trading Arrange-
ment (NETA)*at the end of March 2001. In 2002,
the one-year forward price for base-load power was
13% lower on average compared with the previous
year. Peak-load power was about 18% cheaper on
average over the year. However, electric companies
with a healthy balance between the generation and
end customer businesses as well as flexible and
efficient power plant portfolios were only slightly
affected.
In 2002, international oil markets were marked by
speculation over crises. The potential escalation of
the Iraq conflict was the major source of concern.
Following lows of less than US$ 20 per barrel, the
price of Brent crude rose over the course of the
year, closing 2002 at US$ 30. It averaged US$ 25
per barrel and was thus slightly up on the previous
year’s high level. Europe’s natural gas prices, which
track oil prices with a time lag of about six-months,
initially decreased at the end of 2001 owing to
weaker oil prices, but recovered later in the year.
Gas exports to Germany cost an average of € 11.5
per MWh. This corresponds to an 18% decrease
compared with the previous year’s high level. Czech
imports were 22% cheaper. In Great Britain, a
country which covers the lion’s share of its natural
gas consumption with domestic production, prices
on the spot market were 24% lower year-on-year.
Growth witnessed by the private water market in
prior years continued. More stringent quality and
environmental standards as well as the need to
replace pipeline networks formed the basis for this.
Whereas the regulated water business displayed
166
166
167
167
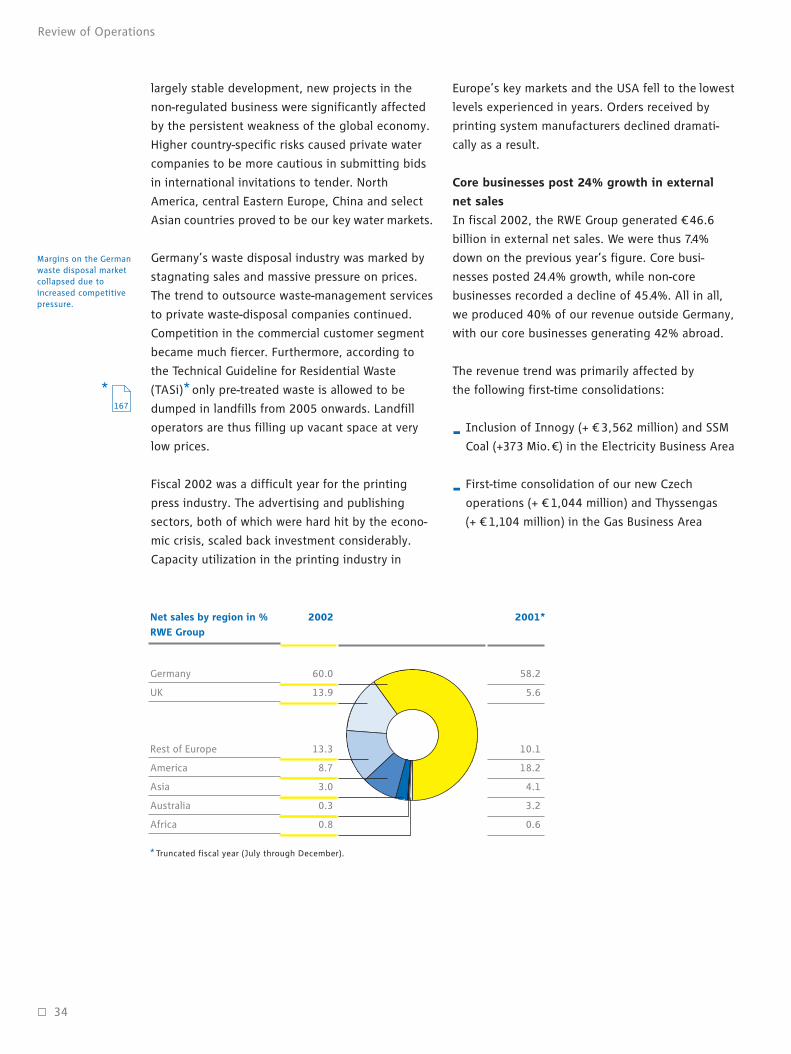
34
Margins on the Germanwaste disposal marketcollapsed due toincreased competitivepressure.
Review of Operations
largely stable development, new projects in the
non-regulated business were significantly affected
by the persistent weakness of the global economy.
Higher country-specific risks caused private water
companies to be more cautious in submitting bids
in international invitations to tender. North
America, central Eastern Europe, China and select
Asian countries proved to be our key water markets.
Germany’s waste disposal industry was marked by
stagnating sales and massive pressure on prices.
The trend to outsource waste-management services
to private waste-disposal companies continued.
Competition in the commercial customer segment
became much fiercer. Furthermore, according to
the Technical Guideline for Residential Waste
(TASi)*only pre-treated waste is allowed to be
dumped in landfills from 2005 onwards. Landfill
operators are thus filling up vacant space at very
low prices.
Fiscal 2002 was a difficult year for the printing
press industry. The advertising and publishing
sectors, both of which were hard hit by the econo-
mic crisis, scaled back investment considerably.
Capacity utilization in the printing industry in
Europe’s key markets and the USA fell to the lowest
levels experienced in years. Orders received by
printing system manufacturers declined dramati-
cally as a result.
Core businesses post 24% growth in external
net sales
In fiscal 2002, the RWE Group generated €46.6
billion in external net sales. We were thus 7.4%
down on the previous year’s figure. Core busi-
nesses posted 24.4% growth, while non-core
businesses recorded a decline of 45.4%. All in all,
we produced 40% of our revenue outside Germany,
with our core businesses generating 42% abroad.
The revenue trend was primarily affected by
the following first-time consolidations:
jInclusion of Innogy (+ € 3,562 million) and SSM
Coal (+373 Mio.€) in the Electricity Business Area
jFirst-time consolidation of our new Czech
operations (+ € 1,044 million) and Thyssengas
(+ € 1,104 million) in the Gas Business Area
2001*Net sales by region in %
RWE Group
2002
58.2
5.6
10.1
18.2
4.1
3.2
0.6
Germany
UK
Rest of Europe
America
Asia
Australia
Africa
60.0
13.9
13.3
8.7
3.0
0.3
0.8
*Truncated fiscal year (July through December).
167

35
Review of Operations
Electricity
Gas
Water
Environmental Services
Total core business
RWE Dea Downstream2
Heidelberger Druckmaschinen
Total non-core business
Other/holding/consolidation
RWE Group
19,1681
3,724
2,746
2,055
27,6931
16,641
5,330
21,971
7024
50,3661
23,797
5,666
2,850
2,136
34,449
7,6823
4,315
11,997
187
46,633
+ 24.1
+ 52.1
+ 3.8
+ 3.9
+ 24.4
- 53.8
- 19.0
- 45.4
- 73.4
- 7.4
2001
pro forma
+/- in %External net sales
€ million
2002
1 Net of the change in sales disclosed for energy trading activities (unadjusted Group figure: € 52.8 billion; core business: € 30.1 billion; Electricity Business Area: € 21.6 billion).
2 Discontinuing operations, in accordance with IAS.3 Only the first half of 2002 (divested as of July 1, 2002).4 Still includes RWE Dea’s former chemicals operations on a two-month basis.
Net of first-time and deconsolidations, external
net sales decreased by 3.7%. This was principally
due to the steep decline in sales generated by
our non-core businesses. Heidelberger Druckma-
schinen’s business volume dropped 19%, owing to
the weak economy. RWE Gas and RWE Dea
Electricity
Gas
Water
Environmental Services
Total core business
RWE Dea Downstream1
Heidelberger Druckmaschinen
Total non-core business
Other/holding/consolidation
RWE Group
3,378
877
1,327
321
5,903
525
574
1,099
- 212
6,790
4,146
1,239
1,457
281
7,123
522
414
466
- 348
7,241
+ 22.7
+ 41.3
+ 9.8
- 12.5
+ 20.7
- 90.1
- 27.9
- 57.6
- 64.2
+ 6.6
2001
pro forma
+/- in %EBITDA
€ million
2002
1 Discontinuing operations, in accordance with IAS.2 Only the first six months of 2002 (divested as of July 1, 2002).
Group external netsales were down 7.4%.Net of consolidationeffects, they were only3.7% lower. By contrast,sales generated by ourcore business were up24.4%.
The aforementioned acquisitions were the main
reason for the growth in revenue in our core busi-
nesses. Our withdrawal from the Shell & DEA Oil
joint venture in the non-core business, effective
July 1, 2002, had a counteractive effect. We are
missing the sales generated from these activities
in the second half of 2002. The oil downstream*business contributed € 8,414 million to the Group’s
sales from July to December 2001.
Downstream suffered declines in sales for price-
related reasons.
A detailed description of the sales trend by
business area is presented on pages 70 to 101.
166

36
margin as sales. We adjusted the previous year’s
figures to reflect this change as well. The adop-
tion of the net recognition method does not
have an impact on the result.
In addition, fiscal 2002 was characterized by
material first-time consolidations and deconsoli-
dations, which are partially reflected in an amended
reporting structure:
jOur largest acquisition projects involved the
takeover of almost the entire Czech gas industry
(Transgas along with stakes in eight regional gas
utilities) as well as the acquisition of the UK-
based energy utility Innogy. We consolidated
our new Czech operations as of May 1, 2002 and
Innogy as of June 1, 2002 for the first time.
Accordingly, the acquired companies have been
considered in the consolidated financial
statements based on eight and seven months,
respectively. Transgas and the regional distribu-
tors have been allocated to the Gas Business
Area’s Midstream/Downstream Division. Innogy
is the operating management company of our
new “UK Energy” Division, which is part of the
Electricity Business Area.
jWe fully consolidated Thyssengas GmbH, in
which RWE Gas holds a 75% stake, as of January
2002. Thyssengas is one of Germany’s largest
long-distance gas companies.
jWe transferred RWE Dea’s service-station and
refinery operations (downstream business) to
the Shell & DEA Oil GmbH joint venture effective
January 2, 2002 and sold them to our partner
Shell ahead of schedule as of July 1. Therefore,
these activities are only considered on a six-
month basis. They are consolidated pro-rata to
reflect our 50% stake in the joint venture. On
the other hand, the previous year’s figures still
include RWE Dea’s downstream business on a
100% basis and cover the whole of fiscal 2001.
We will comment on the business trend in 2002 on
the basis of pro forma figures for the previous year,
which were not audited separately. This is due to
the fact that we transitioned to the calendar fiscal
year and were thus compelled to introduce a trun-
cated fiscal year at the Group level in the second
half of 2001. To enable proper comparisons, we
have adjusted the previous year’s figures to exclude
the following effects:
jWe stopped consolidating HOCHTIEF fully on
January 1, 2002, and now account for this invest-
ment at equity. This change was taken into
consideration retroactively in prior year figures
as well. Therefore, this company is only included
in the consolidated operating result on the basis
of its prorated net income. HOCHTIEF’s sales,
personnel and capital expenditure are no longer
included in the Group’s figures.
jThames Water’s unadjusted year-earlier figures
also covered the period from November 9
through December 31, 2000. We netted out this
effect.
jWe synchronized RWE’s and Heidelberger
Druckmaschinen’s reporting periods, which used
to deviate from each other by three months.
Thus, Heidelberg’s prior-year figures now
correspond to the calendar year from January to
December 2001.
jHarpen, our subsidiary that specializes in renew-
ables-based and distributed power generation,
has been listed under “other activities” in the
Electricity Business Area since January 1, 2002.
At the same time, we transferred the Corporate
Services Division from the Electricity Business
Area to the overall Group level, where it is now
included under “other activities.” These amend-
ments to the reporting structure were consi-
dered retroactively in the previous year’s figures.
jSales from energy trading operations is no
longer disclosed in gross figures. Instead, it is
stated net, which means that, instead of the
entire trading volume, we now only state the
Review of Operations
Commentary on the reporting structure
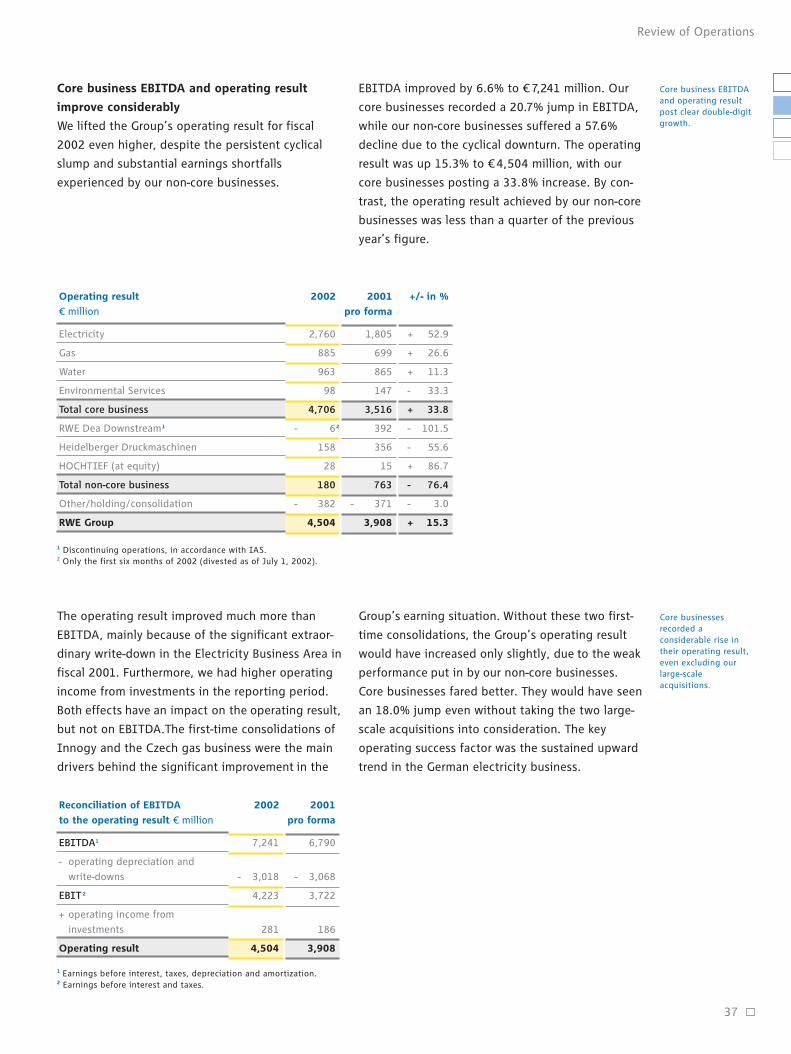
37
Review of Operations
Core business EBITDA and operating result
improve considerably
We lifted the Group’s operating result for fiscal
2002 even higher, despite the persistent cyclical
slump and substantial earnings shortfalls
experienced by our non-core businesses.
Electricity
Gas
Water
Environmental Services
Total core business
RWE Dea Downstream1
Heidelberger Druckmaschinen
HOCHTIEF (at equity)
Total non-core business
Other/holding/consolidation
RWE Group
1,805
699
865
147
3,516
392
356
15
763
- 371
3,908
2,760
885
963
98
4,706
- 62
158
28
180
- 382
4,504
+ 52.9
+ 26.6
+ 11.3
- 33.3
+ 33.8
- 101.5
- 55.6
+ 86.7
- 76.4
- 3.0
+ 15.3
2001
pro forma
+/- in %Operating result
€ million
2002
1 Discontinuing operations, in accordance with IAS.2 Only the first six months of 2002 (divested as of July 1, 2002).
EBITDA improved by 6.6% to € 7,241 million. Our
core businesses recorded a 20.7% jump in EBITDA,
while our non-core businesses suffered a 57.6%
decline due to the cyclical downturn. The operating
result was up 15.3% to €4,504 million, with our
core businesses posting a 33.8% increase. By con-
trast, the operating result achieved by our non-core
businesses was less than a quarter of the previous
year’s figure.
EBITDA1
- operating depreciation and
write-downs
EBIT 2
+ operating income from
investments
Operating result
6,790
- 3,068
3,722
186
3,908
7,241
- 3,018
4,223
281
4,504
Reconciliation of EBITDA
to the operating result € million
2001
pro forma
2002
1 Earnings before interest, taxes, depreciation and amortization.2 Earnings before interest and taxes.
The operating result improved much more than
EBITDA, mainly because of the significant extraor-
dinary write-down in the Electricity Business Area in
fiscal 2001. Furthermore, we had higher operating
income from investments in the reporting period.
Both effects have an impact on the operating result,
but not on EBITDA.The first-time consolidations of
Innogy and the Czech gas business were the main
drivers behind the significant improvement in the
Group’s earning situation. Without these two first-
time consolidations, the Group’s operating result
would have increased only slightly, due to the weak
performance put in by our non-core businesses.
Core businesses fared better. They would have seen
an 18.0% jump even without taking the two large-
scale acquisitions into consideration. The key
operating success factor was the sustained upward
trend in the German electricity business.
Core business EBITDAand operating resultpost clear double-digitgrowth.
Core businessesrecorded aconsiderable rise intheir operating result,even excluding ourlarge-scaleacquisitions.

38
electricity operations were by far the most impor-
tant earnings mainstay of our multi-utility* portfo-
lio. In this business area alone, we generated more
than 60%, or € 2,760 million, of our operating re-
sult. In the first seven months of its consolidation,
Innogy contributed € 379 million. But even without
Innogy, we would have closed fiscal 2002 31.9%
up year-on-year. Our German electricity business
was our main pillar, as in the previous year. Cost
reductions, higher prices and a return-oriented
sales policy all helped improve the result conside-
rably. In contrast, our US subsidiary CONSOL Ener-
gy had to contend with massive earnings shortfalls.
The hard coal and gas producer saw its operating
result decrease by € 142 million to € 251 million.
This was due to the steep decline in hard coal sales
volumes caused by cyclical and weather-related
effects and lower average prices for gas in the USA.
The Electricity Business Area achieved a ROCE of
13.5%. We thus clearly exceeded our capital costs.
At € 710 million, absolute value added was nearly
three times higher than in the previous year,
despite Innogy’s first-time consolidation.
Gas
We grew earnings significantly in the Gas Business
Area as well. EBITDA advanced 41.3%, and the
operating result climbed 26.6%. The Midstream/
Downstream Division increased its operating result
by 50.3%. This was primarily due to our new Czech
gas activities. Eight months of their accounts con-
tributed € 179 million to the operating result. Net
of this one-off effect, the division would have
closed the fiscal year 3.6% down on the previous
one, owing to the lower gas margins that were
caused by developments in oil prices. The Upstream
Division improved its operating result by 5.2% over
the previous year’s high level. Higher production
volumes and an essentially unchanged price level
were the basis for this. This division’s ROCE was
14.9% and thus clearly exceeded capital costs. As
a result of the first-time consolidation of the Czech
gas business, the € 249 million in absolute value
added was 28.0% down year-on-year. Without this
effect, it would have declined by 15.3%. This re-
flected the big increase in the Upstream Division’s
operating assets, which was partially a conse-
quence of the acquisition of Highland Energy.
Review of Operations
Absolute value added up 80% in core business
We aim to increase shareholder value. The extent
to which we achieve this goal is measured by the
Group’s return on capital employed (ROCE). In the
year under review, this key figure was 10.4%. It
thus exceeded our capital cost of 9.5% before
taxes. The difference between these two values,
multiplied by our €44.3 billion in operating assets,
is the absolute value contribution, which is the key
indicator used to measure the success of our activi-
ties. Absolute value added totaled € 395 million in
2002. Despite the dramatic earnings shortfalls in
our non-core businesses, we thus surpassed the
previous year’s pro-forma figure (€ 388 million) by
1.8%. The value contribution made by our core
businesses jumped considerably. It was up 80.1%
to € 796 million. If Innogy and the Czech gas ope-
rations had not been taken into consideration, value
added would actually have more than doubled to
€ 930 million. As far as these two acquisitions are
concerned, we aim to have them at least match
their capital cost by 2005 and 2006, respectively.
Our power generation business recorded the stron-
gest rise in ROCE. The water business was still sig-
nificantly below its capital costs due to increases in
goodwill from acquisitions. However, it has already
managed to reduce its negative value contribution
considerably. The waste business also made a
negative contribution to value added due to the
unfavorable situation on the German waste-dis-
posal market. Value added by our non-core busi-
nesses dropped substantially, falling to -€ 341 mil-
lion from € 138 million a year earlier.
The following commentary addresses our core
businesses individually:
Electricity
The upward trend in the electricity business conti-
nued in 2002. EBITDA was up 22.7% and the ope-
rating result was boosted 52.9%. These financials
grew at different rates primarily owing to the fact
that the previous year’s operating result was com-
paratively low. This was due to write-offs incurred
for RWE Power’s Mülheim-Kärlich nuclear power
plant as well as for a test facility operated by RWE
Rheinbraun. Write-offs reduce the operating result,
but do not affect EBITDA. Once again, our
Electricity was the keyearnings mainstay inour multi-utility port-folio. But Gas andWater improved as well.
Value added by corebusinesses roseconsiderably, while itdecreased substantiallyin our non-corebusiness.
167
Water
EBITDA generated by the Water Business Area was
up 9.8%. The operating result was 11.3% higher
year-on-year. This was due to operating improve-
ments and acquisitions in Chile as well as the first-
time inclusion of RWW Rheinisch-Westfälische
Wasserwerksgesellschaft and of Spanish-based
PRIDESA and Ondagua. Higher expenditure on net-
work infrastructure improvements in Great Britain
had a counteractive effect. ROCE was 7.3% up on
the previous year’s level, but was still unable to
match the water business’ capital costs. This was
due to goodwill related to acquisitions. Therefore,
absolute value added amounted to -€ 93 million.
However, it rose by € 70 million compared with
2001.
Environmental Services
Environmental Services was the only core business
to close the reporting period down on the previous
year. EBITDA declined by 12.5% and the operating
result decreased by 33.3%. The collapse in prices
in the residential and commercial waste sectors
was primarily responsible for this development. At
5.8%, ROCE was far below the cost of capital. Ab-
solute value added totaled -€ 71 million and was
thus substantially down year-on-year. Both the de-
clining earnings trend as well as the goodwill from
the increase in our stake in Trienekens from 50% to
100% had an impact. Since we had already consoli-
dated this company fully, capital employed rose,
but the operating result that we had included in
the consolidated financial statements did not. To
counteract this development, we realigned our
environmental operations within the scope of the
integration of Trienekens and initiated additional
restructuring measures.*
Non-core businesses
jRWE Dea Downstream closed the period ended
June 30 with a significant drop in EBITDA, which
totaled € 52 million and a negative operating
result of -€ 6 million. Extremely weak refinery
margins and the earnings situation were a
burden. ROCE entered negative territory, falling
to -1.5%. At -€ 59 million, absolute value added
clearly fell short of the previous year’s level.
jHeidelberger Druckmaschinen suffered under the
dramatic deterioration of its branch of industry,
which witnessed a considerable drop in demand
in North America and Europe, both of which are
key markets. EBITDA declined 27.9% and the
operating result was more than halved. ROCE
decreased to 7.5% and was thus far below capital
costs, which amounted to 14.0%. Accordingly,
absolute value added slid to -€ 225 million.
jOur investment in the construction industry,
HOCHTIEF, considered in our consolidated
financial statements based on its prorated net
income, contributed € 28 million to the Group’s
operating result and thus outperformed the
previous year’s low level. The major contributor
to this was the proceeds from the Monachia real-
estate business. Furthermore, HOCHTIEF redu-
ced the operating loss in its German construction
business. Turner’s US operations continued to
improve. This was contrasted by losses in Dutch-
based Ballast Nedam, among other things. ROCE
advanced to 3.0%, but was still markedly below
capital costs. At -€ 56 million, absolute value
added was negative, but already clearly above
the year-earlier figure (-€ 165 million).
39
Review of Operations
In the non-core busi-ness, the earningssituation of our down-stream activities, whichhave been sold in themeantime, and ofHeidelberger Druck-maschinen deterioratedconsiderably.
97

40
Review of Operations
Increasing shareholder value lies at the heart of
our strategy. Additional value is created when the
return on capital employed exceeds capital costs.
We measure the return as ROCE (return on capital
employed). ROCE reflects the purely operating
return of a company or business area. It is the pro-
duct of dividing the operating result by operating
assets.
We calculate our cost of capital as a weighted ave-
rage of equity and external capital costs. The
equity capital costs cover the market’s company-
specific expectation of returns when investing in a
share of RWE above and beyond that of a risk-free
investment. The external capital costs are linked to
long-term financing conditions in the RWE Group
and allow external capital interest to be classified
as tax deductible (tax shield).
We calculate the group’s cost of outside capital by
applying a pre-tax cost rate of 6.0%. The cost of
equity capital is derived on the basis of an interest
rate of 5.5%, which is customary for a risk-free
investment, and add to that risk charges specific to
the business area or the Group. We do not derive
the relationship between equity and external
capital from the amounts carried on the balance
sheet, but assume a long-term ratio of 40:60 ins-
tead. In 2002, the RWE Group’s cost of capital is
thus 9.5% before taxes. Due to the recent strong
increase in the share of outside capital and the
higher weight accorded to the less risky water
activities in our portfolio, we will lower the capital
cost rate to 9.0% in 2003. We will not reduce the
cost rates for our individual business areas, i.e. the
hurdles for capital expenditure.
Relative value added is the difference between
ROCE and the capital cost rate. Multiplying this by
the capital employed results in the absolute value
added, which we employ as a central management
benchmark. It is the most important criterion for
evaluating capital expenditures. The higher the
value added, the more attractive a particular
activity is for our portfolio.
1 We have recognized 7/12 and 8/12 of Innogy’s and our Czech companies’ operating assets, respectively.2 Includes € 99 million in interest from sales financing at Heidelberger Druckmaschinen (previous year: € 67 million).3 Figure after taxes due to HOCHTIEF’s consolidation under the equity method.
247
346
- 163
12
442
287
16
- 165
138
- 192
388
710
249
- 93
- 71
796
- 59
- 225
- 56
- 341
- 60
395
3.5
4.2
- 0.7
- 4.2
1.9
- 14.5
- 6.5
- 6.0
- 7.1
—
0.9
10.0
10.7
8.0
10.0
9.5
13.0
14.0
9.03
12.9
—
9.5
13.5
14.9
7.3
5.8
11.4
- 1.5
7.5
3.0
5.8
—
10.4
20,5041
5,9591
13,200
1,689
41,352
409
3,449
937
4,795
- 1,854
44,293
2,760
885
963
98
4,706
- 6
2572
28
2792
- 382
4,6032
Electricity
Gas
Water
Environmental Services
Total core business
RWE Dea Downstream
Heidelberger Druckmaschinen
HOCHTIEF
Total non-core business
Other/holding/consolidation
RWE Group
Capital
costs
%
Relative
value
added
%
Absolute
value
added
€ million
Absolute
value
added
in 2001
€ million
ROCE
%
Operating
assets
€ million
Operating
result
€ million
Value added by business area
in fiscal 2002
RWE value management: goal-oriented control of all the Group’s business areas

41
Review of Operations
Net income reflectsexpenses associatedwith our acquisitionsand exceptionalcharges due to theeconomic situation.
Income from operating activities
+ Income from investments
- Non-operating result
Operating result
+ Non-operating result
+ Financial results
Income before tax
- Taxes on income
Income after tax
- Minority interest
Net income
_Incl. goodwill amortization
_Excl. goodwill amortization
Earnings per share (€)
_Incl. goodwill amortization
_Excl. goodwill amortization
3,326
620
- 38
3,908
38
- 1,752
2,194
- 450
1,744
- 394
1,350
1,799
2.40
3.20
4,800
554
- 850
4,504
850
- 2,632
2,722
- 1,367
1,355
- 305
1,050
1,830
1.87
3.25
+ 44.3
- 10.6
—
+ 15.3
—
- 50.2
+ 24.1
+ 203.8
- 22.3
- 22.6
- 22.2
+ 1.7
- 22.1
+ 1.6
2001
pro forma
+/- in %Commercial Income Statement
€ million
2002
Net income reflects external growth and
burdens from one-off charges
As expected, the group’s net income reflects
expenses associated with our acquisitions. However,
it was also burdened by high exceptional charges
due to the weak economic situation and the
difficult state of the capital market. We offset the
latter effects with the book gain that we realized
on the early sale of the refinery and service-station
business. The reconciliation of the operating result
to net income reveals various influential factors:
Our non-operating result rose from € 38 million to
€ 850 million. Proceeds from divestments made a
major contribution and primarily stemmed from the
sale of our downstream operations (+€ 937 million)
and of our shares in STEAG (+€ 322 million). The
non-operating result also benefited from extra-
ordinary income from the release of nuclear energy
provisions (+€ 963 million). We reduce the annual
escalation rate used to determine future expen-
diture on waste disposal in line with actual price
trends. Furthermore, we achieved savings by
changing the disposal procedure for spent nuclear
fuel elements. This is a result of the agreement on
nuclear energy reached with Germany’s federal
government. The aforementioned income was con-
trasted by goodwill amortization charges totaling
-€ 780 million (previous year: -€449 million). In
addition, the non-operating result was burdened
by one-off effects. In light of the significant
deterioration of the market environment in which
RWE Umwelt and Heidelberger Druckmaschinen
work, we set aside € 253 million and
€ 126 million for restructuring. We also had a
-€ 230 million impairment on our investment in
HOCHTIEF. This reflects the decrease in
HOCHTIEF’s share price.
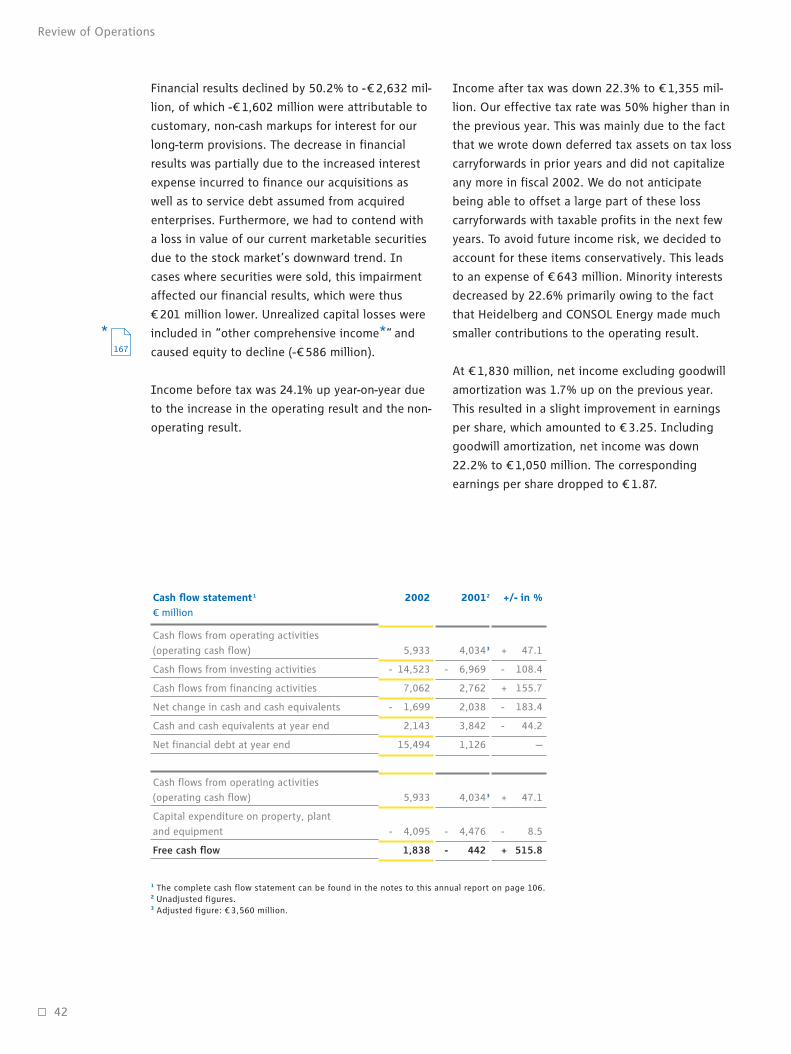
42
Review of Operations
Cash flows from operating activities
(operating cash flow)
Cash flows from investing activities
Cash flows from financing activities
Net change in cash and cash equivalents
Cash and cash equivalents at year end
Net financial debt at year end
Cash flows from operating activities
(operating cash flow)
Capital expenditure on property, plant
and equipment
Free cash flow
4,0343
- 6,969
2,762
2,038
3,842
1,126
4,0343
- 4,476
- 442
5,933
- 14,523
7,062
- 1,699
2,143
15,494
5,933
- 4,095
1,838
+ 47.1
- 108.4
+ 155.7
- 183.4
- 44.2
—
+ 47.1
- 8.5
+ 515.8
20012 +/- in %Cash flow statement 1
€ million
2002
1 The complete cash flow statement can be found in the notes to this annual report on page 106.2 Unadjusted figures.3 Adjusted figure: € 3,560 million.
Financial results declined by 50.2% to -€ 2,632 mil-
lion, of which -€ 1,602 million were attributable to
customary, non-cash markups for interest for our
long-term provisions. The decrease in financial
results was partially due to the increased interest
expense incurred to finance our acquisitions as
well as to service debt assumed from acquired
enterprises. Furthermore, we had to contend with
a loss in value of our current marketable securities
due to the stock market’s downward trend. In
cases where securities were sold, this impairment
affected our financial results, which were thus
€ 201 million lower. Unrealized capital losses were
included in “other comprehensive income*” and
caused equity to decline (-€ 586 million).
Income before tax was 24.1% up year-on-year due
to the increase in the operating result and the non-
operating result.
Income after tax was down 22.3% to € 1,355 mil-
lion. Our effective tax rate was 50% higher than in
the previous year. This was mainly due to the fact
that we wrote down deferred tax assets on tax loss
carryforwards in prior years and did not capitalize
any more in fiscal 2002. We do not anticipate
being able to offset a large part of these loss
carryforwards with taxable profits in the next few
years. To avoid future income risk, we decided to
account for these items conservatively. This leads
to an expense of € 643 million. Minority interests
decreased by 22.6% primarily owing to the fact
that Heidelberg and CONSOL Energy made much
smaller contributions to the operating result.
At € 1,830 million, net income excluding goodwill
amortization was 1.7% up on the previous year.
This resulted in a slight improvement in earnings
per share, which amounted to € 3.25. Including
goodwill amortization, net income was down
22.2% to € 1,050 million. The corresponding
earnings per share dropped to € 1.87.
167
43
Review of Operations
According to assessments made by the leading
rating agencies, RWE has good creditworthiness.
Credit ratings are largely determined on the basis
of the ratio of EBITDA to net interest expense. The
higher the indicator, the higher the company’s
financing capability. To maintain our solid rating,
we set a minimum limit for this indicator of 5.0.
Accordingly, our EBITDA has to be at least five
times our net interest expense. At the end of the
fiscal year, this key figure was at 11.2. It will
decline as planned in the 2003 fiscal year, owing
to the purchase of American Water, but it will still
remain clearly above our lower limit.
Balance sheet structure
The balance sheet total was up 9.6% to € 100.3
billion as of December 31, 2002. This was princi-
pally due to the acquisition of Innogy and the
takeover of the Czech gas operations, which added
€ 5.6 billion and € 1.5 billion in goodwill to our
books, respectively. Acquisitions made a major
contribution to the 25.2% increase in non-current
assets. Counteractive effects stemmed from the
deconsolidation of our financial investment in
HOCHTIEF and of the oil downstream business.
On the equity and liability side, liabilities were up
10.6%. This was principally due to the issuance of
additional bonds. The € 2.2 million decrease in
equity to € 8.9 billion is a result of currency
exchange effects and valuation adjustments marke-
table securities, among other things. Our capital-
to-assets ratio fell from 12.2% to 8.9%. Besides the
reduction in equity, this decrease reflected the
steep rise in the balance sheet total. Resources
available to us in the long term cover 108.4% of
our non-current assets.
Operating cash flowswere markedly up year-on-year due to highertax liabilities and thefact that trade accountspayable grew morethan correspondingaccounts receivable.
Net debt increased to€ 15.5 billion. SinceEBITDA is more thanfive times our netinterest expense, RWEhas a strong financialposition.
Operating cash flow markedly up year-on-year
Cash flows from operating activities (operating
cash flow) rose 47.1% to € 5,933 million. Compared
with the previous year’s adjusted figure of € 3,560
million, this corresponds to an increase of 66.7%.
This is partially due to the fact that we accrued tax
liabilities. A tax payment, which had been
scheduled for December 2002, had to be post-
poned until the first half of 2003 to comply with
tax-collection procedures. On the other hand, our
trade accounts payable grew more than the corres-
ponding accounts receivable. Both these effects
are reflected in our lower net current assets, which
decreased by a total of € 1,116 million in the year
being reviewed. Cash flows from investing activi-
ties amounted to -€ 14.5 billion and were thus
twice as high as in the previous year. The takeover
of the Czech gas industry and the acquisition of
Innogy had a very significant effect. We received
€ 7,062 million in cash flows from financing
activities. All in all, cash and cash equivalents
declined by € 1,699 million to € 2,143 million.
After deducting capital expenditure on property,
plant and equipment (€4,095 million), operating
cash flow led to € 1,838 million in free cash flow.
The previous year’s corresponding figure was in
negative territory at -€442 million. The substantial
improvement in operating cash flow was the main
driver of this strong rise.
Net financial debt grows to € 15.5 billion
In the reporting period, net financial debt advan-
ced from € 1.1 billion to € 15.5 billion. This was
mainly due to the aforementioned large-scale
acquisitions. Including assumed debt, Innogy and
the Czech gas business were responsible for some
€ 12 billion of this increase. Moreover, net financial
assets were reduced by €1.5 billion due to the
deconsolidation of HOCHTIEF. Other capital
expenditures on property, plant and equipment
and other investments in financial assets totaled
€ 7.9 billion. A counteractive effect was felt from
cash flows from operating activities of € 5.9 billion
as well as from proceeds from disposals amounting
to € 2.2 billion.

44
Review of Operations
Assets
Non-current assets
Inventories, accounts receivable, etc.
Cash and cash equivalents
Deferred taxes
Total
Shareholders’ equity and liabilities
Equity and minority interests
Long-term provisions
Other long-term funding
Short-term provisions and liabilities
Deferred taxes
Total
49,182
30,026
3,842
8,399
91,449
11,129
33,227
14,567
26,320
6,206
91,449
61.4
28.9
2.1
7.6
100.0
8.9
32.5
25.1
26.9
6.6
100.0
61,577
28,960
2,143
7,593
100,273
8,924
32,637
25,181
26,965
6,566
100,273
53.8
32.8
4.2
9.2
100.0
12.2
36.3
15.9
28.8
6.8
100.0
Balance sheet structure 12/31/02
€ million
12/31/02
%
12/31/01
€ million
12/31/01
%
Workforce up 6.8% due to consolidation effects
As of December 31, 2002, the RWE Group’s em-
ployee headcount totaled 131,765. Its workforce
had thus expanded by 6.8% since December 31,
2001. Acquisitions and divestments caused the
labor force to increase by a net 14,710 staff mem-
bers. Changes in operating personnel caused the
staffing level to decrease by 6,368 positions, 2,174
of which were in Germany. We determine our work-
force on the basis of full time equivalents, whereby
each employee is accounted for based on his or her
percentage of full-time employment.
RWE becomes largest multi-utility provider in
Great Britain through the acquisition of Innogy
At the end of May 2002, we acquired UK-based
electric and gas utility Innogy Holdings. The pur-
chase price was € 5,056 million. Including liabili-
ties, the enterprise value amounted to € 8.5 billion.
Thanks to Innogy, we now have a leading position
on Europe’s third-largest utility market. At present,
the company is the No. 3 player in the UK energy
business, with 4.6 million electricity and 1.9 mil-
lion gas customers.
One of Innogy’s characteristic features is its well-
balanced portfolio of electricity generation and
sales activities. Furthermore “npower” gives the
company one of the nation’s strongest brands,
which already has a successful track record of
cross-selling electricity and gas. Through the col-
laborative efforts of Innogy and Thames Water*,
we intend to realize € 80 million in synergies, which
should come into full effect from 2006 onwards. In
so doing, we will offer our British water customers
electricity and gas as well. Our overall goal is to
have Innogy achieve a ROCE that at least covers
the Electricity Business Area’s pretax capital costs
of 10% as early as 2005.
Takeover of Czech gas business completed
On May 16, 2002, we concluded the acquisition of
a 97% stake in Czech-based gas utility Transgas as
well as of between 46% and 58% of the country’s
regional distributors. The purchase price was
€4.1 billion. This acquisition puts us in the top
echelons of Europe’s premiere gas utilities. The
acquired gas companies achieved combined
external net sales of about € 2 billion in 2001 and
EBITDA to the tune of € 300 million. With over
6 million final customers, RWE Gas is now No. 5 in
Europe. Its annual gas sendout of 380 billion kWh
makes it No. 6 in Europe. Furthermore, we are one
of the largest pipeline operators in the West
European natural gas transit sector. The Czech
Republic’s annual average demand growth of 4%
Thanks to the acquisi-tion of Innogy, RWEcan offer electricityand gas in addition towater in the UK.
22

45
Review of Operations
makes the country one of Europe’s most dynamic
natural gas markets. This transaction will enable us
to unleash substantial cost and sales synergies.
We anticipate an additional € 100 million in annual
income potential*, which we intend to realize fully
by 2007. According to our forecasts, our Czech gas
operations should have achieved a ROCE that at
least matches their pretax capital costs of 10% by
2006 at the latest.
American Water: comprehensive approval proce-
dure completed more quickly than expected*In 2002, we established major prerequisites for the
successful conclusion of the acquisition of the lar-
gest water utility in the regulated US water busi-
ness, which we had initiated in September 2001.
The main reason for the protracted procedure was
the fact that a total of 13 of the 27 US states in
which American Water operates required us to go
through far-reaching approval procedures, in
addition, to the clearance we had to obtain from
the US Federal Trade Commission. We received the
last required go-ahead in December 2002. This
enabled us to close the deal on January 10, 2003.
Power operations in central Eastern Europe
strengthened
Our electricity activities’ key regions include high-
growth EU accession countries in central Eastern
Europe in addition to Germany and the UK. We
succeeded in fortifying our position in central
Eastern Europe via two acquisitions.
jWe tapped a new market with the acquisition
of an 85% stake in STOEN, Poland’s third-largest
electric utility in terms of sales, at the end of
December 2002. The power sales and distribu-
tion company supplies approximately 780,000
end customers in the greater Warsaw area,
which displays high growth rates, selling some
€ 5.4 billion kWh of electricity every year.
In 2001, STOEN had a workforce of 1,700 emplo-
yees and generated € 395 million in sales as well
as €41 million in EBITDA. The purchase price
was € 379 million.
jWe acquired a 49% stake in the Slovak-based
power utility VSE. The deal closed in January
2003, once we had received approval from the
Slovak authorities and the respective supervisory
bodies. Headquartered in Kosice, the company
serves over 600,000 end customers and has
about 22% of the market, with annual sales
volumes of approximately 4.6 billion kWh. In
2001, VSE employed about 2,000 people and
generated € 256 million in sales as well as
€ 14 million in EBITDA. The purchase price was
€ 130 million.
Thames Water: external growth in strategic
target markets
Fiscal 2002 saw us lift our stake in RWW Rheinisch-
Westfälische Wasserwerksgesellschaft from 14.3%
to 79.8%. Adding the one million residents served
by RWW in RWE’s legacy region, we increased our
German customer base to some 13 million people.
In June of 2002, we acquired a 49% interest in
China Water Company Limited. China Water runs
several projects in industrial areas, including one in
the vicinity of Shanghai where we have been par-
ticipating in the Da Chang water project since
1997. The number of people we supply with water
in the People’s Republic of China rose from one to
over five million.
Soon thereafter, we entered into the Spanish water
market by acquiring a 75% stakes in both PRIDESA
and Ondagua. In addition to conventional water
and wastewater works, PRIDESA operates cutting-
edge sea water desalination plants in Spain as well
as in neighboring Mediterranean countries and is
Europe’s technology leader in this growth market.
Ondagua runs numerous municipal water utilities
in several Spanish regions. Combined, the two
companies serve more than three million residents
and generated some € 150 million in sales in fiscal
2001.
We paid roughly €400 million for these four acqui-
sitions.
We completed the com-prehensive approvalprocedure for theacquisition of AmericanWater ahead ofschedule.
Thames Water streng-thend its position onthe international watermarket even further viatargeted shareacquisitions.
By acquiring nearly allof the Czech Republic’sgas operations, RWEhas advanced to thepremiere league ofEuropean gas utilities.
93
85

We completed theacquisition of theremaining shares inTrienekens in themiddle of 2002.
The sale of the down-stream business toShell was completedahead of schedule.
46
Moreover, RWE Plus will purchase shares of 20% in
the utility operations of the Wuppertal, Velbert and
Remscheid municipal utilities. Corresponding
agreements were struck in December 2002 and
February 2003. The city of Wuppertal’s utility supp-
lies some 236,000 end customers with electricity,
gas, district heat and water. The municipal utility
in the neighboring town of Velbert provides elec-
tricity, gas and water to about 91,000 residents.
Another 122,000 of the region’s residents are sup-
plied with electricity, gas, heat and water by EWR
GmbH, a subsidiary of Stadtwerke Remscheid. We
paid a total of € 175 million for these three trans-
actions. They are still subject to approval by the
cartel office.
Furthermore, we strengthened our local presence
in RWE Plus’ electricity business. From January
2003 onwards, this operation will be run by two
new sales management teams, which will also
assume responsibility for earnings on a regional
level.
Harpen: regenerative generation capacity more
than tripled
Harpen, our subsidiary that specializes in renew-
ables-based and distributed power supply, conti-
nued to chart its international course for growth
with success. By acquiring the Spanish wind power
specialist, AERSA, for €42 million, we created an
operating platform in one of the world’s wind
energy markets with the highest growth potential.
Furthermore, Harpen began construction work on
its first wind park, which is situated in the vicinity
of Naples, Italy. In sum, the company expanded its
regenerative generation capacity from 100 MW to
over 300 MW in fiscal 2002. Including other RWE
activities, this gives us a renewables-based power
generation capacity of 1,100 MW.
Early exit from the non-core downstream
business
We sold our 50% stake in the Shell & DEA Oil
GmbH joint venture to Deutsche Shell GmbH and
Shell Petroleum N.V. as of July 1, 2002. In so
doing, we completely shed our volatile* refinery
and service-station business. Including assumed
liabilities, the enterprise value totaled US$2 billion.
Market leadership on German waste disposal
market extended
In May 2002, we acquired the remaining 50% in
Trienekens AG* formerly held by the Trienekens
family. This made us the company’s sole owner.
The merger of Trienekens AG and RWE Umwelt,
with RWE Umwelt as the assuming entity with
retroactive commercial effect as of January 1,
2002, created a fully integrated company under
uniform management. We had consolidated
Trienekens fully already prior to the 100% takeover.
Therefore, there were no changes in sales or the
operating result.
German power operations strengthened
On the German market, we are stepping up our
efforts to take on the mounting competitive
challenge by bundling our regional operations:
jWe combined envia Energie Sachsen Branden-
burg AG and Mitteldeutsche Energieversorgung
Aktiengesellschaft to form envia Mitteldeutsche
Energie AG (enviaM). With 1.6 million customers,
the newly created enviaM is Eastern Germany’s
largest regional energy services provider.
jAs of January 1, 2002, we established a joint
venture with GEW Köln AG. We have grouped our
electricity, gas and water activities in the
Cologne/Bonn conurbation under the newly
established GEW RheinEnergie AG, of which we
own 20%. With 1.7 million customers, the joint
venture is Germany’s fifth-largest regional
distributor.
jElektrizitätswerk Rheinhessen AG (EWR), in
which RWE Plus holds a 50% interest, and
Stadtwerke Worms, in which RWE Gas already
holds a 20.8% stake, merged to create EWR AG
effective January 1, 2002. RWE Plus and RWE
Gas own a combined 50% of the new enter-
prise’s shares. EWR delivers electricity, gas and
water to more than 220,000 customers.
Review of Operations
167
97
47
Review of Operations
The sale price was US$1.35 billion and comes due
on July 1, 2003. It was only in January 2002 that
RWE and Shell Deutschland had combined their
refinery, logistics and sales operations to form the
Shell & DEA Oil joint venture. Restructuring costs
incurred to implement the joint venture since then
will be fully covered by Shell.
Divestments on schedule
In addition to withdrawing from the oil down-
stream business, we also divested smaller activi-
ties, which drew aggregate sales proceeds of
€ 669 million.
jElectricity: divestment of our 14.5% stake in
STEAG as well as Harpen Transport AG, the
logistics company (2001 revenue: € 67 million).
jGas: sale of the 45% interest in EMB Erdgas Mark
Brandenburg.
jReal estate not required for operating purposes:
divested about 65% of the total share envisaged
for sale with a fair value of € 750 million by the
end of 2002. We expect to be able to complete
the remaining divestitures in 2003/04. Moreover,
in the fiscal year, we decided to sell additional
residential and commercial properties valued at
€ 250 million, € 50 million of which we had
already realized in 2002.
Procurement: higher potential for pooled
purchasing
Cross-divisional purchasing management has
gained in importance substantially within the
scope of our cost-cutting program. Our acquisitions
allow us to capitalize on additional economies of
scale in procurement. To this end, we pool pur-
chase volumes and set up an internationally orient-
ed supplier management system. Fuel purchasing
harbors the most substantial potential in this area.
It is the single-largest cost position in the entire
group, accounting for over 20% of material costs.
We are buying much higher quantities of natural
gas, which we use in the heating, power gene-
ration and heat production markets, especially
owing to the takeover of the Czech gas business,
the acquisition of Innogy and the first-time
consolidation of Thyssengas. Our gas purchase
volume was approximately 15 billion cubic meters
in 2001, but had already risen to 40 billion cubic
meters by 2002. The situation on the natural gas
procurement market was characterized by the
relatively low oil prices in 2001. We will take
advantage of our improved negotiating position
when renegotiating long-term agreements with gas
producers and suppliers.
Amounts of hard coal used mainly to generate
electric power also rose considerably. Through the
acquisition of Innogy, this volume nearly doubled
from 6 million metric tons to some 12 million
metric tons. Prices paid for imported hard coal
amounted to €44 per metric ton of HCU* averaged
over the year and were thus 17% down on the year-
earlier level.
However, the fuel sector is not the only area in
which Innogy’s inclusion is noticeable. It also has
an effect on electricity procured from third parties,
which totals 106 billion kWh for the Group. Innogy
accounts for 18.8 billion kWh alone.
Our centralized purchasing system, which operates
under the RWE Systems umbrella organization, is
primarily responsible for purchasing materials and
services for our core businesses. Here, efforts
concentrate predominantly on realizing savings
potential by employing a Group-wide product line
management system, combined with a uniform
supplier strategy. Bundling procurement processes
in this manner has already proven worthwhile in
our German business. In the current financial year,
we will adopt the model in our foreign investments
as well. A pilot project in this field has already
begun, with participation from Innogy and Thames
Water.
166
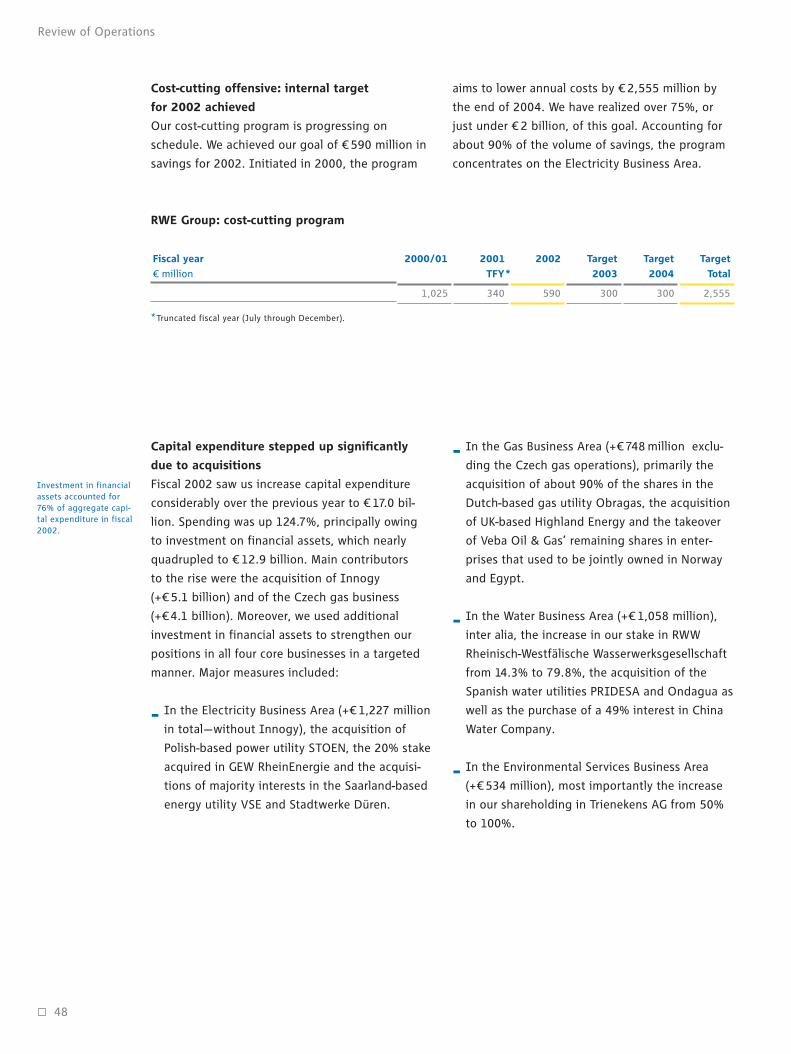
48
Capital expenditure stepped up significantly
due to acquisitions
Fiscal 2002 saw us increase capital expenditure
considerably over the previous year to € 17.0 bil-
lion. Spending was up 124.7%, principally owing
to investment on financial assets, which nearly
quadrupled to € 12.9 billion. Main contributors
to the rise were the acquisition of Innogy
(+€ 5.1 billion) and of the Czech gas business
(+€4.1 billion). Moreover, we used additional
investment in financial assets to strengthen our
positions in all four core businesses in a targeted
manner. Major measures included:
jIn the Electricity Business Area (+€ 1,227 million
in total—without Innogy), the acquisition of
Polish-based power utility STOEN, the 20% stake
acquired in GEW RheinEnergie and the acquisi-
tions of majority interests in the Saarland-based
energy utility VSE and Stadtwerke Düren.
jIn the Gas Business Area (+€ 748 million exclu-
ding the Czech gas operations), primarily the
acquisition of about 90% of the shares in the
Dutch-based gas utility Obragas, the acquisition
of UK-based Highland Energy and the takeover
of Veba Oil & Gas’ remaining shares in enter-
prises that used to be jointly owned in Norway
and Egypt.
jIn the Water Business Area (+€ 1,058 million),
inter alia, the increase in our stake in RWW
Rheinisch-Westfälische Wasserwerksgesellschaft
from 14.3% to 79.8%, the acquisition of the
Spanish water utilities PRIDESA and Ondagua as
well as the purchase of a 49% interest in China
Water Company.
jIn the Environmental Services Business Area
(+€ 534 million), most importantly the increase
in our shareholding in Trienekens AG from 50%
to 100%.
Investment in financialassets accounted for76% of aggregate capi-tal expenditure in fiscal2002.
Cost-cutting offensive: internal target
for 2002 achieved
Our cost-cutting program is progressing on
schedule. We achieved our goal of € 590 million in
savings for 2002. Initiated in 2000, the program
Review of Operations
RWE Group: cost-cutting program
aims to lower annual costs by € 2,555 million by
the end of 2004. We have realized over 75%, or
just under € 2 billion, of this goal. Accounting for
about 90% of the volume of savings, the program
concentrates on the Electricity Business Area.
3003401,025 590 2,555
Target
2003
300
Target
2004
Target
Total
Fiscal year
€ million
20022001
TFY*
2000/01
*Truncated fiscal year (July through December).
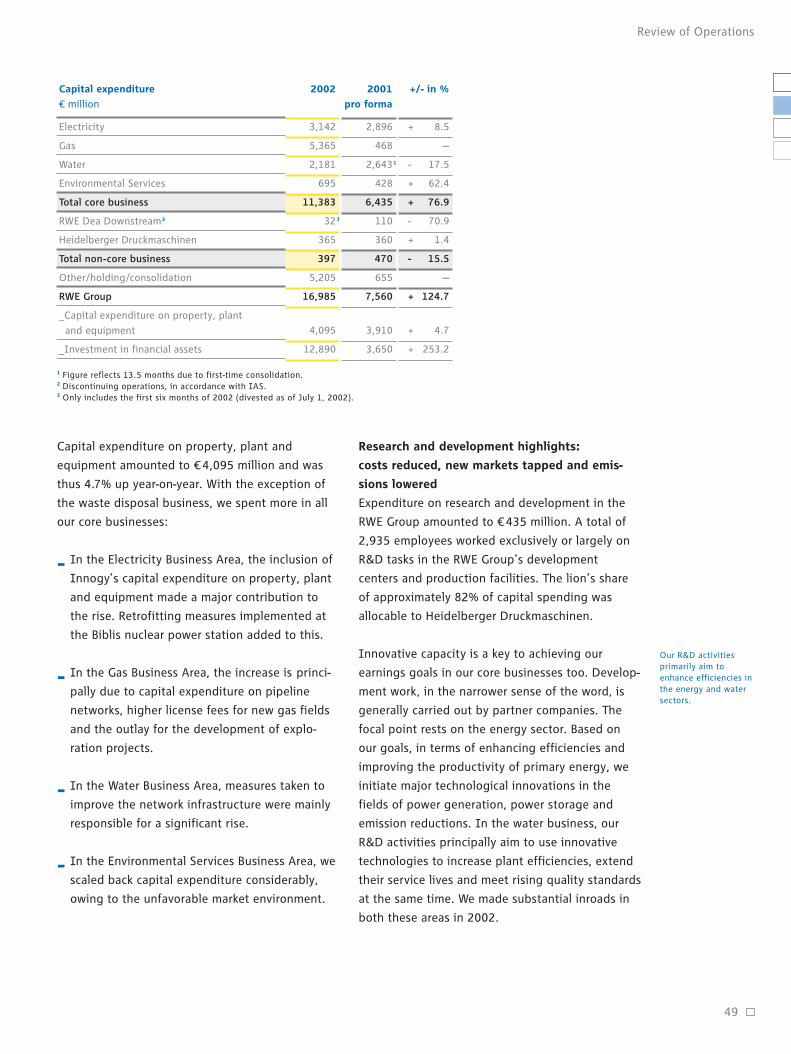
Our R&D activitiesprimarily aim toenhance efficiencies inthe energy and watersectors.
49
Review of Operations
Capital expenditure on property, plant and
equipment amounted to €4,095 million and was
thus 4.7% up year-on-year. With the exception of
the waste disposal business, we spent more in all
our core businesses:
jIn the Electricity Business Area, the inclusion of
Innogy’s capital expenditure on property, plant
and equipment made a major contribution to
the rise. Retrofitting measures implemented at
the Biblis nuclear power station added to this.
jIn the Gas Business Area, the increase is princi-
pally due to capital expenditure on pipeline
networks, higher license fees for new gas fields
and the outlay for the development of explo-
ration projects.
jIn the Water Business Area, measures taken to
improve the network infrastructure were mainly
responsible for a significant rise.
jIn the Environmental Services Business Area, we
scaled back capital expenditure considerably,
owing to the unfavorable market environment.
Electricity
Gas
Water
Environmental Services
Total core business
RWE Dea Downstream2
Heidelberger Druckmaschinen
Total non-core business
Other/holding/consolidation
RWE Group
_Capital expenditure on property, plant
and equipment
_Investment in financial assets
2,896
468
2,6431
428
6,435
110
360
470
655
7,560
3,910
3,650
3,142
5,365
2,181
695
11,383
323
365
397
5,205
16,985
4,095
12,890
+ 8.5
—
- 17.5
+ 62.4
+ 76.9
- 70.9
+ 1.4
- 15.5
—
+ 124.7
+ 4.7
+ 253.2
2001
pro forma
+/- in %Capital expenditure
€ million
2002
1 Figure reflects 13.5 months due to first-time consolidation.2 Discontinuing operations, in accordance with IAS.3 Only includes the first six months of 2002 (divested as of July 1, 2002).
Research and development highlights:
costs reduced, new markets tapped and emis-
sions lowered
Expenditure on research and development in the
RWE Group amounted to €435 million. A total of
2,935 employees worked exclusively or largely on
R&D tasks in the RWE Group’s development
centers and production facilities. The lion’s share
of approximately 82% of capital spending was
allocable to Heidelberger Druckmaschinen.
Innovative capacity is a key to achieving our
earnings goals in our core businesses too. Develop-
ment work, in the narrower sense of the word, is
generally carried out by partner companies. The
focal point rests on the energy sector. Based on
our goals, in terms of enhancing efficiencies and
improving the productivity of primary energy, we
initiate major technological innovations in the
fields of power generation, power storage and
emission reductions. In the water business, our
R&D activities principally aim to use innovative
technologies to increase plant efficiencies, extend
their service lives and meet rising quality standards
at the same time. We made substantial inroads in
both these areas in 2002.

50
jLowering CO2 emissions and improving energy
productivity in fossil fuel-based power genera-
tion is atop our list of priorities. The main key to
enhancing efficiencies to 47% and more in next-
generation steam power plants is to increase the
operating temperature significantly. We made
substantial progress in identifying, developing
and testing materials suitable for this purpose in
a test line specifically reserved for this project in
our Westfalen power station within the scope
of a project carried out with external partners.
jWe continue to direct a lot of our attention
towards fuel cells, a technology of the future.
Our involvement will help accelerate its market
launch in the field of distributed power gene-
ration. In our Essen technology center, we are
currently testing fuel cells manufactured by the
world’s leading suppliers for use in residential
and industrial applications. Performance ra-
tings range from 1 kW to 250 kW at present.
Partner companies include the DaimlerChrysler
subsidiary MTU, Siemens Westinghouse and
Sulzer Hexis.
jInnogy, our new UK subsidiary, is working on an
innovative electricity storage system dubbed
“Regenesys.” Two pilot plants each rated at
15 MW with a storage capacity of 120 MWh in
the UK and US are scheduled to take up commer-
cial operation in 2003 and 2004 respectively.
However, the technology’s economic viability
will be a decisive factor in determining whether
the project will continue to be pursued.
jThe use of membrane technology for the proces-
sing of drinking water and the cleansing of
waste-water is another focal point. The advan
tage of this technique is the small plant foot-
print, resulting in considerable space savings,
along with the possibility of significantly
reducing the use of chemicals. This will enable
us to tap additional market segments. In 2002,
we commissioned these kinds of plants in the UK
and the USA. Our development work also dealt
with the use of membrane systems in membrane
bioreactors. They allow one to use very compact
facilities for processing wastewater in urban
areas. We put this technology to use for the first
time in the US.
jMoreover, by acquiring Spanish-based PRIDESA,
we were able to expand our R&D competence in
the field of reverse osmosis for sea water desali-
nation significantly. This will allow us to enter
the sea water desalination market segment.
In April 2001, we established our “RWE Dynamics”
venture capital fund with a budget of € 50 million.
We intend to use the fund to obtain promising,
innovative technologies for our core business
areas. Case in point: new ultrafiltration membrane
technology allowed us to reduce water and waste-
water purification costs.
Risk management—an integral component
of the entire budgeting and controlling process
In light of the progressive deregulation of energy
markets and their increasing international reach,
the RWE Group is exposed to a number of risks.
To strike a good balance between profit oppor-
tunities and risks of loss in the long term, risks
must be systematically included in the decision-
making process in accordance with uniform Group
standards. To that end, we have introduced a com-
prehensive risk management system. Most impor-
tant, it fulfills the Executive Board’s reporting
duties pursuant to the German Controlling and
Transparency in the Corporate Sector Act
(KonTraG). Beyond complying with statutory
requirements, it also promotes the continued
growth of a value-based risk culture within the
RWE Group.
Continuous early detection and standardized
recording, evaluation, control and monitoring of
our risks are accomplished by the operational units
and the holding company itself. Risks are evaluated
according to their damage potential and probabi-
lity of occurrence and aggregated at the business
area, divisional and Group levels. Here a risk’s
damage potential is defined against reference
variables, i.e. the operating result and equity
capital of the business unit concerned or the Group
as a whole. We can thus ensure a systematic and
uniform analysis of our current risk situation
Review of Operations
The RWE Group’s riskmanagement systemenables the uniformanalysis of risks in allof the Group’s businessareas.

51
Review of Operations
throughout the Group, on the basis of which
specific risk-control initiatives can be developed for
the business units concerned. Our risk reporting
scheme is fully integrated in our standardized
budgeting and controlling process. The RWE
Group’s management and supervisory bodies are
regularly informed of the current risk situation.
The efficiency and efficacy of our risk management
system is monitored by an internal controlling
system and auditing teams and verified by the
external auditor.
We distinguish among the following risk
categories:
jMarket risks
The companies of the RWE Group face the price
and sales risks associated with a market environ-
ment in the throes of deregulation and subject
to intense competition. We address these risks
with differentiated pricing strategies and an
appropriate marketing policy as well as with
aggressive measures to cut costs.
In energy trading, our primary goal is to limit
earnings risks arising from price fluctuations on
energy markets. Trading offers an opportunity to
hedge future prices for energy sources as
needed, thus creating a stable foundation for
calculations. To a limited extent, trading is also
targeted to take advantage of price movements.
Here risks of loss can arise in the event of
unexpected, extreme market price fluctuations.
Credit risks can also result from our trading
activity if trading partners fail to meet their
contractual obligations. The RWE Group’s inte-
grated trading and risk management system is
firmly aligned with best practices*, as applied to
the trading business. Specific risk benchmarks
for market and credit risks are established on a
daily basis. The RWE AG Risk Committee then
sets limits that are continuously monitored.
jOperating risks
We operate technologically complex and inter-
connected production plants all along our chain
of value-creating elements. Possible operational
interruptions and production downtimes that
could impact our income are addressed through
systematic maintenance and quality control pro-
cesses, the continuous improvement of our pro-
duction processes and the employment of highly
qualified people. As appropriate, insurance
policies can also limit possible effects of damage.
jFinancial risks
Within the scope of our operations, we are also
exposed to interest-rate, currency-exchange and
price-fluctuation risks. We hedge against such
risks by using nonderivative and derivative
financial instruments, among others.
jEnvironmental risks
The constant changes in our political, legal and
social environment can pose income risks.
Considerable risks may arise in connection with
the possible introduction of a greenhouse gas
emission trading scheme in light of the high
share of lignite-fired and hard coal power
stations in our electricity generation portfolio.
We are mitigating this risk by taking measures to
lower emissions, such as modernizing our power
plants and optimizing the mix of energy sources
involved. Additional risk arise from mounting
pressure from policymakers and antitrust
authorities on Germany’s grid fees. German
antitrust authorities have begun to conduct a
comprehensive study of the country’s grid fees.
This could also affect RWE Net. However, being a
provider with relatively low costs, RWE Net plays
the role of reference company in one of these
processes. Substantial environmental risks
have arisen in connection with the German
ecological tax reform and the new statutory
regulations to promote combined heat and
power generation (CHP) and renewable energy
sources. We believe a lively dialog and contri-
buting our technical expertise are the best
methods to minimize these risks, as in the
general discussions about creating a regulatory
agency for electricity and gas.
166
52
jRegulating power and gas grids
The compromise on network regulation reached
in Brussels back in 2001 remained essentially
unchanged. Instead of having to obtain approval
for one’s grid fees as originally suggested, now
it is necessary that the method used to calculate
the fees be confirmed. This will be supplemented
by an abuse control mechanism. The procedure
is compatible with the controlled self-regulation
practiced in Germany.
jNew Gas and Electricity Association
Agreements
The Electricity II plus and Gas II Association
Agreements constitute the current framework for
this controlled self-regulation. In December
2001 and May 2002, the network operators in
the electricity and gas sectors agreed to refine
the existing regulations governing network
access and determined basic principles for the
calculation of grid fees. The amendment of the
German Energy Act required to write the asso-
ciation agreements into law, as intended, was
still outstanding when this report was finalized.
Review of Operations
Basic political conditions make it difficult for
Germany to have an attractive energy industry
Political conditions play a key role on utility
markets. This holds especially true as far as the
present competitive environment, which is charac-
terized by the suppliers’ increasing level of inter-
nationalization, is concerned. We continue to con-
front a difficult statutory environment, which poses
substantial hurdles. In that respect, the fiscal year
was marked by the following issues:
jEmissions trading
In December 2002, the European Union’s
environment ministers agreed on a draft
directive for trading greenhouse gas emission
allowances in the EU. Now the task at hand is to
firm up the agreements within the framework
of “national allocation plans,” which determine
how many emission allowances each company
or plant is accorded, as well as their mandatory
reduction goals. As long as this process is
pending, we cannot estimate the economic
impact the system may have—especially on
budgeting and investment projects.
jThe European Union’s “nuclear energy
action plan”
The European Commission submitted a draft
directive on nuclear energy, which regulates
provisions. German companies active in the
nuclear energy industry reject the proposed
introduction of a fund model for the fulfillment
of nuclear waste disposal obligations. They have
the most extensive nuclear waste disposal obli-
gations along with correspondingly higher
provisions when compared with companies in
other EU member states. Therefore, there is no
cause for the concern that obligations may not
be fulfilled. A uniform fund-based solution on a
European level would put German companies at
an added disadvantage with respect to their
competitors.

RWE AG’s net worth, financial position and
earnings situation
RWE AG does not conduct its own operating
business. Its net worth, financial position and
earnings situation are thus determined by its
management of investments and activities on
behalf of its Group companies. Shares in manage-
ment companies are held by the holding company.
RWE AG handles the financing of these manage-
ment companies. This is reflected in corresponding
accounts receivable from and payable to affiliated
companies. Provisions to cover pension commit-
ments also include cover for the vested benefits of
the energy sector’s current and former employees.
RWE AG is reimbursed for pension expenses by the
companies concerned.
In the year under review, RWE AG’s financial
position was mainly characterized by the financing
of the acquisition of Innogy through the interme-
diate holding company GBV5 as well as the
takeover of nearly the entire Czech gas industry via
RWE Gas. Being an attractive bond issuer on the
outside capital market, RWE AG placed a € 15
billion debt issuance program. It had already
successfully placed € 13.7 billion of the total issue
volume as of the balance-sheet date and another
€ 0.8 billion by January 2003. Furthermore, the
commercial paper program was expanded to over
US$5 billion. The issuance volume was € 1.7 billion.
RWE AG’s net income amounted to € 1,149 million
and was thus 41.5% up on the previous year. This
was primarily due to the significant rise in income
transferred from RWE Dea AG, after the down-
stream business was sold to Shell, and from RWE
Power AG. € 530 million of our net income were
transferred to retained earnings. As a result, the
distributable profit totaled € 619 million.
Increased dividend payout for 2002
On this basis, the Executive Board and the Super-
visory Board will propose to the May 15, 2003
Annual General Meeting that the dividend payout
be increased. According to the proposal, the
dividend is to remain unchanged at € 1.00 per
share and a bonus of € 0.10 paid in addition. This
one-time bonus is to allow our shareholders to
partake in the successful exit from the refinery and
service-station business. Based on the closing
quotations on February 28, 2003*, the dividend
distribution results in a 5.4% return on the
dividend for common shares and 5.9% for
preferred shares.
The financial statements of RWE AG, which have
been issued an unqualified audit opinion by PwC
Deutsche Revision Aktiengesellschaft Wirtschafts-
prüfungsgesellschaft, are published in the Bundes-
anzeiger (Federal Gazette) and filed with the
Commercial Register of the Essen District Court.
They can be ordered from RWE AG and are also
available on the Internet*.
RWE’s AGM will decideon the proposeddividend of € 1.00 inaddition to a bonus of€ 0.10.
53
Review of Operations
25
04
54
Review of Operations
Events after the close of the fiscal year
Successful completion of the acquisition of
American Water Works*We successfully completed the acquisition of
American Water (the company’s new name) on
January 10, 2003. American Water’s shareholders,
the US Federal Trade Commission and all of the
relevant US regulatory authorities approved the
transaction. In some states, we had to accept res-
trictions imposed by the regulatory authorities,
which primarily consist of delays to tariff adjust-
ments. This is common practice as regards take-
overs in the regulated US water business and had
been taken into consideration in the assumptions
on which we based the acquisition’s valuation. It
does not hamper operating activities in any mate-
rial way. American Water is now part of Thames
Water, our operating management company for the
Water Business Area. Thames Water’s chief execu-
tive also assumed chairmanship of the board of the
US water utility. American Water will manage all of
RWE’s water operations in North and South
America.
Harry Roels succeeds Dietmar Kuhnt at the helm
of the RWE Group
On February 1, 2003, Harry Roels took office as the
new chairman of RWE AG’s Executive Board. For a
month, the 53-year-old Dutchman initially shared
the position with Dr. Dietmar Kuhnt, who retired
his position as the Group’s President and CEO on
February 28, after more than eight years. Roels has
been the sole President and CEO of RWE AG since
March 1, 2003. His career includes more than 30
years with Royal Dutch/Shell. In 1999, Mr. Roels
joined the Executive Board of Royal Dutch Petro-
leum Company and the Royal Dutch Shell Group
where, among other things, he was responsible for
corporate planning and corporate strategy, with a
focus on gas and electricity just before leaving.
Outlook for 2003
Economic development still marked by
uncertainty
The world economy’s present weakness will place
a permanent mark on fiscal 2003. It is virtually
impossible to make accurate forecasts due to the
unstable political situation surrounding the Iraq
crisis. Signs of economic recovery are becoming
more abundant in the US, albeit still on a low
scale. However, prospects for the European Union’s
markets are much more subdued. Germany is very
likely to stay at the back of the pack. Only the
countries in central Eastern Europe have good
prerequisites for stronger growth, with the EU
accession candidates leading the way.
Consolidation tops our list of priorities
After three financial years that have been charac-
terized by external growth, in 2003, we will direct
our focus to consolidating the positions we have
obtained. We have not planned to make additional
large-scale acquisitions. Medium-sized acquisitions
must be financed through divestments. The most
urgent task at hand is to rapidly and efficiently
integrate the acquisitions into the Group. The
integration of Innogy, American Water and our
Czech gas operations is crucial when it comes to
achieving our goals in the years to come.
However, if we want to consolidate our competitive
position as one of Europe’s leading utility groups,
we must also realize the potential value in our
enlarged operating platform. Therefore, as we
integrate, we will continue to cut costs and
enhance efficiencies throughout our core busi-
nesses as well as constantly improve our earning
power. Center stage is taken by the cost-cutting
program in the electricity business, which we will
have concluded by the end of 2004, as well as
targeted earnings improvements and synergies
within the scope of the individual integration pro-
cesses. In this context, the Executive Board is pay-
ing special attention to the restructuring of the
Environmental Services Business Area. The aim is
to have it at least recover its capital costs by the
2005 fiscal year.
23
After a phase of strongexternal growth, conso-lidation, integrationand reducing net debtare our priorities.

5555
Review of Operations
Another central task in the current financial year is
to secure the RWE Group’s stable financial position.
Thanks to the high cash flows from our core busi-
nesses, which have little cyclical exposure, we fulfill
the preconditions for continuing to receive favo-
rable credit ratings compared with our peer group.
We will strengthen our financial position even
further by implementing goal-oriented measures to
reduce our net debt.
Consolidated external net sales to increase
slightly
We expect a moderate increase in external net
sales from the previous year’s €46.6 billion, princi-
pally as a result of consolidation effects. Contribu-
tions from the service-station and refinery business
will be absent on the one hand, while revenue
streams from American Water, Innogy and the
Czech gas utilities will be added on a full 12-month
basis for the first time on the other. Once again,
our electricity operations will be the focal point of
organic growth.
Core businesses will continue to record strong
earnings growth
We will record another rise in our consolidated
operating result in the current fiscal year. We anti-
cipate another double-digit increase, which will be
exclusively driven by our core businesses. The most
significant impact will be felt from the first-time
consolidation of American Water as well as the
first-time full-year inclusion of Innogy and our
Czech gas activities. The operating result genera-
ted by our electricity operations will rise further
even without taking the consolidation effects into
consideration. But we expect our non-core business’
earnings situation to deteriorate even more, owing
to the extremely adverse market conditions under
which Heidelberger Druckmaschinen operates.
Net income will fall short of the € 1,050 million
generated in 2002. We expect it to decline by 25%
to 30%. This forecast is based on the assumption
that we will not suffer from more unfavorable
currency exchange ratios, share prices or oil prices.
The expected reduction in net income reflects the
costs of external growth. Financing costs and the
amortization of goodwill from our large-scale
acquisitions will take full effect in our accounts for
the first time. Excluding goodwill amortization, net
income will roughly amount to the previous year’s
level of € 1,830 million.
Value management
We will not achieve our goal of creating € 1 billion
in absolute added value by 2003 from our core
businesses (excluding Innogy). This is due to the
dramatic worsening of the situation on the German
waste disposal market. In addition, we will include
American Water in our consolidated accounts as
early as January 1, 2003, since the acquisition was
completed ahead of schedule. As a result, the
impact of the initially negative value contribution
arising from the transaction will be felt in its
entirety. Furthermore, Thames Water will invest
more than anticipated, because of the requirements
regarding the modernization of London’s water
network. However, we believe we will be able to
factor these additional burdens into our prices from
2005 onwards.
Earnings trend by business area
Our Electricity Business Area will be the RWE
Group’s strongest earnings mainstay in 2003 as
well. We expect our electricity business to post a
low double-digit increase in its operating result,
primarily owing to the full-year inclusion of Innogy
compared with seven months in 2002. We antici-
pate that our German power operations will
continue their positive earning trend, albeit with
more moderate growth rates than a year earlier.
Additional cost reductions will form the basis for
this development. Moreover, we have already
secured our German electricity generation sales to
a considerable extent by concluding forward con-
tracts on the basis of higher prices. In addition, we
believe that prices on the German market will at
least remain stable.
The Group’s operatingresult is expected topost double-digitgrowth in 2003. This isprimarily due to con-solidation effects andour strong electricitybusiness.
Our cost-cutting pro-gram is to reduce costsby € 2.6 billion per yearby the end of 2004.
We will also be able to lift operating results in the
Gas Business Area once again. This will be made
possible by the fact that our Czech gas business
will be included in our consolidated financial state-
ments on a full, twelve-month basis for the first
time in fiscal 2003. Our Upstream Division is
expected to close the fiscal year roughly on par
with the previous one. It is virtually impossible to
make price forecasts for crude oil at present, due
to political risks. We have already secured part of
our crude oil sales volumes with forward contracts.
In light of the high prices of crude oil in the
second half of 2002, we anticipate a slight increase
in gas prices.
In the Water Business Area, we will record strong
double-digit growth in operating results primarily
due to the inclusion of American Water. As a result,
our water operations will contribute about one-
fourth of the Group’s operating result. Some 95%
of this result contribution will come from the
stable regulated businesses. However, we believe
that our new US activities will not emerge entirely
unscathed from the weak economy, despite the
fact that the regulated business benefits from
stable framework conditions. In addition, security
and insurance costs rose after the 9-11 terrorist
attacks, and planned price concessions made with-
in the scope of negotiations on the approval of the
acquisition also have to be borne. In the regulated
UK water business, we will have to contend with
the expense of improving the London network
infrastructure as mentioned earlier on. We will
counteract this with measures to enhance efficien-
cies. If the British pound and US dollar display
negative trends, we may suffer currency conversion
losses in our operating result from water activities.
However, such losses will be largely offset in in-
come before tax as those businesses have been
financed with British pounds and US dollars.
The earnings situation in the Environmental Ser-
vices Business Area continues to be marked by the
persistently difficult situation on the German waste
disposal market. On top of that, a can deposit was
introduced in Germany as of January 1, 2003, which
gives rise to additional risks. Thanks to the restruc-
turing measures initiated in the previous year, we
expect to be able to stabilize our operating result
in the current fiscal year.
The earnings contribution made by our non-core
businesses will deteriorate from our present
perspective. Heidelberger Druckmaschinen has to
contend with a dramatic decline in demand in the
printing sector. To stabilize its earnings, the world
leader in printing technology launched a far-
reaching cost-cutting program that aims for € 200
million in annual savings. Heidelberg intends to
realize a large portion of the savings in 2003.
Nevertheless, we expect this business field’s
operating result to worsen in RWE’s 2003 fiscal
year. The earnings situation at HOCHTIEF, our
investment in the construction sector which we
state at equity, i.e. based on prorated net income,
is likely to remain stable.
Cost-reduction program to be continued
We will proceed with our cost-cutting program,
focusing on the energy business as planned. By the
end of 2004, we intend to have realized some
€ 2.6 billion in savings. We plan to achieve
€ 300 million of the € 600 million in unrealized
savings in the financial year currently underway.
Future capital expenditure markedly lower
Having made above-average financial investments
in our large-scale acquisitions, we will reduce our
capital expenditure considerably in the current
fiscal year and expect spending to total about
€ 10 billion by year-end. In the previous year,
capital expenditure amounted to just under
€ 17 billion. We will invest roughly € 5 billion in
financial assets, €4.6 billion of which are ear-
marked for the acquisition of American Water. Our
capital expenditure on property, plant and equip-
ment will also amount to some € 5 billion. The
increase over the previous year is due to the first-
time full inclusion of expenditure on property,
plant and equipment by Innogy, the Czech gas
utilities and American Water.
56
Review of Operations

Reduction of net debt
We will reduce our net debt to less than € 24 billion
by the end of 2003. To this end, we plan to reduce
our capital expenditure by pursuing a restrictive
spending policy throughout the Group. Further-
more, we will divest those operations assigned to
our core businesses that do not meet our strategic
or performance requirements. Our debt-reduction
measures will be continued in 2004 and 2005. This
does not yet include the planned sale of our stakes
in Heidelberger Druckmaschinen and HOCHTIEF.
In 2003, the EBITDA-to-net interest ratio, which is
a key rating indicator for utility companies such as
RWE, will be about six and thus exceed our lower
limit of five.
Procurement costs largely stable
We expect the volume of fuel purchased in 2003 to
be stable. However, we anticipate an increase in
prices for natural gas procured from third parties
due to their link to the previous year’s high oil
prices. According to our forecasts, prices paid for
imported hard coal on world markets will show
only little fluctuation. It is likely that price
reductions may be achieved for goods and services
purchased owing, among other things, to increased
internationalization.
Employee headcount up year-on-year
due to the inclusion of American Water
In 2003, our workforce will grow as a result of
consolidations. American Water’s first-time inclu-
sion will be largely responsible for the expansion
of our labor force by some 6,500 employees.
Restructuring measures that are being implemen-
ted by Heidelberger Druckmaschinen and RWE
Umwelt as well as the planned job cuts in the
energy business will have a significant counter-
active effect.
57
Review of Operations
Forward-looking statements
This annual report contains forward-looking state-
ments regarding the future development of the
RWE Group and its companies as well as economic
and political developments. These statements are
assessments that we have made based on infor-
mation available to us at the time this document
was prepared. In the event that the underlying
assumptions do not materialize or additional risks
arise, actual performance can deviate from the per-
formance expected at present. Therefore, we
cannot assume responsibility for the correctness
of these statements.
We will graduallyreduce our net debt in2003 as well as in thefuture.
58
Integration is the top-most priority in our HRactivities.
International executive exchange program
expanded
Once again, integration work took center stage in
the field of HR management. At the same time,
internationalization has come to play a more promi-
nent role than before. RWE’s competence model
describes the increased demands placed on our
executives. Qualifications that are more frequently
sought after than in the past include the ability to
come to terms with other cultures, show respect for
different working environments, and build inter-
national networks. Our international executive
exchange program promotes intercultural know-
ledge and practical experiences equally. It offers
a wide range of possibilities, from the handling of
projects with limited timeframes to years-long
secondments to assume responsibility for sophisti-
cated tasks abroad. Since the cross-border mobility
of our employees has become a key factor for the
Group’s success, in 2002, we optimized the basic
conditions for foreign secondments even further.
Our Group-wide guideline creates a high level of
transparency. It contains rules which ensure that
performance remains competitive and that people
performing duties abroad are remunerated appro-
priately. The guideline also sees to it that such
employees receive assistance from the beginning,
in preparing for their secondments, to the end, in
reintegrating.
58
Workforce
As we extend our international reach and integrate our new companies, weplace higher demands on our human resources work. Creating a strong teamtogether with our new companies—therein lies the challenge in fiscal 2003.Our solution initiatives involve Group-wide concepts for personnel and execu-tive resource development, strategic successor planning, and performance-linked compensation.
A strong team
Management Development Program (MDP)
RWE’s Management Development Program (MDP)
prepares our managers by upgrading required
skills to enable them to take on present challen-
ges. Top management is the target group. MDP’s
overall goals are to convey knowledge on the
implementation of strategies, strengthen the exe-
cutives’ overall view of the Group, and create a
network of managers. Renowned college and uni-
versity professors, board members and executives
from the Group as well as from other companies
share their knowledge and managerial experience
with the program’s participants, thus fostering the
transfer of practices.
Systematic succession plan
Professional experience abroad and a successful
track record in various capacities in more than one
management company are key prerequisites for
the assumption of management tasks in the RWE
Group. Furthermore, through our succession plans,
we ensure that executives take over those posi-
tions in which they can best put their individual
skills and core competencies into play. This
enables us to staff vacancies adequately and
primarily from within our own ranks.

59
Workforce
Electricity
Gas
Water
Environmental Services
Core business total
Germany
International
RWE Dea Downstream
Heidelberger Druckmaschinen
Non-core business total
Others/holding
RWE Group
Germany
International
63,607
2,795
11,586
14,453
92,441
59,521
32,920
3,212
24,489
27,701
3,281
123,423
80,205
43,218
69,441
9,176
11,907
14,406
104,930
59,313
45,617
—
23,460
23,460
3,375
131,765
76,202
55,563
+ 9.2
+ 228.3
+ 2.8
- 0.3
+ 13.5
- 0.3
+ 38.6
—
- 4.2
- 15.3
+ 2.9
+ 6.8
- 5.0
+ 28.6
12/31/01 +/- in %Workforce
FTE*
12/31/02
*In full time equivalent (FTE), corresponding to the percentage of full-time employment.
HR marketing and development
With the International Graduate Program, the
Group offers an attractive 18-month entry program
for college and university graduates with above-
average qualifications in various fields. Trainees
are placed in various RWE companies and func-
tional areas for three to four months. They gain
insight into the Group’s inner workings and create
an overarching network. Supplementary training
measures refine such competencies of strategic
importance as intercultural sensitivity as well as
entrepreneurial and generalist thinking.
Long-Term Incentive Plan for executives
We launched our Long-Term Incentive Plan (LTIP)
on September 20, 2002. It will enable 1,450 exe-
cutives throughout the Group to partake in the
company’s future success. The program is based
on the issuance of stock appreciation rights
(SARs). After a two-year period of non-nego-
tiability, the SARs entitle the holders to obtain
proceeds from the increase in the shares’ price
without having to purchase RWE shares before-
hand. In line with international standards, their
exercise is subject to both relative and absolute
conditions. To take the relative hurdle, RWE’s
common share must outperform the Dow Jones
STOXX Utility Price Index on ten consecutive days.
This condition is waived if the share price* rises
by more than 20% after expiry of the waiting
period. This 20% increase is also the absolute
hurdle to being able to exercise the SARs com-
pletely. Partial SARs can be granted if the share
price increases by at least 10%. SARs are awarded
once a year.
01
Our Long Term Incen-tive Plan allows execu-tives to partake in thecompany’s futuresuccess according tostrict criteria.

The RWE Group’s work-force grew by about7% due to acquisitions.
Trainee positions again exceed own needs
As of December 31, 2002, 5,034 young people
were in vocational training at RWE, 4,434 of which
were in Germany. Thus, as in prior years, we have
provided capacities far exceeding our own
requirements. Besides the “classical” training
careers, dual training with a combined degree
course is proving increasingly popular among high
school graduates. In close cooperation with
colleges and academies, we are creating attractive
alternatives to a university course, while avoiding
bottlenecks among qualified recruits.
Further information on human resources
management is provided in the current RWE
Human Resources Report.*
60
Workforce
05
Headcount rises owing to expansion of scope
of consolidation
The RWE Group employed 131,765 people as of
December 31, 2002. This represents a 6.8%
increase year-on-year. Company acquisitions and
divestments led to a net addition of 14,710 staff
members. Operating personnel changes made
6,368 positions redundant, 2,174 of which were in
Germany. Personnel figures are based on FTE (full
time equivalent). Each staff member is recorded to
reflect his or her percentage of full-time
employment.
Transfer company opens up new possibilities
In implementing necessary socially-acceptable
redundancy schemes, last year, the RWE Group
started offering RWE Net, RWE Plus, RWE Power
and RWE Rheinbraun employees a new option,
which is supported by the country’s labor policy:
the use of a transfer company. This enables us to
continue optimizing our personnel reduction, while
affording affected staff members the opportunity
to acquire additional qualifications and refocus
their careers.

RWE’s philanthropicwork is extremelyvaried, manifestingitself in a youth foun-dation, the UNICEFchildren’s fund anddrinking water projectsin underdevelopedcountries.
61
Corporate Citizenship
Social sponsorship
The RWE Youth Foundation was established in
1998. It supports some 20 projects every year,
which promote professional qualification, social
integration and public willingness to act in a social
context. Initiatives promoted by the foundation
run the gamut from AIDS prevention to the Center
for Nature and the Environment.
We have been committed to UNICEF, the United
Nations’ children’s fund, since 1992. Our main
ambition in this engagement is to champion the
fund’s goals, which involve safeguarding children’s
lives, fostering their education and development,
and protecting them against abuse and violence.
In addition, we host the UNICEF gala soiree, an
important cultural event that is broadcast on
television and promotes the interests of the chil-
dren’s fund in its own right.
We have implemented far-reaching educational and
social programs in the Czech Republic, which play
to their strengths especially in communities and
areas with very limited financial resources. Projects
range from reforestation to the full equipment of
an eye clinic.
The WaterAid initiative, launched by our subsidiary
Thames Water, gives people living in underdeve-
loped regions access to drinking water. Some
250,000 people have benefited from this project
thus far. Thames Water, its employees and its
customers donated substantial amounts of money
to this cause. Here again, the aim is to provide
some stimuli to adopt novel approaches to pro-
moting sustainability—in much the same way as we
are doing in our core businesses.
Cultural sponsorship
We have been in close cooperation with the
Folkwang Museum in Essen since 1999. Our
sponsorship in this field is mainly focused on
contemporary art after 1945. This opens up new
room for innovative thinking and creativity.
The highly renowned Ruhr Piano Festival will take
place for the fifteenth time in 2003. In our role as
sponsor, we help enable the realization of perfor-
mances of world-famous musicians such as Martha
Argerich, Alfred Brendel and MaurizioPollini.
We also promote cultural activities on an inter-
national level. For example, the RWE Dea Norway
Music Foundation is dedicated to intercultural
exchange. Furthermore, we struck a partnership
with the Czech Republic’s biggest stage—the
Prague National Theater. Also among the initiatives
we support are the Karlovy Vary International Film
Festival in the Czech Republic as well as the Clas-
sical Extravaganza concert event in Great Britain.
Responsible action
Commercial success is not the only benchmark of performance. Instead, it isequally reflected in social engagement and the assumption of responsibilityvis-à-vis society. We take the role we play as service provider in our societyseriously, because we believe it is linked to the service we render it. And, asa company with international operations, it is a matter of course for us to actas good corporate citizens, no matter what corner of the earth we may be in.

Sport sponsorship
In the field of sports, we are the long-term official
partner of the Czech Paralympic Team. Via our sub-
sidiary Transgas, we provide assistance in the pre-
paration of more than 17,000 disabled athletes,
who often achieve great success—both in winter
sports as well as in track and field. The same goes
for the Czech Olympic Team. As partner to the
team, we managed to increase the public’s
awareness of RWE.
Our subsidiary Innogy promotes the British Test
Cricket Series as main sponsor. The sponsoring
contract has a term of three years and has sig-
nificantly raised the profile of Innogy and its
npower brand.
We are also the main sponsor of Bayer Leverkusen,
the German Bundesliga soccer team. RWE’s
umbrella brand is thus the main visual theme in
Leverkusen’s BayArena, while the RWE logo adorns
the players’ jerseys. More than anything else, our
involvement in this field underscores RWE’s com-
mitment to innovation, performance, team spirit,
customer proximity and progressiveness.
62
Corporate Citizenship
We entertain a partnership with sports at a
regional level too. For example, the Rot-Weiss
Essen soccer club, situated in RWE’s home town,
depicts the RWE logo on its jerseys.
Sport sponsorship has clearly given RWE a higher
profile on both national and international levels.
It has become an integral component of our
nationwide, integrated brand communication
activities, making our involvement a win-win pro-
position for everyone involved.
In the sports arena,RWE supports theCzech Paralympic Teamas well as cricket andsoccer in Great Britainand Germany.

RWE helps achieveGermany’s climate con-servation goalsespecially through itsuse of emission avoi-dance technologies.
6363
Environmental Protection
Environmental protection—investing in
the future
In the 2002 fiscal year, we spent a total of €416
million on environmental protection initiatives.
Preventive and emission avoidance activities conti-
nued to gain priority vis-à-vis remedial measures.
Focus on climate conservation
Climate conservation again topped our list of
environmental topics. Having lowered greenhouse
gas emissions by almost 19% between 1990 and
2000, Germany, alongside Great Britain, leads the
way in Europe in the field of climate conservation.
It is thus likely that Germany will be able to hit its
21% reduction target by 2012. German industry’s
self-imposed obligation and the commitment made
by the energy sector to attempt to scale back CO2
emissions by 45 million metric tons per year are of
major assistance in this endeavor. RWE is also
making a significant contribution to this cause. Our
wide range of expertise enables us to use cutting-
edge technologies to lower CO2 emissions. This is
exemplified by the gas and steam cogeneration
plants using combined heat and power technology
that we put to use for our industrial customers as
well as our new 1,000 megawatt lignite power
plant in Niederaussem, which we commissioned in
September 2002. It will replace six old units and is
30% more efficient than the technology it replaces.
CO2 emissions can be reduced by 30%, or up to 3
million metric tons per year with this new plant
alone. A second power station of this series is in
the pipeline and may go live as early as 2008.
However, this will only be possible if the investment
project’s economic viability is not jeopardized by
changes in framework conditions, e.g. as a result of
the national implementation of the impending
emission allowance trading system envisioned by
the EU and its members states.
But as far as climate policy is concerned, the
intended phase-out of nuclear energy will have a
counter-productive effect, as it will abolish a form
of CO2-free power generation. Lawmakers have
been unclear to date as to how these quantities of
electricity are to be substituted. It is imperative
that additional emissions caused by this be taken
into account in the national allocation plan for
emission allowances to keep them from having a
negative impact on the emission balance sheets of
companies active in the field of nuclear energy.
Sustainability—an integral component of our corporate strategy
Electricity, gas, water and environmental services are our core businesses, all of which are products that are extremely important in day-to-day life.Conserving nature’s resources and the world’s climate are key challenges inthis field. After all, sustainable economizing will serve future generations andis at once one of the cornerstones of RWE’s long-term success on the market.

Renewables-basedelectricity generationcapacities were signifi-cantly expanded byinvesting in Europe andthrough Innogy’s ope-rations.
64
Environmental Protection
Renewable energies: it’s all about choosing
the right location
As long as they are profitable in the long term,
renewables-based energies are a wise way to
supplement our power generation portfolio. With a
current combined installed capacity of just under
1,100 MW, we increased our capacity to produce
electric power from renewable sources by some
25% compared with the previous year. Investments
made in European countries outside Germany
helped strengthen our position even further in
2002. Thanks to Harpen AG’s acquisition of
Spanish-based AERSA, we now rank among the lar-
gest wind power station operators in the Medi-
terranean region, which has the best prospects for
growth in wind power generation in Europe at
present. We have grouped our Continental Euro-
pean renewable energy operations and placed
them under the supervision of Harpen AG. Innogy,
our new UK subsidiary, is one of the leading provi-
ders of wind energy on its domestic market. Our
overall goal is to double the installed capacity for
electricity we generate from hydro, wind, biomass
and solar energy to about 2,000 MW by 2010. In
so doing, we will see to it that installed plants
meet the same strict efficiency standards as our
conventional power stations do, with a view to
making them a sustainable option and ensuring
that they remain profitable and give us a healthy
environmental balance sheet. Furthermore, by
establishing the RWE Schott Solar joint venture
company, we fortified our position on the growth
market for solar technology even further. The joint
venture is No. 1 in Europe and operates the world’s
most modern solar technology factory in Alzenau.
Once it has been completed, the € 150 million
investment project is to produce photovoltaic
components for a 60 MW power generation facility
from 2005 onwards.
2001*Expenditure on
environmental protection
RWE Group
2002
50%
27%
15%
6%
2%
0%
€ 322
Landscape conservation
Air-pollution prevention
Water conservation
Waste disposal
Noise abatement
Restoration of
contaminated sites
Total in millions
29%
34%
21%
13%
2%
1%
€ 416
* Truncated fiscal year (July through December).

65
Environmental Protection
Involvement in international projects
In addition to implementing our own climate con-
servation measures and participating in national
initiatives, we also support international action
plans aiming to achieve the Kyoto goals. Examples
include:
jour involvement in activities in countries such
as Latvia, Chile and Uganda within the scope of
World Bank’s “Prototype Carbon Fund*,”
jour support of measures contained in the E7
initiative*, e.g. for the use of renewable energies
in Indonesia, Bolivia and the Galapagos Islands,
and
jour contribution to a project that is recognized
as a climate conservation measure, involving the
construction of a highly efficient gas-fired power
plant to replace an outdated lignite power
station in one of the VW Group’s Czech
automobile factories.
Environmental protection concept
on a wide base
Some 35 certified RWE locations around the globe
are proof of the fact that we have begun walking
down a path to success, not only to conserve our
climate, and not only in Germany. Case in point:
our sustainable water business. Our know-how,
combined with the far-reaching investments
undertaken by Thames Water to increase quality
have made a substantial contribution to turning
the Thames, which is situated in the company’s
legacy supply area, into the cleanest and most
biodiverse river in the world that runs through a
metropolis. Moreover, Thames Water adheres to
the same environmental standards wherever it
goes to work around the globe. This is evidenced
by the ISO 14001 certifications obtained in Turkey
and China.
Second case in point: Innogy. High environmental
protection standards are nothing new to our British
energy enterprise either. Besides taking measures
to continue developing renewables-based energies
and constantly lower emissions caused by power
generation, Innogy also expends a great deal of
energy to guarantee that endangered species are
protected in its power stations’ surroundings.
RWE again included in the Dow Jones
Sustainability Index
Our commitment has been honored once again.
RWE was included in the Dow Jones Sustainability
Indices DJSI World and DJSI STOXX for the third
straight year. These indices consist of 10% of the
companies that have top rankings in their sectors
based on economic, ecological and social criteria.
RWE’s detailed environmental reporting* is also
highly regarded.
06
Once again, RWE meetsthe strict criteria of theDow Jones Sustain-ability Index.
Sustainable wateroperations are anotherfocal point of ourenvironmental pro-tection measures.
166
167

66
Business Areas
Business Areas
68_Electricity
80_Gas
88_Water
94_Environmental Services
98_Non-Core Businesses
66–101

67
Business Areas
Business Areas

68
Electricity
»You can achieve a lot alone. But, in a team, the possibilities are infinite.«Laura Webb, npower Integration Manager, Innogy
Her task as a member of the “Best Practice Team“ is to coordinate theintegration of npower into the RWE Group. Webb compares RWE Plus’and npower’s sales structures, identifies synergies, and providesassistance in realizing ideas and innovations on their respective markets.
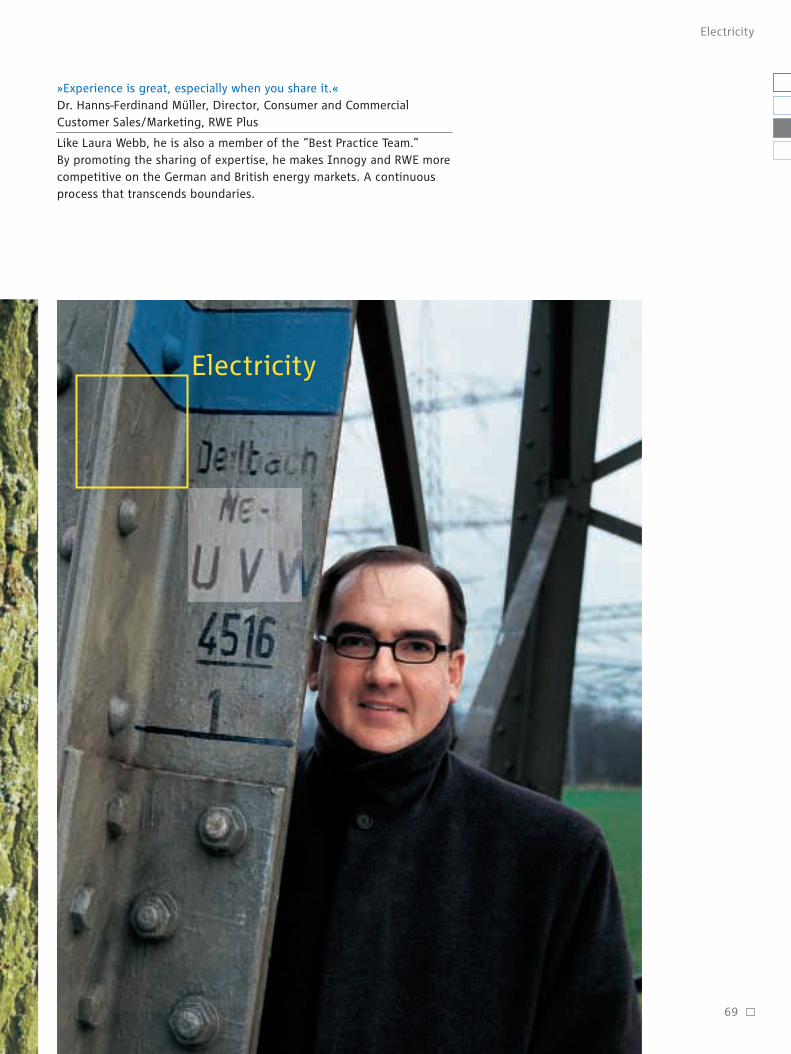
69
Electricity
»Experience is great, especially when you share it.«Dr. Hanns-Ferdinand Müller, Director, Consumer and CommercialCustomer Sales/Marketing, RWE Plus
Like Laura Webb, he is also a member of the “Best Practice Team.”By promoting the sharing of expertise, he makes Innogy and RWE morecompetitive on the German and British energy markets. A continuousprocess that transcends boundaries.
Electricity

German wholesaleelectricity pricescontinued to rise.Electricity consumptionand generation wereessentially unchanged.
Germany: stagnant electricity consumption
Germany’s primary energy consumption was 2%
down year-on-year due to the mild weather and the
weak economy. Electricity consumption was
roughly on par with the previous year since energy-
intensive base material industries stepped up pro-
duction in the second half of the year. This was
especially true for the chemical sector. Power
generation was also essentially unchanged.
Wholesale electricity prices continued to recover in
2002. One-year forward prices* for electricity deli-
veries in 2003 averaged € 23.73 per megawatt
hour of base-load power*and were thus 5.2%
higher than the previous year’s figure. The average
price for the same type of future contract for peak-
load power*rose by 9.7% to € 34.53. Electricity
became more expensive in the end consumer
business too, principally due to higher wholesale
prices as well as the repeated increase in burdens
suffered from the electricity tax and the laws for
the promotion of renewables-based energies and
for combined heat and power generation. RWE Plus
raised prices for standard-rate customers by about
5% as of January 1, 2002.
German household customers still reluctant to
switch providers
Germany’s electricity market was marked by fierce
competition in the key account business in 2002 as
well. About one-third of the industrial customer
base has switched providers since the market was
deregulated. However, private and commercial
customers still showed little willingness to switch.
After all, nearly 30% of all households and some
50% of all commercial customers agreed with their
existing providers to make their contractual terms
more favorable. Suppliers were even more
reluctant to enter into agreements with extremely
aggressive prices below cost. An increasing trend
towards establishing prices based on quotations
on power exchanges has become apparent.
70
Electricity
Electricity business continues on course for success
The upward trend in our German electricity business is persisting. Welowered costs even further and adhered to our margin-oriented sales policywith resolve. Furthermore, we benefited from the continued recovery inelectricity prices. Our acquisition of the British electric and gas utility Innogyhas given us a strong position on Europe’s third-largest energy market. Onthe whole, we improved our operating result by 53%. Electricity operationsthus contributed more than 60% of the Group’s operating result.
166
166
167
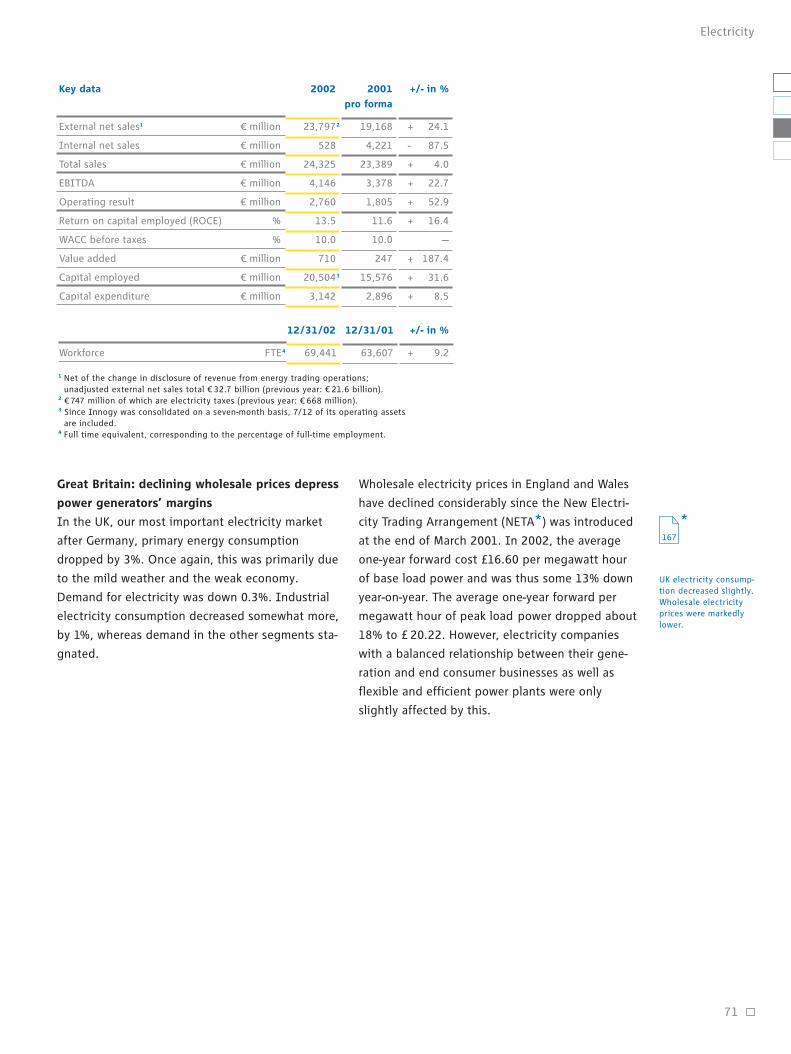
Great Britain: declining wholesale prices depress
power generators’ margins
In the UK, our most important electricity market
after Germany, primary energy consumption
dropped by 3%. Once again, this was primarily due
to the mild weather and the weak economy.
Demand for electricity was down 0.3%. Industrial
electricity consumption decreased somewhat more,
by 1%, whereas demand in the other segments sta-
gnated.
Wholesale electricity prices in England and Wales
have declined considerably since the New Electri-
city Trading Arrangement (NETA*) was introduced
at the end of March 2001. In 2002, the average
one-year forward cost £16.60 per megawatt hour
of base load power and was thus some 13% down
year-on-year. The average one-year forward per
megawatt hour of peak load power dropped about
18% to £ 20.22. However, electricity companies
with a balanced relationship between their gene-
ration and end consumer businesses as well as
flexible and efficient power plants were only
slightly affected by this.
UK electricity consump-tion decreased slightly.Wholesale electricityprices were markedlylower.
71
Electricity
External net sales1
Internal net sales
Total sales
EBITDA
Operating result
Return on capital employed (ROCE)
WACC before taxes
Value added
Capital employed
Capital expenditure
Workforce
19,168
4,221
23,389
3,378
1,805
11.6
10.0
247
15,576
2,896
23,7972
528
24,325
4,146
2,760
13.5
10.0
710
20,5043
3,142
69,441 63,607 + 9.2
€ million
€ million
€ million
€ million
€ million
%
%
€ million
€ million
€ million
FTE4
+ 24.1
- 87.5
+ 4.0
+ 22.7
+ 52.9
+ 16.4
—
+ 187.4
+ 31.6
+ 8.5
2001
pro forma
12/31/01 +/- in %12/31/02
+/- in %Key data 2002
1 Net of the change in disclosure of revenue from energy trading operations; unadjusted external net sales total € 32.7 billion (previous year: € 21.6 billion).
2 € 747 million of which are electricity taxes (previous year: € 668 million).3 Since Innogy was consolidated on a seven-month basis, 7/12 of its operating assets
are included.4 Full time equivalent, corresponding to the percentage of full-time employment.
167
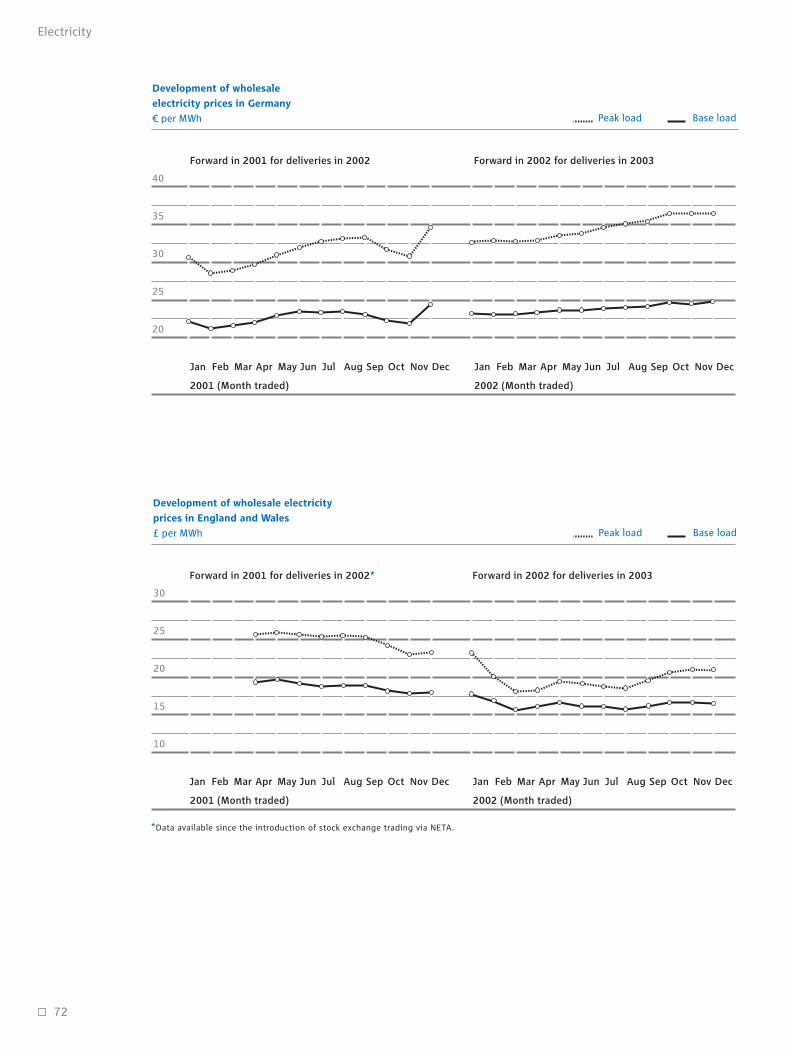
72
Electricity
Development of wholesale
electricity prices in Germany
€ per MWh
40
35
30
25
20
2002 (Month traded)2001 (Month traded)
Jan Feb Mar Apr May Jun Jul Aug Sep Oct Nov Dec Jan Feb Mar Apr May Jun Jul Aug Sep Oct Nov Dec
Forward in 2002 for deliveries in 2003Forward in 2001 for deliveries in 2002
Peak load Base load
Development of wholesale electricity
prices in England and Wales
£ per MWh Peak load
30
25
20
15
10
2002 (Month traded)
Base load
2001 (Month traded)
Jan Feb Mar Apr May Jun Jul Aug Sep Oct Nov Dec Jan Feb Mar Apr May Jun Jul Aug Sep Oct Nov Dec
Forward in 2002 for deliveries in 2003Forward in 2001 for deliveries in 2002*
*Data available since the introduction of stock exchange trading via NETA.
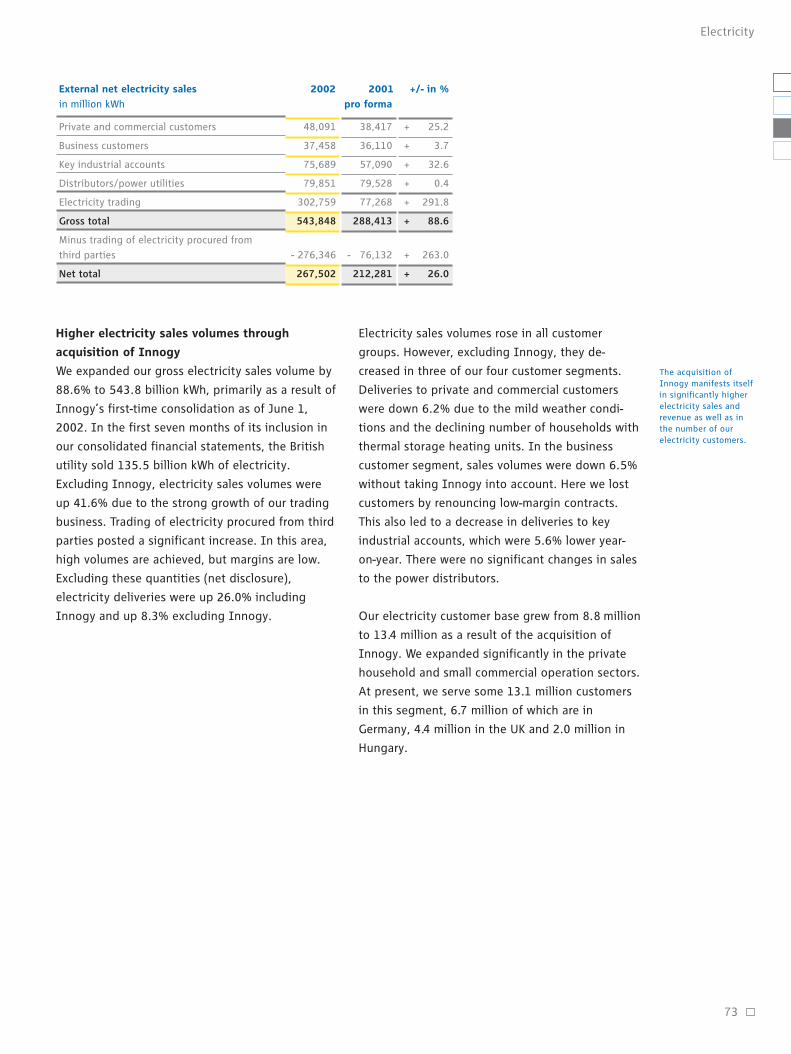
Higher electricity sales volumes through
acquisition of Innogy
We expanded our gross electricity sales volume by
88.6% to 543.8 billion kWh, primarily as a result of
Innogy’s first-time consolidation as of June 1,
2002. In the first seven months of its inclusion in
our consolidated financial statements, the British
utility sold 135.5 billion kWh of electricity.
Excluding Innogy, electricity sales volumes were
up 41.6% due to the strong growth of our trading
business. Trading of electricity procured from third
parties posted a significant increase. In this area,
high volumes are achieved, but margins are low.
Excluding these quantities (net disclosure),
electricity deliveries were up 26.0% including
Innogy and up 8.3% excluding Innogy.
Electricity sales volumes rose in all customer
groups. However, excluding Innogy, they de-
creased in three of our four customer segments.
Deliveries to private and commercial customers
were down 6.2% due to the mild weather condi-
tions and the declining number of households with
thermal storage heating units. In the business
customer segment, sales volumes were down 6.5%
without taking Innogy into account. Here we lost
customers by renouncing low-margin contracts.
This also led to a decrease in deliveries to key
industrial accounts, which were 5.6% lower year-
on-year. There were no significant changes in sales
to the power distributors.
Our electricity customer base grew from 8.8 million
to 13.4 million as a result of the acquisition of
Innogy. We expanded significantly in the private
household and small commercial operation sectors.
At present, we serve some 13.1 million customers
in this segment, 6.7 million of which are in
Germany, 4.4 million in the UK and 2.0 million in
Hungary.
The acquisition ofInnogy manifests itselfin significantly higherelectricity sales andrevenue as well as inthe number of ourelectricity customers.
73
Electricity
Private and commercial customers
Business customers
Key industrial accounts
Distributors/power utilities
Electricity trading
Gross total
Minus trading of electricity procured from
third parties
Net total
38,417
36,110
57,090
79,528
77,268
288,413
- 76,132
212,281
48,091
37,458
75,689
79,851
302,759
543,848
- 276,346
267,502
+ 25.2
+ 3.7
+ 32.6
+ 0.4
+ 291.8
+ 88.6
+ 263.0
+ 26.0
2001
pro forma
+/- in %External net electricity sales
in million kWh
2002
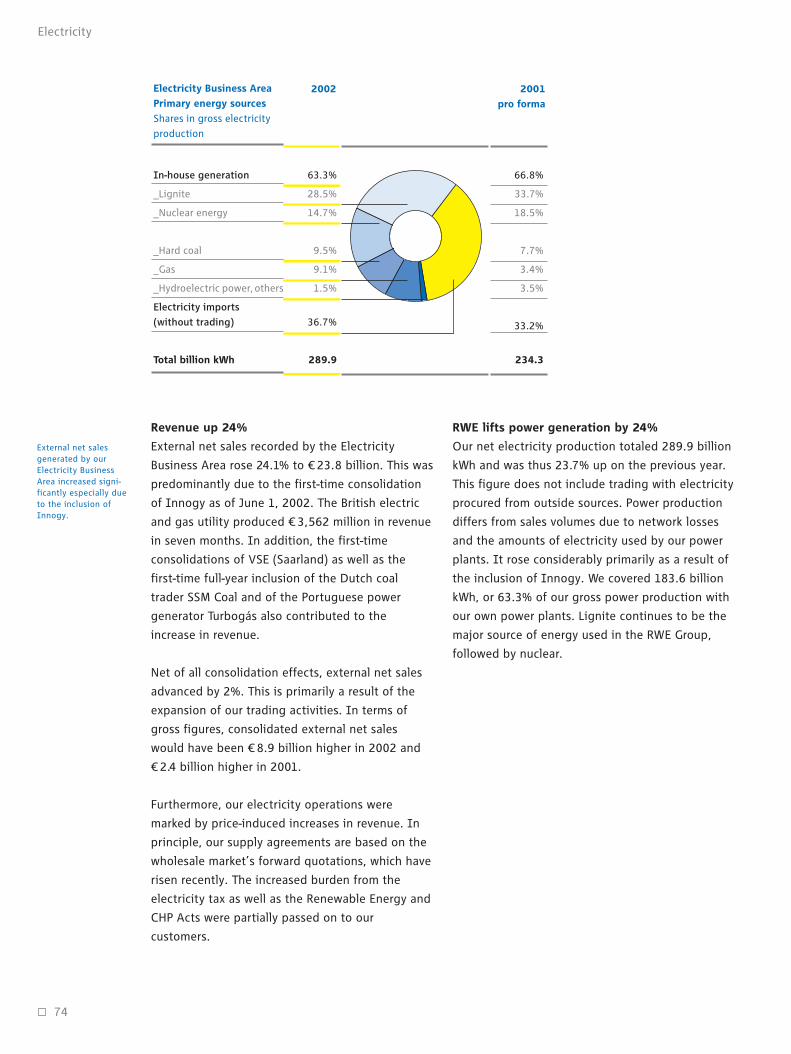
2001
pro forma
Electricity Business Area
Primary energy sources
Shares in gross electricity
production
2002
66.8%
33.7%
18.5%
7.7%
3.4%
3.5%
33.2%
234.3
In-house generation
_Lignite
_Nuclear energy
_Hard coal
_Gas
_Hydroelectric power, others
Electricity imports
(without trading)
Total billion kWh
63.3%
28.5%
14.7%
9.5%
9.1%
1.5%
36.7%
289.9
External net salesgenerated by ourElectricity BusinessArea increased signi-ficantly especially dueto the inclusion ofInnogy.
Revenue up 24%
External net sales recorded by the Electricity
Business Area rose 24.1% to € 23.8 billion. This was
predominantly due to the first-time consolidation
of Innogy as of June 1, 2002. The British electric
and gas utility produced € 3,562 million in revenue
in seven months. In addition, the first-time
consolidations of VSE (Saarland) as well as the
first-time full-year inclusion of the Dutch coal
trader SSM Coal and of the Portuguese power
generator Turbogás also contributed to the
increase in revenue.
Net of all consolidation effects, external net sales
advanced by 2%. This is primarily a result of the
expansion of our trading activities. In terms of
gross figures, consolidated external net sales
would have been € 8.9 billion higher in 2002 and
€ 2.4 billion higher in 2001.
Furthermore, our electricity operations were
marked by price-induced increases in revenue. In
principle, our supply agreements are based on the
wholesale market’s forward quotations, which have
risen recently. The increased burden from the
electricity tax as well as the Renewable Energy and
CHP Acts were partially passed on to our
customers.
RWE lifts power generation by 24%
Our net electricity production totaled 289.9 billion
kWh and was thus 23.7% up on the previous year.
This figure does not include trading with electricity
procured from outside sources. Power production
differs from sales volumes due to network losses
and the amounts of electricity used by our power
plants. It rose considerably primarily as a result of
the inclusion of Innogy. We covered 183.6 billion
kWh, or 63.3% of our gross power production with
our own power plants. Lignite continues to be the
major source of energy used in the RWE Group,
followed by nuclear.
74
Electricity
Operating result boosted by more than 50%
EBITDA generated by the Electricity Business Area
jumped 22.7% to €4,146 million. We recorded an
even steeper climb in the operating result. It rose
to € 2,760 million, eclipsing the previous year’s
figure by more than 50%. This considerable in-
crease is due to the fact that we recorded a compa-
ratively low figure in the previous year, owing to
factors that had a negative effect on the operating
result, but not on EBITDA. They principally con-
sisted of high write-downs on the Mülheim-Kärlich
nuclear power station in the Power Generation
Division and a test facility in the Lignite-Fired
Power Generation and Mining Division.
Earnings growth in the electricity business stems
from external growth and especially from the
acquisition of Innogy. However, we lifted the
operating result by 31.9% even without accounting
for this consolidation effect. This was made
possible by the upward trend in our German power
operations. They reflected our successful cost-
cutting and margin-oriented sales policy. Further-
more, electricity prices continued to recover.
Without taking the decline in earnings of our US
hard coal and gas producer CONSOL Energy into
consideration, the Electricity Business Area would
have posted a significantly higher operating result.
Our US subsidiary had to contend with a consi-
derable decline in earnings as a result of the
weather- and cyclically-induced lower demand for
hard coal as well as the substantial decline in gas
prices. Its operating result decreased by € 142
million to € 251 million. Absolute value added by
the Electricity Business Area nearly tripled to € 710
million despite CONSOL Energy’s weak earnings
situation and Innogy’s first-time consolidation.
Development of the individual divisions’
operating results
Power Generation
The Power Generation Division boosted EBITDA by
72.0% to € 855 million. Its operating result rose
more than five-fold, rising to € 629 million. This
was primarily due to cost reductions and the in-
crease of our internal electricity settlement prices
to levels existing on wholesale markets. In addi-
tion, revenue from the provision of balancing
power*rose considerably. Balancing power is used
to compensate for unpredictable fluctuations in
power fed into and taken our of the live grid at
short notice. The increased need for balancing
power is partially due to the fact that wind energy’s
share of the power generation mix in Germany is
growing. Furthermore, the quality of electricity
demand forecasts has deteriorated. This is due to
the significant increase in the number of com-
panies feeding electricity into and taking electri-
city out of the live grid.
Lignite-Fired Power Generation and Mining
Despite the fact that CONSOL’s earning situation
deteriorated substantially, the Lignite-Fired Power
Generation and Mining Division improved its
EBITDA by 18.0% to € 1,108 million. Its operating
result climbed 47.2% to € 521 million. Here too,
growth was primarily due to cost reductions and
the adjustment of internal electricity settlement
prices to wholesale market levels.
Cost discipline andreturn-orientation payoff: our Germanelectricity operations’earnings situation post-ed another strongimprovement.
75
Electricity
166
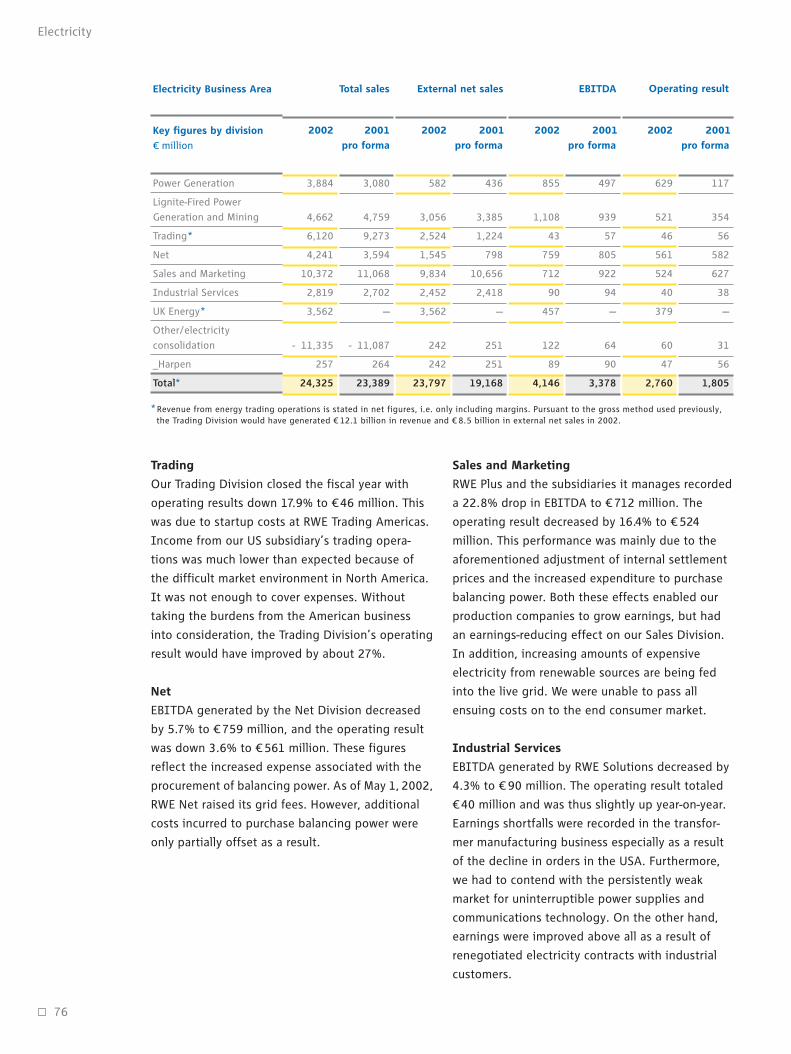
Trading
Our Trading Division closed the fiscal year with
operating results down 17.9% to €46 million. This
was due to startup costs at RWE Trading Americas.
Income from our US subsidiary’s trading opera-
tions was much lower than expected because of
the difficult market environment in North America.
It was not enough to cover expenses. Without
taking the burdens from the American business
into consideration, the Trading Division’s operating
result would have improved by about 27%.
Net
EBITDA generated by the Net Division decreased
by 5.7% to € 759 million, and the operating result
was down 3.6% to € 561 million. These figures
reflect the increased expense associated with the
procurement of balancing power. As of May 1, 2002,
RWE Net raised its grid fees. However, additional
costs incurred to purchase balancing power were
only partially offset as a result.
Sales and Marketing
RWE Plus and the subsidiaries it manages recorded
a 22.8% drop in EBITDA to € 712 million. The
operating result decreased by 16.4% to € 524
million. This performance was mainly due to the
aforementioned adjustment of internal settlement
prices and the increased expenditure to purchase
balancing power. Both these effects enabled our
production companies to grow earnings, but had
an earnings-reducing effect on our Sales Division.
In addition, increasing amounts of expensive
electricity from renewable sources are being fed
into the live grid. We were unable to pass all
ensuing costs on to the end consumer market.
Industrial Services
EBITDA generated by RWE Solutions decreased by
4.3% to € 90 million. The operating result totaled
€40 million and was thus slightly up year-on-year.
Earnings shortfalls were recorded in the transfor-
mer manufacturing business especially as a result
of the decline in orders in the USA. Furthermore,
we had to contend with the persistently weak
market for uninterruptible power supplies and
communications technology. On the other hand,
earnings were improved above all as a result of
renegotiated electricity contracts with industrial
customers.
76
Electricity
3,884
4,662
6,120
4,241
10,372
2,819
3,562
- 11,335
257
24,325
3,080
4,759
9,273
3,594
11,068
2,702
—
- 11,087
264
23,389
117
354
56
582
627
38
—
31
56
1,805
629
521
46
561
524
40
379
60
47
2,760
497
939
57
805
922
94
—
64
90
3,378
855
1,108
43
759
712
90
457
122
89
4,146
Power Generation
Lignite-Fired Power
Generation and Mining
Trading*
Net
Sales and Marketing
Industrial Services
UK Energy*
Other/electricity
consolidation
_Harpen
Total*
436
3,385
1,224
798
10,656
2,418
—
251
251
19,168
Electricity Business Area Total sales Operating result
2002 2001
pro forma
EBITDA
2002 2001
pro forma
2001
pro forma
External net sales
20022001
pro forma
2002Key figures by division
€ million
*Revenue from energy trading operations is stated in net figures, i.e. only including margins. Pursuant to the gross method used previously, the Trading Division would have generated € 12.1 billion in revenue and € 8.5 billion in external net sales in 2002.
582
3,056
2,524
1,545
9,834
2,452
3,562
242
242
23,797
UK Energy
Innogy, the electric and gas utility that was con-
solidated for the first time as of June 1, 2002, is
the operating management company for our newly
established UK Energy Division. On a seven-month
basis, the company contributed € 379 million in
operating results. In light of the collapse of UK
electricity wholesale prices, this is an encouraging
performance. Thanks to its strong presence on the
end customer market and its flexible, efficient
power plant portfolio, Innogy was able to offset
declines in income in the power plant business
with sales.
Other (incl.Harpen)/electricity consolidation
The Harpen Group, which is stated under this line
item, saw EBITDA decrease by 1.1% to € 89 mil-
lion. The operating result amounted to €47 million
and was thus 16.0% lower than in the previous
year. This decline was due to the fact that we shed
the Toman Group and the car wash operator IMO
Deutschland at the end of 2001 and divested
Harpen’s logistics operations as of April 30, 2002.
Cost-cutting offensive on target
Our cost-cutting program* is one of the key rea-
sons for our electricity operations’ success. In
the financial year being reviewed, we achieved
€450 million in savings, as planned. Cost reduc-
tions were also realized through personnel-related
measures. From December 31, 1999, to December
31, 2002, we trimmed our electricity companies’
labor forces by some 6,850 positions in a socially
acceptable manner. Our cost-cutting program
also entails shutting down unprofitable power
stations. By the end of 2001, we had already taken
3,000 megawatts offline. However, no further
capacities were decommissioned in the reporting
period since demand for balancing power is rising
steadily. Therefore, to generate peak-load power,
RWE Power has gone back to using gas blocks that
had originally been on the decommissioning list.
In light of the current level of electricity prices
and thanks to the cost reductions already achieved,
these facilities can be operated at a profit.
Therefore, we will continue running them for the
time being.
Capital expenditure 8.5% up on previous year
In the Electricity Business Area, we spent € 3,142
million, or 8.5% more than a year earlier. Innogy’s
inclusion made a major contribution to this
increase. Capital expenditure on property, plant
and equipment was up 6.5% to € 1,915 million.
This was predominantly due to the inclusion of
Innogy. Power plant construction was one of the
investment magnets. In the year under review, we
completed our 1,000-MW lignite block with
optimized plant technology in Niederaussem. The
installation went online in September, following
four years of construction. This gives us the world’s
most modern lignite-fired power station. Since we
improved lignite energy yield by 30%, the power
plant makes a substantial contribution to
enhancing efficiencies and avoiding emissions.
Investment in financial assets rose 11.7% to
€ 1,227 million, principally due to our acquisition
of the Polish-based power utility STOEN. In addi-
tion, we increased our shares in Saarland-based
VSE to 69.33% and in Stadtwerke Düren to 74.95%.
Furthermore, we acquired a 20% stake in GEW
RheinEnergie under which we have grouped our
electricity, gas and water activities for the
Cologne/Bonn conurbation.
In 2002, we completedthe world’s largest andmost modern lignitepower plant.
77
Electricity
48
In the Slovak Republic, RWE Plus acquired a 49%
stake in the power utility VSE. The shares changed
ownership with the approval of the Slovak autho-
rities and supervisory committees on January 23,
2003. RWE Plus also assumed entrepreneurial con-
trol of VSE. Headquartered in Kosice, the enter-
prise provides some 600,000 end customers with
electricity. In 2001, it had a labor force of about
2,000 and generated € 256 million in revenue.
With 22% of the market, VSE is the Slovak Repu-
blic’s third-largest energy utility. VSE has already
been cooperating with the Hungarian utility ÉMÁSZ
for years. ÉMÁSZ’s supply area neighbors on that
of VSE directly, and RWE Plus owns 54% of ÉMÁSZ.
Second cutting-edge lignite-optimized power
station planned
RWE Rheinbraun plans to build a second lignite-
optimized power plant. The envisioned 1,050-MW
block has been given a budget of € 1.2 billion. The
power station is scheduled to go live in 2008.
However, we will implement this project only if its
economic viability is not jeopardized by burdens
from the planned CO2 emission allowance trading
system or unreasonable restrictions connected to
its legal approval.
Acquisition of Innogy: RWE becomes second-lar-
gest UK electric utility
At the end of May 2002, we acquired Innogy, the
British electric and gas utility. The purchase price
was € 5,056 million. Including assumed liabilities,
the enterprise value totaled € 8.5 billion. We con-
solidated Innogy for the first time as of June 1,
2002 and made it the operating management com-
pany for our new “UK Energy” Division, which is
part of the Electricity Business Area. The company
is currently No. 3 in the UK energy market, with
4.6 million electricity customers and 1.9 million
gas customers.
Thanks to this acquisition, we now command a
leading position in Europe’s third-largest utility
market. As we integrate Innogy, we want to lower
annual costs by € 80 million by 2006 via synergies.
We will realize 75% of the targeted savings through
the cooperation between Innogy and Thames
Water. The remaining portion will be realized prin-
cipally by eliminating overlapping functions at RWE
Trading. Our goal is to have the new UK Energy
Division achieve a ROCE that at least covers its
capital costs by 2005.
Entry into the Polish and Slovak growth markets
RWE Plus became one of Poland’s leading power
providers by acquiring an 85% shareholding in
STOEN, the former state-owned company. STOEN
is an electric utility in the city of Warsaw, which
makes it active in Poland’s fastest-growing eco-
nomic region. The enterprise supplies some
5.4 billion kWh of electricity to about 780,000 end
customers in the greater Warsaw area every year.
In 2001, STOEN employed approximately 1,700
people and generated roughly €400 million in
revenue. With 39 million residents, Poland ranks
among the largest markets in central Eastern
Europe, which has high growth rates.
78
Electricity

Renewables-based power generation capacity
significantly expanded
Harpen, our subsidiary that specializes in renew-
ables-based and distributed electricity generation,
continued its international course for growth with
success. By acquiring the Spanish wind power
specialist AERSA, Harpen has built an operating
platform in one of the world’s fastest-growing wind
energy markets. Furthermore, Harpen began con-
struction work on its first wind park in Italy in the
vicinity of Naples. In fiscal 2002, the Dortmund-
based company increased its renewables-based
power generation capacity from 100 MW to 328
MW. RWE has an additional 206 MW at its disposal
through its acquisition of Innogy. The RWE Group’s
aggregate renewables-based electricity generation
capacity thus nearly totals 1,100 MW. It has risen
by more than 50% since 2001.
More customer proximity in power sales
Our German regional redistributors have always
been successful thanks to their strong local market
presence. By regionalizing our sales structure, we
are currently stepping up RWE Plus’ activity in the
electricity business on a market with a total of
2.9 million private, commercial and business
customers. From January 2003 onwards, it will be
run by two newly established sales management
units, which will also assume responsibility for
regional results.
Outlook
Our electricity operations will continue to be the
RWE Group’s strongest earnings mainstay. We
expect this business area to post low double-digit
growth in its operating result primarily due to the
fact that Innogy will be included in our consoli-
dated accounts for the entire year, as compared
with its seven-month inclusion in 2002. We anti-
cipate our German power operations to continue
their positive earnings trend, albeit with far lower
growth rates than in the previous year. The basis
for this forecast performance are further cost
reductions. Furthermore, we have already secured
our German electricity generation to a great extent
through futures based on higher wholesale quota-
tions. In addition, we believe that prices on the
German market will at least remain stable.
We expect ourElectricity BusinessArea to post lowdouble-digit growth inits operating result.
79
Electricity

80
»Anything is possible if you have the right tools.«Vítezslav Borovicka, Underground Storage Manager, Transgas
Has been working in the gas sector for 25 years. The transportation and storage of gas are a central integration project to which employeeslike Vítezslav Borovicka have committed their entire know-how. This ishow he contributes to strengthening the position RWE’s gas businessoccupies in Europe even further.

81
Gas
»We’re becoming more and more European.«Jan Heinz Knoop, Storage Manager, Kalle Natural Gas Storage Facility,RWE Gas
Loves working across borders. RWE doubled its storage capacitythrough the acquisition of Czech-based Transgas. Moreover, this pro-vides access to one of the major transit lines between Russia andEurope: Some 20% of the natural gas exported by Russia takes thisroute to Western Europe.

Average prices andvolumes on the Germanand Czech gas marketswere down on theprevious year.
Crude oil prices match year-earlier level
Prices on the international oil market recovered
after a low at the beginning of the year. In 2002,
a barrel of Brent crude cost US$ 25 on average,
slightly exceeding the previous year’s level
(US$ 24.7). The increase in oil prices is primarily a
result of volume limits set by OPEC in anticipation
of the possible war with Iraq. Moreover, there was
a national strike in Venezuela, which lasted several
weeks. This almost caused the country’s oil exports
to cease entirely.
Economic slump and mild weather hamper
German gas consumption
Mild weather conditions in the first quarter of
2002 and the persistent economic slump dampe-
ned Germany’s natural gas consumption. These
factors overpowered the positive trend in demand
caused by the increased share of homes heated
with gas-fired systems. Consumption slipped 0.5%
to 935 billion kWh. Prices in the German gas
market, which track heating oil prices with a time
lag of approximately six months, were strongly
influenced by the low prices paid for oil in the
months leading up to and following the end of
2001. Average prices for gas deliveries to muni-
cipal and regional utilities were some 7% down,
while prices paid by private, commercial and indus-
trial customers were about 10% lower compared
with the previous year.
82
Gas
We completed the acquisition of Czech-based Transgas as well as of thestakes in the country’s regional distributors in May 2002. RWE has thusadvanced to the premiere league of European gas utilities. Our UpstreamDivision’s production exceeded the previous year’s high earnings thanks toits intensified production activities. All in all, we improved the Gas BusinessArea’s operating result by 27%.
Successful entry into the Czech gas business

83
The Upstream Divisionexpanded its gas pro-duction by 9.7%.
Gas
+ 9.7
+ 3.9
+ 121.3
+ 52.1
- 3.8
+ 44.3
+ 41.3
+ 26.6
- 30.7
- 2.7
- 28.0
+ 83.2
—
2,172
4,482
99,541
3,724
606
4,330
877
699
21.5
11.0
346
3,252
468
2,382
4,657
220,258
5,666
583
6,249
1,239
885
14.9
10.7
249
5,959
5,365
m3 million
t ‘000
kWh million
€ million
€ million
€ million
€ million
€ million
%
%
€ million
€ million
€ million
Production (RWE Dea)
_Natural gas
_Petroleum
Natural gas sales (RWE Gas)
External net sales
Internal net sales
Total sales
EBITDA
Operating result
Return on capital employed (ROCE)
WACC before taxes
Value added
Capital employed
Capital expenditure
2002 2001
pro forma
+/- in %Key data
Workforce 9,176 2,795 + 228.3FTE*
12/31/01 +/- in %12/31/02
*Full time equivalent, corresponding to the percentage of full-time employment.
The mild weather also had an impact on the Czech
gas market, leading to a drop in demand. At 99.2
billion kWh, consumption was 3.3% down on the
previous year. In the Czech Republic, gas prices
are fixed once a quarter by an independent regu-
latory authority. Key criteria include international
crude oil prices as well as the exchange rate
between the Czech crown and the US dollar and
the euro. On average, gas prices paid by private
and commercial customers were reduced by 8.7%
on April 1, 2002, and by 8.2% on October 1, 2002.
This trend is being reversed at the beginning of
the current financial year because of the recent
steep climb in oil prices.
Production stepped up considerably
Our Upstream Division stepped up production
even further. Output was up 9.7% to 2,382 million
cubic meters. The rise in production was principally
due to the fact that the British gas producer High-
land Energy, which now operates as “RWE Dea
UK,” was included for the first time. Petroleum pro-
duction was lifted 3.9% to 4.7 million metric tons.
This rise was based on new drilling in the German
Mittelplate field as well as the fact that we
increased our shares in three oilfields in the Gulf of
Suez to 100%. We also expanded production in
Kazakhstan.

84
Gas
Private and commercial customers
Industrial key accounts
_Power plants
Distributors/power utilities
Total
24,793
19,163
1,988
55,585
99,541
57,328
62,317
11,027
100,613
220,258
+ 131.2
+ 225.2
+ 454.7
+ 81.0
+ 121.3
2001
pro forma
+/- in %Midstream/Downstream Division*
External net gas sales in million kWh
2002
* Includes the Czech gas business from May 1, 2002 onwards.
Gas sales grew markedly through acquisitions
in the Czech Republic and the Netherlands
Natural gas sales volumes recorded by RWE Gas
and its investments climbed 121.3% to 220 billion
kWh. Major drivers were the acquisition of the
Czech gas utility Transgas and the stakes in the
country’s regional distributors. The acquisition of
a share of approximately 90% in Dutch-based
Obragas also had an effect. Furthermore, we started
consolidating the sales volumes generated by our
75% shareholding in Thyssengas in January of
2002.
However, deliveries were slightly higher even
without taking these extraordinary effects into
consideration. This was because we won a large
number of new customers since the number of
homes with gas-fired heating installed has risen.
Net of consolidation effects, we sold 22.4% more
gas to private and commercial customers. Sales to
industrial key accounts decreased 7.9% due to the
economic situation. Sales to energy utilities
declined by 6.1%. Taking all new acquisitions into
consideration, RWE Gas and its investments
currently serve 163 municipal and regional utilities,
1,390 industrial customers and over 3.1 million pri-
vate and commercial clients in Germany, the
Netherlands and the Czech Republic. Including
minority interests as well as the gas operations of
Innogy and RWE Plus, which are part of our
Electricity Business Area, RWE serves 9.9 million
gas customers in Europe.
Sales up 52%
External net sales generated by the Gas Business
Area were boosted 52.1% to € 5,666 million. This
significant increase is primarily a result of the
inclusion of our Czech operations and the full
consolidation of Thyssengas in the Midstream/
Downstream Division. It also benefited from the
one-off effect in the Upstream Division. Sales from
RWE Dea’s former downstream unit had been
consolidated at 50% since it was incorporated into
the Shell & DEA Oil joint venture at the beginning
of 2002. But we disclosed all these sales as
external net sales as of July 1. On the other hand,
in the previous year’s figures these sales were
categorized as internal net sales. Lower gas prices
had an adverse effect on revenue.
In the Gas BusinessArea, external net salesposted strong growth,especially due toconsolidation effects.

85
Gas
Operating result clearly up through inclusion
of Czech gas business
We lifted EBITDA by 41.3% to € 1,239 million. The
operating result jumped 26.6% to € 885 million.
This was primarily due to the first-time consolida-
tion of the Czech gas business in the Midstream/
Downstream Division. We saw improvements in the
Upstream Division as well. As a result of the first-
time consolidation of the Czech gas business,
absolute value added totaled € 249 million and was
28.0% lower than the year before. It would have
dropped 15.3% excluding this effect. Here the sig-
nificant growth in the Upstream Division’s
operating assets, which was partially due to the
acquisition of Highland Energy, manifested itself.
The Midstream/Downstream Division improved
its operating result by 50.3% to €499 million
year-on-year. Transgas and the six fully consolida-
ted regional distributors contributed € 179 million
to the operating result on an eight-month basis. It
should be pointed out that, with the exception of
international transit, in the gas business, propor-
tionally more income is generated in the winter
months. Since we only started consolidating our
Czech gas activities as of May 1, these winter
months have not yet been included in our opera-
ting result. RWE reaped the full benefit of cash
flows achieved from January to April of 2002 as
liquidity rose due to first-time consolidations.
Excluding the earnings contribution made by the
Czech gas operations, the Midstream/Downstream
Division would have closed the fiscal year 3.6%
down on the previous one, principally due to the
lower gas margins caused by oil prices.
In the Upstream Division, we surpassed the pre-
vious year’s strong operating result by 5.2%,
raising it to € 386 million. This division benefited
from additional revenue from the expansion of our
production, efficiency enhancements and currency
exchange effects.
2,834
—
1,496
4,330
332
—
367
699
499
179
386
885
375
—
502
877
652
267
587
1,239
Midstream/Downstream
_Czech gas*
Upstream
Total
2,802
—
922
3,724
Gas Business Area Total sales Operating result
2002 2001
pro forma
EBITDA
2002 2001
pro forma
2001
pro forma
External net sales
4,833
1,044
833
5,666
20022001
pro forma
4,958
1,044
1,291
6,249
2002Key data by division
€ million
*Czech gas business included as of May 1, 2002 (eight months).
The Midstream/Downstream andUpstream Divisionsincreased theiroperating result by50.3% and 5.2%,respectively.

86
Gas
Capital expenditure substantially higher through
acquisition of Czech gas business
At € 5,365 million, the investment budget
exceeded the previous year’s more than ten-fold.
This significant rise is predominantly attributable
to the Midstream/Downstream Division. The
acquisition of Transgas and the Czech regional
utilities accounted for about €4.1 billion. In
addition, we acquired a 90% stake in the Dutch
gas utility Obragas for € 319 million. Furthermore,
the division spent a considerable amount of money
on property, plant and equipment on network
infrastructure. Capital spending was up in the
upstream sector too. The main investment projects
were the acquisition of Highland Energy and the
purchase from Veba Oil & Gas GmbH of the
remaining shares in companies that used to be
jointly owned in Norway and Egypt.
Czech gas: first integration milestones passed
On May 16, we completed the acquisition of a 97%
interest in the Czech-based gas utility Transgas and
of stakes of between 46% and 58% in the country’s
eight regional distributors. Six of the regional
utilities are now majority-owned by RWE. We
consolidated Transgas and these companies with
retroactive commercial effect as of May 1. Thanks
to this acquisition, we have advanced to the major
league of European gas utilities. Transgas and the
regional distributors serve some 2.6 million end
customers, thus serving nearly the entire Czech gas
market, which ranks among Europe’s most
dynamic, with 4% average annual demand growth.
Our new Czech gas operations are being integrated
on schedule. Our aim is to have them generate
ROCE that at least covers capital costs by 2006 at
the latest. We intend to realize € 100 million in
annual synergies by 2007. This will occur on two
levels. RWE Gas and Transgas are working on
achieving savings by pooling their gas procure-
ment, transport and storage activities. Our Czech
regional utilities are focusing on cooperating in
sales and gas logistics. Moreover, they are reorga-
nizing overlapping administrative functions*.
First-time consolidation of Thyssengas
We consolidated our 75% stake in Thyssengas fully
at the beginning of the 2002 financial year.
Thyssengas GmbH is one of Germany’s largest
natural gas utilities, focusing on import and
wholesaling. Fiscal 2002 saw this company con-
tribute € 1.1 billion to consolidated revenue.
RWE Gas establishes logistics joint venture
In January 2002, RWE Gas and UK-based National
Grid Transco (formerly known as Lattice Group)
agreed to set up a jointly managed natural gas
logistics enterprise. Operating as “Viavera,” the
company offers services primarily to natural gas
traders and sales companies. Center stage is taken
by logistics management, running the gamut from
negotiations with network operators to complete
monitoring of transport contracts. RWE Gas owns a
60% stake in the joint venture. By taking this step,
we want to take advantage of the opportunities
arising from the deregulation of Germany’s gas
market in the field of logistics.
21
Upstream position gains international reach
We strengthened our upstream position even
further in the 2002 financial year. Once again, we
increased RWE Dea’s natural gas reserves consi-
derably from 76.5 million cubic meters of oil equi-
valent (OE) at the end of 2001 to 88.1 million
cubic meters of OE. This expansion was a result of
our acquisition of shares formerly held by Veba Oil
& Gas in joint ventures in Egypt and Norway, with
our successful exploration activity playing an even
more significant role. Gas reserves discovered off
Egypt’s Mediterranean coast and the increase in
shares in concessions caused reserves to grow by
approximately 9.8 million cubic meters of OE. We
bid successfully for exploration licenses in attrac-
tive concession areas in Great Britain, Norway and
Algeria. Furthermore, we acquired a 20% interest
in nine offshore*blocks east of the Canary Islands
from Repsol-YPF.
We strengthened our oil business with new pro-
duction drilling in the German Mittelplate territory.
In addition, we joined forces with partners to
obtain approval for the development of two North
Sea oilfields northwest of Denmark.
Due to the first-timefull consolidation ofour Czech operations,we expect the GasBusiness Area to postfurther growth in itsoperating result.
87
Gas
Outlook
We will also be able to lift operating results in the
Gas Business Area once again. This will be made
possible by the fact that our Czech gas business
will be included in our consolidated financial
statements on a full, twelve-month basis for the
first time in fiscal 2003. Our Upstream Division is
expected to close the fiscal year roughly on par
with 2002. It is virtually impossible to make price
forcecasts at present, due to political risks. How-
ever, we have already secured part of our crude oil
sales volumes with forward contracts. In light of
the high price of crude oil, we anticipate a slight
increase in gas prices in the second half of 2002.
166

Water
»Just like running water, we always find a way.«Martyn Andrews, Head of Financial Appraisal, Thames Water
Focuses on cooperation with Thames Water China. RWE’s operatingmanagement company, Thames Water, has also been active in Chinasince 1997. In June 2002, Thames Water acquired just under 49% ofThe China Water Company Ltd. Today, RWE is the world’s third-largestwater provider, serving 70 million people.

89
Water
Water
»We keep the ideas flowing to get the best results.«Minyi Du, Business Development Director, Thames Water China
Her global thinking is being deepened by the Oxford Leadership Program. Minyi Du contributes her regional knowledge to ensure thatRWE’s water business is successful in China. Thames Water and ChinaWater employees pool their experience with a view to offering somefour million people even better services.
The required capitalexpenditure on therenovation of infra-structure and the trendto privatization createlong-term growthpotential.
Global water market continues to be stable
In 2002, the world water market was much less
affected by the global economy’s sustained weak-
ness than most other utility sectors. Stable long-
term potential will arise from the high necessary
investment in the modernization of network infra-
structure in the water and wastewater businesses.
In the year under review, privatization and out-
sourcing trends persisted especially where pipeline
networks are no longer capable of meeting in-
creased standards in terms of supply security,
quality and environmental protection. However,
competition for new projects increased—primarily
in large industrial nations.
90
Water
High-growth portfolio
Fiscal 2002 saw us concentrate on the comprehensive expansion of our com-petitive position in the international water business. We set the course forthe future in the USA by obtaining approval for the acquisition of AmericanWater Works. At the same time, we fortified our presence in Germany, Chileand China and we succeeded in entering the Spanish market. The operatingresult rose by 11%.
Sales slightly up year-on-year
In the reporting period, we generated € 2,850
million in revenue in the Water Business Area. This
corresponds to a 3.8% increase year-on-year. Net
of the peripheral activities that were sold in 2001,
revenue rose by 8%. Revenue produced outside of
the established regulated UK business posted
above-average growth, advancing to some 40% of
total revenue, thanks to the first-time consolidation
of RWW Rheinisch-Westfälische Wasserwerksgesell-
schaft, the Chilean water utilities ANSM and ESSEL
and the Spanish water companies PRIDESA and
Ondagua. In Great Britain, the low rate of inflation,
which is used as a basis for price adjustments in
the regulated sector, dampened revenue growth.
Currency exchange effects and the divestment of
peripheral activities also caused revenue to
decline.

91
In the regulated UK water business, revenue was
only slightly up as a result of inflation, and higher
expenses were incurred to improve the infrastruc-
ture of the network in the London supply area.
We offset these effects with measures to improve
efficiency that enabled us to outperform the
investment and operating cost targets set by the
regulator.
The operating resultrose by more than 11%despite high servicingcosts.
Water
External net sales
Internal net sales
Total sales
EBITDA
Operating result
Return on capital employed (ROCE)
WACC before taxes
Value added
Capital employed
Capital expenditure
Workforce
2,746
—
2,746
1,327
865
6.7
8.0
- 163
12,856
2,6431
2,850
—
2,850
1,457
963
7.3
8.0
- 93
13,200
2,181
11,907 11,586 + 2.8
€ million
€ million
€ million
€ million
€ million
%
%
€ million
€ million
€ million
FTE2
+ 3.8
—
+ 3.8
+ 9.8
+ 11.3
+ 9.0
—
+ 42.9
+ 2.7
- 17.5
2001
pro forma
12/31/01 +/- in %12/31/02
+/- in %Key data 2002
1 Figure reflects 13.5 months due to first-time consolidation.2 Full time equivalent, corresponding to the percentage of full-time employment.
Operating result posts double-digit growth
EBITDA in the Water Business Area was up 9.8% to
€ 1,457 million. The operating result increased by
11.3% to € 963 million. This was primarily due to
tariff increases as well as the aforementioned first-
time consolidations.
Great Britain and Ireland
Europe, Near East, Africa
America
Asia-Pacific Rim
Total
2,046
263
358
79
2,746
1,982
338
411
119
2,850
- 3.1
+ 28.5
+ 14.8
+ 50.6
+ 3.8
2001
pro forma
+/- in %Water Business Area
External net sales by division
€ million
2002
A look at the relationship between revenue and the
operating result shows just how profitable this
business area is. Whereas it was only responsible
for 6.1% of Group revenue, it contributed more
than 20% of the consolidated operating result.
The absolute value contributed by the Water
Business Area improved by € 70 million compared
with the previous year, although it still was
negative, coming in at -€ 93 million because of
goodwill from acquisitions.
Higher capital expenditure on network infra-
structure
Totaling € 2,181 million, capital expenditure was
down on the year-earlier level. Financial invest-
ments amounted to € 1,058 million and principally
related to the aforementioned acquisitions. Capital
expenditure on property, plant and equipment
primarily included expenses for the improvement
of network infrastructure in Great Britain as well as
investments in business expansion in Chile.
Water portfolio strengthened considerably
We significantly bolstered our competitive position
in several of our strategic target markets:
jIn April of 2002, we improved our leading
position on the German market substantially
through the increase in our shareholding in
RWW Rheinisch-Westfälische Wasserwerksgesell-
schaft to a majority stake of just under 75%.
October of 2002 saw us acquire another 5%
interest. The purchase price for all shares
acquired in 2002 totaled € 233 million. Byadding
some one million residents served by RWW to
our German water customer base, it grew to
about 13 million people. In 2001, RWW
generated approximately € 100 million in
revenue.
jIn June of 2002, we acquired a 49% stake in
China Water Company for about US$70 million.
China Water is in charge of several projects in
industrial regions, including one in the vicinity
of Shanghai where Thames Water has been
participating in the Da Chang water project
since 1997. All in all, the number of people we
provide with water in the People’s Republic of
China rose from one million to over five million.
jShortly thereafter, we gained a foothold in the
Spanish water market by acquiring majority
interests in PRIDESA and Ondagua. The combi-
ned purchase price was about € 100 million.
PRIDESA engineers and operates conventional
water and sewerage facilities as well as ultra-
modern sea water desalination plants in Spain
and in neighboring Mediterranean countries.
Furthermore, the company is the European
technology leader on this growth market.
Ondagua runs numerous municipal water utili-
ties in several Spanish regions. Together, the
companies serve more than three million resi-
dents and generated a combined € 150 million
(approx.) in revenue in 2001.
92
Water

Acquisition of American Water Works success-
fully completed
We completed the acquisition of American Water
Works, which was initiated in September of 2001,
on January 10, 2003—far earlier than planned.
This was due to the rapid approval procedures.
In addition to clearance from the Federal Trade
Commission, we had to go through comprehensive
approval processes in 13 of the 27 states in which
American Water Works is active. We had to accept
the postponement of tariff adjustments in several
states. This is common practice as regards acqui-
sitions in the regulated US water business. The
impact on future earnings falls within the range we
anticipated. Having undertaken far -reaching pre-
parations in the 16-month approval phase, we were
in a position to begin integrating American Water
Works into the Group quite effectively in January
of 2003. The company was renamed “American
Water.” Our goal is to have our American water
operations’ ROCE at least match capital costs by
2006. As far as the entire Water Business Area is
concerned, we intend to pass this hurdle as early
as 2005.
With American Water on board, along with its
15 million-strong customer base in the US and
Canada, we are clearly the new No.1 in the North
American regulated water business. RWE now
serves 70 million people worldwide. This has
enabled us to substantially strengthen our position
as No. 3 among international water companies.
Outlook
Our Water Business Area will see a major jump in
revenue and operating results, thanks to the inclu-
sion of American Water. However, we also expect
that our new US activities will not be able to
emerge from the weak economic situation entirely
unscathed, despite the stable framework condi-
tions in the regulated business. Moreover, we will
have to shoulder the increased security and
insurance costs in reaction to the 9-11 terrorist
attacks as well as price concessions made within
the scope of the approval procedure. In the
regulated UK business, we expect expenses for the
improvement of London’s network infrastructure to
be higher, and to be able to pass them on via price
adjustments in due course. In addition, we will
counteract this by taking measures to enhance
efficiencies. The operating result may decrease due
to currency conversion if the British pound and the
US dollar display negative developments. However,
we will be able to offset most of this effect in our
income before tax through our acquisition finan-
cing, which is also based on pounds and dollars.
All in all, the Water Business Area will post signi-
ficant double-digit growth in its operating result
and thus contribute about one-fourth of the
Group’s operating result. Some 95% of this ear-
nings contribution will come from stable regulated
businesses.
In 2003, this businessarea will record strongdouble-digit growth inits operating resultowing to the first-timeinclusion of AmericanWater.
93
Water
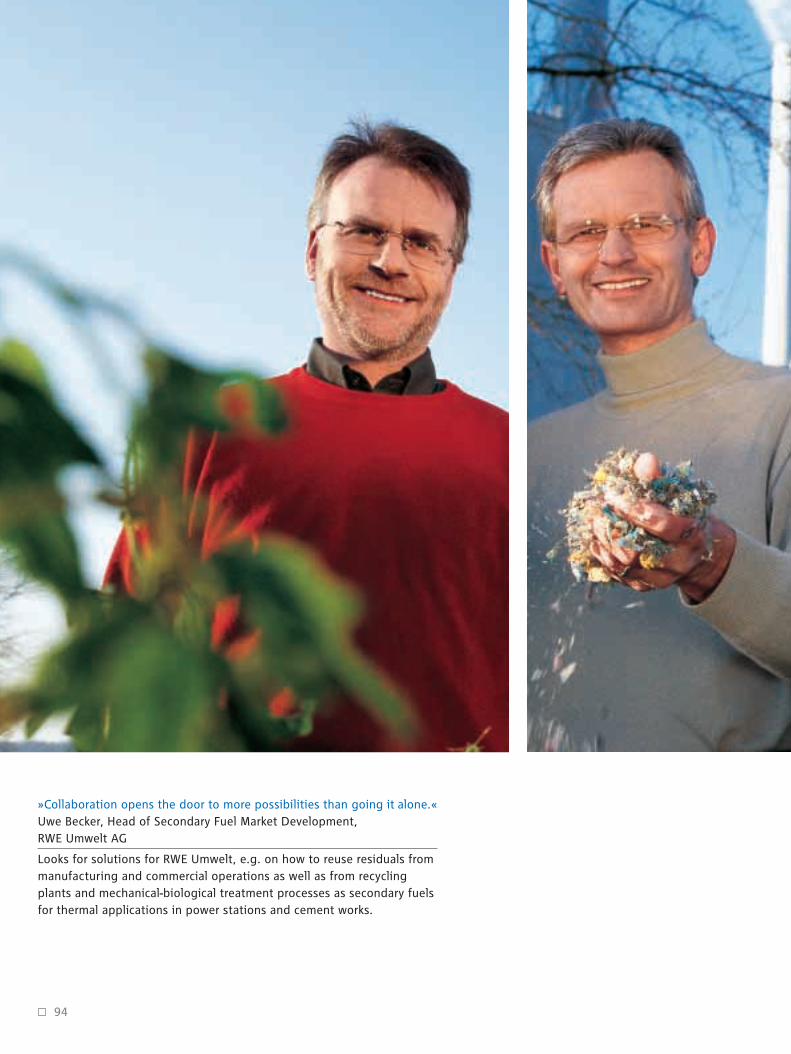
94
»Collaboration opens the door to more possibilities than going it alone.«Uwe Becker, Head of Secondary Fuel Market Development, RWE Umwelt AG
Looks for solutions for RWE Umwelt, e.g. on how to reuse residuals frommanufacturing and commercial operations as well as from recyclingplants and mechanical-biological treatment processes as secondary fuelsfor thermal applications in power stations and cement works.
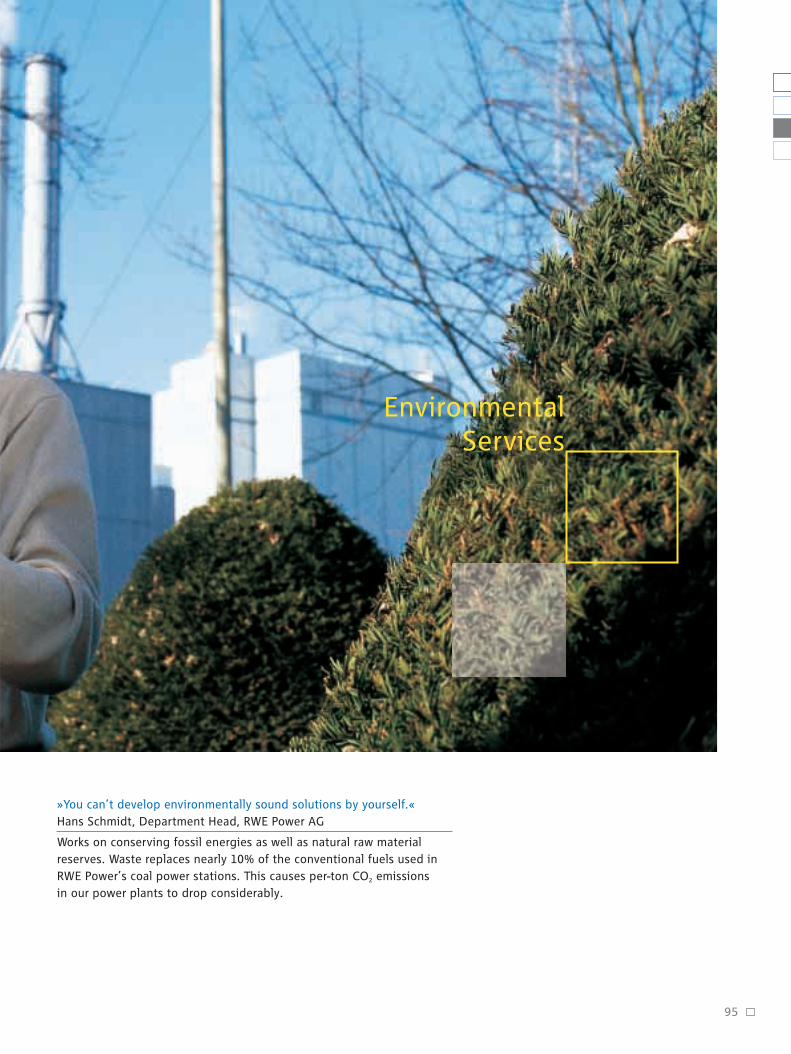
95
EnvironmentalServices
»You can’t develop environmentally sound solutions by yourself.« Hans Schmidt, Department Head, RWE Power AG
Works on conserving fossil energies as well as natural raw material reserves. Waste replaces nearly 10% of the conventional fuels used inRWE Power’s coal power stations. This causes per-ton CO2 emissions in our power plants to drop considerably.

Price and volumedeclines in Germany’swaste disposal busi-ness are intensifyingpredatory competition.
Sector under duress, especially in the commer-
cial waste sector
Market and competitive conditions in Germany’s
waste disposal sector have become even more
difficult to cope with due to the sustained econo-
mic slump. This branch of industry suffered
declines in sales primarily in the commercial waste
sector. All segments of the secondary raw materials
sector stagnated. Neither the waste paper, nor the
electronic scrap disposal sector showed significant
signs of improvement. Only the measures taken to
implement the Technical Guideline for Residential
Waste (TASi)* revitalized the market somewhat.
The business of the recycling enterprise “Duales
System Deutschland” (DSD) was rather stable in
comparison. Here, the new invitation for bids for
service level agreements as of January 1, 2004 is
on the agenda for the current fiscal year.
Sales slightly up year-on-year
At € 2,136 million, external net sales exceeded the
previous year’s figure by 3.9%. Sales growth was
principally driven by the three following consoli-
dation effects:
jThe first-time full-year consolidation of the
Kanal-Müller Group, a specialist in the
redevelopment of sewerage systems
jThe first-time consolidation of the Remex Group,
a leading company in the field of mineral
recycling
jThe acquisition of Thames Water’s waste dispo-
sal operations (Thames Waste Management)
In addition, in the secondary raw materials marke-
ting sector, the industrial services business and our
Eastern European business, sales advanced as a
result of volume growth and price developments.
This enabled us to further consolidate our sales
ranking as Number 1 in Germany.
Slipping margins depress earnings
In contrast to the rise in sales, RWE Umwelt
recorded a drop in earnings. At € 281 million,
EBITDA was 12.5% down on the previous year. The
operating result decreased by 33.3% to € 98 mil-
lion. This was primarily due to volumes and prices
in the residential and commercial waste sectors.
Unfavorable market and competitive conditions in
the other sectors also had an impact. Here, the
level of market prices, which is extremely unsatis-
factory, has been impacted by a short-term over-
supply of landfill capacity. At the same time, to
prepare for the implementation of the Technical
Guideline for Residential Waste, more and more
refuse must be disposed of in waste incineration
plants—an increasingly expensive endeavor. In
addition, the operating result is being hampered
considerably by subsidiaries and investments that
do not belong to the core waste and recycling
business. Absolute value added was also lower
than in the previous year at -€ 71 million.
Capital expenditure up
Capital expenditure amounted to € 695 million,
surpassing the previous year’s figure by approxi-
mately 62.4%. The significant increase is a result of
substantially higher financial investments. Replace-
ment investments were the main item concerning
96
Environmental Services
Rough waters
Persistently unfavorable economic developments have had an impact onGermany’s entire waste disposal industry. Intensified competitive pressure iscausing margins to collapse. RWE Umwelt saw its operating result drop by33%. We have initiated an incisive program to realign and restructure thisbusiness, which will pave the way to recovery in the medium term.
167

97
Environmental Services
External net sales
Internal net sales
Total sales
EBITDA
Operating result
Return on capital employed (ROCE)
WACC before taxes
Value added
Capital employed
Capital expenditure
Workforce
2,055
33
2,088
321
147
10.9
10.0
12
1,348
428
2,136
43
2,179
281
98
5.8
10.0
- 71
1,689
695
14,406 14,453 - 0.3
€ million
€ million
€ million
€ million
€ million
%
%
€ million
€ million
€ million
FTE*
+ 3.9
+ 30.3
+ 4.4
- 12.5
- 33.3
- 46.8
—
- 691.7
+ 25.3
+ 62.4
2001
pro forma
+/- in %12/31/02 12/31/01
+/- in %Key data 2002
*Full time equivalent, corresponding to the percentage of full-time emplyment.
property, plant and equipment. The major financial
investment in this regard was the acquisition of the
remaining 50% in Trienekens AG, which was im-
plemented at the end of May 2002. Excluding this
purchase, capital expenditure was markedly down
on the preceding year.
Trienekens AG acquired in its entirety and
merged into RWE Umwelt
After acquiring the 50% stake that was still held by
the Trienekens family, we merged Trienekens AG
into RWE Umwelt with retroactive commercial
effect as of January 1, 2002. This created a fully
integrated company under uniform management.
We had already been consolidating Trienekens fully
before we acquired the whole company. Therefore,
the transaction did not affect sales or the
operating result.
Strategic realignment in the wake of the
Trienekens acquisition
RWE Umwelt took advantage of the fact that it was
integrating Trienekens to implement a far-reaching
reorientation*. We combined the two former head
offices to create a headquarters at RWE Umwelt
AG’s new domicile: Viersen, Germany. Moreover,
we are grouping operations into eight regions ins-
tead of the previous 17.
In reaction to basic economic conditions, we ini-
tiated further restructuring measures to reduce
costs at RWE Umwelt substantially, going beyond
what would be possible from the synergistic
potential resulting from the tie-up with Trienekens.
Our cost reduction target is € 50 million per year,
most of which we intend to realize in 2003 and
2004. We are thus better equipped to take on
future challenges arising from the implementation
of the Technical Guideline for Residential Waste as
well as the impending new round of bids for DSD
service level agreements. We set aside € 253 mil-
lion to cover the entire restructuring program.
A considerable portion of this expense was taken
into account when the Trienekens acquisition was
valued and led to a corresponding reduction in the
purchase price.
Outlook
The situation on the German waste disposal market
will remain under strain in the fiscal year under-
way. In addition, we will have to contend with the
risk connected with the introduction of a can
deposit in Germany from January 1, 2003 onwards.
Thanks to the restructuring measures initiated in
the previous year, we expect to be able to stabilize
our operating result in the current one.
We expect theoperating result forfiscal 2003 to stabilize.
39

Non-core businesses record considerableearnings shortfallsThe operating result produced by our non-corebusinesses dropped to €180 million, or one-quarter of the previous year’s level. Heidelbergwas hard hit by the sustained cyclical down-turn. The printing press manufacturer saw itsoperating result decline by 56%. RWE Dea’sservice-station and refinery operations contri-buted a slightly negative result, owing toextremely low refinery margins. We transferredthese activities to the Shell & DEA Oil jointventure at the beginning of 2002 and soldthem to Shell in the middle of the year. Westopped the full consolidation of HOCHTIEF,our construction subsidiary, as of January 1,2002 and now include it in the consolidatedfinancial statements based on prorated netincome. Therefore, we no longer comment onits business trend.
98
Non-Core Businesses
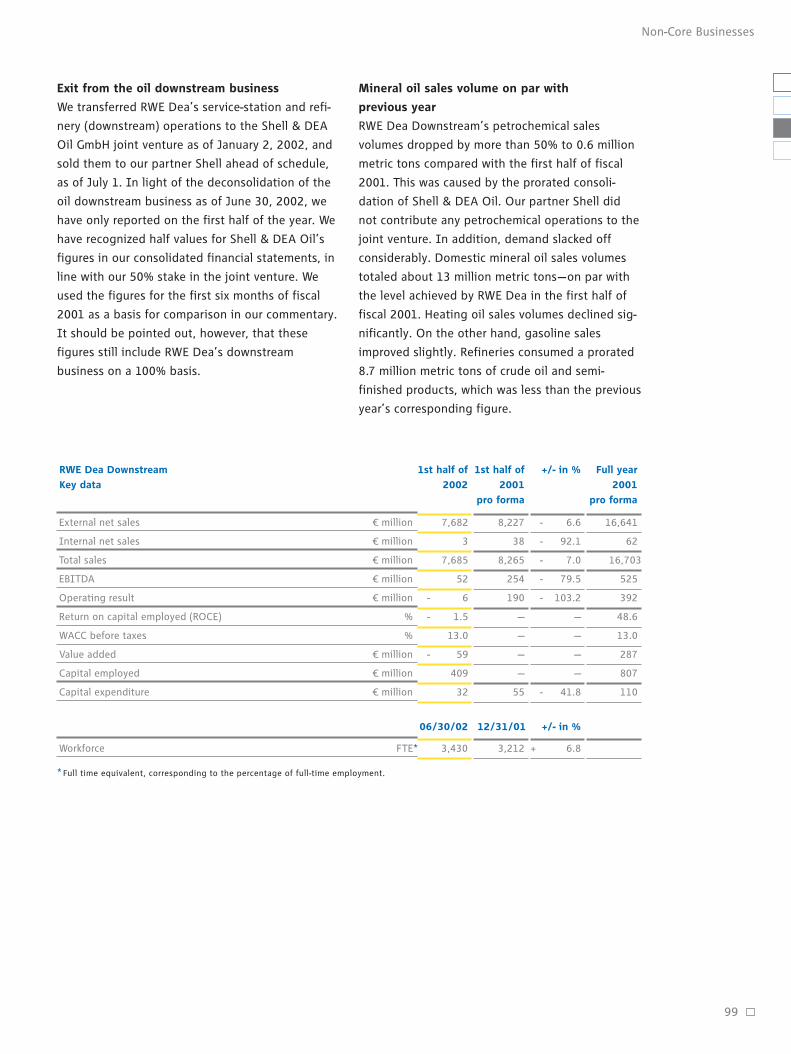
Exit from the oil downstream business
We transferred RWE Dea’s service-station and refi-
nery (downstream) operations to the Shell & DEA
Oil GmbH joint venture as of January 2, 2002, and
sold them to our partner Shell ahead of schedule,
as of July 1. In light of the deconsolidation of the
oil downstream business as of June 30, 2002, we
have only reported on the first half of the year. We
have recognized half values for Shell & DEA Oil’s
figures in our consolidated financial statements, in
line with our 50% stake in the joint venture. We
used the figures for the first six months of fiscal
2001 as a basis for comparison in our commentary.
It should be pointed out, however, that these
figures still include RWE Dea’s downstream
business on a 100% basis.
99
Non-Core Businesses
External net sales
Internal net sales
Total sales
EBITDA
Operating result
Return on capital employed (ROCE)
WACC before taxes
Value added
Capital employed
Capital expenditure
Workforce
- 6.6
- 92.1
- 7.0
- 79.5
- 103.2
—
—
—
—
- 41.8
8,227
38
8,265
254
190
—
—
—
—
55
7,682
3
7,685
52
- 6
- 1.5
13.0
- 59
409
32
06/30/02 12/31/01 +/- in %
3,430 3,212 + 6.8
16,641
62
16,703
525
392
48.6
13.0
287
807
110
+/- in % Full year
2001
pro forma
1st half of
2002
€ million
€ million
€ million
€ million
€ million
%
%
€ million
€ million
€ million
FTE*
RWE Dea Downstream
Key data
1st half of
2001
pro forma
*Full time equivalent, corresponding to the percentage of full-time employment.
Mineral oil sales volume on par with
previous year
RWE Dea Downstream’s petrochemical sales
volumes dropped by more than 50% to 0.6 million
metric tons compared with the first half of fiscal
2001. This was caused by the prorated consoli-
dation of Shell & DEA Oil. Our partner Shell did
not contribute any petrochemical operations to the
joint venture. In addition, demand slacked off
considerably. Domestic mineral oil sales volumes
totaled about 13 million metric tons—on par with
the level achieved by RWE Dea in the first half of
fiscal 2001. Heating oil sales volumes declined sig-
nificantly. On the other hand, gasoline sales
improved slightly. Refineries consumed a prorated
8.7 million metric tons of crude oil and semi-
finished products, which was less than the previous
year’s corresponding figure.
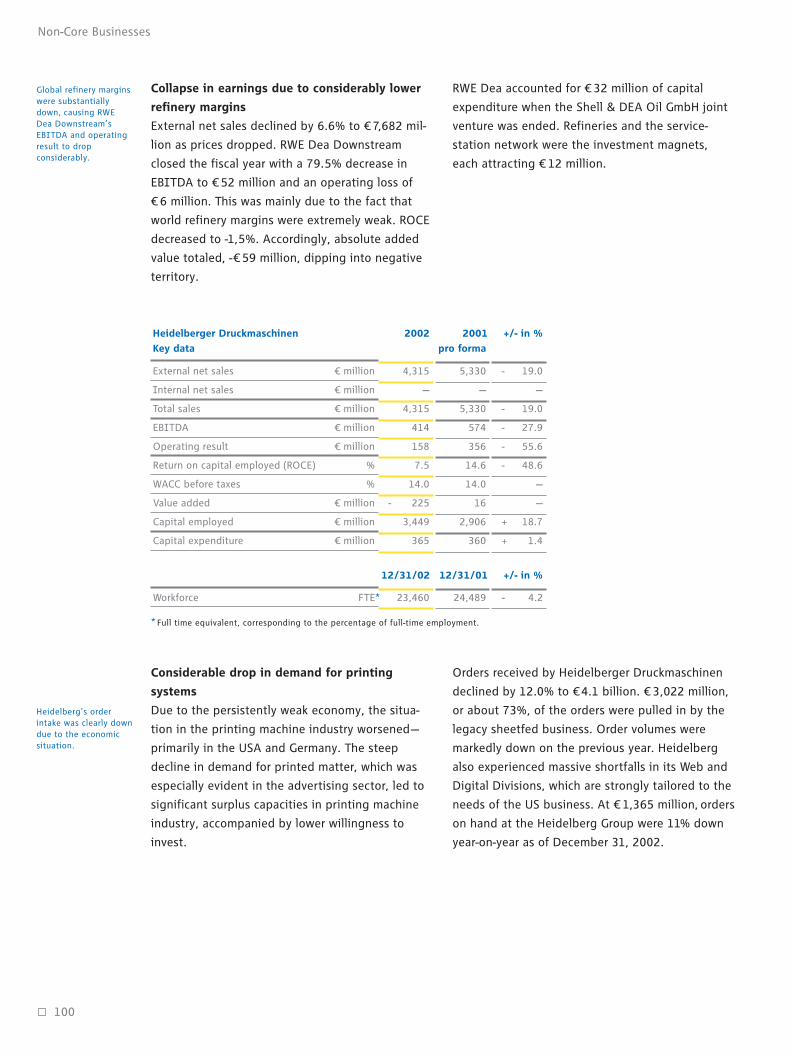
100
Non-Core Businesses
External net sales
Internal net sales
Total sales
EBITDA
Operating result
Return on capital employed (ROCE)
WACC before taxes
Value added
Capital employed
Capital expenditure
Workforce
5,330
—
5,330
574
356
14.6
14.0
16
2,906
360
4,315
—
4,315
414
158
7.5
14.0
- 225
3,449
365
€ million
€ million
€ million
€ million
€ million
%
%
€ million
€ million
€ million
- 19.0
—
- 19.0
- 27.9
- 55.6
- 48.6
—
—
+ 18.7
+ 1.4
2001
pro forma
+/- in %Heidelberger Druckmaschinen
Key data
2002
12/31/02 12/31/01 +/- in %
23,460FTE* 24,489 - 4.2
* Full time equivalent, corresponding to the percentage of full-time employment.
Considerable drop in demand for printing
systems
Due to the persistently weak economy, the situa-
tion in the printing machine industry worsened—
primarily in the USA and Germany. The steep
decline in demand for printed matter, which was
especially evident in the advertising sector, led to
significant surplus capacities in printing machine
industry, accompanied by lower willingness to
invest.
Orders received by Heidelberger Druckmaschinen
declined by 12.0% to €4.1 billion. € 3,022 million,
or about 73%, of the orders were pulled in by the
legacy sheetfed business. Order volumes were
markedly down on the previous year. Heidelberg
also experienced massive shortfalls in its Web and
Digital Divisions, which are strongly tailored to the
needs of the US business. At € 1,365 million, orders
on hand at the Heidelberg Group were 11% down
year-on-year as of December 31, 2002.
Collapse in earnings due to considerably lower
refinery margins
External net sales declined by 6.6% to € 7,682 mil-
lion as prices dropped. RWE Dea Downstream
closed the fiscal year with a 79.5% decrease in
EBITDA to € 52 million and an operating loss of
€ 6 million. This was mainly due to the fact that
world refinery margins were extremely weak. ROCE
decreased to -1,5%. Accordingly, absolute added
value totaled, -€ 59 million, dipping into negative
territory.
RWE Dea accounted for € 32 million of capital
expenditure when the Shell & DEA Oil GmbH joint
venture was ended. Refineries and the service-
station network were the investment magnets,
each attracting € 12 million.
Global refinery marginswere substantiallydown, causing RWEDea Downstream’sEBITDA and operatingresult to dropconsiderably.
Heidelberg’s orderintake was clearly downdue to the economicsituation.

We expect our non-core businesses torecord a further dropin earnings in 2003.
101
Non-Core Businesses
Earnings and revenue reflect economic slump
The unfavorable economic situation was also
reflected in declining revenue and earnings figures.
In 2002, Heidelberg generated €4,315 million in
revenue. This corresponds to a 19.0% decline.
Heidelberger Druckmaschinen’s EBITDA was down
27.9% to €414 million. The operating result was
more than halved compared with the previous year.
It dropped to € 158 million. This was the result of
idle capacity that went hand-in-hand with the fact
that none of the areas were able to earn back their
costs. Heidelberg produced a ROCE of 7.5%, which
fell clearly short of covering capital costs. At -€ 225
million, added value was considerably down year-
on-year.
Cost-cutting program initiated
In response to the persistently weak demand, in
September 2002, Heidelberger Druckmaschinen ini-
tiated a comprehensive program to enhance
efficiency and cut costs sustainably, which is to
take full effect in Heidelberg’s 2003/04 financial
year. The program is to achieve some € 200 million
in annual savings. It will focus on optimizing pro-
duction processes as well as relocations. Within
the scope of the restructurings, Heidelberg intends
to reduce its labor force at home and abroad by a
total of 2,200 positions.
Capital expenditure matches year-earlier level
At € 365 million, spending hovered around the
previous year’s level. Lower spending on property,
plant and equipment was compensated by higher
investments in financial assets. Heidelberg spent a
large portion of the funds on innovations in the
field of digital and offset printing. Some 8% of
sales was spent on research and development.
Outlook
Results contributed by our non-core businesses
will decrease even further. We expect earnings at
HOCHTIEF, our construction subsidiary consoli-
dated at equity, to be stable, but Heidelberg’s
operating result in RWE’s current fiscal year is likely
to fall even farther below the figure recorded in
2002. The printing press manufacturer anticipates
continued, significant weakness in order intake.
Although a substantial portion of the savings
achieved by the cost-cutting program will be
realized in 2003, this will not suffice to offset the
cyclically-induced earnings shortfalls.

102
Consolidated Financial Statements
102–170
Consolidated Financial
Statements
104_Income Statement
105_Balance Sheet
106_Cash Flow Statement
107_Changes in Equity
109_Notes
155_Auditors’ Report
Additional Information
156_Material Investments
159_RWE Value Management
160_Boards
166_Glossary
168_Index
_Five-Year Overview
_Financial Calendar
_Design Legend
103
Consolidated Financial Statements
other Group companies
g result
528
24,325
4,146
2,760
€ million
€ million
€ million
€ million
Consolidated Financial Statements
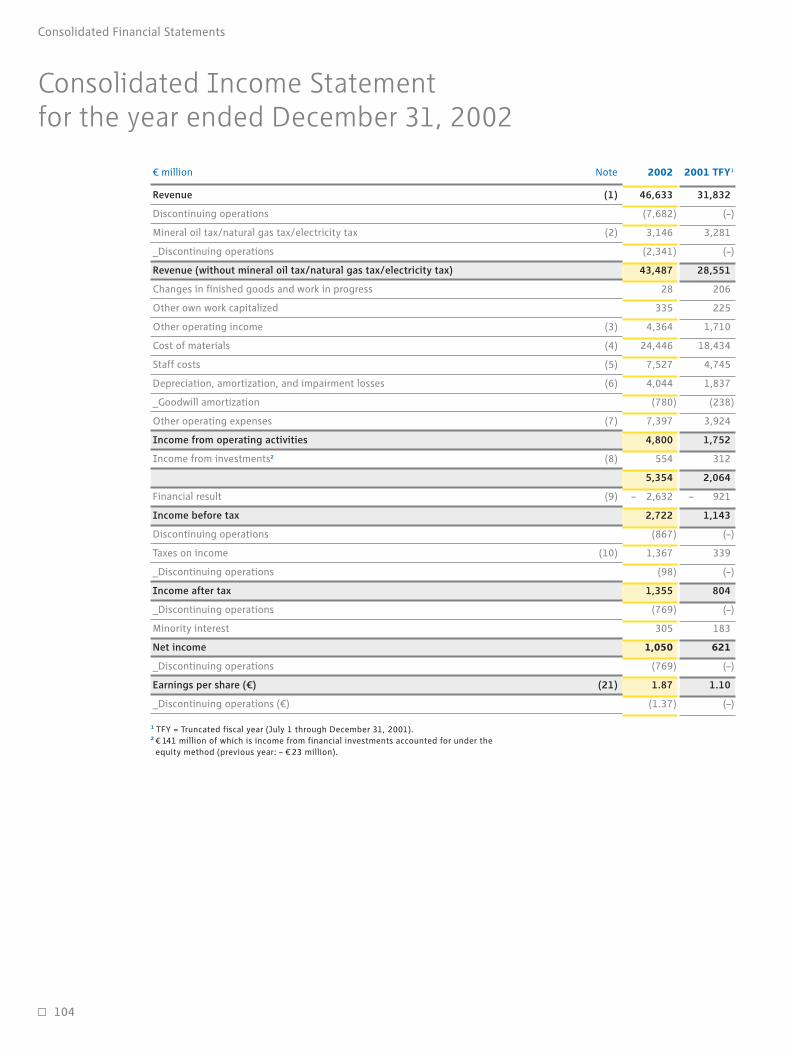
104
Consolidated Financial Statements
31,832
(–)
3,281
(–)
28,551
206
225
1,710
18,434
4,745
1,837
(238)
3,924
1,752
312
2,064
– 921
1,143
(–)
339
(–)
804
(–)
183
621
(–)
1.10
(–)
2001 TFY12002 million Note
1 TFY = Truncated fiscal year (July 1 through December 31, 2001).2 € 141 million of which is income from financial investments accounted for under theequity method (previous year: – € 23 million).
Consolidated Income Statementfor the year ended December 31, 2002
46,633
(7,682)
3,146
(2,341)
43,487
28
335
4,364
24,446
7,527
4,044
(780)
7,397
4,800
554
5,354
– 2,632
2,722
(867)
1,367
(98)
1,355
(769)
305
1,050
(769)
1.87
(1.37)
Revenue (1)
Discontinuing operations
Mineral oil tax/natural gas tax/electricity tax (2)
_Discontinuing operations
Revenue (without mineral oil tax/natural gas tax/electricity tax)
Changes in finished goods and work in progress
Other own work capitalized
Other operating income (3)
Cost of materials (4)
Staff costs (5)
Depreciation, amortization, and impairment losses (6)
_Goodwill amortization
Other operating expenses (7)
Income from operating activities
Income from investments2 (8)
Financial result (9)
Income before tax
Discontinuing operations
Taxes on income (10)
_Discontinuing operations
Income after tax
_Discontinuing operations
Minority interest
Net income
_Discontinuing operations
Earnings per share (€) (21)
_Discontinuing operations (€)
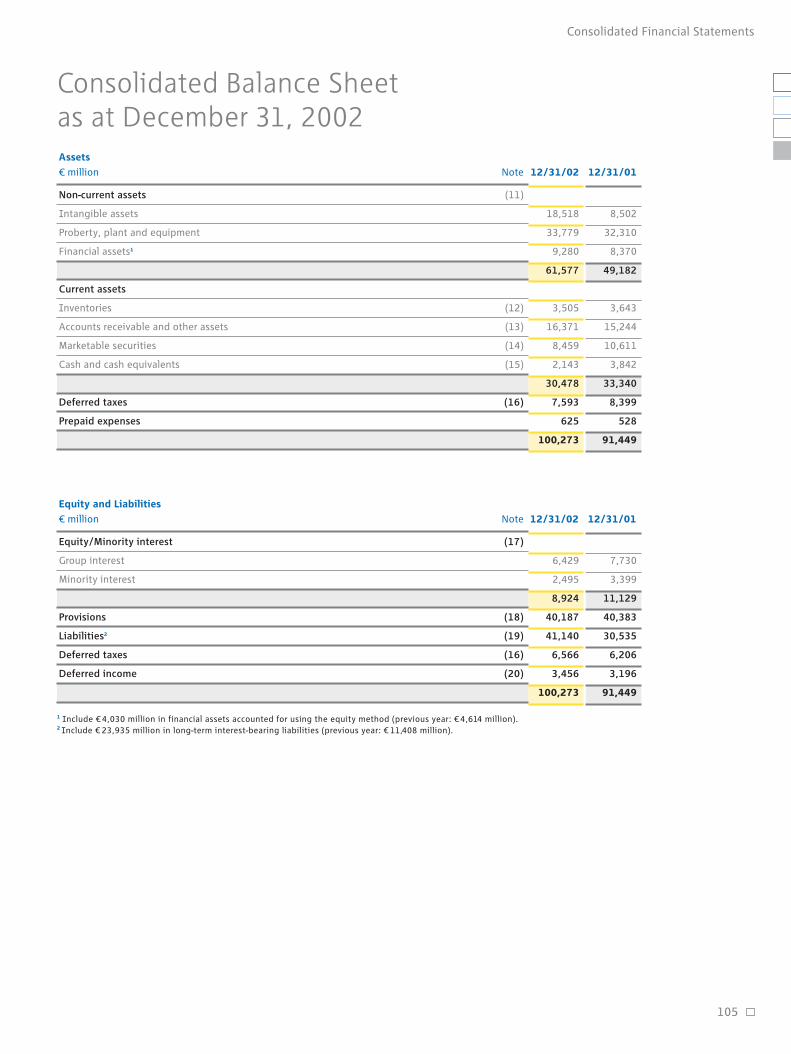
105
Consolidated Financial Statements
Assets
million Note
Non-current assets (11)
Intangible assets
Proberty, plant and equipment
Financial assets1
Current assets
Inventories (12)
Accounts receivable and other assets (13)
Marketable securities (14)
Cash and cash equivalents (15)
Deferred taxes (16)
Prepaid expenses
18,518
33,779
9,280
61,577
3,505
16,371
8,459
2,143
30,478
7,593
625
100,273
8,502
32,310
8,370
49,182
3,643
15,244
10,611
3,842
33,340
8,399
528
91,449
Equity/Minority interest (17)
Group interest
Minority interest
Provisions (18)
Liabilities2 (19)
Deferred taxes (16)
Deferred income (20)
6,429
2,495
8,924
40,187
41,140
6,566
3,456
100,273
7,730
3,399
11,129
40,383
30,535
6,206
3,196
91,449
12/31/0112/31/02
Equity and Liabilities
million Note
1 Include € 4,030 million in financial assets accounted for using the equity method (previous year: € 4,614 million).2 Include € 23,935 million in long-term interest-bearing liabilities (previous year: € 11,408 million).
12/31/0112/31/02
Consolidated Balance Sheetas at December 31, 2002

106
Consolidated Financial Statements
Income after tax
Depreciation, amortization, impairment losses, write-backs
Changes in long-term provisions
Changes in deferred taxes
Other non-cash items
(mainly equity accounting method and result of non-current asset disposals)
Changes in working capital
Changes in other balance sheet items
Cash flows from operating activities
_Discontinuing operations
Intangible assets/property, plant and equipment
_ Capital expenditure
_ Proceeds from sale of assets
Acquisitions, investments and loans to associates and other investments
_ Capital expenditure
_ Proceeds from sale of assets/divestitures
Changes in marketable securities and cash investments
Cash flows from investing activities
_Discontinuing operations
Capital contribution to RWE AG and share of
minority interests in capital contributions to subsidiaries
and share buybacks of RWE Group companies
Dividends paid to RWE shareholders and minority interests
Issuance of financial liabilities
Repayment of financial liabilities
Cash flows from financing activities
_Discontinuing operations
Net change in cash and cash equivalents
Effects of exchange rate changes and other changes in value
Effects of changes in the scope of consolidation
Total net change in cash and cash equivalents
Cash and cash equivalents at beginning of fiscal year
Cash and cash equivalents at end of fiscal year
1,355
4,227
304
– 70
– 1,236
1,116
237
5,933
(300)
– 4,095
594
– 12,890
1,614
254
– 14,523
( – 318)
–
– 838
14,036
– 6,136
7,062
( – 42)
– 1,528
– 86
– 85
– 1,699
3,842
2,143
804
1,801
– 189
– 179
– 502
– 698
– 16
1,021
(–)
– 2,295
297
– 1,411
630
– 1,340
– 4,119
(–)
4
– 236
6,956
– 3,615
3,109
(–)
11
– 27
806
790
3,052
3,842
2001 TFY2002 million cf. Notes (25)
Consolidated Cash Flow Statementfor the year ended December 31, 2002
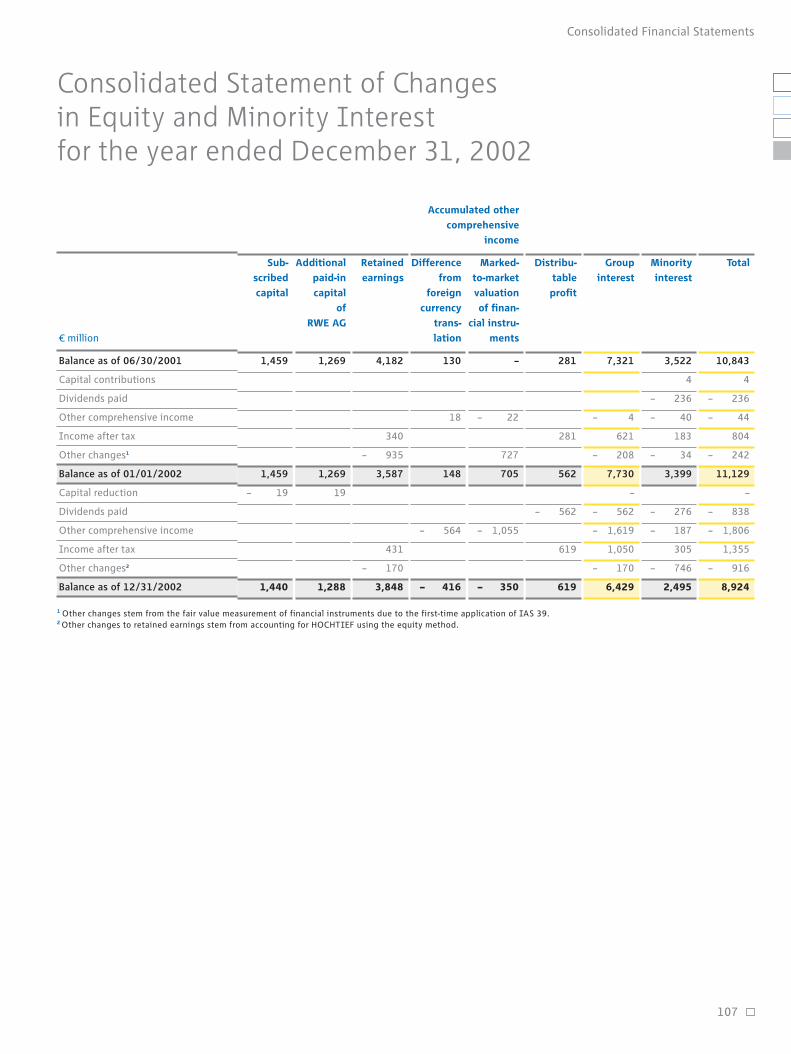
107
Consolidated Financial Statements
Balance as of 06/30/2001
Capital contributions
Dividends paid
Other comprehensive income
Income after tax
Other changes1
Balance as of 01/01/2002
Capital reduction
Dividends paid
Other comprehensive income
Income after tax
Other changes2
Balance as of 12/31/2002
10,843
4
– 236
– 44
804
– 242
11,129
–
– 838
– 1,806
1,355
– 916
8,924
3,522
4
– 236
– 40
183
– 34
3,399
– 276
– 187
305
– 746
2,495
7,321
– 4
621
– 208
7,730
–
– 562
– 1,619
1,050
– 170
6,429
281
281
562
– 562
619
619
–
– 22
727
705
– 1,055
– 350
130
18
148
– 564
– 416
4,182
340
– 935
3,587
431
– 170
3,848
1,269
1,269
19
1,288
1,459
1,459
– 19
1,440
Sub-
scribed
capital
Additional
paid-in
capital
of
RWE AG
Retained
earnings
Difference
from
foreign
currency
trans-
lation
Marked-
to-market
valuation
of finan-
cial instru-
ments
Accumulated other
comprehensive
income
Distribu-
table
profit
Group
interest
Minority
interest
Total
million
Consolidated Statement of Changes in Equity and Minority Interest for the year ended December 31, 2002
1 Other changes stem from the fair value measurement of financial instruments due to the first-time application of IAS 39.2 Other changes to retained earnings stem from accounting for HOCHTIEF using the equity method.
108
Consolidated Financial Statements
prepared. Compliance with legal regulations, the internal
guidelines as well as the reliability and viability of the control
systems are continuously examined throughout the group.
In line with the requirements of the German Corporate Con-
trol and Transparency Act, our risk management system
enables the Executive Board to identify potential risks at an
early stage and initiate countermeasures, if necessary.
The consolidated financial statements, review of group oper-
ations and the report of independent auditors are discussed
in detail by the Audit Committee and at the Supervisory
Board’s meeting on financial statements with the auditors
present. The results of the Supervisory Board’s examination
have been included in the Report of the Supervisory Board
(pages 8 to 11) of this annual report.
Statement by the Executive Board
The Executive Board of RWE AG is responsible for the com-
pleteness and accuracy of the consolidated financial state-
ments and the review of group operations.
The consolidated financial statements for the period ended
December 31, 2002 have been prepared in compliance with
International Accounting Standards (IAS). They are in com-
pliance with the 83/349/EEC Directive. The previous year’s
figures have been calculated according to the same princi-
ples. Pursuant to Section 292a, which was added to the Ger-
man Commercial Code under the German Act to Facilitate the
Raising of Capital, these IAS-compliant consolidated finan-
cial statements have an exempting effect. The regulations set
forth in German Accounting Standard 1 have been complied
with.
Internal control systems, the use of uniform directives
throughout the Group, and our programs for basic and
advanced staff training ensure that the consolidated financial
statements and review of group operations are adequately
Essen, February 25, 2003
The Executive Board
Kuhnt Roels Klein Maichel Remmel Sturany Zilius

109
Notes
Pro-forma presentation
In the following pro-forma presentation, we compared the
period under review with the equivalent prior-year period
from January 1 to December 31, 2001 (pro-forma FY) that
was not audited within the scope of an independent audit.
We adopted the calendar fiscal year as of January 1, 2002.
Completing the transition required us to introduce a trun-
cated fiscal year (TFY) covering the reporting period running
from July 1 to December 31, 2001.
Comparability is limited especially due to the first-time
consolidation of Transgas, the Czech regional utilities (from
May 1, 2002 onwards) and Innogy (from June 1, 2002
onwards).
2001
pro forma
2002
million
46,633
(7,682)
3,146
(2,341)
43,487
363
24,446
7,527
4,044
(780)
– 3,033
4,800
554
– 2,632
2,722
(867)
1,367
(98)
1,355
(769)
305
1,050
(769)
50,366
(–)
6,396
(–)
43,970
397
27,159
7,320
3,513
(449)
– 3,049
3,326
620
– 1,752
2,194
(–)
450
(–)
1,744
(–)
394
1,350
(–)
Revenue
_ Discontinuing operations
Mineral oil tax/natural gas tax/electricity tax
_ Discontinuing operations
Revenue (without mineral oil tax/
natural gas tax/electricity tax)
Changes in finished goods and work in progress/Other
own work capitalized
Cost of materials
Staff costs
Depreciation and amortization
_ Goodwill amortization
Other operating result
Income from operating activities
Income from investments
Financial result
Income before tax
_ Discontinuing operations
Taxes on income
_ Discontinuing operations
Income after tax
_ Discontinuing operations
Minority interest
Net income
_ Discontinuing operations
Consolidated Income Statement

110
Notes
2001
pro forma1
2002
million
1 Reflects the four quarters published for 2001, without additional adjustments.2 Including additional adjustments, the adjusted cash flows from operating activitiestotaled € 3,560 million in the previous pro-forma year.
Consolidated Cash Flow Statement
Segment reporting
5,933
(300)
– 4,095
– 12,890
2,208
254
– 14,523
( – 318)
7,062
( – 42)
– 171
– 1,699
3,842
2,143
1,126
15,494
4,034 2
(–)
– 4,476
– 3,760
2,453
– 1,186
– 6,969
(–)
2,762
(–)
2,211
2,038
1,804
3,842
– 5,160
1,126
Cash flows from operating activities
_Discontinuing operations
Capital expenditure on intangible assets/property, plant and equipment
Capital expenditure on non-current financial assets
Proceeds from sale of property, plant and equipment and financial assets
Changes in marketable securities and cash investments
Cash flows from investing activities
_Discontinuing operations
Cash flows from financing activities
_Discontinuing operations
Other (currency translation adjustments, changes in the scope of consolidation)
Net change in cash and cash equivalents
Cash and cash equivalents at beginning of year
Cash and cash equivalents at end of year
Net financial debt at beginning of year
Net financial debt at end of year
2002 2001
pro-forma
2002 2001
pro-forma
2002 2001
pro-forma
2002 2001
pro-forma
Electricity
Core business
Gas Water Environmental
Services
million
23,797
528
24,325
2,760
4,146
20,504
1,915
19,168
4,221
23,389
1,805
3,378
15,576
1,798
5,666
583
6,249
885
1,239
5,959
564
3,724
606
4,330
699
877
3,252
396
2,850
0
2,850
963
1,457
13,200
1,123
2,746
0
2,746
865
1,327
12,856
959
2,136
43
2,179
98
281
1,689
161
2,055
33
2,088
147
321
1,348
266
External revenue
Internal revenue
Total revenue
Operating result
EBITDA
Operating assets
(as per the value
management concept)
Capital expenditure
on intangible assets
and property, plant
and equipment

Cash flows from operating activities rose to € 5,933 million.
Cash flows from investing activities totaled € 14,523 million.
Financial debt assumed to finance these capital expenditures
resulted in € 7,062 million in cash provided by financing
activities. Cash and cash equivalents declined by € 1,699 mil-
lion.
Net financial debt increased by € 14,368 million to € 15,494
million in the fiscal year. This rise was primariy due to capital
expenditures on property, plant and equipment and financial
assets as well as the assumption of net financial debt from
newly acquired companies. Cash provided by operating activ-
ities had the most significant counteractive effect.
111
Notes
Financial
investments
2002 2001
pro-forma
Discontinuing
operations
RWE Dea Downstream
2002 2001
pro-forma
Other/holding/
consolidation
2002 2001
pro-forma
Group
2002 2001
pro-forma
Non-core business
4,315
0
4,315
186
414
4,386
244
5,330
0
5,330
371
574
4,194
262
7,682
3
7,685
– 6
52
409
28
16,641
62
16,703
392
525
807
110
187
1,407
1,594
– 382
– 348
– 1,854
60
702
1,136
1,838
– 371
– 212
– 276
119
46,633
2,564
49,197
4,504
7,241
44,293
4,095
50,366
6,058
56,424
3,908
6,790
37,757
3,910
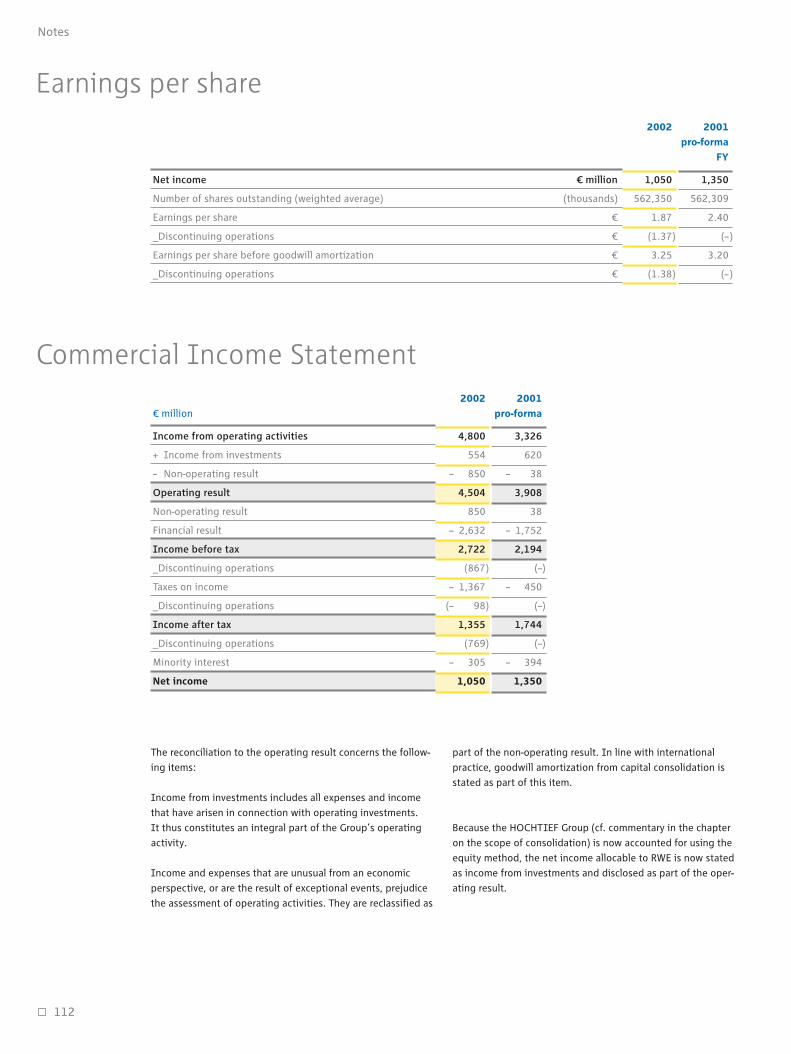
The reconciliation to the operating result concerns the follow-
ing items:
Income from investments includes all expenses and income
that have arisen in connection with operating investments.
It thus constitutes an integral part of the Group’s operating
activity.
Income and expenses that are unusual from an economic
perspective, or are the result of exceptional events, prejudice
the assessment of operating activities. They are reclassified as
part of the non-operating result. In line with international
practice, goodwill amortization from capital consolidation is
stated as part of this item.
Because the HOCHTIEF Group (cf. commentary in the chapter
on the scope of consolidation) is now accounted for using the
equity method, the net income allocable to RWE is now stated
as income from investments and disclosed as part of the oper-
ating result.
112
Notes
Earnings per share
Commercial Income Statement
1,050
562,350
1.87
(1.37)
3.25
(1.38)
1,350
562,309
2.40
(–)
3.20
(–)
2002 2001
pro-forma
FY
Income from operating activities
+ Income from investments
– Non-operating result
Operating result
Non-operating result
Financial result
Income before tax
_Discontinuing operations
Taxes on income
_Discontinuing operations
Income after tax
_Discontinuing operations
Minority interest
Net income
2001
pro-forma
2002
million
Net income € million
Number of shares outstanding (weighted average) (thousands)
Earnings per share
_Discontinuing operations
Earnings per share before goodwill amortization
_Discontinuing operations
4,800
554
– 850
4,504
850
– 2,632
2,722
(867)
– 1,367
(– 98)
1,355
(769)
– 305
1,050
3,326
620
– 38
3,908
38
– 1,752
2,194
(–)
– 450
(–)
1,744
(–)
– 394
1,350

International Accounting Standards effective as of the bal-
ance-sheet date were applied when preparing the consolidat-
ed financial statements. Furthermore, the interpretations of
the Standing Interpretations Committee (SIC)* have been
applied.
A cash flow statement and a statement of changes in equity
and minority interests have been disclosed in addition to the
income statement and the balance sheet. Moreover, state-
ments made in the notes to the financial statements include
segment reporting.
Several balance sheet and income statement items have been
combined in order to improve clarity. These items are stated
and explained separately in the notes to the financial state-
ments. The income statement has been prepared using the
nature of expense method.
The consolidated financial statements have been prepared in
euros. All amounts (unless specified otherwise) are stated in
millions of euros (€ million).
The consolidated financial statements presented here cover
the 2002 fiscal year on the basis of the reporting period from
January 1 to December 31, 2002.
Figures from the truncated fiscal year from July 1 to Decem-
ber 31, 2001 are used as prior-year figures. This limits the
extent to which the figures from the fiscal year can be com-
pared against those from the previous year, especially with
regard to the income and cash flow statements. We have pre-
pared the comparable figures in the review of operations and
the pro-forma presentation included in the notes to the
financial statements to allow for a comparison between actu-
al business developments for the periods from January 1 to
December 31, 2002 and from January 1 to December 31,
2001 (cf. page 36 et seq. of the annual report).
113
Notes
In addition to RWE AG, the consolidated financial state-
ments, contain all domestic and foreign subsidiaries which
RWE AG controls directly or indirectly. Material associates are
accounted for using the equity method.
If investments in subsidiaries, joint ventures or associates are
of secondary importance from a group perspective they are
accounted for in compliance with IAS 39. Non-operating
subsidiaries and those with small business volumes are
generally not consolidated. Altogether, they account for less
than 1% of consolidated, revenue and income. As a rule, sub-
sidiaries reporting a net loss or a negative equity are fully
consolidated.
Subsidiaries that have a different balance-sheet date prepare
interim financial statements.
A collective listing of the Group’s investments in accordance
with Sec. 313, Para. 2, Nos. 1 to 4 and Para. 3 of the German
Commercial Code (HGB) has been filed in the Commercial
Register of the Essen District Court. Principal consolidated
subsidiaries, enterprises accounted for using the equity
method, and other investments are listed on pages 156
to 158.
Forty companies domiciled in Germany and 108 domiciled
abroad were consolidated for the first time in the fiscal year.
Two hundred and forty-nine companies, 199 of which are
headquartered abroad, were excluded from the scope of con-
solidation. Twenty-three enterprises, three of which are
based abroad, were merged. Seventy-four associated compa-
nies, including 56 abroad, were accounted for at equity for
the first time. Sixty-seven enterprises, which had been
accounted for under the equity method in the previous year,
including 25 abroad, have been sold, merged, or fully consol-
idated. First-time consolidation and deconsolidation general-
ly take place at the time of acquisition or sale of the shares
concerned.
Basis of presentation
Scope of consolidation
Fully consolidated companies
Investments accounted
for using the equity method
848
238
724
245
454
101
270
144
Total
12/31/02
Total
12/31/01
Foreign
12/31/02
German
12/31/02
167

As far as affiliates are concerned, the following share increas-
es and acquisitions are particularly significant:
jInnogy Holdings plc, UK, acqusition of a 100.0% stake;
€ 5,056 million in acquisition costs; consolidated for the
first time as of June 1, 2002. As a result of the first-time
consolidation the purchase price exceeded the fair values
of acquired assets and liabilities by € 7.8 billion that break
down as follows:
_ € 5.6 billion in goodwill
_ € 3.2 billion from customer relationships
_ € 1.0 billion in deferred tax liabilities
jTransgas a.s., Czech Republic; acquisition of a 97.0%
stake; €4,053 million in acquisition costs, including costs
incurred for purchasing shares in eight regional utilities,
six of which are majority interests of 50.1% to 58.1%, two
of which are minority stakes of 49.2% and 46.9%
(accounted for at equity) respectively; consolidated for
the first time as of May 1, 2002
jTrienekens AG, Viersen, Germany; increased stake from
50.0% to 100.0%; subsequently merged into RWE Umwelt
AG with economic effect as of January 1, 2002
jObragas N.V., Netherlands; acquisition of a 90.1% stake;
€ 319 million in acquisition costs; consolidated for the
first time as of July 1, 2002
jRWW Rheinisch-Westfälische Wasserwerksgesellschaft
mbH, Mülheim on the Ruhr, Germany; increased stake
by 65.5% to 79.8%, 233 million in acquisition costs;
consolidated for the first time as of April 1, 2002
jHighland Energy Holdings Ltd., UK (renamed RWE Dea UK
Ltd); acquisition of a 100.0% stake; € 183 million in
acquisition costs; consolidated for the first time as of
January 1, 2002
jVSE AG, Saarbrücken, Germany, increased stake by 28.0%
to 69.3%; € 119 million in acquisition costs; consolidated
for the first time as of January 1, 2002
The 75% stake in Thyssengas was fully consolidated for the
first time as of January 2002.
A total of € 10,119 million was used to acquire stakes in com-
panies that were consolidated for the first time, which was
paid in cash or cash equivalents. All in all, a net €4,508 mil-
lion in non-current assets, - €1,944 million in current assets
(including deferred taxes), - € 85 million in cash and cash
equivalents as well as € 2,143 million in liabilities and provi-
sions were assumed or transferred as a result of the acquisi-
tion and divestment of consolidated enterprises. Net finan-
cial debt assumed totaled €4,557 million.
As regards companies accounted for at equity, the following
share acquisitions should be highlighted:
jGEW RheinEnergie AG, Cologne, Germany; acquired a
20.0% stake; € 163 million in acquisition costs, including
a capital increase
jChina Water Company Ltd., China; acquisition of a 48.8%
stake; € 71 million in acquisition costs
jElettra GLLS P.A., Italy; acquisition of a 25.0% stake;
€ 69 million in acquisition costs, including a capital
increase
jNiederrheinwerke GmbH, Viersen, Germany; acquisition
of a 49.0% stake; € 64 million in acquisition costs
In 2003, we will fully consolidate the Polish-based electric
utility STOEN, which was acquired by RWE Plus at the end of
2002. Effective January 1, 2002, the stake in HOCHTIEF
directly held by RWE AG was reduced and the majority stake
in the holding company Francommerz was given up. Since
the preconditions for full consolidation were no longer
met as a result of the transactions, HOCHTIEF has been
accounted for at equity since January 1, 2002. Consequently,
HOCHTIEF was only included in the operating result based
on its prorated net income. HOCHTIEF appears under
the segment entitled “financial investments” in segment
reporting.
The following sales of shareholdings are noteworthy:
jShell & DEA Oil GmbH, Hamburg (joint venture)
jHeidelberger Druckmaschinen AG, Heidelberg; sharehold-
ing reduced by 6.14%
Divested subsidiaries fetched a total selling price of € 232
million, which were paid in cash or cash equivalents. Infor-
mation on the divestment of the shares in the Shell & DEA
Oil joint venture is included below under “Discontinuing
operations.”
Discontinuing operations
The 50% stake in the Shell & DEA Oil GmbH joint venture was
sold to our partner Shell as of July 1, 2002. Proceeds from
the divestment totaled € 1,514 million. RWE Dea’s down-
stream operations were transferred to this joint venture effec-
tive January 2, 2002. The RWE Dea Downstream segment,
which exclusively included the joint venture, is disclosed as a
discontinuing operation. Information on discontinuing oper-
ations and on key figures is stated separately in the income
and cash flow statements.
The review of operations contains further information on
major shareholding acquisitions and divestments.
Effects of changes in the scope of consolidation have been
stated in the notes to the financial statements insofar as they
are of particular importance.
114
Notes

115
Notes
The financial statements of German and foreign companies
included in the scope of consolidation are prepared using
uniform accounting policies.
Capital consolidation takes place by offsetting the invest-
ments’ carrying amounts against the proportionate value of
subsidiaries’ equity that is revalued at their time of acquisi-
tion. Assets and liabilities are recognized at fair value.
Remaining excess costs are capitalized as goodwill
and—according to their future economic benefit—amortized
over a period of up to 20 years, with an effect on results.
Negative goodwill from first-time consolidations is also car-
ried as an asset and released in accordance with IAS 22.61
to 22.63. Within the scope of deconsolidation, residual carry-
ing amounts of goodwill and negative goodwill are taken
into account when calculating income from disposals.
Expenses and income as well as receivables and payables
between consolidated companies are eliminated. Intra-group
profits and losses are eliminated unless they are of minor sig-
nificance. As a general rule, the amortization of investments
in consolidated enterprises disclosed in separate financial
statements is reversed.
The Shell & DEA Oil joint venture’s financial statements were
included in RWE’s consolidated financial statements pro-rata,
according to the principles applied for subsidiaries.
The same consolidation principles apply to the joint ventures
and investments in associates accounted for at equity, where-
by recognized goodwill is reported on the balance sheet
under investments and amortization is disclosed in income
from investments accordingly. Uniform accounting principles
have also been observed for the financial statements of all
principal enterprises accounted for using the equity method.
Foreign-currency transactions disclosed in companies’ sepa-
rate financial statements are valued at the exchange rate
valid when they are added to the books. Exchange rate gains
and losses from the assessment of monetary assets or mone-
tary liabilities in foreign currency occurring up to the balance-
sheet date are included in income.
Functional currency translation is applied when converting
the currencies of foreign companies’ financial statements.
In the consolidated financial statements, the balance-sheet
items of all foreign companies are translated from the respec-
tive country’s currency into euros at the average exchange
rate prevailing on the balance-sheet date in compliance with
official regulations, since principal foreign enterprises includ-
ed in the consolidated financial statements conduct their
business activities independently in their national currencies.
When translating the adjusted equity of foreign enterprises
accounted for under the equity method, the same procedure
is followed. Differences to previous-year translations are net-
ted out against other comprehensive income without an
effect on profits or losses. Goodwill is translated at year end
as an asset of the economically autonomous foreign sub-unit.
Income and expense items are translated at annual average
exchange rates. Annual financial statements of Group compa-
nies based in a country with hyperinflation are translated
according to IAS 29.
Consolidation principles
Currency translation

116
Notes
Intangible assets are accounted for at cost, less usage-
induced amortization. Software for commercial and technical
applications is amortized over three to five years using the
straight-line method; concessions and other usage rights
generally have useful lives of up to 20 years. Goodwill from
separate financial statements is capitalized and amortized
over its expected useful life using the straight-line method,
as is goodwill from capital consolidation. Negative goodwill
from capital consolidation is stated as an asset under intangi-
ble assets.
Development costs are recognized as assets if a newly devel-
oped product or process can be clearly identified, is techni-
cally feasible, and it is the company’s intention to either use
the product or process itself or market it. Furthermore, asset
recognition requires that there be a sufficient level of certain-
ty that the development costs will provide future cash
inflows. Capitalized development costs are amortized over
the time period during which the products are expected to
be sold. Research costs are recognized as an expense.
Property, plant and equipment is stated at cost, less depre-
ciation through use. The borrowing cost is not capitalized as
part of the cost. Exploratory drillings are disclosed according
to the successful efforts method, i.e. as a rule, they are capi-
talized only in the event of commercial success. As a rule,
property, plant and equipment as well as mining develop-
ments are depreciated using the straight-line method unless
another depreciation method is better suited to the usage
pattern.
Investment property is measured at depreciated cost. The
fair value of the Group’s investment property is stated in the
notes to the financial statements. It is determined using
internationally accepted valuation principles, such as the dis-
counted cash flow method, or derived from current market
prices of comparable real estate.
Accounting policies
The following exchange rates (among others) were used as a
basis for currency translation:
1 US dollar
1 Pound Sterling
100 Czech kroners
100 Hungarian forints
0.96
1.54
3.18
0.42
1.12
1.61
2.99
0.40
1.06
1.59
3.25
0.41
1.13
1.64
3.13
0.41
12/31/02
Year end
12/31/01in 2001 TFY2002
Average
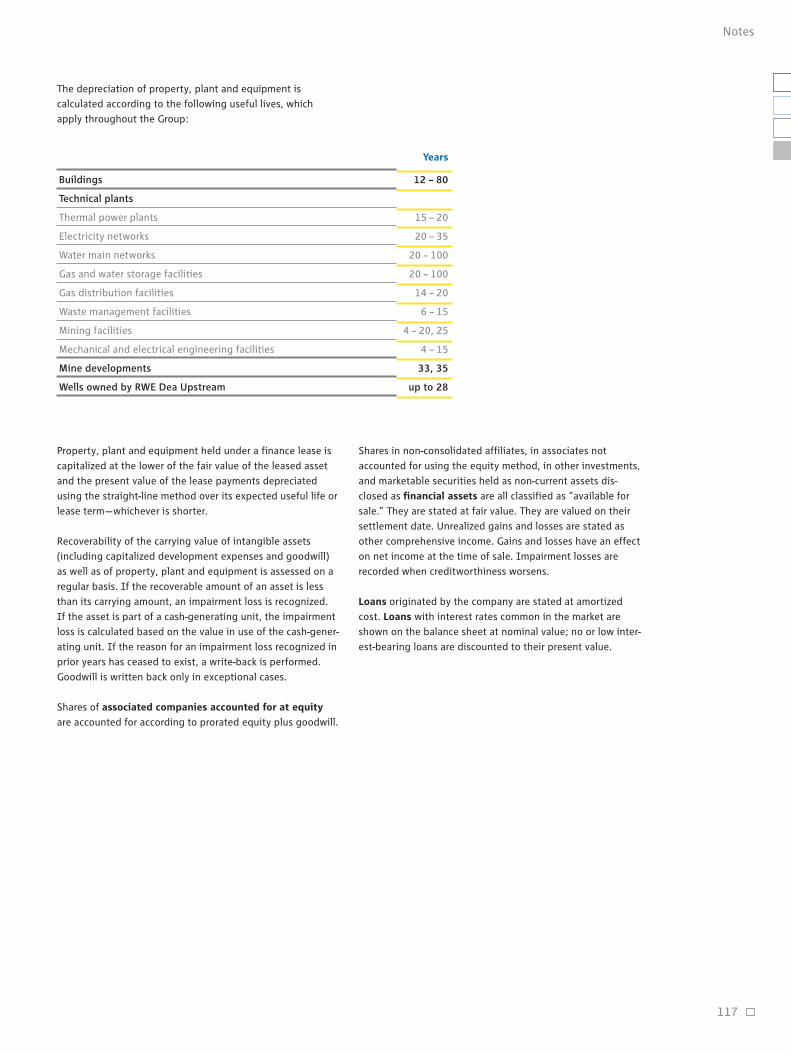
117
Notes
Property, plant and equipment held under a finance lease is
capitalized at the lower of the fair value of the leased asset
and the present value of the lease payments depreciated
using the straight-line method over its expected useful life or
lease term—whichever is shorter.
Recoverability of the carrying value of intangible assets
(including capitalized development expenses and goodwill)
as well as of property, plant and equipment is assessed on a
regular basis. If the recoverable amount of an asset is less
than its carrying amount, an impairment loss is recognized.
If the asset is part of a cash-generating unit, the impairment
loss is calculated based on the value in use of the cash-gener-
ating unit. If the reason for an impairment loss recognized in
prior years has ceased to exist, a write-back is performed.
Goodwill is written back only in exceptional cases.
Shares of associated companies accounted for at equity
are accounted for according to prorated equity plus goodwill.
The depreciation of property, plant and equipment is
calculated according to the following useful lives, which
apply throughout the Group:
Shares in non-consolidated affiliates, in associates not
accounted for using the equity method, in other investments,
and marketable securities held as non-current assets dis-
closed as financial assets are all classified as “available for
sale.” They are stated at fair value. They are valued on their
settlement date. Unrealized gains and losses are stated as
other comprehensive income. Gains and losses have an effect
on net income at the time of sale. Impairment losses are
recorded when creditworthiness worsens.
Loans originated by the company are stated at amortized
cost. Loans with interest rates common in the market are
shown on the balance sheet at nominal value; no or low inter-
est-bearing loans are discounted to their present value.
Buildings
Technical plants
Thermal power plants
Electricity networks
Water main networks
Gas and water storage facilities
Gas distribution facilities
Waste management facilities
Mining facilities
Mechanical and electrical engineering facilities
Mine developments
Wells owned by RWE Dea Upstream
12 – 80
15 – 20
20 – 35
20 – 100
20 – 100
14 – 20
6 – 15
4 – 20, 25
4 – 15
33, 35
up to 28
Years

Inventories are carried at cost. Assessment is generally
based on average values. The overburden of lignite mining is
determined according to the FIFO method. Production costs
include full costs and are determined based on the produc-
tion facilities’ normal capacity. When broken down, in addi-
tion to directly allocable costs, production costs include ade-
quate portions of required materials and production over-
heads, including production-related depreciation and pen-
sion benefit expenses. The borrowing cost is not capitalized
as part of the cost. Inventory risks resulting from decreased
usability are taken into account via appropriate value
allowances. We disclose lower values at year end stemming
from reduced net gains on disposals. If the net realizable
value of inventories written down in earlier periods has
increased, the resulting reversal of the write-down is recog-
nized as a reduction of the cost of materials.
Prepayments received from customers are carried as liabilities.
Nuclear fuel assemblies shown under inventories are stated
at depreciated cost. Depreciation is determined by operation
and capacity based on consumption and the reactor’s useful
life, respectively.
Long-term construction contracts are recognized under the
percentage of completion method. The capitalizable amount
is disclosed under revenue and accounts receivable. The per-
centage of completion is determined according to the costs
incurred (cost-to-cost method). Expected contract losses are
covered by valuation allowances or provisions and are deter-
mined taking identifiable risks into account. Contract revenue
comprises the amount of revenue agreed in the contract.
Accounts receivable and other assets are stated at acquisi-
tion cost after deducting necessary valuation allowances
which are based on the actual default risk. Under accounts
receivable for supplies and services from utilities, prepay-
ments received are netted out against customer consumption
which is yet to be metered and billed.
Current marketable securities are all classified as “available
for sale” and are stated at fair value. This item is primarily
composed of marketable securities held in special funds as
well as fixed interest securities with a maturity more than
three months from the date of acquisition. They are valued on
their settlement date. Unrealized gains and losses are stated
as other comprehensive income. Gains and losses have an
effect on net income at the time of sale. Impairment losses
are recorded when creditworthiness worsens.
Provisions (accrued liabilities) for pensions and similar
obligations are calculated according to the projected unit
credit method. This benefit/years-of-service method does not
only take into account the pension benefits and benefit enti-
tlements known as of the balance-sheet date, but also
increases in salaries and pension benefits to be expected in
the future. Actuarial gains and losses falling outside the lim-
its of a 10% range of total benefit obligations are distributed
over the average remaining working lives. The service cost is
allocated to staff costs, and the interest accretion to provi-
sions is allocated to the financial result.
All other provisions (accrued liabilities) take into account
all obligations identifiable as of the balance-sheet date which
result from previous transactions or events whose amount or
due date is not certain. Provisions are carried at settlement
amounts and are not offset against reimbursement claims.
The most probable settlement value is used as a starting
point. Provisions are only recognized when based on legal or
de-facto obligations to third parties.
118
Notes
All long-term provisions are recognized at the settlement
value that is discounted as of the balance-sheet date. The
settlement value also includes the cost increases to be taken
into account as of the balance-sheet date. Excluded from this
are pension provisions for which special rules apply in accor-
dance with IAS 19.
Deferred taxes resulting from temporary differences between
the carrying amount in the separate financial statements and
the tax base and from consolidation procedures are disclosed
separately. Deferred tax assets also include tax reduction
claims resulting from the expected utilization of existing loss
carryforwards in subsequent years. They are capitalized when
their realization is guaranteed with sufficient certainty.
Deferred taxes are assessed based on tax rates that are
applicable or expected in the individual countries at the time
of realization. The taxation rate used to calculate German
deferred taxes is 39.28%. The Group’s average local business
tax rate has been taken into account in addition to the 25%
corporate income tax rate and the 5.5% solidarity surcharge.
Otherwise, tax regulations for calculating deferred taxes valid
or adopted as of the balance-sheet date apply.
Liabilities are valued in the amount of the obligations.
Liabilities from finance lease agreements are measured at
the amount of the present value of the lease payments.
Advances and contributions in aid of construction and buil-
ding connection that are carried on the liabilities side by the
utilities as deferred income are amortized with an income
effect over a period of 20 years, dependent on the contract,
if necessary. Taxable subsidies and tax-free grants for non-
current assets—which are usually issued by the government—
are disclosed as deferred income on the balance sheet and
recognized as other operating income in line with the assets’
depreciation.
Derivative financial instruments are exclusively used for
hedging purposes. All derivative financial instruments are
accounted for as assets or liabilities. All derivative financial
instruments are stated at fair value regardless of their pur-
pose.
If the conditions of a fair value hedge are met, changes in
the fair valuation of hedging instruments as well as of the
hedged item are recognized in the income statement. The
gains and losses from the fair valuation of the hedging
instrument are allocated to the same line item of the income
statement as those of the related hedged item.
If a cash flow hedge or a hedge of a net investment in a for-
eign entity exists, unrealized gains and losses from the
hedge are initially stated as part of other comprehensive
income. Gains and losses are disclosed in the income state-
ment as soon as the hedged underlying transaction has an
effect on results. If the gain or loss on a hedge relates to the
acquisition of an asset or a liability, the gain or loss on the
hedge is taken into account when determining the acquisi-
tion costs and/or when stating the value of the liability.
The ineffective part of a hedging relationship is recognized
with an effect on results in the income statement.
Contingent liabilities are possible or present obligations
that arise from past events and for which an outflow of
resources is not probable. They are not recorded on the bal-
ance sheet. The amounts disclosed are the amounts that
would have to be paid to settle the obligation at the balance
sheet date.
119
Notes

120
Notes
Revenue is recorded once the risk has been transferred to the
customer. This does not apply to contract revenue recognized
under the percentage of completion method for long-term
construction contracts. Mineral oil tax/natural gas tax/elec-
tricity tax paid directly by Group companies are disclosed
separately.
To improve the presentation of the business development,
revenue generated by energy trading operations is stated
as net figures for the first time. This means that revenue now
only reflects realized gross margins. The previous year’s
figures have been adjusted. Furthermore, electricity, gas,
coal and oil transactions that are subject to physical settle-
ment are stated as gross figures. Energy trading revenue is
generated by RWE Trading and Innogy. In fiscal 2002, gross
revenue (including energy trading revenue) amounted to
€ 55,520 million (previous year: € 33,301 million).
The segment reporting on pages 148 and 149 contains a
breakdown by business area and geographic region. Of the
€46,633 million in revenue (previous year: € 31,832 million),
€ 28 million (previous year: € 6,106 million) are attributable
to revenue from construction contracts, while € 301 million
are attributable to the change in the scope of consolidation.
Mineral oil tax/natural gas tax/electricity tax are the taxes
paid directly by Group companies.
Results from derivative energy trading activities is stated in net
amounts. The previous year’s figure has been adjusted.
Income from the disposal of financial assets is disclosed under
income from investments if it relates to investments; otherwise,
it is recorded as part of the financial result, as is the income
from the disposal of current marketable securities.
Currency gains are contrasted against currency losses that are
disclosed under other operating expenses.
The change in the scope of consolidation caused other operat-
ing income to increase by € 12 million.
Notes to the Income Statement
(1) Revenue
(2) Mineral oil tax/natural gas tax/electricity tax
(3) Other operating income
2001 TFY2002 million
The following table summarizes the other operating income:
Reversal of unused provisions
Disposal of non-current assets
excluding financial assets
Disposal and write-back of current assets
excluding marketable securities
Derivative financial transactions
Currency gains
Other
1,559
226
91
366
316
1,806
4,364
355
111
38
1
62
1,143
1,710

Wage earners
Salaried staff
_Part-time and fixed-term employees
Trainees
121
Notes
The cost of pension benefits is € 297 million (previous year:
€ 241 million); this figure consists mainly of € 196 million
in benefits earned in the fiscal year (previous year:
€ 123 million) as well as adjustments for past service costs
in the amount of € 18 million and recognized actuarial losses
of € 9 million.
Employee equivalents include full-time staff members at
100%, whereas part-time and fixed-term employees are
included on a prorated basis in accordance with the extent of
their part-time work or their duration of employment.
The cost of raw materials also contains transfers to provisions
for the management of spent nuclear fuel assemblies,
€ 123 million (previous year: € 57 million) in amounts written
off for nuclear fuel assemblies, and € 77 million (previous
year: €42 million) in taxes paid for RWE-Dea Upstream’s
foreign production companies. A total of € 8,887 million in
material costs (previous year: € 1,469 million) were netted
out against energy trading revenue. Due to the change in the
scope of consolidation, the cost of materials decreased by
€455 million.
(4) Cost of materials
(5) Staff costs
2001 TFY2002 million
Cost of raw materials and of goods for resale
Costs of purchased services
19,739
4,707
24,446
12,301
6,133
18,434
2001 TFY2002 million
Wages and salaries
Cost of social security, pensions, and other benefits
6,091
1,436
7,527
3,909
836
4,745
2001 TFY2002Annual average employee equivalents
72,587
84,368
156,955
(7,640)
5,385
162,340
Consolidation effects caused staff costs to decrease by
€ 322 million.
53,326
74,852
128,178
(6,996)
4,429
132,607
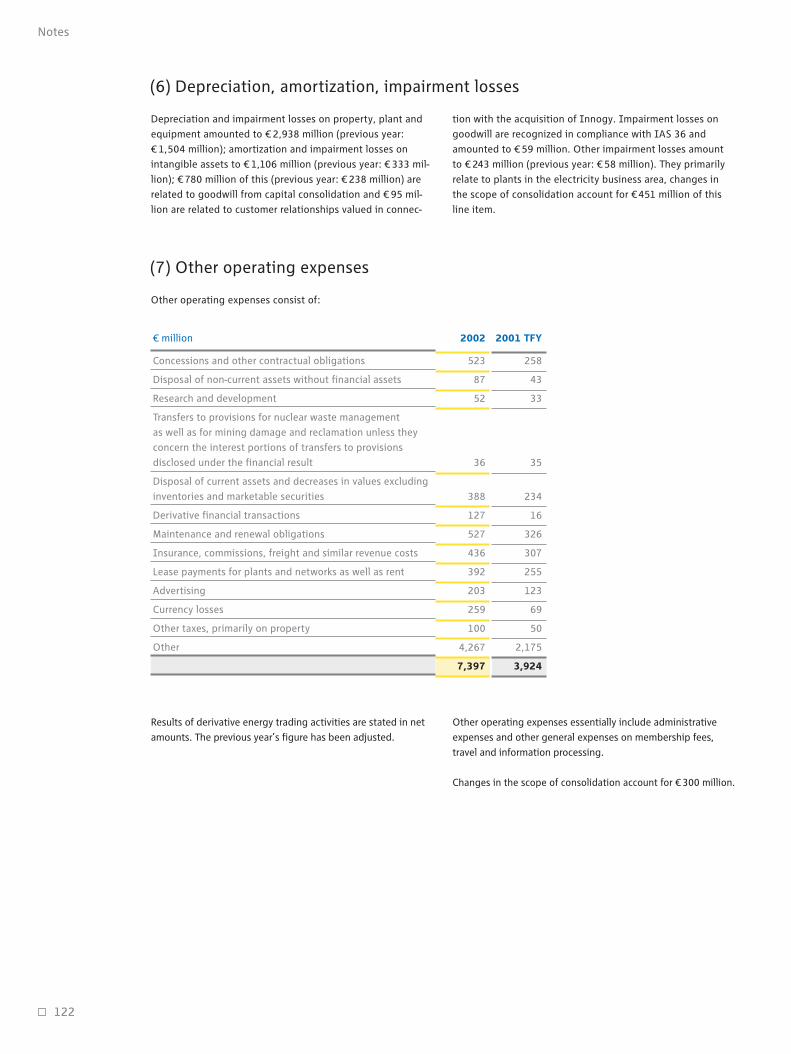
122
Notes
Depreciation and impairment losses on property, plant and
equipment amounted to € 2,938 million (previous year:
€ 1,504 million); amortization and impairment losses on
intangible assets to € 1,106 million (previous year: € 333 mil-
lion); € 780 million of this (previous year: € 238 million) are
related to goodwill from capital consolidation and € 95 mil-
lion are related to customer relationships valued in connec-
tion with the acquisition of Innogy. Impairment losses on
goodwill are recognized in compliance with IAS 36 and
amounted to € 59 million. Other impairment losses amount
to € 243 million (previous year: € 58 million). They primarily
relate to plants in the electricity business area, changes in
the scope of consolidation account for €451 million of this
line item.
Results of derivative energy trading activities are stated in net
amounts. The previous year’s figure has been adjusted.
Other operating expenses essentially include administrative
expenses and other general expenses on membership fees,
travel and information processing.
Changes in the scope of consolidation account for € 300 million.
Other operating expenses consist of:
(6) Depreciation, amortization, impairment losses
(7) Other operating expenses
2001 TFY2002 million
523
87
52
36
388
127
527
436
392
203
259
100
4,267
7,397
Concessions and other contractual obligations
Disposal of non-current assets without financial assets
Research and development
Transfers to provisions for nuclear waste management
as well as for mining damage and reclamation unless they
concern the interest portions of transfers to provisions
disclosed under the financial result
Disposal of current assets and decreases in values excluding
inventories and marketable securities
Derivative financial transactions
Maintenance and renewal obligations
Insurance, commissions, freight and similar revenue costs
Lease payments for plants and networks as well as rent
Advertising
Currency losses
Other taxes, primarily on property
Other
258
43
33
35
234
16
326
307
255
123
69
50
2,175
3,924

123
Notes
Income from investments contains profit contributions from
operating investments. They represent almost all interests
held in unconsolidated enterprises, including associates. The
business activities of these investments are closely linked to
the performance of fully consolidated enterprises. Income
from investments includes all income and expenses which
have arisen in connection with these investments.
Impairment losses on financial assets included in income
from investments amounted to € 92 million (previous year:
€ 25 million); €4 million thereof are accounted for by loans to
investments (previous year: € 2 million).
Changes in the scope of consolidation increased income from
investments by €45 million.
(8) Income from investments
2001 TFY2002 million
Income from profit- and loss-pooling agreements
Expenses from profit- and loss-pooling agreements
Income from investments
_ from unconsolidated subsidiaries
_ from associates accounted for using the equity method
_ from other investments
_ of which corporate income tax imputation credit
Income from the disposal of investments
Expenses from the disposal of investments
Amortization and impairment losses on investments
_ of which amortization of shares in companies accounted for at equity
_ of which amortization of goodwill of companies accounted for at equity
_ of which relating to unconsolidated subsidiaries
Income from loans to investments
Expenses from loans to investments
Other
Income from investments
10
– 24
10
5
36
51
(16)
327
– 2
– 56
(–)
( – 33)
( – 8)
8
– 2
0
312
21
– 15
103
494
63
660
(4)
423
– 104
– 440
( – 230)
( – 123)
( – 14)
18
– 6
– 3
554

124
Notes
Profit contributions included in the financial result are non-
operating. The financial result breaks down into three compo-
nents: “net interest,” “interest accretion to provisions,” and
“other financial result.”
Net interest includes interest income from interest-bearing
marketable securities and loans as well as all expenses and
income relating to current marketable securities and all inter-
est expenses. Net interest also includes all prorated profits
and dividends from marketable securities held as non-current
and current assets.
Interest accretions to provisions contain the reversal alloca-
ble to the current year of the discounting of long-term provi-
sions due to the annual update of the present value calcula-
tion.
The other financial result contains all other financial income
and financial expenses which cannot be allocated to the net
interest or to the interest accretion to provisions. Among
other things, financial income includes € 139 million in gains
realized from the disposal of marketable securities. Other
financial expenses include impairment losses of loans and
marketable securities in the amount of € 142 million (previ-
ous year: € 6 million) and € 340 million in losses realized from
the disposal of marketable securities, essentially due to long-
term changes in fair values. Changes in the scope of consoli-
dation reduced the financial result by € 19 million.
(9) Financial result
2001 TFY2002 million
Interest and similar income
of which from unconsolidated subsidiaries
Interest and similar expenses
_of which relating to unconsolidated subsidiaries
Net interest
Interest accretion to provisions
for pensions and similar obligations
Interest accretion to provisions for nuclear
waste management as well as to mining provisions
Interest accretion to other provisions
Interest accretion to provisions
Other financial income
Other financial expenses
Other financial result
Financial result
572
(4)
– 789
(– 7)
– 217
– 379
– 331
– 84
– 794
277
– 187
90
– 921
1,305
(10)
– 1,949
(– 29)
– 644
– 723
– 601
– 278
– 1,602
473
– 859
– 386
– 2,632

125
Notes
On balance, current taxes on income contain €40 million in
tax back payments (previous year: tax refund of € 19 million)
relating to prior periods.
Changes in tax rates led to a deferred tax income of
€ 19 million. German deferred taxes are calculated using a tax
rate of 39.28%. Due to the German law for solidarity with
flooding victims that came into force in September 2002, the
corporate tax rate rose exclusively for the 2003 fiscal year
from 25% to 26.5%. The average tax rate used to calculate
deferred taxes was unchanged. By consequence, there are
no related changes in the valuation of deferred taxes whose
inverse effects will occur in 2003. Due to tax loss carryfor-
wards unrecognized in prior years, current taxes on income
were reduced by € 169 million (previous year: € 101 million).
Deferred tax expenses decreased by € 27 million (previous
year: € 18 million) due to previously unrecognized tax loss
carryforwards that are to be reassessed.
(10) Taxes on income
Current taxes on income
Deferred taxes
million 2002 2001 TFY
518
– 179
339
1,437
– 70
1,367
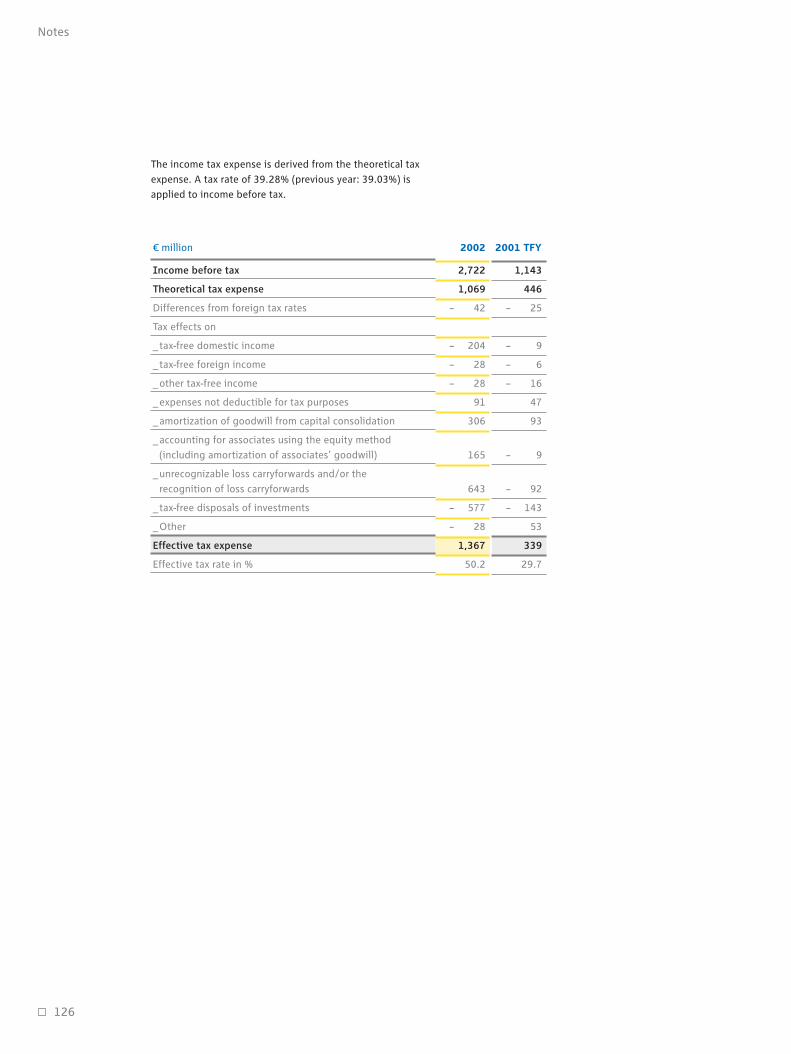
126
Notes
The income tax expense is derived from the theoretical tax
expense. A tax rate of 39.28% (previous year: 39.03%) is
applied to income before tax.
2002 2001 TFY million
Income before tax
Theoretical tax expense
Differences from foreign tax rates
Tax effects on
_tax-free domestic income
_tax-free foreign income
_other tax-free income
_expenses not deductible for tax purposes
_amortization of goodwill from capital consolidation
_accounting for associates using the equity method
(including amortization of associates’ goodwill)
_unrecognizable loss carryforwards and/or the
recognition of loss carryforwards
_tax-free disposals of investments
_Other
Effective tax expense
Effective tax rate in %
1,143
446
– 25
– 9
– 6
– 16
47
93
– 9
– 92
– 143
53
339
29.7
2,722
1,069
– 42
– 204
– 28
– 28
91
306
165
643
– 577
– 28
1,367
50.2

127
Notes
An analysis and description of the movements of non-current
asset items summarized in the balance sheet for the period
under review is provided on pages 128 and 129.
In the year under review, goodwill rose by € 8.0 billion pri-
marily due to the acquisition of Transgas and Innogy. € 5.6
billion thereof are allocable to Innogy, while € 1.5 billion are
attributable to Transgas. Innogy’s customer relationships
were valued at € 3.2 billion.
In the year under review, a total of €435 million (previous
year: € 325 million) was spent on research and development.
Development costs of € 84 million (previous year: € 22 mil-
lion) were capitalized.
Investment property is all property held to earn rental
income or for capital appreciation rather than for use in the
production or for administrative purposes. This property is
measured at depreciated cost. Depreciable investment prop-
erty is depreciated over 12 to 80 years using the straight-line
method. Its fair value is € 893 million (previous year: € 1,183
million). Fair values are determined using internationally
accepted valuation methods such as the discounted cash
flow method, or derived from current market prices of com-
parable real estate. € 72 million of the fair value (previous
year: € 27 million) are based on a valuation made by indepen-
dent appraisers. Rental income generated in the reporting
period amounted to € 62 million (previous year: €49 million).
Direct operating expenses totaled € 17 million (previous year:
€ 11 million).
€ 362 million in property, plant and equipment, € 5 million
of which is investment property (previous year: € 331 million,
of which € 75 million was investment property) are subject to
restrictions on disposal in the form of mortgages and collat-
eral assignments. Of the carrying amount of property, plant
and equipment, € 923 million (previous year: €408 million)
are attributable to assets leased under finance leases. Dis-
posals of property, plant and equipment resulted from the
sale, dismantling, and decommissioning of plants.
Additions to financial assets, excluding marketable securities,
other loans the equity value adjustment and the fair valua-
tion of shares in affiliated companies and other investments,
total € 12,890 million (previous year: € 1,411 million) and
reflect € 10,722 million in acquisitions made in the period
under review (previous year: € 655 million) as well as capital
contributions and loans to subsidiaries and investees. The
additions to non-current marketable securities and to loans
as well as the additions from applying the equity method
and measurement at fair value amount to € 1,708 million
(previous year: €486 million).
Non-current marketable securities are predominantly fixed-
interest marketable securities and shares of public compa-
nies. They are not subject to any restrictions on disposal.
They all belong to the class of marketable securities designat-
ed “available for sale” and are measured at fair value.
Notes to the Balance Sheet
(11) Non-current assets

128
Notes
Roll-forward of Non-current Assets
Intangible assets
Development costs
Concessions, patent rights and similar rights and
assets as well as licenses in such rights and assets
Goodwill
_ from individual financial statements
_from capital consolidation
Negative goodwill from capital consolidation
Prepayments
Property, plant and equipment
Land, land rights and buildings
including buildings on third-party land
Investment property
Technical plant and machinery
Other equipment, factory and office equipment
Prepayments to other enterprises
Plants under construction
Financial assets
Investments in affiliates
Loans to affiliates
Investments
_in associated companies accounted
for using the equity method
_other investments
Loans to investments
Long-term marketable securities
Other loans
Total non-current assets
204
5,302
336
15,678
– 7
23
21,536
15,663
893
64,747
6,220
89
1,026
88,638
1,103
54
4,555
722
846
602
2,333
10,215
120,389
68
40
75
– 10
2
175
161
12
845
279
13
221
1,531
6052
10
4331
4943
82
117
271
2,012
3,718
– 12
– 146
– 6
– 680
– 844
– 909
– 3
– 926
– 396
0
– 56
– 2,290
1
– 123
– 1
– 8
– 1
– 16
– 148
– 3,282
– 3
– 5
24
– 1
– 17
– 2
0
59
953
165
– 534
– 642
1
1
0
0
– 101
– 31
– 9
30
– 110
– 111
84
253
12
4
19
372
554
19
2,035
465
80
570
3,723
11,2922
10
8311
2853
693
39
1,448
14,598
18,693
– 8
3,416
108
8,033
– 13
11,536
– 234
– 371
2,540
339
6
336
2,616
– 10,143
3
– 566
– 302
– 35
21
37
– 10,985
3,167
Balance
as of
01/01/02
Additions/
disposals
through
changes
in scope
of cons.
Additions Transfers Currency
trans-
lation
adjust-
ments
Disposals Balance
as of
12/31/02
million
Cost
143
1,852
238
8,397
– 4
23
10,649
16,413
1,201
60,990
5,926
550
1,039
86,119
557
51
4,846
1,335
309
669
1,105
8,872
105,640
1 € 209 million of the additions and € 276 million of the disposals result from applying the equity method.2 € 10 million of the additions and € 5 million of the disposals result from the fair valuation pursuant to IAS 39.3 € 2 million of the additions and € 43 million of the disposals result from the fair valuation pursuant to IAS 39.

129
Notes
Accumulated depreciation/amortization/impairment losses Carrying amounts
0
0
3
0
1
4
4
1
2
0
7
11
39
38
48
2
127
18
5
664
408
0
2
1,097
10
0
5
6
0
0
21
1,245
– 2
– 7
– 3
– 35
– 47
– 290
0
– 230
– 242
0
– 762
– 1
– 1
– 810
– 8
9
0
– 3
– 2
– 90
– 3
– 6
122
– 21
2
0
23
253
49
780
1
1,106
641
33
1,702
559
0
3
2,938
14
1
353
73
4
7
95
547
4,591
1
– 21
0
– 39
– 59
– 289
– 136
176
223
– 1
0
– 27
19
2
– 54
– 48
– 1
1
– 4
– 85
– 171
Balance
as of
01/01/02
Additions/
disposals
through
changes
in scope
of cons.
Deprecia-
tion/
amorti-
zation/im-
pairment
losses in
reporting
period
Transfers Currency
trans-
lation
adust-
ments
Disposals Write-
backs
55
1,403
134
1,426
3,018
6,285
308
43,708
4,536
22
54,859
237
12
525
53
5
9
94
935
58,812
Balance
as of
12/31/02
Balance
as of
12/31/02
33
1,225
117
768
4
2,147
6,334
419
42,731
4,282
1
42
53,809
218
9
232
34
3
3
3
502
56,458
Balance
as of
12/31/02
149
3,899
202
14,252
– 7
23
18,518
9,378
585
21,039
1,684
89
1,004
33,779
866
42
4,030
669
841
593
2,239
9,280
61,577
110
627
121
7,629
– 4
19
8,502
10,079
782
18,259
1,644
549
997
32,310
339
42
4,614
1,301
306
666
1,102
8,370
49,182

Trade accounts receivable
_ from Percentage
of Completion (PoC)
_ other
Accounts receivable
from affiliated companies
Accounts receivable
from other investments
Other assets
130
Notes
Due to changes in the scope of consolidation, inventories
increased by € 8 million. € 117 million (previous year: € 368
million) of the total amount of inventories recognized as of
December 31, 2002 are carried at their net realizable value.
Inventories are not subject to restrictions on disposal, and
there are no further burdens.
(13) Accounts receivable and other assets
(12) Inventories
12/31/0112/31/02 million
205
1
1,306
617
210
1,110
56
3,505
Nuclear fuel assemblies
Preliminary overburden of lignite mining
Raw materials
Work in progress – goods
Work in progress – services
Finished goods and goods for resale
Prepayments
198
11
1,176
689
234
1,266
69
3,643
12/31/01 Thereof
RT*>1 year million
Thereof
RT*>1 year
12/31/02
*RT = remaining term.
129
5
3
1,266
1,403
816
7,007
7,823
214
1,413
5,794
15,244
24
16
1
1,423
1,464
2
7,201
7,203
378
681
8,109
16,371
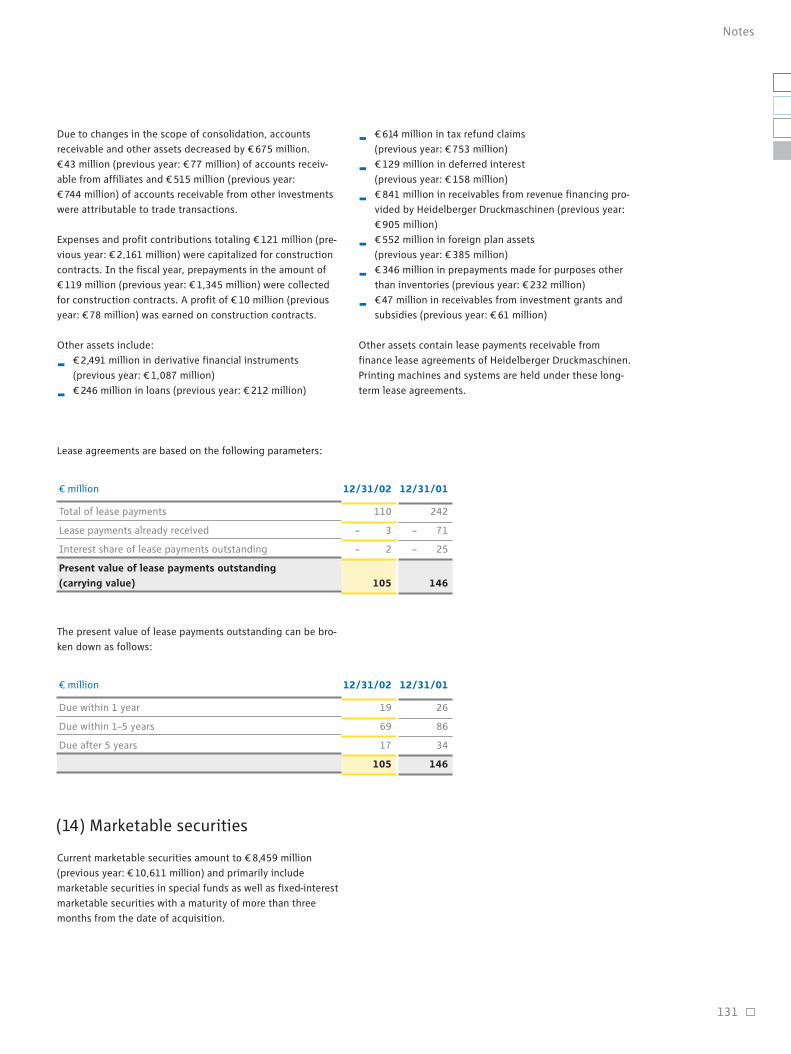
131
Notes
Due to changes in the scope of consolidation, accounts
receivable and other assets decreased by € 675 million.
€43 million (previous year: € 77 million) of accounts receiv-
able from affiliates and € 515 million (previous year:
€ 744 million) of accounts receivable from other investments
were attributable to trade transactions.
Expenses and profit contributions totaling € 121 million (pre-
vious year: € 2,161 million) were capitalized for construction
contracts. In the fiscal year, prepayments in the amount of
€ 119 million (previous year: € 1,345 million) were collected
for construction contracts. A profit of € 10 million (previous
year: € 78 million) was earned on construction contracts.
Other assets include:
j€ 2,491 million in derivative financial instruments
(previous year: € 1,087 million)
j€ 246 million in loans (previous year: € 212 million)
Lease agreements are based on the following parameters:
j€ 614 million in tax refund claims
(previous year: € 753 million)
j€ 129 million in deferred interest
(previous year: € 158 million)
j€ 841 million in receivables from revenue financing pro-
vided by Heidelberger Druckmaschinen (previous year:
€ 905 million)
j€ 552 million in foreign plan assets
(previous year: € 385 million)
j€ 346 million in prepayments made for purposes other
than inventories (previous year: € 232 million)
j€47 million in receivables from investment grants and
subsidies (previous year: € 61 million)
Other assets contain lease payments receivable from
finance lease agreements of Heidelberger Druckmaschinen.
Printing machines and systems are held under these long-
term lease agreements.
12/31/0112/31/02 million
Total of lease payments
Lease payments already received
Interest share of lease payments outstanding
Present value of lease payments outstanding
(carrying value)
The present value of lease payments outstanding can be bro-
ken down as follows:
12/31/0112/31/02 million
Due within 1 year
Due within 1–5 years
Due after 5 years
Current marketable securities amount to € 8,459 million
(previous year: € 10,611 million) and primarily include
marketable securities in special funds as well as fixed-interest
marketable securities with a maturity of more than three
months from the date of acquisition.
(14) Marketable securities
242
– 71
– 25
146
110
– 3
– 2
105
26
86
34
146
19
69
17
105

132
Notes
Cash and cash equivalents consist of cash on hand, demand
deposits, and fixed-interest marktetable securities with a
maturity of three months or less from the date of acquisition.
The total amount of cash and cash equivalents corresponds
to the amount of cash and cash equivalents disclosed in the
cash flow statement.
Deferred tax assets and liabilities amounted to € 7,593 mil-
lion and € 6,566 million respectively (previous year: € 8,399
million and € 6,206 million respectively) and primarily relate
to measurement differences to the tax bases.
(15) Cash and cash equivalents
(16) Deferred taxes
Cash and cash equivalents break down as follows:
12/31/0112/31/02 million
Cash
Marketable securities (maturity three months or less from
the date of acquisition)
Total deferred tax assets include the following capitalized tax
reduction claims which result from the expected utilization of
previously unused tax loss carryforwards in subsequent years:
The following is a breakdown of deferred tax assets and
liabilities by balance sheet item:
Deferred
tax
assets
Deferred
tax
liabilities million
12/31/02 12/31/01
Deferred
tax
liabilities
Deferred
tax
assets
4,512
979
758
69
214
34
6,566
—
6,566
335
224
—
1,783
3,718
1,203
7,263
330
7,593
3,299
1,454
919
72
368
94
6,206
—
6,206
486
281
—
2,029
3,745
1,112
7,653
746
8,399
Non-current assets
Current assets and other assets
Exceptional tax items
Provisions for pensions
Other provisions
Other liabilities
Tax loss carryforwards
Total
12/31/0112/31/02 million
351
395
746
318
12
330
Corporate income tax (or comparable foreign income tax)
Trade tax
3,446
396
3,842
1,673
470
2,143

133
Notes
A breakdown of equity and the minority interest is shown on
page 107.
Pursuant to the resolution passed by the Annual General
Meeting on June 6, 2002, the Executive Board was autho-
rized to purchase up to 57,000,000 shares of any class in
RWE until December 5, 2003. Own shares held in the previ-
ous year were appropriated in line with the capital decrease
which became effective per the Executive Board resolution of
July 2, 2002.
The realization of these tax loss carryforwards is guaranteed
with sufficient certainty. There are € 2,121 million in corpo-
rate income tax loss carryforwards and € 5,390 million in
trade tax loss carryforwards for which no deferred tax claims
have been recognized (previous year: € 1,670 million and
€ 1,046 million respectively).
The balance of corporate income tax reductions and increas-
es related to future disbursements amounted to € 996 million
as of December 31, 2002. These corporate income tax reduc-
tions and increases can occur or can be utilized until 2015 as
a result of the German Tax Reduction Act, which came into
force in October 2000.
In the year under review, – € 8 million in deferred taxes
(previous year: + € 3 million) arising from the translation of
foreign financial statements and + €47 million (previous year:
+ € 74 million) from the valuation of financial instruments
without effect on net income were offset against equity.
(17) Equity/minority interest
Subscribed capital breaks down as follows:
Common shares
Preferred shares
1,340
100
1,440
93.2
6.8
100.0
531,000
39,000
570,000
93.1
6.9
100.0
1,359
100
1,459
12/31/02
million
12/31/01
million
12/31/01
Number
of shares
’000%
523,405
39,000
562,405
12/31/02
Number
of shares
’000 %
Stock option plans
Contingent capital in the amount of € 51,200,000 is available
to offer subscription rights for common shares in the name of
the bearer to members of the Executive Board and to other
RWE AG executives and affiliated companies.
The Executive Board of RWE AG has been authorized to issue
non-transferable subscription rights to a total of up to
20,000,000 common shares to the aforementioned persons
up to the end of the day on March 8, 2004. There is a three-
year waiting period for the stock options which have a term
of five years after their respective issue.
The following options have been issued so far:
1999 tranche
2000 tranche
2001 tranche
2001 A tranche
– 122,300
– 383,000
– 395,500
– 371,300
– 1,272,100
1,935,800
4,336,500
5,222,300
5,262,300
16,756,900
Expired
in
2002
Balance
as of
12/31/02
Originally
issued
Balance
as of
12/31/01
Subscribed capital and the additional paid-in capital relate
to RWE AG. Common and preferred shares are no-par value
bearer share certificates.
1,319,300
2,983,000
4,454,100
4,818,500
13,574,900
1,441,600
3,366,000
4,849,600
5,189,800
14,847,000

–
1,058,197
632,908
466,880
2,157,985
The stock options can only be exercised if the quoted market
price of the common share—calculated on the basis of the
total return approach—has increased by at least 6% annually
on average (absolute performance) before being exercised
and has not trailed the Dow Jones STOXX share index by
more than ten percentage points (relative performance) in
the same period. The four-week exercise periods start on the
21st trading day following the publication of the provisional
revenue and earnings figures for the completed fiscal year
and of the semi-annual results.
The stock options can only be exercised by payment of the
exercise price. The exercise price equals the quoted market
price of the common share on the first trading day after
expiry of the relevant exercise period, minus a markdown,
which is composed of the absolute and relative performance
components. The markdown is limited to 40 percentage
points.
Exercise conditions stipulate that the stock options can be
used for already existing common shares instead of new
shares from contingent capital or that the markdown can be
paid in cash instead of in common shares. If the persons
holding stock options are not employed by RWE AG, the
expenses associated with the exercise are borne by the
respective Group company.
In the 2002 fiscal year, a long-term incentive plan (LTIP) was
introduced for Executive Board members and other execu-
tives of RWE AG, and subordinate domestic and foreign
affiliates, based on stock appreciation rights (SARs), in line
with a resolution passed by the Supervisory Board.
There is a two-year waiting period for the SARs which have a
term of five years after their respective issue.
5,950,350 stock options were issued in the fiscal fiscal year
for the first time. 5,945,350 of them remained as of the bal-
ance-sheet date.
SARs can be exercised only if the common share price has
risen by at least 10% before the exercise date (absolute per-
formance) and has outperformed in the same period the Dow
Jones STOXX Utility Price Index on ten consecutive days
(relative performance). The relative success hurdle does not
apply if the common share price increases by at least 20%.
SARs can be exercised daily after expiry of the waiting period
and once the aforementioned performance targets have been
hit, except during short blocking periods prior to the publica-
tion of corporate data. The number of exercisable SARs is
determined by the extent to which the common share has
risen over the exercise price established when the SARs were
issued. If the common share price increases by 20%, all SARs
can be exercised; an increase of 15% enables the exercise of
60%, and an increase of 10% enables the exercise of 25% of
the SARs. Whenever SARs are exercised, the issuing company
pays the difference between the current share price and the
exercise price. The sum is limited to 50% of the exercise
price.
The LTIP’s exercise conditions stipulate that common shares
may be given instead of cash to pay out gains on the exercise
of SARs. If the persons holding stock options are not
employed by RWE AG, expenses associated with the exercise
are borne by the respective Group company.
Under the employee stock option plan, eligible staff mem-
bers were granted up to three non-transferable stock options
to each common share of RWE AG for each employee share
purchased.
134
Notes
The following stock options with a term of three years have
been issued so far:
1999 tranche
2000 tranche
2001 tranche
2001 A tranche
– 1,119,972
– 167,303
– 75,459
– 66,231
–1,428,965
Expired
in
2002
Balance
as of
12/31/02
Originally
issued
Balance
as of
12/31/01
1,445,040
1,476,366
735,274
533,570
4,190,250
1,119,972
1,225,500
708,367
533,111
3,586,950

135
Notes
The stock options can be exercised if the common share's
quoted market price has risen to at least 110% of the initial
price set. Employees can then either purchase existing com-
mon shares at a reduced price or be paid out the difference.
The capital gain is limited to 20% of the initial price.
Commitments arising from the stock option plans and the
LTIP are accrued over their terms to maturity. Commitments
arising from the stock option plans are stated at the intrinsic
value valid as of the balance-sheet date, while taking fluc-
tuation discounts into consideration, whereas commitments
arising from the LTIP are stated at the fair value valid as of
the balance-sheet date, also taking fluctuation discounts into
consideration.
Thames Water Plc introduced an employee stock ownership
plan that enables entitled employees to save a maximum
fixed sum of £100 per month over a period of three years to
purchase RWE shares. RWE shares can be purchased between
September 1, 2004 and February 28, 2005 at a 20% discount
on the price quoted at the end of June 2001. Thames Water
has collateralized the expected number of purchased shares
through corresponding options with the same exercise price.
The option price is deferred over the three-year duration of
the employee stock ownership plan.
Entitled employees are tendered RWE shares within the
scope of Thames Water Plc's long-term stock option plan. If
Thames Water exceeds certain predetermined ROCE targets,
Thames Water pays an agreed sum into an independent trust
that acquires the corresponding number of RWE shares and
holds them for three years. The shares are issued to eligible
employees on expiry of the three-year holding period. Provi-
sions were recognized to cover the sums the trust is expected
to receive.
Accumulated other comprehensive income is part of
retained earnings and reflects changes in the fair values of
financial instruments available for sale and of cash flow
hedges as well as currency translation differences from
foreign financial statements.
In the year under review, – € 131 million in non-operating
changes in fair values of cash flow hedges and – € 618 million
in financial instruments available for sale were disclosed
under accumulated other comprehensive income. In the
fiscal year, € 7 million in cash flow hedges were realized as an
expense and € 313 million in financial instruments available
for sale were realized as income.
Dividend proposal
We propose to the Annual General Meeting that RWE AG's
distributable profit for fiscal 2002 be appropriated as follows:
Payment of a dividend of € 1.00 and a bonus of € 0.10 per
individual share certificate on the dividend-bearing capital
stock of
€ 1,439,756,800.00: € 618,645,500.00
Profit carryforward € 76,446.24
Distributable profit € 618,721,946.24
The minority interest shows the share ownership of third
parties in Group enterprises. Above all, a minority interest
is held in enviaM, Hungarian-based power utilities, Heidel-
berger Druckmaschinen, CONSOL Energy, and the Czech
gas companies.
Expired
in
2002
Balance
as of
12/31/02
Originally
issued
Balance
as of
12/31/01
2001 tranche
2002 tranche
– 3,006
–
– 3,006
391,511
–
391,511
412,608
280,307
692,915
388,505
280,307
668,812
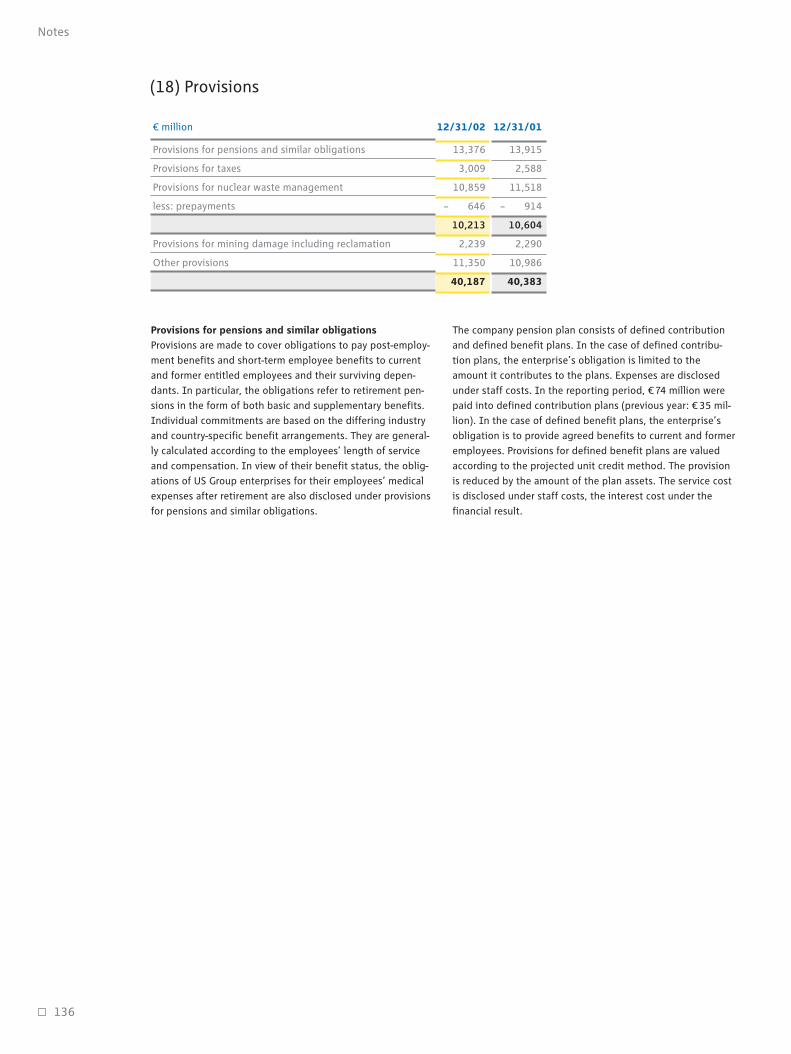
(18) Provisions
Provisions for pensions and similar obligations
Provisions are made to cover obligations to pay post-employ-
ment benefits and short-term employee benefits to current
and former entitled employees and their surviving depen-
dants. In particular, the obligations refer to retirement pen-
sions in the form of both basic and supplementary benefits.
Individual commitments are based on the differing industry
and country-specific benefit arrangements. They are general-
ly calculated according to the employees’ length of service
and compensation. In view of their benefit status, the oblig-
ations of US Group enterprises for their employees’ medical
expenses after retirement are also disclosed under provisions
for pensions and similar obligations.
The company pension plan consists of defined contribution
and defined benefit plans. In the case of defined contribu-
tion plans, the enterprise’s obligation is limited to the
amount it contributes to the plans. Expenses are disclosed
under staff costs. In the reporting period, € 74 million were
paid into defined contribution plans (previous year: € 35 mil-
lion). In the case of defined benefit plans, the enterprise’s
obligation is to provide agreed benefits to current and former
employees. Provisions for defined benefit plans are valued
according to the projected unit credit method. The provision
is reduced by the amount of the plan assets. The service cost
is disclosed under staff costs, the interest cost under the
financial result.
136
Notes
12/31/0112/31/02 million
13,376
3,009
10,859
– 646
10,213
2,239
11,350
40,187
Provisions for pensions and similar obligations
Provisions for taxes
Provisions for nuclear waste management
less: prepayments
Provisions for mining damage including reclamation
Other provisions
13,915
2,588
11,518
– 914
10,604
2,290
10,986
40,383
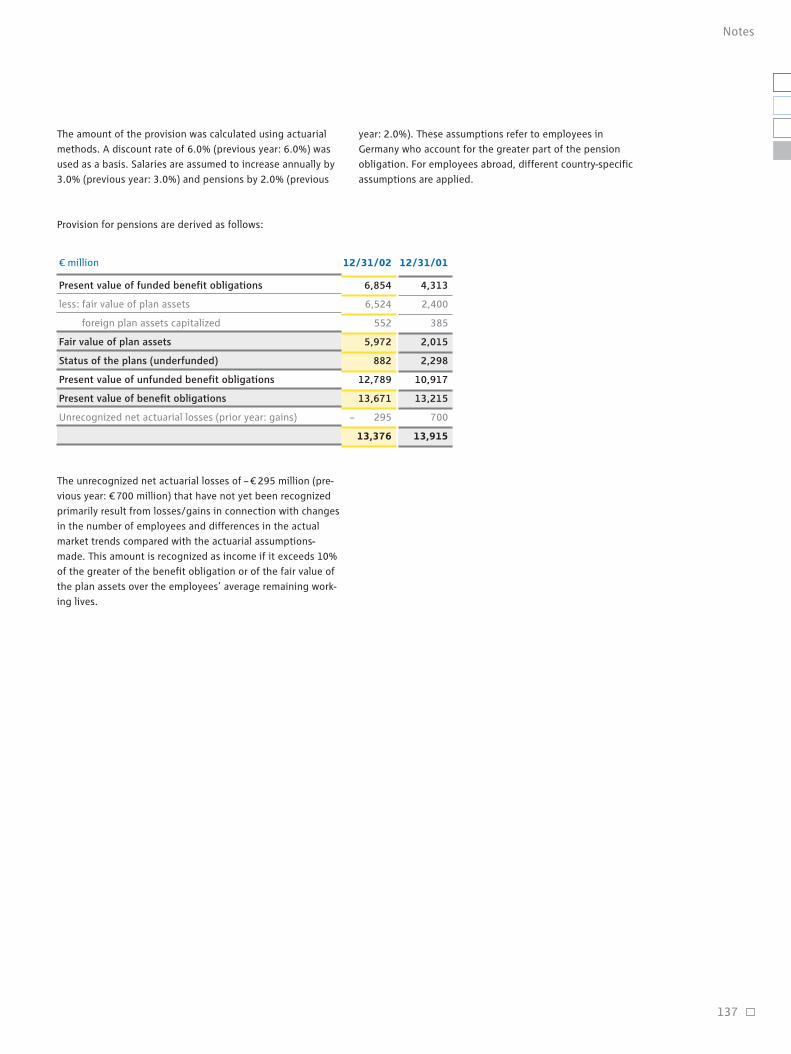
The unrecognized net actuarial losses of – € 295 million (pre-
vious year: € 700 million) that have not yet been recognized
primarily result from losses/gains in connection with changes
in the number of employees and differences in the actual
market trends compared with the actuarial assumptions-
made. This amount is recognized as income if it exceeds 10%
of the greater of the benefit obligation or of the fair value of
the plan assets over the employees’ average remaining work-
ing lives.
137
Notes
The amount of the provision was calculated using actuarial
methods. A discount rate of 6.0% (previous year: 6.0%) was
used as a basis. Salaries are assumed to increase annually by
3.0% (previous year: 3.0%) and pensions by 2.0% (previous
year: 2.0%). These assumptions refer to employees in
Germany who account for the greater part of the pension
obligation. For employees abroad, different country-specific
assumptions are applied.
12/31/0112/31/02 million
Provision for pensions are derived as follows:
Present value of funded benefit obligations
less: fair value of plan assets
foreign plan assets capitalized
Fair value of plan assets
Status of the plans (underfunded)
Present value of unfunded benefit obligations
Present value of benefit obligations
Unrecognized net actuarial losses (prior year: gains)
6,854
6,524
552
5,972
882
12,789
13,671
– 295
13,376
4,313
2,400
385
2,015
2,298
10,917
13,215
700
13,915
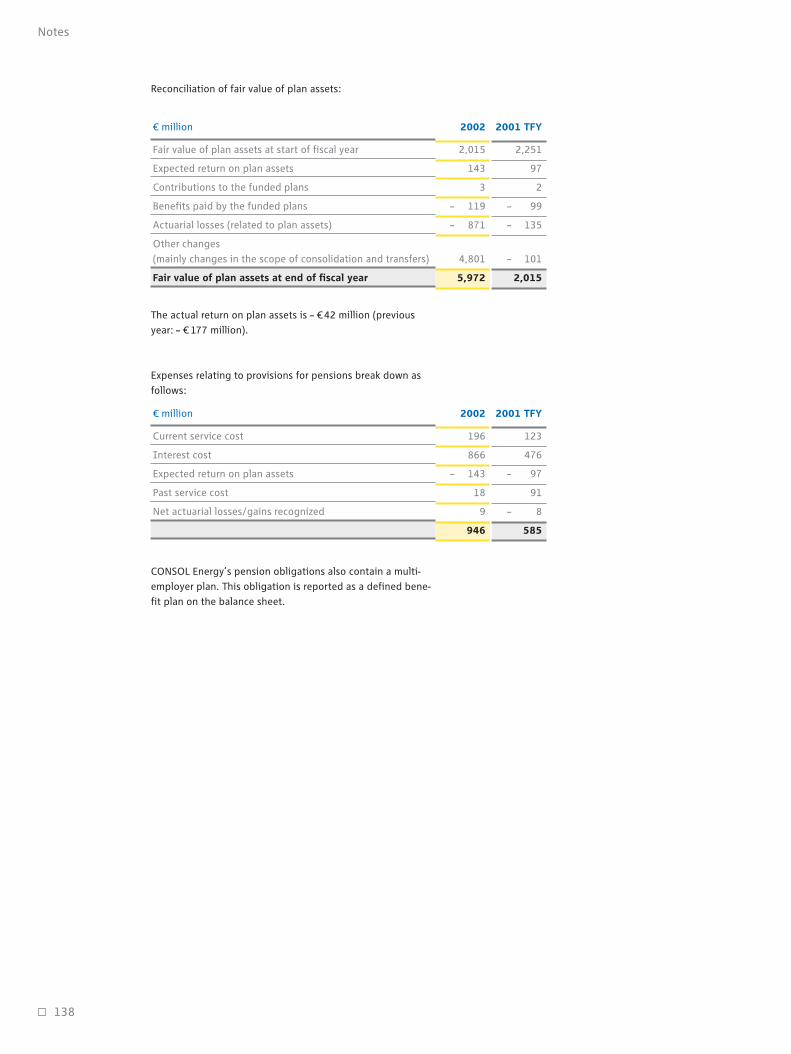
138
Notes
CONSOL Energy’s pension obligations also contain a multi-
employer plan. This obligation is reported as a defined bene-
fit plan on the balance sheet.
2001 TFY2002 million
Reconciliation of fair value of plan assets:
Fair value of plan assets at start of fiscal year
Expected return on plan assets
Contributions to the funded plans
Benefits paid by the funded plans
Actuarial losses (related to plan assets)
Other changes
(mainly changes in the scope of consolidation and transfers)
Fair value of plan assets at end of fiscal year
2,015
143
3
– 119
– 871
4,801
5,972
2,251
97
2
– 99
– 135
– 101
2,015
2001 TFY2002 million
Expenses relating to provisions for pensions break down as
follows:
The actual return on plan assets is – €42 million (previous
year: – € 177 million).
Current service cost
Interest cost
Expected return on plan assets
Past service cost
Net actuarial losses/gains recognized
196
866
– 143
18
9
946
123
476
– 97
91
– 8
585

Provisions for pensions
Provisions for taxes
Provisions for nuclear waste
management less prepayments
Provisions for mining damage
including reclamation
Other provisions
Of which with a term of up to one year
Of which changes to the scope
of consolidation
1
145
963
33
563
1,705
Reconcilitation of provisions
million
Provisions for nuclear waste management
Waste management provisions in the nuclear energy sector
are based on obligations under public law and restrictions
included in operating licenses.
Provisions for the disposal of spent nuclear fuel assemblies
are recognized primarily based on consumption. They cover
expected costs, which primarily include reprocessing costs
on the basis of contractual agreements, and direct final stor-
age. The associated cost of transporting, treating and taking
back waste, including the cost of final storage and associated
pre-financing costs calculated based on data from the Ger-
man Federal Office for Radiation Protection, are included
accordingly. These provisions are used up over a period of up
to 80 years.
Provisions for the decommissioning of nuclear power station
facilities are accrued based on expected costs. The calcula-
tion of expected costs is based on outside expert opinions
and assumes that the facilities concerned are eliminated
completely. Costs incurred during the interim period preced-
ing decommissioning operations are also included. Further-
more, provisions were made for other waste management
measures (management of radioactive operational waste).
Waste management provisions in the nuclear energy sector
are stated as long-term provisions, and their settlement value
is discounted to the balance-sheet date. An interest rate of
6.0% (previous year: 6.0%) was used as the discount rate.
Volume-induced increases to the provisions are measured at
their present value. In the fiscal year, they amounted to
€ 196 million (previous year: € 81 million). € 963 million in
unused provisions (previous year: € 182 million) were reversed
primarily due to changes in waste disposal concepts in con-
nection with the approvals received for the interim storage of
fuel elements at the Biblis and Lingen sites as well as to
update the settlement value and periods in the field of nuclear
waste disposal where necessary. Additions to provisions for
nuclear waste management primarily consist of an interest
accretion of €491 million (previous year: € 274 million).
139
Notes
Provisions with a term of up to one year relate to tax provi-
sions and to other provisions amounting to €4,541 million
(previous year: €4,568 million).
Amounts
used
Balance
at
12/31/02
Unused
amounts
reversed
Additions
723
–
491
110
278
1,602
– 900
– 427
–
– 43
22
–1,348
584
295
115
99
3,087
4,180
Balance
at
01/01/02
Interest
accretion/
interest
rate
changes
Changes
in the
scope
of conso-
lidation,
currency,
adjust-
ments &
transfers
223
1,288
196
14
3,714
5,435
13,915
2,588
10,604
2,290
10,986
40,383
(7,156)
13,376
3,009
10,213
2,239
11,350
40,187
(7,550)
(– 358)
Provisions for mining damage including reclamation
These provisions are formed for risks and obligations to
redress, including those arising from mining damage that has
already occurred or been caused. Such risks and obligations
are those that exist as of the balance-sheet date and are
identifiable when the balance sheet is being prepared. They
have to be recognized due to obligations under public law
that are based on the German Federal Mining Act and formu-
lated, above all, in operation schedules and water law per-
mits. Provisions are generally accrued based on the increase
in the obligation, i.e. in line with coal production. They are
measured at full expected cost or according to estimated
compensation payments.
At RWE Dea Upstream, provisions are made owing to obliga-
tions under public law to fill wells and eliminate other dam-
age caused by drilling and production work. The amount of
these provisions is based on cost estimates derived from past
experience and comparative rates determined by the German
Association of the Oil and Natural Gas Production Industry.
Provisions for mining damage including the corresponding
provisions at RWE Dea Upstream are long-term provisions
which are recognized at their settlement value and discount-
ed to the balance-sheet date. An interest rate of 6.0% (previ-
ous year: 6.0%) was used as the discount rate. In the report-
ing period, additions to provisions for mining damage
amounted to € 14 million (previous year: € 26 million) and
caused by an increase in the obligation. The interest accre-
tion of the additions to provisions for mining damage is
€ 110 million (previous year: € 57 million).
Other provisions
Other provisions mainly include obligations arising from the
personnel sector in the amount of € 2,338 million (previous
year: € 2,865 million), restructuring commitments of € 1,890
million (previous year: € 1,941 million), purchase and sale
obligations of € 3,457 million (previous year: € 2,796 million)
as well as contingent liabilities originating from the electricity
business area of € 670 million (previous year: € 659 million).
Provisions for restructuring mainly comprise socially accept-
able personnel measures for further payroll downsizing. The
agreement on personnel measures expires on June 30, 2004.
The provisions also cover further measures required for the
short-term implementation of necessary payroll downsizing
(including redundancy payments) as well as projected decom-
missioning measures, resource pooling, site consolidation
and other costs resulting from the merger with VEW.
The carrying amounts of provisions for nuclear waste man-
agement and mining damages exceed the present value
determined following the changes made to the estimates by
€ 1,478 million (previous year: € 1,509 million). The differ-
ence primarily stems from the past increase in the interest
rate. The difference in present value will be distributed as
income over the compliance period.
140
Notes
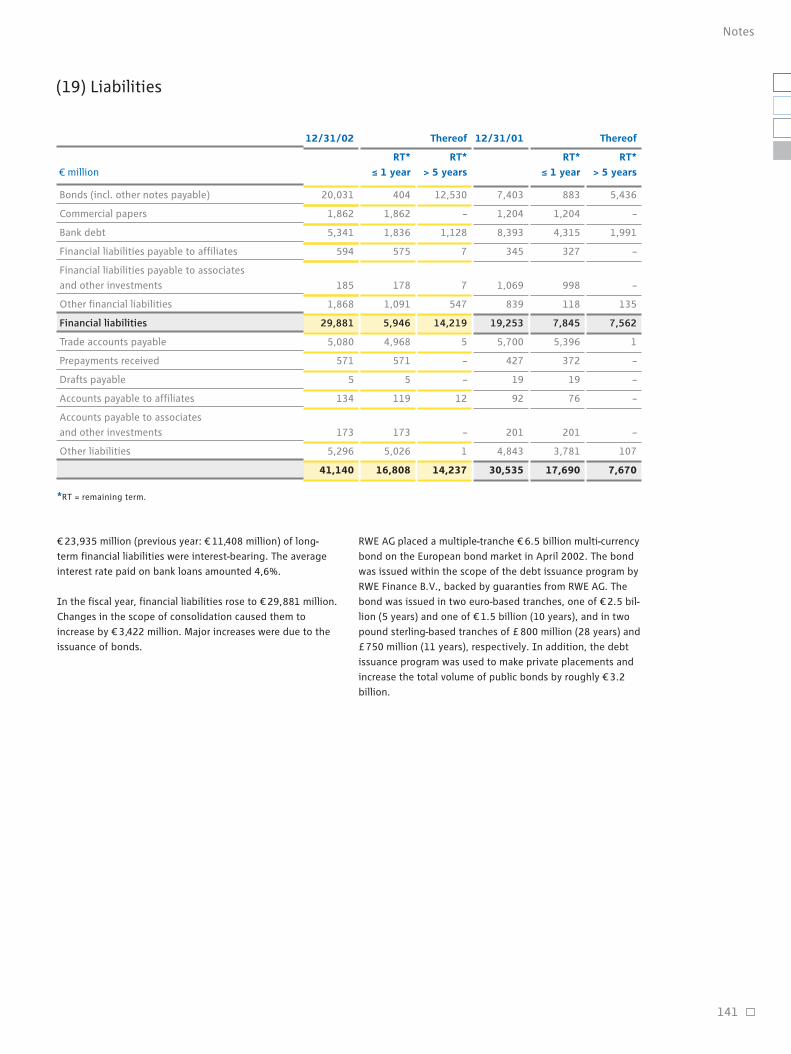
(19) Liabilities
€ 23,935 million (previous year: € 11,408 million) of long-
term financial liabilities were interest-bearing. The average
interest rate paid on bank loans amounted 4,6%.
In the fiscal year, financial liabilities rose to € 29,881 million.
Changes in the scope of consolidation caused them to
increase by € 3,422 million. Major increases were due to the
issuance of bonds.
RWE AG placed a multiple-tranche € 6.5 billion multi-currency
bond on the European bond market in April 2002. The bond
was issued within the scope of the debt issuance program by
RWE Finance B.V., backed by guaranties from RWE AG. The
bond was issued in two euro-based tranches, one of € 2.5 bil-
lion (5 years) and one of € 1.5 billion (10 years), and in two
pound sterling-based tranches of £ 800 million (28 years) and
£ 750 million (11 years), respectively. In addition, the debt
issuance program was used to make private placements and
increase the total volume of public bonds by roughly € 3.2
billion.
141
Notes
RT*
≤ 1 year
RT*
> 5 years
RT*
≤ 1 year million
RT*
> 5 years
ThereofThereof12/31/02 12/31/01
*RT = remaining term.
Bonds (incl. other notes payable)
Commercial papers
Bank debt
Financial liabilities payable to affiliates
Financial liabilities payable to associates
and other investments
Other financial liabilities
Financial liabilities
Trade accounts payable
Prepayments received
Drafts payable
Accounts payable to affiliates
Accounts payable to associates
and other investments
Other liabilities
7,403
1,204
8,393
345
1,069
839
19,253
5,700
427
19
92
201
4,843
30,535
883
1,204
4,315
327
998
118
7,845
5,396
372
19
76
201
3,781
17,690
5,436
–
1,991
–
–
135
7,562
1
–
–
–
–
107
7,670
20,031
1,862
5,341
594
185
1,868
29,881
5,080
571
5
134
173
5,296
41,140
12,530
–
1,128
7
7
547
14,219
5
–
–
12
–
1
14,237
404
1,862
1,836
575
178
1,091
5,946
4,968
571
5
119
173
5,026
16,808
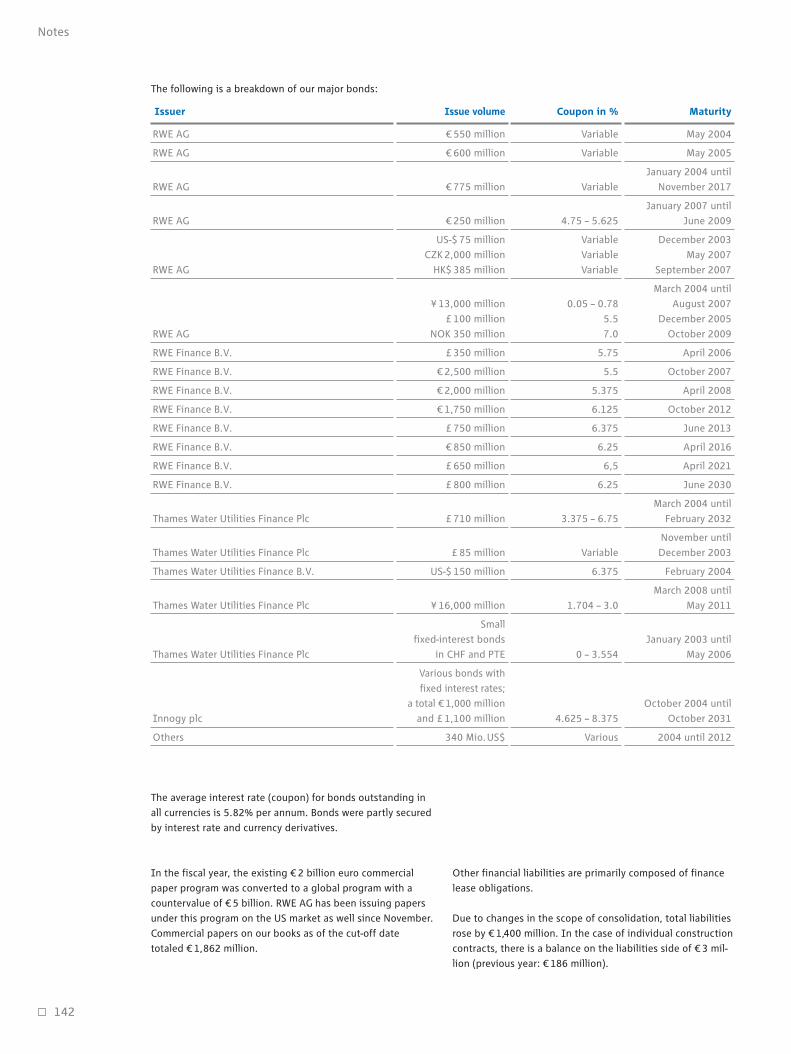
The average interest rate (coupon) for bonds outstanding in
all currencies is 5.82% per annum. Bonds were partly secured
by interest rate and currency derivatives.
In the fiscal year, the existing € 2 billion euro commercial
paper program was converted to a global program with a
countervalue of € 5 billion. RWE AG has been issuing papers
under this program on the US market as well since November.
Commercial papers on our books as of the cut-off date
totaled € 1,862 million.
Other financial liabilities are primarily composed of finance
lease obligations.
Due to changes in the scope of consolidation, total liabilities
rose by € 1,400 million. In the case of individual construction
contracts, there is a balance on the liabilities side of € 3 mil-
lion (previous year: € 186 million).
142
Notes
The following is a breakdown of our major bonds:
Issuer Coupon in % MaturityIssue volume
RWE AG 550 million Variable May 2004
RWE AG 600 million Variable May 2005
January 2004 until
RWE AG 775 million Variable November 2017
January 2007 until
RWE AG 250 million 4.75 – 5.625 June 2009
US-$ 75 million Variable December 2003
CZK 2,000 million Variable May 2007
RWE AG HK$ 385 million Variable September 2007
March 2004 until
¥ 13,000 million 0.05 – 0.78 August 2007
£ 100 million 5.5 December 2005
RWE AG NOK 350 million 7.0 October 2009
RWE Finance B.V. £ 350 million 5.75 April 2006
RWE Finance B.V. € 2,500 million 5.5 October 2007
RWE Finance B.V. € 2,000 million 5.375 April 2008
RWE Finance B.V. € 1,750 million 6.125 October 2012
RWE Finance B.V. £ 750 million 6.375 June 2013
RWE Finance B.V. € 850 million 6.25 April 2016
RWE Finance B.V. £ 650 million 6,5 April 2021
RWE Finance B.V. £ 800 million 6.25 June 2030
March 2004 until
Thames Water Utilities Finance Plc £ 710 million 3.375 – 6.75 February 2032
November until
Thames Water Utilities Finance Plc £ 85 million Variable December 2003
Thames Water Utilities Finance B.V. US-$ 150 million 6.375 February 2004
March 2008 until
Thames Water Utilities Finance Plc ¥ 16,000 million 1.704 – 3.0 May 2011
Small
fixed-interest bonds January 2003 until
Thames Water Utilities Finance Plc in CHF and PTE 0 – 3.554 May 2006
Various bonds with
fixed interest rates;
a total € 1,000 million October 2004 until
Innogy plc and £ 1,100 million 4.625 – 8.375 October 2031
Others 340 Mio.US$ Various 2004 until 2012
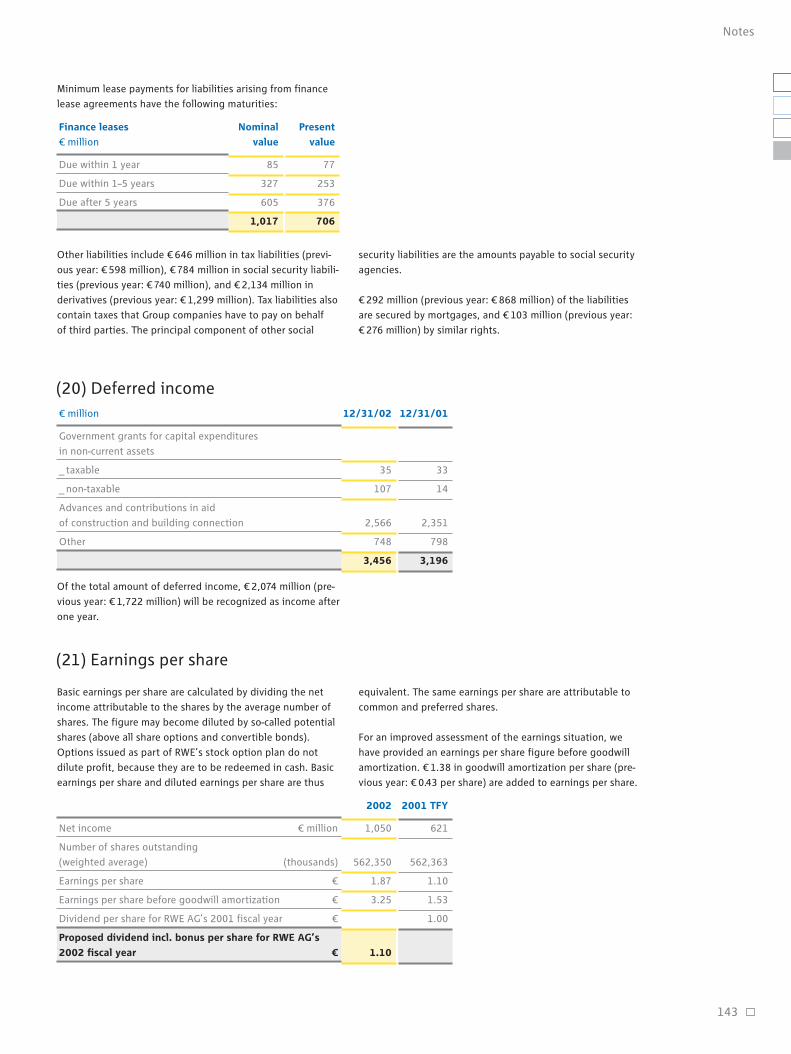
Of the total amount of deferred income, € 2,074 million (pre-
vious year: € 1,722 million) will be recognized as income after
one year.
Basic earnings per share are calculated by dividing the net
income attributable to the shares by the average number of
shares. The figure may become diluted by so-called potential
shares (above all share options and convertible bonds).
Options issued as part of RWE’s stock option plan do not
dilute profit, because they are to be redeemed in cash. Basic
earnings per share and diluted earnings per share are thus
equivalent. The same earnings per share are attributable to
common and preferred shares.
For an improved assessment of the earnings situation, we
have provided an earnings per share figure before goodwill
amortization. € 1.38 in goodwill amortization per share (pre-
vious year: € 0.43 per share) are added to earnings per share.
143
Notes
(20) Deferred income
(21) Earnings per share
2001 TFY2002
1,050
562,350
1.87
3.25
1.10
621
562,363
1.10
1.53
1.00
Net income million
Number of shares outstanding
(weighted average) (thousands)
Earnings per share €
Earnings per share before goodwill amortization €
Dividend per share for RWE AG’s 2001 fiscal year €
Proposed dividend incl. bonus per share for RWE AG’s
2002 fiscal year €
12/31/0112/31/02 million
35
107
2,566
748
3,456
33
14
2,351
798
3,196
Government grants for capital expenditures
in non-current assets
_ taxable
_ non-taxable
Advances and contributions in aid
of construction and building connection
Other
Finance leases
million
Present
value
Nominal
value
Due within 1 year
Due within 1–5 years
Due after 5 years
85
327
605
1,017
77
253
376
706
Other liabilities include € 646 million in tax liabilities (previ-
ous year: € 598 million), € 784 million in social security liabili-
ties (previous year: € 740 million), and € 2,134 million in
derivatives (previous year: € 1,299 million). Tax liabilities also
contain taxes that Group companies have to pay on behalf
of third parties. The principal component of other social
security liabilities are the amounts payable to social security
agencies.
€ 292 million (previous year: € 868 million) of the liabilities
are secured by mortgages, and € 103 million (previous year:
€ 276 million) by similar rights.
Minimum lease payments for liabilities arising from finance
lease agreements have the following maturities:

Financial instruments include non-derivative and derivative
financial instruments.
Non-derivative financial instruments essentially include, on
the assets side, cash and cash equivalents, receivables and
marketable securities. Securities are stated at fair value. On
the liabilities side, they refer to liabilities. The balance of
non-derivative financial instruments is disclosed in the bal-
ance sheet, and the amount of financial assets represents the
maximum default risk. If default risks associated with finan-
cial assets are identified, they are recognized through
allowances.
Within its operating activities, the RWE Group is also
exposed to interest rate, currency and price risks. Among
other things these risks are met by hedges. Derivative finan-
cial instruments are used to hedge the following risks:
currency, interest rate and price risks from operations as well
as from trading, cash investments and financing transactions.
The instruments most commonly used are foreign exchange
forwards, foreign exchange options, interest rate swaps,
interest rate currency swaps, commodity futures, commodity
options as well as product margin swaps. Binding internal
directives define our Group companies’ range of action,
responsibilities and controls. Accordingly, as a rule, deriva-
tive financial instruments may not be used for speculative
purposes; they only serve to hedge risks arising from opera-
tions.
Foreign currency risks arising from foreign investments are
hedged with derivative and non-derivative financial instru-
ments.
Within the framework of RWE Trading’s and Innogy’s opera-
tions, derivative financial instruments are also used for trad-
ing purposes. All trading carried out in physical and deriva-
tive form is subject to a limit that is monitored independently
on a daily basis. Binding internal directives define the range
of action, responsibilities and controls allowable when trad-
ing with derivatives.
Maturities of derivative interest rate, currency and margin
transactions are based on underlying transactions and are
thus primarily short-term and medium-term in nature. On a
case by case basis, e.g. to hedge foreign currency risks of
foreign investments, maturities of up to 30 years can be
agreed upon.
We use the value-at-risk method to quantify the interest rate
change and currency risks for financial instruments in line
with international banking standards. The maximum
expected loss arising from changes in market prices is cal-
culated and continuously checked on the basis of historical
market price fluctuations, a confidence interval of 99%, and
a holding period of one day.
When interpreting the positive and negative market values of
derivative financial instruments, it must be taken into
account that they are matched by offsetting underlying trans-
actions. All derivative financial instruments are recognized as
assets or liabilities. They are stated at fair value regardless of
their purpose. Fair values of marketable securities are derived
from their market price or are determined on the basis of
generally accepted valuation methods.
The nominal volume of the hedging transactions outlined
below is specified without being offset. It represents the
total of all purchase and sales amounts on which the trans-
actions are based. The level of the nominal volume enables
estimates regarding the scope of the use of derivatives, but
does not reflect the risk the Group is exposed to from the use
of derivatives.
Currency risks may exist for financial assets and liabilities in
foreign currency. Such risks are counteracted by derivative
financial instruments.
144
Notes
(22) Reporting on financial instruments

145
Notes
The following foreign exchange hedging instruments were
used:
Interest-rate risks are mainly associated with long-term
items.
Derivative transactions were concluded to hedge prices and
margins in the Electricity and Gas Business Areas.
Derivatives are exposed to default risks equivalent to their
positive market values. These risks are minimized by the high
demands on our counterparties’ creditworthiness. Default
risk exposure was negligible in the fiscal year. Market risks
which result from the fact that the value of a financial instru-
ment changes due to market fluctuations are generally not
relevant for assessing the Group’s net worth or financial or
earnings position, due to their hedging purpose.
A total of € 17,543 million of the nominal volume of the price
and margin derivatives were attributable to Innogy as of
December 31, 2002.
12/31/0112/31/0112/31/02
Foreign exchange derivatives
million 12/31/01
Value
at risk
Remaining term
> 1 year
Nominal volume Market value
Options
Swaps
Commodity-based futures
Other
4,253
2,155
1,352
0
7,760
9,594
7,301
15,831
1,663
34,389
1,508
291
1
0
1,800
5.8
43.4
4.0
0
53.2
12/31/0112/31/0112/31/02
3,756
2,841
4,455
88
11,140
12/31/02
– 89.5
62.7
– 265.1
51.3
– 240.6
12/31/02
Price and margin derivatives
million 12/31/01
Remaining term
> 1 year
Nominal volume Market value
12/31/0112/31/0112/31/02
Interest rate derivatives
million 12/31/01
Value
at risk
Remaining term
> 1 year
Nominal volume Market value
Interest rate options
Interest rate swaps
123
1,741
1,864
11
9,851
9,862
12/31/02
1
6,243
6,244
12/31/02
0
– 259.9
– 259.9
12/31/02
0
37
37
123
1,264
1,387
5,5
– 62.0
– 56.5
Foreign exchange forwards
Foreign exchange options
Other foreign-exchange
hedging instruments
4,252
5,695
7,384
17,331
7,590
3,412
10,191
21,193
12/31/02
630
29
9,902
10,561
12/31/02
64.2
279.7
513.8
857.7
12/31/02
28
19
58
105
276
4,570
6,220
11,066
27.4
– 59.6
– 84.2
– 116.4

(23) Contingent liabilities and finan-cial commitments
The Group had € 277 million in capital commitments
(previous year: € 527 million). Moreover, as of December 31,
2002, assurances relating to acquisitions of investments
totaled € 5,861 million (previous year: € 9,752 million). Com-
mitments regarding investment acquisitions primarily
relate to a recommended offer for the US-based water utility
American Water Works Company Inc.
Under certain conditions, capital commitments vis-à-vis co-
shareholders in the amount of some € 13 million may arise in
connection with existing investments.
Commitments from operate leases largely refer to long-term
rental agreements for power generation and supply plants as
well as rent and lease obligations for storage and administra-
tion buildings.
Contingent liabilities in respect of calls on shares for non-
current investments amounted to € 75 million (previous year:
€ 99 million). Joint liability for third-party payment obliga-
tions under Sec. 24 of the German Limited Liability Com-
panies Act totaled € 14 million (previous year: € 14 million).
Long-term purchase and service agreements for uranium,
conversion, enrichment, production and waste management
exist in the Electricity Business Area. We bear customary
commercial liability for long-term contracts in the plant
construction business.
We shoulder the legal and contractual liability from our
membership in various joint ownerships which exist in con-
nection with power plant projects, profit and loss pooling
agreements and for the provision of liability cover for nuclear
risks, among others.
By signing a mutual benefit agreement, RWE AG and other
parent companies of German nuclear power plant operators
undertook to provide € 2,244.4 million in funding to liable
nuclear power plant operators to ensure that they are able to
meet their payment obligations in the event of nuclear dam-
ages. RWE AG has a 28.938% (from January 1, 2003 onwards:
24.834%) contractual share in the liability, including 5% for
damage settlement costs. The mutual benefit agreement
came into force with the passage of the German Nuclear
Energy Act and the Coverage Provision Directive in accor-
dance with the German Nuclear Energy Act in the spring of
2002.
RWE Group companies are involved in litigation connected
with their operations. However, RWE is not expecting any
major negative repercussions from these litigation on the
RWE Group’s economic or financial position. Additionally,
RWE Group companies in the Electricity and Gas Business
Areas are directly involved in various administrative and
regulatory procedures (including approval procedures) or are
directly affected by the results of such procedures.
146
Notes
Minimum lease payments come due as follows:
million
Operate
leases
Nominal
value
Due within 1 year
Due within 1–5 years
Due after 5 years
151
452
377
980
million 12/31/0112/31/02
3
758
220
210
1,191
1
873
227
106
1,207
Contingent liabilities resulting from
the issue and negotiation of drafts
Contingent liabilities from general,
draft and check guarantees
Contingent liabilities from warranties
Contingent liabilities from granting
collateral for third-party liabilities
147
Notes
In the RWE Group, segments are distinguished on the basis
of the services provided by the Group’s business areas. The
segmentation of business areas and geographical regions is
based on the management reporting system.
The Electricity Business Area, which is a core business, covers
the entire value-added chain, from power generation and
the grid to sales and trading. The new “UK Energy” Division
became part of the core business area Electricity when Inno-
gy was acquired on June 1, 2002. The Electricity Business
Area also comprises the activities of RWE Solutions and,
since January 1, 2002, the Harpen Group, which specializes
in renewables-based and distributed power generation.
Gas, another core business area, includes RWE Gas’ mid-
stream and downstream operations as well as RWE Dea’s
upstream business. The Midstream/Downstream Division was
enlarged with the addition of Transgas and eight Czech
regional gas utilities as of May 1, 2002.
Water, another core business area, controls the Group’s full
range of water operations via Thames Water Plc.
Environmental Services, another core business area, is head-
ed up by RWE Umwelt AG and provides a wide range of ser-
vices in the field of waste management.
The segment “financial investments” includes Heidelberger
Druckmaschinen and the stake in HOCHTIEF. HOCHTIEF has
been accounted for using the equity method since January 1,
2002 after having been fully consolidated in the previous
year. This limits the comparability of the year under review
with the previous fiscal year.
Consolidation effects, the holding company and other activi-
ties not allocable to the business areas presented separately
are disclosed under “other/holding company/consolidation.”
This primarily includes the centralized services of RWE Sys-
tems.
The operations of the former RWE Dea Downstream Division
are classified as discontinuing operations. All of RWE Dea
Downstream’s activities were transferred to the Shell & DEA
Oil GmbH joint venture at the beginning of fiscal 2002. The
50% stake in Shell & DEA Oil GmbH previously held by RWE
Dea was sold to Shell effective July 1, 2002.
(24) Segment reporting

148
Notes
2002 2001 TFY 2002 2001 TFY 2002 2001 TFY 2002 2001 TFY
Electricity
Core business
Gas Water Environmental
Services
million
Business areas
million
Regions
External revenue
Gross assets (as per the balance sheet)
Capital expenditure on intangible
assets and property, plant and equipment
2002 2001 TFY
Germany Rest of Europe
2002 2001 TFY
America
2002 2001 TFY
Asia
2002 2001 TFY
28,003
51,910
1,930
18,325
54,418
1,215
12,691
38,362
1,507
4,811
20,717
649
4,072
9,190
625
6,067
13,222
301
1,392
691
31
1,379
1,781
6
9,490
1,964
11,454
1,009
931
11
758
1,939
1,729
15,721
47,798
41,262
2,299
960
5,666
583
6,249
885
1,589
45
498
483
1,239
5,959
12,995
10,750
439
564
1,647
351
1,998
258
248
– 8
154
131
395
3,251
6,327
3,647
541
198
2,850
0
2,850
963
651
– 5
734
219
1,457
13,200
18,278
11,416
312
1,123
1,394
0
1,394
415
289
– 14
352
179
670
12,784
18,328
11,012
231
451
2,136
43
2,179
98
– 236
9
238
455
281
1,689
3,061
2,793
172
161
1,068
22
1,090
89
73
2
101
170
176
1,396
2,444
2,134
107
130
Segment Reporting
External revenue
Internal revenue
Total revenue
Operating result
Income from operating activities
Income from associates accounted for using
the equity method
Depreciation and amortization
Other major non-cash expenses
EBITDA
Operating assets
(as per the value management concept)
Gross assets (as per the balance sheet)
Gross debt (as per the balance sheet)
Carrying amount of shares in equity companies
Capital expenditure on intangible assets
and property, plant and equipment
23,797
528
24,325
2,760
3,042
352
1,901
3,686
4,146
20,504
61,033
49,582
2,162
1,915

149
Notes
Financial investments
2002 2001 TFY
4,315
0
4,315
186
75
– 305
211
674
414
4,386
5,892
3,606
909
244
9,749
8
9,757
268
235
– 14
289
634
543
4,320
13,965
9,305
908
462
Discontinuing
operations
RWE Dea Downstream
2002 2001 TFY
7,682
3
7,685
– 6
– 87
15
76
127
52
409
0
0
0
28
8,414
24
8,438
202
184
8
73
127
271
1,030
2,792
2,250
158
55
Other/holding/
consolidation
2002 2001 TFY
187
1,407
1,594
– 382
– 234
30
84
1,986
– 348
– 1,854
– 986
13,202
36
60
70
636
706
– 212
– 208
– 8
52
873
– 147
– 642
– 205
10,710
370
39
117
111
2
1,058
1,272
124
46,633
100,273
4,095
31,832
91,449
2,295
Australia
2002 2001 TFY
Group
358
9
0
192
39
0
Africa
2002 2001 TFY 2002 2001 TFY
Group
2002 2001 TFY
46,633
2,564
49,197
4,504
4,800
141
3,742
7,630
7,241
44,293
100,273
91,349
4,030
4,095
31,832
3,005
34,837
2,029
1,752
– 23
1,779
4,053
3,637
37,860
91,449
80,320
4,614
2,295
Non-core business
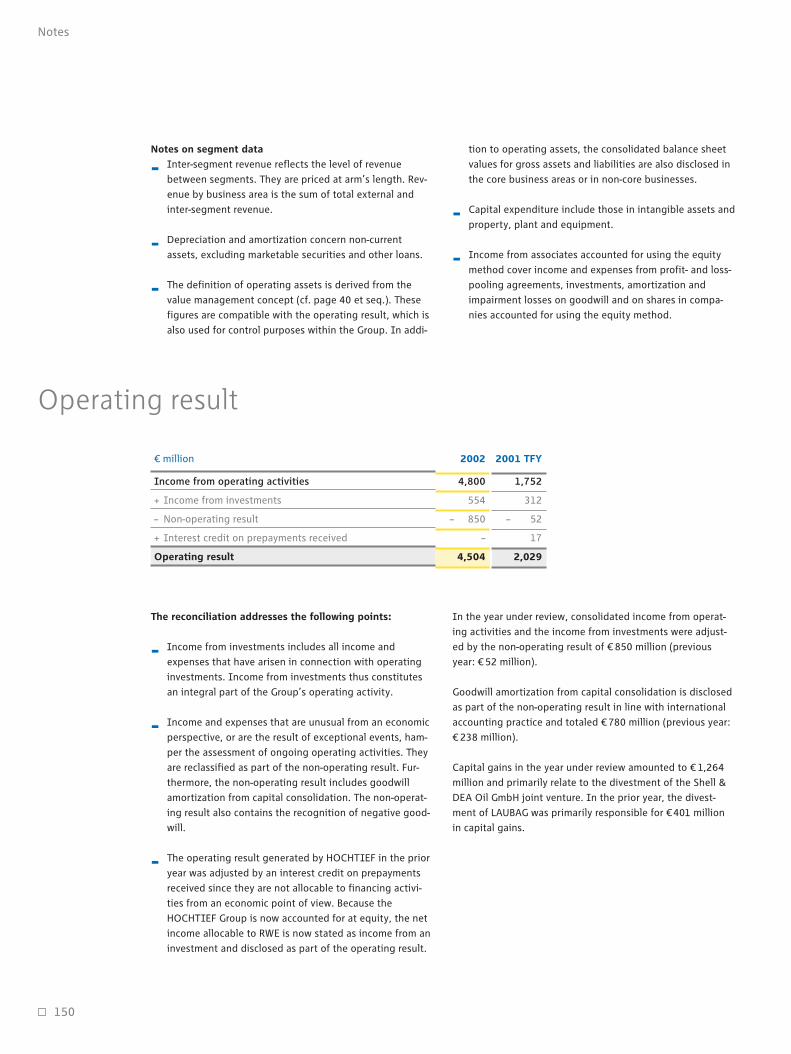
Notes on segment data
jInter-segment revenue reflects the level of revenue
between segments. They are priced at arm’s length. Rev-
enue by business area is the sum of total external and
inter-segment revenue.
jDepreciation and amortization concern non-current
assets, excluding marketable securities and other loans.
jThe definition of operating assets is derived from the
value management concept (cf. page 40 et seq.). These
figures are compatible with the operating result, which is
also used for control purposes within the Group. In addi-
tion to operating assets, the consolidated balance sheet
values for gross assets and liabilities are also disclosed in
the core business areas or in non-core businesses.
jCapital expenditure include those in intangible assets and
property, plant and equipment.
jIncome from associates accounted for using the equity
method cover income and expenses from profit- and loss-
pooling agreements, investments, amortization and
impairment losses on goodwill and on shares in compa-
nies accounted for using the equity method.
The reconciliation addresses the following points:
jIncome from investments includes all income and
expenses that have arisen in connection with operating
investments. Income from investments thus constitutes
an integral part of the Group’s operating activity.
jIncome and expenses that are unusual from an economic
perspective, or are the result of exceptional events, ham-
per the assessment of ongoing operating activities. They
are reclassified as part of the non-operating result. Fur-
thermore, the non-operating result includes goodwill
amortization from capital consolidation. The non-operat-
ing result also contains the recognition of negative good-
will.
jThe operating result generated by HOCHTIEF in the prior
year was adjusted by an interest credit on prepayments
received since they are not allocable to financing activi-
ties from an economic point of view. Because the
HOCHTIEF Group is now accounted for at equity, the net
income allocable to RWE is now stated as income from an
investment and disclosed as part of the operating result.
In the year under review, consolidated income from operat-
ing activities and the income from investments were adjust-
ed by the non-operating result of € 850 million (previous
year: € 52 million).
Goodwill amortization from capital consolidation is disclosed
as part of the non-operating result in line with international
accounting practice and totaled € 780 million (previous year:
€ 238 million).
Capital gains in the year under review amounted to € 1,264
million and primarily relate to the divestment of the Shell &
DEA Oil GmbH joint venture. In the prior year, the divest-
ment of LAUBAG was primarily responsible for €401 million
in capital gains.
150
Notes
Operating result
million 2001 TFY2002
1,752
312
– 52
17
2,029
4,800
554
– 850
–
4,504
Income from operating activities
+ Income from investments
– Non-operating result
+ Interest credit on prepayments received
Operating result
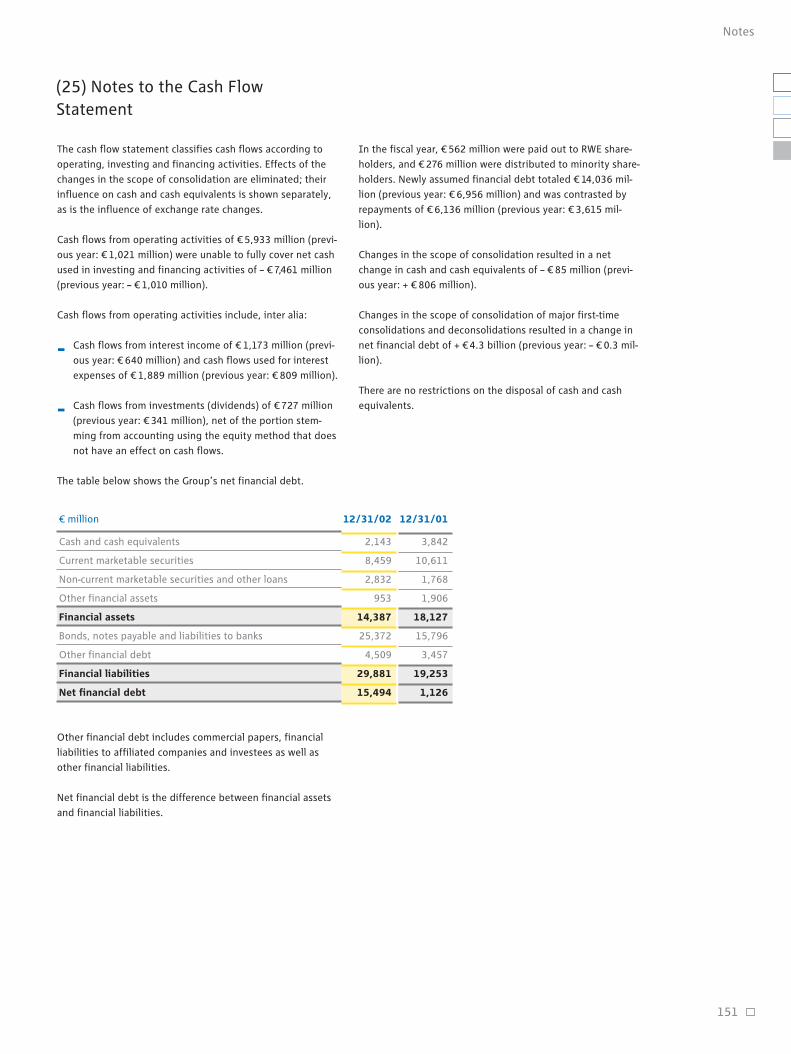
The cash flow statement classifies cash flows according to
operating, investing and financing activities. Effects of the
changes in the scope of consolidation are eliminated; their
influence on cash and cash equivalents is shown separately,
as is the influence of exchange rate changes.
Cash flows from operating activities of € 5,933 million (previ-
ous year: € 1,021 million) were unable to fully cover net cash
used in investing and financing activities of – € 7,461 million
(previous year: – € 1,010 million).
Cash flows from operating activities include, inter alia:
jCash flows from interest income of € 1,173 million (previ-
ous year: € 640 million) and cash flows used for interest
expenses of € 1,889 million (previous year: € 809 million).
jCash flows from investments (dividends) of € 727 million
(previous year: € 341 million), net of the portion stem-
ming from accounting using the equity method that does
not have an effect on cash flows.
In the fiscal year, € 562 million were paid out to RWE share-
holders, and € 276 million were distributed to minority share-
holders. Newly assumed financial debt totaled € 14,036 mil-
lion (previous year: € 6,956 million) and was contrasted by
repayments of € 6,136 million (previous year: € 3,615 mil-
lion).
Changes in the scope of consolidation resulted in a net
change in cash and cash equivalents of – € 85 million (previ-
ous year: + € 806 million).
Changes in the scope of consolidation of major first-time
consolidations and deconsolidations resulted in a change in
net financial debt of + €4.3 billion (previous year: – € 0.3 mil-
lion).
There are no restrictions on the disposal of cash and cash
equivalents.
Other financial debt includes commercial papers, financial
liabilities to affiliated companies and investees as well as
other financial liabilities.
Net financial debt is the difference between financial assets
and financial liabilities.
151
Notes
(25) Notes to the Cash Flow Statement
12/31/0112/31/02 million
The table below shows the Group’s net financial debt.
2,143
8,459
2,832
953
14,387
25,372
4,509
29,881
15,494
3,842
10,611
1,768
1,906
18,127
15,796
3,457
19,253
1,126
Cash and cash equivalents
Current marketable securities
Non-current marketable securities and other loans
Other financial assets
Financial assets
Bonds, notes payable and liabilities to banks
Other financial debt
Financial liabilities
Net financial debt
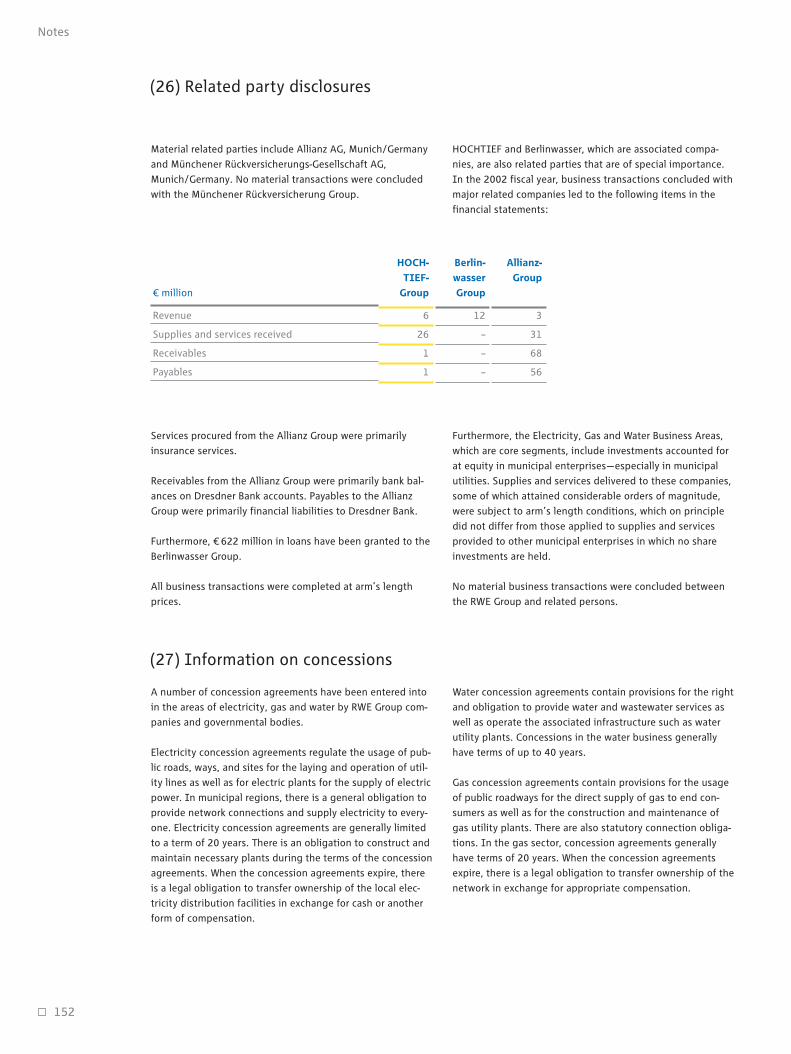
12
–
–
–
6
26
1
1
3
31
68
56
Revenue
Supplies and services received
Receivables
Payables
Services procured from the Allianz Group were primarily
insurance services.
Receivables from the Allianz Group were primarily bank bal-
ances on Dresdner Bank accounts. Payables to the Allianz
Group were primarily financial liabilities to Dresdner Bank.
Furthermore, € 622 million in loans have been granted to the
Berlinwasser Group.
All business transactions were completed at arm’s length
prices.
Furthermore, the Electricity, Gas and Water Business Areas,
which are core segments, include investments accounted for
at equity in municipal enterprises—especially in municipal
utilities. Supplies and services delivered to these companies,
some of which attained considerable orders of magnitude,
were subject to arm’s length conditions, which on principle
did not differ from those applied to supplies and services
provided to other municipal enterprises in which no share
investments are held.
No material business transactions were concluded between
the RWE Group and related persons.
A number of concession agreements have been entered into
in the areas of electricity, gas and water by RWE Group com-
panies and governmental bodies.
Electricity concession agreements regulate the usage of pub-
lic roads, ways, and sites for the laying and operation of util-
ity lines as well as for electric plants for the supply of electric
power. In municipal regions, there is a general obligation to
provide network connections and supply electricity to every-
one. Electricity concession agreements are generally limited
to a term of 20 years. There is an obligation to construct and
maintain necessary plants during the terms of the concession
agreements. When the concession agreements expire, there
is a legal obligation to transfer ownership of the local elec-
tricity distribution facilities in exchange for cash or another
form of compensation.
Water concession agreements contain provisions for the right
and obligation to provide water and wastewater services as
well as operate the associated infrastructure such as water
utility plants. Concessions in the water business generally
have terms of up to 40 years.
Gas concession agreements contain provisions for the usage
of public roadways for the direct supply of gas to end con-
sumers as well as for the construction and maintenance of
gas utility plants. There are also statutory connection obliga-
tions. In the gas sector, concession agreements generally
have terms of 20 years. When the concession agreements
expire, there is a legal obligation to transfer ownership of the
network in exchange for appropriate compensation.
152
Notes
(27) Information on concessions
Material related parties include Allianz AG, Munich/Germany
and Münchener Rückversicherungs-Gesellschaft AG,
Munich/Germany. No material transactions were concluded
with the Münchener Rückversicherung Group.
HOCHTIEF and Berlinwasser, which are associated compa-
nies, are also related parties that are of special importance.
In the 2002 fiscal year, business transactions concluded with
major related companies led to the following items in the
financial statements:
(26) Related party disclosures
Allianz-
Group
Berlin-
wasser
Group million
HOCH-
TIEF-
Group
Accounting, valuation and consolidation methods applied in
accordance with IAS differ from those required by the Ger-
man Commercial Code primarily as regards the following
items:
Intangible assets
IAS stipulate the capitalization of internally generated intan-
gible non-current assets if the prerequisites of capitalization
are met. Pursuant to the German Commercial Code, capital-
ization is not allowed.
Non-current and current marketable securities
According to IAS, marketable securities classified as “avail-
able for sale” must be marked to market. The RWE Group dis-
closes changes in fair values without an effect on net income
as part of other comprehensive income. In accordance with
the German Commercial Code, marketable securities are mea-
sured at amortized cost.
Derivative financial instruments
Derivative financial instruments that are not used for hedg-
ing purposes must be marked to market with an effect on net
income pursuant to IAS. In accordance with the German
Commercial Code, derivative financial instruments that are
not used for hedging purposes are to be valued based on the
imparity principle. IAS criteria for on-balance-sheet hedging
transactions and related items deviate from those of the Ger-
man Commercial Code.
Inventories
Unlike under the German Commercial Code, according to IAS,
lower valuations may on principle only take the sales market
into consideration.
Construction contracts
As a rule, under the German Commercial Code, gains on con-
struction contracts may only be realized once the entire con-
tract has been completed and accepted. Under IAS, gains
should be recognized pro-rata by reference to the percentage
of completion method.
Deferred taxes
In accordance with the German Commercial Code, deferred
taxes must be determined on all timing differences between
the recognition of income in the financial statements for
financial reporting purposes and their recognition in the tax
computations using the so-called timing concept.
Pursuant to IAS, deferred taxes must be determined for all
temporary differences between the tax bases in accordance
with tax laws and the carrying amounts in the consolidated
balance sheets in accordance with finanical reporting rules.
Unlike under the German Commercial Code, deferred taxes
must be accrued for quasi-permanent differences and tax loss
carryforwards.
Provisions for pensions and similar obligations
According to IAS, provisions for pensions are stated using
the projected unit credit method. Increases of pension bene-
fits expected in the future are considered in addition to ben-
efits accumulated attributable to service year end.
Other long-term provisions
Under the German Commercial Code, provisions must be stat-
ed as would be deemed appropriate using reasonable com-
mercial judgement as of the balance-sheet date. They may
only be discounted insofar as the underlying liability has an
interest component.
Under IAS, provisions are measured at their settlement
amounts. Future events that may have an influence on the
settlement amount of long-term provisions must be taken
into account. Long-term provisions must be discounted at an
interest rate with the same terms and adjusted to account for
the associated risks.
Capital consolidation
The purchase method known as the “book value method”
and the “revaluation method” are permissible pursuant to
the German Commercial Code. Revalued equity must not
exceed its acquisition cost. Under IAS, equity must be
remeasured to the fair value to the extent of the acquirer’s
interest (benchmark treatment) or to the full fair value
(allowed alternative treatment) independently of the acquisi-
tion costs.
153
Notes
(28) Special comments pursuant to Sec. 292a of the German Commercial Code
Information on the members of the Executive Board and
Supervisory Board pursuant to Section 285, No. 10 of the
German Commercial Code is provided on pages 160 to 163.
Provided that the Annual General Meetings pass the
proposed disbursements, the remuneration paid to members
of the Executive Board for the year under review is as
follows: the fixed remuneration amounted to 4,223,895.03
and the variable remuneration amounted to 5,262,085.38
(total compensation in the truncated fiscal year:
3,049,133.94), of which 446,873.35 were fixed and
589,500.43 were variable and come from subsidiaries (total
compensation in the previous truncated fiscal year:
999,246.18). The fixed-remuneration paid to members of
the Supervisory Board are to 283,459.40 and their variable
remuneration amounted to 1,017,754.08 (total compensa-
tion in the truncated fiscal year: 752,456.55), of which
161,060.21 were fixed and 50,034.93 were variable and
come from subsidaries (total compensation in the previous
truncated fiscal year: 127,720.55). As of the balance-sheet
date, under RWE AG’s stock option plan, current and former
Executive Board members held non-transferable stock
options on 1,060,000 and 140,000 common shares of RWE
AG, respectively (previous year: 1,240,000 and 140,000,
respectively), of which 180,000 and 60,000 are from sub-
sidiaries (previous year: 180,000 and 60,000, respectively) as
well as 375,000 SARs within the scope of the Long Term
Incentive Plan, of which 35,000 were from subsidiaries. For
details on the stock option plan, please refer to the commen-
tary on the equity (cf. pages 133 and 135).
Former members of the Executive Board and their surviving
dependants received € 7,809,093.94 (previous year:
€ 3,815,391.08), € 1,654,381.49 of which (previous year:
€ 911,801.82) came from subsidiaries. € 76,916,551.00 (pre-
vious year: € 81,264,572.02) have been accrued for pension
commitments vis-à-vis former members of the Executive
Board and their surviving dependants, € 16,876,742.00 of
which (previous year: € 19,638,105.00) were set aside at
subsidiaries.
The Economic Advisory Board was paid € 691,157.93 (previ-
ous year: €471,312.04), € 69,491.26 of which (previous year:
€ 75,895.37) came from subsidiaries.
Declarations required to comply with Sec. 161 of the German
Stock Corporation Act relating to RWE AG and its listed Ger-
man subsidiaries have been issued and made available to
shareholders.
On October 15, 2002, RW Energie-Beteiligungsgesellschaft
mbH, Münster, Germany, informed RWE AG pursuant to Sec.
21, Para. 1 of the German Securities Trading Act (WpHG) that
it exceeded the 10% voting stock handle on October 14,
2002 and that it now owns 10.94% of RWE AG‘s voting stock.
On October 18, 2002, Allianz Aktiengesellschaft, Munich,
Germany, informed RWE AG pursuant to Sec. 21, Para. 1 of
the German Securities Trading Act (WpHG) that it fell below
the 10% voting stock handle on October 14, 2002 and that it
now owns 7.55% of RWE AG‘s voting stock, 7.51% of which
are allocable to Allianz according to Sec. 22, Para. 1, P 1,
No. 1 of the German Securities Trading Act (WpHG) and 0.04%
of which are allocable to Allianz according to Sec. 22, Para. 1,
P 1, No. 6 of the German Securities Trading Act (WpHG).
On October 21, 2002, Münchener Rückversicherungs-
Gesellschaft Aktiengesellschaft in München, Munich, Ger-
many, informed RWE AG pursuant to Sec. 21, Para. 1 and Sec.
22, Para. 1, No. 1 of the German Securities Trading Act (WpHG)
that it exceeded the 5% voting stock handle on October 14,
2002 and that it now owns 5.8% of RWE AG‘s voting stock.
This encludes 4.3% of RWE AG‘s voting rights that are allo-
cable to it in accordance with Sec. 22, Para. 1, No. 1 of the
German Securities Trading Act (WpHG).
Subsequent events
Events that occurred after the balance-sheet date are report-
ed on page 54.
This report contains individual forward-looking statements
concerning the further course of business such as forecasts
on the development of the economic and political environ-
ment as well as on our own business. These statements are
based on carefully made assumptions on our part. However,
due to remaining risks and uncertainties, we cannot guaran-
tee that they will turn out to be correct in part or in their
entirety.
154
Notes
Additional information
Auditors’ report
We have audited the consolidated financial statements of
RWE AG, consisting of the income statement, the balance
sheet, the cash flow statement, the statement of changes in
equity and the notes to the financial statements for the fiscal
year from January 1, 2002 to December 31, 2002. These
consolidated financial statements according to the Interna-
tional Accounting Standards are the responsibility of the
Company’s Executive Board. Our responsibility is to express
an opinion, based on our audit, whether the consolidated
financial statements are in accordance with IAS.
We conducted our audit of the consolidated financial state-
ments in accordance with German auditing regulations and
generally accepted standards for the audit of financial state-
ments promulgated by the Institut der Wirtschaftsprüfer in
Deutschland (IDW) as well as in accordance with the Interna-
tional Standards on Auditing (ISA). Those standards require
that we plan and perform the audit to obtain reasonable
assurance about whether the consolidated financial state-
ments are free of material misstatement. An audit includes
examining, on a test basis, evidence supporting the amounts
and disclosures in the consolidated financial statements. An
audit also includes assessing the accounting principles used
and significant estimates made by the Executive Board, as
well as evaluating the overall presentation of the consolidat-
ed financial statements. We believe that our audit provides a
reasonable basis for our opinion.
In our opinion, based on our audit, the consolidated financial
statements give a true and fair view of the net assets of the
group, and of its financial position, its results of operations
and its cash flows for the fiscal year in accordance with IAS.
Our audit, which according to German auditing regulations,
also extends to the review of group operations combined
with the review of operations of RWE AG, which is prepared
by the Executive Board for the fiscal year from January 1,
2002 to December 31, 2002, has not led to any reservations.
In our opinion, on the whole, the combined review of opera-
tions provides a suitable understanding of the group’s posi-
tion and suitably presents the risks of future development. In
addition, we confirm that the consolidated financial state-
ments and the combined review of operations for the fiscal
year from January 1, 2002 to December 31, 2002 satisfy the
conditions required for the Company’s exemption from its
duty to prepare consolidated financial statements and the
review of operations in accordance with German accounting
law.
Essen, Germany, March 5, 2003
PwC Deutsche Revision
Aktiengesellschaft
Wirtschaftsprüfungsgesellschaft
P. Albrecht Dr. N. Schwieters
Wirtschaftsprüfer Wirtschaftsprüfer
(German Certified (German Certified
Public Accountant) Public Accountant)
155
Auditors’ Report

156
Material Investments
Material Investments as of December 31, 2002Investment
in acc. with
Sec. 16 of
the Ger-
man Stock
Corpora-
tion Act
%
Equity
of the
last fiscal
year
’000
Net
income/
loss
of the
last fiscal
year
’000
External
revenue
2002 FY
million
Em-
ployees4
2002 FY
average
I. Affiliates
367
2,480
11,899
161
5,915
2,208
260
9,554
129
2,022
6,786
704
3,404
1,389
580
708
280
589
1,279
3,107
–
10
6
1,168
161
523
262
1,960
155
396
1,626
7
486
–
3,494
1,784
4,580
4,241
5,240
966
3,562
58
649
2,257
333
1,886
306
230
215
323
217
736
195
1
10
2
130
220
83
127
231
736
86
906
310
216
1,148,682
– 1
– 1
– 1
– 1
– 1
– 1
84,196
16,588
26,033
12,330
12,916
87,780
1,696
18,442
116
– 1
16,354
22,168
23,403
19,307
1,796
– 1
– 1
– 1
– 448
– 4
– 1
12,420
1,719
35,635
– 354
12,558
4,175,385
1,005,895
1,111,080
51,100
960,129
510,905
185,985
939,999
203,471
293,799
155,486
82,462
909,223
130,203
46,254
76,304
465,545
81,391
182,030
177,667
36,361
14,250
61,694
11,025
36,684
16,718
10,256
32,251
31,087
12,412
250,945
20,725
131,456
100
100
100
100
100
100
100
95
55
72
79
60
54
54
75
88
58
90
51
100
100
100
100
100
100
100
100
100
100
78
75
69
RWE Aktiengesellschaft, Essen
Electricity
RWE Power Aktiengesellschaft, Essen
RWE Rheinbraun Aktiengesellschaft, Cologne
RWE Trading GmbH, Essen
RWE Net Aktiengesellschaft, Dortmund
RWE Plus Aktiengesellschaft, Essen
RWE Solutions Aktiengesellschaft, Frankfurt/Main
Innogy Holdings plc, Swindon/UK2
Harpen Aktiengesellschaft, Dortmund
Budapesti Elektromos Müvek Rt. (ELMÜ), Budapest/Hungary
CONSOL Energy Inc., Wilmington/Delaware/USA;
CONSOL Energy Group2 with 51 subsidiaries in the USA, Belgium, Canada and Australia
Emscher Lippe Energie GmbH, Gelsenkirchen
envia Mitteldeutsche Energie AG, Chemnitz
Észak-magyarországi Áramszolgáltató Rt. (ÉMÁSZ), Miskolc/Hungary
EWV Energie- und Wasser-Versorgung GmbH, Stolberg
Kernkraftwerke Gundremmingen GmbH, Gundremmingen
Kernkraftwerke Lippe-Ems GmbH, Lingen (Ems)
Koblenzer Elektrizitätswerk und Verkehrs-AG, Koblenz
Lechwerke Aktiengesellschaft, Augsburg3
Mátrai Erömü Rt. (MÁTRA), Visonta/Hungary
RBB Vermögensverwaltungs GmbH, Cologne
Rheinbraun Engineering und Wasser GmbH, Cologne
RV Rheinbraun Handel und Dienstleistungen GmbH, Cologne
SAG Energieversorgungslösungen GmbH, Frankfurt/Main
RWE NUKEM GmbH, Alzenau
RWE Piller GmbH, Osterode am Harz
RWE Industrie-Lösungen GmbH, Duisburg
SAG Netz- und Energietechnik GmbH, Langen
SSM Coal B.V., Rotterdam/Niederlande
SSM Coal-Group2 with 23 subsidiaries in Germany, Europe, Australia and the USA
Starkstrom-Gerätebau GmbH, Regensburg
Süwag Energie AG, Frankfurt/Main
Turbogás-Produtora Energética, S.A., Lisbon/Portugal
VSE Aktiengesellschaft, Saarbrücken
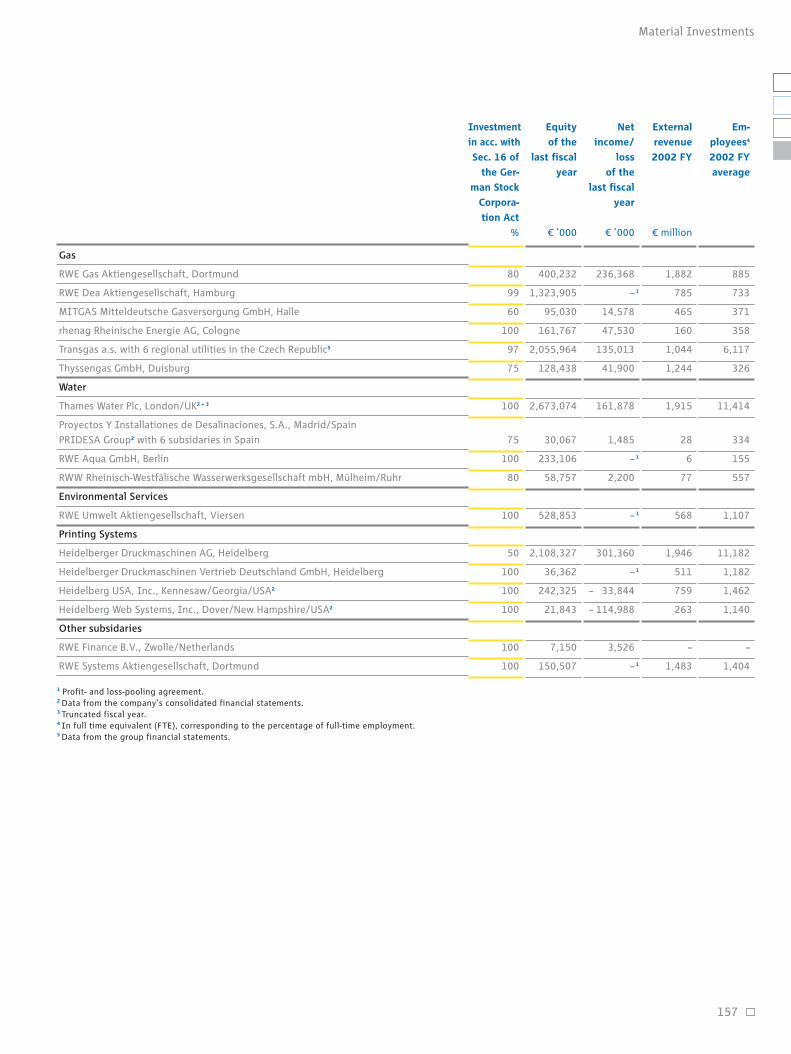
157
Material Investments
Investment
in acc. with
Sec. 16 of
the Ger-
man Stock
Corpora-
tion Act
%
Equity
of the
last fiscal
year
’000
Net
income/
loss
of the
last fiscal
year
’000
External
revenue
2002 FY
million
Em-
ployees4
2002 FY
average
1 Profit- and loss-pooling agreement.2 Data from the company’s consolidated financial statements.3 Truncated fiscal year.4 In full time equivalent (FTE), corresponding to the percentage of full-time employment.5 Data from the group financial statements.
Gas
RWE Gas Aktiengesellschaft, Dortmund
RWE Dea Aktiengesellschaft, Hamburg
MITGAS Mitteldeutsche Gasversorgung GmbH, Halle
rhenag Rheinische Energie AG, Cologne
Transgas a.s. with 6 regional utilities in the Czech Republic5
Thyssengas GmbH, Duisburg
Water
Thames Water Plc, London/UK2 + 3
Proyectos Y Installationes de Desalinaciones, S.A., Madrid/Spain
PRIDESA Group2 with 6 subsidaries in Spain
RWE Aqua GmbH, Berlin
RWW Rheinisch-Westfälische Wasserwerksgesellschaft mbH, Mülheim/Ruhr
Environmental Services
RWE Umwelt Aktiengesellschaft, Viersen
Printing Systems
Heidelberger Druckmaschinen AG, Heidelberg
Heidelberger Druckmaschinen Vertrieb Deutschland GmbH, Heidelberg
Heidelberg USA, Inc., Kennesaw/Georgia/USA2
Heidelberg Web Systems, Inc., Dover/New Hampshire/USA2
Other subsidaries
RWE Finance B.V., Zwolle/Netherlands
RWE Systems Aktiengesellschaft, Dortmund
885
733
371
358
6,117
326
11,414
334
155
557
1,107
11,182
1,182
1,462
1,140
–
1,404
1,882
785
465
160
1,044
1,244
1,915
28
6
77
568
1,946
511
759
263
–
1,483
236,368
– 1
14,578
47,530
135,013
41,900
161,878
1,485
– 1
2,200
– 1
301,360
– 1
– 33,844
– 114,988
3,526
– 1
400,232
1,323,905
95,030
161,767
2,055,964
128,438
2,673,074
30,067
233,106
58,757
528,853
2,108,327
36,362
242,325
21,843
7,150
150,507
80
99
60
100
97
75
100
75
100
80
100
50
100
100
100
100
100

158
Material Investments
Electricity
Energieversorgung Oberhausen AG, Oberhausen
Kärntner Energieholding Beteiligungs-GmbH, Klagenfurt, Austria*
Kommunale Energie- und Wasserversorgung Neunkirchen AG, Neunkirchen
Motor-Columbus AG, Baden/Switzerland*
Niederrheinische Versorgung und Verkehr AG, Mönchengladbach*
Stadtwerke Duisburg AG, Duisburg
Stadtwerke Düsseldorf AG, Düsseldorf
TCP Petcoke Corporation, Dover/Delaware/USA
Gas
Fövárosi Gázmüvek Rt., Budapest/Hungary
Nafta a.s., Trnava/Slovak Republic*
Stadtwerke Essen AG, Essen
TIGÁZ Tiszántúli Gázszolgáltató Rt., Hajdúszoboszló/Hungary
Water
RWE/VIVENDI Berlinwasser Beteiligungs AG, Berlin
Others
HOCHTIEF Aktiengesellschaft, Essen*
III. Other investments
* Data from the company’s consolidated financial statements.
Electricity
Städtische Werke Magdeburg GmbH, Magdeburg
Stadtwerke Chemnitz AG, Chemnitz
Others
RAG Aktiengesellschaft*
13,115
10,840
4,568
49,788
36,298
18,081
46,542
11,445
16,729
15,803
14,810
19,503
– 66,826
– 41,434
36,992
120,157
67,206
417,927
388,112
142,222
355,714
4,282
147,418
104,438
113,454
144,192
333,283
1,213,766
50
49
29
20
50
20
20
50
33
40
29
44
50
40
10,851
12,891
21,400
126,026
257,628
2,023,000
17
19
30
Investment
in acc. with
Sec. 16 of
the Ger-
man Stock
Corpora-
tion Act
%
Equity
of the
last fiscal
year
’000
Net
income/
loss
of the
last fiscal
year
’000
II. Associates accounted for using the equity method
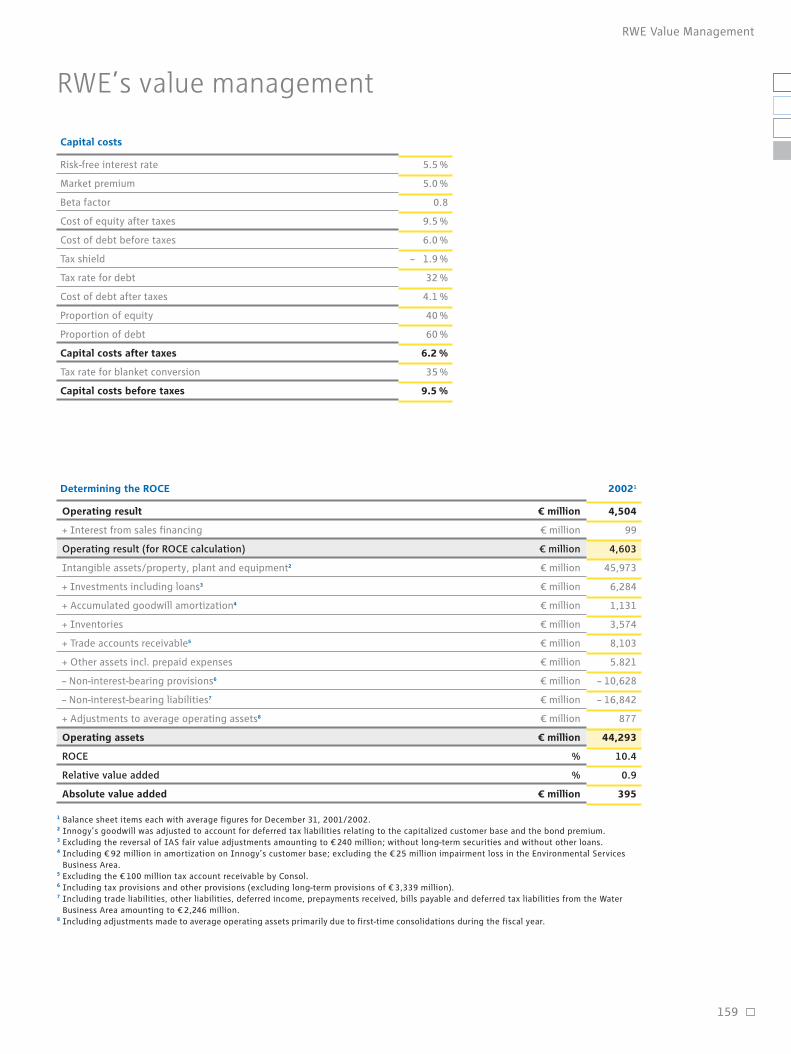
159
RWE Value Management
Capital costs
Risk-free interest rate
Market premium
Beta factor
Cost of equity after taxes
Cost of debt before taxes
Tax shield
Tax rate for debt
Cost of debt after taxes
Proportion of equity
Proportion of debt
Capital costs after taxes
Tax rate for blanket conversion
Capital costs before taxes
RWE’s value management
5.5 %
5.0 %
0.8
9.5 %
6.0 %
– 1.9 %
32 %
4.1 %
40 %
60 %
6.2 %
35 %
9.5 %
Determining the ROCE 20021
4,504
99
4,603
45,973
6,284
1,131
3,574
8,103
5.821
– 10,628
– 16,842
877
44,293
10.4
0.9
395
Operating result € million
+ Interest from sales financing € million
Operating result (for ROCE calculation) € million
Intangible assets/property, plant and equipment2 € million
+ Investments including loans3 € million
+ Accumulated goodwill amortization4 € million
+ Inventories € million
+ Trade accounts receivable5 € million
+ Other assets incl. prepaid expenses € million
– Non-interest-bearing provisions6 € million
– Non-interest-bearing liabilities7 € million
+ Adjustments to average operating assets8 € million
Operating assets € million
ROCE %
Relative value added %
Absolute value added € million
1 Balance sheet items each with average figures for December 31, 2001/2002.2 Innogy’s goodwill was adjusted to account for deferred tax liabilities relating to the capitalized customer base and the bond premium.3 Excluding the reversal of IAS fair value adjustments amounting to € 240 million; without long-term securities and without other loans.4 Including € 92 million in amortization on Innogy’s customer base; excluding the € 25 million impairment loss in the Environmental Services
Business Area.5 Excluding the € 100 million tax account receivable by Consol.6 Including tax provisions and other provisions (excluding long-term provisions of € 3,339 million).7 Including trade liabilities, other liabilities, deferred income, prepayments received, bills payable and deferred tax liabilities from the Water
Business Area amounting to € 2,246 million.8 Including adjustments made to average operating assets primarily due to first-time consolidations during the fiscal year.

160
Boards
Supervisory Board
Dr. h.c. Friedel Neuber
Duisburg
Chairman
jBabcock Borsig AG (Chairman)
jDeutsche Bahn AG
jHapag-Lloyd AG
jRAG AG
jThyssenKrupp AG
jTUI AG (Chairman)
jLandwirtschaftliche Rentenbank
Frank Bsirske*
Hanover
Deputy Chairman
Chairman of ver.di Vereinte
Dienstleistungsgewerkschaft e.V.
jDAWAG Deutsche Angestellten-Wohnungsbau-AG
jDeutsche Lufthansa AG
jIBM Central Holding GmbH
Dr. Paul Achleitner
Munich
Executive Vice-President of Allianz AG
jAllianz Immobilien GmbH (Chairman)
jBayer AG
jMAN AG
jÖsterreichische Industrieholding AG
Carl-Ludwig von Boehm-Bezing
Bad Soden
Former member of the Board of Management of
Deutsche Bank AG
jRÜTGERS AG
jSteigenberger Hotels AG
jThyssenKrupp AG
Burkhard Drescher
Oberhausen
Mayor of the City of Oberhausen
jEnergieversorgung Oberhausen AG
jRW Holding AG (Chairman)
jStadtwerke Oberhausen AG (Chairman)
jDeutsche Städte-Medien GmbH
jEntwicklungsgesellschaft Neu-Oberhausen mbH
—ENO—(Chairman)
jPBO Projektentwicklungs- und Beteiligungsgesellschaft
Oberhausen mbH
jStadtsparkasse Oberhausen (Chairman)
Wilfried Eickenberg*
Cologne
Chairman of the General Works Council of RWE Plus AG
jRWE Plus AG
Ralf Hiltenkamp*
Arnsberg
Chairman of the General Works Council of
RWE Umwelt Westfalen GmbH & Co. KG
jRWE Umwelt AG
Heinz-Eberhard Holl
Osnabrück
Former Chief Administrative Officer, Osnabrück Rural District
jGeorgsmarienhütte GmbH
jGeorgsmarienhütte Holding GmbH
Berthold Huber*
Stuttgart
Trade Union Secretary of IG Metall
jAudi AG
jHeidelberger Druckmaschinen AG
jSaarstahl AG
Berthold Krell*
Wenden-Hünsborn
Chairman of the General Works Council of RWE Net AG
jRWE Net AG
Dr. Gerhard Langemeyer
Dortmund
Mayor of the City of Dortmund
jDortmunder Stadtwerke AG (Chairman)
jDortmunder Energie und Wasser GmbH
jKEB Holding AG
jDüsseldorf Rhein-Ruhr 2012 GmbH
jKlinikum Dortmund gGmbH (Chairman)
jSchüchtermann Schiller’sche Kliniken KG
jSTEAG microParts GmbH
Josef Pitz*
Angelbachtal
Chairman of the General Works Council of
Heidelberger Druckmaschinen AG
jHeidelberger Druckmaschinen AG
* Employee representative on the Supervisory Board.
jMember of other mandatory supervisory boards.
jMember of comparable domestic and foreign supervisory bodies ofcommercial enterprises.
161
Boards
Dr. Wolfgang Reiniger
Essen
Mayor of the City of Essen
jDeutsche Städte-Medien GmbH
jEntwicklungsgesellschaft Universitätsviertel
Essen mbH (Chairman)
jEMG Essen Marketing GmbH Gesellschaft für Stadt-
werbung, Touristik und Zentrenmanagement (Chairman)
jEssener Wirtschaftsförderungsgesellschaft mbH
(Chairman)
jMargarethe Krupp-Stiftung für Wohnungsfürsorge
(Chairman)
jMesse Essen GmbH (Chairman)
jSparkasse Essen (Chairman)
Günter Reppien*
Lingen
Chairman of the General Works Council of RWE Power AG
jRWE Power AG
jStadtwerke Lingen GmbH
Bernhard von Rothkirch*
Frechen
M.A. in mining engineering
Dr. Manfred Schneider
Leverkusen
Chairman of the Supervisory Board of Bayer AG
jAllianz AG
jDaimlerChrysler AG
jLinde AG
jMetro AG
jTUI AG
Klaus-Dieter Südhofer*
Recklinghausen
Deputy Chairman of IG Bergbau, Chemie, Energie
jBGAG Beteiligungsgesellschaft der Gewerkschaften AG
jGSG Wohnungsbau Braunkohle GmbH
jHarpen AG
jRAG AG
jRAG Immobilien AG
jRWE Dea AG
jRWE Rheinbraun AG
Dr. Alfons Friedrich Titzrath
Cologne
Former Chairman of the Supervisory Board of Dresdner Bank AG
jCelanese AG
jDeutsche Lufthansa AG
Prof. Karel Van Miert
Beersel
President of Nyenrode University
jFraport AG
jMünchener Rückversicherungs-Gesellschaft AG
jAgfa-Gevaert N.V.
jAnglo American plc
jDe Persgroup
jDHV Group
jKoninklijke Philips Electronics N.V.
jWolters Kluwer N.V.
Erwin Winkel*
Niederzier
Chairman of the General Works Council of RWE Rheinbraun AG
* Employee representative on the Supervisory Board.
jMember of other mandatory supervisory boards.
jMember of comparable domestic and foreign supervisory bodies ofcommercial enterprises.
162
Boards
Executive Committee of the
Supervisory Board
Dr. h.c. Friedel Neuber (Chairman)
Frank Bsirske
Dr. Paul Achleitner
Burkhard Drescher
Wilfried Eickenberg
Josef Pitz
Dr. Manfred Schneider
Erwin Winkel
Mediation Committee in accordance
with Sec. 27, Para. 3 of the German
Co-Determination Act (MitbestG)
Dr. h.c. Friedel Neuber (Chairman)
Frank Bsirske
Berthold Krell
Dr. Manfred Schneider
Executive Board Human
Resources Committees
Dr. h.c. Friedel Neuber (Chairman)
Frank Bsirske
Dr. Paul Achleitner
Heinz-Eberhard Holl
Klaus-Dieter Südhofer
Audit Committee
Carl-Ludwig von Boehm-Bezing (Chairman)
Ralf Hiltenkamp
Berthold Krell
Dr. Gerhard Langemeyer
Günter Reppien
Prof. Karel Van Miert
Supervisory Board Committees

163
Boards
Harry Roels
Essen
—since February 1, 2003—
President and CEO of RWE AG
jRWE Plus AG (Chairman)
jRWE Power AG (Chairman)
jInnogy Holdings plc (Chairman)
jThames Water Plc (Chairman)
Dr. Dietmar Kuhnt
Essen
—until February 28, 2003—
Former President and CEO of RWE AG
jAllianz Versicherungs-AG
jDresdner Bank AG
jHapag-Lloyd AG
jHeidelberger Druckmaschinen AG (Chairman)
jHOCHTIEF AG (Chairman)
jmg technologies ag
jTUI AG
Dr. Richard R. Klein
Essen
—until March 13, 2003—
Former Executive Vice-President of RWE AG
jHarpen AG (Chairman)
jRWE Systems AG (Chairman)
jRWE Umwelt AG
jInnogy Holdings plc
jThames Water Plc
Dr. Gert Maichel
Dortmund
Executive Vice-President of RWE AG
jHarpen AG
jRAG AG
jRWE Dea AG (Chairman)
jRWE Gas AG
jRWE Rheinbraun AG (Chairman)
jTÜV Rheinland Holding AG
jInnogy Holdings plc
jRWE Trading GmbH (Chairman)
Manfred Remmel
Essen
—until March 13, 2003—
Former Executive Vice-President of RWE AG
jAXA Versicherung AG
jRWE Gas AG (Chairman)
jRWE Net AG (Chairman)
jRWE Plus AG
jRWE Solutions AG (Chairman)
jRWE Umwelt AG (Chairman)
jWISTA-Management GmbH
Dr. Klaus Sturany
Dortmund
Executive Vice-President of RWE AG
jCommerzbank AG
jHannover Rückversicherungs-AG
jHeidelberger Druckmaschinen AG
jHOCHTIEF AG
jRAG AG
jRWE Dea AG
jRWE Power AG
jRWE Solutions AG
jInnogy Holdings plc
jRWE Trading GmbH
jThames Water Plc
Jan Zilius
Essen
Executive Vice-President of RWE AG
jRWE Gas AG
jRWE Net AG
jRWE Rheinbraun AG
jRWE Systems AG
Executive Board

Edmond Alphandéry
Paris
—until March 31, 2002—
Président du Conseil de Surveillance de CNP
Prof. Dr. Dr. h.c. Theodor Baums
Frankfurt/Main
—since January 1, 2002—
Member of the Executive Committee of
Deutsche Schutzvereinigung für Wertpapierbesitz e. V.
Dr. h.c. Manfred Bodin
Hanover
President and CEO of Norddeutsche Landesbank Girozentrale
Dr. Gerhard Cromme
Düsseldorf
Chairman of the Supervisory Board of
ThyssenKrupp AG
Jürgen Dormann
Schiltigheim
Chairman of the Supervisory Board of Aventis
Dr. Michael Frenzel
Hanover
President and CEO of TUI AG
Prof. Dr. Dr. h.c. Joachim Funk
Düsseldorf
—until December 31, 2002—
Dr. Jürgen Großmann
Georgsmarienhütte
Partner in Georgsmarienhütte GmbH
Helmut Haumann
Cologne
President and CEO of GEW RheinEnergie AG
Dr. Georg Holzhey
Augsburg
Dieter Kauffmann
Esslingen
—until June 30, 2002—
Former Chairman of Schutzgemeinschaft
der Kleinaktionäre e. V.
Dr. h.c. Martin Kohlhaussen
Frankfurt/Main
Chairman of the Supervisory Board of
Commerzbank AG
Prof. Dr. Hubert Markl
Konstanz
Professor of Biology at Konstanz University
Dr. Thomas Middelhoff
Gütersloh
—since February 1, 2002—
Former President and CEO of Bertelsmann AG
Rafael Miranda
Madrid
Consejero Delegado del Grupo Endesa
Dr. Karl Josef Neukirchen
Frankfurt/Main
President and CEO of mg technologies ag
Dr. Udo Oels
Leverkusen
Executive Vice-President of Bayer AG
Alfred Freiherr von Oppenheim
Cologne
Chairman of the Supervisory Board of
Sal. Oppenheim jr. & Cie. KGaA
Dr. Heinrich von Pierer
Munich
President and CEO of Siemens AG
Bernd Pischetsrieder
Wolfsburg
President and CEO of Volkswagen AG
164
Boards
Economic Advisory Board
165
Boards
Diethelm Sack
Frankfurt/Main
Executive Vice-President of Deutsche Bahn AG
Prof. Dr. Ernst Schadow
Frankfurt/Main
Executive Vice-President of Celanese AG
Prof. Dr. Dieter Schmitt
Essen
Faculty of Energy Management Chair, GH Essen University
Klaus Schneider
Munich
—since July 1, 2002—
Chairman of Schutzgemeinschaft der Kleinaktionäre e. V.
Hans Peter Schreib
Düsseldorf
—until December 31, 2002—
Attorney-at-Law, Member of the Executive Committee
Deutsche Schutzvereinigung für Wertpapierbesitz e. V.
Dr. Ron Sommer
Bonn
Former President and CEO of Deutsche Telekom AG
Karl Starzacher
Essen
President and CEO of RAG AG
Prof. Dr. Jürgen Strube
Ludwigshafen
President and CEO of BASF AG
Marcus Wallenberg
Stockholm
Executive Vice President, Investor AB
Marilyn Ware
New Jersey
—since February 1, 2002—
Chairman Emeritus of American Water Works Company, Inc.
Dr. E.h. Jürgen Weber
Frankfurt/Main
President and CEO of Deutsche Lufthansa AG
Prof. Dr. Carl Christian von Weizsäcker
Cologne
Director of the Energy Industry Institute at
Cologne University
Wilhelm Werhahn
Neuss
Personally liable partner in Wilh. Werhahn
Dr. h.c. Wolfgang Ziemann
Essen
Former Executive Vice-President of RWE AG
166
Glossary
Glossary
Actuarial gains and
losses
Balancing power
Base load
Best practice
Cash flow
Cross-selling
Downstream
EBITDA
The actuarial calculation (computa-
tion according to insurance mathe-
matics) of pension provisions is
largely based on forecast parameters
(such as the projected pattern of
wages and pensions). Actuarial
gains and losses arise if these
assumptions are revised in the light
of actual developments.
Amount of electricity needed to
establish a constant balance
between electricity fed into a power
grid and taken out of it for use.
Basic electricity requirement. Avail-
able regardless of all load fluctua-
tions. Base load power is primarily
provided by nuclear power plants,
lignite power stations and—to a less-
er extent—run-of-river power plants.
Continuous process of comparing
processes, products, services and
practices with those of the strongest
competitors or companies regarded
as leaders in their industries.
Key figure for assessing an enter-
prise’s financial position and prof-
itability when analyzing the compa-
ny, its balance sheet and its stock.
Sale of different products and ser-
vices to a single customer. Cross-
selling occurs, for example, if gas
is additionally sold to a customer
who previously only purchased elec-
tricity.
Denotes the chain of activities com-
prising the supply of crude oil to
refineries, the processing of the
crude oil to obtain petroleum and
petrochemical products, and sales of
such products.
Acronym for “Earnings Before Inter-
est, Taxes, Depreciation and Amorti-
zation.” EBITDA serves as an indica-
tor of the cash flow generated by a
company’s operations.
E7 initiative
Forward contract
HCU
Kilowatt
Kyoto Protocol
Group formed by the world’s nine
leading power utilities (American
Electric Power, EdF, Enel, Hydro-Que-
bec, Kansai Electric Power, Ontario
Power Generation, RWE, Scottish
Power and Tokyo Electric Power).
The initiative has been participating
in collaborative endeavors and pro-
jects regarding sustainable develop-
ment since 1992. Work done by the
E7 initiative aims to promote the
efficient generation and use of elec-
tric power throughout the world.
Contract between parties for the
future purchase/sale of a commodity
whose price is agreed in advance.
Forward contracts are usually negoti-
ated by contracting parties individu-
ally and are not quoted publicly on
the stock exchange like futures.
Acronym for hard coal unit. Refer-
ence value for the assessment of the
energy content of various energy
carriers. One kilogram HCU corre-
sponds to 29,308 kilojoules. In
2002, on average, 1 kilogram of raw
lignite from the Rhineland mining
region equaled 0.34 kilograms HCU.
Unit of measurement of electric
output. Conversion of other output
units: 1 megawatt = 103 kilowatts,
1 gigawatt = 106 kilowatts,
1 terawatt = 109 kilowatts.
Agreement established in 1997 pur-
suant to international law. Sets forth
the major principles of international
climate regulations. Signatory indus-
trial nations commit to lowering
their greenhouse gas emissions. A
set of tools dubbed “Kyoto mecha-
nisms” affords participating coun-
tries increased flexibility. Kyoto
mechanisms envisage countries
and—depending on the nature of
the national agreement—companies
taking their own initiative to imple-
ment projects in other countries if
this provides a more affordable way
of avoiding greenhouse gas emis-
sions than taking measures in one’s
home country.
167
Glossary
Multi-utility
NETA
Offshore
Other
comprehensive
income
Peak load
Performance
Projected Unit-
Credit Method
Prototype Carbon
Fund
Designation for companies offering
a variety of utility services from a
single source. In the context of its
multi-utility strategy, RWE focuses
on energy and the environment.
Its core activities are electricity,
gas, water and wastewater, waste
disposal and recycling as well as
associated energy-related services.
New Electricity Trading Arrange-
ments. New Framework covering the
trading of electricity in England and
Wales introduced in March 2001.
Production of petroleum and natural
gas off coastal lines and in large
inland waters.
Other comprehensive income covers
changes in equity resulting from the
fair valuation of financial instru-
ments available for sale and deriva-
tives in cash flow hedges. This item
also subsumes the differences in cur-
rency translation that do not affect
income.
During peak consumption periods
on the power grid, storage power
stations, pumped storage power
plants and gas turbine power sta-
tions are used to compensate for the
spikes.
Development of a financial invest-
ment within a defined period.
Provisions for pensions and similar
obligations are calculated using the
Projected Unit-Credit Method (IAS
19). It pays due regard not only to
pensions and vested benefits
accrued as of the cut-off date, but
also to anticipated increases in
salaries and wages.
Resources contained in this fund are
used first and foremost to increase
the use of renewables-based ener-
gies, especially in developing and
emerging countries.
Rating
Standing interpre-
tations Committee
(SIC)
Technical Guideline
for Residential
Waste (TASi)
Upstream
Volatility
Standardized assessment of the risk
exposure and creditworthiness of
issuers of securities and the securi-
ties themselves. Ratings are per-
formed by specialists, which are
generally recognized agencies.
The SIC rules on controversial
accounting issues. Its interpreta-
tions are approved by the board
of the International Accounting
Standards Committee (IASC) and,
once adopted, are binding on all
IAS users.
Legal directive in Germany that
defines technical standards for the
dumping of residential waste. On
expiry of the transitional deadlines,
starting in 2005, only waste that has
been pretreated using thermal or
mechanical-biological processes may
be dumped in landfills.
In the petroleum industry, this term
encompasses the exploration and
production of crude oil and natural
gas.
Bandwidth of market prices and
their movement within this band-
width.
116ff
114, 153
23, 45, 54, 93
27, Financial calendar
5, 11, 15f, 26
10, 155
105
43f
49, 139
154
28f, 141f
20ff, 38ff
48f, 56, 77, 86, 92,
96, 101
42ff, 105ff, 110
132, 151
42f, 106, 110, 151
42
106
33, 51, 63, 70
115
8ff, 12ff
48, 54, 101
104, 109, 121
115f
105
43, 115
105, 119, 143
44, 119, 125,
132f, 153
104, 106, 122, 129,
148, 150
117
121
5, 11, 24, 26f, 53,
135, 143
135
35f, 39, 46f, 99ff
41f, 104, 112, 143
37
35ff, 75, 85, 91, 96, 99ff
164
71f
40, 44, 105, 133ff
A
Accounting policies
Acquisition cost
American Water
Analysts’ conference
Annual General Meeting
Auditors’ report
B
Balance sheet
Balance sheet structure
Biblis
Board remuneration
Bonds
C
Capital costs
Capital expenditure
Cash and cash equivalents
Cash flow
Cash flow statement
_abridged
_complete
Combined heat and power
generation (CHP)
Consolidation principles
Corporate governance
Cost-cutting program
Cost of materials
Currency translation
Current assets
D
Deconsolidations
Deferred income
Deferred taxes
Depreciation and amortization
_useful life
_nuclear fuel assemblies
Dividend
Dividend proposal
Downstream
E
Earnings per share
EBIT
EBITDA
Economic Advisory Board
Electricity wholesale prices
Equity
113ff, 117, 123, 128,
158
163
127, 144, 153,
151
119, 131, 144, 153,
114, 147
,34f, 73f,
42f
116f, 122, 127, 159
115
41f, 104, 112
41f, 56, 93, 104,
112, 126
41f, 104, 112, 124i
41f, 104, 150
112, 123, 150
104
21f, 28, 34, 44, 48,
73, 77f, 84
105, 106, 110, 116,
128, 148, 153
44, 105, 118, 130,
153, 159
156ff
26ff
143, 146
44, 105, 119, 141ff
125f, 132, 153,
27
38, 75
29, 57
41f, 55f
43, 44, 105, 127
Equity method
Executive Board
F
Fair values
Financial assets
Financial instruments
_non-derivative, derivative
Financial investments
First-time consolidations
Free cash flow
G
Goodwill
_measurement method
I
Income
_after tax
_before tax
_Financial result
_Non-operating result
Income from investments
Income statement
Innogy
Intangible assets
Inventories
Investments (material)
Investor Relations
L
Leases
Liabilities
Loss carryforwards
M
Market capitalization
Mülheim-Kärlich
N
Net debt
Net income
Non-current assets
168
Index
Index

169
Index
37ff, 75, 85, 91, 100
54, 79, 87, 93, 97, 101
118, 120, 130, 153
47, 57
118,
116f, 127, 159,
106, 118,
120ff, 126ff, 153
140
139
140
118, 132, 136f, 153
7, 28f, 43, 57
138
33, 52, 70
49f, 101, 122, 127
50ff
38ff, 159
128
34ff, 74, 84, 90, 96, 100
113f
43, 105, 106, 118,
124, 127, 128,
131f, 151
120, 147f
24f
143
133
24ff
59, 133f
104, 118, 121
107
45, 48, 77f, 114
107
160
8ff, 162
O
Operating result
Outlook (cf. individual business
areas)
P
Percentage-of-Completion Method
Procurement
Production cost
Property, plant and equipment
Provisions
_for mining damage
_for nuclear waste management
_other
Provisions for pensions
R
Rating
Reconciliation of provisions
Renewable Energy Act
Research and development
Risk management
ROCE
Roll-forward of non-current assets
S
Sales
Scope of consolidation
Securities
Segment reporting
Shares
_price
_number
_own
_performance
_Stock option plan
Staff costs
Statement of changes in equity and
minority interest
STOEN
Subscribed capital
Supervisory Board
_Boards
104, 112, 125,
105, 32f, 153,
119, 125f,
22f, 45, 47, 54, 65,
90ff,
20ff, 44f, 82ff,
38ff, 55, 159,
44, 49, 58ff
T
Taxes on income
_deferred taxes
_tax rate
Thames Water
Transgas
V
Value management
W
Workforce
170
Imprint
RWE
Aktiengesellschaft
Phone
Fax
Investor Relations:
Phone
Fax
Corporate
Communications:
Phone
Fax
Phone
Phone
Phone
Design
Photographs
Production
management
Lithography
Printing
Opernplatz 1
45128 Essen
Germany
+49-201-1200
+49-201-12151-99
+49-201-121-5025
+49-201-121-5265
+49-201-121-5250
+49-201-121-5094
For annual reports, interim reports
and other information on RWE,
please visit us on the Web at
www.rwe.com
or call our shareholder hotline:
(01801) 304-070 (callers in Germany)
+49-1801-304-070 (callers outside
Germany, excluding the USA)
011-49-1801-304-070 (from the USA)
This is a translation of the German
annual report. In case of diver-
gence from the German version, the
German version shall prevail.
Hesse Design, Erkrath
Matthias Heitmann, Hamburg
NETWØRK GmbH, Hamburg
ADDON, Düsseldorf
Heining & Müller GmbH,
Mülheim a.d. Ruhr
Printed on
Heidelberg Speedmaster stock.
Printed on paper made of
chlorine-free bleached pulp.
Imprint

1 Truncated fiscal year(July to December).
2 No comparison with prior-year figures due to comprehen-sive changes to the Group’s structure and the adjustment to the value manage-ment concept.
3 Cash flows from operating activities minus capital expen-diture on property,plant and equip-ment/intangible assets.
4 Full time equivalent from fiscal 2000/01 onwards.
5 Including bonus.
6 Data only available since December 31, 2000.
External net sales
Income
EBITDA
Operating income
Income before tax
Net income (RWE's share of net income)
Net income excl. goodwill amortization
Earnings per share incl. goodwill amortization
Earnings per share excl. goodwill amortization
Return on equity
Return on sales
Value management
Return on capital employed (ROCE)
Value added
Capital employed
Cash flow/capital expenditure/depreciation
and amortization
Cash flows from operating activities
Free cash flow3
Capital expenditure incl. acquisitions
Depreciation, amortization and asset disposals
_Goodwill amortization
Free cash flow per share
Workforce
Workforce at end of fiscal year4
Asset/capital structure
Non-current assets
Current assets
Deferred tax assets
Balance sheet equity
Long-term provisions
Other long-term debt
Short-term provisions and debt
Deferred tax liabilities
Balance sheet total
Net financial debt/assets
Capital-to-assets ratio
RWE Aktiengesellschaft
Dividends
Dividends
Dividend per share
Market capitalization/rating
Market capitalization at end of fiscal year
Long-term credit rating6
_Moody´s
_(outlook)
_Standard & Poor´s
_(outlook)
47,918
4,708
2,804
2,151
1,212
1,419
2.24
2.62
15.9
5.7
—2
—2
—2
3,241
414
4,923
4,707
207
0.76
152,132
34,493
23,615
6,881
9,557
29,371
3,235
19,868
2,958
64,989
15,097
14.7
523
1.00
18.1
62,878
6,575
3,953
2,238
1,264
1,638
2.24
2.90
17.3
6.1
11.5
770
37,757
3,814
296
13,408
6,664
374
0.52
162,347
54,589
24,781
8,056
10,843
32,643
12,622
26,189
5,129
87,426
135
12.4
563
1.00
26.3
Aa3
AA-
33,301
3,637
2,029
1,143
621
859
1.10
1.53
7.3
6.4
11.1
307
37,860
1,021
- 1,274
3,706
3,144
238
- 2.27
155,634
49,182
33,868
8,399
11,129
33,227
14,567
26,320
6,206
91,449
- 1,126
12.2
562
1.00
23.6
Aa3
(negative)
AA-
(negative)
46,633
7,241
4,504
2,722
1,050
1,830
1.87
3.25
13.5
10.7
10.4
395
44,293
5,933
1,838
16,985
6,655
780
3.27
131,765
61,577
31,103
7,593
8,924
32,637
25,181
26,965
6,566
100,273
- 15,494
8.9
619
1.105
13.7
A1
(negative)
A+
38,415
5,982
3,190
2,722
1,149
1,284
2.07
2.31
15.2
8.7
—2
—2
—2
4,782
2,118
5,244
3,202
135
3.81
154,223
29,110
20,292
5,830
10,024
27,053
3,761
11,649
2,745
55,232
13,336
18.1
555
1.00
24.0
Five-year overview
1999/
2000
1998/
1999
2001
TFY1
2002
€ million
€ million
€ million
€ million
€ million
€ million
€
€
%
%
%
€ million
€ million
€ million
€ million
€ million
€ million
€ million
€
€ million
€ million
€ million
€ million
€ million
€ million
€ million
€ million
€ million
€ million
%
€ million
€
€ billion
RWE Group 2000/
2001
RWE_GB_EN_US_Einzelseiten.qxd 14.03.2003 19:32 Uhr Seite 7
Internet links
Design legend
www.rwe.com/en/investor_
relation/shares/corporate_
governance
www.rwe.com/en/investor_
relation
www.rwe.com/en/investor_
relation/bonds
www.rwe.com/en/investor_
relation/annualreports
01
02
03
04
www.rwe.com/en/press/
mediacenter
www.rwe.com/en/one_
group/environmental_policy
05
06
Total
Emphasized total
Emphasis
Cross reference
Internet link
122
01
Back cover left:
»Dialogue is a key component
to success. Especially at the
international level.«
Anja Lorenz, Tax Manager,
RWE AG, Essen
Back cover right:
»RWE’s future lies in
harnessing its diverse skills
and cultures to achieve clear
strategic goals.«
Alan Robinson, Director
of Strategy and Planning,
Innogy, Swindon
RWE_GB_EN_US_Einzelseiten.qxd 14.03.2003 19:32 Uhr Seite 8

Financial Calender 2003_2004
5
Five-year overview
Preliminary report on fiscal 2003
Annual report for fiscal 2003
_Balance sheet press conference
_Analyst conference
Annual General Meeting
Interim report for the first
quarter of 2004
Interim report for the first half
of 2004
_Mid-year press conference
_Analyst conference
Interim report for the first three
quarters of 2004
Annual report for fiscal 2002
_Balance sheet press conference
_Analyst conference
Interim report for the first
quarter of 2003
Annual General Meeting
Interim report for the first half
of 2003
_Mid-year press conference
_Analyst conference
Interim report for the first three
quarters of 2003
03/17/2003 01/06/2004
02/26/2004
04/15/2004
05/11/2004
08/10/2004
11/09/2004
05/14/2003
05/15/2003
08/12/2003
11/13/2003
RWE_GB_EN_US_Einzelseiten.qxd 14.03.2003 19:31 Uhr Seite 1
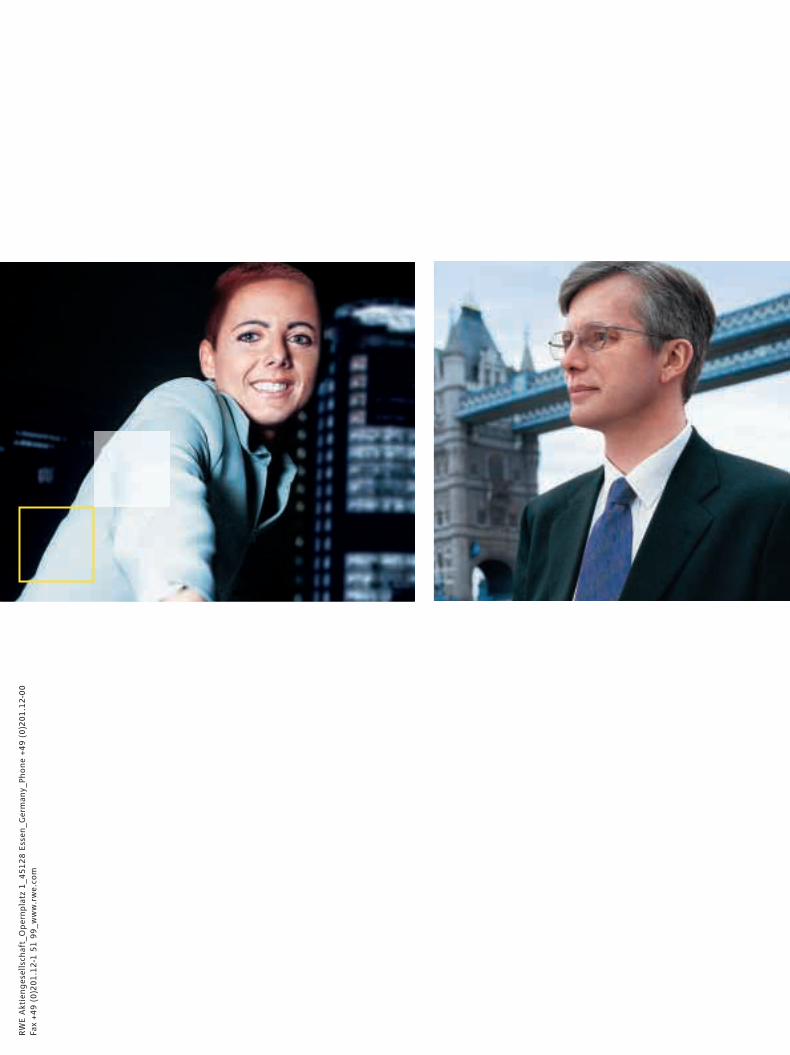
RW
E A
ktie
ng
esel
lsch
aft_
Op
ern
pla
tz 1
_45
12
8 E
ssen
_Ger
man
y_Ph
on
e +4
9 (
0)2
01
.12
-00
Fax
+49
(0
)20
1.1
2-1
51
99
_ww
w.r
we.
com
RWE_GB_EN_US_Einzelseiten.qxd 14.03.2003 19:32 Uhr Seite 2