A little about me…and my institution…
Fields of interest: • active tectonics• identification and characterization of seismogenic faults • geology of earthquake• tectonic geomorphology• paleoseismology• post-earthquake geological surveys• …and LiDAR!!!
I am a geologist, currently working as a Post-Doc at Istituto Nazionale di
Geofisica e Vulcanologia (INGV), within the Active Tectonics and Paleoseismology
group (Leaded by Daniela Pantosti).

INGV – Istituto Nazionale di Geofisica e Vulcanologia
The National Institute for Geophysics and Volcanology is a scientific institution ofthe Italian Government, dealing with research in Geophysics and Volcanology andwith responsibilities within the Italian Civil Protection system.
INGV employs around 1000 people in Rome and in regional offices in Milano,Bologna, Pisa, Napoli, Catania and Palermo.
Besides research, the mission of INGV is 24-hour countrywide seismic and volcanicmonitoring as well as the development of geophysical observations in solid andfluid Earth.
Other activities:
• Post-earthquake geological surveys
• Early warning and forecast
• Education and Outreach
Founding:
• Italian Ministry of Education, University and Research
• Italian Civil Protection
• Europe Union research projects

Post-earthquake
geological surveys
INGV geological survey team,usually after M> 5.5 earthquakes
2009 L’Aquila earthquake
2012 Emilia seismic sequence 2012 Emilia seismic sequence
Post-earthquake
geological surveys
WebGIS
Did You see earthquake geological effects?

Ongoing projects
• A) High-resolution investigations for the estimate of seismic hazard and risk in the area struck by the April 6, 2009 L'Aquila earthquake (Central Italy)
• B) Detailed geomorphological analysis of the 2012 Emilia earthquakes epicentral area and liquefactions
A
B

Simplified seismotectonic
framework
Weber et al., 2010

Simplified
seismotectonic
framework

Morphotectonic analysis of the long-term surface expression of the Paganica – San Demetrio Fault System (2009 L’Aquila earthquake, Central Italy)
RICCARDO CIVICO (*), STEFANO PUCCI (*), DANIELA PANTOSTI (*) & PAOLO MARCO DE MARTINI (*)* Istituto Nazionale di Geofisica e Vulcanologia

The 2009 L’Aquila seismic sequence,
historical seismicity and active faults
On April 6, 2009 (01:32 UTC – 03:32 Italian time), a Mw 6.1 earthquake struck a densely populated area in the Abruzzi Apennines and was felt in a wide area of central Italy
Seismological and geodetic data depict a 12 to 18 km-long, NW-SE oriented, SW-dipping causative fault at depth, located to the east of the Middle Aterno valley
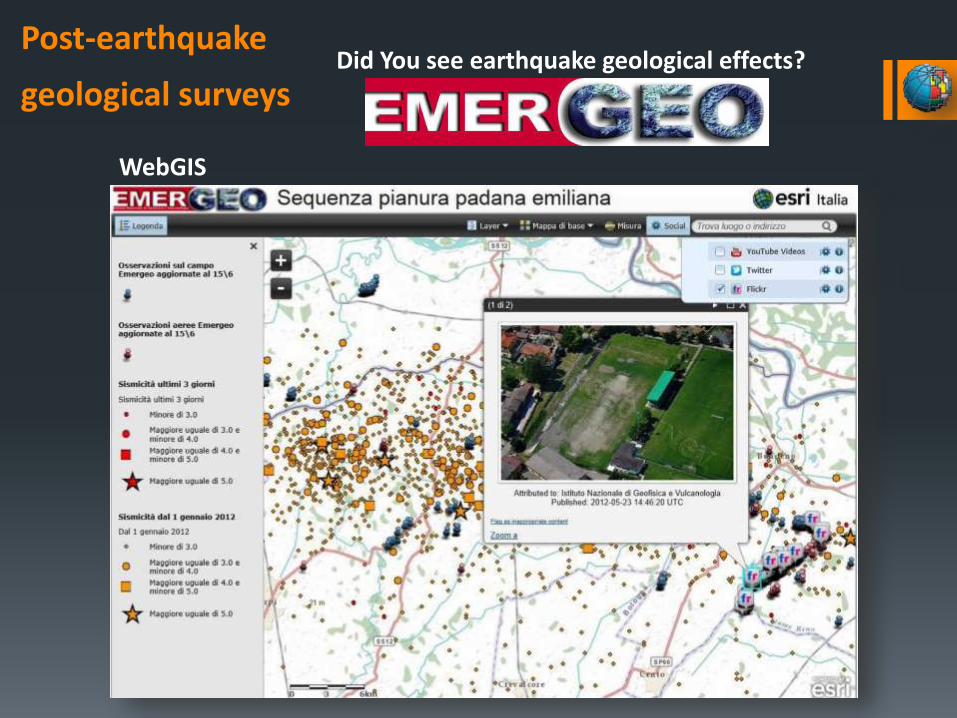
Distribution of the 2009 coseismic surface ruptures along the eastern side of the Middle Aterno valley
Coseismic surface ruptures occurred along prominent pre-existing fault scarps and along secondary fault splays located in the eastern sector of the Middle Aterno Valley
Continuous surfacefaulting (∼3 km-longwith maximum throw of 0.15m) wasobserved along the NW-SE trending, SW-dipping Paganica fault
Coseismic ruptures

Main characteristics of the surface ruptures
Photos by EMERGEO WG, 2009
• mostly open cracks (av. 10 cm)• slight vertical dislocations or warps (max 15 cm) SW-side down• persistent orientation of N130°-N140°• commonly organized in en-echelon arrangement• occur regardless of slope angle, the type of deposits crossed, or the type of manmade feature
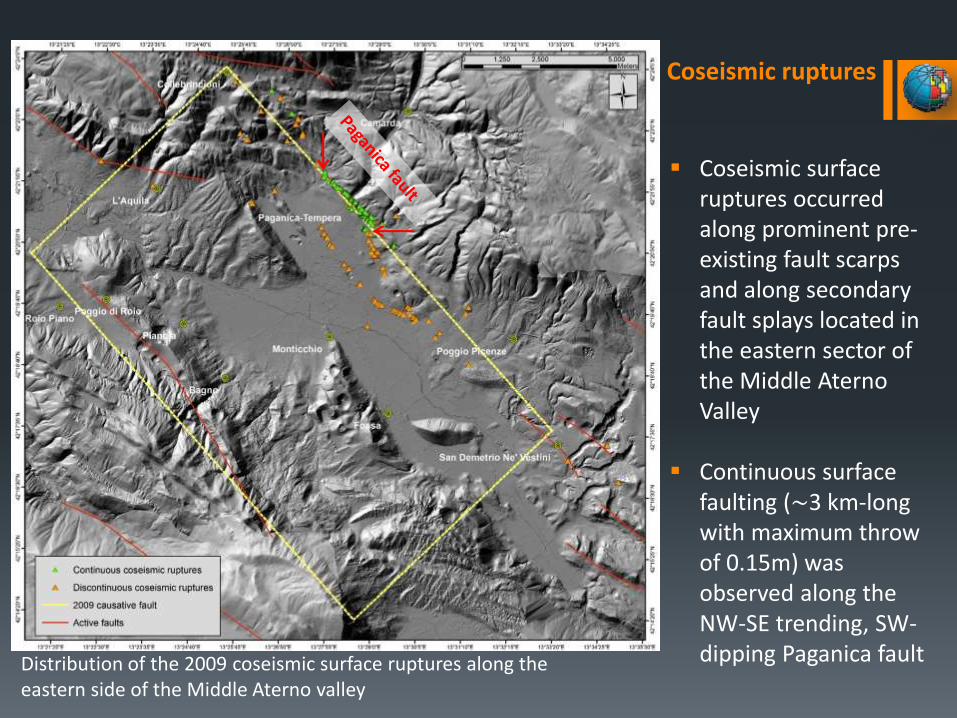
Slip distribution
Slip distribution after Cirella et al., 2009

Different interpretation of the coseismic
discountinuous ruptures
Gori et al., 2012
Galli et al., 2012
Boncio et al., 2010Falcucci et al., 2009
Vittori et al., 2011Emergeo WG, 2010
Estimated surface faulting total length between 3 and 19 km
The extent of the long-term morphological expression of the earthquake causative fault and of the modeled seismologic/geodetic coseismic fault contrasts with the observed primary coseismic surface ruptures, both in terms of size and location
This discrepancy has open a debate about the maximum length of rupture within this fault system
Is the 2009 earthquake a typical event for this fault system?
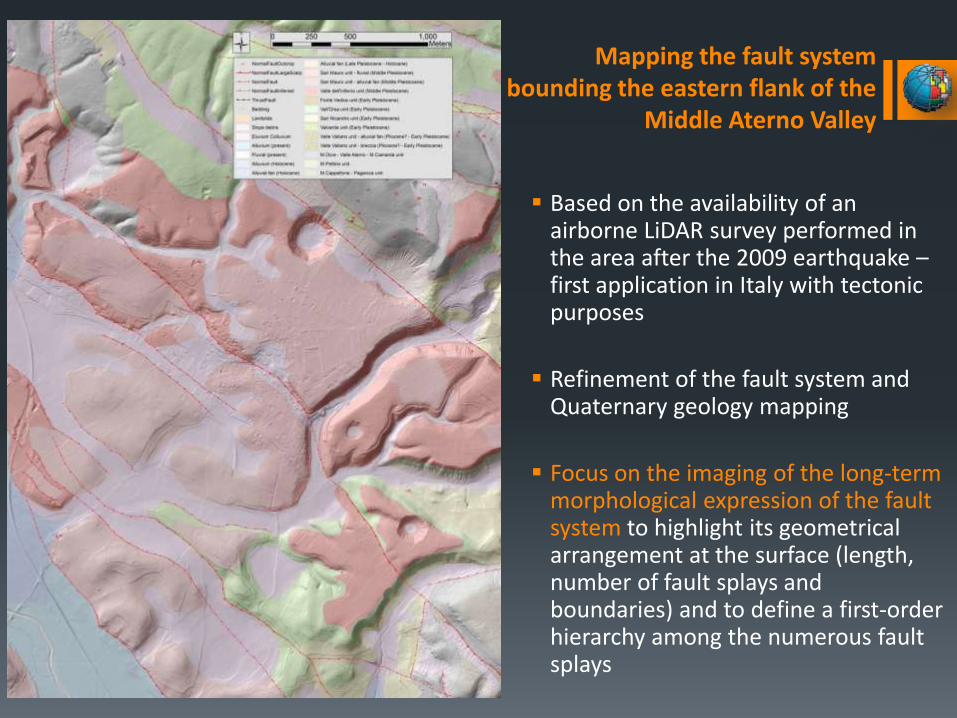
Based on the availability of an airborne LiDAR survey performed in the area after the 2009 earthquake –first application in Italy with tectonic purposes
Refinement of the fault system and Quaternary geology mapping
Focus on the imaging of the long-term morphological expression of the fault system to highlight its geometrical arrangement at the surface (length, number of fault splays and boundaries) and to define a first-order hierarchy among the numerous fault splays
Mapping the fault system bounding the eastern flank of the
Middle Aterno Valley

Geometrical arrangement of the Paganica - San Demetrio fault system at the surface
At the LiDAR resolution, it is noticeable a complex surface structural setting, with several normal parallel fault splays both synthetic and antithetic.We can distinguish two main sectors of the fault system:
Paganica sector: narrow deformation zone (≤2 km wide) small Quaternary basin
San Demetrio sector: several tectonic structures, wider fault system (ca. 5
km) exhumation and dissection of a larger Quaternary basin
Paganica sector
San Demetrio sector

Along strike morphological throw
Cumulated fault throws have been measured by vertical offsets of topographic surfaces across individual fault splays as well as across the entire fault system
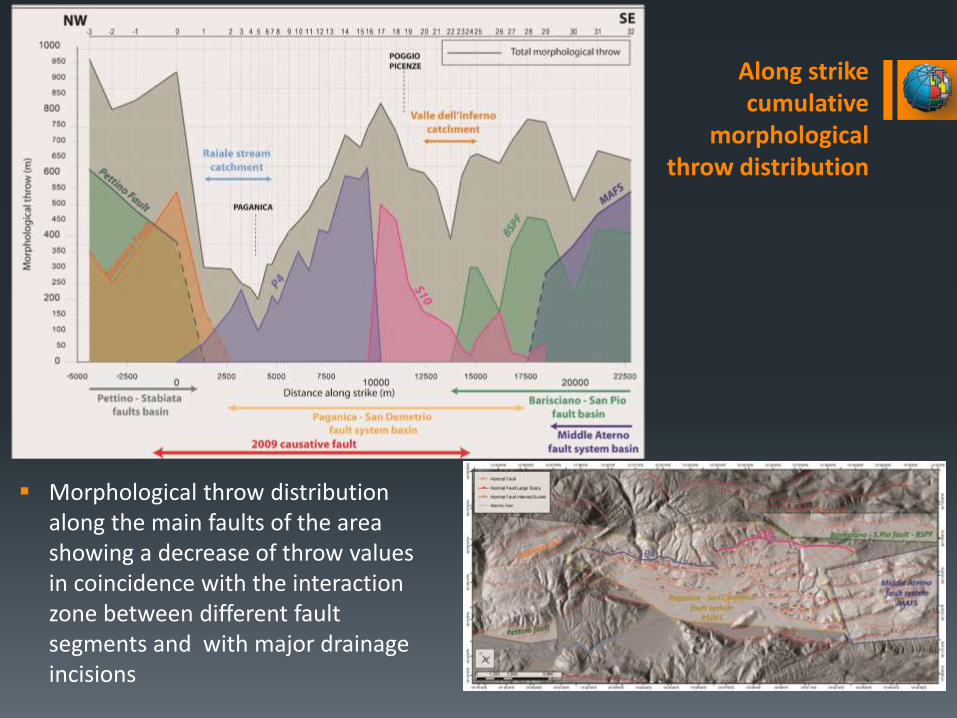
Along strike cumulative
morphological throw distribution
Morphological throw distribution along the main faults of the area showing a decrease of throw values in coincidence with the interaction zone between different fault segments and with major drainage incisions

Along-strike plot of the
morphological throws
Persistence of the deformation across a narrow fault zone (Paganica), allowing the development of a small Quaternary basin
Distributed deformation (San Demetrio), resulting in the development of a widerQuaternary basin
Different amount of deformation related to the fault spalys displacing Quaternary deposits:
Paganica sector
San Demetrio
sector

Fault splays hierarchy
Among the fault splays affecting mainly the Quaternary deposits, the main contributors are fault splays P3 and S6
Aligned in map view
The subtle fault-related geomorphic expression in the central portion can be explained by the presence of a Late Pleistocene (ca. 27k yrs) alluvial fan
The linkage of P3 and S6 seems to represents the most active surface trace of the PSDFS during the Quaternary

We imaged the long-term morphological expression of the Paganica-San Demetrio fault system: complex geometrical arrangement at the surface, with several normal parallel fault
splays both synthetic and antithetic; two main sectors: a) Paganica sector with a narrow deformation zone and a small
Quaternary basin and b) San Demetrio sector, characterized by a wider fault system and by the exhumation and dissection of the Quaternary basin;
Conclusions 1
Paganica sector
San Demetrio sector

We identified the relative contribution of individual fault splays to the overall deformation across the system:
most of the deformation of the PSDFS is accommodated by the two easternmost basin-bounding fault-splays (P4 and S10), affecting mainly the bedrock;
the linkage of fault splays P3 and S6 seems to represents the most active surface trace of the PSDFS during the Quaternary.
Conclusions 2

We defined the length of the PSDFS:
The morphological throw graph approximates a symmetric bell-shaped curve, suggesting the existence of an isolated extensional fault;
The tips of the curve represent the fault boundaries, resulting in a 19 km-long structure, in good agreement with the up to 18 km-long 2009 seismogenic fault;
The extent of the long-term morphological expression of the PSDFS, when compared with the 3 km-long 2009 continuous coseismic ruptures, suggests that larger magnitude earthquakes with respect to the 2009 event are needed to built-up the present morphology;
By using the PSDFS length, we estimated (W&C) a maximum expectedmagnitude ≥ 6.3
Conclusions 3

What’s next…
Geology compare geological and morphological throws; obtain slip-rate estimates;
Subsurface geophysics include subsurface data in the estimation of cumulative throws;

Contribution to the assessment of surface faulting hazard
RICCARDO CIVICO (*), DANIELA PANTOSTI (*), STEFANO PUCCI (*) & PAOLO MARCO DE MARTINI (*)* Istituto Nazionale di Geofisica e Vulcanologia

In Italy the assessment of surface faulting hazard is often a difficult task because of: a) lack of detailed map of active faults at a national level; b) the frequent complex geometrical pattern of active tectonic structures related to inherited structural and deformational style.
DISS Working Group, 2010 ITHACA - (ITaly HAzard from CApable faults)
Surface faulting hazard

The occurrence of the 2009 L’ Aquila earthquake strongly highlighted how critical is adeep knowledge of the location and characterization of the active faults and also oftheir secondary splays to prevent damage directly related to surface faulting.
During the Mw 6.1 April 6, 2009 L’Aquila earthquake, coseismic surface ruptures occurred along several fault splays.
Surfacefaulting:2009 L’Aquila earthquake
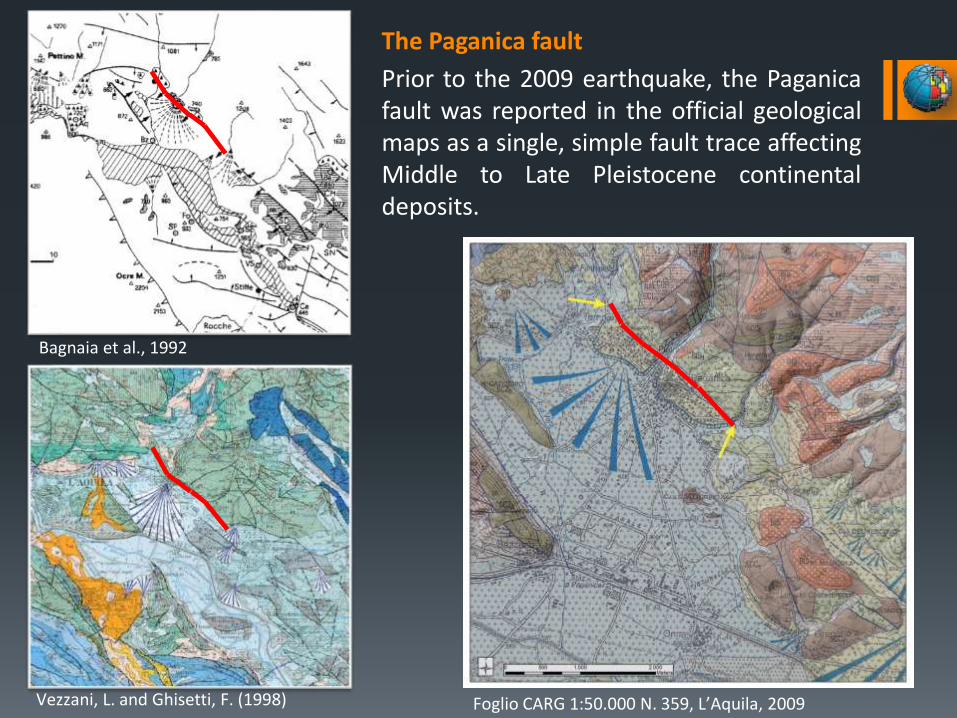
Prior to the 2009 earthquake, the Paganicafault was reported in the official geologicalmaps as a single, simple fault trace affectingMiddle to Late Pleistocene continentaldeposits.
Foglio CARG 1:50.000 N. 359, L’Aquila, 2009
The Paganica fault
Vezzani, L. and Ghisetti, F. (1998)
Bagnaia et al., 1992

Damaged water pipeline - Paganica

The complexity of the 2009 coseismic surface breaks highlighted the need for a substantial refinement of the Paganica fault mapping, including minor and hidden active fault traces.
Refinement of the Paganica fault mapping

LiDAR-derived shaded relief showing the surface structural setting of the Paganica- San Demetrio fault
Surface structural setting of the Paganica – San Demetrio fault
At the LiDAR resolution, the surface structural setting of the Paganica –San DEmetrio fault appears to be much more complex than expected from the official geological map but also from previous works.
Presence of several normal parallel fault splays both synthetic and antithetic.

Urban areas as well as important infrastructures, facilities and lifelines are developed in the area hit by the April 6 2009 earthquake
Infrastructures
Water pipeline
Power line
Railways
Main roads
Roads
Urban centers
Industrial centers
Hihgway

LiDAR data analysis contributed to a better imaging of the location of the active fault splays
More than 80 points of intersection of fault lines with urban centers and main infrastructures (roads, railways, pipelines, etc.)
Infrastructures
Water pipeline
Power line
Railways
Main roads
Roads
Urban centers
Industrial centers
Hihgway
Water pipeline
Power line
Railways
Main roads
Roads
Urban centers
Industrial centers
Fault traces
Hihgway
Water pipeline
Power line
Railways
Main roads
Roads
Urban centers
Industrial centers
Fault traces
Hihgway
Intersection points
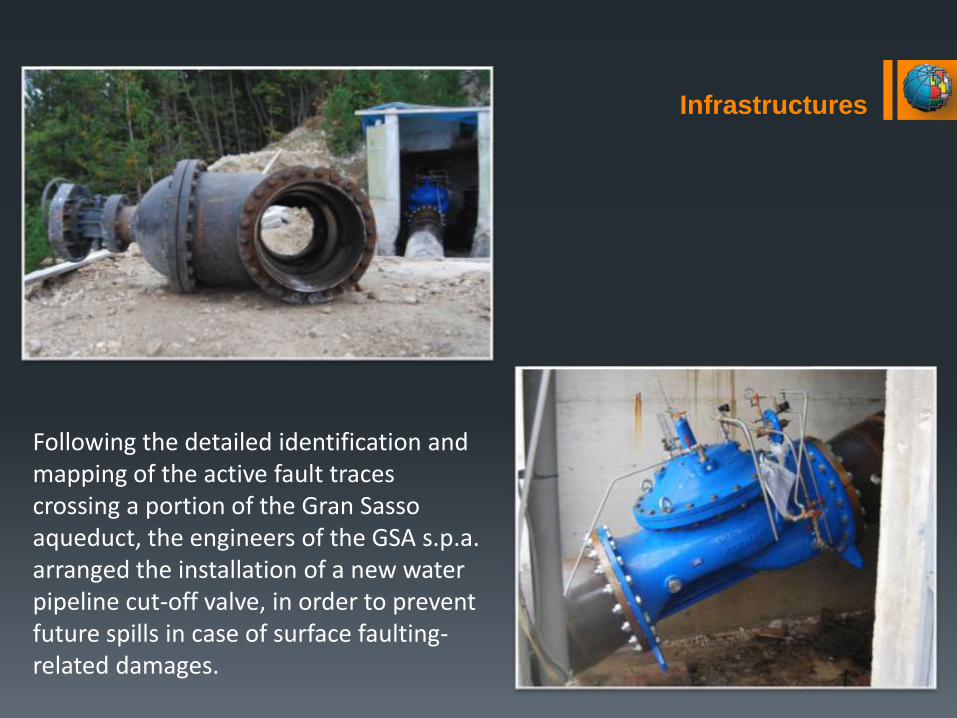
Following the detailed identification and mapping of the active fault traces crossing a portion of the Gran Sassoaqueduct, the engineers of the GSA s.p.a. arranged the installation of a new water pipeline cut-off valve, in order to prevent future spills in case of surface faulting-related damages.
Infrastructures

Detailed geomorphological analysis of the 2012 Emilia earthquakes epicentral area and liquefactions
RICCARDO CIVICO (*), CARLO ALBERTO BRUNORI (*) & PAOLO MARCO DE MARTINI (*)* Istituto Nazionale di Geofisica e Vulcanologia
The 2012 Emilia seismic sequence caused extensive liquefaction phenomena over an area of 1200 km2 in the Po Plain, following the 20 May, ML5.9 and 29 May, ML 5.8 mainshocks, both occurred on about E– W trending, S dipping blind thrust faults.
Seismic sequence in the Emilia Padania Plain since the 19th of May up to 19th ofJune 2012. In a month almost 2000 seismic events occurred, seven having Mlgreater or equal 5.0 (red stars). Blue pinpoints locate the observation recordsmade, through field and aerial survey, by the Emergeo working group.

718 (~ 52%) out of a total of 1374 coseismic observations (both from field and aerial surveys) are located in coincidence with known fluvial landforms
Levee and other fluvial ridges were preferred location for liquefaction,
hosting together ~69% of them while crevasse splays account for
~23%.
We want to perform a quantitative analysis of the spatial distribution of the 2012 coseismic observations using GIS tools and to define areas where liquefaction is more likely to occur.
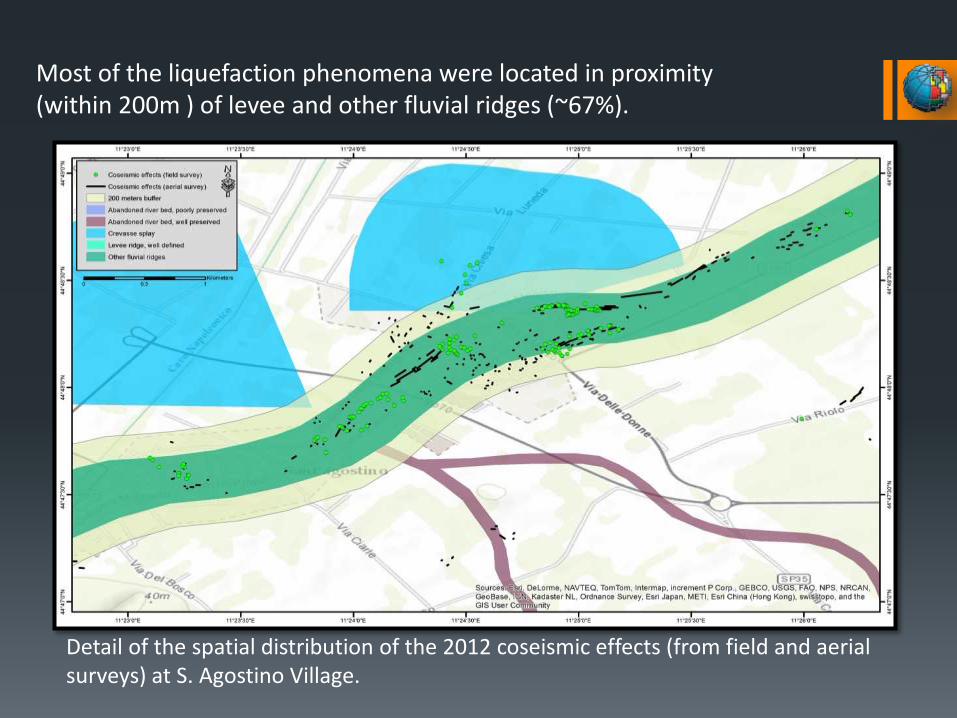
Most of the liquefaction phenomena were located in proximity(within 200m ) of levee and other fluvial ridges (~67%).
Detail of the spatial distribution of the 2012 coseismic effects (from field and aerialsurveys) at S. Agostino Village.

Future detailed high-resolution topographic analysis are needed in order to:
• refine the geomorphological mapping of this sector of the Po Plain also by identifying new subtle fluvial landforms
• quantify the minimum distance from these fluvial features needed to reduce the liquefaction hazard to a low level.
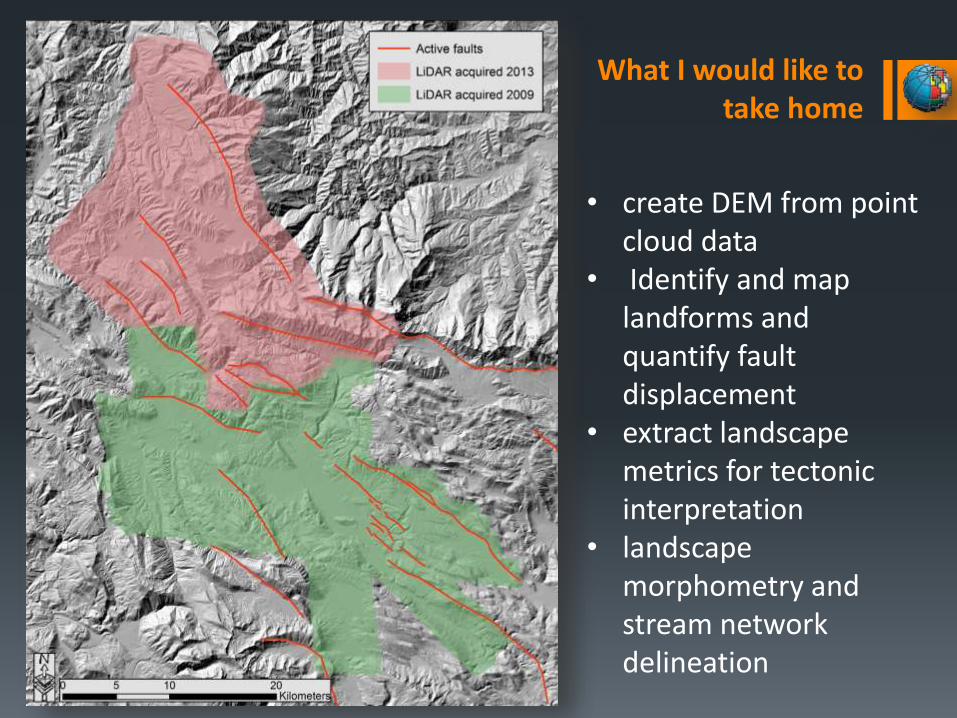
• create DEM from point cloud data
• Identify and map landforms and quantify fault displacement
• extract landscape metrics for tectonic interpretation
• landscape morphometry and stream network delineation
What I would like to take home

Thank you!
Recommended