2014 Software Global Client Conference
How to Enable a
High-Performance
Organization in the
Oil & Gas Industry
Presenters:
Omar Halaseh
Stan DeVries
2014 Software Global Client Conference
Definition: High Performance Organization
● In High Performance Organizations Strategies are important but
Execution is the key.
● In an HPO there are well defined processes that are measured and
accountable.
● In an HPO everyone understands how their actions are measured and
so how they impact the Scoreboard.
●Consequently the Operations staff are empowered to make decisions
that impact the Scoreboard.
● In an HPO the organization beats it GM targets by 3-5%
2014 Software Global Client Conference
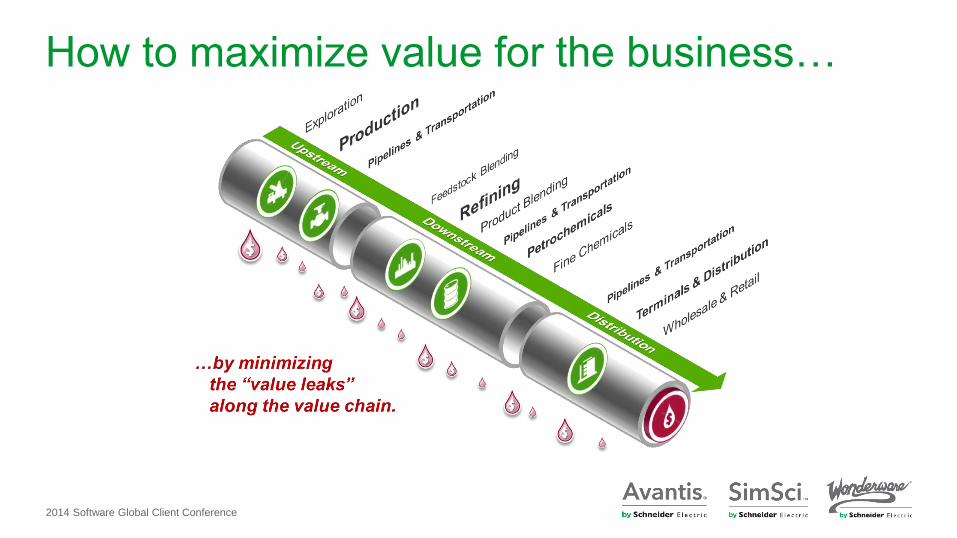
How to maximize value for the business…
2014 Software Global Client Conference
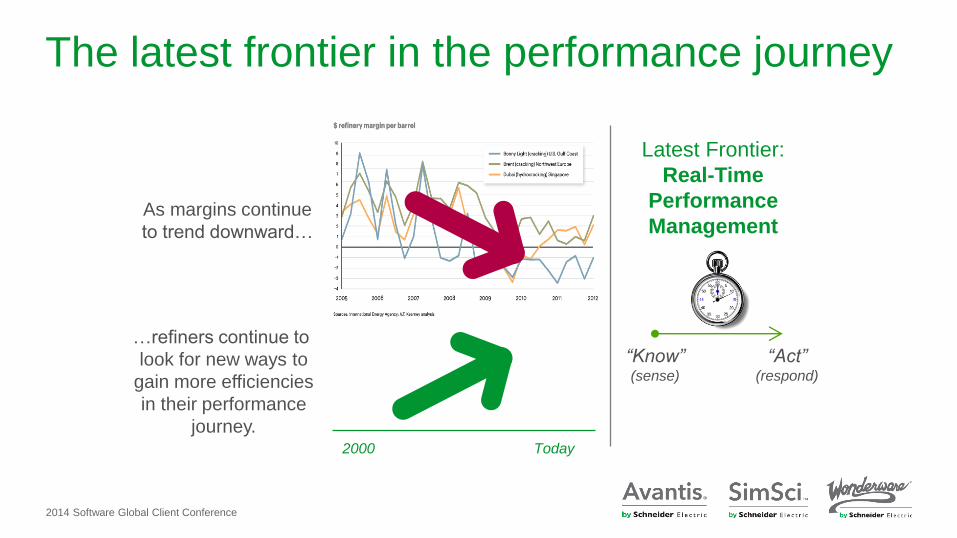
The latest frontier in the performance journey
As margins continue
to trend downward…
…refiners continue to
look for new ways to
gain more efficiencies
in their performance
journey.
Latest Frontier:
Real-Time
Performance
Management
2000 Today
“Know” (sense)
“Act” (respond)
2014 Software Global Client Conference
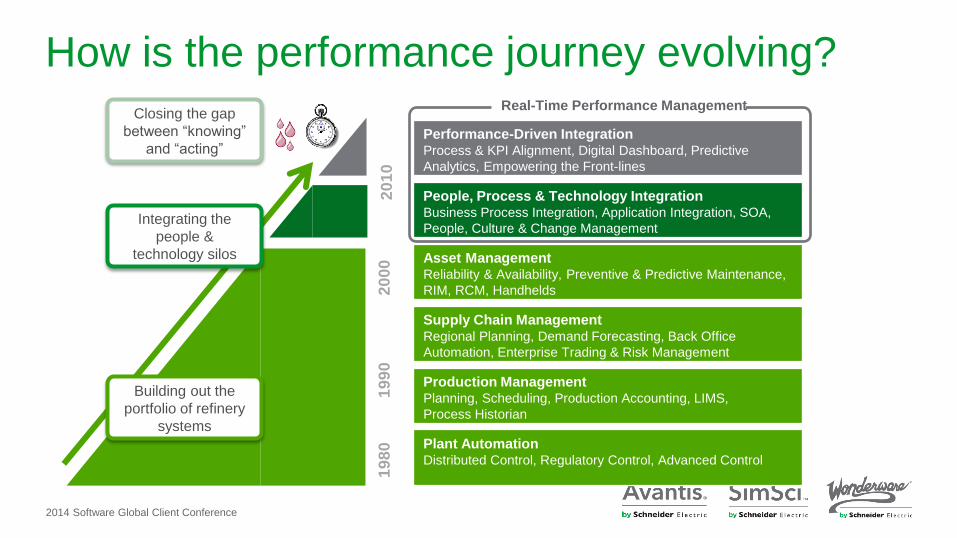
How is the performance journey evolving?
Building out the
portfolio of refinery
systems
Closing the gap
between “knowing”
and “acting”
Plant Automation Distributed Control, Regulatory Control, Advanced Control
Production Management Planning, Scheduling, Production Accounting, LIMS,
Process Historian
Supply Chain Management Regional Planning, Demand Forecasting, Back Office
Automation, Enterprise Trading & Risk Management
Asset Management Reliability & Availability, Preventive & Predictive Maintenance,
RIM, RCM, Handhelds
People, Process & Technology Integration Business Process Integration, Application Integration, SOA,
People, Culture & Change Management
Performance-Driven Integration Process & KPI Alignment, Digital Dashboard, Predictive
Analytics, Empowering the Front-lines
19
80
1
99
0
2
00
0
20
10
Integrating the
people &
technology silos
Real-Time Performance Management
2014 Software Global Client Conference
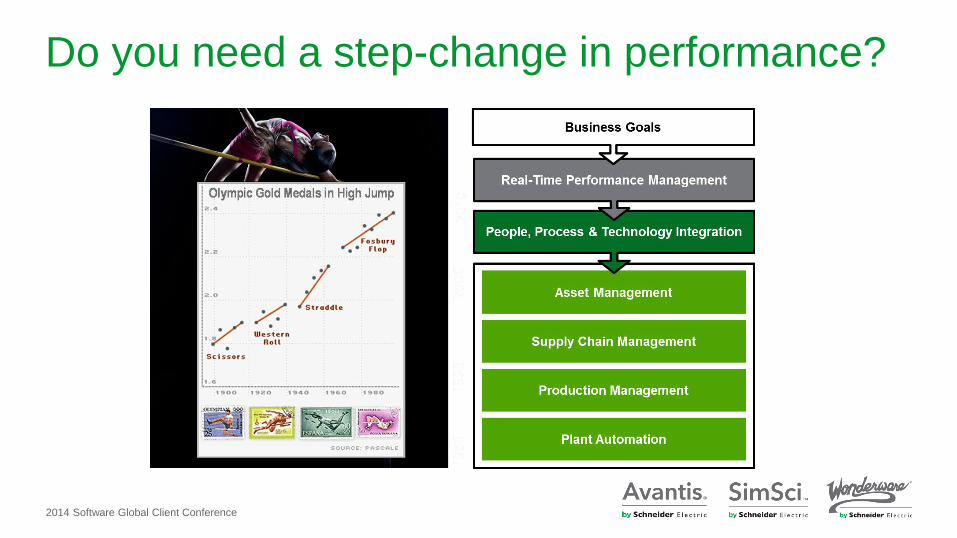
Do you need a step-change in performance?
2014 Software Global Client Conference
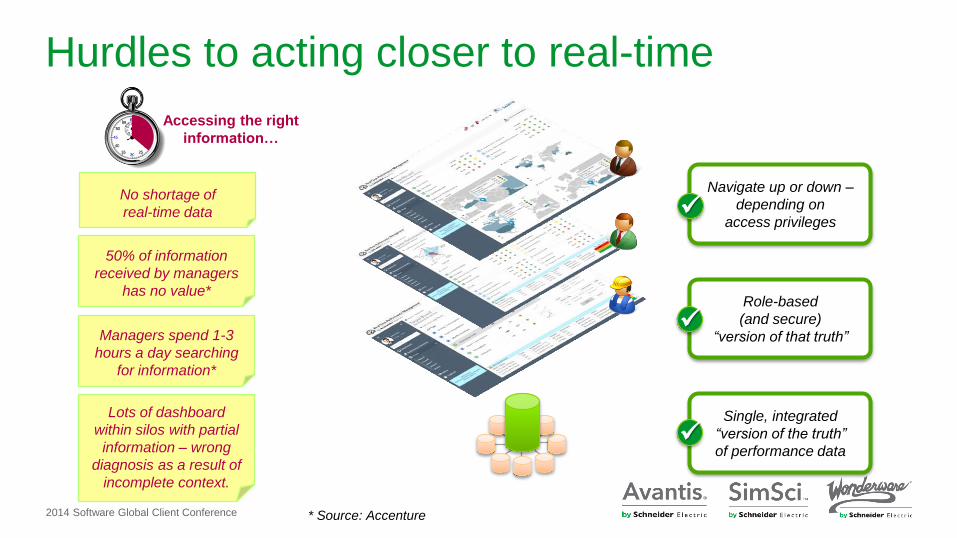
Hurdles to acting closer to real-time
* Source: Accenture
Navigate up or down –
depending on
access privileges
Single, integrated
“version of the truth”
of performance data
Role-based
(and secure)
“version of that truth”
50% of information
received by managers
has no value*
Accessing the right
information…
Managers spend 1-3
hours a day searching
for information*
Lots of dashboard
within silos with partial
information – wrong
diagnosis as a result of
incomplete context.
No shortage of
real-time data
2014 Software Global Client Conference
Empowering
the frontlines
to take action
Structured &
linked measures
via leading
& lagging KPIs
“Single version
of the truth” via
role-based
dashboards
Culture of
accountability
• Right Domain
Expertise
• Right Metrics
• Right Behavior
• Right Data Sources
• Right User
• Right Context
• Right Diagnosis
• Right Decision
• Right Action
• Right Accountability
• Right Time
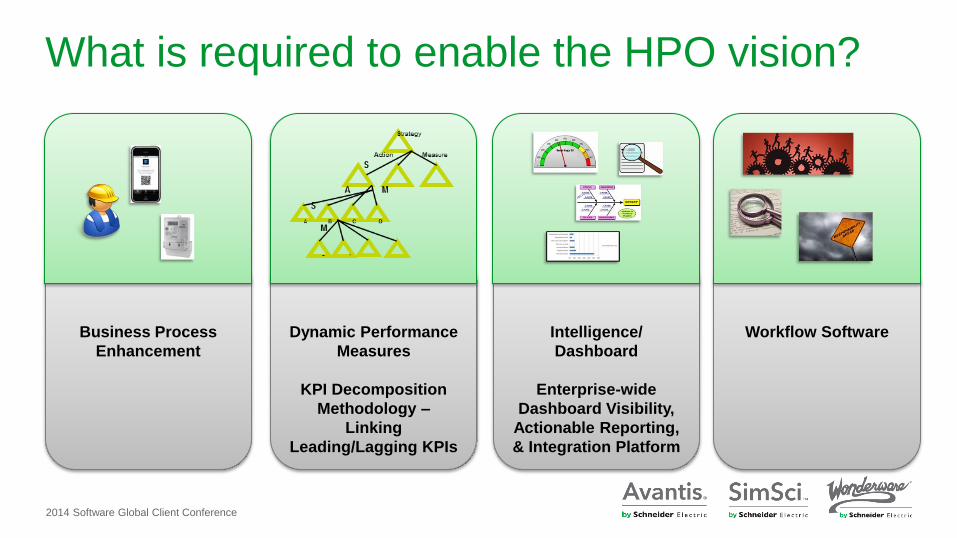
Dynamic Performance
Measures
KPI Decomposition
Methodology –
Linking
Leading/Lagging KPIs
What is required to enable the HPO vision?
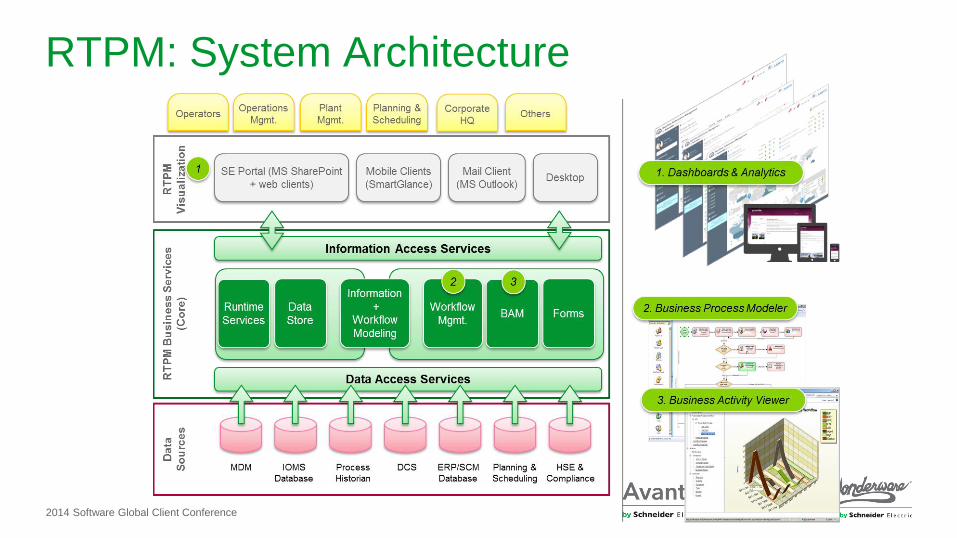
Intelligence/
Dashboard
Enterprise-wide
Dashboard Visibility,
Actionable Reporting,
& Integration Platform
Business Process
Enhancement
Workflow Software
2014 Software Global Client Conference
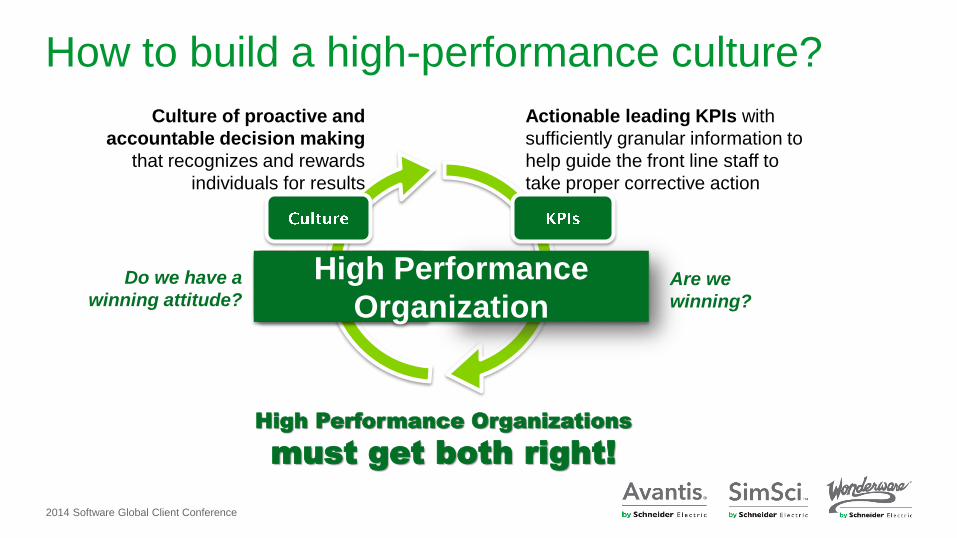
How to build a high-performance culture?
Do we have a
winning attitude? Are we
winning?
High Performance Organizations
must get both right!
Culture of proactive and
accountable decision making
that recognizes and rewards
individuals for results
Actionable leading KPIs with
sufficiently granular information to
help guide the front line staff to
take proper corrective action
High Performance
Organization
2014 Software Global Client Conference 13
KPI Decomposition & Alignment Overview & Case Study
2014 Software Global Client Conference
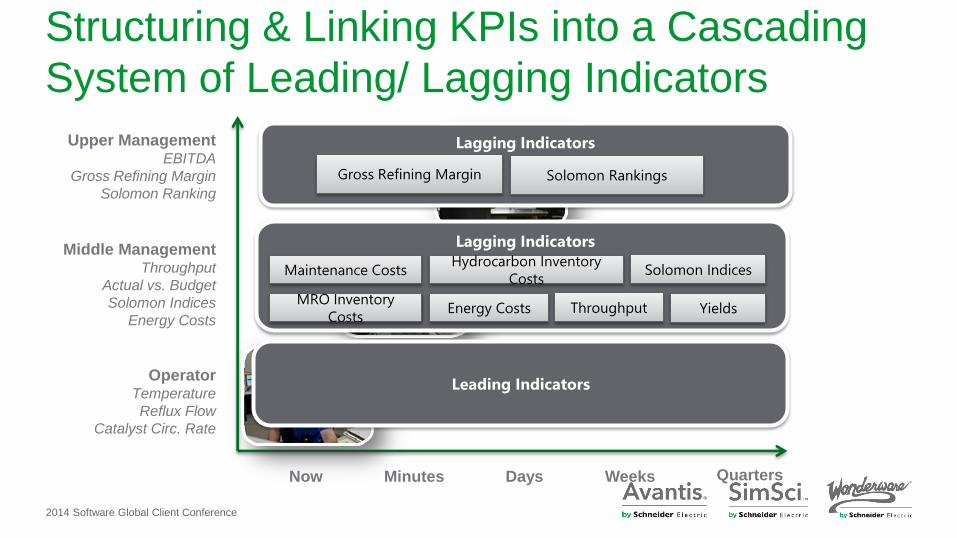
Structuring & Linking KPIs into a Cascading
System of Leading/ Lagging Indicators
Now Minutes Days Weeks
Middle Management Throughput
Actual vs. Budget
Solomon Indices
Energy Costs
Upper Management EBITDA
Gross Refining Margin
Solomon Ranking
Operator Temperature
Reflux Flow
Catalyst Circ. Rate
Lagging Indicators
Gross Refining Margin Solomon Rankings
Leading Indicators
Throughput Yields MRO Inventory
Costs
Maintenance Costs Solomon Indices Hydrocarbon Inventory
Costs
Energy Costs
Lagging Indicators
Quarters
2014 Software Global Client Conference
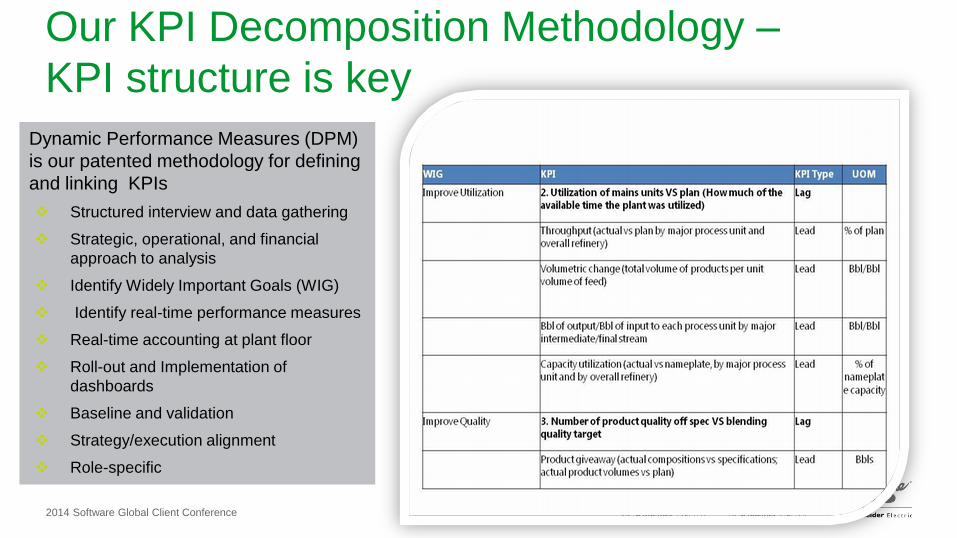
Our KPI Decomposition Methodology –
KPI structure is key
Dynamic Performance Measures (DPM)
is our patented methodology for defining
and linking KPIs
Structured interview and data gathering
Strategic, operational, and financial
approach to analysis
Identify Widely Important Goals (WIG)
Identify real-time performance measures
Real-time accounting at plant floor
Roll-out and Implementation of
dashboards
Baseline and validation
Strategy/execution alignment
Role-specific
2014 Software Global Client Conference
Case Study –Sasol
What Sasol needed
High resolution cost and profit data in real time
Visibility to the value of improvement activities
More and better information from accounting
Focus only on improvements that provide value
Employees aligned with strategy
Improved morale and performance
2014 Software Global Client Conference
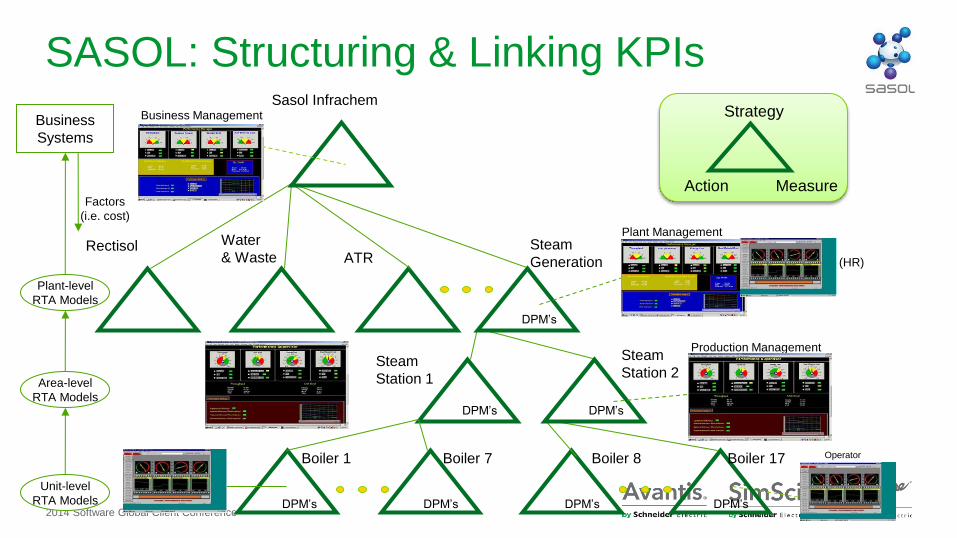
SASOL: Structuring & Linking KPIs Sasol Infrachem
Steam
Generation Rectisol Water
& Waste ATR
Steam
Station 1
Steam
Station 2
Boiler 1 Boiler 7 Boiler 8 Boiler 17
Unit-level
RTA Models
Business
Systems
Area-level
RTA Models
Plant-level
RTA Models
Plant Management
Business Management
Factors
(i.e. cost)
(HR)
Production Management
Operator
DPM’s DPM’s DPM’s DPM’s
DPM’s DPM’s
DPM’s
Strategy
Action Measure
2014 Software Global Client Conference
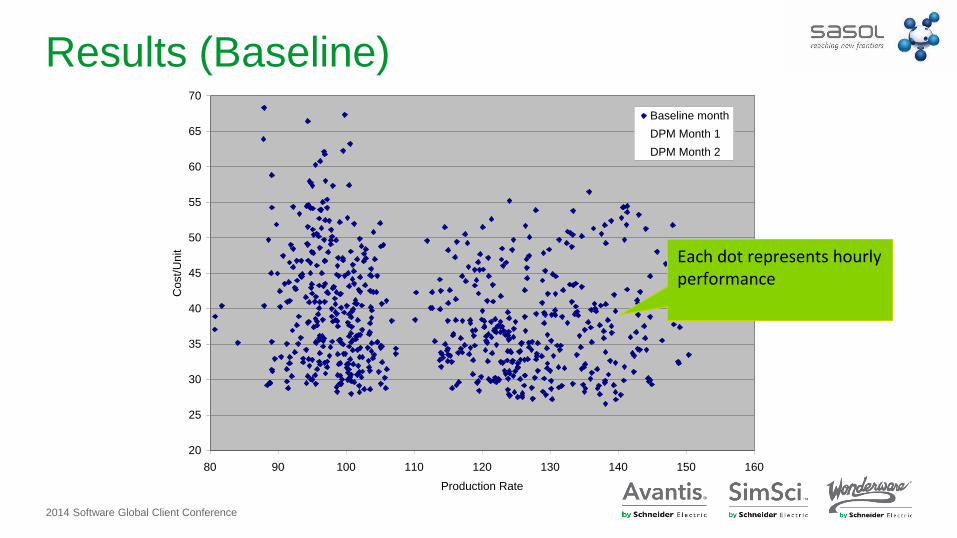
Results (Baseline)
20
25
30
35
40
45
50
55
60
65
70
80 90 100 110 120 130 140 150 160
Production Rate
Cost/
Unit
Baseline month
DPM Month 1
DPM Month 2
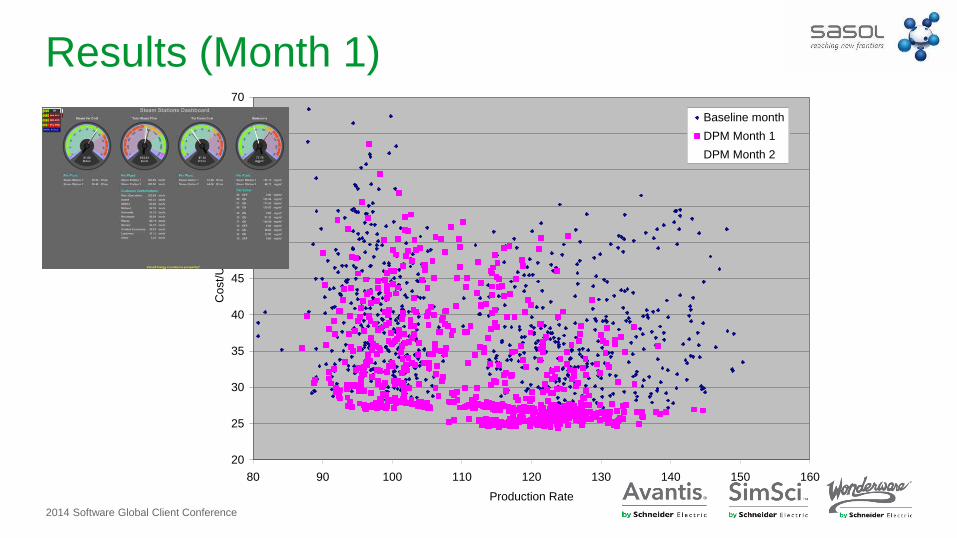
Each dot represents hourly performance
2014 Software Global Client Conference
Results (Month 1)
20
25
30
35
40
45
50
55
60
65
70
80 90 100 110 120 130 140 150 160
Production Rate
Cost/
Unit
Baseline month
DPM Month 1
DPM Month 2
2014 Software Global Client Conference
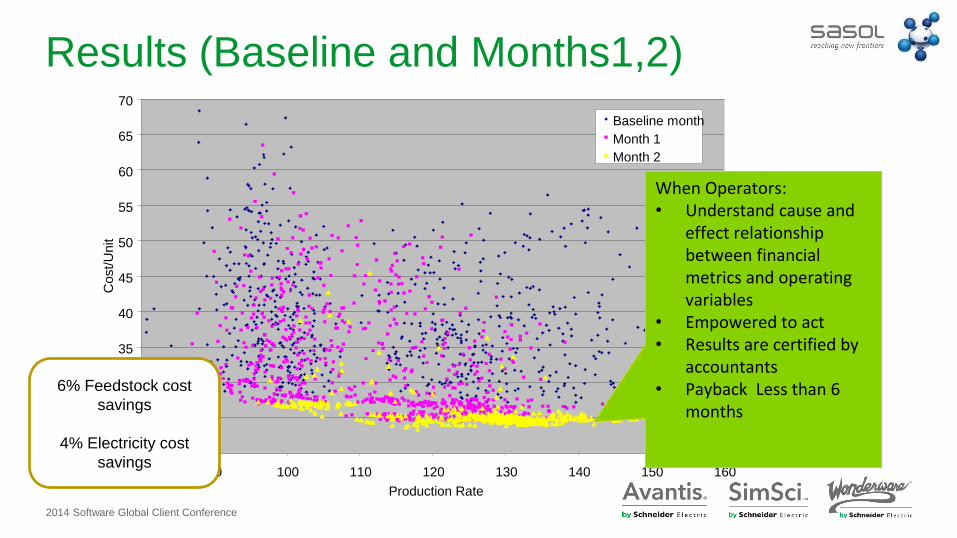
Results (Baseline and Months1,2)
20
25
30
35
40
45
50
55
60
65
70
80 90 100 110 120 130 140 150 160
Production Rate
Cost/U
nit
Baseline month
Month 1
Month 2
When Operators: • Understand cause and
effect relationship between financial metrics and operating variables
• Empowered to act • Results are certified by
accountants • Payback Less than 6
months
6% Feedstock cost
savings
4% Electricity cost
savings
2014 Software Global Client Conference
RTPM: System Architecture
2014 Software Global Client Conference
Similar Engagements in the last 3 years
●South African Coal and Oil (SASOL)
●Saudi Aramco Total Refining and Petrochemicals Co (SATORP)
●Rabigh Refining and Petrochemical Company (PetroRabigh)
●Cheniere Energy Inc.
●Abu Dhabi Gas Industries Limited (GASCO)
●Bin Sohn Refinery (PetroVietnam)
●Abu Dhabi Gas Liquefaction Company (ADGAS)
●GS-Caltex Refinery
2014 Software Global Client Conference
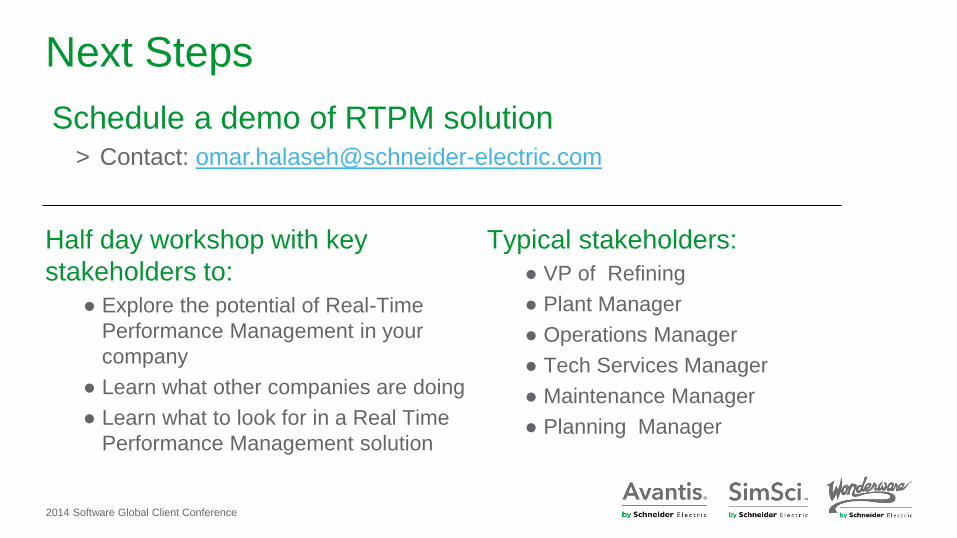
Next Steps
Half day workshop with key
stakeholders to:
● Explore the potential of Real-Time
Performance Management in your
company
● Learn what other companies are doing
● Learn what to look for in a Real Time
Performance Management solution
Typical stakeholders:
● VP of Refining
● Plant Manager
● Operations Manager
● Tech Services Manager
● Maintenance Manager
● Planning Manager
Schedule a demo of RTPM solution > Contact: [email protected]
24 Confidential Property of Schneider Electric
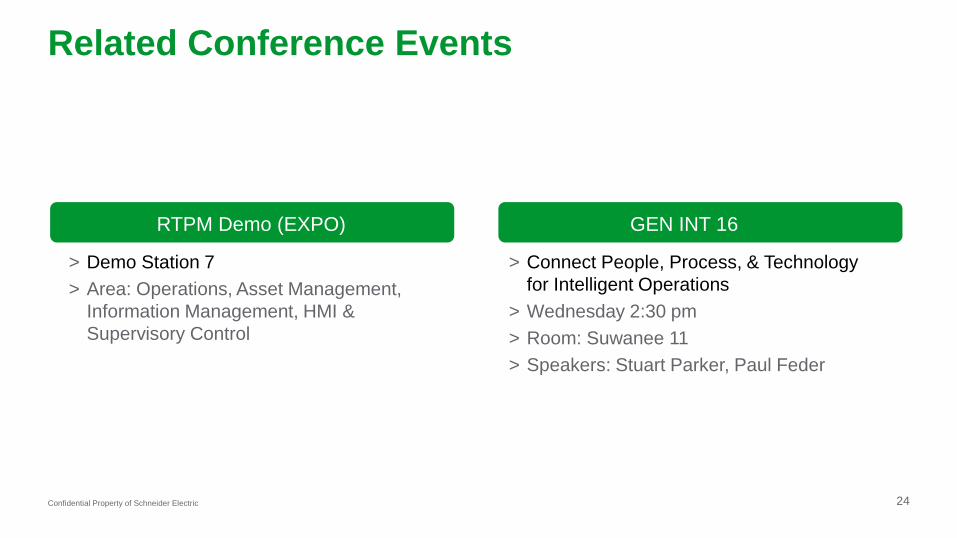
Related Conference Events
> Demo Station 7
> Area: Operations, Asset Management,
Information Management, HMI &
Supervisory Control
RTPM Demo (EXPO)
> Connect People, Process, & Technology
for Intelligent Operations
> Wednesday 2:30 pm
> Room: Suwanee 11
> Speakers: Stuart Parker, Paul Feder
GEN INT 16
2014 Software Global Client Conference
Q&A Building a High-Performance Organization
in the Oil & Gas Industry

26 ©2014 Schneider Electric. All Rights Reserved.
All trademarks are owned by Schneider Electric Industries SAS or its affiliated companies or their respective owners.
Recommended