ABOUT BALLARD POWER SYSTEMS Ballard Power Systems (TSX and NASDAQ: BLDP) provides clean energy products that reduce customer costs and risks, and helps customers solve difficult technical challenges or address new business opportunities. To learn more about Ballard, please visit www.ballard.com.
CONTENTS Notice of Annual Meeting ....................................................................................................................................................... 1 Sustainability Report .............................................................................................................................................................. 5 Management Proxy Circular ................................................................................................................................................. 8 Matters to be Voted Upon ...................................................................................................................................................... 8 Voting Information ................................................................................................................................................................. 8 Corporate Governance ......................................................................................................................................................... 15 Executive Compensation ...................................................................................................................................................... 23 Equity-Based Compensation Plans ...................................................................................................................................... 50 Additional Information ........................................................................................................................................................ 52 Defined Terms ....................................................................................................................................................................... 54 Appendix "A" Board Mandate .......................................................................................................................................... A-1 Appendix "B" Description of Option Plan ....................................................................................................................... B-1 Appendix "C" Description of SDP ................................................................................................................................... C-1 Financial Information......................................................................................................................................................... D-1
CAUTION REGARDING FORWARD-LOOKING STATEMENTS
This document contains forward-looking statements concerning projected revenue growth, product shipments, gross margin, Adjusted EBITDA, cash operating expenses product sales and market adoption of fuel cell electric vehicles. These forward-looking statements reflect Ballard’s current expectations as contemplated under section 27A of the Securities Act of 1933, as amended, and Section 21E of the Securities Exchange Act of 1934, as amended. Any such statements are based on Ballard’s assumptions relating to its financial forecasts and expectations regarding its product development efforts, manufacturing capacity, and market demand. For a detailed discussion of the factors and assumptions that these statements are based upon, and factors that could cause our actual results or outcomes to differ materially, please refer to Ballard’s most recent management discussion & analysis.
Other risks and uncertainties that may cause Ballard’s actual results to be materially different include general economic and regulatory changes, detrimental reliance on third parties, successfully achieving our business plans and achieving and sustaining profitability. For a detailed discussion of these and other risk factors that could affect Ballard’s future performance, please refer to Ballard’s most recent Annual Information Form. These forward-looking statements are provided to enable external stakeholders to understand Ballard’s expectations as at the date of this document and may not be appropriate for other purposes. Readers should not place undue reliance on these statements and Ballard assumes no obligation to update or release any revisions to them, other than as required under applicable legislation.

BALLARD POWER SYSTEMS INC.
9000 Glenlyon Parkway
Burnaby, British Columbia, Canada V5J 5J8
NOTICE OF ANNUAL MEETING
TO OUR SHAREHOLDERS:
Our 2019 Annual Meeting (the "Meeting") will be held at our corporate head office facilities at 9000 Glenlyon Parkway, Burnaby, British Columbia, on Tuesday, June 4, 2019 at 1:00 p.m. (Pacific Daylight Time) for the following purposes:
1. To receive our audited financial statements for the financial year ended December 31, 2018 and the report of our auditors thereon;
2. To elect our directors for the ensuing year;
3. To appoint our auditors for the ensuing year and to authorize our Audit Committee to fix the remuneration of the auditors;
4. To consider and, if thought appropriate, to approve a resolution, on an advisory basis, accepting the Corporation’s approach to executive compensation; and
5. To transact such other business as may properly be brought before the Meeting or any adjournment thereof.
A detailed description of the matters to be dealt with at the Meeting and our 2018 Annual Report are included with this Notice.
If you are unable to attend the Meeting in person and wish to ensure that your shares will be voted at the Meeting, you must complete, date and execute the enclosed form of proxy and deliver it in accordance with the instructions set out in the form of proxy and in the Management Proxy Circular accompanying this Notice, so that it is received by Computershare Investor Services Inc. no later than close of business (Pacific Daylight Time) on Friday, May 31, 2019.
If you plan to attend the Meeting you must follow the instructions set out in the form of proxy and in the Management Proxy Circular to ensure that your shares will be voted at the Meeting.
DATED at Burnaby, British Columbia, April 8, 2019.
BY ORDER OF THE BOARD
"Kerry Hillier"
Kerry Hillier Corporate Secretary Ballard Power Systems Inc.
1

Letter from JAMES ROCHE Chair of the Board
Fellow Shareholders:
2018 was another year of measured progress for Ballard in the rapidly evolving PEM fuel cell industry. While financial performance was below expectations, management achieved significant progress on our long-term strategy, while strengthening our balance sheet.
The board had a busy 2018, including activities relating to corporate strategy, the Weichai Power strategic collaboration, divestiture of our Power Manager business, talent development, succession planning, oversight of operating activities and performance management. The board also traveled to Weifang, Shandong Province, China in support of the company’s long-term strategic collaboration with Weichai.
We continued our board renewal process. As planned, having reached the director term limit, Ian Bourne did not stand for re-election at our 2018 Annual General Meeting. The entire board and management team wish to thank Ian for his outstanding leadership, guidance and mentorship during his tenure as board Chair. Consistent with the terms of our strategic collaboration with Weichai, we added two new board members, expanding the board from seven to nine members. Mr. Jiang Kui (Mr. Kevin Jiang) and Mr. Sun Shaojun (Mr. Sherman Sun) were appointed to the Ballard board effective January 1st, 2019. Both Kevin and Sherman have been long-standing executives with the Weichai group of companies and will provide valuable insights and counsel to our board in terms of the China market as well as Weichai’s capabilities and relationships throughout the powertrain and vehicle manufacturing value chain.
There are positive signals implying attractive long-term growth in the hydrogen and fuel cell industry. The macro trends of climate change, air quality and electrification of propulsion systems support our strategy. Target markets are increasingly showing real signs of commitment to clean energy solutions, initially focused on Heavy and Medium Duty Motive transportation applications. Your company is well-positioned to leverage these opportunities for future growth.
On behalf of my board colleagues, I would like to extend our appreciation to Ballard employees for their continued integrity, customer focus, innovation and commitment to doing the right things in our business, day in and day out. I would also draw your attention to a subset of employees identified on page 7, who received special recognition as 2018 Ballard Impact Award winners. On behalf of the board we also thank our shareholders for your continued support.
"James Roche"
JAMES ROCHE Chair of the Board of Directors
2

Letter from R. RANDALL MACEWEN President and Chief Executive Officer
Fellow Shareholders,
2018 was an important year for the hydrogen and fuel cell industry. There is mounting evidence that the shift to zero-emission transportation is accelerating and that fuel cell electric vehicles (FCEVs) will play an integral role. The macro drivers of climate change, air quality and electrification are global and converging. Governments across the planet are considering decarbonisation of energy, transportation and industry.
We believe there are large and attractive addressable markets and use cases for zero-emission Heavy and Medium Duty Motive applications – such as city buses, coaches, delivery trucks, drayage trucks, long-haul trucks, train, tram and certain marine applications – where FCEVs will offer a strong value proposition. These heavy vehicles typically require long daily range and fast refueling. We expect early adoption markets where the value proposition is strongest and where the barriers to hydrogen refueling infrastructure are lowest, such as centralized depot refueling.
These market segments are now bracing for a shift away from pure diesel vehicles into alternative powertrain systems. We view these markets as ripe for disruption. Increasingly, others are joining the chorus and starting to voice their agreement. We are seeing the early signs of disruption with regulators, transit operators, fleet operators and OEMs in the bus, commercial truck and train markets. Change is being led, in part, by certain local governments and cities in Europe, China and California, which are indicating plans to limit or ban diesel vehicle usage.
The Hydrogen Council has set targets for 350,000 fuel cell commercial trucks, 50,000 fuel cell buses and thousands of fuel cell trains in the year 2030. The Hydrogen Council also targets 12-to-20 million commercial fuel cell trucks, 5 million fuel cell buses and 20% of certain trains to be fuel cell powered in the year 2050.
At the same time as the macro backdrop continues to advance, your company made significant strategic progress in 2018. Last June, we celebrated the 25th anniversary of the public listing of our shares on the Toronto Stock Exchange. And, as Ballard turns 40 years old in 2019, we started the year with our strongest strategic positioning in our history. With the emerging recognition of the value proposition of FCEVs, customer engagement is soaring. Ballard is working every day to fulfill our customers’ needs for PEM fuel cell power products and technology solutions. We are working on the successful launch and commercialization of our next-generation PEM fuel cell stack and module, raising the bar again on industry-leading performance. We entered into a landmark strategic alliance with Weichai in 2018, setting the stage for a strong growth platform in the large China market. We deepened our important technology relationship with Audi, signing a multi-year extension to our Technology Solutions program into 2022. We are working hard to support Audi in the small series production launch of its first fuel cell consumer car. Ballard continued to refine our business portfolio, divesting non-core and underperforming assets, including our Power Manager business.
3

In 2018, we generated revenue of US$96.6 million, gross margin of 31% and Adjusted EBITDA of US($13.5) million. Importantly, we ended the year with US$192.2 million in cash reserves – giving us a fortified balance sheet.
As a result, Ballard offers a unique investment thesis – a play on the electrification theme in the light, medium and heavy duty motive applications space, where FCEVs offer a compelling value proposition for select use cases.
As we look ahead over the next few years, we see sustained investment to drive adoption and market share in target markets. We expect continued early-stage momentum in the adoption of fuel cell power solutions, particularly for Heavy and Medium Duty Motive applications, including bus, truck, rail and marine. We expect growth in China, Europe and California. These opportunities will set the stage for long-term commercialization and return on investment for Ballard.
Looking out over the next 5-to-10 years, we envision:
further legislative restrictions on internal combustion engines in city centers improved reliability and significant cost reductions in fuel cell engines and vehicles more than 100,000 commercial FCEVs in operation globally growing market share of fuel cell passenger cars, supported by adoption of ride sharing and
autonomous drive technologies scaled deployment of next generation, purpose-built fuel cell-powered material handling equipment early commercialization of certain off-highway, marine, aerospace and drone applications
Ballard intends to maintain our leadership position as markets evolve over this time horizon. Our strategy is to continue to invest in talent, technology, products, customer experience and brand.
At Ballard, our vision is simple – We deliver fuel cell power for a sustainable planet. This vision energizes our dedicated team of professionals. Our employees globally live by our cultural values of Safety, Innovation, Listen and Deliver, Quality Always, Inspire Excellence, Row Together, and Own It. Our team’s collective expertise, experience, innovation, passion, grit and commitment to put our customers at the center of our decision-making drives our business forward each day.
We express our deep appreciation to our valued customers and partners for their trust, business and collaboration. We are privileged to have a growing list of remarkable customers, partners and strategic investors, including ABB, Alexander Dennis Ltd., Anglo American Platinum, Audi, Broad Ocean Motor, Dongfeng, ElDorado, Eniig, FAW, Fibia, Hexagon, Hyster-Yale, Kenworth, King Long, KION, Nel, New Flyer, Nisshinbo, Plug Power, ReFire, Siemens, Sinohytec, Solaris, Synergy, Toyota, Van Hool, VDL, Volkswagen, Weichai, Wrightbus and many others.
Finally, we thank our shareholders for your confidence. We intend to continue earning your trust by delivering against our strategy, driving to sustainable profitability and building long-term shareholder value. We look forward to reporting our progress over the coming year.
"R. Randall MacEwen"
R. RANDALL MACEWEN President & CEO
Ballard Power Systems Inc.
4

For the past several years Ballard has beenactively pursuing sustainability efforts that reduceour carbon footprint in product development,testing and manufacturing facilities co-locatedwith our corporate headquarters in Burnaby,British Columbia (a portion of our productdevelopment and testing operation is depictedin the photograph to the right). Our sustainabilityactivities have, to this point, been primarily in twoareas – energy management and recycling.
Ballard has worked with our power provider – BC Hydro – and with other regional cohorts to share best-practices for the reduction of electricity consumption. We have developed a target list of 42 initiatives designed to achieve this goal through the elimination of wasted energy, with no impact on our product development, testing or manufacturing capacity. Through the implementation of just a portion of these initiatives in the 2017-18 period, electricity consumption was reduced in 2018 by 2.4MWh, enough electricity to power 225 typical homes in the Province of British Columbia for an entire year.
ENERGY MANAGEMENT
SUSTAINABILITYREPORT
2018
JAN FEB MAR APR MAY JUN JUL AUG SEP OCT NOV DEC
MAXTARGET
kWh
1,900,000
1,800,000
1,700,000
1,600,000
1,500,000
1,400,000
1,300,000
1,200,000
2017 2018POWER CONSUMPTION
5

Fuel Cell ProductsBallard has developed expertise, through more than 30 years of innovation, in recycling fuel cell productcomponents. We effectively refurbish, reuse and reclaim these components so that our products not onlymeet a zero-emission standard when used by customers in the field, but also meet a zero-waste standardin the manufacturing process.
A fuel cell stack reaches its end-of-life when the membrane electrode assembly, or MEA, wears out –typically in 5 to 10 years. At that point, Ballard refurbishes each stack by reusing the plates and hardware together with our latest generation MEA. We then reclaim approximately 95% of the platinum, a valuable precious metal, from each of the used MEAs and reuse it in the manufacture of new stacks. With more than 30,000 stacks shipped to customers over the years, we now refurbish several thousand each year. Ballard is also certified under ISO 14001, the international standard for effective environmental management systems.
Manufacturing MaterialsAs depicted in the chart below, we recycle various materials used in our operations, from organics andglass to wood. Over the 2017-18 period, more than 1.2 million kilograms (over 2.6 million lbs.) of materials have been recycled. As one example, the 27,000 kilograms (59,500 lbs.) of glass, metal and plasticsrecycled in 2018 alone are enough to manufacture 38 passenger cars!
We are working to expand existing sustainability initiatives, includingthe addition of water and natural gas waste reduction plans and expansionof existing initiatives to all corporate manufacturing locations. Wehave also formed an internal cross-functional team that will beresponsible for corporate-wide planning and execution ofan exhaustive sustainability plan, and we look forwardto communicating progress to all shareholdersin our next Annual Report.
RECYCLING ACTIVITIES
MOVING FORWARD
6

2018 Ballard Impact Awards Recipients
Innovation Award HDV8 Design Team Gener Arciaga, Nate MacRostie, George Skinner, Wendy Cellik, Ben Greenough, Ian Milne, Stefan Strbac, Norm Cook, Tegan Harrower, Terry Moreau, Chris Strohhacker, Bahram Dashtimoghaddam, Zoltan Kollar, Steve Gabrys, Nicolae Mosoiu, Scott Sweeney, Joel Lancaster, David Myers, Kenneth Wang, Mike Ebbehoj, TJ Lawy, Ed Peters, Ian Eldergill, Cathy Li, Wade Popham, Lisa Zeng, Stam Liu, Alex Robinson, James Kirker, Sanjiv Kumar, Don Lines, Mike Padmore, Paul Paterson, Jeff Pledger, Jeff Riha, Grace Valle, Semen Foudimov, Kyle Fritzke, Alex Degraaf, Robert Yachuk, Luke Damron, Jaedyn Foley, Darrell Klammer, Stephen Linsley, Sorin Popa, Mitchell Pozar
Safety Award Occupational Safety Standard of Excellence (OSSE) Kaki Chan
Listen & Deliver Award Flexible Benefits Program Roll Out Harsimran Kapoor and Dayna Sandher
Quality. Always Award Audit Excellence Jyoti Sidhu, Sentayehu Kebede, Lynette McHugh, Cara Startek, Paul Beattie, Ian Eldergill, Joanna Kolodziej, Steve Gabrys, Shoaib Khan, Neil Black, Jeff Glandt, Evelyn Lai, Antonio Lee, Tim Naylor, Silvano Pozzi, James Wong, Leonardo Estrada, Jane Calinisan, Edith Hicks, Kevin Colbow, Seungsoo Jung, Lee Sweetland, Antonio Lee, Jan Laishley, Harsimran Kapoor, Kailyn Domican, Andrew Desouza, Shanna Knights, Grace Valle, Brenda Chen, Sonia Cheung, Laura Stolar, Garth Currier, Lisa Li, Jacqueline Ricafrente, Ron Mah, Lars Husted, Carmen Cheung, Warren Williams, Paul Louw, David Musil, Neil Blackadar, Alan Young, Noosha Mirzalou, Milena Cabral, Nico Van Rooi, Jefferson Casauay, David Lo, Greg Iuzzolino
Inspire Excellence Award Challenge Solving Innovation Sessions Contributors Soroush Mohammadjafaryvahed, Ales Horky, Terry Moreau, Brooks Friess, Greg Afonso, Perry Ho
Own it Award China Service and Application Engineering Excellence Ethan Zhang and Jack Fang
Row Together Award MD30 Support Patricia Chong, Christian Tuazon, Paul Lam, Bahram Dashtimoghaddam, Lisa Li, Gener Arciaga, Jeff Riha, Ashkan Soheili, Steve Gabrys, Carmen Cheung, Grace Valle, Ethan Zhang, Stephen Shen, Lewis Liu, Jack Fang, Wei Ye, Donald Guan, Byron Somerville, Norman Woo, Bruce Yu, Leanne Feng, Jason Cox, Vincent Liu, Brock Pang, Gihan Wickremasuriya, Mandy Tam, Andy Chen, Shoaib Khan, Michael Liou, Alan Li, Hyeseon Oh, Howard Tseng, Jyoti Sidhu, Norman Chor
POWER TO CHANGE THE WORLD®
7

MANAGEMENT PROXY CIRCULAR dated as of April 8, 2019
MATTERS TO BE VOTED UPON
Registered Shareholders or their duly appointed proxyholders will be voting on:
the election of directors to our Board; the re-appointment of our auditors and authorization for our Audit Committee to fix the
remuneration of the auditors; on an advisory basis, the Corporation’s approach to executive compensation; and such other business as may properly be brought before the meeting.
As of the date of this Management Proxy Circular, we know of no amendment, variation or other matter that may come before the Meeting other than the matters referred to in the Notice of Annual Meeting. If any other matter is properly brought before the Meeting, it is the intention of the persons named in the enclosed proxy to vote the proxy on that matter in accordance with their best judgment.
VOTING INFORMATION
SOLICITATION OF PROXIES
This Management Proxy Circular is furnished in connection with the solicitation of proxies by our management in connection with the Meeting to be held on Tuesday, June 4, 2019 at 1:00 p.m. (Pacific Daylight Time) in Burnaby, BC, or the date and place of any adjournment thereof. We are soliciting proxies primarily by mail, but our directors, officers and employees may solicit proxies personally, by telephone, by facsimile transmission or by other means of electronic communication. The cost of the solicitation will be borne by us. The approximate date on which this Management Proxy Circular and the related materials are first being sent to Registered Shareholders is April 26, 2019.
OBTAINING A PAPER COPY OF MANAGEMENT PROXY CIRCULAR AND FINANCIAL
STATEMENTS
In lieu of mailing the Notice of Meeting, Management Proxy Circular and our audited financial statements and management's discussion and analysis for the year ended December 31, 2018, the Corporation is using notice-and-access to provide an electronic copy of these documents to registered shareholders and beneficial shareholders of the Corporation's Shares by posting them on www.ballard.com and on the Corporation's profile on www.SEDAR.com. For more information regarding notice-and-access, you may call toll free at 1-855-887-2244, from Canada or the United States.
If you wish to obtain a paper copy of these documents, you may call toll free at 1-877-907-7643, from Canada or the United States. You must call to request a paper copy by May 22, 2019 in order to receive a paper copy prior to the deadline for submission of your voting instructions or form of proxy. If your request is received on or after the date of the Meeting, then the documents will be sent to you within ten calendar days of your request. Ballard will provide a paper copy of the documents to any registered or beneficial shareholder upon request for a period of one year following the date of the filing of this Management Proxy Circular on www.SEDAR.com.
If you have standing instructions to receive paper copies of these documents and would like to revoke them, you may call toll free at 1-877-907-7643, from Canada or the United States.
HOW TO VOTE
Only Registered Shareholders or their duly appointed proxyholders are permitted to vote at the Meeting. Beneficial Shareholders are not permitted to vote at the Meeting as only proxies from Registered Shareholders can be recognized and voted at the Meeting. You may vote as follows:
8

Registered Shareholders: If you are a Registered Shareholder you may vote by attending the Meeting in person, or if you do not plan to attend the Meeting, by completing the proxy and delivering it according to the instructions contained in the form of proxy and this Management Proxy Circular.
Beneficial Shareholders: If you are a Beneficial Shareholder you may only vote by carefully following the instructions on the voting instruction form or proxy form (“VIF”) provided to you by your stockbroker or financial intermediary. If you do not follow the special procedures described by your stockbroker or financial intermediary, you will not be entitled to vote.
Should a Beneficial Shareholder who receives a VIF wish to attend the Meeting or have someone else attend on his or her behalf, the Beneficial Shareholder may request a legal proxy as set forth in the VIF, which will grant the Beneficial Shareholder or his/her nominee the right to attend and vote at the Meeting.
Distribution of Meeting Materials to Beneficial Shareholders
The Corporation has distributed copies of the notice-and-access notice and VIF to the depositories and intermediaries for onward distribution to Beneficial Shareholder. Beneficial shareholders who have previously provided standing instructions will receive a paper copy of the Notice of Meeting, Management Proxy Circular, financial statements and related management discussion and analysis. If you are a Beneficial Shareholder and the Corporation or its agent has sent these materials directly to you, your name and address and information about your holdings and securities have been obtained in accordance with securities regulatory requirements from the intermediary holding on your behalf.
EXECUTION AND REVOCATION OF PROXIES
A Registered Shareholder or the Registered Shareholder’s attorney authorized in writing or, where the Registered Shareholder is a company, a duly authorized officer or attorney of that company, must execute the proxy. In order to be effective, completed proxies must be deposited at the office of the registrar and transfer agent for the Shares, being Computershare Investor Services Inc. ("Computershare"), Proxy Dept., 100 University Avenue, 9th Floor, Toronto Ontario, M5J 2Y1 (Fax: within North America: 1-866-249-7775; outside North America: 1-416-263-9524), not less than 48 hours (excluding Saturdays and holidays) before the time of the Meeting. The individuals named as proxyholders in the accompanying form of proxy are directors and officers of Ballard. A Registered Shareholder desiring to appoint a person or company
(who need not be a shareholder) to represent him or her at the Meeting, other than the persons or
companies named in the enclosed proxy, may do so by inserting the name of such other person or
company in the blank space provided in the proxy.
A proxy may be revoked by written notice executed by the Registered Shareholder or by his or her attorney authorized in writing or, where the Registered Shareholder is a company, by a duly authorized officer or attorney of that company, and delivered to:
Computershare, at the address or fax number set out above, at any time up to and including the last business day preceding the day of the Meeting;
the registered office of the Corporation at any time up to and including the last business day preceding the day of the Meeting; or
the chair of the Meeting on the day of the Meeting and before any vote in respect of which the proxy is to be used is taken.
A proxy may also be revoked in any other manner provided by law. Any revocation of a proxy will not affect a matter on which a vote is taken before such revocation.
VOTING OF SHARES AND EXERCISE OF DISCRETION BY PROXIES
If you complete and deposit your proxy properly, then the proxyholder named in the accompanying form of proxy will vote or withhold from voting the Shares represented by the proxy in accordance with your instructions.
9

If you do not specify a choice on any given matter to be voted upon, your Shares will be voted in
favour of such matter. The proxy grants the proxyholder the discretion to vote on amendments to or
variations of matters identified in the Notice of Annual Meeting and with respect to other matters that
may properly come before the Meeting.
VOTING SHARES AND PRINCIPAL SHAREHOLDERS
As of the Record Date of April 8, 2019, we had 232,343,296 Shares issued and outstanding, each carrying the right to one vote. On a show of hands, every individual who is present as a Registered Shareholder or as a representative of one or more corporate Registered Shareholders, or who is holding a proxy on behalf of a Registered Shareholder who is not present at the Meeting, will have one vote, and on a poll, every Registered Shareholder present in person or represented by proxy and every person who is a representative of one or more corporate Registered Shareholders, will have one vote for each Share recorded in the Registered Shareholder’s name in the Corporation’s central securities register.
As of the Record Date, Weichai Power Co., Ltd. (“Weichai”) beneficially owns 46,131,712 Shares, representing 19.9% of all issued and outstanding Shares, each carrying the right to one vote. As of the Record Date, to the knowledge of our directors and executive officers, no other person beneficially owns, controls or directs, directly or indirectly, Shares carrying more than 10% of the voting rights attached to all issued and outstanding Shares carrying the right to vote in all circumstances.
INTEREST OF CERTAIN PERSONS OR COMPANIES IN MATTERS TO BE ACTED UPON
No one who has been a director, director nominee or executive officer of ours at any time since January 1, 2019, or any of his or her associates or affiliates, has any material interest, direct or indirect, by way of beneficial ownership of Shares or otherwise, in any matter to be acted on at the Meeting other than the election of directors.
ELECTION OF DIRECTORS
At the Meeting you will be asked to elect nine directors. All of our nominees are currently members of the Board. Each elected director will hold office until the end of our next annual shareholders’ meeting (or if no director is then elected, until a successor is elected) unless the director resigns or is otherwise removed from office earlier. If any nominee for election as a director advises us that he or she is unable to serve as a director, the persons named in the enclosed proxy will vote to elect a substitute director at their discretion.
As part of the strategic transaction with Weichai announced on November 13, 2018, Weichai has the right to nominate two directors to Ballard’s Board so long as Weichai holds at least 15% of Ballard’s outstanding Shares. Mr. Jiang and Mr. Sun were nominated to the Board by Weichai and were appointed as of January 1, 2019.
The following information pertains to our nominees for election as directors at the Meeting, as of April 8, 2019.
10

Douglas P. Hayhurst
Age: 72 B.C., Canada Director since: 2012 Independent
Mr. Hayhurst’s principal occupation is corporate director. Previously, Mr. Hayhurst was an executive with IBM Canada Business Consulting Services (consulting services) and a partner with PricewaterhouseCoopers Management Consultants (consulting services). Prior to that, Mr. Hayhurst held various senior executive management roles with Pricewaterhouse including National Deputy Managing Partner (Toronto) and Managing Partner for British Columbia (Vancouver). Mr. Hayhurst received a Fellowship (FCA) from the Institutes of Chartered Accountants of British Columbia and of Ontario. He has completed the Directors Education Program of the Institute of Corporate Directors and has received his ICD.D designation.
Board and Committee Membership
Attendance
Other Public Board Memberships
Board Audit (Chair) Corporate Governance & Compensation
12 6 6
100% 100% 100%
Current: none Previous: Accend Capital Corporation; Canexus Corporation; Catalyst Paper Corporation(1); Northgate Minerals Corporation
Securities Held(2)
Year Shares DSUs Total of Shares and DSUs
Value of Shares and DSUs (CDN$)(3)
Director Share Ownership Guidelines
2019 5,000 199,801 204,801 $956,421 Achieved
2018 5,000 186,101 191,101 $831,289 On track
Kui (Kevin) Jiang
Age: 55 Shandong, China Director since: 2019
Independent(4)
Mr. Jiang is President of Shandong Heavy Industry Group Co., Ltd. (heavy machinery manufacturing). He is also a non-executive director of Weichai Power Co., Ltd, (diesel engine, powertrain and hydraulic products manufacturing), a non-executive director of Sinotruk (Hong Kong) Limited, (heavy-duty truck manufacturing), a director of the Power Solutions International Inc. (cleantech engine and powertrain manufacturing), and a director of Ferretti International Holdings S.p.A. (engineering and construction). Previously, Mr. Jiang was deputy general manager of Shandong Bulldozer General Factory (heavy machinery manufacturing); deputy general manager of Shantui Construction Machinery Import and Export Company (heavy machinery); a director and senior officer of Shantui Engineering Machinery Co., Ltd. (heavy machinery); deputy general manager of Shandong Engineering Machinery Group Co., Ltd. (heavy machinery); executive deputy general manager and vice chairman of Weichai Group Holdings Limited, (diesel engine, powertrain and hydraulic products manufacturing); and chairman of Shanzhong Jianji Co., Ltd. (heavy machinery). He is a senior engineer and holds an MBA degree.
Board and Committee Membership
Attendance
Other Public Board Memberships
Board - - Current: Weichai Power Co., Ltd.; Sinotruk (Hong Kong) Limited; KION Group (supervisor); Power Solutions International Inc.; Ferretti International Holdings S.p.A. Previous: Shantui Engineering Machinery Co., Ltd.
Securities Held(2)
Year Shares DSUs Total of Shares and DSUs
Value of Shares and DSUs (CDN$)(3)
Director Share Ownership
Guidelines(5)
2019 0 0 0 0 N/A
2018 - - - - -
Duy-Loan Le
Age: 56 Texas, USA Director since: 2017
Independent
Ms. Le is President of DLE Management Consulting LLC (management consulting services), a position she has held since 2016. Previously, Ms. Le was an advanced technology ramp manager and a Senior Fellow at Texas Instruments Incorporated (semiconductor design and manufacturing) from 2002 to 2015; Program Manager and Fellow from 1998 to 2002; and Design Engineer and Manager from 1982 to 1998. Ms. Le is an inventor on 24 U.S. patents.
Board and Committee Membership Attendance Other Public Board Memberships
Board Audit Corporate Governance & Compensation
11 6 6
92% 100% 100%
Current: National Instruments Inc.; Cree, Inc. Previous: none
Securities Held(2)
Year Shares DSUs Total of Shares and DSUs
Value of Shares and DSUs (CDN$)(3)
Director Share Ownership Guidelines
2019 50,000 23,785 73,785 $344,576 Achieved
2018 50,000 11,955 61,955 $269,504 On track
11

R. Randall MacEwen
Age: 50 B.C., Canada Director since: 2014
Non-Independent
Mr. MacEwen is President and Chief Executive Officer of Ballard, a position he has held since October 2014. Previously, Mr. MacEwen was the founder and Managing Partner at NextCleanTech LLC (consulting services) from 2010 to 2014; and President & CEO and Executive Vice President, Corporate Development at Solar Integrated Technologies, Inc. (solar) from 2006 to 2009 and 2005 to 2006, respectively. Prior to that, Mr. MacEwen was Executive Vice President, Corporate Development at Stuart Energy Systems Corporation (onsite hydrogen generation systems) from 2001 to 2005; and an associate at Torys LLP (law firm) from 1997 to 2001.
Board and Committee Membership Attendance Other Public Board Memberships
Board
12
100%
Current: none Previous: Solar Integrated Technologies Inc.
Securities Held(2, 6)
Year Shares DSUs Total of Shares and DSUs
Value of Shares and DSUs (CDN$)(3)
Director Share Ownership
Guidelines(5)
2019 318,310 148,046 466,356 $2,177,883 N/A
2018 161,821 148,046 309,867 $1,347,921 N/A
Marty Neese Age: 56 California, USA Director since: 2015 Independent
Mr. Neese’s principal occupation is corporate director. He is also co-founder of Nuvosil AS (silicon recycling). Previously, he was Chief Operating Officer of Velodyne LiDAR, Inc. (autonomous vehicles) from February 2017 to October 2017. Prior to that, Mr. Neese was Chief Operating Officer of SunPower Corporation (solar power equipment and services) from 2008 to 2017; responsible for Global Operations at Flextronics (electronics manufacturing services) from 2007 to 2008 following its acquisition of Solectron Corporation (electronics manufacturing services) where he was Executive Vice President from 2004 to 2007.
Board and Committee Membership
Attendance
Other Public Board Memberships
Board Audit Corporate Governance & Compensation
12 6 6
100% 100% 100%
Current: none Previous: none
Securities Held(2)
Year Shares DSUs Total of Shares and DSUs
Value of Shares and DSUs (CDN$)(3)
Director Share Ownership Guidelines
2019 0 59,040 59,040 $275,717 On track
2018 0 37,856 37,856 $164,674 On track
James Roche Age: 56 Ontario, Canada Director since: 2015 Independent
Mr. Roche is founder, President and Chief Executive Officer of Stratford Managers Corporation (management consulting services), a position he has held since 2008. Prior to that, Mr. Roche was co-founder, President and Chief Executive Officer of Tundra Semiconductor (semiconductor component manufacturer) from 1995 to 2006 and founding member and executive at Newbridge Networks Corporation (communications equipment manufacturer) from 1986 to 1995.
Board and Committee Membership
Attendance
Other Public Board Memberships(1)
Board (Chair) Audit Corporate Governance & Compensation
12 6 6
100% 100% 100%
Current: none Previous: Wi-LAN Inc.; Tundra Semiconductor Corporation; Aztech Innovations Inc..
Securities Held(2)
Year Shares DSUs Total of Shares and DSUs
Value of Shares and DSUs (CDN$)(3)
Director Share Ownership Guidelines
2019 50,000 69,202 119,202 $556,673 On track
2018 50,000 51,609 101,609 $441,999 On track
12

Shaojun (Sherman) Sun
Age: 53 Shandong, China Director since: 2019
Independent(4)
Mr. Sun is an Executive Director and Executive President of Weichai Power Co., Ltd. (diesel engine, powertrain and hydraulic products manufacturing), a director of Weichai Group Holdings Limited and chairman of Power Solutions International Inc. (cleantech engine and powertrain manufacturing). Previously, Mr. Sun was supervisor and chief engineer at Weifang Diesel Engine Factory (diesel engine manufacturing) and director of Torch Automobile Group Co., Ltd. (heavy machinery and automotive manufacturing). He holds doctorate degree in engineering.
Board and Committee Membership
Attendance
Other Public Board Memberships
Board - - Current: Weichai Power Co., Ltd.; Power Solutions International Inc.; Weichai Heavy-duty Machinery Co., Ltd Previous: none
Securities Held(2)
Year Shares DSUs Total of Shares and DSUs
Value of Shares and DSUs (CDN$)(3)
Director Share Ownership
Guidelines(5)
2019 0 0 0 0 N/A
2018 - - - - -
Ian Sutcliffe
Age: 66 Ontario, Canada Director since: 2013
Independent
Mr. Sutcliffe’s principal occupation is corporate director. Mr. Sutcliffe has been a partner at Sutcliffe & Associates Management Consultants (management consulting services) since June 1985. Previously, Mr. Sutcliffe was Executive Chair of PureFacts Financial Solutions (financial software services) from May 2013 to November 2016. Prior to that, he was co-CEO of PHeMI, Inc. (medical software and IT infrastructure) form July 2010 to November 2012; CEO, Chairman and independent director of BluePoint Data (IT services) from Sept 2001 to June 2011; and Vice Chair and CEO of BCS Global Networks Inc. (video conferencing services) from January 2003 to March 2004. Mr. Sutcliffe was independent director, IBM Canada Limited (IT service management) from 1998 to 2001. Mr. Sutcliffe was President of Mediconsult.com, Inc. (internet health services) from June 1995 to June 1999 and President and CEO from 1999 to 2001.
Board and Committee Membership
Attendance
Other Public Board Memberships
Board Audit Corporate Governance & Compensation
12 6 6
100% 100% 100%
Current: none Previous: BluePoint Data Inc.(1); BCS Global Networks Inc.
Securities Held(2)
Year Shares DSUs Total of Shares and DSUs
Value of Shares and DSUs (CDN$)(3)
Director Share Ownership Guidelines
2019 10,000 90,495 100,495 $469,312 On track
2018 10,000 78,665 88,665 $385,693 On track
Janet Woodruff
Age: 62 B.C., Canada Director since: 2017
Independent
Ms. Woodruff’s principal occupation is corporate director. Previously, Ms. Woodruff served as acting CEO to the Transportation Investment Corporation (transportation infrastructure management) from 2014 to 2105, advisor to the board (2013-2014) and interim Chief Financial Officer (2012-2013). Prior to that, she was Vice President and Special Advisor to BC Hydro (public utility) from 2010 to 2011; Interim President (2009-2010) and Vice President, Corporate Services and Chief Financial Officer (2007-2008) of BC Transmission Corporation (electricity transmission infrastructure); and Chief Financial Officer and Vice President, Systems Development and Performance of Vancouver Coastal Health from 2003 to 2007.
Board and Committee Membership Attendance Other Public Board Memberships
Board Audit Corporate Governance & Compensation
12 6 6
100% 100% 100%
Current(7): Keyera Corporation; Altus Group Limited; Capstone Infrastructure Corporation; FortisBC Energy Inc. and FortisBC Inc. Previous: Nordion Inc. (formerly MDS Inc.); Pacific Northern Gas
Securities Held(2)
Year Shares DSUs Total of Shares and DSUs
Value of Shares and DSUs (CDN$)(3)
Director Share Ownership Guidelines
2019 0 22,739 22,739 $106,191 On track
2018 0 9,404 9,404 $40,907 On track
13

(1) Canadian securities legislation requires disclosure of any company that becomes insolvent while a director is a member of its board, or within
one year from ceasing to act as a director. In this regard, Mr. Roche was Chair of Aonix Advanced Materials Corp. (a private company) when a bankruptcy order was issued against it under the Bankruptcy and Insolvency Act (Canada) on October 13, 2017. Mr. Hayhurst was a director of Catalyst Paper Corporation, which sought an Initial Order under the Companies’ Creditors Arrangement Act on January 31, 2012. Mr. Ian Sutcliffe was a director of BluePoint Data Inc. on May 12, 2012 when the British Columbia Securities Commission issued a cease trade order against it for failure to file its financial statements and management’s discussion and analysis related thereto for the year ended December 31, 2011. Mr. Sutcliffe resigned as a director on June 27, 2012, subsequent to which BluePoint sold its business and distributed the proceeds to its shareholders.
(2) As of April 8, 2019 and April 9, 2018, respectively. The number of Shares shown as being held by each nominee constitute the number beneficially owned, or controlled or directed, directly or indirectly, by that nominee and such information has been provided to us by that nominee.
(3) Based on a CDN$4.67 and CDN$4.35 closing Share price on the TSX as of April 8, 2019 and April 9, 2018, respectively. (4) Mr. Jiang and Mr. Sun are not independent under NASDAQ corporate governance rules and guidelines for the purposes of serving on the Audit
Committee. (5) Management directors and directors who are shareholder nominees appointed pursuant to agreements with the Corporation are not subject to
director share ownership guidelines. As President and CEO, Mr. MacEwen is subject to executive share ownership guidelines: see “Share Ownership Guidelines and Share Trading Policy” on page 38 and following for more details.
(6) As President and CEO, Mr. MacEwen also holds PSUs and Options. See the Executive Compensation Tables on page 40 and following for more details.
(7) Fortis BC Inc. and Fortis BC Energy Inc. are both wholly owned subsidiaries of Fortis Inc., but which have public debt securities outstanding. Capstone Infrastructure Corporation is a wholly owned subsidiary of Irving Infrastructure Corp., but which has preferred shares which are publicly traded on the TSX.
APPOINTMENT OF AUDITORS
Our Audit Committee has recommended that KPMG LLP, Chartered Accountants, of 777 Dunsmuir Street, Vancouver, British Columbia, be nominated at the Meeting for re-appointment as our external auditors. Our Audit Committee will fix the remuneration of our external auditors if authorized to do so by Shareholders at the Meeting. It is expected that representatives of KPMG LLP will be present at the Meeting. KPMG LLP were appointed as our external auditors in 1999. We comply with the requirement regarding the rotation of our audit engagement partner every five years. The current audit engagement partner at KPMG LLP may continue in his role until the end of 2021.
The following table shows the total fees we incurred with KPMG LLP in 2018 and 2017:
Type of Audit Fees 2018 (CDN$)
2017 (CDN$)
Audit Fees $516,800 $543,000
Audit-Related Fees Nil Nil
Tax Fees $18,000 Nil
All Other Fees Nil Nil
For a more detailed description of the Audit Committee or to see the Audit Committee’s mandate, a copy of which is posted on our website (www.ballard.com), see the section entitled "Audit Committee Matters" in our Annual Information Form dated March 7, 2019, which section is incorporated by reference into this Management Proxy Circular.
ADVISORY VOTE ON APPROACH TO EXECUTIVE COMPENSATION
The Corporate Governance & Compensation Committee ("CGCC") monitors developments and trends relating to best practices on corporate governance and executive compensation, including relating to “say-on-pay” in Canada and in the United States. In the United States, the SEC has established “say-on-pay” advisory shareholder vote requirements for certain issuers. Although the Corporation’s shares are traded on NASDAQ, Ballard is a “foreign private issuer” under applicable SEC rules and, accordingly, these requirements do not apply to the Corporation. Although “say-on-pay” shareholder votes have yet to be mandated in Canada, a number of larger issuers in Canada have voluntarily implemented such advisory votes. Ballard has also voluntarily implemented “say on pay” advisory votes. At the request of the Board,
14

our Shareholders have passed resolutions, on an advisory basis, accepting the Corporation’s approach to executive compensation since 2011.
Over the past three years, the CGCC has continued to review and refine our executive compensation philosophy, executive compensation programs and executive compensation disclosure. In 2016, we revised our approach to executive compensation disclosure to make the disclosure clearer, more transparent and more communicative. We believe these efforts, along with improved corporate financial performance, led to an increase in our votes for our Say on Pay resolution, which passed by over 90% in each of 2017 and 2018, as compared to 72.5% in 2016.
The CGCC recommended to the Board that Ballard Shareholders again be provided the opportunity, on an advisory basis, to vote at the Meeting in respect of the Corporation’s approach to executive compensation. The CGCC also recommended that adoption by the Board of a formal “say-on-pay” policy should continue to be deferred until applicable Canadian securities regulatory authorities have set out the regulatory requirements applicable to the Corporation.
Accordingly, the Shareholders of the Corporation are able to vote at this Meeting, on an advisory and non-binding basis, “FOR” or “AGAINST” the Corporation’s current approach to executive compensation through the following resolution:
“RESOLVED, on an advisory basis and not to diminish the role and responsibilities of the Board of Directors of the Corporation, that the Shareholders accept the approach to executive compensation disclosed in the Corporation’s management proxy circular delivered in advance of the Corporation’s 2019 annual meeting of Shareholders.”
The Board believes that Shareholders should be well informed about and fully understand the objectives, philosophy and principles that it has used to make executive compensation decisions. For information regarding Ballard’s approach to executive compensation, Shareholders should review the section entitled "Executive Compensation – Compensation Discussion and Analysis" appearing below in this Management Proxy Circular.
Approval of the above resolution will require an affirmative vote of a majority of the votes cast on the matter at the Meeting. Abstentions will have no effect and will not be counted as votes cast on the resolution. As the vote on this resolution is advisory, the results will not be binding on the Board or the CGCC. However, the Board and the CGCC will take the results of the advisory vote into account, as appropriate, as part of their ongoing review of the Corporation’s executive compensation objectives, philosophy, principles, policies and programs.
CORPORATE GOVERNANCE
Our Board and senior management consider good corporate governance to be central to our effective and efficient operation. We monitor corporate governance initiatives as they develop and benchmark industry practices to ensure that we are in compliance with applicable corporate governance rules.
Our corporate governance practices are reflected in our Corporate Governance Policies, which provides for board composition and director qualification standards, tenure and term limits, director responsibilities, the form and amount of director compensation, director orientation and continuing education, management succession planning and performance evaluation of the Board. A copy of our Corporate Governance Policies can be found on our website (http://ballard.com/investors/governance). We have also reviewed our internal control and disclosure procedures, and are satisfied that they are sufficient to enable our Chief Executive Officer and Chief Financial Officer to certify our interim and annual financial reports filed with Canadian securities regulatory authorities, and to certify our annual financial reports filed with the SEC.
In addition, we have set up a process for Shareholders to communicate to the Board, the details of which can be found on our website. A summary of shareholder feedback is provided to the Board through a quarterly report.
We believe that we comply with all applicable Canadian securities administrators (“CSA”) and NASDAQ corporate governance rules and guidelines. The CSA requires that listed corporations subject to National
15

Instrument 58-101 - Disclosure of Corporate Governance Practices ("NI 58-101") disclose their policies respecting corporate governance. We comply with NI 58-101, which addresses matters such as the constitution and independence of corporate boards, the functions to be performed by boards and their committees, and the effectiveness and education of board members. We are exempt from the NASDAQ corporate governance rule requiring that each NASDAQ quoted company has in place a minimum quorum requirement for shareholder meetings of 33 1/3% of the outstanding shares of the company’s voting common stock. Our by-laws currently provide that a quorum is met if holders of at least 25% of the votes eligible to be cast at a Shareholders’ meeting are present or represented by proxy at the meeting.
BOARD COMPOSITION AND NOMINATION PROCESS
All of our directors are independent except for Randall MacEwen, our President and Chief Executive Officer. "Independence" is judged in accordance with the provisions of the United States Sarbanes-Oxley Act of 2002 ("Sarbanes-Oxley"), and as determined by the CSA and the NASDAQ. Mr. Jiang and Mr. Sun, as Weichai nominees, are not considered independent under NASDAQ rules for the purposes of serving on the Audit Committee. We conduct an annual review of the other corporate boards on which our directors sit, and have determined that currently there are no board interlocks with respect to our directors. The Board has also established a guideline for the maximum number of public company boards on which a director should sit. In 2019, this guideline was set at no more than five public company boards, including the Corporation's Board; and for directors who are CEOs (or hold similar positions), no more than two public company boards in addition to his/her own company’s board. In calculating service on public company boards, service on a board of a company affiliated with the director’s employer is not included. Currently all of our board members comply with this guideline.
The Board believes that its membership should be composed of highly qualified directors with diverse and complementary backgrounds, skills sets and experience bases and who demonstrate integrity and suitability for overseeing management. The CGCC and the Board have determined that the criteria to be considered when selecting directors and recommending their election by the Shareholders include the following:
a) Direct experience in leading a business as a CEO or other senior executive
b) Strategy development experience
c) Sales/Marketing experience
d) Finance/Accounting experience & education
e) Product development experience
f) Corporate governance experience & education
g) Early-Stage business commercialization experience
h) CleanTech sector knowledge
i) Asian market experience
In addition to these criteria, we also take into consideration other industry and business factors in determining the composition of our Board.
Our CGCC conducts an annual process under which an assessment is made of the skills, expertise and competencies of the directors and is compared to our needs and the needs of the Board. This process culminates in a recommendation to the Board of individual nominee directors for election at our annual Shareholders’ meeting. To this end, the CGCC will, when identifying candidates to recommend for appointment or election to the Board:
a) consider only candidates who are highly qualified based on their relevant experience, expertise, perspectives, and personal skills and qualities, and cultural fit;
b) consider diversity criteria including gender, age, ethnicity and geographic background; and
16

c) in addition to its own search, as and when appropriate from time to time, engage qualified independent external advisors to conduct a search for candidates who meet the Board’s expertise, skills and diversity criteria.
Currently, we have two women serving on our board, a representation of 22%. As part of its approach to Board diversity, the Board has not established specific targets for any diversity criteria at this time. The CGCC will assess the effectiveness of this approach annually and recommend amendments to the Board, including the possible adoption of measurable objectives for achieving Board diversity, as appropriate. The Corporation is a member of the Canadian chapter of the 30% Club, a group whose aspirational goal is for 30% of board seats and C-Suites to be held by women by 2022.
The following table identifies some of the current skills and other factors considered as part of the competency matrix developed by the CGCC. Each director was asked to indicate the top three competencies which he/she believes they possess.
Douglas P. Hayhurst
Kevin Jiang
Duy-Loan Le
R. Randall MacEwen
Marty Neese
James Roche
Sherman Sun
Ian Sutcliffe
Janet Woodruff
President/CEO Experience
Strategy
Sales/ Marketing
Finance/ Accounting
Product Development
Corporate Governance
Early Stage Business
Commercial-ization
Clean Technology
Asian Markets
TENURE AND TERM LIMITS
Directors are elected yearly at our annual Shareholders’ meeting and serve on the Board until the following annual Shareholders’ meeting, at which time they either stand for re-election or leave the Board. If no meeting is held, each director serves until his or her successor is elected or appointed, unless the director resigns earlier.
Independent directors are expected to serve on at least one Committee of the Board. The CGCC and Audit Committee are tasked with ensuring a rotation of Committee members and Chairs to broaden the experience and skills of each member of the Board, and ensure an appropriate mix of experience and expertise in respect of the various roles of the Board and its committees. A director may only serve on the Board for a maximum of 15 consecutive years. These provisions do not apply to the President & Chief Executive Officer in his/her role as a Board member.
DIRECTOR SHARE OWNERSHIP GUIDELINES
We have minimum share ownership guidelines that apply to our directors, other than management directors (Mr. MacEwen, who is subject to such guidelines for our executive officers) and directors who are shareholder nominees appointed pursuant to agreements with the Corporation (Mr. Jiang and Mr. Sun).
17

All other directors are required to hold at least the number of Ballard Shares that has a value equivalent to three times the director’s annual retainer. Directors have six years from the date that they are first elected to the Board to comply with this minimum share ownership guideline. In determining whether a director is in compliance with the minimum share ownership guidelines, any DSUs that a director receives as payment for all or part of their annual retainer will be credited towards calculating achievement of the minimum share ownership requirements.
The value of Shares and DSUs held by directors will be measured on or about December 31st of each year based on the purchase price actually paid by the director for such Shares, or the value of DSUs or Shares received by the director when issued to him or her by the Corporation, as applicable.
Any director who fails to comply with the share ownership guideline will not be eligible to stand for re-election. Currently, all of our directors have met or are on track to achieve these guidelines, as applicable.
BOARD MEETINGS
The Board meets on a regularly scheduled basis and directors are kept informed of our operations at meetings of the Board and its committees, and through reports by and discussions with management. In 2018, in camera sessions, chaired by the Chair of the Board, were held after each regularly scheduled Board meeting involving all of the independent directors without the presence of management. In addition, communications between the directors and management occur apart from regularly scheduled Board and committee meetings. The Board has set a minimum meeting attendance guideline of 75%. Non-compliance with this guideline by a director is one of the factors considered in his or her individual performance evaluation at the end of the year.
ROLES AND RESPONSIBILITIES
The Board operates under a formal mandate (a copy of which is attached as Appendix "A" and is posted on our website (http://ballard.com/investors/governance)), which sets out its duties and responsibilities, including matters such as corporate strategy, fiscal management and reporting, selection of management, legal and regulatory compliance, risk management, external communications and performance evaluation. The Board has also established terms of reference for the Board Chair and for individual directors (copies of which are also posted on our website), which set out the directors’ individual responsibilities and duties. Terms of reference are also established for the CEO. These terms of reference and our Corporate Governance Policies serve as a code of conduct with which each director is expected to comply, and address matters such as conflicts of interest, the duties and standard of care of directors, the level of availability expected of directors, requirements for maximizing the effectiveness of Board and committee meetings, and considerations that directors are to keep in mind in order to make effective and informed decisions.
In addition, we have a Board-approved Code of Ethics, which applies to all members of the Board, as well as our officers and employees. A copy of the Code of Ethics can be found on our website (http://ballard.com/investors/governance). This document is reviewed annually and updated or revised as necessary. Annually, all employees in Sales & Marketing, Finance & Administration, Supply Chain, Customer Service and Quality, and all management employees and officers, are required to formally acknowledge they have read, reviewed and comply with the Code of Ethics. A compliance report is then presented to the Audit Committee and Board.
The Chair of the Board is responsible for ensuring the appropriate organization, content and flow of information to the Board and that all concerns of the directors are addressed. The Chair of the Board reviews and sets the agenda for each Board meeting. The Chair of the Board is also responsible for organizing and setting the frequency of Board meetings and ensuring that Board meetings are conducted efficiently. The Chair of the Board is an independent director.
Each year, the Board identifies a list of focus priorities for the Board during the year. The CGCC regularly monitors the Board’s progress against these priorities throughout the year.
18
BOARD ORIENTATION AND EDUCATION
We have established a formal director orientation and ongoing education program. Upon joining our Board, each director receives an orientation regarding our business. Such orientation includes site visits to our manufacturing facilities, presentations regarding our business, technology and products, and a manual that contains various reference documents and information. Continuing education is offered by way of ongoing circulation of informative materials aimed at topical subject matters, material industry developments, and management presentations at Board meetings, as well as guest speakers who are invited to speak to our Board on various topics. From time to time we have invited guest speakers to speak to our Board about the fuel cell industry, government regulation, regional markets, capital markets, corporate governance and risk management, and internal management representatives to speak about various issues, including relating to our industry, business, strategy, markets, customers, projects, technology, products, services, operations, employee relations, investor relations and risks. The orientation and ongoing educational presentations that are made by internal management provide an opportunity for Board members to meet and interact with members of our management team.
In October 2018, the Board and senior management travelled to China for meetings, presentations and site visits with representatives of Weichai Power Co., Ltd, to visit their facilities and discuss the strategic collaboration with them.
SHAREHOLDER FEEDBACK AND COMMUNICATION
We have an e-mail process for Shareholders to communicate with the Board, through the Chair of the Board. Shareholders who wish to send a message to the Chair of the Board can find the email address on our website (http://ballard.com/contact-us). In addition, a summary of shareholder feedback that is received by us is provided to the Board through a quarterly report.
BOARD AND DIRECTOR PERFORMANCE EVALUATIONS
Each year, the Board conducts an evaluation and review of its performance during the past year. The evaluation is conducted through a process determined from time to time by the CGCC which elicits responses from individual directors on a confidential basis regarding performance of the Board and individual directors. The process may include the completion of a questionnaire by all of the directors as well as individual director self-evaluations and peer evaluations. The CGCC presents the summary results to the full Board, which then determines appropriate actions and changes to improve Board effectiveness.
COMMITTEES OF THE BOARD
The Board currently has three standing committees: (1) the Audit Committee; (2) the Corporate Governance & Compensation Committee (CGCC); and (3) the Commercial Committee. The Commercial Committee was established in 2019.
Each committee has been delegated certain responsibilities, performs certain advisory functions and either makes certain decisions or makes recommendations to the Board. Each committee chair reports on the activities of the committee to the Board following each committee meeting. The members of these committees are all independent. Given a number of considerations including: the size and composition of the Board; considerations relating to the efficiency and effectiveness of the Board and committees; and the flat retainer fee structure used for compensating the Board, the Audit Committee and CGCC were represented by all directors other than the CEO in 2018. In 2019, with the addition of the Weichai nominees, Mr. Jiang and Mr. Sun, and the establishment of the Commercial Committee, the board revaluated committee memberships.
19

The following chart sets out the current members of our standing committees:
Audit Committee
Corporate Governance & Compensation
Committee Commercial Committee
Douglas P. Hayhurst (Chair)
Kevin Jiang1
Duy-Loan Le
Marty Neese (Chair)
James Roche 2
2 2
Sherman Sun3
Ian Sutcliffe
Janet Woodruff (Chair) 1 Mr. Jiang joined the board on January 1, 2019. 2 As Chair of the Board Mr. Roche is an ex officio member of each of the committees and is entitled to vote at meetings. 3 Mr. Sun joined the board on January 1, 2019.
After the Meeting, we will reconstitute all of the standing committees to reflect the newly elected Board.
Audit Committee
The Audit Committee is responsible for assisting the Board in fulfilling its oversight responsibilities regarding the integrity of the Corporation’s accounting and financial reporting; the Corporation’s systems of internal controls over financial reporting; the independence and performance of the Corporation’s external and internal auditors; the identification and management of the Corporation’s risks; the Corporation’s whistleblower reporting processes; the Corporation’s financial policies; and the review and approval of related party transactions.
The Audit Committee met six (6) times during 2018. The Audit Committee is constituted in accordance with SEC rules, applicable Canadian securities laws and applicable NASDAQ rules, and assists the Board in fulfilling its responsibilities by reviewing financial information, the systems of corporate controls and the audit process. The Audit Committee has at least two members, Douglas P. Hayhurst and Janet Woodruff, who qualify as audit committee financial experts under applicable securities regulations. All of the members of the Audit Committee are independent directors in accordance with the applicable Canadian and United States securities laws and exchange requirements and are financially literate.
The Audit Committee is responsible for recommending the appointment of our external auditors (for Shareholder approval at our annual general meeting), monitoring the external auditors’ qualifications and independence, and determining the appropriate level of remuneration for the external auditors. The external auditors report directly to the Audit Committee. The Audit Committee also approves in advance, on a case-by-case basis, any services to be provided by the external auditors that are not related to the audit. The Audit Committee is also responsible for the appointment of our internal auditors (or persons responsible for the function), and directing, monitoring and providing guidance to the internal audit function and review the performance of the internal auditor at least annually.
The external auditors report directly to the Audit Committee. The Audit Committee is responsible for evaluating the effectiveness of the external audit and the external auditors and annually conducts a formal audit effectiveness assessment to drive continuous improvement in the external audit. The Audit Committee, in coordination with Management and KPMG, continues to participate in the Canadian Public Accountability Board’s audit quality indicators project. The project is aimed at improving audit quality through the use of quantitative measures to evaluate audit quality. Using the year-end audit quality indicators report, the Audit
20

Committee will evaluate how to best integrate the indicators into its regular processes and into the external audit.
In addition, the Audit Committee is mandated to review all financial disclosure contained in prospectuses, annual reports, annual information forms, management proxy circulars and other similar documents. The Audit Committee reviews and approves, in advance, related party transactions (including transactions and agreements in respect of which a director or executive officer has a material interest) on a case-by-case basis.
For a more detailed description of the Audit Committee or to see the Audit Committee’s mandate, see the section entitled "Audit Committee Matters" in our Annual Information Form dated March 7, 2019, which section is incorporated by reference into this Management Proxy Circular. A copy of the Audit Committee’s mandate is also posted on our website (http://ballard.com/investors/governance).
Corporate Governance & Compensation Committee
The CGCC met six (6) times during 2018. Collectively, the CCGC members have extensive compensation-related experience as senior executives (past and present) and members of the board of directors and committees of other public and private corporations. The Board is confident that the CCGC collectively has the knowledge, experience and background to carry out the Committee’s mandate effectively and to make executive compensation decisions in the best interests of the Corporation and its Shareholders.
The CGCC is responsible for the following:
recommending the size of the Board and the formation and membership of committees of the Board;
review and approval of all director nominations to the Board; determining director compensation; maintaining an ongoing education program for Board members; ensuring a formal process exists to evaluate the performance of the Board, Board committees,
individual directors, and the Chair of the Board, and ensuring that appropriate actions are taken, based on the results of the evaluation, to improve the effectiveness of the Board;
conducting succession planning for the Board; and monitoring corporate governance and making recommendations to enable the Board to comply
with best corporate governance practices in Canada and the United States.
The CGCC is also responsible for:
considering and authorizing the terms of employment and compensation of executive officers and providing advice on organizational and compensation structures in the various jurisdictions in which we operate;
reviewing and setting the minimum share ownership requirement for directors and executive officers;
reviewing all distributions under our equity-based compensation plans, and reviewing and approving the design and structure of, and any amendments to, those plans;
ensuring appropriate CEO and senior management succession planning, recruitment, development, training and evaluation; and
annually reviewing the performance objectives of our CEO and conducting his annual performance evaluation.
The CGCC has the authority to appoint compensation consultants, determine their level of remuneration, and oversee and terminate their services. Such consultants report directly to the CGCC.
The CGCC does not have a written policy regarding succession planning or recruitment of executive officers. However, the CGCC takes the same approach when identifying candidates for executive officers that it takes in respect of director candidates. The CGCC will, when identifying executive officer candidates:
21

a) consider only candidates who are highly qualified based on their experience, expertise, perspectives, and personal skills and qualities; and
b) consider diversity criteria including gender, age, ethnicity and geographic background.
The CGCC has not established targets for any diversity criteria for executive officers at this time. The CGCC and Board annually review executive succession plans and emerging leadership candidates, including a review of demographic information to ensure the correct focus on diversity. Individual development plans are established by management, including those for female leaders, and the Corporation has sponsored and supported participation in activities including the Minerva “Women in” annual luncheon series and Board-led career discussions. As of the Record Date, the corporation has two women executive officers.
A copy of the CGCC’s mandate is posted on our website (http://ballard.com/investors/governance). The mandate is reviewed annually and the CGCC’s performance is assessed annually through a process overseen by the Board.
Commercial Committee
Following the investment by Weichai in the Corporation in late 2018, and the appointment of two Weichai nominees to the Board in early 2019, the Board established the Commercial Committee to oversee the management of the Corporation's business and affairs relating to certain existing or prospective key partners (which may include customers, suppliers, contract manufacturers, joint venture or other strategic partners) and commercially sensitive and/or proprietary information.
Members of the Commercial Committee must not, in the opinion of the Board: (i) have a direct or indirect material relationship with any key partner of the Corporation; or (ii) have a relationship with a key partner that could reasonably be expected to compromise any commercially sensitive and/or proprietary information of any other key partners or of the Corporation.
A copy of the Commercial Committee’s mandate is posted on our website (http://ballard.com/investors/governance).
22

EXECUTIVE COMPENSATION
COMPENSATION DISCUSSION AND ANALYSIS
This section discusses the elements of compensation earned by our "Named Executive Officers" (or “NEOs”) as of December 31, 2018:
Randall MacEwen
President and Chief Executive Officer
Anthony Guglielmin
Vice President and Chief Financial
Officer
Robert Campbell
Vice President and Chief Commercial
Officer
Kevin Colbow
Vice President, Technology &
Product Development
David Whyte
Vice President, Operations
INTRODUCTION
The Corporation puts a considerable amount of effort into the development, and ongoing monitoring and management, of our executive compensation plan. This includes monitoring of industry best-practices, benchmarking against relevant comparators inside and outside the fuel cell industry sector, and the involvement of expert third parties to provide independent advice. We also solicit investor feedback on our executive compensation approach by providing an advisory “Say on Pay” vote, which we introduced in 2011.
Executive Compensation Program Highlights
Ballard’s executive compensation program is designed to attract the skillsets and experience needed to lead the development and execution of the Corporation’s strategy, to incent and reward executives appropriately for performance and risk management, and to incent retention and align executive compensation with long-term shareholder value. Our executive compensation program is comprised of the following elements:
Annual Base Salary – set to reflect the size and scope of the role, as well as individual experience and performance, and market competitiveness;
Annual Performance Bonus – expressed as a percentage of annual base salary and typically paid in cash (or a combination of cash and Deferred Share Units), annual performance bonus is determined based on achievement levels against a weighted mix of annual corporate performance goals and individual performance goals, both quantitative and qualitative – at the Board’s discretion;
Long-Term Incentive
o Performance Share Units (PSUs) – performance-based PSUs are typically awarded annually as a percentage of annual base salary, with equal thirds earned over three years, subject to the achievement of defined corporate performance objectives; PSUs are aligned with shareholder interests as vesting is dependent on corporate performance, retention over three years, and the realizable value of PSUs partly depends on our share price after vesting. In limited circumstances, such as new hire grants, PSUs may be awarded that are subject to time vesting only, typically over three years; these one-time awards are aligned with shareholder interests as the realizable value depends on our share price after vesting. For awards made in 2016 and after, we determined that PSU grants will vest after three years.
o Stock Options – stock options are awarded annually, vest over three years and have a seven year term; stock options are aligned with shareholder interests as their realizable value depends on growth in our share price.
With these compensation elements, a significant proportion of compensation is put “at risk” (for NEOs, from 53% to 70% of total compensation), since it depends on successful performance and growth in Ballard’s share price – both of which effectively align executive compensation with shareholder interests.
To further align with the shareholder experience, our executive officers are required to comply with minimum share ownership requirements. Specifically, executive officers are required to hold between 100%
23

and 300% of their individual base salary in Shares or DSUs, depending on their level within the Corporation. They have 5 years in which to meet this minimum share ownership requirement.
In setting, monitoring and managing executive compensation the Corporation ensures careful consideration of the relevant factors impacting each element of the plan through a rigorous process, with appropriate oversight designed to pay appropriate short- and long-term incentive amounts that are strongly aligned with the creation of long-term value for shareholders.
In recruiting our CEO in October 2014, we were mindful to adopt best practices, including claw-back provisions, and provisions dealing with termination and change of control, as well as to align the total compensation package at a level appropriate for the Corporation’s size and stage of development.
Significant Recent Program Changes
Executive Claw-Back Provisions
As of 2017, all Named Executive Officers agreed to the following claw-back provision:
Where there is a restatement of the financial results of the Corporation for any reason other than a restatement caused by a change in applicable accounting rules or interpretations, and, in connection with such restatement a senior officer engaged in gross negligence, fraud or willful misconduct, the Board may: (a) require that a senior officer return or repay to the Corporation, or reimburse the Corporation for, all or part of the after-tax portion of any excess compensation; and/or (b) cause all or part of any awarded and unpaid or unexercised performance-based compensation (whether vested or unvested) that constitutes excess compensation for a senior officer to be cancelled.
Executive Compensation Review
In 2017, the CGCC engaged with Willis Towers Watson in order to conduct a competitive review of the compensation structure for the executive team, including, base salary, performance bonus incentive, target total cash (salary and target bonus), long-term incentive awards and total direct compensation (including theoretical value of long-term incentives). Data was sourced by Willis Towers Watson from a comparator group (updated list disclosed below) and Willis Towers Watson’s General Industry Executive Compensation Survey. As a result of this review, certain structural changes and compensation values were made to the Corporation’s executive compensation program in 2017 to strengthen the Corporation’s executive compensation program, better align the program with current practices, standardize certain program components, and adjust compensation based on the peer group data.
In 2018 two changes were implemented relating to the structure and calculation of executive short term incentive bonuses. The first is that the weighting between corporate and individual performance changed from 50% corporate and 50% individual performance weighting to 70% corporate and 30% individual. The second is that the bonus calculation would be determined by adding the corporate and individual scores together rather than multiplying them, as previously used. The new method puts greater emphasis on achievement of corporate objectives and provides a stronger alignment with teamwork.
Context of Our Executive Compensation Practices
There are a number of industry and business factors that present challenges to creating and implementing an effective executive compensation program, including the following:
Despite our lengthy history, we are a pre-profit, publicly-listed company developing and commercializing new technology, products and services that are highly disruptive in our markets and disruptive to incumbent markets.
Our business is complex and volatile:
o We have a relatively complex business model for a company with our revenue base. Our business activities include technology and product development, commercialization of new
24

products in global markets, manufacturing operations, engineering services, sales and marketing for various market applications, and after-sales service support. We have operations and offices in Canada, the United States, Denmark, and China; and an international sales and service team. Many of our customers and markets are outside North America, which creates a degree of complexity, and requiring us to recruit executives with wider skills and international experience than may be the case for many companies our size.
o Setting longer-term performance targets in an early-stage business with significant volatility and market risks is particularly challenging. The CGCC seeks to balance setting concrete, challenging performance targets that reflect genuine progress in the business consistent with our strategy, which are also reasonably achievable and capable of dealing with the volatility and complexity of our business.
While we may be considered an industrial products company, we also compete for talent in the technology industry, where there is a higher emphasis on equity to compensate key employees than general industry.
We use equity incentives as a way to compete for talent with larger companies while conserving our shareholders’ cash for investment in our business.
Many of our competitors are headquartered in the United States and are subject to different market conditions relating to executive compensation than typical Canadian-headquartered companies.
Our head office is located in Burnaby, British Columbia, which is a suburb of Vancouver. The Greater Vancouver Area has increasingly become a relatively high cost of living area.
The CGCC seeks to balance these factors, the expectations of our shareholders and the highest standards of governance. As our business becomes more robust and predictable through the execution of our strategy, the CGCC intends to continue to align compensation more predictably to performance, for example, through the use of performance metrics that demonstrate and measure our performance relative to peer group companies.
Highlights of our Executive Compensation Philosophy
Our compensation philosophy focuses on creating shareholder value, paying for performance and effective risk management. Our objective is to pay competitively in the markets in which we compete for talent, while also aligning compensation with value created for shareholders.
25
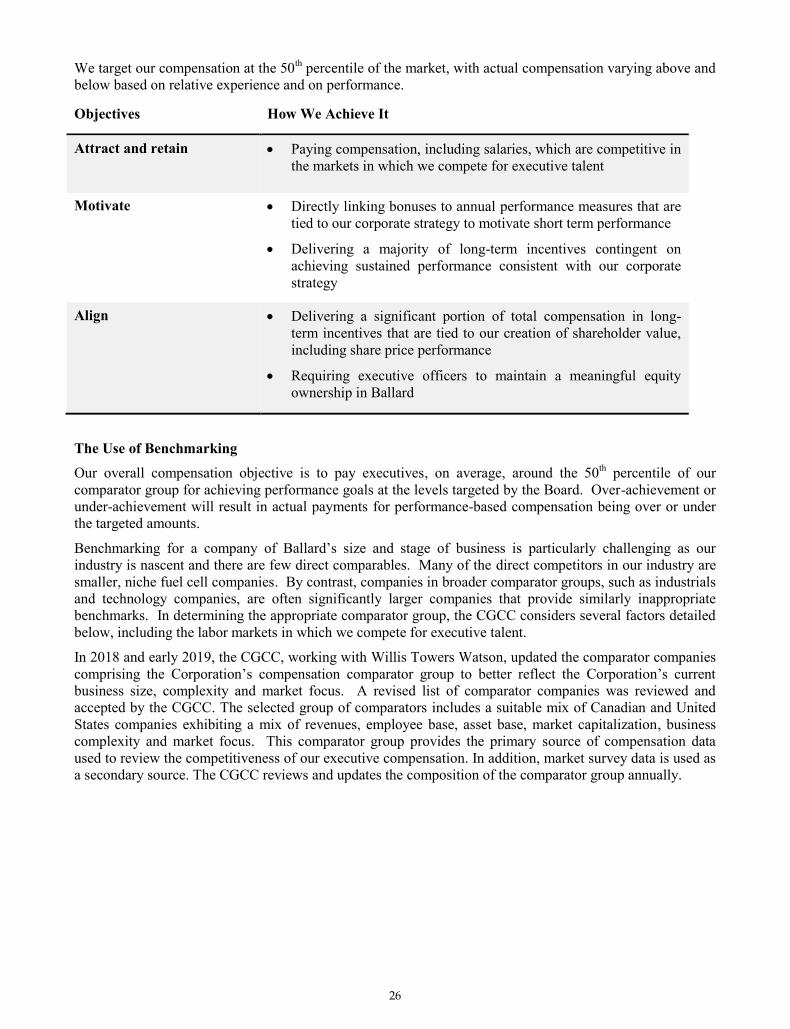
We target our compensation at the 50th percentile of the market, with actual compensation varying above and below based on relative experience and on performance.
Objectives How We Achieve It
Attract and retain
Paying compensation, including salaries, which are competitive in
the markets in which we compete for executive talent
Motivate Directly linking bonuses to annual performance measures that are tied to our corporate strategy to motivate short term performance
Delivering a majority of long-term incentives contingent on achieving sustained performance consistent with our corporate strategy
Align
Delivering a significant portion of total compensation in long-
term incentives that are tied to our creation of shareholder value, including share price performance
Requiring executive officers to maintain a meaningful equity ownership in Ballard
The Use of Benchmarking
Our overall compensation objective is to pay executives, on average, around the 50th percentile of our comparator group for achieving performance goals at the levels targeted by the Board. Over-achievement or under-achievement will result in actual payments for performance-based compensation being over or under the targeted amounts.
Benchmarking for a company of Ballard’s size and stage of business is particularly challenging as our industry is nascent and there are few direct comparables. Many of the direct competitors in our industry are smaller, niche fuel cell companies. By contrast, companies in broader comparator groups, such as industrials and technology companies, are often significantly larger companies that provide similarly inappropriate benchmarks. In determining the appropriate comparator group, the CGCC considers several factors detailed below, including the labor markets in which we compete for executive talent.
In 2018 and early 2019, the CGCC, working with Willis Towers Watson, updated the comparator companies comprising the Corporation’s compensation comparator group to better reflect the Corporation’s current business size, complexity and market focus. A revised list of comparator companies was reviewed and accepted by the CGCC. The selected group of comparators includes a suitable mix of Canadian and United States companies exhibiting a mix of revenues, employee base, asset base, market capitalization, business complexity and market focus. This comparator group provides the primary source of compensation data used to review the competitiveness of our executive compensation. In addition, market survey data is used as a secondary source. The CGCC reviews and updates the composition of the comparator group annually.
26

Our current comparator group is:
Canada (5) United States (8)
Calian Group Ltd. AeroVironment Inc.
EXFO Inc. Allied Motion Technologies Inc.
Hydrogenics Corp. American Superconductor Corporation
Sierra Wireless Inc. Capstone Turbine Corporation
Westport Fuel Systems Fuel Cell Energy Inc.
Plug Power Inc.
Maxwell Technologies, Inc.
Ultralife Corporation
The CGCC compares each executive officer’s annual salary, target annual incentive bonus and long-term incentive compensation value, both separately and in the aggregate, to amounts paid for similar positions at comparator group companies.
Market Analysis
In 2017, Willis Towers Watson conducted a review and assessed the market competitiveness of the compensation arrangements for Ballard’s executive team against the comparator group of companies in similar industries, considering the market data in nominal dollars (US$ = CDN$) for target total direct compensation (salary + target bonus + long-term incentives). Based on this review, the CGCC implemented the compensation structure outlined below.
Compensation Framework for 2018
The compensation program for our executive officers has five primary components that deliver pay over the short- and long-term:
Element Features 2018 Performance Measures
Base Salary Set to reflect market conditions and the size and scope of the role, internal alignment, as well as individual experience and performance
N/A
Annual Bonus
Paid annually in cash or DSUs Each executive has a specified target bonus
expressed as a percentage of his or her base salary Actual bonuses based on Corporate and Individual
performance multipliers that range from 0% - 150% of target based on Corporate and Individual performance
Outcomes are formula-driven subject to the Board’s overarching discretion
Corporate Quantitative (60%) Revenue Gross margin $ Cash flow from operations Qualitative (40%) Achieving Key Milestones
for Stack and Module Development
Signing Major Strategic Agreement
27

Element Features 2018 Performance Measures
Long-Term Incentive:
Performance Share Units (PSUs)
Each executive has a specified target long-term incentive expressed as a percentage of base salary
75% of each executive’s target long-term incentive is awarded in the form of PSUs
Annual awards earned in equal thirds based on annual achievement of Corporate objectives, with vesting after three years
Payout can range from 0% - 150% of target award For special purposes (e.g. on-hire award), one-time
awards vest in equal thirds over three year period
Annual Revenue Gross Margin $
Long-Term Incentive:
Stock Options
Annual grants (25% of each executive’s target long-term incentive is awarded in the form of Stock Options)
Exercise price equal to market price at grant Awards vest in equal amounts annually over three
years Seven-year term
N/A Option value contingent on
share price growth
Executive Pay Mix and the Emphasis on "At Risk" Pay
We emphasize performance by linking a significant proportion of our executive officers’ total annual compensation to corporate and individual performance. For 2018, an average of 58% of the target annual compensation earned by each of our Named Executive Officers was "at risk", in the form of variable and/or performance-related compensation as shown below (including annual bonus, PSUs and stock options). As such, executives will only receive value from those elements to the extent that the relevant performance conditions are met. With long-term incentive (LTI), values also aligned with share price performance.
Base Salary 31%
Annual Bonus 31%
LTI 38%
Total Target Direct Compensation Mix - CEO
Base Salary 44% Annual
Bonus 28%
LTI 28%
Total Target Direct Compensation Mix - Other Executives
28
Pay for Performance and Incentive Awards aligned with Shareholders Interests
The alignment between pay for performance for executive officers and Shareholder interests is clearly demonstrated as follows:
Annual Bonus Plan – Performance measures are substantially and directly linked to the Annual Operating Plan and achievement against those measures determines the size of the annual executive bonus award. When corporate performance is below the minimum level expected by the Board this amount could be zero. Equally, over achievement against the measures may result in payment of bonus greater than the targeted amount, up to a capped amount.
Long Term Incentive Plan –PSUs deliver compensation value to executives by tying the earning of PSUs (i.e. ability to receive value from units) to the extent that performance measures related to key business objectives are met, while the value of each vested unit changes in line with movements in the Corporation’s share price. Stock Options align pay with share price performance as the compensation realised is based solely on share price appreciation.
How Executive Compensation is Determined
The CGCC reviews and approves executive officers’ benefit policies and compensation plans, including our annual bonus plan and our long-term equity-based compensation plans. As part of its mandate, the CGCC:
Approves and recommends to the Board the appointment of our executive officers;
Reviews and approves the amount and form of their compensation, their development and succession plans, and any significant executive management changes;
Retains independent compensation consultants for professional advice and as a source of competitive market information as required;
Determines the annual compensation, sets the performance conditions relating to the annual bonus and long-term incentives, and determines the actual bonus payments in relation to our President and CEO. The President and CEO is not a member of the CGCC and does not participate in the portions of the CGCC discussions that relate directly to his personal compensation;
Seeks the advice and recommendations of our President and CEO with respect to the compensation of our other executive officers including setting annual compensation, approving performance conditions and targets for short- and long-term incentive awards, and proposed long-term incentive awards and actual bonus payments; and
Ensures 100% of CGCC meetings include an in-camera session, and our CGCC is advised by independent compensation counsel.
Annual Salary
The CGCC approves the annual salary of our executive officers. Salary guidelines and adjustments for our executive officers are considered with reference to:
(a) compensation benchmarking as set out above;
(b) the experience and qualifications of each executive officer;
(c) the individual performance of each executive officer; and
(d) the scope of responsibilities of each executive officer.
29
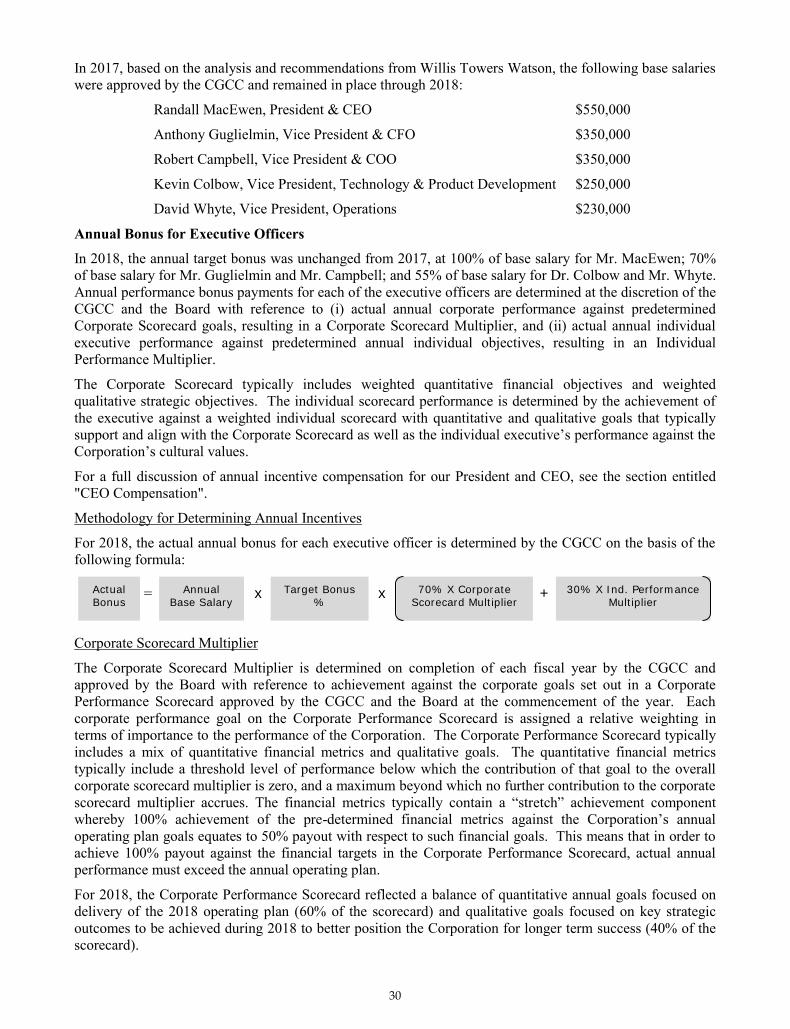
In 2017, based on the analysis and recommendations from Willis Towers Watson, the following base salaries were approved by the CGCC and remained in place through 2018:
Randall MacEwen, President & CEO $550,000
Anthony Guglielmin, Vice President & CFO $350,000
Robert Campbell, Vice President & COO $350,000
Kevin Colbow, Vice President, Technology & Product Development $250,000
David Whyte, Vice President, Operations $230,000
Annual Bonus for Executive Officers
In 2018, the annual target bonus was unchanged from 2017, at 100% of base salary for Mr. MacEwen; 70% of base salary for Mr. Guglielmin and Mr. Campbell; and 55% of base salary for Dr. Colbow and Mr. Whyte. Annual performance bonus payments for each of the executive officers are determined at the discretion of the CGCC and the Board with reference to (i) actual annual corporate performance against predetermined Corporate Scorecard goals, resulting in a Corporate Scorecard Multiplier, and (ii) actual annual individual executive performance against predetermined annual individual objectives, resulting in an Individual Performance Multiplier.
The Corporate Scorecard typically includes weighted quantitative financial objectives and weighted qualitative strategic objectives. The individual scorecard performance is determined by the achievement of the executive against a weighted individual scorecard with quantitative and qualitative goals that typically support and align with the Corporate Scorecard as well as the individual executive’s performance against the Corporation’s cultural values.
For a full discussion of annual incentive compensation for our President and CEO, see the section entitled "CEO Compensation".
Methodology for Determining Annual Incentives
For 2018, the actual annual bonus for each executive officer is determined by the CGCC on the basis of the following formula:
= x x +
Corporate Scorecard Multiplier
The Corporate Scorecard Multiplier is determined on completion of each fiscal year by the CGCC and approved by the Board with reference to achievement against the corporate goals set out in a Corporate Performance Scorecard approved by the CGCC and the Board at the commencement of the year. Each corporate performance goal on the Corporate Performance Scorecard is assigned a relative weighting in terms of importance to the performance of the Corporation. The Corporate Performance Scorecard typically includes a mix of quantitative financial metrics and qualitative goals. The quantitative financial metrics typically include a threshold level of performance below which the contribution of that goal to the overall corporate scorecard multiplier is zero, and a maximum beyond which no further contribution to the corporate scorecard multiplier accrues. The financial metrics typically contain a “stretch” achievement component whereby 100% achievement of the pre-determined financial metrics against the Corporation’s annual operating plan goals equates to 50% payout with respect to such financial goals. This means that in order to achieve 100% payout against the financial targets in the Corporate Performance Scorecard, actual annual performance must exceed the annual operating plan.
For 2018, the Corporate Performance Scorecard reflected a balance of quantitative annual goals focused on delivery of the 2018 operating plan (60% of the scorecard) and qualitative goals focused on key strategic outcomes to be achieved during 2018 to better position the Corporation for longer term success (40% of the scorecard).
Actual Bonus
Annual Base Salary
Target Bonus %
70% X Corporate Scorecard Multiplier
30% X Ind. Performance Multiplier
30

The quantitative annual goals related to annual revenue, gross margin contribution (in dollars) and cash flow from operations. Each of the revenue, gross margin and cash flow from operations goals were weighted at 20% each, representing a total of 60% of the 2018 Corporate Scorecard. The range of possible scoring against each of these quantitative goals was between 0% and 150% of achievement, with a 50% rating being achieved at the Corporation’s annual operating plan for 2018.
The 2018 Corporate Scorecard included two qualitative goals, each weighted at 20% (40% in total). The first qualitative goal was focused on the Corporation’s achievement against key milestones on its LCS stack and HDV8 module technology development strategy. The second qualitative goal was focused on signing an agreement relating to a significant strategic transaction, major customer program or major commercial contract that accelerates future scaling and profitability.
Based on the Corporation’s actual performance in 2018, the CGCC and Board assessed the Corporate Performance Scorecard as follows:
Component Weight Performance Areas Performance Highlights
Quantitative (60%)
Annual revenue Under-achieved
Annual gross margin dollar contribution Under-achieved
Annual cash flow from operations Under-achieved
Qualitative (40%)
Achieve Key technology milestones for stack and module development
Substantially achieved
Signing Major Strategic Agreement Over-achieved
The Corporation underachieved each of the three quantitative goals in 2018. The Corporation’s 2018 annual revenue, gross margin dollar contribution and cash flow from operations did not meet the minimum targets for bonus payout for these goals. The underperformance was partly due to significantly reduced sales to our Synergy Ballard joint venture in China under our MEA supply agreement.
The Corporation substantially achieved its 2018 corporate goal relating to the key 2018 milestones for the development programs for both its next generation heavy-duty motive stack (LCS) and its next generation heavy-duty motive module (HDv8). Almost all key technical, product performance, product cost and commercial delivery milestones were fully achieved; and the remaining milestones were substantially or partially achieved.
The Corporation over-achieved its 2018 corporate goal relating to signing a major agreement (strategic transaction, major customer program or major commercial contract). In June 2018, the Corporation entered into a multi-year extension to its technology solutions contract with Audi AG to support its small series production launch of fuel cell passenger cars. The program extension through August 2022 has an aggregate value expected to be CDN$80-to-$130 million.
Based on its review and assessment, the CGCC and Board determined the Corporate Scorecard Multiplier achievement for 2018 was 46%.
One-Time Special Bonus
The CGCC and Board also determined to grant an incremental special bonus pool of US$2.5 million (the “Special Bonus”) for eligible Ballard employees, including executive officers, in recognition of the Corporation’s successful closing in November 2018 of the strategic collaboration with Weichai. The strategic collaboration with Weichai includes the following key components:
31

Equity Investment: an equity investment in the Corporation by Weichai in the amount of $163.6 million, representing a 19.9% equity interest in the Corporation, with a purchase price per Share that represented a 15% premium to the 30-day volume weighted average price. In addition, Broad-Ocean Motor, an existing Ballard strategic investor and Chinese partner, also invested a further $20.2 million at the same price to maintain its 9.9% ownership position in the Corporation. As a result the total investment by Weichai and Broad-Ocean generated total gross proceeds of $183.8 million.
Joint Venture and Technology Transfer Program: Weichai and the Corporation also established a joint venture company, Weichai Ballard Hy-Energy Technologies Co., Ltd. (the “Weichai-Ballard JV”), in Shandong, China in the fourth quarter of 2018. Weichai holds a controlling ownership interest of 51% and Ballard holds an initial 49% ownership position. The Weichai-Ballard JV will manufacture our next-generation LCS fuel cell stack and LCS-based power modules for bus, commercial truck and forklift applications with exclusive rights in China. The Weichai-Ballard JV will pay us $90 million under a program to develop and transfer technology to enable these manufacturing activities. The Corporation will retain an exclusive right to the developed technologies outside China.
2,000 Fuel Cell Bus Program: Weichai has agreed to supply a minimum of 2,000 fuel cell modules for commercial vehicles in China by 2021. This is the largest planned commercial fuel cell vehicle deployment announced globally. Specific terms related to the potential supply of fuel cell power modules for commercial vehicles, including scope, product mix, pricing and timing of shipments, are under discussion between Weichai and the Corporation.
Given the intensity and complexity of the discussions between the Corporation and Weichai throughout 2018, the successful closing of the collaboration in 2018, and the strategic importance of the collaboration to the Corporation’s positioning in China, the CGCC and the Board approved the Special Bonus.
Individual Performance Multiplier
The individual performance multiplier is determined with reference to achievement against the individual goals set for each executive officer. Individual goals are set for individual executive officers by the CEO and reviewed by the CGCC, and are based on agreed, objective and identifiable measures related to their roles, and aligned to the corporate performance goals. An individual performance multiplier greater than 100% may be awarded for superior performance against these goals, with an individual performance multiplier of less than 100% being awarded for performance that does not achieve the goals.
In 2018, individual multipliers for each Named Executive Officer ranged from 100%-135%. Our executive officers received their 2018 bonus in cash.
A summary of the Named Executive Officers’ annual bonus payments for 2018 is as follows:
Name
Target Bonus
(% of salary)
Corporate Score /
Multiplier
Individual Score /
Multiplier Performance
Bonus Special Bonus(1) Total Bonus
Bonus paid as a
% of Salary
CEO(2) 100% 46% 120% $391,091 $286,391 $677,482 118%
Other NEOs 55% - 70% 46% 100% - 135% $78,000 - $178,000 $52,000 - $138,000 $130,000 - $316,000 57% - 90%
(1) Special Bonus relating to the Weichai strategic collaboration, discussed above. (2) A portion of Mr. MacEwen’s bonus was earned and paid in United States dollars (US$217,942 and US$159,522 for the performance bonus and
Special Bonus, respectively). The United States dollar amounts were converted into Canadian dollars for the purpose of this disclosure using the Bank of Canada rate of exchange on December 31, 2018.
Long Term Incentives
We provide our executive officers with equity-based long-term incentives through the Consolidated Share Option Plan (“Option Plan”) and the Consolidated Share Distribution Plan (“SDP”). Our equity-based long-
32

term incentives typically take the form of Stock Options or PSUs. These plans are designed to align executive officer remuneration with performance and long-term shareholder value. They serve a vital role in retaining executives as value under the plans is only received over time.
Performance Share Units
Performance Share Units (PSUs) typically comprise 75% of the long-term incentive compensation provided to an executive. The number of PSUs awarded to each executive officer is usually determined in the first quarter of each financial year, as a percentage of base salary. The PSUs provide for earning of one third of the grant each year over a period of three years, subject to achievement of certain performance criteria (the “PSU Scorecard”) in each year.
PSU Scorecard Earned PSUs
< 25% 0%
≥25% and <50% 50%
≥50% and ≤100% 100%
>100% Up to 150%
Although PSUs are earned during each of the three years based on performance, they are also subject to a vesting time period. For awards made in 2016 and after, earned PSUs vest three years after the award grant date. For example, for PSUs granted in 2016, one third are earned in each of 2017, 2018 and 2019; all earned PSUs then vest in 2019. Redemption of vested PSUs may be satisfied either with Shares bought under the Market Purchase PSU Plan or by treasury Shares reserved under the SDP.
One-time PSU grants that are subject to time vesting only vest one third of the grant each year over a period of three years and are not subject to the PSU Scorecard.
Stock Options
Stock options are an integral part of each executive’s annual compensation package and are granted annually in respect of approximately 25% of the long-term incentive compensation to be provided to an executive.
Under our Option Plan:
(a) the exercise price of each option is determined by the Board, but must not be less than the closing price per Share on the TSX or NASDAQ on the last trading day before the date the option is granted; and
(b) each option may be exercised by the holder in respect of up to one-third of the Shares subject to the option on or after the first, second and third anniversary of the effective date of the option on a cumulative basis.
Vested stock options may normally be exercised for a period of seven years from the grant date (the option “term”).
33

Target Value of LTI
The target value of long-term incentives granted to Named Executive Officers in 2018, and the composition of long-term incentives is set out in the table below.
Total LTI Mix (%)
Name Target LTI ($) PSUs1 Stock Options2
Mr. MacEwen 687,500 75% 25%
Mr. Guglielmin 245,000 75% 25%
Mr. Campbell 245,000 75% 25%
Dr. Colbow 137,500 75% 25%
Mr. Whyte 126,500 75% 25%
1 Converted to a number of PSUs dividing the dollar value by the closing Share price on either the TSX or NASDAQ on the award date. 2 Converted to a number of options by dividing the dollar value by the Black-Scholes value of the option on the award date. The exercise price of these options was determined based on the closing Share price on the day prior to the award date.
This element of compensation supports the Corporation’s overall compensation objectives by linking our Shareholders’ interests with those of our executive officers, by providing our executive officers with compensation that is driven by the experience of our Shareholders in terms of our share price performance, and in the case of PSUs is further tied to the achievement of performance measures. In addition, we require our executive officers to comply with minimum share ownership guidelines that further align them with the Shareholders’ experience.
For 2018 the awards to our Named Executive Officers were as follows:
Number Granted
Name Total LTI Granted ($) PSUs Stock Options
Mr. MacEwen 687,500 106,976 71,023
Mr. Guglielmin 245,000 38,122 25,310
Mr. Campbell 245,000 38,122 25,310
Dr. Colbow 138,000 21,473 14,256
Mr. Whyte 127,000 19,761 13,120
Units Granted
In 2018, PSUs were issued to the Named Executive Officers, including the President and CEO, using the methodology described above on the following dates and amounts:
February 28, 2018 224,454
34

Vesting Awards
In 2018, the following PSUs vested and were redeemed into Shares for the Named Executive Officers:
On March 2, 2018, 107,479 PSUs vested and after statutory withholdings, 53,952 PSUs were redeemed into Shares, representing 138.7% of one-third of the 2015 annual PSU awards granted to Messrs. MacEwen, Guglielmin, Colbow, and Whyte that were subject to the 2017 PSU Scorecard achievement.
On May 7, 2018, 26,943 PSUs vested and after statutory withholdings, 13,525 PSUs were redeemed into shares, representing one-third of Mr. Campbell’s new hire PSU grant that is subject to time vesting only.
Earned Awards
In 2018, the performance criteria for the PSU Scorecard were scaled targets for annual revenue and gross margin dollars that were linked to the 2018 Annual Operating Plan but lower than the corresponding Corporate Scorecard targets. Revenue and gross margin performance were weighted equally under the PSU Scorecard.
Based on the Corporation’s performance, the CGCC approved a 2018 PSU Scorecard achievement of 61%.
In March 2019, the Board determined, based on the 2018 PSU Scorecard achievement, that for outstanding PSU awards granted in 2016, 2017 and 2018 that are subject to it, 61% of the PSUs were earned. As noted above, these awards are subject to a 3-year vesting period.
CEO Compensation
Mr. MacEwen was appointed President & CEO on October 6, 2014 with a base salary set at CDN$500,000 per year. As noted above, Mr. MacEwen’s base salary was adjusted to CDN $550,000 in 2017 and remained at this level in 2018. In April 2018, Mr. MacEwen transitioned onto Ballard’s United States payroll system. His compensation continues to be based on CDN $550,000 and is converted to United States dollars and paid through the Ballard United States payroll system.
Mr. MacEwen’s target bonus for 2018 was CDN$550,000 based on an amount equal to 100% of his annual base salary. His actual bonus for 2018 was determined by the CGCC on the basis of corporate financial and operational performance reflected in the Corporate Performance Scorecard rating, plus performance relative to his individual goals for 2018, as approved by the Board.
35

Annual Bonus Performance Areas
Outcome
Corporate Specific corporate quantitative and qualitative results are described in detail under “Corporate Scorecard Multiplier”
In 2018, the corporate score was 46% of target Individual Mr. MacEwen’s individual objectives for 2018 were based on:
Building a Sustainable Business Platform – Over Achieved
Strategy Development and Communications – Substantially Achieved
Organizational Design and Development– Over Achieved
The objective relating to building a sustainable platform focused on improving the Company’s positioning to achieve future long-term profitability and cash flow breakeven by strengthening strategic positioning (including markets, customers, technology, products, competencies, assets) for long-term health, profitability, success and risk mitigation.
The objective relating to strategy development and communications focused on improving the corporate strategy development process, including management and board engagement, as well as communication of strategy to various stakeholders.
The objective relating to organizational design and development focused on continuous improvement on living our cultural values, improving the safety culture, knowledge sharing and how the organization works together, ensuring the continued development and strengthening of the Executive Team and organizational capabilities to support the strategic plan.
In 2018, Mr. MacEwen’s individual performance multiplier was 120% of target.
Overall Outcome
Mr. MacEwen’s annual bonus award was CDN$391,091 representing 71% of his target bonus, based on a corporate multiplier of 46% and an individual performance multiplier of 120%. In addition, Mr. MacEwen received a Special Bonus award of CDN$286,391, resulting in a total bonus award of CDN$677,482.
Long-term Incentives Type Value Features
Annual Award
($687,500)
Stock Option $171,875 7-year term, with one-third of the options vesting at the end of each of the first three years
PSU $515,625 3-year vesting with performance criteria
36

For the CEO, 69% of his target compensation is ‘at-risk’ (via the annual bonus plan and long term incentive awards). 60% of his target compensation is linked directly to performance goals (via annual bonus plan and PSUs). 38% of his target compensation is linked to the performance of the Ballard common shares (via PSUs and Stock Option grants).
CEO Realized Pay
In 2018, actual CEO realized pay, as defined by the sum of base salary earned, annual bonus achieved plus the value of vested equity during the year equalled CDN$1,797,080 in total.
Perquisites
In addition to cash and equity compensation, the Corporation provides Named Executive Officers with certain personal benefits, consistent with similar benefits coverage within the comparator group. These benefits include a car allowance, medical benefits program, long and short-term disability coverage, life insurance, an annual medical and a financial planning allowance.
Retirement Benefits
Executives are eligible to receive a matching contribution by the Corporation to their RRSP or 401K. Executives paid in Canada receive an RRSP contribution up to 50% of the maximum amount allowable under the Income Tax Act (Canada). Executives paid in the United States receive a 401K contribution up to 50% of the maximum amount allowable under the Internal Revenue Code (United States). Annual contributions are pro-rated for any partial year of employment.
In 2018, Mr. MacEwen received an RRSP contribution from the Corporation, equal to 50% of the maximum amount allowable under the Income Tax Act (Canada), as he made an equivalent personal matching contribution. The contribution amount was pro-rated for the period January to March. Mr. MacEwen received a 401K contribution equal to 50% of the allowable maximum under the Internal Revenue Code (United States), as he made an equivalent personal matching contribution. The contribution amount was pro-rated for the period April to December.
In 2018, Mr. Guglielmin, Dr. Colbow, Mr. Campbell and Mr. Whyte received an RRSP contribution from the Corporation, equal to 50% of the maximum amount allowable under the Income Tax Act (Canada), as each of them made an equivalent personal matching contribution.
In 2018, none of the Named Executive Officers participated in any Corporation-sponsored Defined Benefits Plan, Defined Contribution Plan, or Supplemental Executive Retirement Plan, nor did they receive contributions to any such plan on their behalf from the Corporation.
Base Salary 31%
Annual Bonus 31%
LTI 38%
Total Target Direct Compensation Mix - CEO
Base Salary 31%
Annual Bonus 31%
Options 9%
PSU 29%
2018 Annual Direct Compensation Elements CEO
37
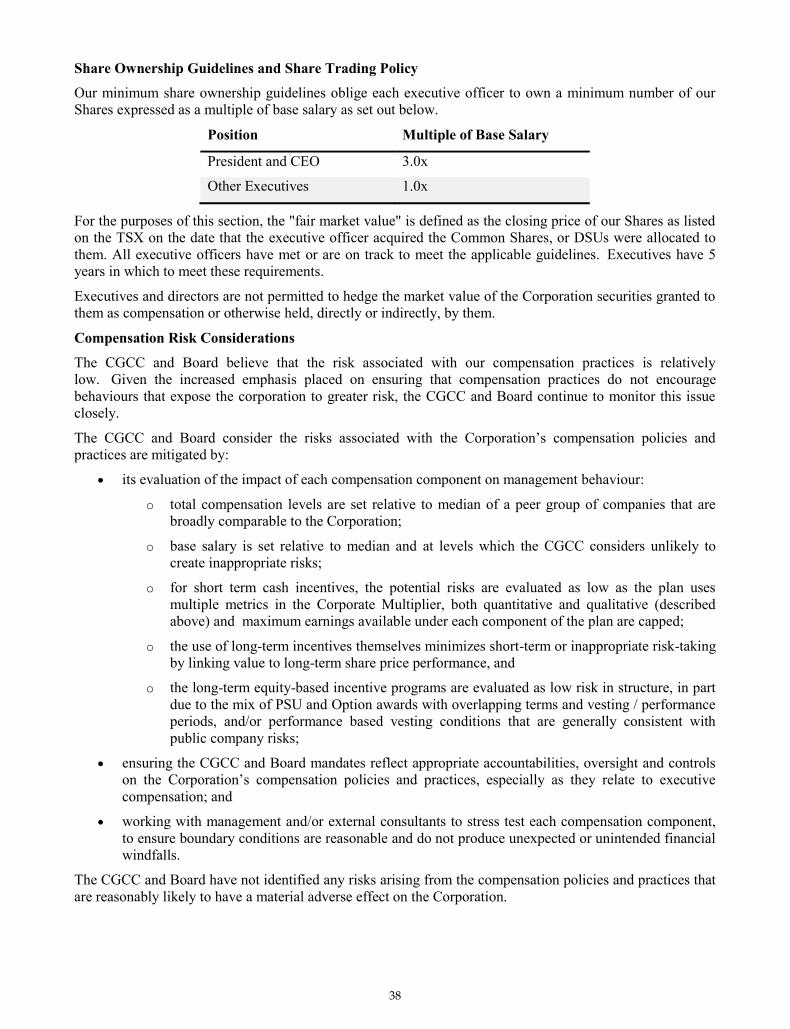
Share Ownership Guidelines and Share Trading Policy
Our minimum share ownership guidelines oblige each executive officer to own a minimum number of our Shares expressed as a multiple of base salary as set out below.
Position Multiple of Base Salary
President and CEO 3.0x
Other Executives 1.0x
For the purposes of this section, the "fair market value" is defined as the closing price of our Shares as listed on the TSX on the date that the executive officer acquired the Common Shares, or DSUs were allocated to them. All executive officers have met or are on track to meet the applicable guidelines. Executives have 5 years in which to meet these requirements.
Executives and directors are not permitted to hedge the market value of the Corporation securities granted to them as compensation or otherwise held, directly or indirectly, by them.
Compensation Risk Considerations
The CGCC and Board believe that the risk associated with our compensation practices is relatively low. Given the increased emphasis placed on ensuring that compensation practices do not encourage behaviours that expose the corporation to greater risk, the CGCC and Board continue to monitor this issue closely.
The CGCC and Board consider the risks associated with the Corporation’s compensation policies and practices are mitigated by:
its evaluation of the impact of each compensation component on management behaviour:
o total compensation levels are set relative to median of a peer group of companies that are broadly comparable to the Corporation;
o base salary is set relative to median and at levels which the CGCC considers unlikely to create inappropriate risks;
o for short term cash incentives, the potential risks are evaluated as low as the plan uses multiple metrics in the Corporate Multiplier, both quantitative and qualitative (described above) and maximum earnings available under each component of the plan are capped;
o the use of long-term incentives themselves minimizes short-term or inappropriate risk-taking by linking value to long-term share price performance, and
o the long-term equity-based incentive programs are evaluated as low risk in structure, in part due to the mix of PSU and Option awards with overlapping terms and vesting / performance periods, and/or performance based vesting conditions that are generally consistent with public company risks;
ensuring the CGCC and Board mandates reflect appropriate accountabilities, oversight and controls on the Corporation’s compensation policies and practices, especially as they relate to executive compensation; and
working with management and/or external consultants to stress test each compensation component, to ensure boundary conditions are reasonable and do not produce unexpected or unintended financial windfalls.
The CGCC and Board have not identified any risks arising from the compensation policies and practices that are reasonably likely to have a material adverse effect on the Corporation.
38

Advisors to the Corporate Governance & Compensation Committee
Willis Towers Watson has been retained by the CGCC since 2008 to provide executive compensation benchmarking and general executive compensation, equity plan and Board compensation advisory services. As noted above, in 2018, Willis Towers Watson provided input into the Executive Compensation Review.
The following table sets out the fees paid to Willis Towers Watson during each of the two most recently completed financial years:
Compensation-Related Fees
All Other Fees
2018 $7,905 Nil
2017 $74,897 Nil
Performance Graph
The following graph compares the total cumulative return to a Shareholder who invested $100 in our Shares on December 31, 2010, assuming reinvestment of dividends, with the total cumulative return of $100 on the NASDAQ Composite Index for the last five years. NASDAQ data was selected because the majority of trading of Ballard’s shares (typically >75%) occurs on this exchange.
(Dec 31) 2013
($)
2014
($)
2015
($)
2016
($)
2017
($)
2018
($)
Ballard 100 130 103 109 290 157
NASDAQ Composite Index
100 113 120 129 165 159
The trend shown by this graph does not reflect the trend in the Corporation’s compensation to its Named Executive Officers.
$0
$50
$100
$150
$200
$250
$300
$350
2013 2014 2015 2016 2017 2018
Cumulative Value of a $100 Investment
Ballard (BLDP on Nasdaq) NASDAQ Composite Index
39

Executive Compensation Tables
The following table summarizes the compensation paid for the fiscal years ended on December 31, 2016, December 31, 2017 and December 31, 2018 to our Named Executive Officers.
Summary Compensation Table
Name and Principal Position Year
Salary(5) (CDN$)
Bonus(6) (CDN$)
Long-Tern Incentives
All Other Compensation(9)
(CDN$)
Total Compensation
(CDN$)
Share-Based Awards(7) (CDN$)
Option-Based Awards(8) (CDN$)
Randall MacEwen(1, 2) President and Chief Executive Officer
2018 2017 2016
573,449 540,385 500,000
677,482 756,250 530,000
515,625 515,625 468,750
171,875 171,875 156,250
39,171 53,721 58,971
1,977,602 2,037,856 1,713,971
Anthony Guglielmin Vice President and Chief Financial Officer
2018 2017 2016
350,000 343,846 318,000
315,658 404,250 314,820
183,750 183,750 144,000
61,250 61,250 48,000
41,116 38,787 37,159
951,774 1,031,883 861,979
Robert Campbell(3) Vice President and Chief Commercial Officer
2018 2017 2016
350,000 222,115
0
298,161 125,000
0
183,750 389,750
0
61,250 238,075
0
80,155 24,087
0
973,316 999,027
0
Kevin Colbow Vice President, Technology and Product Development
2018 2017 2016
250,000 240,385 194,118
167,428 189,062 146,801
103,500 103,125 75,000
34,500 34,375 25,000
26,955 21,300 19,278
582,383 588,247 460,197
David Whyte(4) Vice President, Operations
2018 2017 2016
230,000 217,500 162,022
131,389 146,108 102,449
95,250 94,875 75,000
31,750 31,625 25,000
30,517 19,854 17,384
518,906 509,962 381,855
(1) Mr. MacEwen was appointed President and Chief Executive Officer as of October 6, 2014. He is also a director, but receives no compensation for his service as a director.
(2) In April 2018, Mr. MacEwen transitioned onto Ballard’s United States payroll system. His compensation continues to be based on CDN $550,000 and was converted to United States dollars effective April 1, 2018, based on the prevailing exchange rate. From that date, Mr. MacEwen’s compensation was paid in United States dollars. The United States dollar amounts were converted into Canadian dollars for the purpose of this disclosure using the Bank of Canada rate of exchange on December 31, 2018.
(3) Mr. Campbell was appointed Vice President and Chief Commercial Officer as of May 1, 2017, and received a pro rata portion of his $350,000 annual salary in 2017.
(4) Mr. Whyte retired from the Corporation in December 2018. (5) Salary of each of the Named Executive Officers was paid in Canadian dollars, with the exception of Mr. MacEwen effective April 1, 2018
(US$319,564). The United States dollar amounts for 2018 were US$420,356, US$256,561, US$256,561, US$183,258, and US$168,597 for Messrs. MacEwen, Guglielmin, Campbell, Colbow, and Whyte, respectively. The United States dollar amounts for 2017 were US$396,119, US$252,050, US$162,817, US$176,210, and US$159,434 for Messrs. MacEwen, Guglielmin, Campbell, Colbow, and Whyte, respectively. The United States dollar amounts for 2016 were US$366,515, US$233,104, US$0, US$142,294, and US$118,767 for Messrs. MacEwen, Guglielmin, Campbell, Colbow, and Whyte, respectively. The Canadian dollar amounts were converted into United States dollars for the purpose of this disclosure using the Bank of Canada rate of exchange on December 31, 2018. In 2018 Mr. Whyte departed his position. In connection with the departure, the total of salary and benefits continuance was $191,500.
(6) Bonus of each of the Named Executive Officers was paid in cash or DSUs. Cash bonus was paid in Canadian dollars with the exception of a portion of Mr. MacEwen’s 2018 bonus, which was paid in United States dollars (US$377,464 for 2018). The DSU amount is based on the grant date fair market value of the award, which equals the closing price of the Shares on the TSX on the date of issuance of the award.
The United States dollar amounts for 2018 were US$496,615, US$231,387, US$218,561, US$122,730, and US$96,312 for Messrs. MacEwen, Guglielmin, Campbell, Colbow, and Whyte, respectively. For 2018, the bonus for each of the Named Executive Officers was paid in cash. The United States dollar amounts for 2017 were US$554,354, US$296,328, US$91,629, US$138,588, and US$107,102 for Messrs. MacEwen, Guglielmin, Campbell, Colbow, and Whyte, respectively. In 2017, Messrs. MacEwen, Guglielmin, Campbell, Colbow, and Whyte elected to have 20%, 20%, 20%, 50%, and 50% of their bonus paid as DSUs, respectively, with the remaining amount paid in cash. The United States dollar amounts for 2016 were US$388,506, US$230,773, US$0, US$107,610, and US$75,098 for Messrs. MacEwen, Guglielmin, Campbell, Colbow, and Whyte, respectively. In 2016, the bonus for each of the Named Executive Officers was paid in cash. The Canadian dollar amounts were converted into United States dollars for the purpose of this disclosure using the Bank of Canada rate of exchange on December 31, 2018. The amounts of the bonus paid in cash and issued as DSUs including the number of DSUs issued to each Named Executive Officer in respect of the fiscal years ended December 31, 2018, December 31, 2017, and December 31, 2016 is as follows:
40

Bonus
Named Executive Officer Year
DSUs (#)
Fair Market Value of a Share (CDN$)(A)
DSU Total (CDN$)
Cash Total (CDN$)
Total Bonus (CDN$)
Randall MacEwen 2018
2017 2016
0
31,380 0
0
4.82 0
0
151,250 0
677,482
605,000 530,000
677,482
756,250 530,000
Anthony Guglielmin 2018 2017
2016
0 16,774
0
0 4.82
0
0 80,850
0
315,658 323,400
314,820
315,658 404,250
314,820
Robert Campbell 2018 2017
2016
0 5,187
0
0 4.82
0
0 25,000
0
298,161 100,000
0
298,161 125,000
0
Kevin Colbow 2018
2017 2016
0
19,612 0
0
4.82 0
0
94,531 0
167,428
94,531 146,801
167,428
189,062 146,801
David Whyte 2018 2017
2016
0 15,156
0
0 4.82
0
0 73,054
0
131,389 73,054
102,449
131,389 146,108
102,449
(A) The fair market value of a Share has been calculated using the Canadian dollar closing price of the Shares underlying the DSUs on the TSX on the date of issuance.
(7) Represents the total fair market value of PSUs issued to each Named Executive Officer during the 2018, 2017, and 2016 fiscal years. This amount is based on the grant date fair market value of the award, which equals the closing price of the Shares on the TSX and NASDAQ on the date of issuance of the award. Fair value is determined in accordance with IFRS 2 of the International Financial Reporting Standards (accounting fair value) is recorded as compensation expense in the statement of operations over vesting periods of one to three years. There is no difference in Canadian dollars between the grant date fair market value of the award and the accounting fair value.
As noted above, a dollar value is approved for the long term incentive awarded to each executive and approximately 75% of this amount is awarded in the form of PSUs with the remaining 25% being awarded in the form of stock options in 2018, 2017, and 2016. The number of PSUs awarded is equal to the dollar amount of the award divided by the fair market value of the Shares at the time of issuance (based on the closing price of the Shares on the TSX and NASDAQ on the date of issuance). The number of PSUs issued to each Named Executive Officer in respect of the fiscal years ended December 31, 2018, December 31, 2017, and December 31, 2016 is as follows:
Share-Based Awards
Named Executive Officer Year
PSUs (#)
Fair Market Value of a Share (CDN$)(B)
Total (CDN$)(C)
Randall MacEwen 2018 2017 2016
106,976 187,222 260,417
4.82 2.75 1.80
515,625 515,625 468,750
Anthony Guglielmin 2018 2017 2016
38,122 63,821 80,000
4.82 2.88 1.80
183,750 183,750 144,000
Robert Campbell 2018
2017(A) 2016
38,122 90,719
0
4.82 4.30
0
183,750 389,750
0
Kevin Colbow 2018 2017 2016
21,473 35,086 41,667
4.82 2.94 1.80
103,500 103,125 75,000
David Whyte 2018 2017 2016
19,761 33,034 41,667
4.82 2.87 1.80
95,250 94,875 75,000
(A) Included in the PSUs issued to Mr. Campbell in 2017 was a $350,000 grant of 80,831 PSUs (time vested only), which represented a new hire grant upon his appointment in May 2017.
(B) The fair market value of a Share has been calculated using the Canadian dollar closing price of the Shares underlying the PSUs on the TSX on the date of issuance.
(C) The United States dollar amounts for 2018 were US$377,969, US$134,694, US$134,694, US$75,869, and US$69,821 for Messrs. MacEwen, Guglielmin, Campbell, Colbow, and Whyte, respectively. The United States dollar amounts for 2017 were US$377,969, US$134,694, US$285,699, US$75,593, and US$69,546 for Messrs. MacEwen, Guglielmin, Campbell, Colbow, and Whyte, respectively. The United States dollar amounts for 2016 were US$343,608, US$105,556, US$0, US$54,977, and US$54,977 for Messrs. MacEwen, Guglielmin, Campbell, Colbow, and Whyte, respectively. The Canadian dollar amounts
41

were converted into United States dollars for the purpose of this disclosure using the Bank of Canada rate of exchange on December 31, 2018.
(8) Represents the total of the fair market value of options to purchase our Shares issued under the Option Plan granted to each Named Executive Officer during each fiscal year. This amount is based on the grant date fair market value of the award determined using the Black-Scholes valuation model using the following key assumptions: expected life of 4 years, expected volatility of 65% and risk free interest rate of 2% for 2018; expected life of 4 years, expected volatility of 70% and risk free interest rate of 1% for 2017; and expected life of 4 years, expected volatility of 77% and risk free interest rate of 1% for 2016. Accounting fair value is recorded as compensation expense in the statement of operations over the vesting period. There is no difference in Canadian dollars between the grant date fair market value of the award determined using the Black-Scholes valuation model and accounting fair value determined in accordance with IFRS 2 of the International Financial Reporting Standards (accounting fair value).
As noted above, a dollar value is approved for the long term incentive awarded to each executive and approximately 75% of this amount is awarded in the form of PSUs with the remaining 25% being awarded in the form of stock options in 2018, 2017, and 2016. The number of stock options awarded is equal to the dollar amount of the award divided by the fair market value of the Shares at the time of issuance (based on the closing trading price of the Shares on the TSX on the day prior to issuance). The number of stock options issued to each Named Executive Officer in respect of the fiscal years ended December 31, 2018, December 31, 2017 and December 31, 2016 is as follows:
Option-Based Awards
Named Executive Officer Year
Shares Under Options
(#)
Black-Scholes Value of Shares Underlying Options
on Date of Grant (CDN$/Share)(B)
Fair Market Value (CDN$)(C)
Randall MacEwen 2018 2017 2016
71,023 119,258 154,702
2.42 1.44 1.01
171,875 171,875 156,250
Anthony Guglielmin 2018 2017 2016
25,310 40,717 47,524
2.42 1.50 1.01
61,250 61,250 48,000
Robert Campbell 2018
2017(A) 2016
25,310 106,400
0
2.42 2.24
0
61,250 238,075
0
Kevin Colbow 2018 2017 2016
14,256 22,401 24,752
2.42 1.53 1.01
34,500 34,375 25,000
David Whyte 2018 2017 2016
13,120 21,073 24,752
2.42 1.50 1.01
31,750 31,625 25,000
(A) Included in the stock options issued to Mr. Campbell in 2017 was a grant of 100,000 stock options, which represented a new hire grant upon his appointment in May 2017.
(B) The fair market value of a Share has been calculated based on the Black-Scholes valuation model using the Canadian dollar closing price of the Shares underlying the options on the TSX on the date of issuance.
(C) The United States dollar amounts for 2018 were US$125,990, US$44,898, US$44,898, US$25,289, and US$23,274 for Messrs. MacEwen, Guglielmin, Campbell, Colbow, and Whyte, respectively. The United States dollar amounts for 2017 were US$125,988, US$44,896, US$174,515, US$25,196, and US$23,181 for Messrs. MacEwen, Guglielmin, Campbell, Colbow, and Whyte, respectively. The United States dollar amounts for 2016 were US$114,536, US$35,185, US$0, US$18,325, and US$18,325 for Messrs. MacEwen, Guglielmin, Campbell, Colbow, and Whyte, respectively. The Canadian dollar amounts were converted into United States dollars for the purpose of this disclosure using the Bank of Canada rate of exchange on December 31, 2018.
(9) All Other Compensation was paid in Canadian dollars with the exception of Other Compensation for Mr. MacEwen, which was paid in part in United States dollars (US$16,706). The United States dollar amounts for 2018 were US$28,714, US$30,139, US$58,756, US$19,758, and US$22,370 for Messrs. MacEwen, Guglielmin, Campbell, Colbow, and Whyte, respectively. The United States dollar amounts for 2017 were US$39,379, US$28,431, US$17,657, US$15,613, and US$14,553 for Messrs. MacEwen, Guglielmin, Campbell, Colbow, and Whyte, respectively. The United States dollar amounts for 2016 were US$43,227, US$27,238, US$0, US$14,131, and US$12,743 for Messrs. MacEwen, Guglielmin, Campbell, Colbow, and Whyte, respectively. The Canadian dollar amounts were converted into United States dollars for the purpose of the table above using the Bank of Canada rate of exchange on December 31, 2018.
The value of the items included in this amount was based on the aggregate incremental cash cost to the Corporation. All Other Compensation, including the type and amount of each perquisite, the value of which exceeds 25% of the total value of perquisites reported for a Named Executive Officer, includes:
42

All Other Compensation
Named Executive Officer Year
Retirement Benefits (RRSP / 401k /
Defined Benefits) (CDN$)
Insurance Premiums (CDN$)
Other(A) (CDN$)
Total (CDN$)
Randall MacEwen 2018 2017 2016
12,756 13,007 12,685
795 1,540 1,314
25,620 39,174 44,972
39,171 53,721 58,971
Anthony Guglielmin 2018 2017 2016
13,120 13,007 12,685
1,202 1,472 1,203
26,794 24,308 23,271
41,116 38,787 37,159
Robert Campbell 2018 2017 2016
13,120 8,504
0
1,268 882
0
65,767 14,701
0
80,155 24,087
0
Kevin Colbow 2018 2017 2016
12,939 11,346 9,641
1,116 954 637
12,900 9,000 9,000
26,955 21,300 19,278
David Whyte 2018 2017 2016
11,058 10,000 8,023
806 854 529
18,653 9,000 8,832
30,517 19,854 17,384
(A) Includes automobile allowances, temporary living and travel allowances, financial planning services and medical and health benefits. For Mr. Campbell, other compensation in 2018 also includes a $50,000 cash award granted on his appointment in May 2017 that vested at the end of 2018.
INCENTIVE PLAN AWARDS
The following table sets forth all option-based and share-based awards granted to our Named Executive Officers that are outstanding as of December 31, 2018.
Outstanding Share-Based Awards and Option-Based Awards
(as of December 31, 2018)
Option-Based Awards Share-Based Awards
Named Executive Officer
Number of Securities Underlying
Unexercised Options (#)
Option Exercise Price(1) (CDN$)
Option Expiration Date
Value of Unexercised In-
The-Money Options(2) (CDN$)
Number of PSUs That Have Not Vested
(#)
Market or Payout Value of PSUs That Have Not Vested(3)
(CDN$)
Randall MacEwen 200,000
93,563 154,702(5) 111,710(6)
7,548(7)
71,023(4)
2.98 2.98 1.80 2.67 4.02 4.82
Feb. 27, 2022 Feb. 27, 2022 Feb. 26, 2023 Mar. 3, 2024 Jun. 9, 2024 Mar. 1, 2025
60,000 28,069
152,638 22,714
0 0
641,101 2,102,811
Anthony Guglielmin
75,000 29,947
28,743
47,524(8)
34,317(9)
6,400(10)
25,310(4)
1.22 3.73 2.98 1.80 2.67 4.02 4.82
Mar. 8, 2020 Feb. 27, 2021 Feb. 27, 2022 Feb. 26, 2023 Mar. 3, 2024 Jun. 9, 2024 Mar. 1, 2025
154,500 0
8,623 46,889 6,978
0 0
209,325 686,586
Robert Campbell 100,000(11)
6,400(10)
25,310(4)
4.33 4.02 4.82
May 2, 2024 Jun. 9, 2024 Mar. 1, 2025
0 0 0
103,174 338,412
Kevin Colbow 25,000 40,000
40,000
24,752(12) 17,873(13)
4,528(14)
14,256(4)
1.22 3.73 2.98 1.80 2.67 4.02 4.82
Mar. 8, 2020 Feb. 27, 2021 Feb. 27, 2022 Feb. 26, 2023 Mar. 3, 2024 Jun. 9, 2024 Mar. 1, 2025
51,500 0
12,000 24,421 3,634
0 0
112,725 369,739
David Whyte 30,000
30,000 24,752(12) 17,873(13) 3,200(15)
13,120(4)
3.73 2.98 1.80 2.67 4.02 4.82
Feb. 27, 2021 Feb. 27, 2022 Feb. 26, 2023 Mar. 3, 2024 Jun. 9, 2024 Mar. 1, 2025
0 9,000 24,421 3,634
0 0
108,697 356,525
(1) All figures are in Canadian dollars. Where options are exercisable in United States dollars, the exercise price has been converted to Canadian dollars using the Bank of Canada rate of exchange on December 31, 2018.
43

(2) This amount is based on the difference between the closing price of the Shares underlying the options on the TSX as at December 31, 2018, and
the exercise price of the option. Where the difference is a negative number, the value is deemed to be 0. (3) This amount is calculated by multiplying the number of PSUs that have not vested by the closing price of the Shares underlying the PSUs on the
TSX as at December 31, 2018. Such amounts may not represent the actual value of the PSUs which ultimately vest, as the value of the Shares underlying the PSUs may be of greater or lesser value and/or the exchange rate may be higher or lower on vesting. However, given that it would not be feasible for the Corporation to estimate, with any certainty, the market value of its Shares or the exchange rate on vesting, the Corporation has used the market value and exchange rate at the end of the most recently completed financial year for the purpose of calculating the amount disclosed.
(4) Unvested options. (5) Comprising 103,134 vested and 51,568 unvested options. (6) Comprising 37,236 vested and 74,474 unvested options. (7) Comprising 2,516 vested and 5,032 unvested options. (8) Comprising 31,682 vested and 15,842 unvested options. (9) Comprising 11,439 vested and 22,878 unvested options. (10) Comprising 2,133 vested and 4,267 unvested options. (11) Comprising 33,333 vested and 66,667 unvested options. (12) Comprising 16,501 vested and 8,251 unvested options. (13) Comprising 5,957 vested and 11,916 unvested options. (14) Comprising 1,509 vested and 3,019 unvested options. (15) Comprising 1,066 vested and 2,134 unvested options.
The following table sets forth the value of the incentive plan awards vested or earned during the year ended December 31, 2018 by our Named Executive Officers.
Incentive Plan Awards – Value Vested or Earned During the Year
(2018)
Named Executive Officer
Option-Based Awards – Value Vested During the
Year(1) (CDN$)
Share-Based Awards – Value Vested During the Year(2)
(CDN$)
Non-equity incentive plan compensation – Value earned
during the year (CDN$)
Randall MacEwen 242,156 303,993 0
Anthony Guglielmin 74,390 93,384 0
Robert Campbell 0 105,617 0
Kevin Colbow 51,928 32,429 0
David Whyte 46,660 19,458 0
(1) This value was determined by calculating the difference between the market price of the underlying Shares on the TSX on the vesting date and the exercise price of the options on the vesting date. Where the difference is a negative number the value is deemed to be 0.
(2) This value was determined by calculating the dollar value realized by multiplying the number of Shares by the market value of the underlying Shares on the TSX on the vesting date.
The number of options vesting to Named Executive Officers under the Option Plan during the most recently completed financial year is 251,292.
44

For a detailed description of the principal terms of our equity-based compensation plans, see “Equity-Based Compensation Plans”, below. As noted in the Outstanding Share-Based Awards and Option-Based Awards table, as at December 31, 2018, there were 1,175,022 PSUs awarded to Named Executive Officers that were still unvested. The performance criteria for each of these PSUs will be determined by the Board at the appropriate time, and they are set to vest (subject to the terms of the Consolidated Share Distribution Plan or Market Purchase PSU Plan) as follows:
Named Executive Officer Number of PSUs That Have Not Vested Vesting Date
Randall MacEwen 322,752 198,209
13,164 106,976
February 25, 2019 March 2, 2020 June 8, 2020 February 28, 2021
Anthony Guglielmin 99,149 60,890 11,164 38,122
February 25, 2019 March 2, 2020 June 8, 2020 February 28, 2021
Robert Campbell 26,944 26,944 11,164 38,122
May 1, 2019 May 1, 2020 June 8, 2020 February 28, 2021
Kevin Colbow 51,640 31,713 7,899
21,473
February 25, 2019 March 2, 2020 June 8, 2020 February 28, 2021
David Whyte 51,640 31,714 5,582
19,761
February 25, 2019 March 2, 2020 June 8, 2020 February 28, 2021
PENSION PLAN BENEFITS
None of the Named Executive Officers participate in a Corporation-sponsored Defined Benefits Plan or Defined Contribution Plan, nor do they receive contributions to any such plan on their behalf from the Corporation.
TERMINATION AND CHANGE OF CONTROL BENEFITS
Employment Contracts
Ballard employs a standard-form employment agreement which all of our Named Executive Officers have executed. These agreements have indefinite terms, provide for payments to be made on termination and otherwise include standard industry terms and conditions, including intellectual property, confidentiality, and non-competition and non-solicitation provisions in favour of Ballard.
The annual salary paid to each of our Named Executive Officers under their employment agreements for 2018 was as follows: CDN$550,000 for Mr. MacEwen; CDN$350,000 for Mr. Guglielmin; CDN$350,000 for Mr. Campbell; CDN$250,000 for Dr. Colbow; and CDN$230,000 for Mr. Whyte.
Pursuant to these employment agreements, a Named Executive Officer’s employment terminates immediately, without any required period of notice or payment in lieu thereof, for just cause or upon the death of the executive. In every other circumstance for Mr. MacEwen and Mr. Guglielmin, other than on following a change of control, we are required to provide notice of up to 12 months plus one month for every year of employment completed with us, to a maximum of 24 months, or payment in lieu of such notice, consisting of the salary, target bonus and other benefits that would have been earned during such notice period. For Mr. Campbell, we are required to provide notice of up to 12 months plus one month for every year of employment completed with us, to a maximum of 18 months, or payment in lieu of such notice,
45
consisting of the salary, target bonus and other benefits that would have been earned during such notice period. For Dr. Colbow and Mr. Whyte, we are required to provide statutory notice plus one day for each month worked, or payment in lieu of such notice, consisting of the salary and other benefits that would have been earned during such notice period.
The employment contracts for Mr. MacEwen, Mr. Guglielmin and Mr. Campbell include a "double-trigger" in relation to a change of control – if the executive’s employment is terminated (including a constructive dismissal) within two years following the date of a change of control, the executive is entitled to a payment equivalent to payment in lieu of a 24 month notice period. For these purposes, a "change of control" under the employment agreements is defined as occurring when:
(a) a person or persons acting in concert acquires at least one-half of Ballard’s shares;
(b) the persons who comprise the Board of Ballard do not consist of a majority of persons who were previously directors of Ballard, or who were recommended to the Shareholders for election to the Board by a majority of the Directors;
(c) there is a disposition of all or substantially all of Ballard’s assets to an entity in which Ballard does not have a majority interest; or
(d) Ballard is involved in any business combination that results in Ballard’s Shareholders owning less than one-half of the voting shares of the combined entity.
In addition, all Named Executive Officers have agreed to the claw-back provision discussed previously.
Equity-Based Compensation Plans
The Option Plan provides that, if a participant ceases to be an employee of Ballard or its subsidiaries (other than by reason of death/disability or being retired), he or she will have up to 90 days, in the event of termination other than for just cause, or 30 days, in the event of voluntary resignation, in which to exercise his or her vested options (in each case subject to extension if the option would otherwise expire during, or within 9 business days after the end of, a blackout period). In the event of termination other than for just cause, the CEO has the discretion to extend the exercise period to up to one year after the optionee ceases to work for Ballard and to accelerate the vesting of unvested options that would have otherwise vested during that period in the next year (in effect, enabling the continuance of the options during a notice period).
All Ballard PSUs awarded under the SDP expire on the last day on which the participant works for Ballard or any of its subsidiaries (other than by reason of death/disability or being retired).
Under the SDP, DSUs will be redeemed for Shares by no later than December 31 of the first calendar year commencing after the holder’s employment with Ballard and its subsidiaries is terminated; except in the case of US holders, whose DSUs will be redeemed for Shares approximately 6 months after termination of employment.
The Option Plan provides for the vesting of options upon an accelerated vesting event, which is defined as:
(a) a person making a take-over bid that could result in that person or persons acting in concert acquiring more than 50% of Ballard’s Shares;
(b) any person or persons acting in concert acquiring more than 50% of Ballard’s Shares;
(c) there is a disposition of all or substantially all of Ballard’s assets to an entity in which Ballard does not have a majority interest;
(d) Ballard joins in any business combination that results in Ballard’s Shareholders owning less than 50% of the voting shares of the combined entity; or
(e) any other transaction is approved, a consequence of which is to privatize Ballard .
If an accelerated vesting event occurs, any outstanding option may be exercised at any time before the 60th day after such event.
46

Under the SDP, the occurrence of any of the accelerated vesting events described above triggers (subject to Board approval in the case of a take-over bid) the termination of the restriction period applicable to PSUs such that holders will become immediately entitled to receive Shares in respect of their PSUs (subject to satisfaction of any performance criteria or other conditions specified in the award).
The following table shows, for each Named Executive Officer, the amount such person would have been entitled to receive if on December 31, 2018: (1) their employment was terminated without just cause; (2) a change of control occurred; or, (3) their employment was terminated without just cause and that termination occurred following a change in control.
Named Executive Officer
Triggering Event (as of December 31, 2018)
Termination of Employment (2) (CDN$)(1)
Change of Control (3) (CDN$)(1)
Termination of Employment following Change of Control
(CDN$)(1)
Randall MacEwen
Severance $1,488,516 $0 $2,200,000
Other benefits $50,946 $0 $100,298
Accelerated vesting $0 $2,366,232 $0
Total $1,539,462 $2,366,232 $2,300,298
Anthony Guglielmin
Severance $991,667 $0 $1,190,000
Other benefits $68,527 $0 $107,232
Accelerated vesting $0 $903,576 $0
Total $1,060,194 $903,576 $1,297,232
Robert Campbell
Severance $644,583 $0 $1,190,000
Other benefits $80,155 $0 $185,311
Accelerated vesting $0 $338,412 $0
Total $724,739 $338,412 $1,375,311
Kevin Colbow
Severance $484,375 $0 $484,375
Other benefits $36,920 $0 $36,920
Accelerated vesting $0 $461,294 $0
Total $521,295 $461,294 $521,295
David Whyte(4)
Severance $237,667 $0 $237,667
Other benefits $13,309 $0 $13,309
Accelerated vesting $0 $393,580 $0
Total $250,976 $393,580 $250,976
(1) All values are in Canadian dollars, unless otherwise stated (2) Based on accrued service to December 31, 2018. (3) All options and PSUs vest immediately upon a change of control. Value shown equals, in the case of PSUs, the price of the underlying Shares
on December 31, 2018 multiplied by the number of PSUs. Value shown in the case of Options is the difference between the market price on December 31, 2018 and the exercise price for options, for those options where the market price on that date is greater than the exercise price.
(4) Mr. Whyte retired from Ballard in December 2018.
47

DIRECTOR COMPENSATION
The CGCC is responsible for determining compensation for our Directors.
The CGCC ensures that the annual retainer paid to Directors is sufficient to allow the Corporation to attract and retain candidates with an appropriate level of skill and expertise. Consistent with past practice, the CGCC seeks to provide compensation for directors at approximately the 50th percentile of its comparator group of North American companies. The CGCC retains independent compensation consultants (Willis Towers Watson) for professional advice and as a source of competitive market information.
During 2018, the CGCC reviewed the director compensation program from the viewpoint of best governance trends and practices, the Board/Committee model currently employed at Ballard and the appropriate level of compensation for Directors as compared to the comparator group. The review did not result in any changes to the overall structure for director compensation in 2018:
Flat Fee Structure for Board Chair. Annual Flat Fee Structure for directors. No additional meeting attendance fees for board or
committee meetings. Additional annual retainer fees for committee Chairs. All retainer fees are paid in CDN$, regardless of director’s country of residence.
Management directors (the President & CEO) and directors who are shareholder nominees appointed pursuant to agreements with the Corporation are not compensated by the Corporation for their service as directors. However, all directors are entitled to reimbursement for travel and other reasonable expenses incurred in connection with fulfilling their duties.
We remunerate all other directors for services to the Board, committee participation and special assignments. The following table describes the compensation of independent directors in 2018:
2018 Compensation Elements CDN$
Annual Retainer (Non-Executive Chair of the Board) $150,000
Annual Retainer (Director) $90,000
Annual Retainer (Committee Chairs) $15,000
If a meeting or group of meetings is held on a continent other than the continent on which a director (other than management or shareholder directors) is resident, that director will receive an additional fee of CDN$2,250, in recognition of the additional time required to travel to and from the meeting or meetings.
48

In 2018, the following compensation was paid to the directors:
Director Board Retainer
(CDN$) Committee Retainer
(CDN$)
Meeting Fees(1)
(CDN$)
Total Compensation
(CDN$) (1)
Ian A. Bourne(2) 65,110 N/A 0 65,110
Douglas P. Hayhurst(3) 90,000 37,000 2,250 129,250
Duy-Loan Le 90,000 0 0 90,000
Marty Neese 90,000 0 2,250 92,250
Jim Roche 123,956 6,511 2,250 132,717
Ian Sutcliffe(3) 90,000 15,000 2,250 107,250
Janet Woodruff(3) 90,000 23,489 2,250 115,739 1. Directors attended a meeting in China in September 2018, except for Ms. Le who was unable to attend. 2. Mr. Bourne retired from the board effective June 6, 2018, and received a pro rata portion of his board retainer. 3. A Special Committee was established (and dissolved) in 2018 to consider certain strategic transactions. The Special Committee members,
Mr. Hayhurst, Mr. Sutcliffe and Ms. Woodruff, received a $15,000 cash retainer. Mr. Hayhurst received an additional $7,000 cash retainer as Committee Chair.
Retainers are paid 50% in DSUs and 50% in cash. Directors can elect to take 100% of their fees in the form of DSUs annually in support of their share ownership targets. The period over which share ownership targets must be met (remaining at 3x annual retainer) was increased from 5 years to 6 years, recognizing the higher retainer level multiple to be achieved.
Directors are entitled to participate in the deferred share unit section for directors (the "DSU Plan for Directors") in the SDP. Each DSU is convertible into one Share. The number of DSUs to be credited to a Director is determined quarterly by dividing the amount of the eligible remuneration to be deferred into DSUs by the fair market value per Share, being a price not less than the closing sale price at which the Shares are traded on the TSX (in respect of a DSU issued or to be issued to a person who is resident in any country other than the U.S.) or NASDAQ (in respect of a DSU issued or to be issued to a person who is resident in the U.S.) on the trading day before the relevant date. For the Directors, DSUs are credited to an account maintained for each eligible person by Ballard at the time specified by the Board. However, a DSU is not redeemed until the Director leaves the Board, and its value on redemption will be based on the value of our Shares at that time. The SDP or any successor plans will be used to satisfy the redemption of DSUs issued pursuant to the DSU Plan for Directors.
Directors have not been issued any stock options in the last 5 years, and there is no current intention to do so in the future.
INCENTIVE PLAN AWARDS
The following table sets forth all option-based and share-based awards granted to our non-executive directors that are outstanding as of December 31, 2018.
In 2003, we ceased the practice of annual grants of share options to our independent Directors.
49

Outstanding Share-Based Awards and Option-Based Awards (as of December 31, 2018)
Option-Based Awards
Name
Number of Securities Underlying
Unexercised Options Option Exercise Price(1)
(CDN$) Option Expiration
Date
Value of Unexercised In-The-Money
Options(2) (CDN$)
Ian A. Bourne 0 ─ ─ ─
Doug Hayhurst 0 ─ ─ ─ Duy-Loan Le 0 ─ ─ ─
Marty Neese 0 ─ ─ ─
Jim Roche 0 ─ ─ ─
Ian Sutcliffe 0 ─ ─ ─ Janet Woodruff 0 ─ ─ ─ (1) All figures are in Canadian dollars. (2) This amount is based on the difference between the closing price of the Shares underlying the options on the TSX as at December 31, 2018, and
the exercise price of the option. Where the difference is a negative number the value is deemed to be 0.
No incentive plan awards vested for, or were earned by, our Directors during the year ended December 31, 2018.
Directors are not permitted to hedge the market value of the Corporation securities they hold.
EQUITY-BASED COMPENSATION PLANS
The Corporation adopted two equity-based compensation plans approved by our Shareholders at the 2009 Annual Meeting and most recently re-approved at the 2018 Annual Meeting(1):
(a) a consolidated share option plan (the "Option Plan"; and
(b) a consolidated share distribution plan (the "SDP").
Copies of the Option Plan and SDP are posted on the Governance section of the Corporation’s website (http://ballard.com/investors/governance). For a detailed description of our equity-based compensation plans, see Appendix "B" and "C" of this Management Proxy Circular.
The following table sets out, as of December 31, 2018, the number of securities we are authorized to issue under our equity-based compensation plans and the relevant exercise prices at which such securities may be issued.
Plan Category
Number of Securities to be Issued Upon Exercise of Outstanding Options, Warrants
and Rights (#)
Weighted -Average Exercise Price of Outstanding Options, Warrants and
Rights (CDN$)
Equity-based compensation plans approved by security holders 7,658,867 (1) 2.14
Equity-based compensation plans not approved by security holders Nil N/A
Total 7,658,867 (1) 2.14
(1) Shares issuable under the DSU Plan for Directors and the DSU Plan for Executive Officers (together, the "DSU Plans") will be satisfied with Shares reserved under the SDP or any successor plan.
(1) The Corporation also adopted a plan, administered by an independent trustee, for the purchase of Ballard Shares on
the open market for the redemption of PSU awards (the "Market Purchase PSU Plan"). The independent trustee makes these open market purchases through the facilities of the TSX, and holds the purchased Shares in escrow until the restriction period is complete and any performance criteria have been satisfied. Shares purchased under this plan do not count against the rolling cap under the Option Plan or SDP.
50
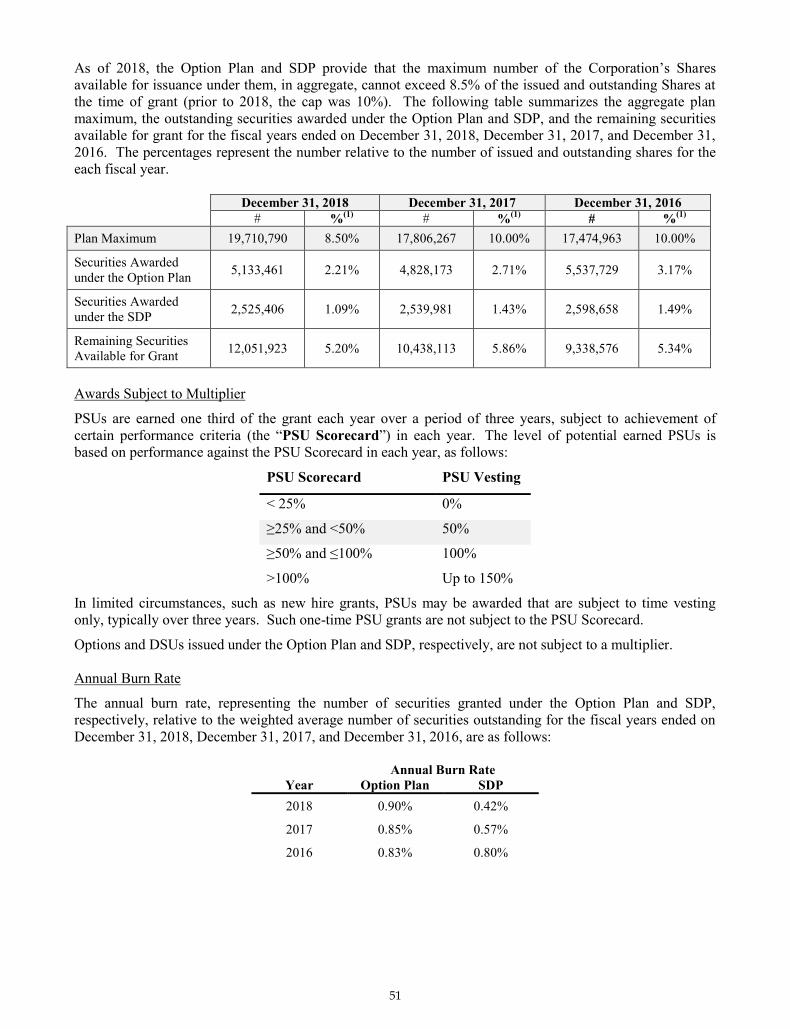
As of 2018, the Option Plan and SDP provide that the maximum number of the Corporation’s Shares available for issuance under them, in aggregate, cannot exceed 8.5% of the issued and outstanding Shares at the time of grant (prior to 2018, the cap was 10%). The following table summarizes the aggregate plan maximum, the outstanding securities awarded under the Option Plan and SDP, and the remaining securities available for grant for the fiscal years ended on December 31, 2018, December 31, 2017, and December 31, 2016. The percentages represent the number relative to the number of issued and outstanding shares for the each fiscal year. December 31, 2018 December 31, 2017 December 31, 2016 # %(1) # %(1) # %(1) Plan Maximum 19,710,790 8.50% 17,806,267 10.00% 17,474,963 10.00%
Securities Awarded under the Option Plan 5,133,461 2.21% 4,828,173 2.71% 5,537,729 3.17%
Securities Awarded under the SDP 2,525,406 1.09% 2,539,981 1.43% 2,598,658 1.49%
Remaining Securities Available for Grant 12,051,923 5.20% 10,438,113 5.86% 9,338,576 5.34%
Awards Subject to Multiplier
PSUs are earned one third of the grant each year over a period of three years, subject to achievement of certain performance criteria (the “PSU Scorecard”) in each year. The level of potential earned PSUs is based on performance against the PSU Scorecard in each year, as follows:
PSU Scorecard PSU Vesting
< 25% 0%
≥25% and <50% 50%
≥50% and ≤100% 100%
>100% Up to 150%
In limited circumstances, such as new hire grants, PSUs may be awarded that are subject to time vesting only, typically over three years. Such one-time PSU grants are not subject to the PSU Scorecard.
Options and DSUs issued under the Option Plan and SDP, respectively, are not subject to a multiplier. Annual Burn Rate
The annual burn rate, representing the number of securities granted under the Option Plan and SDP, respectively, relative to the weighted average number of securities outstanding for the fiscal years ended on December 31, 2018, December 31, 2017, and December 31, 2016, are as follows:
Annual Burn Rate Year Option Plan SDP 2018 0.90% 0.42%
2017 0.85% 0.57%
2016 0.83% 0.80%
51

INTEREST OF INFORMED PERSONS IN MATERIAL TRANSACTIONS
To the best of our knowledge, no informed person, proposed director or person who has been a director or executive officer of the Corporation (or any associate of affiliate of such persons) had any interest in any material transactions during the past year or has any interest in any material transaction to be considered at the Meeting, except as disclosed in this Management Proxy Circular.
INDEBTEDNESS OF DIRECTORS AND EXECUTIVE OFFICERS
In compliance with Sarbanes-Oxley, we do not make or arrange personal loans to directors or executive officers. As of April 8, 2019, our current or former directors, officers and employees have no outstanding indebtedness to the Corporation, its subsidiaries or to any other entity and which is guaranteed by the Corporation or its subsidiaries.
DIRECTORS’ AND OFFICERS’ LIABILITY INSURANCE
We purchase and maintain insurance for the benefit of our directors and officers for losses arising from claims against them for certain actual or alleged wrongful acts they may undertake while performing their director or officer function. The total annual premium in respect of our directors’ and officers’ liability insurance program was approximately US$265,000 for 2018 and US$217,000 for 2017. The aggregate maximum coverage provided by the policy for all claims, for both directors and officers, in any single policy year is US$30 million. In addition to the payment of the premiums, we are accountable for the payment of the policy deductible of US$0 to US$500,000 per claim. We have also agreed to indemnify each of our directors and officers against all expenses, liability and loss, reasonably incurred or suffered, arising from the performance of his or her duties as an officer or director of Ballard.
ADDITIONAL INFORMATION
Additional information relating to us is included in the following public filings, which are incorporated by reference (the "Incorporated Documents") into, and form an integral part of, this Management Proxy Circular:
Annual Information Form dated March 7, 2019;
Audited Annual Financial Statements for the year ended December 31, 2018 together with the auditors’ report thereon; and
Management's Discussion and Analysis for the year ended December 31, 2018.
Copies of the Incorporated Documents and all our other public filings providing additional information relating to us may be obtained at www.sedar.com or www.sec.gov, or upon request and without further charge from either our Corporate Secretary, at 9000 Glenlyon Parkway, Burnaby, British Columbia, Canada V5J 5J8, or by calling our Investor Relations Department at (604) 454-0900.
PROPOSALS
Any Shareholder who intends to present a proposal at our 2020 annual Shareholders’ meeting must send the proposal to our Corporate Secretary at 9000 Glenlyon Parkway, Burnaby, British Columbia, Canada V5J 5J8. In order for the proposal to be included in the proxy materials we send to Shareholders for that meeting, the proposal:
must be received by us no later than March 4, 2020; and
must comply with the requirements of section 188 of the Business Corporations Act (British Columbia).
We are not obligated to include any shareholder proposal in our proxy materials for the 2020 annual Shareholders’ meeting if the proposal is received after the March 4, 2020 deadline.
52

APPROVAL BY THE BOARD
Our Board has approved the contents and the sending of this Management Proxy Circular to the Shareholders of the Corporation.
BY ORDER OF THE BOARD
"Kerry Hillier"
Kerry Hillier Corporate Secretary Ballard Power Systems Inc.
Dated: April 8, 2019
53

DEFINED TERMS
In this Management Proxy Circular:
"Ballard", "Corporation", "we", "us" and "our" refer to Ballard Power Systems Inc.
"Beneficial Shareholders" means holders of our Shares that do not hold our Shares in their own name, but instead, whose Shares are held on the Record Date by a bank, trust company, securities broker or other nominee.
"Board" means the board of directors of Ballard.
"CDN$" refers to Canadian currency.
"Equity-based Compensation Plans" means the Option Plan and the SDP.
"DSU" means deferred share unit.
"$" or "dollars" refer to United States currency unless specifically stated otherwise.
"Meeting" means the 2019 annual meeting of our Registered Shareholders and includes any adjournment thereof, unless otherwise indicated.
"NASDAQ" means the NASDAQ Global Market.
"Option Plan" means the Corporation’s consolidated share option plan, the principal terms of which are set out in Appendix "B".
"PSU" means performance share unit subject to time and performance vesting criteria, unless otherwise noted.
"Record Date" means 5:00 p.m. Pacific Daylight Time on April 8, 2019.
"Registered Shareholders" means registered holders of our Shares on the Record Date.
"SDP" means the Corporation’s consolidated share distribution plan, the principal terms of which are set out in Appendix "C".
"SEC" means the U.S. Securities and Exchange Commission.
"Shares" means common shares without par value in the capital of Ballard.
"TSX" means the Toronto Stock Exchange.
"US$" refers to United States currency.
54
A-1
APPENDIX "A"
BOARD MANDATE
The board of directors (the "Board") is responsible for the overall corporate governance of the Corporation. It oversees and directs the management of the Corporation’s business and affairs. In doing so, it must act honestly, in good faith, and in the best interests of the Corporation. The Board guides the Corporation’s strategic direction, evaluates the performance of the Corporation’s executive officers, monitors the Corporation’s financial results, and is ultimately accountable to the Corporation’s shareholders, employees, customers, suppliers, and regulators. Board members are kept informed of the Corporation’s operations at meetings of the Board and its committees, and through reports and analyses by, and discussions with, management. The Board manages the delegation of decision-making authority to management through Board resolutions under which management is given authority to transact business, but only within specific limits and restrictions.
In this Mandate, the "Corporation" means Ballard Power Systems Inc. and a "director" means a member of the Corporation's board of directors (the "Board"). A “senior officer” means VP-level employees and executive officers of the Corporation. The “CEO” means the President & Chief Executive Officer of the Corporation.
COMPOSITION
A. As stated in the Articles of the Corporation, the Board will be composed of no fewer than three directors.
B. The Board will have a majority of independent directors. A director is considered “independent” if they do not have a material or pecuniary relationship with the Corporation or related entities (other than compensation received for their service as director) and otherwise meet the requirements for independence established by securities regulations and exchange requirements applicable to the Corporation from time to time.
C. The Board will appoint its own Chair.
MEETINGS
A. Meetings of the Board will be held as required, but at least four times a year. Any director may request a meeting of the Board be called by notifying the Board Chair.
B. Notice of the time and place of each meeting will be given to each director either by telephone or other electronic means not less than 1 week before the time of the meeting. Meetings may be held at any time if all directors have waived or are deemed to have waived notice of the meeting. A director participating in a meeting will be deemed to have waived notice of the meeting.
C. The CEO will have direct access to the Board and may request a meeting of the Board be called by notifying the Board Chair. The CEO will receive notice of every Board meeting and will normally be requested to attend, other than in cases where the Board wishes to meet in-camera. Other executives or employees of the Corporation will attend meetings of the Board at the request of the Chair.
D. Meetings will be chaired by the Chair of the Board; or if the Chair is absent, by the CEO, if a director; or if the Chair and the CEO are absent, by a member chosen by the Board from among themselves.
E. A director may participate in meetings of the Board or any committee of the Board in person, by telephone, or with the consent of the other directors at the meeting, by another communications medium, and a director participating in such a meeting by any such means is deemed to be present at that meeting.
F. A majority of directors constitute a quorum necessary for the transaction of business at Board meetings. A quorum once established is maintained even if directors leave the meeting prior to conclusion.

A-2
G. The Corporate Secretary or his or her nominee will act as Secretary to the Board.
H. All decisions made by the Board may be made at a Board meeting or evidenced in writing and signed by all Board members, which will be fully effective as if it had been made or passed at a Board meeting.
I. As part of every regularly-scheduled meeting, the Board will hold in-camera sessions with: (1) the CEO; (2) of the Board, without management or management directors present; and (3) of the independent directors of the Board, without non-independent directors present. The Board may also hold other in-camera sessions with such members of management present as the Board deems appropriate.
DUTIES AND RESPONSIBILITIES
A. Selection of Management
The Board is responsible for appointing the Chief Executive Officer ("CEO"), for monitoring and evaluating the CEO’s performance, and approving the CEO’s compensation. Upon recommendation of the CEO and the Corporate Governance & Compensation Committee, the Board is also responsible for appointing all other officers. The Board also ensures that adequate plans are in place for management development and succession and conducts an annual review of such plans.
B. Corporate Strategy
The Board is responsible for reviewing and approving the Corporation’s corporate mission statement and corporate strategy on a yearly basis, as well as determining the goals and objectives to achieve and implement the corporate strategy, while taking into account, among other things, the opportunities and risks of the business. Each year, the Board meets for a strategic planning session to set the plans for the upcoming year. In addition to the general management of the business, the Board expects management to achieve the corporate goals set by the Board, and the Board monitors the progress made against these goals.
In addition, the Board approves key transactions that have strategic impact to the Corporation, such as acquisitions, key collaborations, key supply arrangements, and strategic alliances. Through the delegation of signing authorities, the Board is responsible for setting out the types of transactions that require approval of the Board..
C. Fiscal Management and Reporting
The Board, through the Audit Committee, monitors the financial performance of the Corporation and must ensure that the financial results are reported: (a) to shareholders and regulators on a timely and regular basis; and (b) fairly and in accordance with applicable accounting principles. The Board must also ensure that all material developments of the Corporation are disclosed to the public on a timely basis in accordance with applicable securities regulations. The Board also reviews and approves the Corporation’s Annual Information Form and management information circular each year.
D. Legal Compliance
The Board is responsible for overseeing compliance with all relevant policies and procedures by which the Corporation operates and ensuring that the Corporation operates at all times in compliance with all applicable laws and regulations, and to the highest ethical and moral standards.
E. Statutory Requirements
The Board is responsible for approving all matters that require Board approval as prescribed by applicable statutes and regulations, such as payment of dividends and issuances of shares. Management ensures that such matters are brought to the attention of the Board as they arise.

A-3
F. Formal Board Evaluation
The Board, through a process led by the Corporate Governance & Compensation Committee, conducts an annual evaluation and review of the performance of the Board, Board committees, and the Chair of the Board. The results of the evaluation and recommended improvements are discussed with the full Board. The Board also sets annual goals or focus priorities and tracks performance against them. In addition, each individual director’s performance is evaluated and reviewed regularly.
G. Risk Management
The Board is responsible for identifying the Corporation’s principal risks and ensuring the implementation of appropriate systems to manage these risks. The Board is also responsible for the integrity of the Corporation’s internal controls and management information systems.
H. External Communications
The Board is responsible for overseeing the establishment, maintenance and annual review of the Corporation’s external communications policies which address how the Corporation interacts with analysts and the public and which also contain measures for the Corporation to avoid selective disclosure. The Board is responsible for establishing a process for receiving shareholder feedback.

This page intentionally left blank.

B-1
APPENDIX "B"
DESCRIPTION OF OPTION PLAN
All directors, officers and employees of Ballard and its subsidiaries are eligible to participate in the Option Plan.
As of April 8, 2019, the total number of Shares issued and reserved and authorized for issue under the Option Plan was 6,265,316 Shares, representing 2.7% of the issued and outstanding Shares as of that date.
The number of options granted under the Option Plan may adjust if any share reorganization, stock dividend or corporate reorganization occurs.
The Option Plan limits insider participation such that the number of Shares issued to insiders, within any one-year period, and issuable to insiders, at any time, under the plan and any other Ballard equity-based compensation arrangements, cannot exceed 8.5% of Ballard’s issued and outstanding Shares.
In any year, a non-executive Director’s participation in all Ballard equity-based compensation arrangements is limited to that number of shares (or that number of securities in respect of underlying shares) having a value of not more than CDN$100,000 on the date of grant, excluding any securities issued in respect of the non-executive Director’s annual retainer.
Apart from the limits on Shares issued or issuable to insiders and to non-executive Directors, described above, the Option Plan does not restrict the number of Shares that can be issued to any one person or to Directors.
The exercise price of a Ballard option will be determined by the Board and is to be no less than the closing price per Share on the TSX (in respect of options issued to persons resident in any country other than the U.S.), or NASDAQ (in respect of options issued to persons resident in the U.S.), on the last trading day before the date the option is granted.
Ballard options may have a term of up to 10 years from the date of grant, and unless otherwise determined by the Board, will vest in equal amounts on the first, second and third anniversaries of the date of grant.
If an "accelerated vesting event" occurs, any outstanding option may be exercised at any time before the 60th day after such event. An accelerated vesting event occurs when: (a) a person makes a take-over bid that could result in that person or persons acting in concert acquiring more than 50% of Ballard’s Shares; (b) any person or persons acting in concert acquire more than 50% of Ballard’s Shares; (c) there is a disposition of all or substantially all of Ballard’s assets to an entity in which Ballard does not have a majority interest; (d) Ballard joins in any business combination that results in anyone other than Ballard’s shareholders owning more than 50% of the voting shares of the combined entity; or (e) any other transaction is approved, a consequence of which is to privatize Ballard.
The Option Plan also contains a "double trigger" in the event of a take-over. Accordingly, vesting will only be accelerated if the Board approves the acceleration. In such circumstances, the Board will also have the ability to make such changes as it considers fair and appropriate, including accelerating vesting, otherwise modifying the terms of options to assist the holder to tender into the take-over bid or terminating options which have not been exercised prior to the successful completion of the accelerated vesting event.
Under the Option Plan each option will expire (or no longer be capable of being exercised) on the earlier of:
(a) the expiration date as determined by the Board, which date will not be more than 10 years from the date of grant; and
(b) if the optionee is a director, officer or employee, the optionee ceases to hold such position, except that, an option will be capable of exercise, if the optionee ceases to be a director, officer or employee:
(i) because of his or her death, for one year after the optionee dies;
(ii) as a result of voluntary resignation, for 30 days after the last day on which the optionee ceases to be a director, or the officer or employee ceases to work for Ballard; or
B-2
(iii) other than as a result of voluntary resignation (in the case of a director) or termination other than for just cause (in the case of an officer or employee), for 90 days after the last day on which the optionee ceases to be a director, or the officer or employee ceases to work for Ballard (although in these circumstances, the Chief Executive Officer has discretion to extend the exercise period to up to one year after the optionee ceases to work for Ballard).
In the event that the optionee dies, all previously unvested options vest and, in the circumstances described in (b)(iii) above, the Chief Executive Officer has discretion to accelerate the vesting of unvested options that would have otherwise vested in the next year. In the other circumstances described above, an option is only capable of being exercised in respect of options that were vested at the time the optionee ceased to be a director or ceased to work for Ballard.
In the event that an optionee becomes "totally disabled" (as defined in the Option Plan), his or her options will continue to vest and be exercisable as they would have had the optionee continued to be a director, officer or employee of Ballard.
Similarly, if an optionee becomes "retired" (as defined in the Option Plan), his or her options will continue to vest and be exercisable as they would have had the optionee continued to be a director, officer or employee of Ballard.
If an option would otherwise expire or cease to be exercisable during a blackout period or within nine business days after the end of a blackout period (that is, a period during which employees and/or directors cannot trade in securities of the Corporation because they may be in possession of insider information), the expiry date of the option is extended to the date which is 10 business days after the end of the blackout period.
The Board is entitled to make, at any time, and from time to time, and without obtaining shareholder approval, any of the following amendments:
(a) amendments to the definitions and other amendments of a clerical nature;
(b) amendments to any provisions relating to the granting or exercise of options, including but not limited to provisions relating to the vesting period, acceleration of vesting, term, extension of term, termination or expiry, amount and payment of the subscription price, vesting period, expiry or adjustment of options, provided that, without shareholder approval, such amendment does not entail:
(i) a change in the number or percentage of Shares reserved for issuance under the plan;
(ii) a reduction in the exercise price of an option held by an insider;
(iii) an extension of the expiry date of an outstanding option;
(iv) an increase to the maximum number of Shares that may be:
(A) issued to insiders within a one-year period; or
(B) issuable to insiders at any time,
under all of Ballard’s equity-based compensation arrangements, which could exceed 10% of the issued and outstanding Shares at that time;
(v) an increase in the maximum number of securities that can be granted to directors (other than directors who are also officers) under all of Ballard’s equity-based compensation arrangements, which could exceed such number of securities in respect of which the underlying Shares have a Fair Market Value (as defined in the plan) on the date of grant of such securities of CDN$100,000; or
(vi) a change to the amendment provisions of the Option Plan;

B-3
(c) the addition or amendment of terms relating to the provision of financial assistance to optionees or resulting in optionees receiving any Ballard securities, including pursuant to a cashless exercise feature;
(d) any amendment in respect of the persons eligible to participate in the plan, provided that, without shareholder approval, such amendment does not permit non-employee directors to re-gain participation rights under the plan at the discretion of the Board if their eligibility to participate had previously been removed or increase limits previously imposed on non-employee director participation;
(e) such amendments as are necessary for the purpose of complying with any changes in any relevant law, rule, regulation, regulatory requirement or requirement of any applicable stock exchange or regulatory authority; or
(f) amendments to correct or rectify any ambiguity, defective provision, error or omission in the plan or in any agreement to purchase options.
Options are not assignable except as permitted by applicable regulatory authorities in connection with a transfer to an optionee’s registered retirement savings plan or registered retirement income fund or to the personal representative of an optionee who has died.

C-1
APPENDIX"C"
DESCRIPTION OF SDP
The SDP is a single plan divided into the following three principal sections:
1. A deferred share unit section for senior executives (the "DSU Plan for Executive Officers"). Under the SDP, DSUs are granted at the election of each executive officer of Ballard who is eligible (as determined by the Board) in partial or full payment of his or her annual bonus, which otherwise is paid in Shares.
2. A deferred share unit section for directors (the "DSU Plan for Directors"). Under the DSU Plan for Directors, each independent outside director elects annually the proportion (0% to 100%) of his or her annual retainer that he or she wishes to receive in DSUs.
Under the SDP, DSUs are credited to an account maintained for each eligible person by Ballard. Each DSU is convertible into one Share. The number of DSUs to be credited to an eligible person is determined on the relevant date by dividing the amount of the eligible remuneration to be deferred into DSUs by the fair market value per Share, being a price not less than the closing sale price at which the Shares are traded on the TSX (in respect of a DSU issued to persons resident in any country other than the U.S.) or NASDAQ (in respect of a DSU issued to persons resident in the U.S.) on the trading day before the relevant date. In the case of the executive officers, the relevant date is set by the Board but if such date occurs during a trading blackout, the number of DSUs will be determined on the first trading day after the day on which the blackout is lifted. For directors, DSUs are credited at the time specified by the Board (currently DSUs are granted in equal instalments over the course of a year, at the end of each quarter).
On any date on which a dividend is paid on the Shares, an eligible person's account will be credited with the number of DSUs calculated by: (i) multiplying the amount of the dividend per Share by the aggregate number of DSUs that were credited to that account as of the record date for payment of the dividend; and (ii) dividing the amount obtained in (i) by the fair market value (determined as set out above) of Shares on the date on which the dividend is paid.
A departing director or executive officer may receive Shares in respect of the DSUs credited to that person's account (at the ratio of one Share per DSU, subject to the deduction of any applicable withholding tax in the case of an eligible person who is a United States citizen or resident for the purpose of United States tax). A DSU, however, cannot be redeemed until such time as the director leaves the Board or the executive officer ceases to work for Ballard, and its value on redemption will be based on the value of Shares at that time. All DSUs vest immediately as they are issued in respect of remuneration that would have otherwise been paid in Shares or cash. DSUs do not expire. Except in the case of death, DSUs can only be assigned with consent.
3. A performance share unit section (the "PSU Plan"). All employees (but not non-executive directors) are eligible to participate in the PSU Plan.
The vesting of PSUs issued under the SDP occurs up to three years from the date of issuance, subject to the achievement of any performance criteria which may be set by the Board and to earlier vesting upon the occurrence of any accelerated vesting event (as defined in the SDP). Each PSU is convertible into one Share, which will be issued under the SDP.
A "double trigger" is included in the event of a take-over. Accordingly, in the event of a take-over the accelerated vesting of a PSU (technically, the shortening of the restriction period) will only occur if the Board so determines. In such circumstances, the Board will also have the ability to make such changes as it considers fair and appropriate in the circumstances, including the date on which the restriction period ends or otherwise modifying the terms of PSUs to assist the holder to tender into the take-over bid. In addition, the Board has the discretion to deem performance criteria or other conditions to have been met on the occurrence of an accelerated vesting event.
If any performance criteria or other conditions specified in an award of PSUs is not met on or before the last day of the restriction period applicable to the relevant grant (usually three years less one day from the date of

C-2
grant), the PSUs will expire and the participant will no longer be entitled to receive any Shares upon conversion of those PSUs.
All PSUs awarded to a participant under the SDP will also expire on the last day on which the participant works for Ballard or any of its subsidiaries except that,
(a) in the event of the participant's death or total disability, the performance criteria and conditions specified in the participant's award of PSUs will, unless otherwise specified in the award, be deemed satisfied and the PSUs will be converted into Shares; and
(b) if the participant is retired, the vesting of PSUs will continue on the same terms as they would have had the participant continued to be an officer or employee of Ballard.
PSUs cannot be assigned other than by will or the laws of descent and distribution.
Under the SDP, the Board can elect to satisfy the conversion of PSUs through Ballard Shares purchased on the open market.
As of April 8, 2019, the total number of Shares issued and reserved and authorized for issue under the SDP was 2,107,698 Shares, representing 0.9% of the issued and outstanding Shares as of that date.
The SDP limits insider participation such that the number of Shares issued to insiders, within any one-year period, and issuable to insiders, at any time, under the plan and any other Ballard equity-based compensation arrangements, cannot exceed 10% of Ballard’s issued and outstanding Shares.
Under the SDP, in any year, a non-executive Director’s participation in all Ballard equity-based compensation arrangements is limited to that number of shares (or that number of securities in respect of underlying shares) having a value of not more than CDN$100,000 on the date of grant, excluding any securities issued in respect of the non-executive Director’s annual retainer.
The SDP does not limit the number of DSUs that can be issued to executive officers.
The SDP does not limit the number of PSUs that can be issued to any one participant.
Apart from the limits on Shares issued or issuable to insiders and non-executive Directors described above, the SDP does not restrict the number of Shares that can be issued to any one person, to executive officers or to Directors.
The SDP permits the Board, without obtaining shareholder approval, to amend any provision of the SDP and/or any PSU and/or DSU governed by it (whether outstanding or otherwise) (subject to any stock exchange or regulatory requirement at the time of any such amendment) including, without limitation, any of the following amendments:
(a) amendments to the definitions and other amendments of a clerical nature;
(b) amendments to any provisions relating to the issuance of Shares, granting or conversion of DSUs or PSUs, including but not limited to provisions relating to the term, termination, and number of DSUs or PSUs to be awarded, provided that, without shareholder approval, such amendment does not entail:
(i) a change in the number or percentage of Shares reserved for issuance under the plan;
(ii) a reduction of the issue price of the Shares issued under the plan or the cancellation and reissue of Shares;
(iii) a reduction to the fair market value used to calculate the number of DSUs to be awarded;
(iv) an extension of time for redemption of a DSU or an extension beyond the original restriction period of a PSU;
(v) an increase to the maximum number of Shares that may be:
(A) issued to insiders within a one-year period; or

C-3
(B) issuable to insiders at any time,
under all of Ballard’s equity-based compensation arrangements, which could exceed 10% of the issued and outstanding Shares at that time;
(vi) an increase in the maximum number of securities that can be granted to directors (other than directors who are also officers) under all of Ballard’s equity-based compensation arrangements, which could exceed such number of securities in respect of which the underlying Shares have a Fair Market Value (as defined in the plan) on the date of grant of such securities of CDN$100,000;
(vii) permitting DSUs or PSUs to be transferable or assignable other than for normal course estate settlement purposes; or
(viii) a change to the amendment provisions of the plan;
(c) any amendment in respect of the persons eligible to participate in the plan (or any part of it), provided that, without shareholder approval, such amendment does not permit non-employee directors to:
(i) participate as holders of PSUs at the discretion of the Board;
(ii) re-gain participation rights under any section of the plan at the discretion of the Board if their eligibility (as a class) to participate had previously been removed; or
(iii) increase limits previously imposed on non-employee director participation;
(d) such amendments as are necessary for the purpose of complying with any changes in any relevant law, rule, regulation, regulatory requirement or requirement of any applicable stock exchange or regulatory authority; or
(e) amendments to correct or rectify any ambiguity, defective provision, error or omission in the plan or in any option agreement, notice to redeem DSUs or PSU agreement.

BALLARD POWER SYSTEMS INC.
MANAGEMENT’S DISCUSSION AND ANALYSIS FOURTH QUARTER 2018
D-1

CAUTION REGARDING FORWARD-LOOKING STATEMENTS
This document contains forward-looking statements about expected events and the financial and operating performance of Ballard
Power Systems Inc. (“Ballard”, “the Company”, “the Corporation”, “we”, “us” or “our”). Forward-looking statements include any
statements that do not refer to historical facts. Forward-looking statements are based on the beliefs of management and reflect our
current expectations as contemplated under the safe harbor provisions of Section 21E of the United States Securities Exchange Act
of 1934, as amended. Such statements include, but are not limited to, statements with respect to our objectives, goals, liquidity,
sources of capital and our outlook including our estimated revenue and gross margins, cash flow from operations, Cash Operating
Costs, EBITDA and Adjusted EBITDA (see Non-GAAP Measures), order backlog, order book of expected deliveries over the
subsequent 12-months, future product costs and selling prices, future product sales and production volumes, expenses / costs,
contributions and cash requirements to and from joint venture operations, as well as statements with respect to our beliefs, plans,
objectives, expectations, anticipations, estimates and intentions. Words such as "estimate", "project", "believe", "anticipate",
"intend", "expect", "plan", "predict", "may", "should", "will", the negatives of these words or other variations thereof and comparable
terminology are intended to identify forward-looking statements. These statements are not guarantees of future performance and
involve assumptions, risks and uncertainties that are difficult to predict.
In particular, these forward-looking statements are based on certain factors and assumptions relating to our expectations with
respect to new and existing customer and partner relationships, the generation of new sales, producing, delivering and selling the
expected product and service volumes at the expected prices and controlling our costs. They are also based on a variety of general
factors and assumptions including, but not limited to, our expectations regarding technology and product development efforts,
manufacturing capacity and cost, product and service pricing, market demand, and the availability and prices of raw materials,
labour and supplies. These assumptions have been derived from information available to the Company including information obtained
by the Company from third parties. These assumptions may prove to be incorrect in whole or in part. In addition, actual results may
differ materially from those expressed, implied, or forecasted in such forward-looking statements. Factors that could cause our actual
results or outcomes to differ materially from the results expressed, implied or forecasted in such forward-looking statements include,
but are not limited to: the condition of the global economy; the rate of mass adoption of our products or related ecosystem,
including the availability of cost-effective hydrogen; changes in product or service pricing or cost; changes in our customers'
requirements, the competitive environment and/or related market conditions; the relative strength of the value proposition that we
offer our customers with our products or services; changes in competitive technologies, including battery and fuel cell technologies;
product safety, liability or warranty issues; challenges or delays in our technology and product development activities; changes in
the availability or price of raw materials, labour and supplies; our ability to attract and retain business partners, suppliers, employees
and customers; changing government or environmental regulations, including subsidies or incentives associated with the adoption of
clean energy products, including hydrogen and fuel cells; our access to funding and our ability to provide the capital required for
product development, operations and marketing efforts, working capital requirements, and joint venture capital contributions; our
ability to protect our intellectual property; our ability to extract value from joint venture operations; currency fluctuations, including
the magnitude of the rate of change of the Canadian dollar versus the U.S. dollar; potential merger and acquisition activities,
including risks related to integration, loss of key personnel, disruptions to operations, costs of integration, and the integration failing
to achieve the expected benefits of the transaction; the general assumption that none of the risks identified in the Risks and
Uncertainties section of this report or in our most recent Annual Information Form will materialize. Readers should not place undue
reliance on Ballard's forward-looking statements.
The forward-looking statements contained in this document speak only as of the date of this Management Discussion and Analysis
(“MD&A”). Except as required by applicable legislation, Ballard does not undertake any obligation to release publicly any updates or
revisions to these forward-looking statements to reflect events or circumstances after the date of this MD&A including the occurrence
of unanticipated events.
D-2

MANAGEMENT’S DISCUSSION AND ANALYSIS March 6, 2019
Section Description 1. Introduction 1.1 Preparation of the MD&A
1.2 Management’s Report on Disclosure Controls and Procedures and Internal Controls over Financial Reporting
1.3 Risks and Uncertainties 2. Core Strategy and Business 2.1 Core Business
2.2 Strategic Imperatives 3. Select Annual Financial Information
and 2019 Business Outlook 3.1 Select Annual Financial Information 3.2 2018 Performance Compared to Revised 2018 Business Outlook 3.3 2019 Business Outlook
4. Recent Developments (Including Contractual Updates)
4.1 Corporate 4.2 China 4.3 Europe 4.4 North America 4.5 Other
5. Results of Operations
5.1 Operating Segments 5.2 Summary of Key Financial Metrics –
Three months ended December 31, 2018 5.3 Summary of Key Financial Metrics –
Year ended December 31, 2018 5.4 Operating Expenses and Other Items –
Three months and year ended December 31, 2018 5.5 Summary of Quarterly Results
6. Cash Flow, Liquidity and Capital Resources 6.1 Summary of Cash Flows 6.2 Cash Provided by (Used by) Operating Activities 6.3 Cash Provided by (Used by) Investing Activities 6.4 Cash Provided by (Used by) Financing Activities 6.5 Liquidity and Capital Resources
7. Other Financial Matters 7.1 Off Balance Sheet Arrangements and Contractual Obligations
7.2 Related Party Transactions 7.3 Outstanding Share and Equity Information
8. Accounting Matters 8.1 Overview 8.2 Critical Judgements in Applying Accounting Policies 8.3 Key Sources of Estimation Uncertainty 8.4 Recently Adopted Accounting Policy Changes 8.5 Future Accounting Policy Changes
9. Supplemental Non-GAAP Measures and Reconciliations
9.1 Overview 9.2 Cash Operating Costs 9.3 EBITDA and Adjusted EBITDA 9.4 Adjusted Net Loss
D-3
INTRODUCTION
1.1 Preparation of the MD&A
This discussion and analysis of financial condition and results of operations of Ballard Power
Systems Inc. (“Ballard”, “the Company”, “we”, “us” or “our”) is prepared as at March 6,
2019 and should be read in conjunction with our audited consolidated financial statements
and accompanying notes for the year ended December 31, 2018. The results reported
herein are presented in U.S. dollars unless otherwise stated and have been prepared in
accordance with International Financial Reporting Standards (“IFRS”) as issued by the
International Accounting Standards Board. Additional information relating to the Company,
including our Annual Information Form, is filed with Canadian (www.sedar.com) and U.S.
securities regulatory authorities (www.sec.gov) and is also available on our website at
www.ballard.com.
1.2 Management’s Report on Disclosure Controls and Procedures and Internal Controls over Financial Reporting
Disclosure controls and procedures Our disclosure controls and procedures are designed to provide reasonable assurance that
relevant information is gathered and reported to senior management, including the Chief
Executive Officer (“CEO”) and the Chief Financial Officer (“CFO”), on a timely basis so that
appropriate decisions can be made regarding public disclosures.
As of the end of the period covered by this report, we evaluated, under the supervision and
with the participation of management, including the CEO and the CFO, the effectiveness of
the design and operation of our disclosure controls and procedures, as defined in Rules 13a–
15(e) and 15d-15(e) of the Securities Exchange Act of 1934 (“Exchange Act”). The CEO and
CFO have concluded that as of December 31, 2018, our disclosure controls and procedures
were effective to ensure that information required to be disclosed in reports we file or
submit under the Exchange Act is recorded, processed, summarized and reported within the
time periods specified therein, and accumulated and reported to management to allow
timely discussions regarding required disclosure.
Internal control over financial reporting The CEO and CFO, together with other members of management, are responsible for
establishing and maintaining adequate internal control over the Company’s financial
reporting. Internal control over financial reporting is designed under our supervision, and
effected by the Company’s board of directors, management, and other personnel, to provide
reasonable assurance regarding the reliability of financial reporting and the preparation of
financial statements for external purposes in accordance with IFRS.
There are inherent limitations in the effectiveness of internal control over financial reporting,
including the possibility that misstatements may not be prevented or detected. Accordingly,
even effective internal controls over financial reporting can provide only reasonable
assurance with respect to financial statement preparation. Furthermore, the effectiveness of
internal controls can change with circumstances.
Management, including the CEO and CFO, have evaluated the effectiveness of internal
control over financial reporting, as defined in Rules 13a–15(f) of the Exchange Act, in
D-4
relation to criteria described in Internal Control–Integrated Framework (2013) issued by the
Committee of Sponsoring Organizations of the Treadway Commission (“COSO”). Based on
this evaluation, management has determined that internal control over financial reporting
was effective as of December 31, 2018.
KPMG LLP, our independent registered public accounting firm, has audited our consolidated
financial statements and expressed an unqualified opinion thereon. KPMG has also
expressed an unqualified opinion on the effectiveness of our internal control over financial
reporting as of December 31, 2018.
Changes in internal control over financial reporting During the year ended December 31, 2018, there were no changes in internal control over
financial reporting that have materially affected, or are reasonably likely to materially affect,
the Company’s internal control over financial reporting. Our design of disclosure controls
and procedures and internal controls over financial reporting includes controls, policies and
procedures covering all of our subsidiaries including Ballard Power Systems Europe A/S,
Protonex Technology Corporation (re-named Ballard Unmanned Systems Inc. as of January
1, 2019), and Guangzhou Ballard Power Systems Co., Ltd.
1.3 Risks and Uncertainties An investment in our common shares involves risk. Investors should carefully consider the
risks and uncertainties described below and in our Annual Information Form. The risks and
uncertainties described in our Annual Information Form are not the only ones we face.
Additional risks and uncertainties, including those that we do not know about now or that
we currently deem immaterial, may also adversely affect our business. For a more complete
discussion of the risks and uncertainties which apply to our business and our operating
results, please see our Annual Information Form and other filings with Canadian
(www.sedar.com) and U.S. (www.sec.gov) securities regulatory authorities.
A summary of our identified risks and uncertainties are as follows:
We may not be able to successfully execute our business plan;
In our Heavy-Duty Motive market, we depend on a limited number of customers for a
majority of our revenues and are subject to risks associated with early stage market
activities related to fuel cell bus, truck, rail and marine applications;
In our Heavy-Duty Motive market, we depend on a limited number of Chinese customers
for a majority of our revenues. Macro-economic conditions, including government
subsidy programs and significant and recent volatility in China’s capital markets, may
adversely impact our Chinese customer’s access to capital and program plans which
could adversely impact our business. Furthermore, successful large-scale deployment of
zero-emission vehicles will require adequate investment in hydrogen fueling
infrastructure and competitive pricing of hydrogen. Inadequate hydrogen fueling
infrastructure and/or excessive hydrogen fuel costs could negatively impact deployment
of zero-emission vehicles and may negatively impact our business, financial condition
and results of operations. Our performance in China is dependent on our business model
of localization, including the strength and performance of our localization partners. A key
part of our strategy is based on the localization of stack and module production with
joint venture partners, where we do not control the joint venture;
D-5

In our Heavy-Duty Motive market, a significant amount of operations are conducted by
joint ventures in China that we cannot operate solely for our benefit;
In our Technology Solutions market, we depend on a single customer for the majority of
our revenues and are subject to risks related to that customer’s continued commitment
to the commercialization of fuel cell passenger cars;
In our Material Handling market, we depend on a single customer for the majority of our
revenues and are subject to risks from that customer’s internal stack development and
commercialization plans;
We expect our cash reserves will be reduced due to future operating losses, working
capital requirements and capital contributions to our joint venture(s) in China, and we
cannot provide certainty as to how long our cash reserves will last or that we will be able
to access additional capital when necessary;
Potential fluctuations in our financial and business results make forecasting difficult and
may restrict our access to funding for our commercialization plan;
We are dependent upon Original Equipment Manufacturers and Systems Integrators to
purchase certain of our products;
Our technology and products may not meet the market requirements, including relating
to performance and / or cost;
We may not be able to achieve commercialization of our products on the timetable we
anticipate, or at all;
A mass market for our products may never develop or may take longer to develop than
we anticipate;
We are subject to risks inherent in international operations, including restrictions on the
conversion of currencies and restrictions on repatriation of funds;
We have limited experience manufacturing fuel cell products on a commercial basis;
Warranty claims, product performance guarantees, or indemnification claims could
negatively impact our gross margins and financial performance;
We could be adversely affected by risks associated with acquisitions;
We depend on our intellectual property, and our failure to protect that intellectual
property could adversely affect our expected future growth and success;
We may experience cybersecurity threats to our information technology infrastructure
and systems, and unauthorized attempts to gain access to our proprietary or confidential
information, as may our customers, suppliers, subcontractors and joint venture
partners;
Global macro-economic conditions are beyond our control and may have an adverse
impact on our business or on our key suppliers and / or customers;
We currently face and will continue to face significant competition;
We could lose or fail to attract the personnel necessary to operate our business;
Public Policy and regulatory changes could hurt the market for our products and
services;
We are dependent on third party suppliers for the supply of key materials and
components for our products and services;
D-6

Exchange rate fluctuations are beyond our control and may have a material adverse
effect on our business, operating results, financial condition and profitability;
Commodity price fluctuations are beyond our control and may have a material adverse
effect on our business, operating results, financial condition and profitability;
We could be liable for environmental damages resulting from our research, development
or manufacturing operations;
If completed, potential merger and acquisition activity may fail to achieve the expected
benefits of the transaction, including potential disruptions to operations, higher than
anticipated costs and efforts to integrate, and loss of key personnel; and
Our products use flammable fuels and some generate high voltages, which could subject
our business to product liability or other claims.
2. CORE BUSINESS AND STRATEGY
2.1 Core Business
At Ballard, our vision is to deliver fuel cell power for a sustainable planet. We are recognized
as a world leader in proton exchange membrane (“PEM”) fuel cell power system
development and commercialization.
Our principal business is the design, development, manufacture, sale and service of PEM
fuel cell products for a variety of applications, focusing on our power product markets of
Heavy-Duty Motive (consisting of bus, truck, rail and marine applications), Portable Power /
UAV, Material Handling and Backup Power, as well as the delivery of Technology Solutions,
including engineering services, technology transfer, and the license and sale of our
extensive intellectual property portfolio and fundamental knowledge for a variety of fuel cell
applications.
A fuel cell is an environmentally clean electrochemical device that combines hydrogen fuel
with oxygen (from the air) to produce electricity. The hydrogen fuel can be obtained from
natural gas, kerosene, methanol or other hydrocarbon fuels, or from water through
electrolysis. Ballard’s clean-energy fuel cell products feature high fuel efficiency, relatively
low operating temperature, low noise and vibration, compact size, quick response to
changes in electrical demand, and modular design. Embedded in each Ballard fuel cell
product lies a stack of unit cells designed with our proprietary PEM technology, which
include membrane electrode assemblies, catalysts, plates, and other key components, and
draw on intellectual property from our patent portfolio, together with our extensive
experience and know-how, in key areas of fuel cell stack design, operation, production
processes and systems integration.
We are based in Canada, with head office, research, technology and product development,
testing, manufacturing and service facilities in Burnaby, British Columbia. We also have a
sales, assembly, service and research and development facility in Hobro, Denmark; and a
sales, assembly, research and development facility in Southborough, Massachusetts. We
also have an office in Guangzhou, the capital of Guangdong Province, China. This office
serves as the Company’s initial operations center in China, with China management, sales
and business development, technical, quality, supply chain, after-sales and administrative
support personnel. We also have a non-controlling, 49% interest, in the newly established
D-7

Weichai Ballard Hy-Energy Technologies Co., Ltd. (“Weichai Ballard JV”), located in China.
Weichai Ballard JV is intended to manufacture Ballard’s next-generation LCS fuel cell stack
and LCS-based power modules for bus, commercial truck and forklift applications with
exclusive rights in China. In addition, we retain a non-controlling 10% interest in
Guangdong Synergy Ballard Hydrogen Power Technology Co., Ltd. (“Synergy Ballard JVCo”),
also located in China. Synergy Ballard JVCo is intended to manufacture fuel cell stacks
utilizing our existing FCvelocity®-9SSL fuel cell stack technology for use primarily in fuel
cell engines assembled in China to provide propulsion power for zero-emission fuel cell
electric buses and commercial vehicles in China.
1.2 Strategic Imperatives
We plan to build value for our shareholders by developing, manufacturing, selling and
servicing zero-emission, industry-leading PEM fuel cell technology products and services to
meet the needs of our customers in select target markets.
We are pursuing a corporate strategy and business model that leverages growth and
mitigates risk by diversifying our business across a portfolio of market opportunities that are
enabled by substantially the same core competencies, technology, products and intellectual
property. Our business model includes two growth platforms (power products and
technology solutions), multiple markets within each of these platforms, geographic
diversification and customer diversification.
We are also pursuing a strategy that supports commercialization, revenue and profitability,
while also enabling future value based on longer-term market opportunities for our
technology, products and intellectual property, such as the global automotive fuel cell
market and the unmanned aerial vehicle (“UAV”) or drone market.
Our two-pronged approach is to build shareholder value through the sale and service of
power products and the delivery of technology solutions. In power product sales, our focus
is on meeting the power needs of our customers by delivering high value, high reliability,
high quality and innovative PEM fuel cell products. Through technology solutions, our focus
is on enabling our customers to solve their technical and business challenges and accelerate
the adoption of fuel cell technology by delivering customized, high value, bundled
technology solutions, including specialized engineering services, access to our deep
intellectual property portfolio and know-how through licensing or sale, and by providing
technology component supply.
Starting in 2015, we increased our efforts on growing our business in China. China
represents a potentially unique opportunity for zero and low-emission motive solutions,
given the convergence of macro trends that include:
continued urbanization of China’s population;
continued infrastructure development and build-out of mass urban transportation;
the large size and continued growth of the Chinese vehicle market;
rapid adoption of electric vehicles in China;
serious air quality challenges in a number of Chinese cities;
a Chinese government mandate to address climate change; and
D-8

strong national and local government commitment supporting the adoption and
commercialization of fuel cells in new-energy vehicle transportation applications,
including the implementation of supporting subsidy programs.
As part of our strategy, we have been working to develop a local fuel cell supply chain and
related ecosystem to address new-energy bus and commercial vehicle markets in China. We
believe this strategy aligns with current and expected local content requirements for
government subsidies supporting the adoption of fuel cell electric vehicles (“FCEV”). Key
elements of our strategy include adopting a business model in which we seek to mitigate
market adoption risk and capital investment by engaging partnerships with local companies
that market our products and invest in manufacturing operations and supply chain
localization.
As part of our strategy, we are pursuing technology transfer and licensing opportunities with
Chinese partners in order to localize the manufacture of Ballard-designed fuel cell modules
and fuel cell stacks for heavy-duty motive applications in China, including bus, commercial
vehicles, material handling and light-rail applications. We typically seek to structure our
arrangements in a way that provide us with payments from our partners of significant value
for technology transfer early in the transfer process, requirements for ongoing purchases by
our partners of components from us, and requirements for our partners to comply with
certain performance conditions and reporting requirements, including quality, branding, and
intellectual property protections. We believe these typical transaction structures provide for
near-, mid- and long-term revenue and cash flow streams by building in program phases,
technology transfer payments, license payments, required supply purchases, and recurring
royalty or other long-term cash generation structures. We also typically structure our
commercial transactions in China to restrict sales to that country and to position Ballard as
the exclusive purchaser of fuel cell modules or fuel cell stacks manufactured by our partners
in China for sale outside of China. We believe this structure provides us with additional
flexibility in satisfying global market demand for our modules and stacks by supplementing
or mitigating our mid- and long-term manufacturing strategy.
We also structure our business model in China to protect our core intellectual property. For
example, we currently do not provide technology transfer and licensing relating to the
manufacture of our proprietary membrane electrode assemblies (“MEAs”), a key high value
technology component in our fuel cell stacks. We currently plan to continue to manufacture
our MEAs in our head office facilities in Burnaby, Canada.
We continue to make significant investment in next generation products and technology,
including MEAs, stacks, modules, and systems integration.
D-9
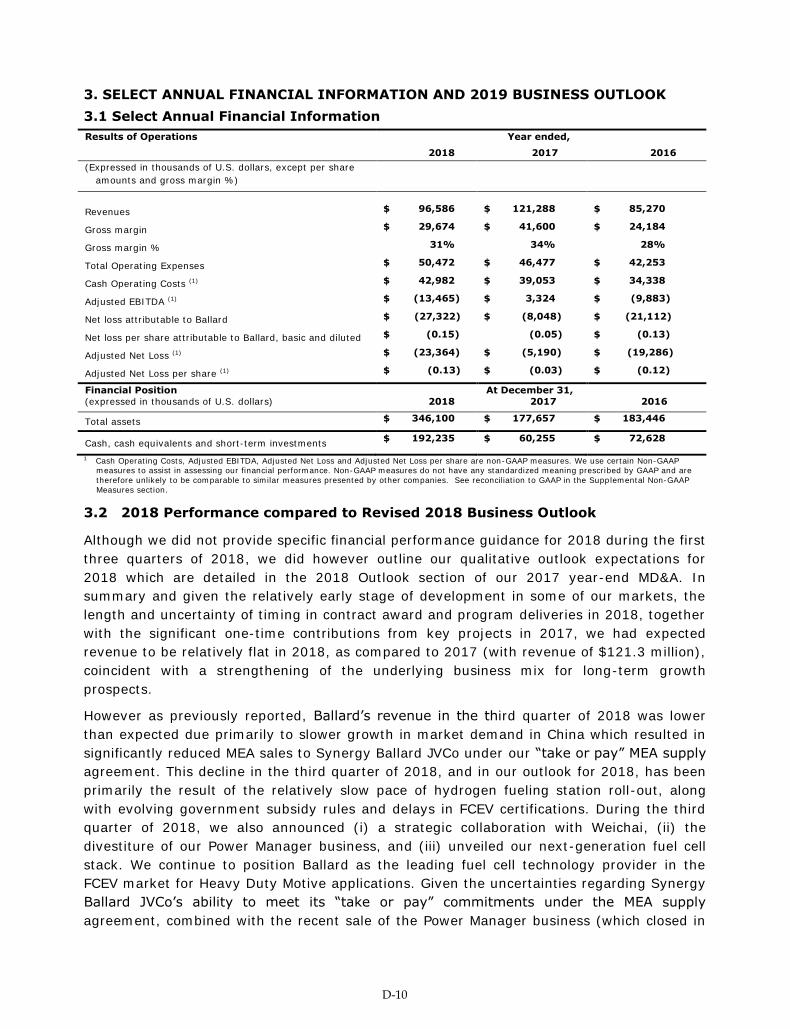
3. SELECT ANNUAL FINANCIAL INFORMATION AND 2019 BUSINESS OUTLOOK 3.1 Select Annual Financial Information Results of Operations Year ended,
2018 2017 2016 (Expressed in thousands of U.S. dollars, except per share
amounts and gross margin %)
Revenues $ 96,586 $ 121,288 $ 85,270
Gross margin $ 29,674 $ 41,600 $ 24,184
Gross margin % 31% 34% 28%
Total Operating Expenses $ 50,472 $ 46,477 $ 42,253
Cash Operating Costs (1) $ 42,982 $ 39,053 $ 34,338
Adjusted EBITDA (1) $ (13,465) $ 3,324 $ (9,883)
Net loss attributable to Ballard $ (27,322) $ (8,048) $ (21,112)
Net loss per share attributable to Ballard, basic and diluted $ (0.15) (0.05) $ (0.13)
Adjusted Net Loss (1) $ (23,364) $ (5,190) $ (19,286)
Adjusted Net Loss per share (1) $ (0.13) $ (0.03) $ (0.12)
Financial Position At December 31, (expressed in thousands of U.S. dollars) 2018 2017 2016
Total assets $ 346,100 $ 177,657 $ 183,446
Cash, cash equivalents and short-term investments $ 192,235 $ 60,255 $ 72,628
1 Cash Operating Costs, Adjusted EBITDA, Adjusted Net Loss and Adjusted Net Loss per share are non-GAAP measures. We use certain Non-GAAP measures to assist in assessing our financial performance. Non-GAAP measures do not have any standardized meaning prescribed by GAAP and are
therefore unlikely to be comparable to similar measures presented by other companies. See reconciliation to GAAP in the Supplemental Non-GAAP
Measures section.
3.2 2018 Performance compared to Revised 2018 Business Outlook
Although we did not provide specific financial performance guidance for 2018 during the first
three quarters of 2018, we did however outline our qualitative outlook expectations for
2018 which are detailed in the 2018 Outlook section of our 2017 year-end MD&A. In
summary and given the relatively early stage of development in some of our markets, the
length and uncertainty of timing in contract award and program deliveries in 2018, together
with the significant one-time contributions from key projects in 2017, we had expected
revenue to be relatively flat in 2018, as compared to 2017 (with revenue of $121.3 million),
coincident with a strengthening of the underlying business mix for long-term growth
prospects.
However as previously reported, Ballard’s revenue in the third quarter of 2018 was lower
than expected due primarily to slower growth in market demand in China which resulted in
significantly reduced MEA sales to Synergy Ballard JVCo under our “take or pay” MEA supply
agreement. This decline in the third quarter of 2018, and in our outlook for 2018, has been
primarily the result of the relatively slow pace of hydrogen fueling station roll-out, along
with evolving government subsidy rules and delays in FCEV certifications. During the third
quarter of 2018, we also announced (i) a strategic collaboration with Weichai, (ii) the
divestiture of our Power Manager business, and (iii) unveiled our next-generation fuel cell
stack. We continue to position Ballard as the leading fuel cell technology provider in the
FCEV market for Heavy Duty Motive applications. Given the uncertainties regarding Synergy
Ballard JVCo’s ability to meet its “take or pay” commitments under the MEA supply
agreement, combined with the recent sale of the Power Manager business (which closed in
D-10

October 2018) and the associated absence of Power Manager-related revenue in the fourth
quarter of 2018, we had therefore revised our revenue expectations for 2018 to
approximately $90 million to $95 million.
Actual revenues in 2018 of $96.6 million slightly exceeded this revised revenue outlook of
between $90 million to $95 million and were primarily as a result of higher than expected
Technology Solutions revenues in the fourth quarter of 2018.
3.3 2019 BUSINESS OUTLOOK
Given the early stage of hydrogen fuel cell market development and adoption, and
consistent with the Company’s past approach, Ballard is not providing specific financial
performance guidance for 2019. However, directionally the Company anticipates total
revenue on a year-over-year basis in 2019 to be relatively flat to 2018, as work progresses
on the establishment of the new joint venture operation in China with Weichai and on
addressing commercial opportunities stemming from growing momentum in other key
target markets.
During 2019, Ballard intends to focus on the early stage execution of the collaboration
agreement with Weichai, further penetration of the European and California markets in
certain Heavy and Medium Duty Motive applications, and continued investment in talent,
technology, products and customer experience. The foundation for the 2019 Outlook
includes a 12-Month Order Book of approximately $69 million at the beginning of the year,
along with a robust sales pipeline. Industry activity levels continue to increase in China,
Europe and North America, including development programs, demonstration programs and
commercial deployments.
In China, Ballard has been pursuing the development of a local fuel cell supply chain and
related ecosystem to address the growing zero-emission bus and commercial vehicle
markets. The collaboration with Weichai that closed in the fourth quarter of 2018 represents
a critical step in positioning the company with strong players in China’s Heavy-Duty Motive
industry and in preparing for the effective delivery of zero-emission fuel cell solutions based
on Ballard’s next-generation FCgen®-LCS fuel cell stack and FCgen®LCS-based power
modules. The collaboration with Weichai has generated increased cash reserves and,
moving forward, is expected to increase corporate revenue through the transfer of LCS
technology and module designs and the sale of MEAs to the joint venture in which Ballard
has a 49% minority position. During 2019, the Company plans to make additional capital
contributions to Weichai Ballard JV of approximately $21 million, including $14.5 million
which was contributed in February 2019. Ballard anticipates making additional contributions
beyond 2019 in order to continue to fund our pro rata ownership share of Weichai Ballard
JV’s operations. In addition, the Company expects to record equity investment losses in
joint venture and associates of approximately $15 million to $20 million in 2019 in
connection with the operations of Weichai Ballard JV. Since the technology transfer and the
establishment of operations in the joint venture will take some time, the proportion of total
revenue generated from the China market in 2019 is expected to be lower than in 2018.
In Europe, during 2019 the Company will continue execution of the HyMotion program with
Audi, will deliver a significant number of modules to support fuel cell electric buses
(“FCEBs”) for deployment in Germany under the Joint Initiative for Hydrogen Vehicles
D-11

across Europe (“JIVE”) funding program, and also expects increased market activity for
FCEBs, which can be expected to result in additional module purchase orders. The
proportion of total revenue generated from the European market is expected to increase in
2019, relative to 2018, largely offsetting the proportionate decline in revenue from China.
Within North America in 2019, Ballard expects increased market activity in California for
FCEVs, which can be expected to result in additional module purchase orders. In addition, a
consistent volume of fuel cell stack sales for forklift applications is also expected.
Technology Solutions revenue is expected to increase in 2019, underpinned by ongoing
work on the HyMotion program with Audi, technology transfer activity in relation to the joint
venture with Weichai, as well as engineering services activity with existing and new
customers in the automotive, rail, material handling and UAV sectors. This revenue increase
is expected to largely offset a decline in Heavy Duty Motive revenue.
In summary, given the relatively early stage of development in some markets and the
uncertainty of timing in contract awards and program deliveries in 2019, Ballard expects
revenue to be relatively flat compared to 2018, coincident with a strengthening of the
underlying business mix for long-term growth prospects.
Our 2019 revenue outlook is supported by our 12-month Order Book of approximately $69
million which is derived from our Order Backlog of approximately $195 million as of
December 31, 2018. Our Order Backlog represents the estimated aggregate value of orders
at a given time for which customers have made contractual commitments and our 12-month
Order Book represents the aggregate expected value of that portion of the Order Backlog
that the Company expects to deliver in the subsequent 12-month period.
Our outlook for 2019 is based on our internal forecast which reflects an assessment of
overall business conditions and takes into account actual sales and financial results in the
first two months of 2019; sales orders received for units and services expected to be
delivered in the remainder of 2019; an estimate with respect to the generation of new sales
and the timing of deliveries in each of our markets for the balance of 2019; and assumes an
average U.S. dollar exchange rate in the mid $0.70’s in relation to the Canadian dollar for
2019.
The primary risk factors to our revised business outlook expectations for 2019 are customer
or production delays in delivering against existing orders and delays from forecast in terms
of closing and delivering expected sales primarily in our Heavy-Duty Motive market
including expected sales to Weichai Ballard JV and / or Weichai; adverse macro-economic
conditions, changes in government subsidy and incentive programs; inadequate investment
in hydrogen infrastructure and / or excessive hydrogen fuel costs, all of which could
negatively impact our customers’ access to capital and the success of their program plans
which could adversely impact our Heavy-Duty market; disruptions in our Heavy-Duty
market due to delays of supply of key materials and components from third party suppliers;
disruptions in our Technology Solutions market as a result of our significant reliance on a
limited number of customers including Audi and Weichai Ballard JV in this growth platform,
which are reliant on their internal commercialization plans and budget requirements;
disruptions in the Material Handling market as a result of our reliance on a single customer
in this market and that customer’s internal stack development and commercialization plans;
D-12

and fluctuations in the Canadian dollar relative to the U.S. dollar, as a significant portion of
our Technology Solutions revenues (including the technology development and engineering
services agreement with Audi) are priced in Canadian dollars.
Our Order Backlog and our 12-month Order Book are currently comprised of a relatively
limited number of contracts and a relatively limited number of customers. Given the relative
immaturity of our industry and customer deployment programs, our Order Backlog and 12-
month Order Book are potentially vulnerable to risk of cancellation, deferral or non-
performance by our customers for a variety of reasons including: risks related to customer
liquidity; credit risks; risks related to changes, reductions or eliminations in government
policies, subsidies and incentives; risks related to slower market adoption; risks related to
vehicle integration challenges; risks related to the development of effective hydrogen
refueling infrastructure; risks related to the ability of our products to meet evolving market
requirements; and supplier-related risks.
Furthermore, potential fluctuations in our financial results make financial forecasting
difficult. The Company's revenues, cash flows and other operating results can vary
significantly from quarter to quarter. Sales and margins may be lower than anticipated due
to general economic conditions, market-related factors, operating factors and competitive
factors. Cash receipts may also vary from quarter to quarter due to the timing of cash
collections from customers. As a result, quarter-to-quarter comparisons of revenues, cash
flows and other operating results may not be meaningful; instead, we believe our operating
performance should be assessed over a number of quarters and years. In addition, due to
the early stage of development of the market for hydrogen fuel cell products, it is difficult to
accurately predict future revenues, cash flows or results of operations on a quarterly basis.
It is likely that in one or more future quarters, financial results will fall below the
expectations of securities analysts and investors. If this occurs, the trading price of the
Company's shares may be materially and adversely affected.
4 RECENT DEVELOPMENTS (Including Contractual Updates)
4.1 Corporate
Development of Next Generation Zero-Emission Fuel Cell Stack for Heavy-Duty Motive
applications
On September 18, 2018, we unveiled our next-generation high performance liquid-cooled
fuel cell stack (“LCS”), the FCgen®-LCS, at the IAA Commercial Vehicles Trade Fair and
Convention in Hannover, Germany. The FCgen®-LCS features important design and
performance enhancements, while also offering a reduction in total-cost-of-ownership. This
stack will be a core technology component of Ballard’s 8th-generation power module
portfolio for use in Heavy-Duty Motive applications – including buses, commercial trucks and
trains – planned for initial launch in 2019, and other applications such as forklifts.
Benefits of the FCgen®-LCS, compared to the current generation liquid-cooled fuel cell
stack that it will replace, are expected to include lower cost, improved durability, high power
density, freeze start capability, higher tolerance to operating conditions, simplified systems
integration, and sustainability.
Ballard will continue to support the Company’s existing customers where current generation
FCvelocity®-9SSL fuel cell stack technology is used.
D-13

Acquisition of assets of Automotive Fuel Cell Cooperation Corporation
On July 3, 2018, we announced that the acquisition of certain strategic assets of Automotive
Fuel Cell Cooperation Corporation (“AFCC”), a private company owned by Daimler AG
(“Daimler”) and Ford Motor Company (“Ford”). Pursuant to the wind-down of AFCC’s
operations in Vancouver, which were co-located with Ballard at our headquarters, Daimler
and Ford have instead in-housed and relocated their fuel cell stack development activities to
their respective operations in Germany and the United States. As a result, Daimler and Ford
agreed to sell AFCC assets to Ballard for approximately Canadian $6 million.
This acquisition supports and accelerates our growth plans in two key respects. First, it
immediately provides needed expansion of our product and material testing capabilities that
will be used to support new and existing programs, products, as well as customers. In
addition, we have acquired key production equipment that supports forecasted growth over
the next five years. With these assets already in place and functioning within Ballard’s
existing facilities, this transaction accelerated the expansion of our fuel cell testing,
production and lab capacity at a lower cost, compared to acquiring new equipment. The
acquired assets include testing equipment, prototype production equipment, and lab and
quality inspection equipment.
Filing of Base Shelf Prospectus ahead of expiry of existing Shelf Prospectus
Ballard had a shelf prospectus on file with the securities regulators in Canada and the United
States, expiring on July 16, 2018. Prior to expiry of that shelf prospectus, we filed a final
short form base shelf prospectus (“Prospectus”), which provides us continued flexibility to
make offerings of securities during the effective period of the Prospectus, until July 2020.
The Prospectus was filed in each of the provinces and territories of Canada, except Quebec,
and a corresponding shelf registration statement on Form F-10 (Registration Statement)
was also filed with the United States Securities and Exchange Commission (“SEC”). These
filings enable offerings of securities up to an aggregate initial offering price of US$150
million at any time during the 25-month period that the Prospectus remains effective. If any
securities are offered under the Prospectus and/or Registration Statement, the terms of any
such securities and the intended use of the net proceeds resulting from such offering would
be established at the time of any offering and would be described in a Prospectus
supplement filed with applicable Canadian securities regulators and/or the SEC,
respectively, at the time of such an offering.
4.2 China
Weichai Power Co., Ltd.
On November 13, 2018, we announced the closing of a strategic collaboration transaction
with Weichai Power Co., Ltd. (“Weichai”), initially detailed on August 29, 2018.
Ballard’s strategic collaboration with Weichai includes the following key elements:
Equity Investment – an equity investment in Ballard made by Weichai in the amount of
$163.6 million, representing a 19.9% interest in the company, through the subscription
and purchase of 46.1 million shares from treasury at a price of $3.54, which reflected a
15% premium to the 30-day VWAP of $3.08 on August 29, 2018.
In addition, Zhongshan Broad-Ocean Motor Co., Ltd. (“Broad-Ocean” – a current Ballard
strategic investor and Chinese partner) – invested a further $20.2 million, through the
D-14

subscription and purchase of 5.7 million shares from treasury at the same price of $3.54
to maintain its 9.9% ownership position in Ballard.
As a result, the Weichai investment and the incremental Broad-Ocean equity
investments in Ballard generated total gross proceeds of $183.8 million. The use of
proceeds is expected to include investment in Ballard’s core fuel cell business, equity
contributions to a joint venture company established by Weichai and Ballard, and
support of potential M&A transactions.
The Weichai investment and the Broad-Ocean incremental investment are subject to 2-
year “standstill” and resale restrictions (subject to customary exceptions). For so long as
Weichai holds at least 15% of Ballard’s outstanding shares, it will have the right to
nominate two directors to Ballard’s board of directors. On January 1, 2019, the Company
appointed Mr. Jiang Kui (also known as Mr. Kevin Jiang) and Mr. Sun Shaojun (also
known as Mr. Sherman Sun) to the Company’s Board of Directors and expanded
Ballard’s Board of Directors from seven members to nine members.
Weichai has also agreed that, in the event of a third-party offer to buy Ballard, Weichai
will have the right to make a superior proposal or otherwise must vote its shares in
accordance with the Ballard board recommendation.
China Joint Venture and Technology Transfer Agreement – Weichai and Ballard have
established a joint venture company in Shandong Province to support China’s Fuel Cell
Electric Vehicle market, with Weichai holding a controlling ownership interest of 51%
and Ballard holding an initial 49% ownership position. The joint venture, Weichai Ballard
Hy-Energy Technologies Co., Ltd. (“Weichai Ballard JV”) was established in the fourth
quarter of 2018 with Weichai making an initial capital contribution in 2018 of RMB 102
million and Ballard making an initial capital contribution of $14.3 million (RMB 98 million
equivalent). Subsequent to year-end, Weichai made its planned second capital
contribution of RMB 102 million and Ballard made its planned second capital contribution
of $14.5 million (RMB 98 million equivalent). Weichai and Ballard will fund pro rata
shares of the Weichai Ballard JV based on an agreed business plan. Weichai will hold
three of five Weichai Ballard JV board seats and Ballard will hold two, with Ballard having
certain shareholder protection provisions.
The Weichai Ballard JV will manufacture Ballard’s next-generation LCS fuel cell stack and
LCS-based power modules for bus, commercial truck and forklift applications with
exclusive rights in China and will pay Ballard $90 million under a program to develop
and transfer technology to the Weichai Ballard JV in order to enable these manufacturing
activities. Revenue earned from the $90 million Weichai Ballard JV technology transfer
agreement ($1.2 million in the fourth quarter of 2018 and in fiscal 2018) is recorded as
Technology Solutions revenues. During the fourth quarter of 2018, Ballard received an
initial 10%, or $9.0 million prepayment from Weichai Ballard JV for this program. Ballard
will also retain an exclusive right to the developed technologies outside China.
The Weichai Ballard JV will purchase MEAs for LCS fuel cell stacks exclusively from
Ballard under a long-term supply agreement. Revenue earned from an MEA supply
agreement (nil million to date) will be recorded as Heavy-Duty Motive revenues.
Fuel Cell Sales – Weichai intends to build and supply at least 2,000 fuel cell modules
using Ballard technology by 2021 for commercial vehicles in China. Specific terms
D-15

related to the source and scope of supply, product mix, pricing and timing of shipments
are subject to future agreement between the parties and the Weichai Ballard JV.
Zhongshan Broad-Ocean Motor Co., Ltd.
As noted above, on November 13, 2018 Broad-Ocean invested a further $20.2 million,
through the subscription and purchase of 5.7 million shares from treasury at the same price
of $3.54 per share as paid by Weichai to maintain its 9.9% ownership position in Ballard.
On December 6, 2017, we announced that a subsidiary of strategic partner Broad-Ocean
called Shanghai Edrive Co. Ltd. ("Shanghai Edrive") has commissioned its fuel cell engine
manufacturing facility located in the City of Shanghai, China. Shanghai Edrive plans to
primarily assemble Ballard FCveloCity® 30-kilowatt (kW) fuel cell engines at the facility
under a technology transfer, licensing and supply arrangement between Ballard and Broad-
Ocean that closed earlier in 2017. Broad-Ocean also has plans to assemble Ballard-designed
engines at locations in Shandong and Hubei Provinces.
On June 5, 2017, we announced the closing of an approximate $18 million supply contract
with Broad-Ocean to support the expected deployment of 400 FCveloCity® fuel cell engines
integrated into clean energy buses and trucks in key Chinese cities. This announcement,
together with an approximate $11 million transaction announced on April 6, 2017 for the
planned deployment of 200 FCveloCity® fuel cell engines, means that Ballard is supporting
Broad-Ocean through the expected deployment of 600 fuel cell engines having a total value
of approximately $29 million. All 600 fuel cell engines and related components were
delivered by Ballard in 2017. Revenue earned from these agreements (nil million in 2018;
$20.7 million in the fourth quarter of 2017; $28.7 million in fiscal 2017), which are
complete, is recorded as Heavy-Duty Motive revenues.
On April 6, 2017, we also announced the closing of a transaction (the “Broad-Ocean
Program”) previously announced on February 16, 2017, relating to technology transfer,
licensing and supply arrangements with Broad-Ocean for the assembly and sale of
FCveloCity® 30-kilowatt (kW) and 85kW fuel cell engines in China. Under the Broad-Ocean
Program, Broad-Ocean can manufacture fuel cell modules in three strategic regions in
China, including Shanghai. The Broad-Ocean Program and future amounts payable to
Ballard are dependent on the attainment of certain commissioning milestones by Broad-
Ocean. In each of the three assembly operation locations, Broad-Ocean will also need to
engage with local governments as well as with bus and commercial vehicle OEMs for
deployment of fuel cell buses and commercial vehicles incorporating Ballard-designed
modules manufactured by Broad-Ocean. Ballard will have the exclusive right to purchase
fuel cell engines from any of the Broad-Ocean manufacturing operations for sale outside
China. Each Ballard-designed fuel cell engine assembled by Broad-Ocean is required to
utilize FCvelocity®-9SSL fuel cell stacks. Stack supply is expected to be provided by
Synergy Ballard JVCo with Ballard being the exclusive supplier of MEAs for stacks
manufactured by Synergy Ballard JVCo. Revenue earned from these Broad-Ocean
technology transfer agreements ($0.1 million in the fourth quarter of 2018; $3.5 million in
fiscal 2018; $0.6 million in the fourth quarter of 2017; $2.0 million in fiscal 2017) is
recorded as Technology Solutions revenues.
Broad-Ocean has also expressed an interest in acquiring a 10% ownership position in the
Weichai Ballard JV, which if transacted, would correspondingly reduce Ballard’s ownership
D-16

position from 49% to 39%. Discussions regarding this investment are currently underway
between the parties.
On August 18, 2016, Broad-Ocean purchased 17.25 million Ballard common shares issued
from treasury for total proceeds to Ballard of $28.3 million. The investment represented
approximately 9.9% of Ballard’s outstanding common shares following the transaction.
Broad-Ocean and Ballard also entered into an Investor Rights Agreement under which
Ballard granted Broad-Ocean certain anti-dilution rights to maintain its 9.9% ownership
interest. Broad-Ocean has no special right to appoint nominees to Ballard's board of
directors.
Guangdong Synergy Ballard Hydrogen Power Co., Ltd.
During 2017, the FCvelocity®-9SSL fuel cell stack joint venture operation in the city of
Yunfu in China’s Guangdong Province commenced operations. Ballard has a non-controlling
10% interest in the joint venture, called Guangdong Synergy Ballard Hydrogen Power
Technology Co., Ltd. (“Synergy Ballard JVCo”), together with our partner Guangdong Nation
Synergy Hydrogen Power Technology Co. Ltd. (a member of the “Synergy Group”) who has
a 90% interest. The fuel cell stacks manufactured by Synergy Ballard JVCo are expected to
be used primarily in fuel cell engines assembled in China to provide propulsion power for
zero-emission fuel cell electric buses and commercial vehicles in China. The Synergy Ballard
JVCo operation is designed to achieve an annualized production capacity of approximately
20,000 fuel cell stacks, based on 3 shifts running 5-days per week.
The joint venture transaction and related sales agreements, which closed on October 25,
2016 and originally announced on July 18, 2016, had a contemplated minimum sales value
to Ballard of approximately $170 million over 5-years (of which approximately $53 million
has been recognized as of December 31, 2018) include these key elements:
Ballard provided approximately $20 million of technology transfer services, test
equipment, production equipment specification and procurement services, training and
commissioning support in relation to the establishment of a production line in Yunfu for
the manufacture and assembly of FCvelocity®-9SSL fuel cell stacks. Revenue earned
from the technology transfer agreements ($0.1 million in fiscal 2018; $1.7 million in the
fourth quarter of 2017; $16.0 million in fiscal 2017; $4.4 million in fiscal 2016), which
are effectively complete, is recorded primarily as Technology Solutions revenues.
Ballard’s exclusive supply of membrane electrode assemblies (“MEA”s), a key component
of every fuel cell, for each fuel cell stack manufactured by Synergy Ballard JVCo, with
minimum annual MEA volume commitments with a contemplated minimum sales value
on a “take or pay” basis to Ballard of at least $150 million over the initial 5-year term
from 2017 to 2021. Revenue earned from the MEA supply agreement ($0.8 million in the
fourth quarter of 2018; $17.5 million in fiscal 2018; $4.7 million in the fourth quarter of
2017; $14.9 million in fiscal 2017; nil million in fiscal 2016) is recorded as Heavy-Duty
Motive revenues.
As a result of various Chinese market circumstances, including dynamic new energy vehicle
subsidies, slower than anticipated build-out and operation of hydrogen refueling
infrastructure and slower than anticipated market adoption, as well as a result of inventory
build-up, liquidity and other challenges at Synergy Ballard JVCo, Synergy Ballard JVCo did
D-17

not meet its “take or pay” purchase commitments under the MEA supply agreement in the
third and fourth quarters of 2018, nor did it make the contractual pre-payments required to
enable any significant fourth quarter of 2018 and first quarter of 2019 MEA shipments. As
previously noted, our Order Backlog and our 12-month Order Book, which had prior to the
end of the third quarter of 2018 included certain contractual commitments under the MEA
supply agreement with Synergy Ballard JVCo, are subject to risk including risks related to
market demand for Synergy Ballard JVCo’s products, and risks related to the ability of
Synergy Ballard JVCo to finance its operations including fulfilling its purchase commitments
to us under the MEA supply agreement. As a result, there continues to be no reasonable
assurance that Synergy Ballard JVCo will be able to meet the “take or pay” purchase
commitment going forward. Accordingly, we have continued to remove all remaining
purchase commitments in the MEA supply agreement from the Order Backlog and 12-month
Order Book.
Synergy Ballard JVCo has an exclusive right to manufacture and sell FCvelocity®-9SSL
stacks in China. Exclusivity is subject to Synergy Ballard JVCo achieving certain
performance criteria, including compliance with: a code of ethics; Ballard’s quality policies
and branding practices; payment terms; and certain intellectual property covenants; as well
as achievement of the minimum annual contemplated “take or pay” MEA volume
commitments. We remain in discussions with Synergy Ballard JVCo to address current
issues and future opportunities including the status of the MEA supply and related
agreements.
Ballard has the exclusive right to purchase FCvelocity®-9SSL fuel cell stacks and sub-
components from Synergy Ballard JVCo for sale outside China. Ballard contributed
approximately $1.0 million for its 10% interest in Synergy Ballard JVCo in 2017. We have
no obligation to provide future funding to Synergy Ballard JVCo.
China - Other
On September 28, 2015, we announced the signing of a joint development agreement and a
supply agreement to develop and commercialize a fuel cell engine specifically designed for
integration into low floor trams manufactured by CRRC Qingdao Sifang Company, Ltd.
(“CRRC Sifang”), a Chinese rolling stock manufacturer. The agreements include delivery of
ten customized FCvelocity® modules and have an initial expected value of approximately $6
million. Ballard has developed a new prototype configuration of its FCvelocity® fuel cell
module to deliver 200 kilowatts of net power for use in powering trams in urban
deployments. An initial deployment of eight fuel cell-powered trams is planned by CRRC
Sifang and the City of Foshan on the Gaoming Line. With delays in the construction of the
Gaoming Line, deployment of these trams by CRRC Sifang is now expected to occur starting
in 2019. As of June 30, 2018, we had delivered all ten FCveloCity®-HD7 200-kilowatt fuel
cell modules in support of this program. Revenue earned from these agreements (nil million
in the fourth quarter of 2018; $2.3 million in fiscal 2018; nil million in the fourth quarter of
2017; $3.1 million fiscal 2017; $0.9 million in fiscal 2016), which are effectively complete,
is recorded as either Heavy-Duty Motive or Technology Solutions revenues depending on the
nature of work performed.
D-18

4.3 Europe
Eniig and Fibia A/S
On February 5, 2019, we announced that the Company’s European subsidiary – Ballard
Power Systems Europe A/S – has signed Framework Agreements for the provision of
FCgen®-H2PM direct hydrogen backup power systems with Eniig and Fibia A/S, operators of
fiber optic broadband networks in Denmark. Ballard also received initial orders for a total of
30 FCgen®-H2PM 5-kilowatt (kW) systems, including installation, hydrogen storage and
power management equipment, having a total value of approximately $1.2 million under
these Framework Agreements. This includes 20 systems for Eniig and 10 systems for Fibia.
Revenue earned from these agreements (nil million to date) will be recorded as Backup
Power revenues.
Audi AG
On June 11, 2018, we announced the signing of a 3.5 year extension to our current
technology solutions contract with AUDI AG (“Audi”), part of the Volkswagen Group
(“Volkswagen AG”), extending the HyMotion program to August 2022. The aggregate value
of the contract extension is expected to be Canadian $80 to $130 million (approximately
$62 to $100 million). The program, through a series of technical milestone awards, will
support Audi through its small series production launch. The HyMotion program
encompasses automotive fuel cell stack development as well as system design support
activities. Ballard is focused on the design and manufacture of world-leading, next-
generation fuel cell stacks for use in Audi’s demonstration car program. Ballard engineers
are leading critical areas of fuel cell product design – including the MEA, plate and stack
components – along with certain testing and integration work.
Ballard signed an initial 4 year contract with Volkswagen AG in March 2013, followed by a 2
year extension in February 2015. Audi assumed leadership of the program in 2016. Revenue
earned from this and related agreements with Audi ($8.8 million in the fourth quarter of
2018; $26.6 million in fiscal 2018; $5.0 million in the fourth quarter of 2017; $18.0 million
in fiscal 2017; $13.9 million in fiscal 2016) are recorded as Technology Solutions revenues.
ABB Marine & Ports
On June 27, 2018, we announced signing of a Memorandum of Understanding (“MOU”) with
ABB to undertake collaboration activities toward the development of megawatt (MW) scale
PEM fuel cell power systems for the marine market, with an initial focus on the cruise ship
segment. The multi-year collaboration between Ballard and ABB will include joint market
development activities, systems design and development work, as well as systems testing
and validation activities. The goal will be development of commercial ready MW-scale
containerized PEM fuel cell power systems for the marine market, with an initial focus on the
cruise ship segment. These systems could be used in a variety of ways, including provision
of power for hotel operations while cruise ships are docked at port as well as the provision
of primary propulsion power when ships are at sea. Revenue earned from this and related
agreements ($0.2 million in fiscal 2018) will be recorded as Technology Solutions revenues.
D-19

Van Hool NV
On May 1, 2018, we announced the receipt of a purchase order from Van Hool NV (“Van
Hool”), a bus OEM in Belgium, for 40 FCveloCity®-HD fuel cell modules to power buses
under the Joint Initiative for Hydrogen Vehicles across Europe (“JIVE”) funding programs.
The purchase order is further to Ballard’s announcement of a Letter of Intent, which was
issued on February 28, 2018. Ballard continues to make initial shipments of the
FCveloCity®-HD 85 kilowatt modules in 2018, with initial deliveries of buses by Van Hool
expected in 2019. Van Hool plans to deploy 30 buses with the Regionalverkehr Köln GmbH
transit agency in Cologne, Germany, and the remaining 10 buses with WSW mobil GmbH
transit agency in Wuppertal, Germany. Revenue earned from this agreement with Van Hool
($0.8 million in the fourth quarter of 2018; $1.2 million in fiscal 2018 and to date) is
recorded as Heavy-Duty Motive revenues.
On September 13, 2017, we announced the acceptance of a Letter of Intent to provide
FCveloCity®-HD 100-kilowatt fuel cell engines to power ExquiCity tram-buses to be built by
Van Hool for delivery in Pau, France to the SMTU-PPP (Syndicat Mixte de Transports urbains
– Pau Portes des Pyrénées) and the STAP (Société de Transport de l’Agglomération Paloise).
During the second quarter of 2018, we finalized contracting for this order and have now
delivered the fuel cell engines to Van Hool. Revenue earned from this and other agreements
under the 3Emotion European program with Van Hool ($1.5 million in the fourth quarter of
2018; $2.2 million in fiscal 2018 and to date) is recorded as Heavy-Duty Motive revenues.
Siemens AG
On November 14, 2017, we announced the signing of a multi-year Development Agreement
with Siemens AG (“Siemens”) for the development of a zero-emission fuel cell engine to
power Siemens’ Mireo light rail train. The Development Agreement has a contemplated
value of approximately $9.0 million to Ballard over 3 years. Under the terms of the
Development Agreement, Ballard will develop a 200 kilowatt fuel cell engine for integration
into Siemens’ new Mireo train platform. Initial deployments of the fuel cell-powered Mireo
train are planned for 2021. Revenue earned from this agreement ($0.2 million in the fourth
quarter of 2018; $1.8 million in fiscal 2018; $0.7 million in the fourth quarter of 2017 and in
fiscal 2017) is recorded as Technology Solutions revenue.
4.4 North America
Protonex Technology Corporation – Divestiture of Power Manager assets
On October 5, 2018, we closed the previously announced transaction (on August 31, 2018)
to divest certain assets of the Company’s subsidiary, Protonex Technology Corporation
(“Protonex”), related to the Power Manager business to Revision Military Ltd. (“Revision”), a
private U.S.-based company. At closing, Ballard received initial consideration of
approximately $4.1 million, paid in $2.0 million cash and a $2.1 million note receivable
payable in the second quarter of 2019, and may receive up to a further $11.25 million,
based on achievement of specific sales objectives during a 12-month earn-out period.
Ballard has retained certain Protonex assets related to fuel cell propulsion systems for
unmanned vehicles, under the Ballard brand. We decided to divest assets of the Protonex
Power Manager assets as they were considered to be no longer aligned with Ballard’s
strategic fuel cell focus, while retaining Protonex assets related to the unmanned systems
D-20
market. The divestiture reduces complexity while adding resources for us to invest in our
core fuel cell business. In 2015, Ballard paid approximately $17.5 million in shares and cash
to acquire Protonex, which included the Power Manager business, a Solid Oxide Fuel Cells
business which was divested in January 2018, and the unmanned systems business.
During the fourth quarter of 2018, we recorded a loss on sale of assets of ($4.0) million for
the Power Manager assets after estimating the amount of variable consideration included in
the transaction price that is constrained to be $2.0 million, as opposed to the above noted
maximum possible earn-out amount of $11.25 million. The estimate of the ultimate
transaction price, including the estimate of the amount of earn-out variable consideration
that is considered constrained of $2.0 million, will be reassessed each quarter-end during
2019. Any change in the estimated transaction price will result in an adjustment to the
above noted loss on sale of assets which will be recognized on a prospective basis.
Protonex Technology Corporation – Revenue contracts and other
On June 25, 2018, we announced that Protonex had received a $1.0 million order for the
supply of SPM-622 Squad Power Manager Kits to support U.S. Army brigades deploying
overseas. Revenue earned from this agreement (nil million to date) is recorded as Portable
Power revenues. This agreement was transferred to Revision on the sale of the Power
Manager assets.
On March 26, 2018, we announced that Protonex had received a $1.9 million follow-on
purchase order for the supply of SPM-622 Squad Power Manager Kits to support U.S. Army
Security Force Assistance Brigades (SFAB). Revenue earned from this agreement (nil million
in the fourth quarter of 2018; $1.9 million in fiscal of 2018), which is complete, is recorded
as Portable Power / UAV revenues.
On January 30, 2018, we announced that Protonex received a $1.6 million purchase order
for the supply of SPM-622 Squad Power Manager Kits for end customer U.S. Special
Operations Command. The purchase order was the first issued by the Program Executive
Office (PEO) – Soldier, as part of the newly approved program of record, with Milestone C
approval having been received in 2017. Revenue earned from this agreement (nil million in
the fourth quarter of 2018; $1.6 million in fiscal of 2018), which is complete, is recorded as
Portable Power / UAV revenues.
Protonex Technology Corporation – Divestiture of Solid Oxide Fuel Cell assets
On January 3, 2018, we announced that as a result of our strategic review in 2017 of our
Protonex subsidiary, we implemented certain changes at Protonex including the divestiture
of certain non-core assets. This action is in addition to steps taken in August 2017 to reduce
and align the Protonex cost base. In the fourth quarter of 2017, it was determined that
certain of Protonex’ Solid Oxide Fuel Cells (“SOFC”) assets were not core to Ballard’s PEM
fuel cell business, and the Company decided to divest these non-core assets. As a result,
certain SOFC assets were transferred to a private, start-up company, Upstart Power Inc.
(“Upstart”), effective December 31, 2017, for nominal consideration. This action enabled
Ballard to significantly reduce the cost structure at Protonex. During the fourth quarter of
2017, we recorded a loss on sale of assets of ($0.5) million related primarily to the sale of
SOFC inventory to Upstart. We also recorded impairment losses of ($1.5) million in the
fourth quarter of 2017 related to a write-down of certain SOFC intangible assets and
property, plant and equipment.
D-21

Hyster-Yale Group, Inc.
On April 30, 2018, we announced the signing of a Master Supply Agreement (“MSA”) with
Hyster-Yale Group, Inc. (“Hyster-Yale”) encompassing the supply of minimum annual
volumes of Ballard FCgen®-1020 air-cooled fuel cell stacks for use in powering Class 3 lift
trucks and support on the design of a fuel cell electric propulsion system to power these lift
trucks. The MSA runs until 2022. Hyster-Yale is a leading global lift truck OEM. In 2014,
Hyster-Yale’s acquisition of Nuvera activated a strategy to design purpose-built, optimized
fuel cell-powered lift trucks, and put in place significant expertise and capabilities for fuel
cells. The collaboration with Ballard, Nuvera, and Hyster-Yale will focus on air-cooled stacks
for low power applications, complementing the existing Nuvera fuel cell solutions. Revenue
earned from this agreement will be recorded as Material Handling revenues.
New Flyer Industries Inc.
On February 13, 2017, we announced the Company's membership in the "Fuel Cell Electric
Bus Commercialization Consortium" (FCEBCC), a large-scale project for which funding has
now been committed to support deployment of 20 zero-emission hydrogen fuel cell electric
buses at two California transit agencies. Ten buses are to be deployed with Alameda Contra-
Costa Transit District (AC Transit) and 10 buses are to be deployed with the Orange County
Transportation Authority (OCTA). In support, Ballard has provided its FCveloCity®-HD 85-
kilowatt fuel cell engines to New Flyer of America Inc., a subsidiary of New Flyer Industries
Inc. ("New Flyer"), the largest transit bus and motor coach manufacturer and parts
distributor in North America. Ballard's engines are to power New Flyer 40-foot Xcelsior
XHE40 fuel cell buses, which are planned to be delivered by New Flyer and in-service with
AC Transit and OCTA starting in late 2018 and into 2019. The buses are to be supported by
advanced hydrogen fueling infrastructure provided by The Linde Group. Revenue earned
from this and other agreements with New Flyer ($3.5 million in the fourth quarter of 2018;
$6.9 million in fiscal 2018 and to date) is recorded as Heavy-Duty Motive revenues.
4.5 Other
Nisshinbo Holdings
On February 21, 2018, we announced the receipt of a follow-on purchase order from
Nisshinbo Holdings (“Nisshinbo”) to progress a Technology Solutions program to the next
stage that was initially announced on September 17, 2017. On September 17, 2017, we
received a purchase order from Nisshinbo to engage in a multi-year Technology Solutions
program to assess the potential development of fuel cell stacks using a Non Precious Metal
Catalyst (“NPMC”) for use in commercial material handling applications. With successful
completion of this initial assessment, this next stage will focus on certain performance and
power density enhancements to support development of low cost NPMC-based fuel cell
stacks again for material handling applications. Revenue earned from this order and related
agreements ($0.4 million in the fourth quarter of 2018; $1.3 million in fiscal 2018; $0.7
million in the fourth quarter of 2017; $1.6 million in fiscal 2017), which are effectively
complete, is recorded as Technology Solutions revenues.
D-22

development of the world’s first NPMC-based PEM fuel cell product – the FCgen®-1040 –
which is a new 30-watt air-cooled fuel cell stack incorporating NPMC with possible uses in
ultralight-weight applications such as laptop and cell phone chargers, and military soldier
power devices. The NPMC is an innovative technology enabling a reduction in product cost
through the use of significantly lower amounts of platinum.
Nisshinbo has been a strategic supplier of compression molded bipolar flow field carbon
plates to Ballard for over 20 years. In November 2015, Nisshinbo also became a strategic
equity investor in Ballard.
Other
On February 14, 2018, we announced that the signing of a Technology Solutions program
with an unnamed strategic customer to develop a next generation air-cooled fuel cell stack.
The multi-year program has an initial value to Ballard of approximately $4.2 million. A key
objective of the Technology Solutions program is to design and validate an ultra-high
durability, high performance air-cooled fuel cell stack for uses in a number of target market
applications, including certain material handling applications, with a target operating lifetime
of 20,000 hours. A key market opportunity will be the integration of the next generation
stacks into fuel cell systems for class 3 lift trucks, such as pallet jacks, deployed in high
throughput distribution centers and warehouse operations. Other potential applications
include systems for stationary continuous and backup power. Revenue earned from this
agreement ($0.9 million in the fourth quarter of 2018; $1.9 million in fiscal 2018) is
recorded as Technology Solutions revenues.
5 RESULTS OF OPERATIONS 5.1 Operating Segments
We report our results in the single operating segment of Fuel Cell Products and Services.
Our Fuel Cell Products and Services segment consists of the sale and service of PEM fuel cell
products for our power product markets of Heavy-Duty Motive (consisting of bus, truck, rail
and marine applications), Portable Power / UAV, Material Handling and Backup Power, as
well as the delivery of Technology Solutions, including engineering services, technology
transfer and the license and sale of our extensive intellectual property portfolio and
fundamental knowledge for a variety of fuel cell applications.
As a result of our sale of the Power Manager assets in the fourth quarter of 2018, we have
renamed the former Portable Power market as the Portable Power / UAV market. As the sale
of the Power Manager assets is not presented as a discontinued operation, the Portable
Power / UAV market includes revenues associated with our power manager business prior to
its sale, and product and service revenues generated from the retained Protonex assets
related primarily to fuel cell propulsion systems for unmanned systems.
This followed an announcement that Nisshinbo and Ballard had successfully collaborated on
D-23
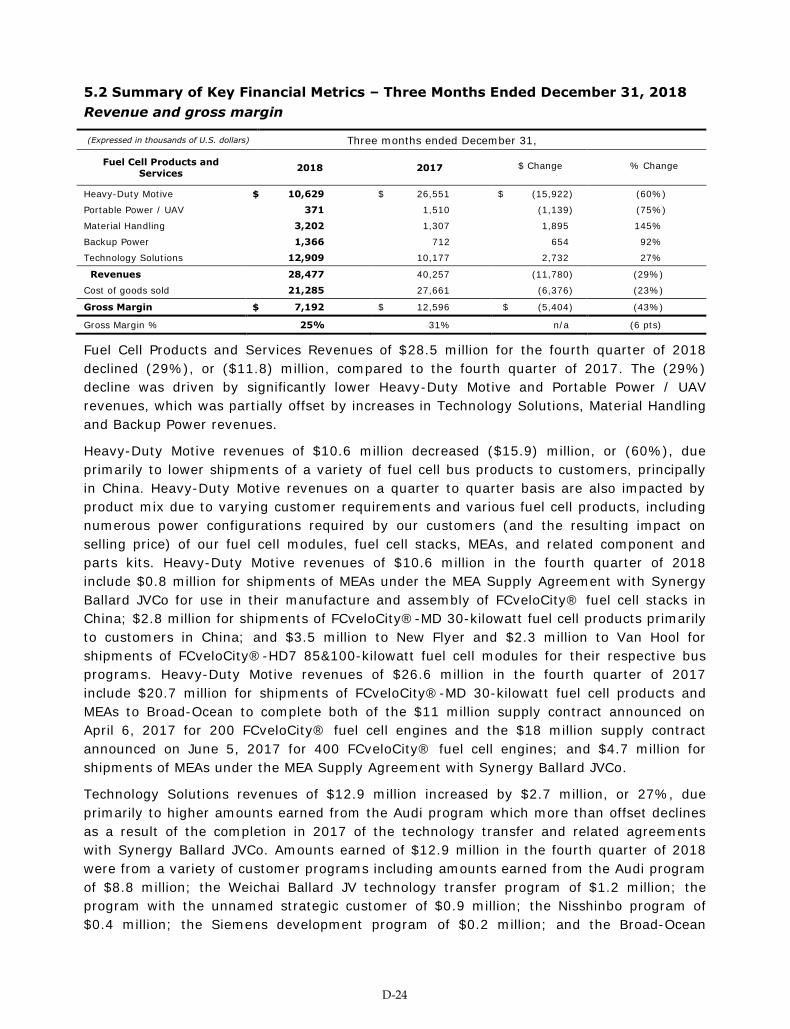
5.2 Summary of Key Financial Metrics – Three Months Ended December 31, 2018 Revenue and gross margin
(Expressed in thousands of U.S. dollars) Three months ended December 31,
Fuel Cell Products and Services 2018 2017 $ Change % Change
Heavy-Duty Motive $ 10,629 $ 26,551 $ (15,922) (60%)
Portable Power / UAV 371 1,510 (1,139) (75%)
Material Handling 3,202 1,307 1,895 145%
Backup Power 1,366 712 654 92%
Technology Solutions 12,909 10,177 2,732 27%
Revenues 28,477 40,257 (11,780) (29%)
Cost of goods sold 21,285 27,661 (6,376) (23%)
Gross Margin $ 7,192 $ 12,596 $ (5,404) (43%)
Gross Margin % 25% 31% n/a (6 pts)
Fuel Cell Products and Services Revenues of $28.5 million for the fourth quarter of 2018
declined (29%), or ($11.8) million, compared to the fourth quarter of 2017. The (29%)
decline was driven by significantly lower Heavy-Duty Motive and Portable Power / UAV
revenues, which was partially offset by increases in Technology Solutions, Material Handling
and Backup Power revenues.
Heavy-Duty Motive revenues of $10.6 million decreased ($15.9) million, or (60%), due
primarily to lower shipments of a variety of fuel cell bus products to customers, principally
in China. Heavy-Duty Motive revenues on a quarter to quarter basis are also impacted by
product mix due to varying customer requirements and various fuel cell products, including
numerous power configurations required by our customers (and the resulting impact on
selling price) of our fuel cell modules, fuel cell stacks, MEAs, and related component and
parts kits. Heavy-Duty Motive revenues of $10.6 million in the fourth quarter of 2018
include $0.8 million for shipments of MEAs under the MEA Supply Agreement with Synergy
Ballard JVCo for use in their manufacture and assembly of FCveloCity® fuel cell stacks in
China; $2.8 million for shipments of FCveloCity®-MD 30-kilowatt fuel cell products primarily
to customers in China; and $3.5 million to New Flyer and $2.3 million to Van Hool for
shipments of FCveloCity®-HD7 85&100-kilowatt fuel cell modules for their respective bus
programs. Heavy-Duty Motive revenues of $26.6 million in the fourth quarter of 2017
include $20.7 million for shipments of FCveloCity®-MD 30-kilowatt fuel cell products and
MEAs to Broad-Ocean to complete both of the $11 million supply contract announced on
April 6, 2017 for 200 FCveloCity® fuel cell engines and the $18 million supply contract
announced on June 5, 2017 for 400 FCveloCity® fuel cell engines; and $4.7 million for
shipments of MEAs under the MEA Supply Agreement with Synergy Ballard JVCo.
Technology Solutions revenues of $12.9 million increased by $2.7 million, or 27%, due
primarily to higher amounts earned from the Audi program which more than offset declines
as a result of the completion in 2017 of the technology transfer and related agreements
with Synergy Ballard JVCo. Amounts earned of $12.9 million in the fourth quarter of 2018
were from a variety of customer programs including amounts earned from the Audi program
of $8.8 million; the Weichai Ballard JV technology transfer program of $1.2 million; the
program with the unnamed strategic customer of $0.9 million; the Nisshinbo program of
$0.4 million; the Siemens development program of $0.2 million; and the Broad-Ocean
D-24

technology transfer program of $0.1 million. Amounts earned of $10.2 million in the fourth
quarter of 2017 were also from a variety of customer programs including amounts earned
from the Audi program revenues of $5.0 million; Synergy Ballard JVCo of $1.4 million on
the completed in 2017 FCvelocity®-9SSL fuel cell stack production line in Yunfu, China; the
Siemens development program of $0.7 million; the Nisshinbo program of $0.7 million; the
Broad-Ocean technology transfer program of $0.6 million; and amounts earned on a variety
of other programs including the HDF distributed generation project, the TRC and CRRC
Sifang tram development projects, and the project to enable Synergy Group to exclusively
manufacture and sell Ballard's direct hydrogen FCgen®-H2PM fuel cell backup power
systems in China. Audi program revenues were also negatively impacted by approximately
($0.5) million in the fourth quarter of 2018, as compared to the fourth quarter of 2017, as a
result of an approximate (4%) lower Canadian dollar, relative to the U.S. dollar, as the Audi
Agreement is priced in Canadian dollars. The underlying costs to satisfy the Audi Agreement
are primarily denominated in Canadian dollars.
Material Handling revenues of $3.2 million increased $1.9 million, or 145%, primarily as a
result of higher stack shipments to Plug Power combined with the impact of a higher
average selling price due to product mix.
Portable Power / UAV revenues of $0.4 million decreased ($1.1) million, or (75%), as a
result of lower product and service revenues generated by Protonex primarily as a result of
the disposition of the Power Manager assets in October 2018.
Backup Power revenues of $1.4 million increased $0.7 million, or 92%, due primarily to an
increase in hydrogen-based backup power product and service revenues in Europe and
Japan for backup power applications.
Fuel Cell Products and Services gross margins were $7.2 million, or 25% of revenues, for
the fourth quarter of 2018, compared to $12.6 million, or 31% of revenues, for the fourth
quarter of 2017. The decline in gross margin of ($5.4) million, or (43%), was driven
primarily by the (29%) decrease in total revenues, combined with a shift to a slightly lower
overall margin product and service revenue mix resulting in a (6) percentage point decrease
in gross margin as a percent of revenues. Gross margin in the fourth quarter of 2017
particularly benefited from the increase in higher margin Heavy-Duty Motive revenues,
combined with improved manufacturing overhead and related cost absorption as a result of
improved scale and efficiency.
Gross margin in the fourth quarter of 2018 was also negatively impacted by net inventory
adjustments of ($0.7) million related primarily to excess and impaired inventory; whereas
Gross margin in 2017 benefited from positive net warranty adjustments of $0.7 million
related primarily to contractual expirations and improved lifetimes and reliability of our
Heavy-Duty Motive products.
D-25

Cash Operating Costs (Expressed in thousands of U.S. dollars) Three months ended December 31,
2018 2017 $ Change % Change Research and Product
Development (cash operating cost) $ 5,718 $ 6,730 $ (1,012) (15%)
General and Administrative
(cash operating cost) 3,514 2,544 970 38%
Sales and Marketing (cash operating cost) 1,965 1,970 (5) (-%)
Cash Operating Costs $ 11,197 $ 11,244 $ (47) -%
Cash Operating Costs and its components of Research and Product Development (cash operating cost), General and Administrative (cash operating cost),
and Sales and Marketing (cash operating cost) are non-GAAP measures. We use certain Non-GAAP measures to assist in assessing our financial
performance. Non-GAAP measures do not have any standardized meaning prescribed by GAAP and are therefore unlikely to be comparable to similar
measures presented by other companies. See the reconciliation of Cash Operating Costs to GAAP in the Supplemental Non-GAAP Measures section and the reconciliation of Research and Product Development (cash operating cost), General and Administrative (cash operating cost), and Sales and Marketing
(cash operating cost) to GAAP in the Operating Expense section. Cash Operating Costs adjusts operating expenses for stock-based compensation
expense, depreciation and amortization, impairment losses on trade receivables, restructuring charges, unrealized gains or losses on foreign exchange
contracts, acquisition costs and financing charges.
Cash Operating Costs (see Supplemental Non-GAAP Measures) for the fourth quarter of
2018 were $11.2 million, relatively flat to the fourth quarter of 2017. The minor decrease
was driven by lower product development cash operating costs of ($1.0) million, offset by
an increase in general and administrative cash operating costs of $1.0 million, as sales and
marketing cash operating costs were relatively flat period over period.
The minor decrease in cash operating costs in the fourth quarter of 2018 was driven
primarily by lower expenses in Protonex as a result of the disposition of our Power Manager
assets and associated personnel in October 2018, combined with lower labour costs in
Canada as a result of an approximate (4%) lower Canadian dollar, relative to the U.S.
dollar, and the resulting positive impact on our Canadian operating cost base. These cost
reductions were effectively offset by higher general and administrative costs due primarily
to higher realized losses on our foreign exchange contracts which are designed as a hedge
against our Canadian dollar labour costs, and by higher legal and advisory costs due to the
timing of transactional contracting and human resources costs.
Adjusted EBITDA
(Expressed in thousands of U.S. dollars) Three months ended December 31,
2018 2017 $ Change % Change
Adjusted EBITDA $ (5,194) $ 2,086 $ (7,280) (349%)
EBITDA and Adjusted EBITDA are non-GAAP measures. We use certain Non-GAAP measures to assist in assessing our financial performance. Non-
GAAP measures do not have any standardized meaning prescribed by GAAP and are therefore unlikely to be comparable to similar measures presented
by other companies. See reconciliation of Adjusted EBITDA to GAAP in the Supplemental Non-GAAP Measures section. Adjusted EBITDA adjusts EBITDA for stock-based compensation expense, transactional gains and losses, asset impairment charges, unrealized gains or losses on foreign
exchange contracts, finance and other income, and acquisition costs.
Adjusted EBITDA (see Supplemental Non-GAAP Measures) for the fourth quarter of 2018
was ($5.2) million, compared to $2.1 million for the fourth quarter of 2017. The ($7.3)
million decline in Adjusted EBITDA was driven primarily by the ($5.4) million decrease in
gross margin as a result of the (29%) decline in overall revenues combined with the (6)
point reduction in gross margin as a percent of revenues, as Cash Operating Costs were
relatively flat period over period. In addition, Adjusted EBITDA in 2018 was negatively
impacted by higher equity investment losses in joint venture and associates of ($1.4)
million, and by higher restructuring expenses of ($0.5) million.
In addition and as noted above, operating costs in the fourth quarter of 2018 were impacted
by the positive impact of a weaker Canadian dollar, relative to the U.S. dollar, as compared
to the fourth quarter of 2017. As a significant amount of our net operating costs (primarily
D-26
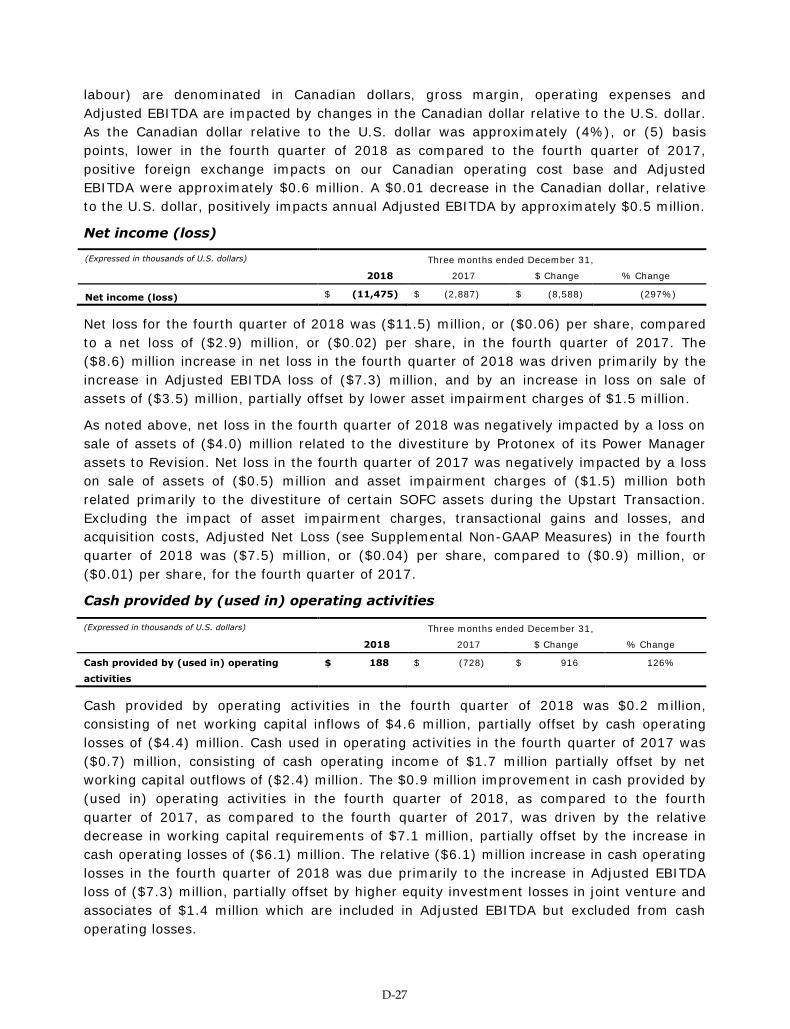
labour) are denominated in Canadian dollars, gross margin, operating expenses and
Adjusted EBITDA are impacted by changes in the Canadian dollar relative to the U.S. dollar.
As the Canadian dollar relative to the U.S. dollar was approximately (4%), or (5) basis
points, lower in the fourth quarter of 2018 as compared to the fourth quarter of 2017,
positive foreign exchange impacts on our Canadian operating cost base and Adjusted
EBITDA were approximately $0.6 million. A $0.01 decrease in the Canadian dollar, relative
to the U.S. dollar, positively impacts annual Adjusted EBITDA by approximately $0.5 million.
Net income (loss)
(Expressed in thousands of U.S. dollars) Three months ended December 31,
2018 2017 $ Change % Change
Net income (loss) $ (11,475) $ (2,887) $ (8,588) (297%)
Net loss for the fourth quarter of 2018 was ($11.5) million, or ($0.06) per share, compared
to a net loss of ($2.9) million, or ($0.02) per share, in the fourth quarter of 2017. The
($8.6) million increase in net loss in the fourth quarter of 2018 was driven primarily by the
increase in Adjusted EBITDA loss of ($7.3) million, and by an increase in loss on sale of
assets of ($3.5) million, partially offset by lower asset impairment charges of $1.5 million.
As noted above, net loss in the fourth quarter of 2018 was negatively impacted by a loss on
sale of assets of ($4.0) million related to the divestiture by Protonex of its Power Manager
assets to Revision. Net loss in the fourth quarter of 2017 was negatively impacted by a loss
on sale of assets of ($0.5) million and asset impairment charges of ($1.5) million both
related primarily to the divestiture of certain SOFC assets during the Upstart Transaction.
Excluding the impact of asset impairment charges, transactional gains and losses, and
acquisition costs, Adjusted Net Loss (see Supplemental Non-GAAP Measures) in the fourth
quarter of 2018 was ($7.5) million, or ($0.04) per share, compared to ($0.9) million, or
($0.01) per share, for the fourth quarter of 2017.
Cash provided by (used in) operating activities
(Expressed in thousands of U.S. dollars) Three months ended December 31,
2018 2017 $ Change % Change
Cash provided by (used in) operating
activities
$ 188 $ (728) $ 916 126%
Cash provided by operating activities in the fourth quarter of 2018 was $0.2 million,
consisting of net working capital inflows of $4.6 million, partially offset by cash operating
losses of ($4.4) million. Cash used in operating activities in the fourth quarter of 2017 was
($0.7) million, consisting of cash operating income of $1.7 million partially offset by net
working capital outflows of ($2.4) million. The $0.9 million improvement in cash provided by
(used in) operating activities in the fourth quarter of 2018, as compared to the fourth
quarter of 2017, as compared to the fourth quarter of 2017, was driven by the relative
decrease in working capital requirements of $7.1 million, partially offset by the increase in
cash operating losses of ($6.1) million. The relative ($6.1) million increase in cash operating
losses in the fourth quarter of 2018 was due primarily to the increase in Adjusted EBITDA
loss of ($7.3) million, partially offset by higher equity investment losses in joint venture and
associates of $1.4 million which are included in Adjusted EBITDA but excluded from cash
operating losses.
D-27

The total change in working capital of $4.6 million in the fourth quarter of 2018 was driven
by higher deferred revenue of $8.5 million due primarily to a $9.0 million program
prepayment received from Weichai Ballard JV, by lower inventory of $3.7 million as we
delivered expected Heavy-Duty Motive shipments to customers in the fourth quarter of
2018, and by higher accrued warranty obligations of $1.6 million primarily on increased
Heavy-Duty Motive product shipments. These fourth quarter of 2018 inflows were partially
offset by higher accounts receivable of ($9.8) million primarily as a result of the timing of
revenues and the related customer collections.
This compares to a total change in working capital of ($2.4) million in the fourth quarter of
2017 which was driven by higher accounts receivable of ($5.7) million primarily as a result
of the timing of revenues and the related customer collections, and by lower deferred
revenue of ($1.5) million as we fulfilled contract deliverables on certain Heavy-Duty Motive
and Technology Solutions contracts for which we received pre-payments in an earlier
period. These fourth quarter of 2017 outflows were partially offset by higher accounts
payable and accrued liabilities of $2.1 million as a result of the timing of supplier payments
and annual compensation awards, by lower inventory of $2.0 million as we delivered
expected Heavy-Duty Motive shipments to customers in the last quarter of 2017, and by
higher accrued warranty obligations of $0.8 million due to increased product shipments.
5.3 Summary of Key Financial Metrics – Year Ended December 31, 2018 Revenue and gross margin
(Expressed in thousands of U.S. dollars) Year ended December 31,
Fuel Cell Products and Services 2018 2017 $ Change % Change
Heavy-Duty Motive $ 39,464 $ 63,684 $ (24,220) (38%)
Portable Power / UAV 7,109 4,468 2,641 59%
Material Handling 8,010 7,535 475 6%
Backup Power 2,426 1,933 493 26%
Technology Solutions 39,577 43,668 (4,091) (9%)
Revenues 96,586 121,288 (24,702) (20%)
Cost of goods sold 66,912 79,688 (12,776) (16%)
Gross Margin $ 29,674 $ 41,600 $ (11,926) (29%)
Gross Margin % 31% 34% n/a (3 pts)
Fuel Cell Products and Services Revenues of $96.6 million in 2018 decreased (20%), or
($24.7) million, compared to 2017. The (20%) decline was driven by lower Heavy-Duty
Motive and Technology Solutions revenues, which more than offset increases in Portable
Power / UAV, Backup Power and Material Handling revenues.
Heavy-Duty Motive revenues of $39.5 million decreased ($24.2) million, or (38%), due
primarily to decreased shipments of a variety of fuel cell products to customers, principally
in China. Heavy-Duty Motive revenues on a quarter to quarter basis are also impacted by
product mix due to varying customer requirements and various fuel cell products, including
numerous power configurations required by our customers (and the resulting impact on
selling price) of our fuel cell modules, fuel cell stacks, MEAs, and related component and
parts kits. Heavy-Duty Motive revenues of $39.5 million in 2018 include $17.5 million for
shipments of MEAs under the MEA Supply Agreement with Synergy Ballard JVCo for use in
D-28

their manufacture and assembly of FCveloCity® fuel cell stacks in China; $5.9 million for
shipments of FCveloCity®-MD 30-kilowatt fuel cell products primarily to customers in China;
$2.3 million for shipments of FCveloCity®-HD7 200-kilowatt fuel cell modules to CRRC
Sifang for their tram project; and $6.9 million to New Flyer and $3.4 million to Van Hool for
shipments of FCveloCity®-HD7 85&100-kilowatt fuel cell modules for their respective bus
programs. Heavy-Duty Motive revenues of $63.7 million in 2017 include $28.7 million for
shipments of FCveloCity®-MD 30-kilowatt fuel cell products and MEAs to Broad-Ocean to
complete both of the $11 million supply contract announced on April 6, 2017 for 200
FCveloCity® fuel cell engines and the $18 million supply contract announced on June 5,
2017 for 400 FCveloCity® fuel cell engines. Heavy-Duty Motive revenues in 2017 also
include $14.9 million for shipments of MEAs under the MEA Supply Agreement with Synergy
Ballard JVCo; $8.7 million for shipments of FCvelocity®-9SSL fuel cell stacks to Synergy
Group for a variety of programs; $2.9 million of shipments of FCveloCity®-HD7 200-
kilowatt fuel cell modules to CRRC Sifang, $2.5 million of shipments of FCveloCity®-HD7
85-kilowatt fuel cell modules to Solaris, and $2.1 million of shipments of FCveloCity®-HD6
150-kilowatt fuel cell modules to Sunline.
Technology Solutions revenues of $39.6 million decreased ($4.1) million, or (9%), due
primarily to lower amounts earned in 2018 from technology transfer and related
agreements with Synergy Ballard JVCo, partially offset by increases in amounts earned on
other the Audi and other programs. Amounts earned of $39.6 million in 2018 were from a
variety of customer programs including amounts earned from the Audi program of $26.6
million; the Broad-Ocean technology transfer program of $3.5 million; the program with the
unnamed strategic customer of $0.9 million; the Siemens development program of $1.8
million; the Nisshinbo program of $1.3 million; and the Weichai Ballard JV technology
transfer program of $1.2 million. Amounts earned of $43.7 million in 2017 were also from a
variety of customer programs including amounts earned from the Audi program of $18.0
million; Synergy Ballard JVCo of $15.1 million on the completed in 2017 FCvelocity®-9SSL
fuel cell stack production line in Yunfu, China; the Broad-Ocean technology transfer program
of $2.0 million; the Nisshinbo program of $1.6 million; the Siemens development program
of $0.7 million; and amounts earned on a variety of other programs including the HDF
distributed generation project, the TRC and CRRC Sifang tram development projects, and
the project to enable Synergy Group to exclusively manufacture and sell Ballard's direct
hydrogen FCgen®-H2PM fuel cell backup power systems in China. Audi service revenues
were nominally impacted in 2018, as compared to 2017, as a result of nominally higher
Canadian dollar, relative to the U.S. dollar, as the Audi Agreement is priced in Canadian
dollars. The underlying costs to satisfy the Audi Agreement are primarily denominated in
Canadian dollars.
Material Handling revenues of $8.0 million increased $0.5 million, or 6%, primarily as a
result of product mix to Plug Power as slightly lower stack shipments benefited by a higher
average selling price.
Portable Power / UAV revenues of $7.1 million increased $2.6 million, or 59%, due to higher
product revenues generated by Protonex prior to the disposition of the Power Manager
assets in October 2018, partially offset by lower service revenues. Revenues from Protonex
in 2018 include $1.9 million of product shipments of SPM-622 Squad Power Manager Kits to
D-29

complete a $1.9 million purchase order from U.S. Army Security Force Assistance Brigades
(SFAB), and $1.6 million of shipments of SPM-622 Squad Power Manager Kits to complete a
purchase order for end customer U.S. Special Operations Command.
Backup Power revenues of $2.4 million increased $0.5 million, or 26%, due primarily to an
increase in hydrogen-based backup power product and service revenues in Europe and
Japan for a variety of backup power applications.
Fuel Cell Products and Services gross margins were $29.7 million, or 31% of revenues, for
2018, compared to $41.6 million, or 34% of revenues, for 2017. The decline in gross
margin of ($11.9) million, or (29%), was driven primarily by the (20%) decrease in total
revenues, combined with a shift to slightly lower overall margin product and service revenue
mix resulting in a (3) percentage point decline in gross margin as a percent of revenues.
Gross margin in 2017 particularly benefited from the increase in higher margin Technology
Solutions revenues (particularly including amounts earned from Synergy Ballard JVCo
related to the completed in 2017 FCvelocity®-9SSL fuel cell stack production operation in
Yunfu, China) and from the increase in higher margin Heavy-Duty Motive revenues.
Gross margin in 2018 was also negatively impacted by net inventory adjustments of ($1.0)
million related primarily to excess and impaired inventory, and negatively impacted by
warranty adjustments of ($0.9) million related primarily to increased Heavy-Duty Motive
service costs. Gross margin in 2017 benefited from positive net warranty adjustments of
$0.7 million related primarily to contractual expirations and improved lifetimes and
reliability of our Heavy-Duty Motive products.
Cash Operating Costs
(Expressed in thousands of U.S. dollars) Year ended December 31,
2018 2017 $ Change % Change
Research and Product
Development (cash operating cost) $ 23,755 $ 21,332 $ 2,423 11%
General and Administrative
(cash operating cost) 11,705 10,248 1,457 14%
Sales and Marketing (cash operating cost) 7,522 7,473 49 1%
Cash Operating Costs $ 42,982 $ 39,053 $ 3,929 10%
Cash Operating Costs and its components of Research and Product Development (cash operating cost), General and Administrative (cash operating cost),
and Sales and Marketing (cash operating cost) are non-GAAP measures. We use certain Non-GAAP measures to assist in assessing our financial
performance. Non-GAAP measures do not have any standardized meaning prescribed by GAAP and are therefore unlikely to be comparable to similar
measures presented by other companies. See the reconciliation of Cash Operating Costs to GAAP in the Supplemental Non-GAAP Measures section and the reconciliation of Research and Product Development (cash operating cost), General and Administrative (cash operating cost), and Sales and Marketing
(cash operating cost) to GAAP in the Operating Expense section. Cash Operating Costs adjusts operating expenses for stock-based compensation
expense, depreciation and amortization, impairment losses on trade receivables, restructuring charges, unrealized gains or losses on foreign exchange
contracts, acquisition costs and financing charges.
Cash Operating Costs (see Supplemental Non-GAAP Measures) in 2018 were $43.0 million,
an increase of $3.9 million, or 10%, compared to 2017. The $3.9 million, or 10%, increase
was driven primarily by an increase in research and product development cash operating
costs of $2.4 million, combined with increases in general and administrative cash operating
costs of $1.5 million and nominal increases in sales and marketing cash operating costs.
The 10% increase in cash operating costs in 2018 was driven primarily by increased
investment in research and product development in Canada related to the ongoing
improvement of all of our fuel cell products and the design and development of our next
generation fuel cell products including our new high performance liquid-cooled fuel cell
D-30

stack, the FCgen®-LCS. In addition, operating expenses were negatively impacted by
increased investment to support our commercial efforts in China, and by increased general
and administrative costs due primarily to higher realized losses on our foreign exchange
contracts which are designed as a hedge against our Canadian dollar labour costs, and by
higher legal and advisory costs due to the timing of transactional contracting and human
resources costs. These cost increases were partially offset by lower costs at Protonex as a
result of the Company’s rationalization initiatives undertaken in the third and fourth
quarters of 2017 and by the disposition of the Power Manager assets and associated
personnel in October 2018.
Adjusted EBITDA
(Expressed in thousands of U.S. dollars) Year ended December 31,
2018 2017 $ Change % Change
Adjusted EBITDA $ (13,465) $ 3,324 $ (16,789) (505%)
EBITDA and Adjusted EBITDA are non-GAAP measures. We use certain Non-GAAP measures to assist in assessing our financial performance. Non-
GAAP measures do not have any standardized meaning prescribed by GAAP and are therefore unlikely to be comparable to similar measures presented
by other companies. See reconciliation of Adjusted EBITDA to GAAP in the Supplemental Non-GAAP Measures section. Adjusted EBITDA adjusts
EBITDA for stock-based compensation expense, transactional gains and losses, asset impairment charges, unrealized gains or losses on foreign exchange contracts, finance and other income, and acquisition costs.
Adjusted EBITDA (see Supplemental Non-GAAP Measures) in 2018 was ($13.5) million,
compared to $3.3 million for 2017. The ($16.8) million decline in Adjusted EBITDA was
driven by the ($11.9) million decrease in gross margin as a result of the (20%) decline in
overall revenues combined with the (3) point reduction in gross margin as a percent of
revenues, and by the increase in Cash Operating Costs of ($3.9) million primarily as a result
of higher research and product development and general and administrative cash operating
costs, and by higher equity investment losses in joint venture and associates of ($1.4)
million, partially offset by lower restructuring expenses of $0.3 million.
Operating costs in 2018 were nominally impacted by the impact of changes in the Canadian
dollar, relative to the U.S. dollar, as the average annual rate for 2018 was consistent with
the average annual rate for 2017. As a significant amount of our net operating costs
(primarily labour) are denominated in Canadian dollars, gross margin, operating expenses
and Adjusted EBITDA are impacted by changes in the Canadian dollar relative to the U.S.
dollar. A $0.01 increase in the Canadian dollar, relative to the U.S. dollar, negatively
impacts annual Cash Operating Costs and Adjusted EBITDA by approximately ($0.5) million.
Net income (loss)
(Expressed in thousands of U.S. dollars) Year ended December 31,
2018 2017 $ Change % Change
Net income (loss) $ (27,323) $ (8,048) $ (19,275) (239%)
Net loss in 2018 was ($27.3) million, or ($0.15) per share, compared to a net loss of ($8.0)
million, or ($0.05) per share, in 2017. The ($19.3) million increase in net loss in 2018 was
driven primarily by the increase in Adjusted EBITDA loss of ($16.8) million, combined with
higher finance and other expense of ($2.2) million in 2018 due primarily to higher foreign
exchange losses, and an increase in loss on sale of assets of ($2.7) million. These net (loss)
increases in 2018 were partially offset by lower income tax expense of $1.2 million related
to withholding taxes on certain Chinese commercial contracts, and by lower asset
impairment charges of $1.5 million.
D-31

As noted above, net loss in 2018 was negatively impacted by a loss on sale of assets of
($4.0) million related to the divestiture by Protonex of its Power Manager assets to Revision.
Net loss in 2017 was negatively impacted by a loss on sale of assets of ($0.5) million and
asset impairment charges of ($1.5) million both related to the divestiture of certain SOFC
assets during the Upstart Transaction, and by a loss on sale of assets of ($0.9) million as a
result of the CHEM Backup Power Transaction. Excluding the impact of asset impairment
charges, transactional gains and losses, and acquisition costs, Adjusted Net Loss (see
Supplemental Non-GAAP Measures) in 2018 was ($23.4) million, or ($0.13) per share,
compared to ($5.2) million, or ($0.03) per share, for 2017.
Cash provided by (used in) operating activities
(Expressed in thousands of U.S. dollars) Year ended December 31,
2018 2017 $ Change % Change
Cash provided by (used in) operating
activities
$ (31,688) $ (9,768) $ (21,920) (224%)
Cash used in operating activities in 2018 was ($31.7) million, consisting of cash operating
losses of ($14.4) million combined with net working capital outflows of ($17.3) million. Cash
used in operating activities in 2017 was ($9.8) million, consisting of cash operating income
of $2.5 million offset by net working capital outflows of ($12.3) million. The ($21.9) million
increase in cash used in operating activities in 2018, as compared to 2017, was driven by
the relative increase in cash operating losses of ($16.9) million and by the relative increase
in working capital requirements of ($5.0) million. The relative ($16.9) million increase in
cash operating losses in 2018 was due primarily to the increase in Adjusted EBITDA loss of
($16.8) million, combined with higher finance and other expense of ($2.2) million in 2018
due primarily to higher foreign exchange losses. These net (loss) increases in 2018 were
partially offset by lower income tax expense of $1.2 million related to withholding taxes on
certain Chinese commercial contracts, and by higher equity investment losses in joint
venture and associates of $1.4 million which are included in Adjusted EBITDA but excluded
from cash operating losses.
The total change in working capital of ($17.3) million in 2018 was driven by higher
inventory of ($12.9) million primarily to support expected Heavy-Duty Motive shipments in
2019 and which were negatively impacted by higher MEA inventory as a result of minimal
shipments to Synergy Ballard JVCo in the third and fourth quarters of 2018 as a result of
them not making required prepayments under the MEA supply agreement, by higher
accounts receivable of ($11.7) million primarily as a result of the timing of revenues and the
related customer collections, and by lower accounts payable and accrued liabilities of ($5.6)
million as a result of the timing of supplier payments and annual compensation awards.
These 2018 outflows were partially offset by higher deferred revenue of $8.6 million due
primarily to a $9.0 million program prepayment received from Weichai Ballard JV, and by
higher accrued warranty obligations of $3.9 million primarily on Heavy-Duty Motive product
shipments.
This compares to a total change in working capital of ($12.3) million in 2017 which was
driven by lower deferred revenue of ($12.5) million as we fulfilled contract deliverables on
certain Heavy-Duty Motive and Technology Solutions contracts for which we received pre-
payments in an earlier period, by higher accounts receivable of ($9.4) million primarily as a
D-32
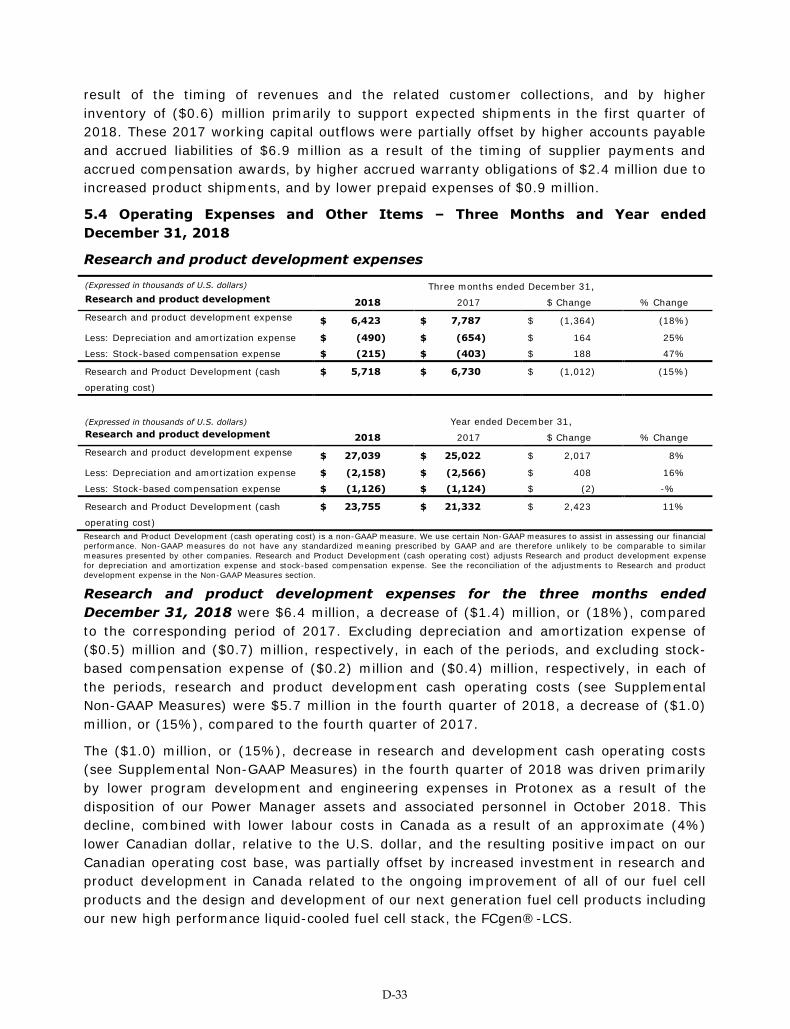
result of the timing of revenues and the related customer collections, and by higher
inventory of ($0.6) million primarily to support expected shipments in the first quarter of
2018. These 2017 working capital outflows were partially offset by higher accounts payable
and accrued liabilities of $6.9 million as a result of the timing of supplier payments and
accrued compensation awards, by higher accrued warranty obligations of $2.4 million due to
increased product shipments, and by lower prepaid expenses of $0.9 million.
5.4 Operating Expenses and Other Items – Three Months and Year ended December 31, 2018
Research and product development expenses
(Expressed in thousands of U.S. dollars) Three months ended December 31, Research and product development 2018 2017 $ Change % Change
Research and product development expense $ 6,423 $ 7,787 $ (1,364) (18%)
Less: Depreciation and amortization expense $ (490) $ (654) $ 164 25%
Less: Stock-based compensation expense $ (215) $ (403) $ 188 47%
Research and Product Development (cash
operating cost)
$ 5,718 $ 6,730 $ (1,012) (15%)
(Expressed in thousands of U.S. dollars)
Year ended December 31, Research and product development 2018 2017 $ Change % Change
Research and product development expense $ 27,039 $ 25,022 $ 2,017 8%
Less: Depreciation and amortization expense $ (2,158) $ (2,566) $ 408 16%
Less: Stock-based compensation expense $ (1,126) $ (1,124) $ (2) -%
Research and Product Development (cash
operating cost)
$ 23,755 $ 21,332 $ 2,423 11%
Research and Product Development (cash operating cost) is a non-GAAP measure. We use certain Non-GAAP measures to assist in assessing our financial performance. Non-GAAP measures do not have any standardized meaning prescribed by GAAP and are therefore unlikely to be comparable to similar
measures presented by other companies. Research and Product Development (cash operating cost) adjusts Research and product development expense
for depreciation and amortization expense and stock-based compensation expense. See the reconciliation of the adjustments to Research and product
development expense in the Non-GAAP Measures section.
Research and product development expenses for the three months ended December 31, 2018 were $6.4 million, a decrease of ($1.4) million, or (18%), compared
to the corresponding period of 2017. Excluding depreciation and amortization expense of
($0.5) million and ($0.7) million, respectively, in each of the periods, and excluding stock-
based compensation expense of ($0.2) million and ($0.4) million, respectively, in each of
the periods, research and product development cash operating costs (see Supplemental
Non-GAAP Measures) were $5.7 million in the fourth quarter of 2018, a decrease of ($1.0)
million, or (15%), compared to the fourth quarter of 2017.
The ($1.0) million, or (15%), decrease in research and development cash operating costs
(see Supplemental Non-GAAP Measures) in the fourth quarter of 2018 was driven primarily
by lower program development and engineering expenses in Protonex as a result of the
disposition of our Power Manager assets and associated personnel in October 2018. This
decline, combined with lower labour costs in Canada as a result of an approximate (4%)
lower Canadian dollar, relative to the U.S. dollar, and the resulting positive impact on our
Canadian operating cost base, was partially offset by increased investment in research and
product development in Canada related to the ongoing improvement of all of our fuel cell
products and the design and development of our next generation fuel cell products including
our new high performance liquid-cooled fuel cell stack, the FCgen®-LCS.
D-33
Research and product development expenses for the year ended December 31, 2018 were $27.0 million, an increase of $2.0 million, or 8%, compared to the
corresponding period of 2017. Excluding depreciation and amortization expense of ($2.2)
million and ($2.6) million, respectively, in each of the periods, and excluding stock-based
compensation expense of ($1.1) million in each of the periods, research and product
development cash operating costs (see Supplemental Non-GAAP Measures) were $23.8
million in 2018, an increase of $2.4 million, or 11%, compared to 2017.
The $2.4 million, or 11%, increase in research and development cash operating costs (see
Supplemental Non-GAAP Measures) in 2018 were driven primarily by increased investment
in research and product development in Canada related to the ongoing improvement of all
of our fuel cell products and the design and development of our next generation fuel cell
products including our new high performance liquid-cooled fuel cell stack, the FCgen®-LCS.
These cost increases were partially offset by lower costs at Protonex as a result of the
Company’s rationalization initiatives undertaken in the third and fourth quarters of 2017 and
by the disposition of the Power Manager assets and associated personnel in October 2018.
Government funding recoveries were also lower in 2018 as compared to 2017 due primarily
to a decline in government funding recoveries in Denmark by Ballard Power Systems Europe
A/S. Government research funding, and development costs capitalized as fuel cell
technology intangible assets, are reflected as cost offsets to research and product
development expenses, whereas labour and material costs incurred on revenue producing
engineering services projects are reallocated from research and product development
expenses to cost of goods sold.
Depreciation and amortization expense included in research and product development expense for the three months and year ended December 31, 2018 was $0.5 million and
$2.2 million, respectively, compared to $0.7 million and $2.6 million, respectively, for the
corresponding periods of 2017. Depreciation and amortization expense relates primarily to
amortization expense on our intangible assets and depreciation expense on our research
and product development equipment. Amortization expense on intangible assets is primarily
due to the acquisition of Protonex on October 1, 2015 and the resulting amortization of
acquired intangible assets.
Stock-based compensation expense included in research and product development expense for the three months and year ended December 31, 2018 was $0.2 million and $1.1 million,
respectively, relatively consistent with the amounts recognized in the corresponding periods
of 2017 of $0.4 million and $1.1 million, respectively.
D-34

General and administrative expenses
(Expressed in thousands of U.S. dollars) Three months ended December 31, General and administrative 2018 2017 $ Change % Change
General and administrative expense $ 4,479 $ 3,223 $ 1,256 39%
Less: Depreciation and amortization expense $ (302) $ (352) $ 50 14%
Less: Stock-based compensation expense $ (213) $ (516) $ 303 59%
Add: Unrealized gain (loss) on foreign
exchange contracts
$ (450) $ 189 $ (639) (338%)
General and Administrative (cash operating
cost)
$ 3,514 $ 2,544 $ 970 38%
(Expressed in thousands of U.S. dollars) Year ended December 31, General and administrative 2018 2017 $ Change % Change
General and administrative expense $ 14,760 $ 12,602 $ 2,158 17%
Less: Depreciation and amortization expense $ (1,254) $ (1,019) $ (235) (23%)
Less: Stock-based compensation expense $ (1,231) $ (1,524) $ 293 19%
Add: Unrealized gain (loss) on foreign
exchange contracts
$ (570) $ 189 $ (759) (402%)
General and Administrative (cash operating
cost)
$ 11,705 $ 10,248 $ 1,457 14%
General and Administrative (cash operating cost) is a non-GAAP measure. We use certain Non-GAAP measures to assist in assessing our financial
performance. Non-GAAP measures do not have any standardized meaning prescribed by GAAP and are therefore unlikely to be comparable to similar
measures presented by other companies. General and Administrative (cash operating cost) adjusts General and administrative expense for depreciation and amortization expense, stock-based compensation expense and unrealized gains or losses on foreign exchange contracts. See the reconciliation of the
adjustments to General and administrative expense in the Non-GAAP Measures section.
General and administrative expenses for the three months ended December 31, 2018 were $4.5 million, an increase of $1.3 million, or 39%, compared to the
corresponding period of 2017. Excluding depreciation and amortization expense of ($0.3)
million and ($0.4) million, respectively, in each of the periods, excluding stock-based
compensation expense of ($0.2) million and ($0.5) million, respectively, in each of the
periods, and excluding unrealized gains (losses) on foreign exchange contracts of ($0.5)
and $0.2 million, respectively, in each of the periods, general and administrative cash
operating costs (see Supplemental Non-GAAP Measures) were $3.5 million in the fourth
quarter of 2018, an increase of $1.0 million, or 38%, compared to the fourth quarter of
2017.
The $1.0 million, or 38%, increase in general and administrative cash operating costs (see
Supplemental Non-GAAP Measures) in the fourth quarter of 2018 was driven primarily by
higher realized losses on our foreign exchange contracts which are designed as a hedge
against our Canadian dollar labour costs, and by higher legal and advisory costs due to the
timing of transactional contracting and human resources costs. These cost increases in the
fourth quarter of 2018 were partially offset by lower expenses in Protonex as a result of the
disposition of our Power Manager assets and associated personnel in October 2018, and by
lower labour costs in Canada as a result of an approximate (4%) lower Canadian dollar,
relative to the U.S. dollar, and the resulting positive impact on our Canadian operating cost
base.
General and administrative expenses for the year ended December 31, 2018 were
$14.8 million, an increase of $2.2 million, or 17%, compared to the corresponding period of
2017. Excluding depreciation and amortization expense of ($1.3) million and ($1.0) million,
D-35

respectively, in each of the periods, excluding stock-based compensation expense of ($1.2)
million and ($1.5) million, respectively, in each of the periods, and excluding unrealized
gains (losses) on foreign exchange contracts of ($0.6) million and $0.2 million, respectively,
in each of the periods, general and administrative cash operating costs (see Supplemental
Non-GAAP Measures) were $11.7 million in 2018, an increase of $1.5 million, or 14%,
compared 2017.
The $1.5 million, or 14%, increase in general and administrative cash operating costs (see
Supplemental Non-GAAP Measures) in 2018 was driven primarily by higher realized losses
on our foreign exchange contracts which are designed as a hedge against our Canadian
dollar labour costs, and by higher legal and advisory costs due to the timing of transactional
contracting and human resources costs. These cost increases in 2018 were partially offset
by lower costs at Protonex as a result of the Company’s rationalization initiatives
undertaken in the third and fourth quarters of 2017 and by the disposition of the Power
Manager assets and associated personnel in October 2018.
Depreciation and amortization expense included in general and administrative expense for
the three months and year ended December 31, 2018 was $0.3 million and $1.3 million,
respectively, compared to $0.4 million and $1.0 million respectively, for the corresponding
periods of 2017. Depreciation and amortization expense relates primarily to our office and
information technology intangible assets and has increased in 2018 primarily as a result of
our recent investment in a new ERP system.
Stock-based compensation expense included in general and administrative expense for the
three months and year ended December 31, 2018 was $0.2 million and $1.2 million,
respectively, compared to $0.5 million and $1.5 million, respectively, for the corresponding
periods of 2016. The decline in 2018 is primarily as a result of cost reduction activities at
Protonex including the disposition of the Power Manager assets and associated personnel.
Unrealized gains (losses) on foreign exchange contracts included in general and administrative expense for the three months and year ended December 31, 2018 was
($0.5) million and ($0.6) million, respectively, compared to $0.2m for each of the
corresponding periods of 2017. We use forward foreign exchange contracts to manage our
exposure to currency rate fluctuations. We record these contracts at their fair value as of
the balance sheet date as either assets or liabilities with any changes in fair value in the
period recorded in profit or loss (general and administrative expense) as these contracts are
not designated or qualified under hedge accounting criteria. At December 31, 2018, we had
outstanding foreign exchange currency contracts to purchase a total of Canadian $17.4
million at an average rate of 1.3014 Canadian per U.S. dollar, resulting in an unrealized loss
of Canadian ($0.8) million at December 31, 2018.
D-36

Sales and marketing expenses
(Expressed in thousands of U.S. dollars) Three months ended December 31, Sales and marketing 2018 2017 $ Change % Change
Sales and marketing expense $ 2,033 $ 2,144 $ (111) (5%)
Less: Depreciation and amortization expense $ - $ - $ - -%
Less: Stock-based compensation expense $ (68) $ (174) $ 106 61%
Sales and Marketing (cash operating cost) $ 1,965 $ 1,970 $ (5) -%
(Expressed in thousands of U.S. dollars)
Year ended December 31, Sales and marketing 2018 2017 $ Change % Change
Sales and marketing expense $ 8,068 $ 7,951 $ 117 1%
Less: Depreciation and amortization expense $ - $ (1) $ 1 -%
Less: Stock-based compensation expense $ (546) $ (477) $ (69) (15%)
Sales and Marketing (cash operating cost) $ 7,522 $ 7,473 $ 49 1%
Sales and Marketing (cash operating cost) is a non-GAAP measure. We use certain Non-GAAP measures to assist in assessing our financial performance.
Non-GAAP measures do not have any standardized meaning prescribed by GAAP and are therefore unlikely to be comparable to similar measures
presented by other companies. Sales and Marketing (cash operating cost) adjusts Sales and marketing expense for depreciation and amortization expense and stock-based compensation expense. See the reconciliation of the adjustments to Sales and marketing expense in the Non-GAAP Measures
section.
Sales and marketing expenses for the three months ended December 31, 2018
were $2.0 million, a decrease of ($0.1) million, or (5%), compared to the corresponding
period of 2017. Excluding stock-based compensation expense of ($0.1) million and ($0.2)
million, respectively, in each of the periods, sales and marketing cash operating costs (see
Supplemental Non-GAAP Measures) were $2.0 million in the fourth quarter of 2018, flat
compared to the fourth quarter of 2017.
Sales and marketing expenses for the year ended December 31, 2018 were $8.1
million, an increase of $0.1 million, or 1%, compared to the corresponding period of 2017.
Excluding stock-based compensation expense of ($0.5) million in each of the periods, sales
and marketing cash operating costs (see Supplemental Non-GAAP Measures) were $7.5
million in 2018, an increase of $0.05 million, or 1%, compared to 2017.
The nominal increase in sales and marketing cash operating costs (see Supplemental Non-
GAAP Measures) in 2018 was driven primarily by an increased investment to support our
commercial sales and marketing efforts in China. This cost increase was effectively offset by
lower costs at Protonex as a result of the Company’s rationalization initiatives undertaken in
the third and fourth quarters of 2017 and the disposition of the Power Manager assets and
associated personnel in October 2018.
Stock-based compensation expense included in sales and marketing expense for the three months and year ended December 31, 2018 was $0.1 million and $0.5 million, respectively,
relatively consistent with the amounts recognized in the corresponding periods of 2017 of
$0.2 million and $0.5 million, respectively.
Other expense for the three months and year ended December 31, 2018 was $0.5
million and $0.6 million, respectively, compared to nil million and $0.9 million, respectively,
for the corresponding periods of 2017. The following table provides a breakdown of other
expense for the reported periods:
D-37

(Expressed in thousands of U.S. dollars) Three months ended December 31,
2018 2017 $ Change % Change
Impairment loss (recovery) on trade
receivables $ 68 $ 101 $ (33) (32%)
Restructuring expense (recovery) 438 (71) 509 717%
Acquisition charges - - - -
Other expenses (recovery) $ 506 $ 30 $ 476 1,587%
(Expressed in thousands of U.S. dollars) Year ended December 31,
2018 2017 $ Change % Change
Impairment loss (recovery) on trade
receivables $ 98 $ 103 $ (5) (5%)
Restructuring expense 507 799 (292) (37%)
Acquisition charges - - - -
Other expenses (recovery) $ 605 $ 902 $ (297) (33%)
Restructuring expenses of $0.5 million for the year ended December 31, 2018 relate
primarily to a change in operations leadership combined with severance obligations paid to
departed employees at Protonex as a result of the disposition of the Power Manager assets
and associated personnel. Restructuring expenses of $0.8 million for the year ended
December 31, 2017 relate primarily to a leadership change in sales and marketing
combined with cost reduction initiatives in the general and administration function
undertaken in the first quarter of 2017, and by cost reduction initiatives at Protonex
undertaken in the third quarter of 2017.
Net impairment loss (recovery) on trade receivables for the three months ended December
31, 2018 and 2017 were nominal. In the event that we are able to recover on an impaired
trade receivable through legal or other means, the recovered amount is recognized in the
period of recovery as a reversal of the impairment loss.
Finance income (loss) and other for the three months and year ended December 31, 2018 was nil million and ($0.4) million, respectively, compared to ($0.2) million and
$1.8 million, respectively, for the corresponding periods of 2017. The following tables
provide a breakdown of finance and other income (loss) for the reported periods:
(Expressed in thousands of U.S. dollars) Three months ended December 31,
2018 2017 $ Change % Change
Employee future benefit plan expense $ (58) $ (51) $ (7) (14%)
Pension administration expense (104) - (104) (100%)
Investment and other income (loss) 617 147 470 320%
Foreign exchange gain (loss) (469) (322) (147) (46%)
Finance income (loss) and other $ (14) $ (226) $ 212 94%
D-38

(Expressed in thousands of U.S. dollars) Year ended December 31,
2018 2017 $ Change % Change
Employee future benefit plan expense $ (226) $ (230) $ 4 2%
Pension administration expense (117) (118) 1 1%
Investment and other income (loss) 972 436 535 123%
Foreign exchange gain (loss) (1,078) 1,692 (2,770) (164%)
Finance income (loss) and other $ (449) $ 1,780 $ (2,230) (125%)
Employee future benefit plan expense for the years ended December 31, 2018 and 2017
were ($0.2) million in each of the periods and primarily represent the excess of expected
interest cost on plan obligations in excess of the expected return on plan assets related to a
curtailed defined benefit pension plan for certain former United States employees. Pension
administration expense for the years ended December 31, 2018 and 2017 were ($0.1)
million in each of the periods and represent administrative costs incurred in managing the
plan.
Foreign exchange gains (losses) for the three months and year ended December 31, 2018
were ($0.5) million and ($1.1) million, respectively, compared to ($0.3) million and $1.7
million, respectively, for the corresponding periods of 2017. Foreign exchange gains and
losses are attributable primarily to the effect of the changes in the value of the Canadian
dollar, relative to the U.S. dollar, on our Canadian dollar-denominated net monetary
position. Foreign exchange gains and losses impacted by the conversion of Ballard Power
Systems Europe A/S’ assets and liabilities from the Danish Kroner to the U.S. dollar at
exchange rates in effect at each reporting date are recorded in other comprehensive income
(loss).
Investment and other income for the months and year ended December 31, 2018 were $0.6
million and $1.0 million, respectively, compared to $0.1 million and $0.4 million,
respectively, for the corresponding periods of 2017. Amounts were earned primarily on our
cash and cash equivalents.
Finance expense for the three months and year ended December 31, 2018 was
($0.1) million and ($0.5) million, respectively, compared to ($0.2) million and ($0.7)
million, respectively, for the corresponding periods of 2017. Finance expense relates
primarily to the sale and leaseback of our head office building in Burnaby, British Columbia
which was completed in 2010. Due to the long term nature of the lease, the leaseback of
the building qualifies as a finance (or capital) lease.
Equity in income (loss) of investment in joint venture and associates for the three months and year ended December, 2018 was ($1.1) million and ($1.2) million,
respectively, compared to $0.3 million and $0.2 million, respectively, for the corresponding
periods of 2017. Equity in income of investment in joint venture and associates relates to
the pickup of 10% of the net income (loss) of Synergy Ballard JVCo as a result of our 10%
ownership position, and 49% of the net income (loss) of Weichai Ballard JV as a result of
our 49% ownership position. Both of these investments in China are accounted for using the
equity method of accounting.
Loss on sale of assets for the three months and year ended December 31, 2018 were ($4.0) million primarily as a result of the divestiture of our Power Manager assets to
D-39

Revision on October 5, 2018. At closing, Ballard received initial consideration of
approximately $4.1 million, paid in $2.0 million cash and a $2.1 million note receivable
payable in the second quarter of 2019, and may receive up to a further $11.25 million,
based on achievement of specific sales objectives during a 12-month earn-out period. The
loss on sale of Power Manager assets of ($4.0) million was calculated after estimating the
amount of variable consideration included in the transaction price that is constrained to be
$2.0 million, as opposed to the above noted maximum possible earn-out amount of $11.25
million. The estimate of the ultimate transaction price, including the estimate of the amount
of earn-out variable consideration that is considered constrained of $2.0 million, will be
reassessed each quarter-end during 2019. Any change in the estimated transaction price
will result in an adjustment to the above noted loss on sale of assets which will be
recognized on a prospective basis.
Loss on sale of assets for the three months and year ended December 31, 2017 were ($0.5) million and ($1.4) million, respectively, consisting of additional losses incurred
in the first three quarters of 2017 of ($0.9) million as a result of the CHEM Backup Power
Transaction, and a loss incurred in the fourth quarter of 2017 of ($0.5) million on the
Upstart SOFC Transaction.
During 2017, we recorded a loss on sale of assets of ($0.9) million as the remaining
estimated potential purchase price owing from the 2016 CHEM Transaction was written
down to its revised and final fair value of $0.9 million (which was collected in the fourth
quarter of 2017) from its previous fair value estimate of $1.8 million as of December 31,
2016.
During the fourth quarter of 2017, we sold certain Protonex solid oxide fuel cells (“SOFC)
assets consisting primarily of SOFC inventory to Upstart Power Inc. for nominal
consideration, resulting in a loss on sale of assets of ($0.5) million. This action had enabled
Ballard to significantly reduce the cost structure at Protonex. No restructuring expense was
incurred as a result of this transaction.
Impairment (Loss) on Intangible Assets and Property, Plant and Equipment for the three months and year ended December 31, 2017 was ($1.5) million and consists of a
($1.2) million impairment charge on intangible assets and a ($0.3) million impairment
charge on property, plant and equipment as we wrote-down certain SOFC fuel cell assets to
their estimated net realizable value of $0.05 million. The impairment charges were incurred
during the fourth quarter of 2017 while we continued to review strategic alternatives for our
SOFC fuel cell assets at Protonex prior to concluding the transaction with Upstart Power Inc.
Income tax expense for the three months ended and year ended December 31, 2018 was ($0.1) million and ($0.4) million, respectively, compared to ($0.2) million and
($1.6) million, respectively, for the corresponding periods of 2017. Income tax expense
relates primarily to withholding taxes in China deducted from proceeds earned on certain
Chinese commercial contracts.
D-40

5.5 Summary of Quarterly Results
The following table provides summary financial data for our last eight quarters:
(Expressed in thousands of U.S. dollars, except per share amounts and weighted average shares outstanding which are expressed in thousands)
Quarter ended,
Dec 31,
2018
Sep 30,
2018
Jun 30,
2018
Mar 31,
2018
Revenues $ 28,477 $ 21,574 $ 26,445 $ 20,090
Net income (loss) attributable to Ballard $ (11,475) $ (6,024) $ (4,323) $ (5,500)
Net income (loss) per share attributable to
Ballard, basic and diluted
$ (0.06) $ (0.03) $ (0.02) $ (0.03)
Weighted average common shares outstanding 207,047 179,153 178,727 178,186
Dec 31,
2017
Sep 30,
2017
Jun 30,
2017
Mar 31,
2017
Revenues $ 40,257 $ 31,854 $ 26,521 $ 22,656
Net income (loss) attributable to Ballard $ (2,887) $ (1,027) $ (1,201) $ (2,935)
Net income (loss) per share attributable to
Ballard, basic and diluted
$ (0.02) $ (0.01) $ (0.01) $ (0.02)
Weighted average common shares outstanding 177,803 176,438 175,953 174,853
Summary of Quarterly Results: There were no significant seasonal variations in our
quarterly results. Variations in our net loss for the above periods were affected primarily by
the following factors:
Revenues: Variations in fuel cell product and service revenues reflect the demand and
timing of our customers’ fuel cell vehicle, bus and fuel cell product deployments as well
as the demand and timing of their engineering services projects. Variations in fuel cell
product and service revenues also reflect the timing of work performed and the
achievements of milestones under long-term fixed price contracts. Revenues were
positively impacted in the fourth quarter of 2017 as we fulfilled an $18 million supply
contract (announced on June 5, 2017) for 400 FCveloCity® fuel cell engines and
consisting primarily of shipments of FCveloCity®-MD 30-kilowatt fuel cell products and
MEAs.
Operating expenditures: Operating expenses were negatively impacted in the fourth
quarter of 2018 by restructuring expenses of ($0.4) million related to a change in
operations leadership combined with severance obligations paid to departed employees
at Protonex as a result of the disposition of the Power Manager assets and associated
personnel. Operating expenses were negatively impacted in the first quarter of 2017 by
restructuring expenses of ($0.6) million related to a leadership change in sales and
marketing and by cost reduction initiatives in the general and administration function.
Operating expenses also include the impact of changes in the value of the Canadian
dollar, versus the U.S. dollar, on our Canadian dollar denominated expenditures.
Net income (loss): Net income (loss) for the fourth quarter of 2018 was negatively
impacted by a loss on sale of assets of ($4.0) million as a result of the divestiture of our
Power Manager assets to Revision on October 5, 2018. Net income (loss) for the fourth
quarter of 2017 was negatively impacted by a loss on sale of assets of ($0.5) million as
we sold certain SOFC fuel cell inventory to Upstart for nominal proceeds. Net loss in the
fourth quarter of 2017 was also negatively impacted by impairment charges of ($1.5)
D-41

million consisting of a ($1.2) million impairment charge on intangible assets and a
($0.3) million impairment charge on property, plant and equipment as we wrote-down
certain SOFC fuel cell assets to their estimated net realizable value of $0.05 million. Net
income (loss) for the second quarter of 2017 was negatively impacted by a loss on sale
of assets of ($0.8) million as we recorded an impairment adjustment against the
potential purchase price receivable from the CHEM Transaction by reducing the
estimated fair value of the potential remaining earn-out to $1.0 million from $1.8
million.
6 CASH FLOWS, LIQUIDITY AND CAPITAL RESOURCES
6.1 Summary of Cash Flows
Cash and cash equivalents were $192.2 million at December 31, 2018, compared to $60.3
million at December 31, 2017. The $131.9 million increase in cash and cash equivalents in
2018 was driven by net proceeds received from the Weichai and Broad-Ocean strategic
financings of $183.7 million, net proceeds received from share purchase warrant exercises
of $1.4 million, net proceeds received from share purchase option exercises of $1.6 million,
and initial net proceeds received on the sale of Power Manager assets of $1.3 million. These
2018 inflows were partially offset by net losses (excluding non-cash items) of ($14.4)
million, net working capital outflows of ($17.3) million, initial equity investment in Weichai
Ballard JV of ($14.6) million, purchases of property, plant and equipment of ($9.9) million,
and by finance lease repayments of ($0.6) million.
6.2 Cash Provided by (Used by) Operating Activities
For the three months ended December 31, 2018, cash provided by operating activities was
$0.2 million, consisting of net working capital inflows of $4.6 million, partially offset by cash
operating losses of ($4.4) million. For the three months ended December 31, 2017, cash
used in operating activities was ($0.7) million, consisting of cash operating income of $1.7
million partially offset by net working capital outflows of ($2.4) million. The $0.9 million
improvement in cash provided by (used in) operating activities in the fourth quarter of
2018, as compared to the fourth quarter of 2017, as compared to the fourth quarter of
2017, was driven by the relative decrease in working capital requirements of $7.1 million,
partially offset by the increase in cash operating losses of ($6.1) million. The relative ($6.1)
million increase in cash operating losses in the fourth quarter of 2018 was due primarily to
the increase in Adjusted EBITDA loss of ($7.3) million, partially offset by higher equity
investment losses in joint venture and associates of $1.4 million which are included in
Adjusted EBITDA but excluded from cash operating losses.
In the fourth quarter of 2018, net working capital inflows of $4.6 million were driven by
higher deferred revenue of $8.5 million due primarily to a $9.0 million program prepayment
received from Weichai Ballard JV, by lower inventory of $3.7 million as we delivered
expected Heavy-Duty Motive shipments to customers in the fourth quarter of 2018, and by
higher accrued warranty obligations of $1.6 million primarily on Heavy-Duty Motive product
shipments. These fourth quarter of 2018 inflows were partially offset by higher accounts
receivable of ($9.8) million primarily as a result of the timing of revenues and the related
customer collections.
D-42
higher accounts receivable of ($5.7) million primarily as a result of the timing of revenues
and the related customer collections, and by lower deferred revenue of ($1.5) million as we
fulfilled contract deliverables on certain Heavy-Duty Motive and Technology Solutions
contracts for which we received pre-payments in an earlier period. These fourth quarter of
2017 outflows were partially offset by higher accounts payable and accrued liabilities of $2.1
million as a result of the timing of supplier payments and annual compensation awards, by
lower inventory of $2.0 million as we delivered expected Heavy-Duty Motive shipments to
customers in the last quarter of 2017, and by higher accrued warranty obligations of $0.8
million due to increased product shipments.
For the year ended December 31, 2018, cash used in operating activities was ($31.7)
million, consisting of cash operating losses of ($14.4) million combined with net working
capital outflows of ($17.3) million. For the year ended December 31, 2017, cash used in
operating activities was ($9.8) million, consisting of cash operating income of $2.5 million
offset by net working capital outflows of ($12.3) million. The ($21.9) million increase in
cash used in operating activities in 2018, as compared to 2017, was driven by the relative
increase in cash operating losses of ($16.9) million and by the relative increase in working
capital requirements of ($5.0) million. The relative ($16.9) million increase in cash
operating losses in 2018 was due primarily to the increase in Adjusted EBITDA loss of
($16.8) million, combined with higher finance and other expense of ($2.2) million in 2018
due primarily to higher foreign exchange losses. These net (loss) increases in 2018 were
partially offset by lower income tax expense of $1.2 million related to withholding taxes on
certain Chinese commercial contracts, and by higher equity investment losses in joint
venture and associates of $1.4 million which are included in Adjusted EBITDA but excluded
from cash operating losses.
In 2018, net working capital outflows of ($17.3) million were driven by higher inventory of
($12.9) million primarily to support expected Heavy-Duty Motive shipments in 2019 and
which were negatively impacted by higher MEA inventory as a result of minimal shipments
to Synergy Ballard JVCo in the third and fourth quarters of 2018 as a result of them not
making required prepayments under the MEA supply agreement, by higher accounts
receivable of ($11.7) million primarily as a result of the timing of revenues and the related
customer collections, and by lower accounts payable and accrued liabilities of ($5.6) million
as a result of the timing of supplier payments and annual compensation awards. These 2018
outflows were partially offset by higher deferred revenue of $8.6 million due primarily to a
$9.0 million program prepayment received from Weichai Ballard JV, and by higher accrued
warranty obligations of $3.9 million primarily on Heavy-Duty Motive product shipments.
In 2017, net working capital outflows of ($12.3) million were driven by lower deferred
revenue of ($12.5) million as we fulfilled contract deliverables on certain Heavy-Duty Motive
and Technology Solutions contracts for which we received pre-payments in an earlier
period, by higher accounts receivable of ($9.4) million primarily as a result of the timing of
revenues and the related customer collections, and by higher inventory of ($0.6) million
primarily to support expected shipments in the first quarter of 2018. These 2017 working
capital outflows were partially offset by higher accounts payable and accrued liabilities of
$6.9 million as a result of the timing of supplier payments and accrued compensation
awards, by higher accrued warranty obligations of $2.4 million due to increased product
In the fourth quarter of 2017, net working capital outflows of ($2.4) million were driven by
D-43

shipments, and by lower prepaid expenses of $0.9 million.
6.3 Cash Provided by (Used by) Investing Activities
Investing activities resulted in net cash outflows of ($14.9) million and ($23.1) million,
respectively, for the three months and year ended December 31, 2018, compared to net
cash outflows of ($0.5) million and ($6.5) million, respectively, for the corresponding
periods of 2017.
Investing activities in 2018 of ($23.1) million consist primarily of investments in associated
companies of ($14.6) million paid as an initial equity contribution in our 49% investment in
Weichai Ballard JV, and capital expenditures of ($9.9) million incurred primarily for
production and test equipment including the acquisition of certain strategic assets of AFCC
in the third quarter of 2018 for approximately Canadian $6 million. These 2018 investments
were partially offset by initial net proceeds received of $1.3 million related to the sale of the
Power Manager assets by Protonex to Revision.
Investing activities in 2017 of ($6.5) million consist primarily of capital expenditures of
($3.1) million, investments in other intangible assets of ($3.4) million related primarily to
the implementation of a new Enterprise Resource Planning (“ERP”) management reporting
software system, investments in associated companies of ($1.0) million paid for our 10%
investment in Synergy Ballard JVCo, partially offset by final net proceeds of $1.0 million
received in the fourth quarter of 2017 from the CHEM Transaction.
6.4 Cash Provided by (Used by) Financing Activities
Financing activities resulted in net cash inflows of $183.6 million and $186.1 million,
respectively, for the three months and year ended December 31, 2018, compared to net
cash inflows of $1.6 million and $5.0 million, respectively, for the three months and year
ended December 31, 2017.
Financing activities in 2018 of $186.1 million consist of net proceeds of $183.7 million
received from the Weichai and Broad-Ocean strategic equity investments in Ballard,
proceeds from share purchase warrant exercises of $1.4 million, proceeds from share
purchase option exercises of $1.6 million, partially offset by finance lease payments of
($0.6) million.
Financing activities in 2017 of $5.0 million consist of proceeds from share purchase warrant
exercises of $2.0 million, proceeds from share purchase option exercises of $3.6 million,
partially offset by capital lease payments of ($0.6) million.
6.5 Liquidity and Capital Resources
At December 31, 2018, we had total liquidity of $192.2 million. We measure liquidity as our
net cash position, consisting of the sum of our cash, cash equivalents and short-term
investments of $192.2 million, net of amounts drawn on our $7 million Canadian demand
revolving facility (“Operating Facility”) of nil. The Operating Facility is available to be used in
helping to finance our short term working capital requirements and is secured by a
hypothecation of our cash, cash equivalents and short-term investments.
We also have a $1.8 million Canadian capital leasing facility (“Leasing Facility”) which is
available to be used to finance the acquisition and / or lease of operating equipment and is
D-44

secured by a hypothecation of our cash, cash equivalents and short-term investments. As of
December 31, 2018, nothing was outstanding on the Leasing Facility.
Our liquidity objective is to maintain cash balances sufficient to fund at least six quarters of
forecasted cash used by operating activities and expected joint venture capital contributions
at all times. Our strategy to attain this objective is to continue our drive to attain profitable
operations that are sustainable by executing a business plan that continues to focus on Fuel
Cell Products and Services revenue growth, improving overall gross margins, maintaining
discipline over Cash Operating Costs, managing working capital requirements, and securing
additional financing to fund our operations as needed until we do achieve profitable
operations that are sustainable. We believe that we currently have adequate liquidity in
cash and working capital to achieve our liquidity objective.
Failure to achieve or maintain this liquidity objective could have a material adverse effect on
our financial condition and results of operations including our ability to continue as a going
concern. There are also various risks and uncertainties affecting our ability to achieve this
liquidity objective including, but not limited to, the market acceptance and rate of
commercialization of our products, the ability to successfully execute our business plan, and
general global economic conditions, certain of which are beyond our control. While we
continue to make significant investments in product development and market development
activities necessary to commercialize our products, make increased investments in working
capital as we grow our business, and make ongoing capital contributions in support of our
investment in Weichai Ballard JV, our actual liquidity requirements will also vary and will be
impacted by our relationships with our lead customers and strategic partners including their
ability to successfully finance and fund their operations and programs and agreements with
us, our success in developing new channels to market and relationships with customers, our
success in generating revenue growth from near-term product, service and licensing
opportunities, our success in managing our operating expense and working capital
requirements, foreign exchange fluctuations, and the progress and results of our research,
development and demonstration programs.
We may also choose to pursue additional liquidity through the issuance of debt or equity in
private or public market financings. To enable the timely issuance of equity securities in the
public market, Ballard has a shelf prospectus on file with the securities regulators in Canada
and the United States, expiring in July 2020. The Prospectus was filed in each of the
provinces and territories of Canada, except Quebec, and a corresponding shelf registration
statement on Form F-10 (Registration Statement) was also filed with the United States
Securities and Exchange Commission (“SEC”). These filings enable offerings of securities up
to an aggregate initial offering price of $150 million at any time during the 25-month period
that the Prospectus remains effective.
No assurance can be given that any such additional liquidity will be available or that, if
available, it can be obtained on terms favorable to the Company. If any securities are
offered under the Prospectus and/or Registration Statement, the terms of any such
securities and the intended use of the net proceeds resulting from such offering would be
established at the time of any offering and would be described in a Prospectus supplement
filed with applicable Canadian securities regulators and/or the SEC, respectively, at the time
of such an offering.
D-45

7 OTHER FINANCIAL MATTERS
7.1 Off-Balance Sheet Arrangements and Contractual Obligations
Periodically, we use forward foreign exchange and forward platinum purchase contracts to
manage our exposure to currency rate fluctuations and platinum price fluctuations. We
record these contracts at their fair value as either assets or liabilities on our balance sheet.
Any changes in fair value are either (i) recorded in other comprehensive income if formally
designated and qualified under hedge accounting criteria; or (ii) recorded in profit or loss
(general and administrative expense) if either not designated, or not qualified, under hedge
accounting criteria. At December 31, 2018, we had outstanding foreign exchange currency
contracts to purchase a total of Canadian $17.4 million at an average rate of 1.3014
Canadian per U.S dollar, resulting in an unrealized loss of Canadian ($0.8) million at
December 31, 2018. The outstanding foreign exchange currency contracts are not qualified
under hedge accounting.
At December 31, 2018, we did not have any other material obligations under guarantee
contracts, retained or contingent interests in transferred assets, outstanding derivative
instruments or non-consolidated variable interests.
At December 31, 2018, we had the following contractual obligations and commercial
commitments (including capital contribution commitments to Weichai Ballard JV):
(Expressed in thousands of U.S. dollars) Payments due by period,
Contractual Obligations Total Less than
one year
1-3 years 4-5 years After 5
years
Operating leases $ 17,770 $ 2,335 $ 4,436 $ 4,148 $ 6,851
Finance leases 7,107 1,023 2,355 2,355 1,374
Asset retirement obligations 1,825 - - - 1,825
Capital contributions to Weichai
Ballard JV
64,121 20,839 34,198 9,084 -
Total contractual obligations $ 90,823 $ 24,197 $ 40,989 $ 15,587 $ 10,050
In addition, we have outstanding commitments of $2.9 million at December 31, 2018
related primarily to purchases of property, plant and equipment. Capital expenditures and
expenditures on other intangible assets pertain to our regular operations and are expected
to be funded through cash on hand.
In connection with the acquisition of intellectual property from UTC in 2014, we have a
royalty obligation in certain circumstances to pay UTC a portion of any future intellectual
property sale and licensing income generated from certain of our intellectual property
portfolio for a period of 15-years expiring in April 2029. No royalties were paid to UTC in the
years ended December 31, 2018 and 2017.
As of December 31, 2018, we retain a previous funding obligation to pay royalties of 2% of
revenues (to a maximum of Canadian $5.4 million) on sales of certain fuel cell products for
commercial distributed utility applications. No royalties have been incurred to date as a
result of this agreement. We also retain a previous funding obligation to pay royalties of 2%
of revenues (to a maximum of Canadian $2.2 million) on sales of certain fuel cell products
for commercial transit applications. No royalties have been incurred to date as a result of
this agreement.
D-46

In the ordinary course of business or as required by certain acquisition or disposition
agreements, we are periodically required to provide certain indemnities to other parties. At
December 31, 2018, we have not accrued any amount owing, or receivable, as a result of
any indemnity agreements undertaken in the ordinary course of business.
In January, February and April 2018, certain related class action complaints were filed in
U.S. Federal Court alleging violations of U.S. federal securities laws. In April plaintiffs
voluntarily dismissed all but one of their cases, Porwal v. Ballard Power Systems, Inc. et al
(S.D. N.Y.). Under the current scheduling order in this action, Plaintiffs filed an amended
complaint on June 22, 2018. Ballard will vigorously contest, and defend against, Plaintiffs’
claims and believes the claims are without merit.
7.2 Related Party Transactions
Related parties include our 49% owned equity accounted investee, Weichai Ballard JV, and
our 10% owned equity accounted investee, Synergy Ballard JVCo, Transactions between us
and our subsidiaries are eliminated on consolidation. For the three months and year ended
December 31, 2018 and 2017, related party transactions and balances with Weichai Ballard
JV and Synergy Ballard JVCo total as follows:
(Expressed in thousands of U.S. dollars)
Three Months Ended December 31,
Transactions with related parties 2018 2017
Revenues $ 2,060 $ 6,369
Cost of goods sold $ - $ -
(Expressed in thousands of U.S. dollars)
Year Ended December 31,
Transactions with related parties 2018 2017
Revenues $ 18,795 $ 30,916
Cost of goods sold $ - $ -
(Expressed in thousands of U.S. dollars)
As at December 31,
Balances with related parties 2018 2017
Accounts receivable $ 1,604 $ 1,415
Investments $ 13,989 $ 676
Deferred revenue $ (10,896) $ (2,973)
We also provide key management personnel, being board directors and executive officers,
certain benefits, in addition to their salaries. Key management personnel also participate in
the Company’s share-based compensation plans. Key management personnel compensation
is summarized in note 31 to our annual consolidated financial statements for the year ended
December 31, 2018.
D-47

7.3 Outstanding Share and Equity Information
As at March 6, 2019
Common share outstanding 231,929,309
Warrants outstanding -
Options outstanding 5,053,795
DSU’s outstanding 747,213
RSU’s / PSU’s outstanding (subject to vesting and performance criteria) 1,778,192
8 ACCOUNTING MATTERS
8.1 Overview Our consolidated financial statements are prepared in accordance with IFRS, which require
us to make estimates and assumptions that affect the application of accounting policies and
the reported amounts of assets, liabilities, income and expenses. Actual results may differ
from those estimates. Estimates and underlying assumptions are reviewed on an ongoing
basis Revisions to accounting estimates are recognized in the period in which the estimates
are revised and in any future periods affected.
8.2 Critical Judgments in Applying Accounting Policies
Critical judgments that we have made in the process of applying our accounting policies and
that have the most significant effect on the amounts recognized in the consolidated financial
statements is limited to our assessment of our ability to continue as a going concern (See
Note 2 (e) to our annual consolidated financial statements).
Our significant accounting policies are detailed in note 4 to our annual consolidated financial
statements for the year ended December 31, 2018.
8.3 Key Sources of Estimation Uncertainty
The following are key assumptions concerning the future and other key sources of
estimation uncertainty that have a significant risk of resulting in a material adjustment to
the reported amount of assets, liabilities, income and expenses within the next financial
year.
REVENUE RECOGNITION
Revenues are generated primarily from product sales, the license and sale of intellectual
property and fundamental knowledge, and the provision of engineering services and
technology transfer services. Product revenues are derived primarily from standard product
sales contracts and from long-term fixed price contracts. Intellectual property and
fundamental knowledge license revenues are derived primarily from standard licensing and
technology transfer agreements. Engineering service and technology transfer service
revenues are derived primarily from cost-plus reimbursable contracts and from long-term
fixed price contracts.
Revenue is recognized when a customer obtains control of the goods or services.
Determining the timing of the transfer of control, at a point in time or over time, requires
judgment.
D-48

On standard product sales contracts, revenues are recognized when customers obtain
control of the product, that is when transfer of title and risks and rewards of ownership of
goods have passed, and when obligation to pay is considered certain. Revenue is recognized
at that point in time. Provisions for warranties are made at the time of sale. Revenue
recognition for standard product sales contracts does not usually involve significant
estimates.
On standard licensing and technology transfer agreements, revenues are recognized on the
transfer of rights to a licensee, when it is determined to be distinct from other performance
obligations, and if the customer can direct the use of, and obtain substantially all of the
remaining benefits from the license as it exists at the time of transfer. In other cases, the
proceeds are considered to relate to the right to use the asset over the license period and
the revenue is recognized over that period. If it is determined that the license is not distinct
from other performance obligations, revenue is recognized over time as the customer
simultaneously receives and consumes the benefit. Revenue recognition for standard license
and sale agreements does not usually involve significant estimates.
On cost-plus reimbursable contracts, revenues are recognized as costs are incurred, and
include applicable fees earned as services are provided. Revenue recognition for cost-plus
reimbursable contracts does not usually involve significant estimates.
On long-term fixed price contracts, the customer controls all of the work in progress as the
services are being provided. This is because under these contracts, the deliverables are
made to a customer’s specification, and if a contract is terminated by the customer, then
the Company is entitled to reimbursement of the costs incurred to date plus the applicable
gross margin. Therefore, revenue from these contracts and the associated costs are
recognized as the costs are incurred over time.
On long-term fixed price contracts, revenues are recognized over time typically on a
percentage-of-completion basis, which consists of recognizing revenue for a performance
obligation on a given contract proportionately with its percentage of completion at any given
time. The percentage of completion is determined by dividing the cumulative costs incurred
as at the balance sheet date by the sum of incurred and anticipated costs for completing a
contract. The cumulative effect of changes to anticipated revenues and anticipated costs for
completing a contract are recognized in the period in which the revisions are identified. If
the anticipated costs exceed the anticipated revenues on a contract, such loss is recognized
in its entirety in the period it becomes known.
The determination of anticipated costs for completing a contract is based on estimates
that can be affected by a variety of factors such as variances in the timeline to
completion, the cost of materials, the availability and cost of labour, as well as
productivity.
The determination of potential revenues includes the contractually agreed amount and
may be adjusted based on the estimate of our attainment on achieving certain defined
contractual milestones. Management’s estimation is required in determining the amount
of consideration for which the Company is expected to be entitled and in determining
when a performance obligation has been met.
D-49

uncertainties that ultimately depend on the outcome of future events and are periodically
revised as projects progress. There is a risk that a customer may ultimately disagree with
our assessment of the progress achieved against milestones, or that our estimates of the
work required completing a contract may change.
During the three months and year ended December 31, 2018 and 2017, there was no
material adjustments to revenues relating to revenue recognized in a prior period.
ASSET IMPAIRMENT
The carrying amounts of our non-financial assets other than inventories are reviewed at
each reporting date to determine whether there is any indication of impairment. If any such
indication exists, then the asset’s recoverable amount is estimated. For goodwill and
intangible assets that have indefinite useful lives, the recoverable amount is estimated at
least annually.
The recoverable amount of an asset or cash-generating unit is the greater of its value in use
and its fair value less costs to sell. In assessing value in use, the estimated future cash
flows are discounted to their present value using a pre-tax discount rate that reflects
current market assessments of the time value of money and the risks specific to the asset.
In assessing fair value less costs to sell, the price that would be received on the sale of an
asset in an orderly transaction between market participants at the measurement date is
estimated. For the purposes of impairment testing, assets that cannot be tested individually
are grouped together into the smallest group of assets that generates cash inflows from
continuing use that are largely independent of the cash inflows of other groups of assets.
The allocation of goodwill to cash-generating units reflects the lowest level at which goodwill
is monitored for internal reporting purposes. Many of the factors used in assessing fair value
are outside the control of management and it is reasonably likely that assumptions and
estimates will change from period to period. These changes may result in future
impairments. For example, our revenue growth rate could be lower than projected due to
economic, industry or competitive factors, or the discount rate used in our value in use
model could increase due to a change in market interest rates. In addition, future goodwill
impairment charges may be necessary if our market capitalization decreased due to a
decline in the trading price of our common stock, which could negatively impact the fair
value of our business.
An impairment loss is recognized if the carrying amount of an asset or its cash-generating
unit exceeds its estimated recoverable amount. Impairment losses are recognized in net
loss. Impairment losses recognized in respect of the cash-generating units are allocated first
to reduce the carrying amount of any goodwill allocated to the units, and then to reduce the
carrying amounts of the other assets in the unit on a pro-rata basis.
An impairment loss in respect of goodwill is not reversed. In respect of other assets,
impairment losses recognized in prior periods are assessed at each reporting date for any
indications that the cumulative loss has decreased or no longer exists. An impairment loss is
reversed only to the extent that the asset’s carrying amount does not exceed the carrying
amount that would have been determined, net of depreciation or amortization, if no
impairment loss had been recognized.
Estimates used to determine revenues and costs of long-term fixed price contracts involve
D-50

events or changes in circumstances indicate that it might be impaired. Under IFRS, the
annual review of goodwill requires a comparison of the carrying value of the asset to the
higher of (i) value in use; and (ii) fair value less costs to sell. Value in use is defined as the
present value of future cash flows expected to be derived from the asset in its current state.
As of December 31, 2018, our consolidated goodwill balance of $40.3 million relates solely
to our Fuel Cell Products and Services segment. Based on the impairment test performed as
at December 31, 2018, we have concluded that no goodwill impairment charge is required
for the year ending December 31, 2018. Details of our 2018 goodwill impairment tests are
as follows:
One of the methods used to assess the recoverable amount of the goodwill is a fair
value, less costs to sale, test. Our fair value test is in effect a modified market
capitalization assessment, whereby we calculate the fair value of the Fuel Cell Products
and Services segment by first calculating the value of the Company at December 31,
2018 based on the average closing share price in the month of December, add a
reasonable estimated control premium to determine the Company’s enterprise value on
a controlling basis after adjusting for excess cash balances, and then deducting the
estimated costs to sell from this enterprise value to arrive at the fair value of the Fuel
Cell Products and Services segment. As a result of this assessment, we have determined
that the fair value of the Fuel Cell Products and Services segment exceeds its carrying
value as of December 31, 2018 indicating that no impairment charge is required for
2017.
In addition to this fair value test, we also performed a value in use test on our Fuel Cell
Products and Services segment that compared the carrying value of the segment to the
present value of future cash flows expected to be derived from the segment. The
principal factors used in this discounted cash flow analysis requiring significant
estimation are the projected results of operations, the discount rate based on the
weighted average cost of capital (“WACC”), and terminal value assumptions. Our value
in use test was based on a WACC of 10%; an average estimated compound annual
growth rate of approximately 23% from 2019 to 2023; a terminal year EBITDA
multiplied by a terminal value multiplier of 10; and a WACC of 8% and a terminal year
revenue multiple of 5 for Weichai Ballard JV. Our value in use assessment resulted in an
estimated fair value for the Fuel Cell Products and Services segment that is consistent
with that as determined under the above fair value, less costs to sell, assessment. As a
result of this assessment, we have determined that the fair value of the Fuel Cell
Products segment exceeds its carrying value by a significant amount as of December 31,
2018 indicating that no impairment charge is required in 2018.
In addition to the above goodwill impairment test, we perform a quarterly assessment of
the carrying amounts of our non-financial assets (other than inventories) to determine
whether there is any indication of impairment. During the year ended December 31, 2018,
we recorded a loss on sale of assets of ($4.0) million on the divestiture by Protonex of its
Power Manager assets to Revision on October 5, 2018 after estimating the amount of
variable consideration included in the transaction price that is constrained to be $2.0
million, as opposed to the maximum possible earn-out amount of $11.25 million. This
estimate of the ultimate transaction price, including the estimate of the amount of earn-out
We perform the annual review of goodwill as at December 31 of each year, more often if
D-51

variable consideration that is considered constrained of $2.0 million, will be reassessed each
quarter-end during 2019. During the year ended December 31, 2017, we recorded a loss on
sale of assets of ($0.9) million as the remaining estimated potential purchase price owing
from the 2016 CHEM Transaction was written down to its revised and final fair value of $0.9
million (which was collected in the fourth quarter of 2017) from its previous fair value
estimate of $1.8 million as of December 31, 2016. During the fourth quarter of 2017, we
also recognized a loss on sale of assets of ($0.5) million as we sold certain SOFC fuel cell
inventory to Upstart for nominal proceeds, and recorded impairment charges of ($1.5)
million consisting of a ($1.2) million impairment charge on intangible assets and a ($0.3)
million impairment charge on property, plant and equipment as we wrote-down certain
SOFC fuel cell assets to their estimated net realizable value of $0.05 million.
WARRANTY PROVISION
A provision for warranty costs is recorded on product sales at the time of shipment. In
establishing the accrued warranty liabilities, we estimate the likelihood that products sold
will experience warranty claims and the cost to resolve claims received.
In making such determinations, we use estimates based on the nature of the contract and
past and projected experience with the products. Should these estimates prove to be
incorrect, we may incur costs different from those provided for in our warranty provisions.
During the three months and year ended December 31, 2018, we recorded provisions to
accrued warranty liabilities of $2.1 million and $4.4 million, respectively, for new product
sales, compared to $1.6 million and $4.1 million, respectively, for the three months and
year ended December 31, 2017.
We review our warranty assumptions and make adjustments to accrued warranty liabilities
quarterly based on the latest information available and to reflect the expiry of contractual
obligations. Adjustments to accrued warranty liabilities are recorded in cost of product and
service revenues. As a result of these reviews and the resulting adjustments, our warranty
provision and cost of revenues for the three months and year ended December 31, 2018
were adjusted upwards by nil million and ($0.9) million, respectively, in each of the periods,
compared to an adjustment downwards by $0.7 million for the three months and year
ended December 31, 2017. The negative adjustments to the accrued warranty liability
provisions in 2018 were due primarily to increased Heavy-Duty Motive service costs,
whereas the positive adjustments to the accrued warranty liability provision in in 2017 were
due primarily to contractual expirations and improved lifetimes and reliability of our Heavy-
Duty Motive products.
INVENTORY PROVISION
In determining the lower of cost and net realizable value of our inventory and establishing
the appropriate provision for inventory obsolescence, we estimate the likelihood that
inventory carrying values will be affected by changes in market pricing or demand for our
products and by changes in technology or design which could make inventory on hand
obsolete or recoverable at less than cost. We perform regular reviews to assess the impact
of changes in technology and design, sales trends and other changes on the carrying value
of inventory. Where we determine that such changes have occurred and will have a
negative impact on the value of inventory on hand, appropriate provisions are made. If
D-52

there is a subsequent increase in the value of inventory on hand, reversals of previous
write-downs to net realizable value are made. Unforeseen changes in these factors could
result in additional inventory provisions, or reversals of previous provisions, being required.
During the three months and year ended December 31, 2018, net inventory adjustments of
($0.7) million and ($1.0) million, respectively, were recorded as a recovery (charge) to cost
of product and service revenues, compared to net inventory adjustments of ($0.1) million
and nil million, respectively, for the three months and year ended December 31, 2017.
FINANCIAL ASSETS INCLUDING IMPAIRMENT OF TRADE RECEIVABLES
A financial asset is classified as measured at: amortized cost; fair value through other
comprehensive income (“FVOCI”) or fair value through profit or loss (“FVTPL”). The
classification of financial assets is generally based on the business model in which a financial
asset is managed and its contractual cash flow characteristics. Derivatives embedded in
contracts where the host is a financial asset in the scope of the standard are never
separated. Instead, the hybrid financial instrument as a whole is assessed for classification.
The Company’s financial assets which consist primarily of cash and cash equivalents, trade
and other receivables, and contract assets, are classified at amortized cost.
An ‘expected credit loss’ (“ECL”) model applies to financial assets measured at amortized
cost and debt investments at FVOCI, but not to investments in equity instruments. The
Company’s financial assets measured at amortized cost and subject to the ECL model
consist primarily of trade receivables and contract assets.
In applying the ECL model, loss allowances are measured on either of the following bases:
12-month ECLs: these are ECLs that result from possible default events within the 12
months after the reporting date; and
Lifetime ECLs: these are ECLs that result from all possible default events over the
expected life of a financial instrument.
We have elected to measure loss allowances for trade receivables and contract assets at an
amount equal to lifetime ECLs.
When determining whether the credit risk of a financial asset has increased significantly
since initial recognition and when estimating ECLs, we consider reasonable and supportable
information that is relevant and available without undue cost or effort. This includes both
quantitative and qualitative information and analysis, based on our historical experience and
informed credit assessment and including forward-looking information.
ECLs are a probability-weighted estimate of credit losses. Credit losses are measured as the
present value of all cash shortfalls (i.e. the difference between the cash flows due to the
entity in accordance with the contract and the cash flows that we expect to receive). ECLs
are discounted at the effective interest rate of the financial asset. At each reporting date,
we assess whether financial assets carried at amortized cost are credit-impaired. A financial
asset is ‘credit-impaired’ when one or more events that have a detrimental impact on the
estimated future cash flows of the financial asset have occurred. Loss allowances for
financial assets measured at amortized cost are deducted from the gross carrying amount of
the assets. Impairment (losses) recoveries related to trade receivables and contract assets
are presented separately in the statement of profit or loss. During the three months and
D-53

year ended December 31, 2018 and 2017, nominal net impairment (charges) on trade
receivables and contract assets were recorded in other operating income.
EMPLOYEE FUTURE BENEFITS
The present value of our defined benefit obligation is determined by discounting the
estimated future cash outflows using interest rates of high-quality corporate bonds that
have terms to maturity approximating the terms of the related pension liability.
Determination of benefit expense requires assumptions such as the discount rate to
measure obligations, expected plan investment performance, expected healthcare cost
trend rate, and retirement ages of employees. Actual results will differ from the recorded
amounts based on these estimates and assumptions.
INCOME TAXES
We use the asset and liability method of accounting for income taxes. Under this method,
deferred income taxes are recognized for the deferred income tax consequences attributable
to differences between the financial statement carrying values of assets and liabilities and
their respective income tax bases (temporary differences) and for loss carry-forwards. The
resulting changes in the net deferred tax asset or liability are included in income.
Deferred tax assets and liabilities are measured using enacted, or substantively enacted, tax
rates expected to apply to taxable income in the years in which temporary differences are
expected to be recovered or settled. The effect on deferred income tax assets and liabilities,
of a change in tax rates, is included in income in the period that includes the substantive
enactment date. Deferred income tax assets are reviewed at each reporting period and are
reduced to the extent that it is no longer probable that the related tax benefit will be
realized. As of December 31, 2018 and 2017, we have not recorded any deferred income
tax assets on our consolidated statement of financial position.
8.4 Recently Adopted Accounting Policy Changes
Effective January 1, 2018, we have initially adopted IFRS 15 Revenue from Contracts with Customers and IFRS 9 Financial Instruments. The effect of initially applying these standards
did not have a material impact on the Company’s financial statements. A number of other
new standards are also effective from January 1, 2018 but they also did not have a material
impact on the Company’s financial statements.
IFRS 15 – REVENUE FROM CONTRACTS WITH CUSTOMERS
IFRS 15 Revenue from Contracts with Customers establishes a comprehensive framework
for determining whether, how much and when revenue is recognized. It replaced IAS 18 Revenue, IAS 11 Construction Contracts and related interpretations. The Company has
adopted IFRS 15 using the cumulative effect method (without practical expedients; with the
effect of initially applying this standard recognized at the date of initial application (i.e.
January 1, 2018). Accordingly, the information presented for 2017 has not been restated –
i.e. it is presented, as previously reported, under IAS 18, IAS 11 and related interpretations.
IFRS 15 contains a single model that applies to contracts with customers and two
approaches to recognizing revenue: at a point in time or over time. The model features a
contract-based five-step analysis of transactions to determine whether, how much, and
D-54

when revenue is recognized. New estimates and judgmental thresholds have been
introduced, which may affect the amount and/or timing of revenue recognized. The new
standard applies to contracts with customers. It does not apply to insurance contracts,
financial instruments or lease contracts, which fall in the scope of other IFRSs. The
clarifications to IFRS 15 provide additional guidance with respect to the five-step analysis,
transition, and the application of the Standard to licenses of intellectual property.
The adoption of IFRS 15 did not have a material impact on the Company’s financial
statements.
IFRS 9 – FINANCIAL INSTRUMENTS
IFRS 9 Financial Instruments sets out requirements for recognizing and measuring financial
assets, financial liabilities and some contracts to buy or sell non-financial items. This
standard replaces IAS 39 Financial Instruments: Recognition and Measurement.
Under IFRS 9, financial assets are classified and measured based on the business model in
which they are held and the characteristics of their contractual cash flows. The standard
introduces additional changes relating to financial liabilities. It also amends the impairment
model by introducing a new ‘expected credit loss’ model for calculating impairment.
IFRS 9 also includes a new general hedge accounting standard which aligns hedge
accounting more closely with risk management. This new standard does not fundamentally
change the types of hedging relationships or the requirement to measure and recognize
ineffectiveness; however it will provide more hedging strategies that are used for risk
management to qualify for hedge accounting and introduce more judgment to assess the
effectiveness of a hedging relationship. Special transitional requirements have been set for
the application of the new general hedging model.
The adoption of IFRS 9 did not have a material impact on the Company’s financial
statements.
8.5 Future Accounting Policy Changes The following is an overview of accounting standard changes that we will be required to
adopt in future years. We do not expect to adopt any of these standards before their
effective dates and we continue to evaluate the impact of these standards on our
consolidated financial statements.
IFRS 16 – LEASES
On January 13, 2016, the IASB issued IFRS 16 Leases. IFRS 16 introduces a single lessee
accounting model and requires a lessee to recognize assets and liabilities for all leases with
a term of more than 12 months, unless the underlying asset is of low value. A lessee is
required to recognize a right-of-use asset representing its right to use the underlying asset
and a lease liability representing its obligation to make lease payments. This standard
substantially carries forward the lessor accounting requirements of IAS 17, while requiring
enhanced disclosures to be provided by lessors. Other areas of the lease accounting model
have been impacted, including the definition of a lease. Transitional provisions have been
provided.
D-55

The new standard is effective for annual periods beginning on or after January 1, 2019.
IFRS 16 will replace IAS 17 Leases and the related interpretations.
The most significant effect of the new standard will be the lessee’s recognition of the initial
present value of unavoidable future lease payments as right-of-use lease assets and lease
liabilities on the statement of financial position, including those for most leases that would
currently be accounted for as operating leases. Both leases with durations of 12 months or
less and leases for low-value assets may be exempted.
The presentation on the statement of income and other comprehensive income required by
the new standard will result in the presentation of most lease expenses as depreciation of
right-of-use lease assets and financing costs arising from lease liabilities, rather than as a
part of operating expenses; reported results from operating activities would thus be higher
under the new standard. Relative to the results of applying the current standard, although
actual cash flows will be unaffected, the lessee’s statement of cash flows will reflect
increases in cash flows from operating activities offset equally by decreases in cash flows
from financing activities. This is the result of the presentation of the payments of the
“principal” component of leases that would currently be accounted for as operating leases as
a cash flow use within financing activities under the new standard.
The Company will adopt IFRS 16 in its financial statements for the fiscal year beginning on
January 1, 2019. The Company intends to apply the modified retrospective approach and
will not restate comparative amounts for the year prior to first adoption. Right-of-use assets
will be measured on transition at the amount of the lease liability on adoption (adjusted for
any prepaid or accrued lease expenses). As a transitional practical expedient permitted by
the new standard, the Company will not reassess whether contracts are, or contain, leases
as at January 1, 2019, that were previously identified as leases applying IAS 17 Leases, and
IFRIC 4 Determining whether an Arrangement contains a Lease. Only contracts entered into
(or changed) after January 1, 2019, will be assessed for being, or containing, leases
applying the criteria of the new standard. The Company also intends to apply the practical
expedient for leases that have duration of 12 months or less.
Based on the analysis completed to date of the Company’s leasing arrangements open as of
December 31, 2018, on adoption of the new standard on January 1, 2019 the Company
expects to recognize, right-of-use assets of between approximately $9 million to $11
million, net of lease incentives (primarily deferred lease inducements) of approximately $2
million, and lease liabilities of between approximately $13 million to $15 million.
IFRIC 23 – UNCERTAINTY OVER INCOME TAX TREATMENTS
On June 7, 2017, the IASB issued IFRIC Interpretation 23 Uncertainty over Income Tax Treatments. The Interpretation provides guidance on the accounting for current and
deferred tax liabilities and assets in circumstances in which there is uncertainty over income
tax treatments. The Interpretation requires:
An entity to contemplate whether uncertain tax treatments should be considered
separately, or together as a group, based on which approach provides better predictions
of the resolution;
An entity to determine if it is probable that the tax authorities will accept the uncertain
tax treatment; and
D-56

If it is not probable that the uncertain tax treatment will be accepted, measure the tax
uncertainty based on the most likely amount of expected value, depending on whichever
method better predicts the resolution of the uncertainty.
The Interpretation is applicable for annual periods beginning on or after January 1, 2019.
The Company will adopt the Interpretation in its financial statements for the fiscal year
beginning on January 1, 2019. Based on an analysis of the Company’s historic tax filing
positions as of January 1, 2019, the Company does not expect the Interpretation to have a
material impact on the financial statements.
AMENDMENTS TO REFERENCES TO THE CONCEPTUAL FRAMEWORK IN IFRS STANDARDS
On March 29, 2018 the IASB issued a revised version of its Conceptual Framework for Financial Reporting (“the Framework”) that underpins IFRS Standards. The IASB also issued
Amendments to References to the Conceptual Framework in IFRS Standards (“the Amendments”) to update references in IFRS Standards to previous versions of the
Conceptual Framework.
Some Standards include references to the 1989 and 2010 versions of the Framework. The
IASB has published a separate document which contains consequential amendments to
affected Standards so that they refer to the new Framework, with the exception of IFRS 3
Business Combinations which continues to refer to both the 1989 and 2010 Frameworks.
Both documents are effective from January 1, 2020 with earlier application permitted. The
Company does not intend to adopt the Amendments in its financial statements before the
annual period beginning on January 1, 2020. The extent of the impact of the change has not
yet been determined.
DEFINITION OF A BUSINESS (AMENDMENTS TO IFRS 3)
On October 22, 2018 the IASB issued amendments to IFRS 3 Business Combinations, that
seek to clarify whether a transaction results in an asset or a business combination.
The amendments include an election to use a concentration test. This is a simplified
assessment that results in an asset acquisition if substantially all of the fair value of the
gross assets is concentrated in a single identifiable asset or a group of similar identifiable
assets. If a preparer chooses not to apply the concentration test, or the test is failed, then
the assessment focuses on the existence of a substantive process.
The amendments apply to businesses acquired in annual reporting periods beginning on or
after January 1, 2020 with earlier adoption permitted. The Company does not intend to
adopt the amendments in its financial statements before the annual reporting period
beginning on January 1, 2020. The extent of the impact of adoption of the amendments has
not yet been determined.
DEFINITION OF MATERIAL (AMENDMENTS TO IAS 1 and IAS 8)
On October 31, 2018 the IASB refined its definition of material and removed the definition
of material omissions or misstatements from IAS 8.
The definition of material has been aligned across IFRS Standards and the Conceptual Framework for Financial Reporting. The amendments provide a definition and explanatory
paragraphs in one place. Pursuant to the amendments, information is material if omitting,
D-57
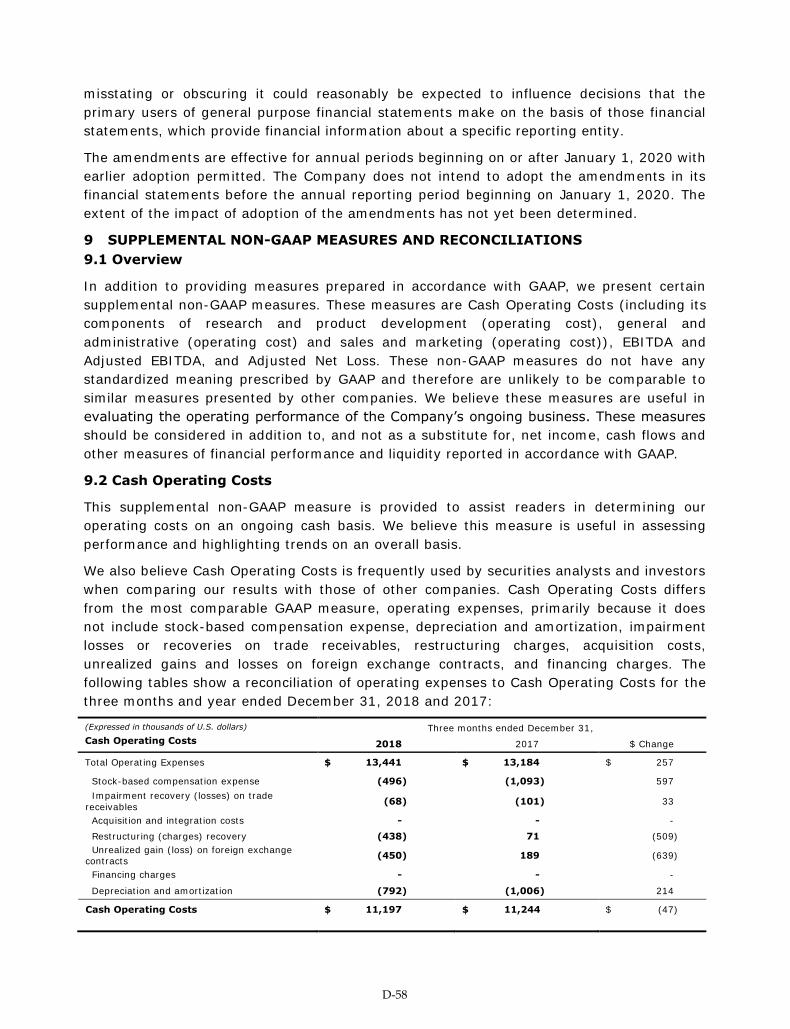
misstating or obscuring it could reasonably be expected to influence decisions that the
primary users of general purpose financial statements make on the basis of those financial
statements, which provide financial information about a specific reporting entity.
The amendments are effective for annual periods beginning on or after January 1, 2020 with
earlier adoption permitted. The Company does not intend to adopt the amendments in its
financial statements before the annual reporting period beginning on January 1, 2020. The
extent of the impact of adoption of the amendments has not yet been determined.
9 SUPPLEMENTAL NON-GAAP MEASURES AND RECONCILIATIONS 9.1 Overview
In addition to providing measures prepared in accordance with GAAP, we present certain
supplemental non-GAAP measures. These measures are Cash Operating Costs (including its
components of research and product development (operating cost), general and
administrative (operating cost) and sales and marketing (operating cost)), EBITDA and
Adjusted EBITDA, and Adjusted Net Loss. These non-GAAP measures do not have any
standardized meaning prescribed by GAAP and therefore are unlikely to be comparable to
similar measures presented by other companies. We believe these measures are useful in
evaluating the operating performance of the Company’s ongoing business. These measures
should be considered in addition to, and not as a substitute for, net income, cash flows and
other measures of financial performance and liquidity reported in accordance with GAAP.
9.2 Cash Operating Costs
This supplemental non-GAAP measure is provided to assist readers in determining our
operating costs on an ongoing cash basis. We believe this measure is useful in assessing
performance and highlighting trends on an overall basis.
We also believe Cash Operating Costs is frequently used by securities analysts and investors
when comparing our results with those of other companies. Cash Operating Costs differs
from the most comparable GAAP measure, operating expenses, primarily because it does
not include stock-based compensation expense, depreciation and amortization, impairment
losses or recoveries on trade receivables, restructuring charges, acquisition costs,
unrealized gains and losses on foreign exchange contracts, and financing charges. The
following tables show a reconciliation of operating expenses to Cash Operating Costs for the
three months and year ended December 31, 2018 and 2017:
(Expressed in thousands of U.S. dollars) Three months ended December 31,
Cash Operating Costs 2018 2017 $ Change
Total Operating Expenses $ 13,441 $ 13,184 $ 257
Stock-based compensation expense (496) (1,093) 597
Impairment recovery (losses) on trade
receivables (68) (101) 33
Acquisition and integration costs - - -
Restructuring (charges) recovery (438) 71 (509)
Unrealized gain (loss) on foreign exchange contracts
(450) 189 (639)
Financing charges - - -
Depreciation and amortization (792) (1,006) 214
Cash Operating Costs $ 11,197 $ 11,244 $ (47)
D-58

(Expressed in thousands of U.S. dollars) Year ended December 31,
Cash Operating Costs 2018 2017 $ Change
Total Operating Expenses $ 50,472 $ 46,477 $ 3,995
Stock-based compensation expense (2,902) (3,125) 222
Impairment recovery (losses) on trade receivables
(98) (103) 5
Acquisition and integration costs - - -
Restructuring (charges) recovery (507) (799) 292
Unrealized gain (loss) on foreign exchange
contracts (570) 189 (759)
Financing charges - - -
Depreciation and amortization (3,413) (3,586) 174
Cash Operating Costs $ 42,982 $ 39,053 $ 3,929
The components of Cash Operating Costs of research and product development (cash
operating cost), general and administrative (cash operating cost), and sales and marketing
(cash operating cost) differ from their respective most comparable GAAP measure of
research and product development expense, general and administrative expense, and sales
and marketing expense, primarily because they do not include stock-based compensation
expense and depreciation and amortization expense. A reconciliation of these respective
operating expenses to the respective components of Cash Operating Costs for the three
month and year ended December 31, 2018 and 2017 is included in Operating Expense and
Other Items.
A breakdown of total stock-based compensation expense for the three months and year
ended December 31, 2018 and 2017 are as follows:
(Expressed in thousands of U.S. dollars) Three months ended December 31,
Stock-based compensation expense 2018 2017 $ Change
Total stock-based compensation expense
recorded as follows:
Cost of goods sold $ - $ - $ -
Research and product development expense 215 403 (188)
General and administrative expense 213 516 (303)
Sales and marketing expense (recovery) 68 174 (106)
Stock-based compensation expense $ 496 $ 1,093 $ (597)
(Expressed in thousands of U.S. dollars) Year ended December 31,
Stock-based compensation expense 2018 2017 $ Change
Total stock-based compensation expense
recorded as follows:
Cost of goods sold $ - $ - $ -
Research and product development expense 1,126 1,124 2
General and administrative expense 1,231 1,524 (293)
Sales and marketing expense (recovery) 545 477 68
Stock-based compensation expense $ 2,902 $ 3,125 $ (223)
D-59

A breakdown of total depreciation and amortization expense for the three months and year
ended December 31, 2018 and 2017 are as follows:
(Expressed in thousands of U.S. dollars) Three months ended December 31,
Depreciation and amortization expense 2018 2017 $ Change
Total depreciation and amortization expense
recorded as follows:
Cost of goods sold $ 386 $ 474 $ (88)
Research and product development expense 490 654 (164)
General and administrative expense 302 352 (50)
Sales and marketing expense - 1 (1)
Depreciation and amortization expense $ 1,178 $ 1,481 $ (303)
(Expressed in thousands of U.S. dollars) Year ended December 31,
Depreciation and amortization expense 2018 2017 $ Change
Total depreciation and amortization expense
recorded as follows:
Cost of goods sold $ 1,603 $ 1,477 $ 126
Research and product development expense 2,158 2,566 (408)
General and administrative expense 1,254 1,019 235
Sales and marketing expense - 1 (1)
Depreciation and amortization expense $ 5,015 $ 5,064 $ (48)
9.3 EBITDA and Adjusted EBITDA These supplemental non-GAAP measures are provided to assist readers in determining our
operating performance. We believe this measure is useful in assessing performance and
highlighting trends on an overall basis. We also believe EBITDA and Adjusted EBITDA are
frequently used by securities analysts and investors when comparing our results with those
of other companies. EBITDA differs from the most comparable GAAP measure, net loss,
primarily because it does not include finance expense, income taxes, depreciation of
property, plant and equipment, and amortization of intangible assets. Adjusted EBITDA
adjusts EBITDA for stock-based compensation expense, transactional gains and losses,
asset impairment charges, finance and other income, unrealized gains and losses on foreign
exchange contracts, and acquisition costs. The following tables show a reconciliation of net
loss to EBITDA and Adjusted EBITDA for the three months and year ended December 31,
2018 and 2017:
D-60

(Expressed in thousands of U.S. dollars) Three months ended December 31,
EBITDA and Adjusted EBITDA 2018 2017 $ Change
Net income (loss) $ (11,475) $ (2,887) $ (8,588)
Depreciation and amortization 1,178 1,481 (303)
Finance expense 121 168 (47)
Income taxes 68 210 (142)
EBITDA $ (10,108) $ (1,028) $ (9,080)
Stock-based compensation expense 496 1,093 (597)
Acquisition and integration costs - - -
Finance and other (income) loss 13 226 (213)
Impairment charges on intangible assets and
property, plant and equipment - 1,484 (1,484)
Loss (gain) on sale of assets 3,955 500 3,455
Unrealized loss (gain) on foreign exchange
contracts 450 (189) 639
Adjusted EBITDA $ (5,194) $ 2,086 $ (7,280)
(Expressed in thousands of U.S. dollars) Year ended December 31,
EBITDA and Adjusted EBITDA 2018 2017 $ Change
Net income (loss) $ (27,323) $ (8,048) $ (19,275)
Depreciation and amortization 5,015 5,064 (49)
Finance expense 503 732 (229)
Income taxes 370 1,571 (1,201)
EBITDA $ (21,435) $ (681) $ (20,754)
Stock-based compensation expense 2,902 3,125 (223)
Acquisition and integration costs - - -
Finance and other (income) loss 449 (1,780) 2,229
Impairment charges on intangible assets and property, plant and equipment
- 1,484 (1,484)
Loss (gain) on sale of assets 4,049 1,365 2,684
Unrealized loss (gain) on foreign exchange
contracts 570 (189) 759
Adjusted EBITDA $ (13,465) $ 3,324 $ (16,789)
9.4 Adjusted Net Loss This supplemental non-GAAP measure is provided to assist readers in determining our
financial performance. We believe this measure is useful in assessing our actual
performance by adjusting our results from continuing operations for transactional gains and
losses and impairment losses. Adjusted Net Loss differs from the most comparable GAAP
measure, net loss, primarily because it does not include transactional gains and losses,
asset impairment charges, and acquisition costs. The following table shows a reconciliation
of net loss to Adjusted Net Loss for the three months and year ended December 31, 2018
and 2017:
D-61

(Expressed in thousands of U.S. dollars) Three months ended December 31,
Adjusted Net Loss 2018 2017 $ Change
Net (loss) $ (11,475) $ (2,887) $ (8,588)
Acquisition and integration costs - - -
Impairment charges (recovery) on intangible assets and property, plant and equipment
- 1,484 (1,484)
Loss on sale of assets 3,957 500 3,457
Adjusted Net Loss $ (7,518) $ (903) $ (6,615)
Adjusted Net Loss per share $ (0.04) $ (0.01) $ (0.03)
(Expressed in thousands of U.S. dollars) Year ended December 31,
Adjusted Net Loss 2018 2017 $ Change
Net (loss) $ (27,323) $ (8,048) $ (19,275)
Acquisition and integration costs - - -
Impairment charges (recovery) on intangible assets and property, plant and equipment
- 1,484 (1,484)
Loss on sale of assets 3,957 1,374 2,583
Adjusted Net Loss $ (23,366) $ (5,190) $ (18,176)
Adjusted Net Loss per share $ (0.13) $ (0.03) $ (0.10)
D-62

Consolidated Financial Statements(Expressed in U.S. dollars)
BALLARD POWER SYSTEMS INC.
Years ended December 31, 2018 and 2017
D-63

MANAGEMENT’S REPORTManagement’s Responsibility for the Financial Statements and Report on Internal Control over FinancialReporting
The consolidated financial statements contained in this Annual Report have been prepared by management inaccordance with International Financial Reporting Standards (“IFRS”) as issued by the International AccountingStandards Board. The integrity and objectivity of the data in these consolidated financial statements are management’sresponsibility. Management is also responsible for all other information in the Annual Report and for ensuring that thisinformation is consistent, where appropriate, with the information and data contained in the consolidated financialstatements.
Management is responsible for establishing and maintaining adequate internal control over financial reporting. Internalcontrol over financial reporting is a process designed to provide reasonable assurance regarding the reliability offinancial reporting and the preparation of consolidated financial statements for external reporting purposes inaccordance with IFRS. Internal control over financial reporting may not prevent or detect fraud or misstatementsbecause of limitations inherent in any system of internal control. Management has assessed the effectiveness of theCorporation’s internal control over financial reporting based on the framework in Internal Control – Integrated Framework(2013) issued by the Committee of Sponsoring Organizations of the Treadway Commission, and concluded that theCorporation’s internal control over financial reporting was effective as of December 31, 2018. In addition, managementmaintains disclosure controls and procedures to provide reasonable assurance that material information iscommunicated to management and appropriately disclosed. Some of the assets and liabilities include amounts, whichare based on estimates and judgments, as their final determination is dependent on future events.
The Board of Directors oversees management’s responsibilities for financial reporting through the Audit Committee,which consists of eight directors who are independent and not involved in the daily operations of the Corporation. TheAudit Committee meets on a regular basis with management and the external and internal auditors to discuss internalcontrols over the financial reporting process, auditing matters and financial reporting issues. The Audit Committee isresponsible for appointing the external auditors (subject to shareholder approval), and reviewing and approving allfinancial disclosure contained in our public documents and related party transactions.
The external auditors, KPMG LLP, have audited the financial statements and expressed an unqualified opinion thereon.KPMG has also expressed an unqualified opinion on the effective operation of the internal controls over financialreporting as of December 31, 2018. The external auditors have full access to management and the Audit Committeewith respect to their findings concerning the fairness of financial reporting and the adequacy of internal controls.
“RANDALL MACEWEN” “TONY GUGLIELMIN”
RANDALL MACEWEN TONY GUGLIELMINPresident and Vice President andChief Executive Officer Chief Financial OfficerMarch 6, 2019 March 6, 2019
D-64

Report of Independent Registered Public Accounting Firm
To the Shareholders and Board of Directors BallardPower Systems Inc.
Opinion on the Consolidated Financial Statements
We have audited the accompanying consolidated balance sheets of Ballard Power Systems, Inc. (the Company)as of December 31, 2018 and 2017, the related consolidated statements of loss, comprehensive loss, changes inequity, and cash flows for each of the years in the three-year period ended December 31, 2018, and the relatednotes collectively, the consolidated financial statements. In our opinion, the consolidated financial statementspresent fairly, in all material respects, the financial position of the Company as of December 31, 2018 and 2017,and the results of its operations and its cash flows for each of the years in the two-year period ended December31, 2018, in conformity with U.S. generally accepted accounting principles.
We also have audited, in accordance with the standards of the Public Company Accounting Oversight Board(United States) (PCAOB), the Company’s internal control over financial reporting as of December 31, 2018,based on criteria established in Internal Control - Integrated Framework (2013) issued by the Committee ofSponsoring Organizations of the Treadway Commission, and our report dated March 6, 2018 expressed anunqualified opinion on the effectiveness of the Company’s internal control over financial reporting.
Change in Accounting Principle
As discussed in Note 3 to the consolidated financial statements, the Company has changed its accounting policiesfor revenue recognition and financial instruments in 2018 due to the adoption of IFRS 15 - Revenue fromContracts with Customers and IFRS 9 - Financial Instruments.
Basis for Opinion
These consolidated financial statements are the responsibility of the Company’s management. Ourresponsibility is to express an opinion on these consolidated financial statements based on our audits. We are apublic accounting firm registered with the PCAOB and are required to be independent with respect to theCompany in accordance with the U.S. federal securities laws and the applicable rules and regulations of theSecurities and Exchange Commission and the PCAOB.
KPMG LLP is a Canadian limited liability partnership and a member firm of the KPMG network of independent member firms affiliated withKPMG International Cooperative (“KPMG International”), a Swiss entity. KPMG Canada provides services to KPMG LLP.
KPMG LLPChartered Professional AccountantsPO Box 10426 777 Dunsmuir StreetVancouver BC V7Y 1K23Canada
Telephone (604) 691-3000Fax (604) 691-3031Internet www.kpmg.ca
D-65

We conducted our audits in accordance with the standards of the PCAOB. Those standards require that we planand perform the audit to obtain reasonable assurance about whether the consolidated financial statements arefree of material misstatement, whether due to error or fraud. Our audits included performing procedures toassess the risks of material misstatement of the consolidated financial statements, whether due to error or fraud,and performing procedures that respond to those risks. Such procedures included examining, on a test basis,evidence regarding the amounts and disclosures in the consolidated financial statements. Our audits alsoincluded evaluating the accounting principles used and significant estimates made by management, as well asevaluating the overall presentation of the consolidated financial statements. We believe that our audits provide areasonable basis for our opinion.
We have served as the Company's auditor since 1999.
//s// KPMG LLP
Chartered Professional Accountants
Vancouver, CanadaMarch 6, 2019
KPMG LLP is a Canadian limited liability partnership and a member firm of the KPMG network of independent member firms affiliated withKPMG International Cooperative (“KPMG International”), a Swiss entity. KPMG Canada provides services to KPMG LLP.
KPMG LLPChartered Professional AccountantsPO Box 10426 777 Dunsmuir StreetVancouver BC V7Y 1K23Canada
Telephone (604) 691-3000Fax (604) 691-3031Internet www.kpmg.ca
D-66

Report of Independent Registered Public Accounting Firm
To the Shareholders and Board of Directors BallardPower Systems Inc.
Opinion on Internal Control Over Financial Reporting
We have audited Ballard Power Systems Inc.’s (the Company) internal control over financial reporting as ofDecember 31, 2018, based on criteria established in Internal Control - Integrated Framework (2013) issued bythe Committee of Sponsoring Organizations of the Treadway Commission. In our opinion, the Companymaintained, in all material respects, effective internal control over financial reporting as of December 31, 2018,based on criteria established in Internal Control - Integrated Framework (2013) issued by the Committee ofSponsoring Organizations of the Treadway Commission.
We also have audited, in accordance with the standards of the Public Company Accounting Oversight Board(United States) (PCAOB), the consolidated balance sheets of the Company as of December 31, 2018 and 2017,the related consolidated statements of loss, comprehensive loss, changes in equity, and cash flows for each ofthe years in the two-year period ended December 31, 2018 and the related notes (collectively, the consolidatedfinancial statements), and our report dated March 6, 2018 expressed an unqualified opinion on thoseconsolidated financial statements.
Basis for Opinion
The Company’s management is responsible for maintaining effective internal control over financial reporting andfor its assessment of the effectiveness of internal control over financial reporting, included in the accompanying“Management’s Responsibility for the Financial Statements and Report on Internal Control over FinancialReporting”. Our responsibility is to express an opinion on the Company’s internal control over financial reportingbased on our audit. We are a public accounting firm registered with the PCAOB and are required to beindependent with respect to the Company in accordance with the U.S. federal securities laws and the applicablerules and regulations of the Securities and Exchange Commission and the PCAOB.
We conducted our audit in accordance with the standards of the PCAOB. Those standards require that we planand perform the audit to obtain reasonable assurance about whether effective internal control over financialreporting was maintained in all material respects. Our audit of internal control over financial reporting includedobtaining an understanding of internal control over financial reporting, assessing the risk that a materialweakness exists, and testing and evaluating the design and operating effectiveness of internal control based onthe assessed risk. Our audit also included performing such other procedures as we considered necessary in thecircumstances. We believe that our audit provides a reasonable basis for our opinion.
KPMG LLP is a Canadian limited liability partnership and a member firm of the KPMG network of independent member firms affiliated withKPMG International Cooperative (“KPMG International”), a Swiss entity. KPMG Canada provides services to KPMG LLP.
KPMG LLPChartered Professional AccountantsPO Box 10426 777 Dunsmuir StreetVancouver BC V7Y 1K23Canada
Telephone (604) 691-3000Fax (604) 691-3031Internet www.kpmg.ca
D-67

Definition and Limitations of Internal Control Over Financial Reporting
A company’s internal control over financial reporting is a process designed to provide reasonable assuranceregarding the reliability of financial reporting and the preparation of financial statements for external purposes inaccordance with generally accepted accounting principles. A company’s internal control over financial reportingincludes those policies and procedures that (1) pertain to the maintenance of records that, in reasonable detail,accurately and fairly reflect the transactions and dispositions of the assets of the company; (2) providereasonable assurance that transactions are recorded as necessary to permit preparation of financial statementsin accordance with generally accepted accounting principles, and that receipts and expenditures of the companyare being made only in accordance with authorizations of management and directors of the company; and(3) provide reasonable assurance regarding prevention or timely detection of unauthorized acquisition, use,or disposition of the company’s assets that could have a material effect on the financial statements.
Because of its inherent limitations, internal control over financial reporting may not prevent or detectmisstatements. Also, projections of any evaluation of effectiveness to future periods are subject to the risk thatcontrols may become inadequate because of changes in conditions, or that the degree of compliance with thepolicies or procedures may deteriorate.
//s// KPMG LLP
Chartered Professional Accountants
Vancouver, CanadaMarch 6, 2019
KPMG LLP is a Canadian limited liability partnership and a member firm of the KPMG network of independent member firms affiliated withKPMG International Cooperative (“KPMG International”), a Swiss entity. KPMG Canada provides services to KPMG LLP.
KPMG LLPChartered Professional AccountantsPO Box 10426 777 Dunsmuir StreetVancouver BC V7Y 1K23Canada
Telephone (604) 691-3000Fax (604) 691-3031Internet www.kpmg.ca
D-68

BALLARD POWER SYSTEMS INC.Consolidated Statement of Financial Position(Expressed in thousands of U.S. dollars)
NoteDecember 31,
2018December 31,
2017
Assets
Current assets:Cash and cash equivalents $ 192,235 $ 60,255Trade and other receivables 7 38,524 23,080Inventories 8 29,311 17,292Prepaid expenses and other current assets 1,523 2,175
Total current assets 261,593 102,802
Non-current assets:Property, plant and equipment 9 21,620 15,314Intangible assets 10 8,285 17,950Goodwill 11 40,287 40,562Investments 12 13,994 681Other non-current assets 321 348
Total assets $ 346,100 $ 177,657
Liabilities and Equity
Current liabilities:Trade and other payables 14 $ 21,154 $ 25,243Deferred revenue 15 16,681 8,082Provisions and other current liabilities 16 9,243 5,447Finance lease liability 17 631 652
Total current liabilities 47,709 39,424
Non-current liabilities:Finance lease liability 17 5,064 6,229Deferred gain on finance lease liability 17 2,566 2,982Provisions and other non-current liabilities 16 3,862 4,253Employee future benefits 19 4,299 4,914
Total liabilities 63,500 57,802
Equity:Share capital 20 1,174,889 986,497Contributed surplus 20 291,260 290,536Accumulated deficit (1,184,400) (1,157,382)Foreign currency reserve 851 204Total equity 282,600 119,855
Total liabilities and equity $ 346,100 $ 177,657
See accompanying notes to consolidated financial statements.
Approved on behalf of the Board:
“Doug Hayhurst” “Jim Roche”Director Director
D-69

BALLARD POWER SYSTEMS INC.Consolidated Statement of Loss and Comprehensive Income (Loss)For the year ended December 31(Expressed in thousands of U.S. dollars, except per share amounts and number of shares)
Note 2018 2017Revenues:Product and service revenues 23 $ 96,586 $ 121,288Cost of product and service revenues 66,912 79,688Gross margin 29,674 41,600
Operating expenses:Research and product development 27,039 25,022General and administrative 14,760 12,602Sales and marketing 8,068 7,951Other expense 25 605 902
Total operating expenses 50,472 46,477
Results from operating activities (20,798) (4,877)Finance income (loss) and other 26 (449) 1,780Finance expense 26 (503) (732)
Net finance income (loss) (952) 1,048Loss on sale of assets 27 (4,049) (1,365)Equity in earnings (loss) of investment in joint venture and associates 12 & 30 (1,154) 201Impairment charges on intangible assets and property, plant and equipment 28 — (1,484)Loss before income taxes (26,953) (6,477)Income tax expense 29 (370) (1,571)Net loss (27,323) (8,048)
Other comprehensive income (loss):
Items that will not be reclassified to profit or loss:Actuarial gain (loss) on defined benefit plans 19 305 (206)
305 (206)Items that may be reclassified subsequently to profit or loss:Foreign currency translation differences 647 (1,139)
647 (1,139)Other comprehensive income (loss), net of tax 952 (1,345)Total comprehensive loss $ (26,371) $ (9,393)
Basic and diluted loss per shareLoss per share $ (0.15) $ (0.05)
Weighted average number of common shares outstanding 185,836,596 176,270,305
See accompanying notes to consolidated financial statements.
D-70

BALLARD POWER SYSTEMS INC.Consolidated Statement of Changes in Equity(Expressed in thousands of U.S. dollars except per share amounts and number of shares)
BallardPower
SystemsBallard Power Systems Inc. Equity Europe A/S
Number ofshares
Sharecapital
Contributedsurplus
Accumulateddeficit
Foreigncurrencyreserve
Non-controlling
interestsTotal
equity
Balance, December 31, 2016 174,749,630 $ 977,707 $ 295,547 $ (1,149,128) $ 718 $ (3,301) $ 121,543Net loss — — — (8,048) — — (8,048)Non dilutive financing — — 12 — — — 12DSUs redeemed (note 20) 181,788 297 (737) — — — (440)RSUs redeemed (note 20) 298,556 706 (1,421) — — — (715)Options exercised (note 20) 1,820,193 5,762 (2,164) — — — 3,598Warrants exercised (note 20) 1,012,500 2,025 — — — — 2,025Share-based compensation (note 20) — — 2,745 — — — 2,745Ballard Power Systems Europe (NCI)adjustment for change in ownership(note 18) — — (3,446) — 625 3,301 480Other comprehensive loss:
Defined benefit plan actuarial loss — — — (206) — — (206)Foreign currency translation forforeign operations (1,139) (1,139)
Balance, December 31, 2017 178,062,667 $ 986,497 $ 290,536 $ (1,157,382) $ 204 $ — $ 119,855Net loss — — — (27,323) — — (27,323)Private placement (note 20) 51,831,659 183,672 — — — — 183,672DSUs redeemed (note 20) 154,752 356 (792) — — — (436)RSUs redeemed (note 20) 149,980 338 (802) — — — (464)Options exercised (note 20) 945,022 2,592 (964) — — — 1,628Warrants exercised (note 20) 747,563 1,434 — — — 1,434Share-based compensation (note 20) — — 3,282 — — — 3,282Other comprehensive income:
Defined benefit plan actuarial gain — — — 305 — — 305Foreign currency translation forforeign operations — — — — 647 — 647
Balance, December 31, 2018 231,891,643 $ 1,174,889 $ 291,260 $ (1,184,400) $ 851 $ — $ 282,600
See accompanying notes to consolidated financial statements.
D-71

BALLARD POWER SYSTEMS INC.Consolidated Statement of Cash FlowsFor the year ended December 31(Expressed in thousands of U.S. dollars)
Note 2018 2017
Cash provided by (used in):Operating activities:Net loss for the year $ (27,323) $ (8,048)Adjustments for:
Share-based compensation 20 2,902 3,125Employee future benefits 226 201Employee future benefits plan contributions (536) (660)Depreciation and amortization 5,015 5,064Loss (gain) on decommissioning liabilities (85) 390Amortization of deferred lease inducement (476) —Loss on sale of assets 27 4,049 1,365Impairment charges on intangible assets and property, plant and equipment 28 — 1,484Impairment loss on trade receivables 25 98 103Unrealized loss (gain) on forward exchange contracts 570 (324)Equity in (earnings) loss of investment in joint venture and associates 12 & 30 1,154 (201)
(14,406) 2,499Changes in non-cash working capital:
Trade and other receivables (11,702) (9,387)Inventories (12,932) (572)Prepaid expenses and other current assets 426 930Trade and other payables (5,573) 6,857Deferred revenue 8,607 (12,539)Warranty provision 3,892 2,444
(17,282) (12,267)Cash used in operating activities (31,688) (9,768)Investing activities:Additions to property, plant and equipment 9 (9,854) (3,068)Net proceeds on sale of property, plant and equipment and other 27 1,345 981Additions to intangible assets 10 — (3,376)Investment in joint venture and associates 12 (14,606) (972)Purchase of non-controlling interest in subsidiary 18 — (47)Cash used in investing activities (23,115) (6,482)Financing activities:Net payment of finance lease liabilities (598) (607)Net proceeds on issuance of share capital from share option exercises 20 1,628 3,598Net proceeds on issuance of share capital from warrant exercises 20 1,434 2,025Net proceeds on issuance of share capital from private placement 20 183,672 —Cash provided by financing activities 186,136 5,016Effect of exchange rate fluctuations on cash and cash equivalents held 647 (1,139)Increase (decrease) in cash and cash equivalents 131,980 (12,373)Cash and cash equivalents, beginning of year 60,255 72,628Cash and cash equivalents, end of year $ 192,235 $ 60,255
Supplemental disclosure of cash flow information (note 31).
See accompanying notes to consolidated financial statements.
D-72

BALLARD POWER SYSTEMS INC.Notes to Consolidated Financial StatementsYears ended December 31, 2018, and 2017(Tabular amounts expressed in thousands of U.S. dollars, except per share amounts and numbers of shares)
1. Reporting entity:
The principal business of Ballard Power Systems Inc. (the “Corporation”) is the design, development, manufacture,sale and service of proton exchange membrane (“PEM”) fuel cell products for a variety of applications, focusingon the power product markets of Heavy-Duty Motive (consisting of bus, truck, rail and marine applications), PortablePower / UAV, Material Handling and Backup Power, as well as the delivery of Technology Solutions, includingengineering services, technology transfer and the license and sale of the Corporation’s extensive intellectualproperty portfolio and fundamental knowledge for a variety of fuel cell applications. A fuel cell is an environmentallyclean electrochemical device that combines hydrogen fuel with oxygen (from the air) to produce electricity.
The Corporation is a company domiciled in Canada and its registered office is located at 9000 Glenlyon Parkway,Burnaby, British Columbia, Canada, V5J 5J8. The consolidated financial statements of the Corporation as at andfor the year ended December 31, 2018 comprise the Corporation and its subsidiaries (note 4(a)).
2. Basis of preparation:
(a) Statement of compliance:
These consolidated financial statements of the Corporation have been prepared in accordance with InternationalFinancial Reporting Standards (“IFRS”) as issued by the International Accounting Standards Board (“IASB”).
The consolidated financial statements were authorized for issue by the Board of Directors on March 6, 2019.
Details of the Corporation's significant accounting policies are included in note 4.
This is the first set of the Corporation's annual financial statements in which IFRS 15 Revenue from Contracts withCustomers and IFRS 9 Financial Instruments have been applied. Changes to significant accounting policies aredescribed in note 3.
(b) Basis of measurement:
The consolidated financial statements have been prepared on the historical cost basis except for the followingmaterial items in the statement of financial position:
• Financial assets classified as measured at: amortized cost; fair value through other comprehensive income(FVOCI) or fair value through profit or loss (FVTPL); and
• Employee future benefits liability is recognized as the net of the present value of the defined benefit obligation,less the fair value of plan assets.
(c) Functional and presentation currency:
These consolidated financial statements are presented in U.S. dollars, which is the Corporation’s functionalcurrency.
(d) Use of estimates:
The preparation of the consolidated financial statements in conformity with IFRS requires the Corporation’smanagement to make estimates and assumptions that affect the application of accounting policies and the reportedamounts of assets, liabilities, income and expenses. Actual results may differ from these estimates.
Estimates and underlying assumptions are reviewed on an ongoing basis. Revisions to accounting estimates arerecognized in the period in which the estimates are revised and in any future periods affected.
D-73
2. Basis of preparation (cont'd):
(d) Use of estimates (cont'd):
Significant areas having estimation uncertainty include revenue recognition, asset impairment, warranty provision,inventory provision, impairment loss (recoveries) on trade receivables, employee future benefits, and income taxes.These estimates and judgments are discussed further in note 5.
(e) Future operations:
The Corporation is required to assess its ability to continue as a going concern or whether substantial doubt existsas to the Corporation’s ability to continue as a going concern into the foreseeable future. The Corporation hasforecast its cash flows for the foreseeable future and despite the ongoing volatility and uncertainties inherent inthe business, the Corporation believes it has adequate liquidity in cash and working capital to finance its operations.The Corporation’s ability to continue as a going concern and realize its assets and discharge its liabilities andcommitments in the normal course of business is dependent upon the Corporation having adequate liquidity andachieving profitable operations that are sustainable. There are various risks and uncertainties affecting theCorporation including, but not limited to, the market acceptance and rate of commercialization of the Corporation’sproducts, the ability of the Corporation to successfully execute its business plan, and general global economicconditions, certain of which are beyond the Corporation’s control.
The Corporation’s strategy to mitigate these risks and uncertainties is to continue its drive to attain profitableoperations that are sustainable by executing a business plan that continues to focus on revenue growth, improvingoverall gross margins, maintaining discipline over operating expenses, managing working capital requirements,and securing additional financing to fund operations as needed until the Corporation does achieve profitableoperations that are sustainable. Failure to implement this plan could have a material adverse effect on theCorporation’s financial condition and or results of operations.
BALLARD POWER SYSTEMS INC.Notes to Consolidated Financial StatementsYears ended December 31, 2018, and 2017(Tabular amounts expressed in thousands of U.S. dollars, except per share amounts and numbers of shares)
3. Changes in accounting policies:
The Corporation has consistently applied the accounting policies set out in note 4 to all periods presented in theseconsolidated financial statements, except as described below. The Corporation has initially adopted IFRS 15Revenue from Contracts with Customers and IFRS 9 Financial Instruments, effective January 1, 2018. The effectof initially applying these standards during the year ended December 31, 2018 did not have a material impact onthese consolidated financial statements. A number of other new standards are also effective from January 1, 2018but they also did not have a material impact on the Corporation's financial statements.
Due to the transition methods chosen by the Corporation in applying these standards, comparative informationthroughout these financial statements has not been restated to reflect the requirements of the new standards.
(a) IFRS 15 Revenue from Contracts with Customers
IFRS 15 Revenue from Contracts with Customers establishes a comprehensive framework for determiningwhether, how much and when revenue is recognized. It replaced IAS 18 Revenue, IAS 11 Construction Contractsand related interpretations. Under IFRS 15, revenue is recognized when a customer obtains control of the goodsor services. Determining the timing of the transfer of control, at a point in time or over time, requires judgment.
IFRS 15 contains a single model that applies to contracts with customers and two approaches to recognizingrevenue: at a point in time or over time. The model features a contract-based five-step analysis of transactions todetermine whether, how much, and when revenue is recognized. New estimates and judgmental thresholds havebeen introduced, which may affect the amount and/or timing of revenue recognized. The new standard applies tocontracts with customers. It does not apply to insurance contracts, financial instruments or lease contracts, whichfall in the scope of other IFRSs. The clarifications to IFRS 15 provide additional guidance with respect to the five-step analysis, transition, and the application of the Standard to licenses of intellectual property.
D-74
3. Changes in accounting policies (cont'd):
(a) IFRS 15 Revenue from Contracts with Customers (cont'd)
The Corporation has adopted IFRS 15 using the cumulative effect method, without practical expedients, with theeffect of initially applying this standard recognized at the date of initial application of January 1, 2018. Accordingly,the information presented for 2017 has not been restated. It is presented, as previously reported, under IAS 18,IAS 11 and related interpretations.
The adoption of IFRS15 did not have a material impact on the Corporation's financial statements.
(b) IFRS 9 Financial Instruments
IFRS 9 Financial Instruments sets out requirements for recognizing and measuring financial assets, financialliabilities and some contracts to buy or sell non-financial items. This standard replaces IAS 39 FinancialInstruments: Recognition and Measurement. There was no material impact to the Corporation’s financialstatements as a result of transitioning to IFRS 9.
IFRS 9 largely retains the existing requirements in IAS 39 for the classification and measurement of financialliabilities. However, it eliminates the previous IAS 39 categories for financial assets of held to maturity, loans andreceivables and available for sale.
Under IFRS 9, financial assets are classified and measured based on the business model in which they are heldand the characteristics of their contractual cash flows. The standard introduces additional changes relating tofinancial liabilities. It also amends the impairment model by introducing a new ‘expected credit loss’ model forcalculating impairment.
IFRS 9 also includes a new general hedge accounting standard which aligns hedge accounting more closely withrisk management. This new standard does not fundamentally change the types of hedging relationships or therequirement to measure and recognize ineffectiveness; however it will provide more hedging strategies that areused for risk management to qualify for hedge accounting and introduce more judgment to assess the effectivenessof a hedging relationship. Special transitional requirements have been set for the application of the new generalhedging model.
The adoption of IFRS 9 did not have a material impact on the Corporation’s financial statements.
BALLARD POWER SYSTEMS INC.Notes to Consolidated Financial StatementsYears ended December 31, 2018, and 2017(Tabular amounts expressed in thousands of U.S. dollars, except per share amounts and numbers of shares)
4. Significant accounting policies:
The accounting policies set out below have been applied consistently to all periods presented in these consolidatedfinancial statements, unless otherwise indicated. Certain prior year comparative figures have been reclassified tocomply with current year presentation.
D-75

4. Significant accounting policies (cont'd):
(a) Basis of consolidation:
The consolidated financial statements include the accounts of the Corporation and its principal subsidiaries asfollows:
Percentage ownership2018 2017
Guangzhou Ballard Power Systems Co., Ltd. 100% 100%Ballard Hong Kong Ltd. 100% 100%Protonex Technology Corporation (renamed Ballard Unmanned Systems Inc. as of January 1, 2019) 100% 100%Ballard Services Inc. 100% 100%Ballard Fuel Cell Systems Inc. 100% 100%Ballard Power Systems Europe A/S 100% 100%Ballard Power Corporation 100% 100%
The Corporation also has a non-controlling, 49% interest, in Weichai Ballard Hy-Energy Technologies Co., Ltd("Weichai Ballard JV") and a non-controlling, 10% interest, in Guangdong Synergy Ballard Hydrogen Power Co.,Ltd (“Synergy Ballard JVCo”). Both of these associated companies are accounted for using the equity method ofaccounting.
Subsidiaries are entities controlled by the Corporation. The Corporation controls an entity when it is exposed to,or has rights to, variable returns from its involvement with the entity and has the ability to affect those returnsthough its power over the entity. The financial statements of subsidiaries are included in the consolidated financialstatements from the date that control commences until the date that control ceases. Intercompany balances andtransactions are eliminated in the consolidated financial statements.
(i) Weichai Ballard JV
On November 13, 2018, the Corporation, through Ballard Hong Kong Ltd ("BHKL"), entered into an agreementwith Weichai Power Co., Ltd ("Weichai Power") to create a new limited liability company based in China calledWeichai Ballard Hy-Energy Technologies Co., Ltd ("Weichai Ballard JV") . The purpose of Weichai Ballard JVis to manufacture the Corporation's next-generation liquid-cooled fuel cell stack ("LCS") and LCS-based powermodules for bus, commercial truck and forklift applications with exclusive rights in China. Under the agreement,Weichai is to contribute RMB 561,000,000 ($81,600,000 equivalent at December 31, 2018 exchange rate)and the Corporation is to contribute RMB 539,000,000 ($78,400,000 equivalent at December 31, 2018exchange rate) representing 51% and 49% of the registered capital in Weichai Ballard JV, respectively. Theparties will make these contributions in cash over a four year period and are not obligated to contribute anyadditional capital in excess of the amounts noted above.
Weichai Power made an initial capital contribution in 2018 of RMB 102,000,000 and the Corporation made aninitial capital contribution of $14,286,000 (RMB 98,000,000 equivalent). In February 2019, the Corporationmade an additional capital contribution of $14,506,000 (RMB 98,000,000 equivalent). Weichai Power andthe Corporation will fund pro rata shares of the Weichai Ballard JV based on an agreed business plan. WeichaiPower will hold three of five Weichai Ballard JV board seats and the Corporation will hold two, with theCorporation having certain shareholder protection provisions. Weichai Ballard JV is not controlled by theCorporation and therefore is not consolidated. The Corporation's 49% investment in Weichai Ballard JV isaccounted for using the equity method of accounting.
(ii) Guangzhou Ballard Power Systems
On January 10, 2017, the Corporation incorporated Guangzhou Ballard Power Systems Co., Ltd. ("GBPS"),a 100% wholly foreign-owned enterprise ("WFOE") in China to serve as the Corporation's operations entityfor all of China.
BALLARD POWER SYSTEMS INC.Notes to Consolidated Financial StatementsYears ended December 31, 2018, and 2017(Tabular amounts expressed in thousands of U.S. dollars, except per share amounts and numbers of shares)
D-76

4. Significant accounting policies (cont'd):
(a) Basis of consolidation (cont'd):
(iii) Synergy Ballard JVCo
On September 26, 2016, the Corporation, through BHKL, entered into a joint venture agreement withGuangdong Nation Synergy Hydrogen Power Technology Co., Ltd (“Synergy”) to create a new limited liabilitycompany based in China called Guangdong Synergy Ballard Hydrogen Power Co., Ltd (“Synergy BallardJVCo”). The purpose of Synergy Ballard JVCo is to carry out the Mk9 SSL fuel cell stack technology transfertransaction that was contemplated in the Mk 9 SSL Manufacturing Master Agreement to establish Mk9 SSLfuel cell stack manufacturing capabilities in China. In setting up the joint venture, as specified in the EquityJoint Venture Agreement (“EJV”) dated September 26, 2016, Synergy contributed RMB 60,300,000($9,000,000) and the Corporation contributed RMB 6,700,000, ($971,000) in March 2017 representing 90%and 10% of the registered capital in Synergy Ballard JVCo, respectively. The parties made their contributionsin cash and the Corporation is not obligated to contribute any additional capital in excess of the amounts notedabove. Synergy Ballard JVCo is not controlled by the Corporation and therefore is not consolidated. TheCorporation’s 10% investment in Synergy Ballard JVCo is accounted for using the equity method of accounting.
(iv) Ballard Hong Kong Ltd
On July 19, 2016, the Corporation incorporated Ballard Hong Kong Ltd (“BHKL”), a 100% owned holdingcompany in Hong Kong, China.
(v) Protonex Technology Corporation
On October 1, 2015, the Corporation acquired Protonex Technology Corporation ("Protonex"), (renamed BallardUnmanned Systems Inc. as of January 1, 2019), a leading designer and manufacturer of advanced powermanagement products and portable fuel cell solutions.
(vi) Ballard Power Systems Europe
On January 18, 2010, the Corporation acquired a controlling interest in Ballard Power Systems Europe A/S(“BPSE”). BPSE (formerly Dantherm Power A/S) has been consolidated since acquisition. The remaining 43%interest was held by Dansk Industri Invest A/S (previously Dantherm Air Handling A/S). On January 5, 2017,the Corporation purchased all of the shares in its European subsidiary held by Dansk Industri Invest A/S fora nominal value of $47,000. As a result, the Corporation now owns 100% of BPSE.
(b) Foreign currency:
(i) Foreign currency transactions
Transactions in foreign currencies are translated to the respective functional currencies of the Corporation andits subsidiaries at the exchange rate in effect at the transaction date. Monetary assets and liabilities denominatedin other than the functional currency are translated at the exchange rates in effect at the balance sheet date.The resulting exchange gains and losses are recognized in earnings. Non-monetary assets and liabilitiesdenominated in other than the functional currency that are measured at fair value are translated to the functionalcurrency at the exchange rate at the date that the fair value was determined. Non-monetary items that aremeasured in terms of historical cost in other than the functional currency are translated using the exchangerate at the date of the transaction.
(ii) Foreign operations
The assets and liabilities of foreign operations are translated to the presentation currency using exchangerates at the reporting date. The income and expenses of foreign operations are translated to the presentationcurrency using exchange rates at the dates of the transactions. Foreign currency differences are recognizedin other comprehensive income.
BALLARD POWER SYSTEMS INC.Notes to Consolidated Financial StatementsYears ended December 31, 2018, and 2017(Tabular amounts expressed in thousands of U.S. dollars, except per share amounts and numbers of shares)
D-77

4. Significant accounting policies (cont'd):
(c) Financial instruments:
(i) Financial assets
The Corporation initially recognizes loans and receivables and deposits on the date that they originated andall other financial assets on the trade date at which the Corporation becomes a party to the contractual provisionsof the instrument. The Corporation derecognizes a financial asset when the contractual rights to the cash flowsfrom the asset expire, or when it transfers substantially all the risks and rewards of ownership of the financialasset.
Financial assets at fair value through profit or loss
Financial assets are classified as measured at: amortized cost; fair value through other comprehensiveincome ("FVOCI") or fair value through profit or loss ("FVTPL"). The classification of financial assets isgenerally based on the business model in which a financial asset is managed and its contractual cash flowcharacteristics. Derivatives embedded in contracts where the host is a financial asset in the scope of thestandard are never separated. Instead, the hybrid financial instrument as a whole is assessed forclassification. The Corporation's financial assets which consist primarily of cash and cash equivalents, tradeand other receivables, and contract assets are classified at amortized cost.
The Corporation also periodically enters into foreign exchange forward contracts and platinum futures contractsto limit its respective exposure to foreign currency rate fluctuations and platinum price fluctuations. Thesederivatives are recognized initially at fair value and are recorded as either assets or liabilities based on theirfair value. Subsequent to initial recognition, these derivatives are measured at fair value and changes to theirvalue are recorded through profit or loss.
(ii) Financial liabilities
Financial liabilities comprise the Corporation’s trade and other payables. The financial liabilities are initiallyrecognized on the date they are originated and are derecognized when the contractual obligations aredischarged or cancelled or expire. These financial liabilities are recognized initially at fair value andsubsequently are measured at amortized costs using the effective interest method, when materially differentfrom the initial amount. Fair value is determined based on the present value of future cash flows, discountedat the market rate of interest.
(iii) Share capital
Share capital is classified as equity. Incremental costs directly attributable to the issue of shares and shareoptions are recognized as a deduction from equity. When share capital is repurchased, the amount of theconsideration paid, including directly attributable costs, is recognized as a deduction from equity. Repurchasedshares are classified as treasury shares and are presented as a deduction from equity. When treasury sharesare subsequently reissued, the amount received is recognized as an increase in equity, and the resultingsurplus or deficit on the transaction is transferred to or from retained earnings.
(d) Inventories:
Inventories are recorded at the lower of cost and net realizable value. The cost of inventories is based on the first-in first-out principle, and includes expenditures incurred in acquiring the inventories, production or conversion costsand other costs incurred in bringing them to their existing location and condition. In the case of manufacturedinventories and work in progress, cost includes materials, labor and appropriate share of production overheadbased on normal operating capacity. Costs of materials are determined on an average per unit basis.
Net realizable value is the estimated selling price in the ordinary course of business, less the estimated costs ofcompletion and selling expenses. In establishing any impairment of inventory, management estimates the likelihoodthat inventory carrying values will be affected by changes in market demand, technology and design, which wouldimpair the value of inventory on hand.
BALLARD POWER SYSTEMS INC.Notes to Consolidated Financial StatementsYears ended December 31, 2018, and 2017(Tabular amounts expressed in thousands of U.S. dollars, except per share amounts and numbers of shares)
D-78

4. Significant accounting policies (cont'd):
(e) Property, plant and equipment:
(i) Recognition and measurement
Items of property, plant and equipment are measured at cost less accumulated depreciation and anyaccumulated impairment losses. The cost of self-constructed assets includes the cost of materials, costsdirectly attributable to bringing the assets to a working condition for their intended use, and the costs ofdismantling and removing items and restoring the site on which they are located. If significant parts of an itemof property, plant and equipment have different useful lives, then they are accounted for as separate items(major components) of property, plant and equipment.
Any gain or loss on disposal of an item of property, plant and equipment is recognized in profit or loss.
(ii) Subsequent expenditure
Subsequent expenditure is capitalized only if it is probable that the future economic benefits associated withthe expenditure will flow to the Corporation.
(iii) Depreciation
Depreciation is calculated to write-off the cost of items of property, plant and equipment less their estimatedresidual values using the straight-line method over their estimated useful lives, and is generally recognized inprofit or loss. Leased assets are depreciated over the shorter of the lease term and their useful lives unless itis reasonably certain that the Corporation will obtain ownership by the end of the lease term.
The estimated useful lives of property, plant and equipment for current and comparative periods are as follows:
Building under finance lease 15 yearsComputer equipment 3 to 7 yearsFurniture and fixtures 5 to 14 yearsFurniture and fixtures under finance lease 5 yearsLeasehold improvements The shorter of initial term of the respective lease and
estimated useful lifeProduction and test equipment 4 to 15 yearsProduction and test equipment under finance lease 5 years
Depreciation methods, useful lives and residual values are reviewed at each reporting date and adjusted ifappropriate.
(f) Leases:
Leases where the Corporation assumes substantially all the risks and rewards of ownership are classified asfinance leases. Upon initial recognition the leased asset is measured at an amount equal to the lower of its fairvalue and the present value of the minimum lease payments. Subsequent to initial recognition, the asset isaccounted for in accordance with the accounting policy applicable to that asset. Other leases are operating leasesand not recognized in the statement of financial position.
Minimum lease payments made under finance leases are apportioned between finance expenses and reductionof the outstanding liability. Finance expense is allocated to each period during the lease term so as to produce aconstant periodic rate of interest on the remaining balance of the liability.
Payments made under operating leases are recognized in income on a straight-line basis over the term of thelease. Lease incentives received are recognized as a reduction to the lease expense over the term of the lease.
The Corporation will adopt the new IFRS 16 Leases standard commencing January 1, 2019 (note 6).
BALLARD POWER SYSTEMS INC.Notes to Consolidated Financial StatementsYears ended December 31, 2018, and 2017(Tabular amounts expressed in thousands of U.S. dollars, except per share amounts and numbers of shares)
D-79

4. Significant accounting policies (cont'd):
(g) Goodwill and intangible assets:
(i) Recognition and measurement
Goodwill Goodwill arising on the acquisition of subsidiaries is measured at cost less accumulated impairmentlosses.
Research and development Expenditure on research activities is recognized in profit or loss as incurred.Development expenditure is capitalized only if the expenditure can be measured reliably, the productor process is technically and commercially feasible, future economic benefits are probable and theCorporation intends to and has sufficient resources to complete development and to use or sell theasset. Otherwise, it is recognized in profit or loss as incurred. Subsequent to initial recognition,development expenditure is measured at cost less accumulated amortization and any accumulatedimpairment losses.
Intangible assets Intangible assets, including patents, know-how, in-process research and development, trademarksand service marks and software systems that are acquired or developed by the Corporation and havefinite useful lives are measured at cost less accumulated amortization and any accumulated impairmentlosses.
(ii) Subsequent expenditure
Subsequent expenditure is capitalized only when it increases the future economic benefits embodied in thespecific asset to which it relates. All other expenditure, including expenditure on internally generated goodwill,is recognized in profit or loss as incurred.
(iii) Amortization
Amortization is calculated to write-off the cost of intangible assets less their estimated residual values usingthe straight-line method over their estimated useful lives, and is recognized in profit or loss. Goodwill is notamortized.
The estimated useful lives for current and comparative periods are as follows:
Internally generated fuel cell intangible assets 5 years
Patents, know-how and in-process research & development 5 to 20 years
ERP management reporting software system 7 years
Trademarks and service marks 15 years
Domain names 15 years
Customer base and relationships 10 years
Acquired non-compete agreements 1 year
Amortization methods, useful lives and residual values are reviewed at each reporting date and adjusted ifappropriate.
(h) Impairment:
(i) Financial assets
An ‘expected credit loss’ ("ECL") model applies to financial assets measured at amortized cost and debtinvestments at FVOCI, but not to investments in equity instruments. The Corporation's financial assetsmeasured at amortized cost and subject to the ECL model consist primarily of trade receivables and contractassets.
BALLARD POWER SYSTEMS INC.Notes to Consolidated Financial StatementsYears ended December 31, 2018, and 2017(Tabular amounts expressed in thousands of U.S. dollars, except per share amounts and numbers of shares)
D-80

4. Significant accounting policies (cont'd):
(h) Impairment (cont'd):
(i) Financial assets (cont'd)
In applying the ECL model, loss allowances are measured on either of the following bases:
• 12-month ECLs: these are ECLs that result from possible default events within the 12months after the reporting date; and
• lifetime ECLs: these are ECLs that result from all possible default events over the expectedlife of a financial instrument.
The Corporation has elected to measure loss allowances for trade receivables and contract assets at anamount equal to lifetime ECLs.
When determining whether the credit risk of a financial asset has increased significantly since initial recognitionand when estimating ECLs, the Corporation considers reasonable and supportable information that is relevantand available without undue cost or effort. This includes both quantitative and qualitative information andanalysis, based on historical experience and informed credit assessment and including forward-lookinginformation.
ECLs are a probability-weighted estimate of credit losses. Credit losses are measured as the present valueof all cash shortfalls (i.e. the difference between the cash flows due to the entity in accordance with thecontract and the cash flows that we expect to receive). ECLs are discounted at the effective interest rate ofthe financial asset. At each reporting date, we assess whether financial assets carried at amortized cost arecredit-impaired. A financial asset is ‘credit-impaired’ when one or more events that have a detrimentalimpact on the estimated future cash flows of the financial asset have occurred. Loss allowances for financialassets measured at amortized cost are deducted from the gross carrying amount of the assets. Impairment(losses) recoveries related to trade receivables and contract assets are presented separately in thestatement of profit or loss.
(ii) Non-financial assets
The carrying amounts of the Corporation’s non-financial assets other than inventories are reviewed at eachreporting date to determine whether there is any indication of impairment. If any such indication exists, thenthe asset’s recoverable amount is estimated. For goodwill and intangible assets that have indefinite usefullives, the recoverable amount is estimated annually.
The recoverable amount of an asset or cash-generating unit is the greater of its value in use and its fair valueless costs to sell. In assessing value in use, the estimated future cash flows are discounted to their presentvalue using a pre-tax discount rate that reflects current market assessments of the time value of money andthe risks specific to the asset. Fair value less costs to sell is defined as the estimated price that would bereceived on the sale of the asset in an orderly transaction between market participants at the measurementdate. For the purposes of impairment testing, assets that cannot be tested individually are grouped togetherinto the smallest group of assets that generates cash inflows from continuing use that are largely independentof the cash inflows of other groups of assets.
The allocation of goodwill to cash-generating units reflects the lowest level at which goodwill is monitored forinternal reporting purposes.
An impairment loss is recognized if the carrying amount of an asset or its cash-generating unit exceeds itsestimated recoverable amount. Impairment losses are recognized in net loss. Impairment losses recognizedin respect of the cash generating units are allocated first to reduce the carrying amount of any goodwill allocatedto the units, and then to reduce the carrying amounts of the other assets in the unit on a pro-rata basis.
BALLARD POWER SYSTEMS INC.Notes to Consolidated Financial StatementsYears ended December 31, 2018, and 2017(Tabular amounts expressed in thousands of U.S. dollars, except per share amounts and numbers of shares)
D-81

4. Significant accounting policies (cont'd):
(h) Impairment (cont'd):
(ii) Non-financial assets (cont'd)
An impairment loss in respect of goodwill is not reversed. In respect of other assets, impairment lossesrecognized in prior periods are assessed at each reporting date for any indications that the loss has decreasedor no longer exists. An impairment loss is reversed only to the extent that the asset’s carrying amount doesnot exceed the carrying amount that would have been determined, net of depreciation or amortization, if noimpairment loss had been recognized.
(i) Provisions:
A provision is recognized if, as a result of a past event, the Corporation has a present legal or constructive obligationthat can be estimated reliably, and it is probable that an outflow of economic benefits will be required to settle theobligation. Provisions are determined by discounting the expected future cash flows at a pre-tax rate that reflectscurrent market assessments of the time value of money and the risk specific to the liability. The unwinding of thediscount is recognized as a finance expense.
Warranty provision
A provision for warranty costs is recorded on product sales at the time the sale is recognized. In establishing thewarranty provision, management estimates the likelihood that products sold will experience warranty claims andthe estimated cost to resolve claims received, taking into account the nature of the contract and past and projectedexperience with the products.
Decommissioning liabilities
Legal obligations to retire tangible long-lived assets are recorded at the net present value of the expected costsof settlement at acquisition with a corresponding increase in asset value. These include assets leased underoperating leases. The liability is accreted over the life of the asset to the ultimate settlement amount and theincrease in asset value is depreciated over the remaining useful life of the asset.
(j) Revenue recognition:
The Corporation generates revenues primarily from product sales, the license and sale of intellectual propertyand fundamental knowledge, and the provision of engineering services and technology transfer services. Productrevenues are derived primarily from standard product sales contracts and from long-term fixed price contracts.Intellectual property and fundamental knowledge license revenues are derived primarily from standard licensingand technology transfer agreements. Engineering service and technology transfer services revenues are derivedprimarily from cost-plus reimbursable contracts and from long-term fixed price contracts.
The details of the new significant accounting policies and the nature of the changes to previous accounting policiesin relation to the Corporation’s various goods and services are set out below. Under IFRS 15, revenue is recognizedwhen a customer obtains control of the goods or services. Determining the timing of the transfer of control, at apoint in time or over time, requires judgment.
On standard product sales contracts, revenues are recognized when customers obtain control of the product,that is when transfer of title and risks and rewards of ownership of goods have passed and when obligation topay is considered certain. Invoices are generated and revenue is recognized at that point in time. Provisions forwarranties are made at the time of sale.
BALLARD POWER SYSTEMS INC.Notes to Consolidated Financial StatementsYears ended December 31, 2018, and 2017(Tabular amounts expressed in thousands of U.S. dollars, except per share amounts and numbers of shares)
D-82

4. Significant accounting policies (cont'd):
(j) Revenue recognition (cont'd):
On standard licensing and technology transfer agreements, revenues are recognized on the transfer of rights toa licensee, when it is determined to be distinct from other performance obligations, and if the customer can directthe use of, and obtain substantially all of the remaining benefits from the license as it exists at the time of transfer.In other cases, the proceeds are considered to relate to the right to use the asset over the license period and therevenue is recognized over that period. If it is determined that the license is not distinct from other performanceobligations, revenue is recognized over time as the customer simultaneously receives and consumes the benefit.
On cost-plus reimbursable contracts, revenues are recognized as costs are incurred, and include applicable feesearned as services are provided.
On long-term fixed price contracts, the customer controls all of the work in progress as the services are beingprovided. This is because under these contracts, the deliverables are made to a customer’s specification, andif a contract is terminated by the customer, then the Corporation is entitled to reimbursement of the costs incurredto date plus the applicable gross margin. Therefore, revenue from these contracts and the associated costs arerecognized as the costs are incurred over time.
On long-term fixed price contracts, revenues are recognized over time typically on a percentage-of-completionbasis, which consists of recognizing revenue for a performance obligation on a given contract proportionatelywith its percentage of completion at any given time. The percentage of completion is determined by dividing thecumulative costs incurred as at the balance sheet date by the sum of incurred and anticipated costs for completinga contract. The cumulative effect of changes to anticipated revenues and anticipated costs for completing acontract are recognized in the period in which the revisions are identified. In the event that the anticipated costsexceed the anticipated revenues on a contract, such loss is recognized in its entirety in the period it becomesknown.
Deferred revenue (i.e. contract liabilities) represents cash received from customers in excess of revenue recognizedon uncompleted contracts.
(k) Finance income and expense:
Finance income comprises interest income on funds invested, gains on the disposal of available-for-sale financialassets and changes in the fair value of financial assets at fair value through profit or loss. Interest income isrecognized as it accrues in income, using the effective interest method.
Finance expense comprise interest expense on capital leases, unwinding of the discount on provisions, changesin the fair value of financial assets at fair value through profit or loss and impairment losses recognized on financialassets. Foreign currency gains and losses are reported on a net basis.
(l) Income taxes:
The Corporation follows the asset and liability method of accounting for income taxes. Under this method, deferredincome taxes are recognized for the deferred income tax consequences attributable to differences between thefinancial statement carrying values of assets and liabilities and their respective income tax bases (temporarydifferences) and for loss carry forwards. The resulting changes in the net deferred tax asset or liability are includedin income.
Deferred tax assets and liabilities are measured using enacted, or substantively enacted, tax rates expected toapply to taxable income in the years in which temporary differences are expected to be recovered or settled. Theeffect on deferred income tax assets and liabilities, of a change in tax rates, is included in income in the periodthat includes the substantive enactment date. Deferred income tax assets are reviewed at each reporting date andare reduced to the extent that it is no longer probable that the related tax benefit will be realized.
BALLARD POWER SYSTEMS INC.Notes to Consolidated Financial StatementsYears ended December 31, 2018, and 2017(Tabular amounts expressed in thousands of U.S. dollars, except per share amounts and numbers of shares)
D-83
4. Significant accounting policies (cont'd):
(m) Employee benefits:
Defined contribution plans
A defined contribution plan is a post-employment benefit plan under which an entity pays fixed contributions intoa separate entity and will have no legal or constructive obligation to pay further amounts.
Obligations for contributions to defined contribution pension plans are recognized as an employee benefit expensein profit or loss in the periods during which services are rendered by employees. Prepaid contributions arerecognized as an asset to the extent that a cash refund or a reduction in future payments is available. Contributionsto a defined contribution plan that are due more than 12 months after the end of the period in which the employeesrender the service are discounted to their present value.
Defined benefit plans
A defined benefit plan is a post-employment pension plan other than a defined contribution plan. The Corporation’snet obligation in respect of defined benefit pension plans is calculated separately for each plan by estimating theamount of future benefit that employees have earned in return for their service in the current and prior periods;that benefit is discounted to determine its present value. Any unrecognized past service costs and the fair valueof any plan assets are deducted. The discount rate is the yield at the reporting date on AA credit-rated bonds thathave maturity dates approximating the terms of the Corporation’s obligations and that are denominated in the samecurrency in which the benefits are expected to be paid. The calculation is performed annually by a qualified actuaryusing the projected unit credit method.
When the calculation results in a benefit to the Corporation, the recognized asset is limited to the total of anyunrecognized past service costs and the present value of economic benefits available in the form of any futurerefunds from the plan or reductions in future contributions to the plan. In order to calculate the present value ofeconomic benefits, consideration is given to any minimum funding requirements that apply to any plan in theCorporation. An economic benefit is available to the Corporation if it is realizable during the life of the plan, or onsettlement of the plan liabilities.
The Corporation recognizes all remeasurements arising from defined benefit plans, which comprise actuarial gainsand losses, immediately in other comprehensive income. Remeasurements recognized in other comprehensiveincome are not recycled through profit or loss in subsequent periods.
Other long-term employee benefits
The Corporation’s net obligation in respect of long-term employee benefits other than pension plans is the amountof future benefit that employees have earned in return for their service in the current and prior periods; that benefitis discounted to determine its present value, and the fair value of any related assets is deducted. The discountrate is the yield at the reporting date on AA credit-rated bonds that have maturity dates approximating the termsof the Corporation’s obligations. The calculation is performed using the projected unit credit method. Any actuarialgains and losses are recognized in other comprehensive income or loss in the period in which they arise.
Termination benefits
Termination benefits are recognized as an expense (restructuring expense recorded in other operating expense)when the Corporation is committed demonstrably, without realistic possibility of withdrawal, to a formal detailedplan to either terminate employment before the normal retirement date, or to provide termination benefits as aresult of an offer made to encourage voluntary redundancy. Termination benefits for voluntary redundancies arerecognized as an expense if the Corporation has made an offer of voluntary redundancy, it is probable that theoffer will be accepted, and the number of acceptances can be estimated reliably. If benefits are payable more than12 months after the reporting period, then they are discounted to their present value.
BALLARD POWER SYSTEMS INC.Notes to Consolidated Financial StatementsYears ended December 31, 2018, and 2017(Tabular amounts expressed in thousands of U.S. dollars, except per share amounts and numbers of shares)
D-84

4. Significant accounting policies (cont'd):
(m) Employee benefits (cont'd):
Short-term employee benefits
Short-term employee benefit obligations are measured on an undiscounted basis and are expensed as the relatedservice is provided.
A liability is recognized for the amount expected to be paid under short-term cash bonus or profit sharing plans ifthe Corporation has a present legal or constructive obligation to pay this amount as a result of past service providedby the employee, and the obligation can be estimated reliably.
(n) Share-based compensation plans:
The Corporation uses the fair-value based method of accounting for share-based compensation for all awards ofshares and share options granted. The resulting compensation expense, based on the fair value of the awardsgranted, excluding the impact of any non-market service and performance vesting conditions, is charged to incomeover the period that the employees unconditionally become entitled to the award, with a corresponding increaseto contributed surplus.
Fair values of share options are calculated using the Black-Scholes valuation method as of the grant date andadjusted for estimated forfeitures. For awards with graded vesting, the fair value of each tranche is calculatedseparately and recognized over its respective vesting period. Non-market vesting conditions are considered inmaking assumptions about the number of awards that are expected to vest. At each reporting date, the Corporationreassesses its estimates of the number of awards that are expected to vest and recognizes the impact of anyrevision in the income statement with a corresponding adjustment to contributed surplus.
The Corporation issues shares and share options under its share-based compensation plans as described in note20. Any consideration paid by employees on exercise of share options or purchase of shares, together with theamount initially recorded in contributed surplus, is credited to share capital.
(o) Earnings (loss) per share:
Basic earnings (loss) per share is computed using the weighted average number of common shares outstandingduring the period, adjusted for treasury shares. Diluted earnings per share is calculated using the treasury stockmethod.
Under the treasury stock method, the dilution is calculated based upon the number of common shares issuedshould deferred share units (“DSUs”), restricted share units (“RSUs”), and “in the money” options, if any, beexercised. When the effects of outstanding stock-based compensation arrangements would be anti-dilutive, dilutedloss per share is not calculated.
(p) Government assistance and investment tax credits:
Government assistance and investment tax credits are recorded as either a reduction of the cost of the applicableassets, or credited against the related expense incurred in the statement of comprehensive loss, as determinedby the terms and conditions of the agreements under which the assistance is provided to the Corporation or thenature of the expenditures which gave rise to the credits. Government assistance and investment tax creditreceivables are recorded when their receipt is reasonably assured.
(q) Segment reporting:
An operating segment is a component of the Corporation that engages in business activities from which it mayearn revenues and incur expenses, including revenues and expenses that relate to transactions with any of theCorporation’s other components. Segment results include items directly attributable to a segment as well as thosethat can be allocated on a reasonable basis. Unallocated items comprise mainly corporate assets, head officeexpenses, and income tax assets and liabilities.
BALLARD POWER SYSTEMS INC.Notes to Consolidated Financial StatementsYears ended December 31, 2018, and 2017(Tabular amounts expressed in thousands of U.S. dollars, except per share amounts and numbers of shares)
D-85
5. Critical judgments in applying accounting policies and key sources of estimation uncertainty:
Critical judgments in applying accounting policies:
Critical judgments that management has made in the process of applying the Corporation’s accounting policiesand that have the most significant effect on the amounts recognized in the consolidated financial statements arelimited to management’s assessment of the Corporation’s ability to continue as a going concern (note 2(e)).
Key sources of estimation uncertainty:
The following are key assumptions concerning the future and other key sources of estimation uncertainty that havesignificant risk of resulting in a material adjustment to the reported amount of assets, liabilities, income and expenseswithin the next fiscal year.
(a) Revenue recognition:
On long-term fixed price contracts, revenues are recorded over time typically on a percentage-of-completionbasis, which consists of recognizing revenue for a performance obligation on a given contract proportionatelywith its percentage of completion at any given time. The percentage of completion is determined by dividing thecumulative costs incurred as at the balance sheet date by the sum of incurred and anticipated costs for completinga contract. The cumulative effect of changes to anticipated revenues and anticipated costs for completing acontract are recognized in the period in which the revisions are identified. If the anticipated costs exceed theanticipated revenues on a contract, such loss is recognized in its entirety in the period it becomes known.
• The determination of anticipated costs for completing a contract is based on estimates that can beaffected by a variety of factors such as variances in the timeline to completion, the cost of materials, theavailability and cost of labour, as well as productivity.
• The determination of potential revenues includes the contractually agreed amount and may be adjustedbased on the estimate of the Corporation’s attainment on achieving certain defined contractualmilestones. Management’s estimation is required in determining the amount of consideration to whichthe Corporation expects to be entitled and in determining when a performance obligation has been met.
Estimates used to determine revenues and costs of long-term fixed price contracts involve uncertainties thatultimately depend on the outcome of future events and are periodically revised as projects progress. There is arisk that a customer may ultimately disagree with management’s assessment of the progress achieved againstmilestones, or that the Corporation's estimates of the work required to complete a contract may change.
(b) Asset impairment:
The recoverable amount of an asset or cash-generating unit is the greater of its value in use and its fair value lesscosts to sell. In assessing value in use, the estimated future cash flows are discounted to their present value usinga pre-tax discount rate that reflects current market assessments of the time value of money and the risks specificto the asset. In assessing fair value less costs to sell, the price that would be received on the sale of an asset inan orderly transaction between market participants at the measurement date is estimated. For the purposes ofimpairment testing, assets that cannot be tested individually are grouped together into the smallest group of assetsthat generates cash inflows from continuing use that are largely independent of the cash inflows of other groupsof assets. The allocation of goodwill to cash-generating units reflects the lowest level at which goodwill is monitoredfor internal reporting purposes. Many of the factors used in assessing fair value are outside the control ofmanagement and it is reasonably likely that assumptions and estimates will change from period to period.
These changes may result in future impairments. For example, the revenue growth rate could be lower thanprojected due to economic, industry or competitive factors, or the discount rate used in the value in use modelcould increase due to a change in market interest rates. In addition, future goodwill impairment charges may benecessary if the market capitalization decreased due to a decline in the trading price of the Corporation’s commonstock, which could negatively impact the fair value of the Corporation’s operating segments.
BALLARD POWER SYSTEMS INC.Notes to Consolidated Financial StatementsYears ended December 31, 2018, and 2017(Tabular amounts expressed in thousands of U.S. dollars, except per share amounts and numbers of shares)
D-86

5. Critical judgments in applying accounting policies and key sources of estimation uncertainty (cont'd):
(c) Warranty provision:
A provision for warranty costs is recorded on product sales at the time of shipment. In establishing the warrantyprovision, management estimates the likelihood that products sold will experience warranty claims and the costto resolve claims received. In making such determinations, the Corporation uses estimates based on the natureof the contract and past and projected experience with the products. Should these estimates prove to be incorrect,the Corporation may incur costs different from those provided for in the warranty provision. Management reviewswarranty assumptions and makes adjustments to the provision at each reporting date based on the latest informationavailable, including the expiry of contractual obligations. Adjustments to the warranty provision are recorded incost of product and service revenues.
(d) Inventory provision:
In determining the lower of cost and net realizable value of inventory and in establishing the appropriate provisionfor inventory obsolescence, management estimates the likelihood that inventory carrying values will be affectedby changes in market pricing or demand for the products and by changes in technology or design which couldmake inventory on hand obsolete or recoverable at less than the recorded value. Management performs regularreviews to assess the impact of changes in technology and design, sales trends and other changes on the carryingvalue of inventory. Where it is determined that such changes have occurred and will have an negative impact onthe value of inventory on hand, appropriate provision are made.
If there is a subsequent increase in the value of inventory on hand, reversals of previous write-downs to netrealizable value are made. Unforeseen changes in these factors could result in additional inventory provisions, orreversals of previous provisions, being required.
(e) Financial assets including impairment of trade receivables:
An ECL model applies to financial assets measured at amortized cost, contract assets and debt investments atFVOCI, but not to investments in equity instruments. The Corporation's financial assets that are measured atamortized cost and subject to the ECL model consist primarily of trade receivables and contract assets.
In applying the ECL model, loss allowances are measured on either of the following bases:
• 12-month ECLs: these are ECLs that result from possible default events within the 12months after the reporting date; and
• lifetime ECLs: these are ECLs that result from all possible default events over the expectedlife of a financial instrument.
The Corporation has elected to measure loss allowances for trade receivables and contract assets at an amountequal to lifetime ECLs.
When determining whether the credit risk of a financial asset has increased significantly since initial recognitionand when estimating ECLs, the Corporation considers reasonable and supportable information that is relevantand available without undue cost or effort. This includes both quantitative and qualitative information and analysis,based on the Corporation’s historical experience and informed credit assessment and including forward-lookinginformation.
ECLs are a probability-weighted estimate of credit losses. Credit losses are measured as the present value of allcash shortfalls (i.e. the difference between the cash flows due to the entity in accordance with the contract andthe cash flows that the Corporation expects to receive). ECLs are discounted at the effective interest rate of thefinancial asset. At each reporting date, the Corporation assesses whether financial assets carried at amortizedcost are credit-impaired. A financial asset is ‘credit-impaired’ when one or more events that have a detrimentalimpact on the estimated future cash flows of the financial asset have occurred. Loss allowances for financialassets measured at amortized cost are deducted from the gross carrying amount of the assets. Impairment(losses) recoveries related to trade receivables and contract assets are presented separately in the statement ofprofit or loss.
BALLARD POWER SYSTEMS INC.Notes to Consolidated Financial StatementsYears ended December 31, 2018, and 2017(Tabular amounts expressed in thousands of U.S. dollars, except per share amounts and numbers of shares)
D-87

5. Critical judgments in applying accounting policies and key sources of estimation uncertainty (cont'd):
(f) Employee future benefits:
The present value of the defined benefit obligation is determined by discounting the estimated future cash outflowsusing interest rates of high-quality corporate bonds that have terms to maturity approximating the terms of therelated pension liability. Determination of benefit expense requires assumptions such as the discount rate tomeasure obligations, expected plan investment performance, expected healthcare cost trend rate, and retirementages of employees. Actual results will differ from the recorded amounts based on these estimates and assumptions.
(g) Income taxes:
Deferred tax assets and liabilities are measured using enacted, or substantively enacted, tax rates expected toapply to taxable income in the years in which temporary differences are expected to be recovered or settled. Theeffect on deferred income tax assets and liabilities of a change in tax rates is included in income in the period thatincludes the substantive enactment date. Management reviews the deferred income tax assets at each reportingperiod and records adjustments to the extent that it is no longer probable that the related tax benefit will be realized.
BALLARD POWER SYSTEMS INC.Notes to Consolidated Financial StatementsYears ended December 31, 2018, and 2017(Tabular amounts expressed in thousands of U.S. dollars, except per share amounts and numbers of shares)
6. Recent accounting pronouncements and future accounting policy changes:
The following is an overview of accounting standard changes that the Corporation will be required to adopt in futureyears. The Corporation does not expect to adopt any of these standards before their effective dates and willcontinue to evaluate the impact of these standards on the consolidated financial statements.
(a) IFRS 16 - Leases
On January 13, 2016, the IASB issued IFRS 16 Leases. IFRS 16 introduces a single lessee accounting modeland requires a lessee to recognize assets and liabilities for all leases with a term of more than 12 months,unless the underlying asset is of low value. A lessee is required to recognize a right-of-use asset representingits right to use the underlying asset and a lease liability representing its obligation to make lease payments.This standard substantially carries forward the lessor accounting requirements of IAS 17, while requiringenhanced disclosures to be provided by lessors. Other areas of the lease accounting model have beenimpacted, including the definition of a lease. Transitional provisions have been provided.
The new standard is effective for annual periods beginning on or after January 1, 2019. IFRS 16 will replaceIAS 17 Leases and the related interpretations.
The most significant effect of the new standard will be the lessee’s recognition of the initial present value ofunavoidable future lease payments as right-of-use lease assets and lease liabilities on the statement of financialposition, including those for most leases that would currently be accounted for as operating leases. Both leaseswith durations of 12 months or less and leases for low-value assets may be exempted.
The presentation on the statement of income and other comprehensive income required by the new standardwill result in the presentation of most lease expenses as depreciation of right-of-use lease assets and financingcosts arising from lease liabilities, rather than as a part of operating expenses; reported results from operatingactivities would thus be higher under the new standard. Relative to the results of applying the current standard,although actual cash flows will be unaffected, the lessee’s statement of cash flows will reflect increases incash flows from operating activities offset equally by decreases in cash flows from financing activities. This isthe result of the presentation of the payments of the “principal” component of leases that would currently beaccounted for as operating leases as a cash flow use within financing activities under the new standard.
D-88

6. Recent accounting pronouncements and future accounting policy changes:
(a) IFRS 16 - Leases (cont'd)
The Corporation will adopt IFRS 16 in its financial statements for the fiscal year beginning on January 1, 2019.The Corporation intends to apply the modified retrospective approach and will not restate comparative amountsfor the year prior to first adoption. Right-of-use assets will be measured on transition at the amount of the leaseliability on adoption (adjusted for any prepaid or accrued lease expenses). As a transitional practical expedientpermitted by the new standard, the Corporation will not reassess whether contracts are, or contain, leases asat January 1, 2019, that were previously identified as leases applying IAS 17 Leases, and IFRIC 4 Determiningwhether an Arrangement contains a Lease. Only contracts entered into (or changed) after January 1, 2019,will be assessed for being, or containing, leases applying the criteria of the new standard. The Corporationalso intends to apply the practical expedient for leases that have duration of 12 months or less.
Based on the analysis completed to date of the Corporation’s leasing arrangements as of December 31, 2018,on adoption of the new standard on January 1, 2019, the Corporation expects to recognize right-of-use assetsof between $9,000,000 and $11,000,000, net of lease incentives (primarily deferred lease inducements) ofapproximately $2,000,000, and lease liabilities of between $13,000,000 and $15,000,000.
(b) IFRIC 23 - Uncertainty over Income Tax Treatments
On June 7, 2017, the IASB issued IFRIC Interpretation 23 Uncertainty over Income Tax Treatments. TheInterpretation provides guidance on the accounting for current and deferred tax liabilities and assets incircumstances in which there is uncertainty over income tax treatments. The Interpretation requires:
• an entity to contemplate whether uncertain tax treatments should be considered separately, or togetheras a group, based on which approach provides better predictions of the resolution;
• an entity to determine if it is probable that the tax authorities will accept the uncertain tax treatment; and
• if it is not probable the uncertain tax treatment will be accepted, measure the tax uncertainty basedon the most likely amount of expected value, depending on whichever method better predicts the resolutionof the uncertainty.
The Interpretation is applicable for annual periods beginning on or after January 1, 2019. The Corporation willadopt the Interpretation in its financial statements for the fiscal year beginning on January 1, 2019. Based onan analysis of the Corporation's historic tax filing positions as of January 1, 2019, the Corporation does notexpect the Interpretation to have a material impact on the consolidated financial statements.
(c) Amendments to References to the Conceptual Framework in IFRS Standards
On March 29, 2018 the IASB issued a revised version of its Conceptual Framework for Financial Reporting(“the Framework”) that underpins IFRS Standards. The IASB also issued Amendments to References to theConceptual Framework in IFRS Standards (“the Amendments”) to update references in IFRS Standards toprevious versions of the Conceptual Framework.
Some Standards include references to the 1989 and 2010 versions of the Framework. The IASB has publisheda separate document which contains consequential amendments to affected Standards so that they refer tothe new Framework, with the exception of IFRS 3 Business Combinations which continues to refer to both the1989 and 2010 Frameworks.
Both documents are effective from January 1, 2020 with earlier application permitted. The Company does notintend to adopt the Amendments in its financial statements before the annual period beginning on January 1,2020. The extent of the impact of the change has not yet been determined.
BALLARD POWER SYSTEMS INC.Notes to Consolidated Financial StatementsYears ended December 31, 2018, and 2017(Tabular amounts expressed in thousands of U.S. dollars, except per share amounts and numbers of shares)
D-89

6. Recent accounting pronouncements and future accounting policy changes (cont'd):
(d) Definition of a Business (Amendments to IFRS 3 Business Combinations)
On October 22, 2018 the IASB issued amendments to IFRS 3 Business Combinations, that seek to clarifywhether a transaction results in an asset or a business combination.
The amendments include an election to use a concentration test. This is a simplified assessment that resultsin an asset acquisition if substantially all of the fair value of the gross assets is concentrated in a singleidentifiable asset or a group of similar identifiable assets. If a preparer chooses not to apply the concentrationtest, or the test is failed, then the assessment focuses on the existence of a substantive process.
The amendments apply to businesses acquired in annual reporting periods beginning on or after January 1,2020 with earlier adoption permitted. The Corporation does not intend to adopt the amendments in its financialstatements before the annual reporting period beginning on January 1, 2020. The extent of the impact ofadoption of the amendments has not yet been determined.
e) Definition of Material (Amendments to IAS 1 and IAS 8)
On October 31, 2018 the IASB refined its definition of material and removed the definition of material omissionsor misstatements from IAS 8.
The definition of material has been aligned across IFRS Standards and the Conceptual Framework for FinancialReporting. The amendments provide a definition and explanatory paragraphs in one place. Pursuant to theamendments, information is material if omitting, misstating or obscuring it could reasonably be expected toinfluence decisions that the primary users of general purpose financial statements make on the basis of thosefinancial statements, which provide financial information about a specific reporting entity.
The amendments are effective for annual periods beginning on or after January 1, 2020 with earlier adoptionpermitted. The Corporation does not intend to adopt the amendments in its financial statements before theannual reporting period beginning on January 1, 2020. The extent of the impact of adoption of the amendmentshas not yet been determined.
BALLARD POWER SYSTEMS INC.Notes to Consolidated Financial StatementsYears ended December 31, 2018, and 2017(Tabular amounts expressed in thousands of U.S. dollars, except per share amounts and numbers of shares)
7. Trade and other receivables:
December 31,2018
December 31,2017
Trade accounts receivable $ 21,724 $ 20,439Other receivables 7,706 1,637Contract assets 9,094 1,004
$ 38,524 $ 23,080
Contract assets primarily relate to the Corporation's rights to consideration for work completed but not billed asat December 31, 2018 for engineering services and technology transfer services.
Contract assetsDecember 31,
2018At January 1, 2018 $ 1,004Additions to contract assets 9,030Invoiced during the year (940)At December 31, 2018 $ 9,094
D-90

8. Inventories:
December 31,2018
December 31,2017
Raw materials and consumables $ 15,547 $ 8,663Work-in-progress 10,034 4,694Finished goods 1,460 2,440Service inventory 2,270 1,495
$ 29,311 $ 17,292
In 2018, the amount of raw materials and consumables, finished goods and work-in-progress recognized ascost of product and service revenues amounted to $39,647,000 (2017 - $55,342,000).
In 2018, the write-down of inventories to net realizable value amounted to $1,300,000 (2017 - $611,000) and thereversal of previously recorded write-downs amounted to $409,000 (2017 - $531,000), resulting in a net write-down of $891,000 (2017 - $80,000). Write-downs and reversals are included in either cost of product and servicerevenues, or research and product development expense, depending on the nature of inventory.
BALLARD POWER SYSTEMS INC.Notes to Consolidated Financial StatementsYears ended December 31, 2018, and 2017(Tabular amounts expressed in thousands of U.S. dollars, except per share amounts and numbers of shares)
9. Property, plant and equipment:
December 31, December 31,Net carrying amounts 2018 2017Building under finance lease $ 5,007 $ 5,819Computer equipment 1,639 1,020Furniture and fixtures 67 155Leasehold improvements 1,019 1,624Production and test equipment 13,888 6,696
$ 21,620 $ 15,314
CostDecember 31,
2017 Additions Disposals
Effect ofmovementsin exchange
ratesDecember 31,
2018Building under finance lease $ 12,180 $ — $ — $ — $ 12,180Computer equipment 4,787 1,016 (215) (4) 5,584Furniture and fixtures 1,190 6 (87) (6) 1,103Leasehold improvements 8,246 71 (363) (18) 7,936Production and test equipment 36,431 8,932 (2,047) (6) 43,310
$ 62,834 $ 10,025 $ (2,712) $ (34) $ 70,113
Accumulated depreciation and impairment lossDecember 31,
2017 Depreciation Disposals
Effect ofmovementsin exchange
ratesDecember 31,
2018Building under finance lease $ 6,361 $ 812 $ — $ — $ 7,173Computer equipment 3,767 383 (200) (5) 3,945Furniture and fixtures 1,035 60 (54) (5) 1,036Leasehold improvements 6,622 524 (211) (18) 6,917Production and test equipment 29,735 1,299 (1,607) (5) 29,422
$ 47,520 $ 3,078 $ (2,072) $ (33) $ 48,493
During the year ended December 31, 2018, the Corporation had cash additions of $9,854,000 and non-cashadditions of $171,000 related to an adjustment for asset retirement obligations (note 16).
D-91

9. Property, plant and equipment (cont'd):
CostDecember 31,
2016 Additions Disposals Transfers
Effect ofmovementsin exchange
ratesDecember 31,
2017Building under finance lease $ 12,180 $ — $ — $ — $ — $ 12,180Computer equipment 4,607 390 (169) (54) 13 4,787Furniture and fixtures 1,163 32 (17) — 12 1,190Leasehold improvements 8,794 7 (594) — 39 8,246Production and test equipment 33,053 2,639 (809) 1,532 16 36,431Production and test equipment 2,078 — — (2,078) — —
under finance lease$ 61,875 $ 3,068 $ (1,589) $ (600) $ 80 $ 62,834
Accumulated depreciation andimpairment loss
December 31,2016 Depreciation
Impairmentloss Disposals Transfers
Effect ofmovements
inexchange
ratesDecember 31,
2017Building under finance lease $ 5,549 $ 812 $ — $ — $ — $ — $ 6,361Computer equipment 3,558 365 — (169) — 13 3,767Furniture and fixtures 978 62 — (17) — 12 1,035Leasehold improvements 6,606 566 — (594) — 44 6,622Production and test equipment 28,040 1,366 284 (809) 843 11 29,735Production and test equipment 1,443 — — — (1,443) — —
under finance lease$ 46,174 $ 3,171 $ 284 $ (1,589) $ (600) $ 80 $ 47,520
During the year ended December 31, 2018, the Corporation disposed of certain property, plant and equipmenttotaling $495,000 primarily related to Protonex' Power Manager business (note 27).
Leased assets
The Corporation leases certain assets under finance lease agreements including the Corporation’s head officebuilding in Burnaby, British Columbia (note 17).
Impairment loss
The Corporation recorded an impairment loss on property, plant and equipment of $284,000 in 2017 related to thewrite-off of certain Protonex Solid Oxide Fuel Cell assets to their estimated net realizable value of $50,000 (note28).
BALLARD POWER SYSTEMS INC.Notes to Consolidated Financial StatementsYears ended December 31, 2018, and 2017(Tabular amounts expressed in thousands of U.S. dollars, except per share amounts and numbers of shares)
10. Intangible assets:
December 31,2018
December 31,2017
Intellectual property acquired from UTC $ 1,417 $ 1,864Intellectual property acquired from H2 Logic A/S 43 129Intellectual property acquired from Protonex 787 8,507Internally generated fuel cell intangible assets 1,199 1,690ERP management reporting software system 4,825 5,738Intellectual property acquired by Ballard Power Systems Europe 14 22
$ 8,285 $ 17,950
D-92

10. Intangible assets (cont'd):
Intangible assets Accumulated Net carryingBalance Cost amortization amountAt January 1, 2017 $ 66,171 $ 48,088 $ 18,083Additions to and acquisition of intangible assets 3,376 — 3,376Amortization expense — 2,309 (2,309)Impairment charges (note 28) — 1,200 (1,200)At December 31, 2017 69,547 51,597 17,950Amortization expense — 2,354 (2,354)Disposals (9,138) (1,827) (7,311)At December 31, 2018 $ 60,409 $ 52,124 $ 8,285
Amortization expense on intangible assets is allocated to research and product development expense or generaland administration expense depending upon the nature of the underlying assets. In 2018, amortization of$2,354,000 (2017 - $2,309,000) was recorded.
During the year ended December 31, 2018, the Corporation disposed of intangible assets of $7,311,000 relatedto Protonex' Power Manager business (note 27).
During the year ended December 31, 2017, the Corporation recorded an impairment loss on intellectual propertyof $1,200,000 related to the write-off of certain Protonex Solid Oxide Fuel Cell assets to their estimated net realizablevalue of $nil (note 28).
BALLARD POWER SYSTEMS INC.Notes to Consolidated Financial StatementsYears ended December 31, 2018, and 2017(Tabular amounts expressed in thousands of U.S. dollars, except per share amounts and numbers of shares)
11. Goodwill:
For the purpose of impairment testing, goodwill is allocated to the Corporation’s cash-generating units whichrepresent the lowest level within the Corporation at which the goodwill is monitored for internal managementpurposes, which is not higher than the Corporation’s operating segments (note 32).
Fuel Cell Products and Services
As of December 31, 2018, the aggregate carrying amount of the Corporation’s goodwill is $40,287,000 (2017 -$40,562,000).
During the year ended December 31, 2018, the Corporation adjusted its goodwill downward by $275,000 relatedto the sale of the assets related to Protonex' Power Manager business (note 27).
The impairment testing requires a comparison of the carrying value of the asset to the higher of (i) value in use;and (ii) fair value less costs to sell. Value in use is defined as the present value of future cash flows expected tobe derived from the asset in its current state.
The Corporation’s fair value test is a modified market capitalization assessment, whereby the fair value of the FuelCell Products and Services segment is determined by first calculating the value of the Corporation at December 31,2018 based on the average closing share price in the month of December, adding a reasonable estimated controlpremium to determine the Corporation’s enterprise value on a controlling basis after adjusting for excess cashbalances, and deducting the estimated costs to sell from this enterprise value, arriving at the fair value of the FuelCell Products and Services segment. Based on the fair value test, the Corporation has determined that the fairvalue of the Fuel Cell Products and Services segment exceeds its carrying value as of December 31, 2018.
D-93

11. Goodwill (cont'd):
In addition to the fair value test, the Corporation also performed a value in use test on the Fuel Cell Products andServices segment, comparing the carrying value of the segment to the present value of future cash flows expectedto be derived from the segment. The principal factors used in the discounted cash flow analysis requiring significantestimation are the projected results of operations, the discount rate based on the weighted average cost of capital(“WACC”), and terminal value assumptions. The Corporation’s value in use test was based on a WACC of 10%;an average estimated compound annual growth rate of approximately 23% from 2019 to 2023; and a terminal yearearnings before interest, taxes, depreciation and amortization (“EBITDA”) multiplied by a terminal value multiplierof 10; and a WACC of 8% and a terminal year revenue multiplier of 5 for Weichai Ballard JV. The value in useassessment resulted in an estimated fair value for the Fuel Cell Products and Services segment that is consistentwith the conclusion determined under the fair value, less costs to sell, assessment.
As the recoverable amount of the Fuel Cell Products and Services segment was determined to be greater than itscarrying amount, no impairment loss was recorded in 2018 or 2017.
BALLARD POWER SYSTEMS INC.Notes to Consolidated Financial StatementsYears ended December 31, 2018, and 2017(Tabular amounts expressed in thousands of U.S. dollars, except per share amounts and numbers of shares)
12. Investments:
December 31,2018
December 31,2017
Investment in Synergy Ballard JVCo (note 4) $ — $ 676Investment in Weichai Ballard JV (note 4) 13,989 —Other 5 5
$ 13,994 $ 681
Investment in Synergy Ballard JVCoDecember 31,
2018December 31,
2017Beginning balance $ 676 $ 1,185Adjustment for actual cash contributed to JV — (34)Elimination of 10% profit on MEAs not yet sold or consumed (139) (676)Equity in earnings (loss) (537) 201
$ — $ 676
Of the $1,185,000 beginning balance at January 1, 2017, $972,000 was contributed to the investment inSynergy Ballard JVCo in 2016.
Investment in Weichai Ballard JVDecember 31,
2018December 31,
2017Capital contribution to JV $ 14,286 $ —Incorporation costs 320 —Equity in loss (617) —
$ 13,989 $ —
Weichai Ballard JV is an associate in which the Corporation has significant influence and a 49% ownership interest.
The following table summarizes the financial information of Weichai Ballard JV as included in its own financialstatements as of December 31, 2018, adjusted for foreign exchange differences and the Corporation's accountingpolicies and its own costs incurred to setup.
D-94

12. Investments (cont'd):
2018
Percentage ownership interest 49%
Cash $ 20,107
Prepaid expenses and other current assets 8,856
Trade and other payables (1,123)
Net assets (100%) $ 27,840
Corporation's share of net assets (49%) 13,642
Incorporation costs 320
Foreign exchange 27
Carrying amount of investment in Weichai Ballard JV $ 13,989
Operating expenses 1,259
Net loss (100%) $ 1,259
Corporation's share of net loss (49%) $ 617
At December 31, 2018, as specified in the Equity Joint Venture Agreement, the Corporation is committed tocapital contributions to Weichai Ballard JV as follows:
Less than 1 year $ 20,8391-3 years 34,1984-5 years 9,084Total capital contributions $ 64,121
In February 2019, the Corporation made a committed capital contribution of $14,506,000 (RMB 98,000,000equivalent) to Weichai Ballard JV.
BALLARD POWER SYSTEMS INC.Notes to Consolidated Financial StatementsYears ended December 31, 2018, and 2017(Tabular amounts expressed in thousands of U.S. dollars, except per share amounts and numbers of shares)
13. Bank facilities:
The Corporation has certain bank facilities available to it, which are secured by a hypothecation of the Corporation’scash and cash equivalents.
Operating Facility
The Corporation has a demand revolving facility (“Operating Facility”) in which an operating line of credit of up toCDN $7,000,000 is made available to be drawn upon by the Corporation. The Operating Facility can be utilized tofinance the short-term working capital requirements of the business. Outstanding amounts are charged interestat the bank’s prime rate minus 0.50% per annum and are repayable on demand by the bank.
There was no activity under the Operating Facility in 2018, and there were no outstanding amounts payable onthe Operating Facility as of December 31, 2018 and 2017.
Leasing Facility
The Corporation also has a CDN $1,830,770 capital leasing facility (“Leasing Facility”) which can be utilized tofinance the acquisition and lease of operating equipment. Interest is charged on outstanding amounts at the bank’sprime rate per annum and is repayable on demand by the bank in the event of certain conditions.
At December 31, 2018, $nil (2017 - a nominal amount) was outstanding on the Leasing Facility which is includedin the finance lease liability (note 17).
D-95

13. Bank facilities (cont'd):
Forward Contract Facility (cont'd)
The Corporation also has a CDN $5,000,000 demand revolving line (“Forward Contract Facility”) and a CDN$30,000,000 credit facility (“EncoreFX Facility”), which are both available for use when the Corporation purchasesforward foreign exchange contracts or forward platinum contracts used to hedge against currency and platinumprice fluctuations, respectively.
Periodically, the Corporation uses forward foreign exchange and forward platinum purchase contracts to manageexposure to currency rate fluctuations and platinum price fluctuations. These contracts are recorded at their fairvalue as either assets or liabilities on the balance sheet. Any changes in fair value are either (i) recorded in thestatement of comprehensive income if formally designated and qualified under hedge accounting criteria; or (ii)recorded in the statement of operations if either not designated, or not qualified, under hedge accounting criteria.
At December 31, 2018, the Corporation had outstanding foreign exchange currency contracts to purchase a totalof CDN $17,400,000 (2017 – CDN $12,000,000) at an average rate of 1.30 CDN per U.S. dollar, resulting in anunrealized loss of CDN $777,000 at December 31, 2018 (2017 – unrealized gain of CDN $243,000). The outstandingforeign exchange currency contracts are not qualified under hedge accounting.
BALLARD POWER SYSTEMS INC.Notes to Consolidated Financial StatementsYears ended December 31, 2018, and 2017(Tabular amounts expressed in thousands of U.S. dollars, except per share amounts and numbers of shares)
14. Trade and other payables:
December 31,2018
December 31,2017
Trade accounts payable $ 6,924 $ 13,181Compensation payable 8,505 9,209Other liabilities 5,327 2,491Taxes payable 398 362
$ 21,154 $ 25,243
15. Deferred revenue:
Deferred revenue (i.e. contract liabilities) represents cash received from customers in excess of revenuerecognized on uncompleted contracts.
Deferred revenueDecember 31,
2018At January 1, 2018 $ 8,082Additions to deferred revenue 19,353Revenue recognized during the year (10,754)
At December 31, 2018 $ 16,681
D-96

16. Provisions and other liabilities:
Restructuring Warranty OtherBalance provision provision liabilities TotalAt January 1, 2017 $ 813 $ 2,755 $ 3,864 $ 7,432Provisions made during the year 912 4,540 111 5,563Provisions used/paid during the year (1,424) (905) — (2,329)Provisions reversed during the year (81) (1,198) — (1,279)Effect of movements in exchange rates 28 7 278 313At December 31, 2017 248 5,199 4,253 9,700Provisions made during the year 509 5,474 (63) 5,920Provisions used/paid during the year (560) (1,409) — (1,969)Provisions reversed during the year (2) (208) — (210)Effect of movements in exchange rates (4) (4) (328) (336)At December 31, 2018 $ 191 $ 9,052 $ 3,862 $ 13,105
At December 31, 2017Current $ 248 $ 5,199 $ — $ 5,447Non-current — — 4,253 4,253
$ 248 $ 5,199 $ 4,253 $ 9,700
At December 31, 2018Current $ 191 $ 9,052 $ — $ 9,243Non-current — — 3,862 3,862
$ 191 $ 9,052 $ 3,862 $ 13,105
Restructuring provision
During 2018, restructuring charges relate primarily to a change in operations leadership combined with severanceobligations paid to departed employees at Protonex as a result of the disposition of the Power Manager assetsand associated personnel (note 27).
During 2017, restructuring charges relate primarily to a leadership change in sales and marketing, combined withcost reduction initiatives in the general and administration function and by cost reduction initiatives at Protonex.
Warranty provision
The Corporation recorded $5,474,000 (2017 - $4,540,000) of warranty provisions of which $4,414,000 (2017 -$4,057,000) related to new product sales and $1,060,000 (2017 - $483,000) related to upward warrantyadjustments. This was offset by warranty expenditures of $1,409,000 (2017 - $905,000) and downward warrantyadjustments of $208,000 (2017 - $1,198,000), due primarily to contractual expirations and changes in estimatedand actual costs to repair. The remaining $4,000 (2017 – $7,000 increase) reduction to the warranty provisionrelated to the effect of movements in exchange rates.
Other liabilities: Decommissioning liabilities
A provision for decommissioning liabilities has been recorded for the Corporation’s head office building in Burnaby,British Columbia and is related to estimated site restoration obligations at the end of the lease term. The Corporationhas made certain modifications to the leased building to facilitate the manufacturing and testing of its fuel cellproducts. Consequently, the site restoration obligations relate primarily to dismantling and removing variousmanufacturing and test equipment and restoring the infrastructure of the leased building to its original state of whenthe lease was entered into.
BALLARD POWER SYSTEMS INC.Notes to Consolidated Financial StatementsYears ended December 31, 2018, and 2017(Tabular amounts expressed in thousands of U.S. dollars, except per share amounts and numbers of shares)
D-97

16. Provisions and other liabilities (cont'd):
Due to the long-term nature of the liability, the most significant uncertainty in estimating the provision is the coststhat will be incurred. The Corporation has determined a range of reasonably possible outcomes of the total costsfor the head office building. In determining the fair value of the decommissioning liabilities, the estimated futurecash flows have been discounted at 2.18% per annum (2017 – 2.26%).
The Corporation performed an assessment of the estimated cash flows required to settle the obligations for thebuilding as of December 31, 2018. Based on the assessment, a $171,000 increase in the provision (2017 - $nil)was recorded against decommissioning liabilities, in addition to accretion costs of $36,000 (2017 - $111,000).
The total undiscounted amount of the estimated cash flows required to settle the obligation for the building is$1,825,000 (2017 - $1,773,000) which is expected to be settled at the end of the lease term in 2025.
Other liabilities: Deferred lease inducement
A lease extension and modification agreement was signed in December 2017 for the second building that eliminatedthe decommissioning liability at the end of the new 10 year lease term. The contractual elimination of thedecommissioning liability of $2,768,000 for the second building was treated as a lease inducement and was deferredand amortized on a straight-line basis over the amended 10 year lease term, commencing January 2018.
As at December 31, 2018, the deferred lease inducement amounted to $2,292,000.
BALLARD POWER SYSTEMS INC.Notes to Consolidated Financial StatementsYears ended December 31, 2018, and 2017(Tabular amounts expressed in thousands of U.S. dollars, except per share amounts and numbers of shares)
17. Finance lease liability:
The Corporation leases its head office building under finance lease agreements. The finance lease has an imputedinterest rate of 7.35% per annum and expires in February 2025.
Finance lease liabilities are payable as follows:
December 31, December 31,2018 2017
Building lease $ 631 $ 638Machinery lease — 14Finance lease liability, current $ 631 $ 652
Building lease $ 5,064 $ 6,191Machinery lease — 38Finance lease liability, non-current $ 5,064 $ 6,229
Future minimumPresent value ofminimum lease
At December 31, 2018 lease payments Interest paymentsLess than one year $ 1,023 $ 392 $ 631Between one and five years 4,710 960 3,750More than five years 1,374 60 1,314
$ 7,107 $ 1,412 $ 5,695
Current $ 631Non-current 5,064
$ 5,695
D-98

17. Finance lease liability (cont'd):
Future minimumPresent value ofminimum lease
At December 31, 2017 lease payments Interest paymentsLess than one year $ 1,127 $ 475 $ 652Between one and five years 4,992 1,323 3,669More than five years 2,774 214 2,560
$ 8,893 $ 2,012 $ 6,881
Current $ 652Non-current 6,229
$ 6,881
The finance lease liability consists primarily of the lease of the Corporation's head office building of $5,695,000(2017 - $6,829,000) and machinery leased by its subsidiary, Protonex of $nil (2017 - $52,000).
Deferred gains were also recorded on closing of the finance lease agreement and are amortized over the financelease term. At December 31, 2018, the outstanding deferred gain was $2,566,000 (2017 – $2,982,000).
BALLARD POWER SYSTEMS INC.Notes to Consolidated Financial StatementsYears ended December 31, 2018, and 2017(Tabular amounts expressed in thousands of U.S. dollars, except per share amounts and numbers of shares)
18. Ballard Power Systems Europe A/S non-controlling interests:
On January 5, 2017, the Corporation purchased all of the shares in its European subsidiary held by Dansk IndustriInvest A/S (previously Dantherm Air Handling A/S) for a nominal amount. As a result, the Corporation now owns100% of it subsidiary in Europe, BPSE (formerly Dantherm Power A/S) effective January 5, 2017. The Corporationpreviously held 57% of the shares in BPSE before purchasing the remaining 43% of shares from Dansk IndustriInvest A/S.
The Corporation acquired the remaining shares and obtained the cancellation of debt of $521,000 owed by BPSEto Dansk Industri Invest A/S for $47,000. The cancellation of debt and the removal of non-controlling interestswere recorded as equity transactions resulting in a net increase of $480,000 to equity. There was no impact onthe Corporation's consolidated statement of loss and other comprehensive loss.
19. Employee future benefits:
December 31,2018
December 31,2017
Net defined benefit pension plan liability $ 4,215 $ 4,794Net other post-retirement benefit plan liability 84 120Employee future benefits $ 4,299 $ 4,914
The Corporation maintains a defined benefit pension plan covering existing and former employees in the UnitedStates. The benefits under the pension plan are based on years of service and salary levels accrued as of December31, 2009. In 2009, amendments were made to the defined benefit pension plan to freeze benefits accruing toemployees at their respective years of service and salary levels obtained as of December 31, 2009. Certainemployees in the United States are also eligible for post-retirement healthcare, life insurance, and other benefits.
The Corporation accrues the present value of its obligations under employee future benefit plans and related costs,net of the present value of plan assets.
D-99
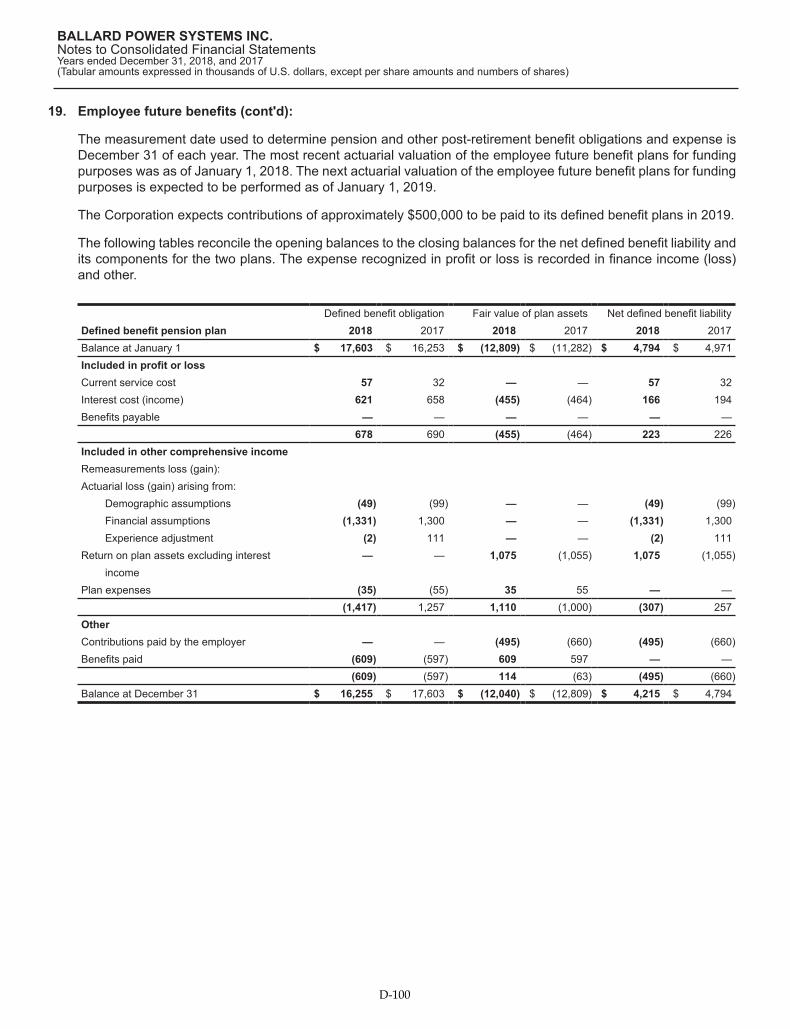
19. Employee future benefits (cont'd):
The measurement date used to determine pension and other post-retirement benefit obligations and expense isDecember 31 of each year. The most recent actuarial valuation of the employee future benefit plans for fundingpurposes was as of January 1, 2018. The next actuarial valuation of the employee future benefit plans for fundingpurposes is expected to be performed as of January 1, 2019.
The Corporation expects contributions of approximately $500,000 to be paid to its defined benefit plans in 2019.
The following tables reconcile the opening balances to the closing balances for the net defined benefit liability andits components for the two plans. The expense recognized in profit or loss is recorded in finance income (loss)and other.
Defined benefit obligation Fair value of plan assets Net defined benefit liabilityDefined benefit pension plan 2018 2017 2018 2017 2018 2017Balance at January 1 $ 17,603 $ 16,253 $ (12,809) $ (11,282) $ 4,794 $ 4,971Included in profit or lossCurrent service cost 57 32 — — 57 32Interest cost (income) 621 658 (455) (464) 166 194Benefits payable — — — — — —
678 690 (455) (464) 223 226Included in other comprehensive incomeRemeasurements loss (gain):Actuarial loss (gain) arising from:
Demographic assumptions (49) (99) — — (49) (99)Financial assumptions (1,331) 1,300 — — (1,331) 1,300Experience adjustment (2) 111 — — (2) 111
Return on plan assets excluding interest — — 1,075 (1,055) 1,075 (1,055)income
Plan expenses (35) (55) 35 55 — —(1,417) 1,257 1,110 (1,000) (307) 257
OtherContributions paid by the employer — — (495) (660) (495) (660)Benefits paid (609) (597) 609 597 — —
(609) (597) 114 (63) (495) (660)Balance at December 31 $ 16,255 $ 17,603 $ (12,040) $ (12,809) $ 4,215 $ 4,794
BALLARD POWER SYSTEMS INC.Notes to Consolidated Financial StatementsYears ended December 31, 2018, and 2017(Tabular amounts expressed in thousands of U.S. dollars, except per share amounts and numbers of shares)
D-100

19. Employee future benefits (cont'd):
Defined benefit obligation Fair value of plan assets Net defined benefit liabilityOther post-retirement benefit plan 2018 2017 2018 2017 2018 2017Balance at January 1 $ 120 $ 196 $ — $ — $ 120 $ 196Included in profit or lossInterest cost (income) 3 4 — — 3 4
3 4 — — 3 4Included in other comprehensive incomeRemeasurements loss (gain):Actuarial loss (gain) arising from:
Demographic assumptions — (1) — — — (1)Financial assumptions (5) 3 — — (5) 3Experience adjustment 7 (53) — — 7 (53)
2 (51) — — $ 2 $ (51)OtherContributions paid by the employer — — (41) (29) (41) (29)Benefits paid (41) (29) 41 29 — —
(41) (29) — — (41) (29)Balance at December 31 $ 84 $ 120 $ — $ — $ 84 $ 120
Included in other comprehensive income (loss)December 31,
2018December 31,
2017Defined benefit pension plan actuarial gain (loss) $ 307 $ (257)Other post-retirement benefit plan actuarial gain (loss) (2) 51
$ 305 $ (206)
Pension plan assets comprise:
2018 2017Cash and cash equivalents 3% 3%Equity securities 59% 60%Debt securities 38% 37%Total 100% 100%
The significant actuarial assumptions adopted in measuring the fair value of benefit obligations at December 31were as follows:
2018 2017
Pension planOther benefit
plan Pension planOther benefit
planDiscount rate 4.16% 3.96% 3.60% 3.27%Rate of compensation increase n/a n/a n/a n/a
The significant actuarial assumptions adopted in determining net expense for the years ended December 31 wereas follows:
2018 2017
Pension planOther benefit
plan Pension planOther benefit
planDiscount rate 3.60% 3.96% 4.13% 3.27%Rate of compensation increase n/a n/a n/a n/a
BALLARD POWER SYSTEMS INC.Notes to Consolidated Financial StatementsYears ended December 31, 2018, and 2017(Tabular amounts expressed in thousands of U.S. dollars, except per share amounts and numbers of shares)
D-101
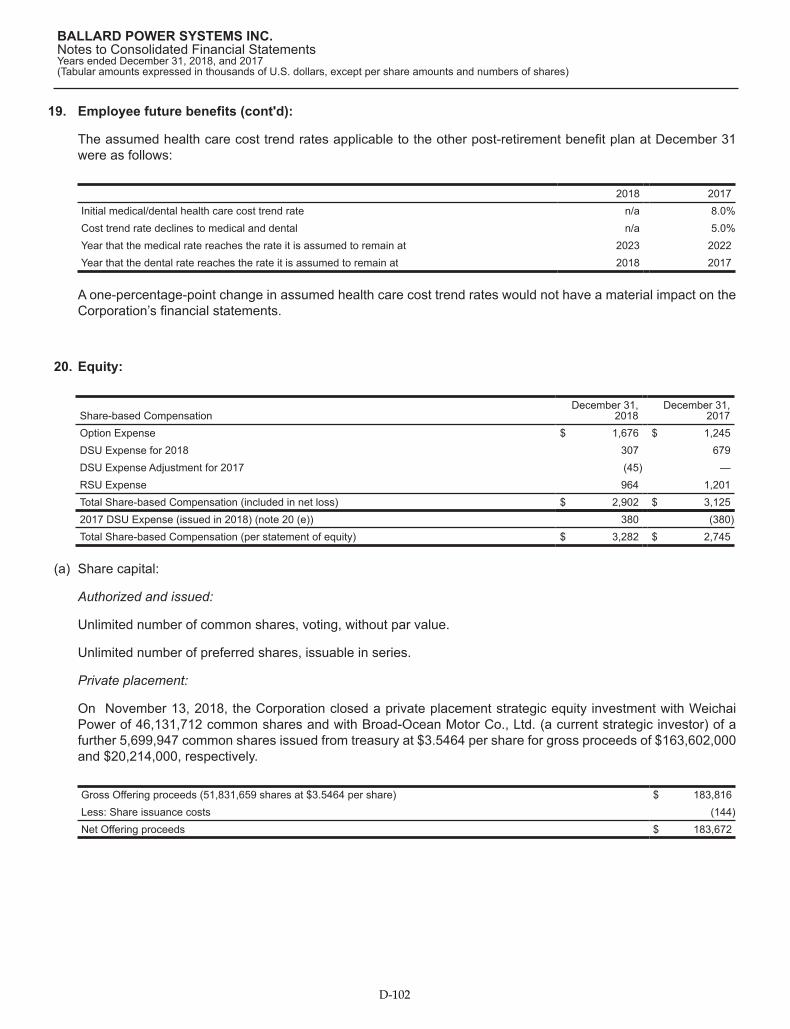
19. Employee future benefits (cont'd):
The assumed health care cost trend rates applicable to the other post-retirement benefit plan at December 31were as follows:
2018 2017Initial medical/dental health care cost trend rate n/a 8.0%Cost trend rate declines to medical and dental n/a 5.0%Year that the medical rate reaches the rate it is assumed to remain at 2023 2022Year that the dental rate reaches the rate it is assumed to remain at 2018 2017
A one-percentage-point change in assumed health care cost trend rates would not have a material impact on theCorporation’s financial statements.
BALLARD POWER SYSTEMS INC.Notes to Consolidated Financial StatementsYears ended December 31, 2018, and 2017(Tabular amounts expressed in thousands of U.S. dollars, except per share amounts and numbers of shares)
20. Equity:
Share-based CompensationDecember 31,
2018December 31,
2017Option Expense $ 1,676 $ 1,245DSU Expense for 2018 307 679DSU Expense Adjustment for 2017 (45) —RSU Expense 964 1,201Total Share-based Compensation (included in net loss) $ 2,902 $ 3,1252017 DSU Expense (issued in 2018) (note 20 (e)) 380 (380)Total Share-based Compensation (per statement of equity) $ 3,282 $ 2,745
(a) Share capital:
Authorized and issued:
Unlimited number of common shares, voting, without par value.
Unlimited number of preferred shares, issuable in series.
Private placement:
On November 13, 2018, the Corporation closed a private placement strategic equity investment with WeichaiPower of 46,131,712 common shares and with Broad-Ocean Motor Co., Ltd. (a current strategic investor) of afurther 5,699,947 common shares issued from treasury at $3.5464 per share for gross proceeds of $163,602,000and $20,214,000, respectively.
Gross Offering proceeds (51,831,659 shares at $3.5464 per share) $ 183,816Less: Share issuance costs (144)Net Offering proceeds $ 183,672
D-102
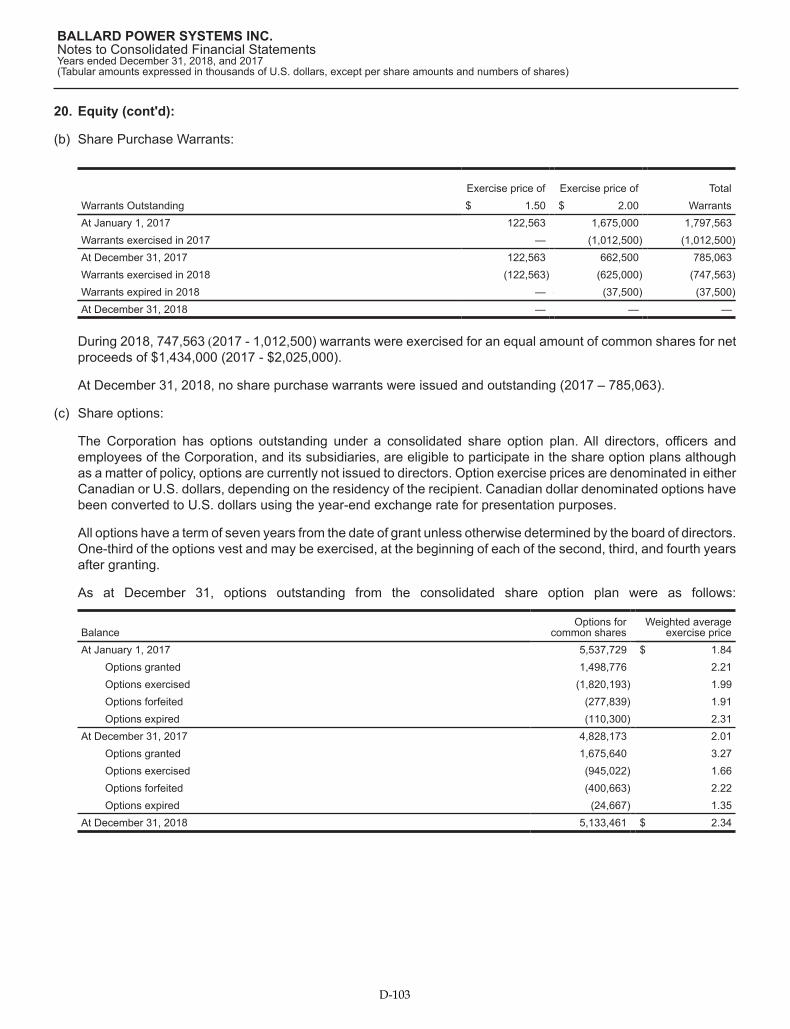
20. Equity (cont'd):
(b) Share Purchase Warrants:
Exercise price of Exercise price of TotalWarrants Outstanding $ 1.50 $ 2.00 WarrantsAt January 1, 2017 122,563 1,675,000 1,797,563Warrants exercised in 2017 — (1,012,500) (1,012,500)At December 31, 2017 122,563 662,500 785,063Warrants exercised in 2018 (122,563) (625,000) (747,563)Warrants expired in 2018 — — (37,500) (37,500)At December 31, 2018 — — —
During 2018, 747,563 (2017 - 1,012,500) warrants were exercised for an equal amount of common shares for netproceeds of $1,434,000 (2017 - $2,025,000).
At December 31, 2018, no share purchase warrants were issued and outstanding (2017 – 785,063).
(c) Share options:
The Corporation has options outstanding under a consolidated share option plan. All directors, officers andemployees of the Corporation, and its subsidiaries, are eligible to participate in the share option plans althoughas a matter of policy, options are currently not issued to directors. Option exercise prices are denominated in eitherCanadian or U.S. dollars, depending on the residency of the recipient. Canadian dollar denominated options havebeen converted to U.S. dollars using the year-end exchange rate for presentation purposes.
All options have a term of seven years from the date of grant unless otherwise determined by the board of directors.One-third of the options vest and may be exercised, at the beginning of each of the second, third, and fourth yearsafter granting.
As at December 31, options outstanding from the consolidated share option plan were as follows:
BalanceOptions for
common sharesWeighted average
exercise priceAt January 1, 2017 5,537,729 $ 1.84
Options granted 1,498,776 2.21Options exercised (1,820,193) 1.99Options forfeited (277,839) 1.91Options expired (110,300) 2.31
At December 31, 2017 4,828,173 2.01Options granted 1,675,640 3.27Options exercised (945,022) 1.66Options forfeited (400,663) 2.22Options expired (24,667) 1.35
At December 31, 2018 5,133,461 $ 2.34
BALLARD POWER SYSTEMS INC.Notes to Consolidated Financial StatementsYears ended December 31, 2018, and 2017(Tabular amounts expressed in thousands of U.S. dollars, except per share amounts and numbers of shares)
D-103

20. Equity (cont'd):
(c) Share options (cont'd):
The following table summarizes information about the Corporation’s share options outstanding as at December 31,2018:
Options outstanding Options exercisable
Number
Weightedaverage
remainingcontractual life
Weightedaverageexercise Number
Weightedaverage
Range of exercise price outstanding (years) price exercisable exercise price$0.83 - $1.19 208,167 1.2 $ 0.90 208,167 $ 0.90$1.23 - $1.96 1,689,154 4.6 1.64 736,818 1.51$2.00 - $2.74 1,994,924 3.9 2.39 1,441,920 2.32$2.80 - $3.74 1,241,216 6.0 3.48 68,190 3.21
5,133,461 4.5 $ 2.34 2,455,095 $ 1.98
During 2018, 945,022 options were exercised for an equal amount of common shares for proceeds of $1,628,000.During 2017, 1,820,193 options were exercised for an equal amount of common shares for proceeds of $3,598,000 .
During 2018, options to purchase 1,675,640 common shares were granted with a weighted average fair value of$1.70 (2017 – 1,498,776 options and $1.09 fair value). The granted options vest annually over three years.
The fair values of the options granted were determined using the Black-Scholes valuation model under thefollowing weighted average assumptions:
2018 2017Expected life 4 years 4 yearsExpected dividends Nil NilExpected volatility 64% 70%Risk-free interest rate 2% 1%
As at December 31, 2018, options to purchase 5,133,461 common shares were outstanding (2017 – 4,828,173).During 2018, compensation expense of $1,676,000 (2017 – $1,245,000) was recorded in net loss based on thegrant date fair value of the awards recognized over the vesting period.
(d) Share distribution plan:
The Corporation has a consolidated share distribution plan that permits the issuance of common shares for nocash consideration to employees of the Corporation to recognize their past contribution and to encourage futurecontribution to the Corporation. At December 31, 2018, there were 12,051,923 (2017 – 11,617,902) sharesavailable to be issued under this plan.
During 2017 and 2018, no shares were issued under this plan and therefore no compensation expense wasrecorded against income.
(e) Deferred share units:
Deferred share units (“DSUs”) are granted to the board of directors and executives. Eligible directors must electto receive at least half of their annual retainers and executives may elect to receive all or part of their annualbonuses in DSUs. Each DSU is redeemable for one common share in the capital of the Corporation after thedirector or executive ceases to provide services to the Corporation. Shares will be issued from the Corporation’sshare distribution plan.
BALLARD POWER SYSTEMS INC.Notes to Consolidated Financial StatementsYears ended December 31, 2018, and 2017(Tabular amounts expressed in thousands of U.S. dollars, except per share amounts and numbers of shares)
D-104

20. Equity (cont'd):(e) Deferred share units (cont'd):
Balance DSUs for common sharesAt January 1, 2017 1,125,250
DSUs granted 87,682DSUs exercised (347,588)
At December 31, 2017 865,344DSUs granted 179,469DSUs exercised (297,600)
At December 31, 2018 747,213
During 2018, $307,000 of compensation expense was recorded in net loss relating to 91,361 DSUs granted duringthe year. For the remaining 88,108 DSUs granted during the year, estimated compensation expense of $380,000was recorded in net income in 2017. Upon the issuance of the DSUs in 2018, a $45,000 adjustment increasingnet income was recorded.
During 2017, $679,000 of compensation expense was recorded in net loss, of which $299,000 related to DSUsgranted during the year. The remaining $380,000 related to compensation expense recorded in 2017 for DSUsultimately issued in 2018.
During 2018, 297,600 DSUs (2017 – 347,588) were exercised, net of applicable taxes, which resulted in theissuance of 154,752 common shares (2017 – 181,788).
As at December 31, 2018, 747,213 deferred share units were outstanding (2017 – 865,344).
(f) Restricted share units:
Restricted share units (“RSUs”) are granted to employees and executives. Each RSU is convertible into onecommon share. The RSUs vest after a specified number of years from the date of issuance, and under certaincircumstances, are contingent on achieving specified performance criteria. A performance factor adjustment ismade if there is an over-achievement of specified performance criteria, resulting in additional RSUs being convertedand likewise if there is an under-achievement of specified performance criteria, a lower number of RSUs will beconverted.
The Corporation has two plans under which RSUs may be granted, the consolidated share distribution plan andthe market purchase RSU plan. Awards under the consolidated share distribution plan (note 20(d)) are satisfiedby the issuance of treasury shares on maturity. Awards granted under the market purchase RSU Plan are satisfiedby shares purchased on the open market by a trust established for that purpose. No common shares wererepurchased in 2018 and 2017.
RSUs for common sharesAt January 1, 2017 1,473,408
RSUs granted 735,978RSU performance factor adjustment 186,083RSUs exercised (560,677)RSUs forfeited (160,155)
At December 31, 2017 1,674,637RSUs granted 379,257RSU performance factor adjustment 218,213RSUs exercised (290,820)RSUs forfeited (203,095)
At December 31, 2018 1,778,192
BALLARD POWER SYSTEMS INC.Notes to Consolidated Financial StatementsYears ended December 31, 2018, and 2017(Tabular amounts expressed in thousands of U.S. dollars, except per share amounts and numbers of shares)
D-105

20. Equity (cont'd):
(f) Restricted share units (cont'd):
During 2018, 379,257 RSUs were issued (2017 – 735,978). The fair value of RSU grants is measured based onthe stock price of the shares underlying the RSU on the date of grant. During 2018, compensation expense of$964,000 (2017 - $1,201,000) was recorded in net loss.
During 2018, 290,820 RSUs (2017 – 560,677) were exercised, net of applicable taxes, which resulted in theissuance of 149,980 common shares (2017 – 298,556).
As at December 31, 2018, 1,778,192 RSUs were outstanding (2017 – 1,674,637).
BALLARD POWER SYSTEMS INC.Notes to Consolidated Financial StatementsYears ended December 31, 2018, and 2017(Tabular amounts expressed in thousands of U.S. dollars, except per share amounts and numbers of shares)
21. Operating leases:
In addition to other minor operating leases, the Corporation leases a facility at its Burnaby, Canada location (whichhas been assessed as an operating lease). This facility had a lease term expiring in 2019 which was extended to2027 under a lease extension and modification agreement signed in December 2017. During 2018, lease paymentsof $2,144,000 relating to this lease were expensed (2017 - $2,107,000).
At December 31, 2018, the Corporation is committed to payments under all operating leases as follows:
Less than 1 year $ 2,3351-3 years 4,4364-5 years 4,148Thereafter 6,851Total minimum lease payments $ 17,770
22. Commitments and contingencies:
In connection with the acquisition of intellectual property from UTC in April 2014, the Corporation retains a royaltyobligation in certain circumstances to pay UTC a portion of any future intellectual property sale and licensingincome generated from certain of the Corporation's intellectual property portfolio for a period of 15 years expiringin April 2029. No royalties were paid to UTC in the years ended December 31, 2018 and December 31, 2017.
The Corporation retains a previous funding obligation to pay royalties of 2% of revenues, to a maximum of$4,613,000 (CDN $5,351,000), on sales of certain fuel cell products for commercial distributed utility applications.As of December 31, 2018, no royalties have been incurred to date for this agreement.
The Corporation also retains a previous funding obligation to pay royalties of 2% of revenues, to a maximum of$1,896,000 (CDN $2,200,000), on sales of certain fuel cell products for commercial transit applications. As ofDecember 31, 2018, no royalties have been incurred to date for this agreement.
At December 31, 2018, the Corporation has outstanding commitments aggregating up to a maximum of $2,911,000(2017 - $3,049,000) relating primarily to purchases of property, plant and equipment.
The Corporation is committed to capital contributions to Weichai Ballard JV over a four year period (note 12).
In January, February and April 2018, certain related class action complaints were filed in U.S. Federal Court allegingviolations of U.S. federal securities laws. In April 2018, plaintiffs voluntarily dismissed all but one of their cases,Porwal v. Ballard Power Systems, Inc. et al (S.D.N.Y.). Under the current scheduling order in this action, Plaintiffsfiled an amended complaint on June 22, 2018. The Corporation will vigorously contest, and defend against, thecomplaints and believes the complaints are without merit.
D-106

23. Disaggregation of revenue:
The Corporation's operations and main revenue streams are the same as those described in note 4. TheCorporation's revenue is derived from contracts with customers.
As disclosed in note 3, the application of IFRS 15 Revenue from Contracts with Customers at January 1, 2018 didnot have a material impact on the Corporation's consolidated financial statements.
In the following table, revenue is disaggregated by geographical market, by market application, and by timing ofrevenue recognition.
December 31, December 31,2018 2017
Geographical marketsChina $ 30,791 $ 76,558Europe 37,590 26,145North America 23,871 15,425Other 4,334 3,160
$ 96,586 $ 121,288Market applicationHeavy Duty Motive 39,464 63,684Portable Power 7,109 4,468Material Handling 8,010 7,535Back Up Power 2,426 1,933Technology Solutions 39,577 43,668
$ 96,586 $ 121,288Timing of revenue recognitionProducts transferred at a point in time 53,729 73,840Products and services transferred over time 42,857 47,448
$ 96,586 $ 121,288
BALLARD POWER SYSTEMS INC.Notes to Consolidated Financial StatementsYears ended December 31, 2018, and 2017(Tabular amounts expressed in thousands of U.S. dollars, except per share amounts and numbers of shares)
24. Personnel expenses:
Personnel expenses are included in cost of product and service revenues, research and product developmentexpense, general and administrative expense, sales and marketing expense, and other expense.
December 31,2018
December 31,2017
Salaries and employee benefits $ 46,381 $ 44,763Share-based compensation (note 20) 2,902 3,125
$ 49,283 $ 47,888
25. Other operating expense:
December 31,2018
December 31,2017
Net impairment loss on trade receivables $ 98 $ 103Restructuring expense 507 799
$ 605 $ 902
D-107

25. Other operating expense (cont'd):
In 2018, the Corporation recorded net impairment losses of $98,000 (2017 - $103,000) primarily due to amountsthat remained uncollected. In the event that the Corporation recovers any amounts previously recorded asimpairment losses, the recovered amount will be recognized as a reversal of the impairment loss in the period ofrecovery.
During 2018, restructuring charges of $507,000 relate primarily to a change in operations leadership combinedwith severance obligations paid to departed employees at Protonex as a result of the disposition of the PowerManager assets and associated personnel (note 27).
During 2017, restructuring charges of $799,000 relate primarily to a leadership change in sales and marketing,combined with cost reduction initiatives in the general and administrative function and by cost reduction initiativesat Protonex.
BALLARD POWER SYSTEMS INC.Notes to Consolidated Financial StatementsYears ended December 31, 2018, and 2017(Tabular amounts expressed in thousands of U.S. dollars, except per share amounts and numbers of shares)
26. Finance income and expense:
2018 2017Employee future benefit plan expense (note 19) $ (226) $ (230)Pension administration expense (117) (118)Investment and other income 1,034 417Other income (loss) (62) 19Foreign exchange gain (loss) (1,078) 1,692Finance income (loss) and other $ (449) $ 1,780Finance expense $ (503) $ (732)
27. Loss on sale of assets:
2018 2017Loss on sale of Power Manager assets $ (3,957) $ —Loss on sale of SOFC assets (94) (508)Loss on sale of Telecom Backup Power assets — (866)Gain on miscellaneous disposals 2 9
$ (4,049) $ (1,365)
2018 2017Cash proceeds received on sale of Power Manager assets $ 2,000 $ —Less: Disposition costs (707) —Net cash proceeds received on sale of Power Manager assets $ 1,293 —Cash proceeds received on sale of SOFC assets 50 —Cash proceeds received on sale of Telecom Backup Power assets — 972Cash proceeds from miscellaneous disposals 2 9Net cash proceeds received on sale of assets $ 1,345 $ 981
D-108

27. Loss on sale of assets (cont'd):
Loss on sale of Power Manager assets
During the year ended December 31, 2018, the Corporation divested certain assets of Protonex related to its PowerManager business while retaining certain Protonex assets related to fuel cell propulsion systems for the unmannedsystems market. The Power Manager assets were sold to Revision, a private U.S. based company. At closing,the Corporation received initial proceeds of $2,000,000, a $2,132,000 note receivable payable in the second quarterof 2019, and may receive up to a further $11,250,000, based on achievement of specific sales objectives duringa 12-month earn-out period. During the year ended December 31, 2018, the Corporation recorded a loss on saleof these assets of $3,957,000 after estimating the amount of variable consideration included in the transactionprice that is constrained to be $2,000,000, as opposed to the above noted maximum possible earn-out amount of$11,250,000. The estimate of the ultimate transaction price, including the estimate of the amount of earn-outvariable consideration that is considered constrained of $2,000,000, will be reassessed each quarter-end during2019. Any change in the estimated transaction price will result in an adjustment to the above noted loss on saleof assets which will be recognized on a prospective basis.
Cash proceeds received in 2018 $ 2,000Note receivable as of December 31, 2018 2,132Proceeds receivable (constrained estimate of earn-out payments) 2,000Total proceeds 6,132Less: Disposition costs (707)Net proceeds 5,425Less: Net book value of disposed assets (9,382)Loss on sale of assets in 2018 $ (3,957)
Loss on sale of SOFC assets
During the year ended December 31, 2017, the Corporation performed a strategic review of its subsidiary, Protonex,specifically its Solid Oxide Fuel Cells ("SOFC") business. As a result, certain SOFC assets were transferred to aprivate start-up company, Upstart Power Inc. ("Upstart"), effective December 31, 2017 for nominal consideration,resulting in a loss on sale of assets of $508,000. Upstart also received an Option to Purchase certain property,plant and equipment that was used primarily for SOFC fuel cell development. This Equipment Purchase Optionwas exercised in August 2018, resulting in cash proceeds of $50,000 and a further loss on sale of property, plantand equipment of $94,000.
Loss on sale of Telecom Backup Power assets
During the year ended December 31, 2017, the Corporation recorded an additional loss on sale of assets of$866,000 as the remaining potential purchase price was written down to its revised estimatedfair value of $nil.
BALLARD POWER SYSTEMS INC.Notes to Consolidated Financial StatementsYears ended December 31, 2018, and 2017(Tabular amounts expressed in thousands of U.S. dollars, except per share amounts and numbers of shares)
28. Impairment charges on intangible assets and property, plant and equipment:
During the year ended December 31, 2017, the Corporation recorded total impairment losses of $1,484,000,consisting of a $1,200,000 impairment charge on intangible assets and a $284,000 impairment charge on property,plant and equipment as the Corporation wrote-off certain SOFC assets to their estimated net realizable value of$50,000. The impairment charges were incurred as a result of the Corporation's divestiture of its SOFC assets toUpstart Power (note 27).
D-109

29. Income taxes:
(a) Current tax expense:
The components of income tax benefit (expense) included in the determination of the profit (loss) from continuingoperations comprise of:
2018 2017Current tax expenseCurrent period income tax $ 51 $ 34Withholding tax 319 1,537Total current tax expense $ 370 $ 1,571Deferred tax expenseOrigination and reversal of temporary differences $ 1,834 $ (13,227)Adjustments for prior periods (1,138) (1,922)Change in unrecognized deductible temporary differences (696) 15,149Total deferred tax expense $ — $ —
Total income tax expense $ 370 $ 1,571
The Corporation’s effective income tax rate differs from the combined Canadian federal and provincial statutoryincome tax rate for companies. The principal factors causing the difference are as follows:
2018 2017Net loss before income taxes $ (26,953) $ (6,477)Expected tax recovery at 27.00% (2017 – 26.00%) $ (7,277) $ (1,684)Increase (reduction) in income taxes resulting from:
Non-deductible expenses 1,009 362Investment tax credits earned (2,439) (1,300)Foreign tax rate differences 227 (1,341)Change in unrecognized deductible temporary differences 8,531 3,997Other 319 1,537
Income taxes $ 370 $ 1,571
(b) Unrecognized deferred tax liabilities:
At December 31, 2018, the Corporation did not have any deferred tax liabilities resulting from taxable temporarydifferences related to unremitted earnings of controlled subsidiaries.
(c) Unrecognized deferred tax asset:
At December 31, 2018, the Corporation did not recognize any deferred tax assets resulting from the followingdeductible temporary differences for financial statement and income tax purposes.
2018 2017Scientific research expenditures $ 83,661 $ 81,459Accrued warranty provision 15,892 14,209Share issuance costs 668 982Losses from operations carried forward 107,339 110,851Investment tax credits 30,231 29,473Property, plant and equipment and intangible assets 168,311 173,928
$ 406,102 $ 410,902
BALLARD POWER SYSTEMS INC.Notes to Consolidated Financial StatementsYears ended December 31, 2018, and 2017(Tabular amounts expressed in thousands of U.S. dollars, except per share amounts and numbers of shares)
D-110
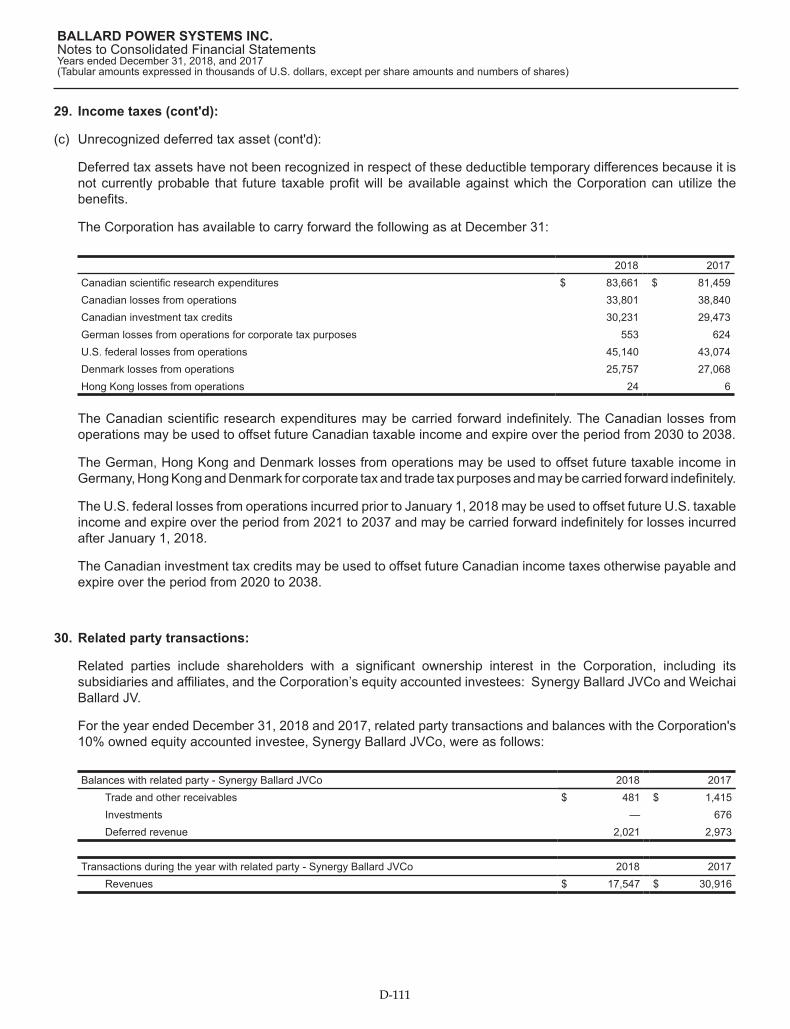
29. Income taxes (cont'd):
(c) Unrecognized deferred tax asset (cont'd):
Deferred tax assets have not been recognized in respect of these deductible temporary differences because it isnot currently probable that future taxable profit will be available against which the Corporation can utilize thebenefits.
The Corporation has available to carry forward the following as at December 31:
2018 2017Canadian scientific research expenditures $ 83,661 $ 81,459Canadian losses from operations 33,801 38,840Canadian investment tax credits 30,231 29,473German losses from operations for corporate tax purposes 553 624U.S. federal losses from operations 45,140 43,074Denmark losses from operations 25,757 27,068Hong Kong losses from operations 24 6
The Canadian scientific research expenditures may be carried forward indefinitely. The Canadian losses fromoperations may be used to offset future Canadian taxable income and expire over the period from 2030 to 2038.
The German, Hong Kong and Denmark losses from operations may be used to offset future taxable income inGermany, Hong Kong and Denmark for corporate tax and trade tax purposes and may be carried forward indefinitely.
The U.S. federal losses from operations incurred prior to January 1, 2018 may be used to offset future U.S. taxableincome and expire over the period from 2021 to 2037 and may be carried forward indefinitely for losses incurredafter January 1, 2018.
The Canadian investment tax credits may be used to offset future Canadian income taxes otherwise payable andexpire over the period from 2020 to 2038.
BALLARD POWER SYSTEMS INC.Notes to Consolidated Financial StatementsYears ended December 31, 2018, and 2017(Tabular amounts expressed in thousands of U.S. dollars, except per share amounts and numbers of shares)
30. Related party transactions:
Related parties include shareholders with a significant ownership interest in the Corporation, including itssubsidiaries and affiliates, and the Corporation’s equity accounted investees: Synergy Ballard JVCo and WeichaiBallard JV.
For the year ended December 31, 2018 and 2017, related party transactions and balances with the Corporation's10% owned equity accounted investee, Synergy Ballard JVCo, were as follows:
Balances with related party - Synergy Ballard JVCo 2018 2017Trade and other receivables $ 481 $ 1,415Investments — 676Deferred revenue 2,021 2,973
Transactions during the year with related party - Synergy Ballard JVCo 2018 2017Revenues $ 17,547 $ 30,916
D-111

30. Related party transactions (cont'd):
For the year ended December 31, 2018 and 2017, related party transactions and balances with the Corporation's49% owned equity accounted investee, Weichai Ballard JV, were as follows:
Balances with related party - Weichai Ballard JV 2018 2017Trade and other receivables $ 1,123 $ —Investments 13,989 —Deferred revenue 8,875 —
Transactions during the year with related party - Weichai Ballard JV 2018 2017Revenues $ 1,248 $ —
The Corporation provides key management personnel, being board directors and executive officers, certainbenefits, in addition to their salaries. Key management personnel also participate in the Corporation’s share-basedcompensation plans (note 20).
In addition to cash and equity compensation, the Corporation provides the executive officers with certain personalbenefits, including car allowance, medical benefit program, long and short-term disability coverage, life insuranceand an annual medical, financial planning allowance and relocation allowances and services as necessary.
The employment agreements for the executive officers are substantially the same with slight variations by individual.The maximum obligation that is required to be provided in the event of termination is notice of 12 months plus onemonth for every year of employment completed with the Corporation, or payment in lieu of such notice, consistingof the salary, bonus and other benefits that would have been earned during such notice period. If there is a changeof control, and if the executive officer’s employment is terminated, including a constructive dismissal, within 2 yearsfollowing the date of a change of control, the executive officer is entitled to a payment equivalent to payment inlieu of a 24 month notice period. The minimum obligation that is required is limited to that required by employmentstandards legislation plus one day for every full month of employment since hire date, with no distinction made fora change of control situation.
Key management personnel compensation is comprised of:
2018 2017Salaries and employee benefits $ 2,869 $ 3,420Post-employment retirement benefits 49 52Termination benefits 12 516Share-based compensation (note 20) 1,353 1,749
$ 4,283 $ 5,737
BALLARD POWER SYSTEMS INC.Notes to Consolidated Financial StatementsYears ended December 31, 2018, and 2017(Tabular amounts expressed in thousands of U.S. dollars, except per share amounts and numbers of shares)
31. Supplemental disclosure of cash flow information:
Non-cash financing and investing activities: 2018 2017Compensatory shares $ 693 $ 1,003Constrained earn-out receivable on sale of assets 2,000 —
D-112

32. Operating segments:
The Corporation operates in a single segment, Fuel Cell Products and Services, which consists of the design,development, manufacture, sale and service of PEM fuel cell products for a variety of applications, focusing onthe power product markets of Heavy-Duty Motive (consisting of bus, truck, rail and marine applications), PortablePower / UAV, Material Handling and Backup Power, as well as the delivery of Technology Solutions, includingengineering services, technology transfer and the licensing and sale of the Corporation’s extensive intellectualproperty portfolio and fundamental knowledge for a variety of fuel cell applications.
As a result of the sale of the Power Manager assets (note 27) in 2018, the Corporation has renamed the formerPortable Power market as the Portable Power / UAV market. As the sale of the Power Manager assets is notpresented as a discontinued operation, the Portable Power / UAV market includes revenues associated with thePower Manager business prior to its sale, and product and service revenues generated from the retained Protonexassets related primarily to fuel cell propulsion systems for unmanned systems.
In 2018, revenues included sales to two individual customers of $26,587,000 and $17,547,000, respectively, whicheach exceeded 10% of total revenue.
In 2017, revenues included sales to three individual customers of $31,080,000, $30,555,000 and $17,989,000,respectively, which each exceeded 10% of total revenue.
Revenues from continuing operations by geographic area, which are attributed to countries based on customerlocation for the years ended December 31, are as follows:
Revenues 2018 2017China $ 30,791 $ 76,558Germany 28,685 18,984U.S. 23,505 14,881Japan 3,901 2,579Belgium 3,531 308Denmark 1,889 808UK 1,431 943Netherlands 892 374Canada 366 551Taiwan 287 483France 276 1,755Poland 213 2,455Finland 198 379Norway 187 37Spain 168 5Other countries 266 188
$ 96,586 $ 121,288
Non-current assets by geographic area are as follows:
December 31, December 31,Non-current assets 2018 2017Canada $ 65,346 $ 60,481U.S. 4,880 13,622China 14,012 692Denmark 269 60
$ 84,507 $ 74,855
BALLARD POWER SYSTEMS INC.Notes to Consolidated Financial StatementsYears ended December 31, 2018, and 2017(Tabular amounts expressed in thousands of U.S. dollars, except per share amounts and numbers of shares)
D-113

33. Financial instruments:
(a) Fair value:
The Corporation’s financial instruments consist of cash and cash equivalents, trade and other receivables,investments, and trade and other payables. The fair values of cash and cash equivalents, trade and otherreceivables, and trade and other payables approximate their carrying values because of the short-term nature ofthese instruments.
Fair value measurements recognized in the statement of financial position must be categorized in accordance withthe following levels:
(i) Level 1: Quoted prices (unadjusted) in active markets for identical assets or liabilities;
(ii) Level 2: Inputs other than quoted prices included in Level 1 that are observable for the asset or liability,either directly (i.e. as prices) or indirectly (i.e. derived from prices);
(iii) Level 3: Inputs for the asset or liability that are not based on observable market data (unobservable inputs).
(b) Financial risk management:
The Corporation primarily has exposure to foreign currency exchange rate risk, commodity risk, interest rate risk,and credit risk.
Foreign currency exchange rate risk
Foreign currency exchange rate risk is the risk that the fair value of deferred cash flows of a financial instrumentwill fluctuate because of changes in foreign exchange rates. The Corporation is exposed to currency risks primarilydue to its holdings of Canadian dollar denominated cash equivalents and its Canadian dollar denominatedpurchases and accounts payable. Substantially all receivables are denominated in U.S. dollars.
The Corporation limits its exposure to foreign currency risk by holding Canadian denominated cash and cashequivalents in amounts up to 100% of forecasted twelve month Canadian dollar net expenditures and up to 50%of the following twelve months of forecasted Canadian dollar net expenditures, thereby creating an economichedge. Periodically, the Corporation also enters into forward foreign exchange contracts to further limit its exposure.At December 31, 2018, the Corporation held Canadian dollar denominated cash and cash equivalents of CDN$18,490,000 and outstanding forward foreign exchange contracts to sell a total of CDN $17,400,000 in 2018 at anaverage rate of CDN $1.30 to US $1.00.
The following exchange rates applied during the year ended December 31, 2018:
$U.S. to $1.00 CDN $CDN to $1.00 U.S.January 1, 2018 Opening rate $0.798 $1.254December 31, 2018 Closing rate $0.734 $1.363Fiscal 2018 Average rate $0.772 $1.296
Based on cash and cash equivalents and forward foreign exchange contracts held at December 31, 2018, a 10%increase in the Canadian dollar against the U.S. dollar, with all other variables held constant, would result in anincrease in foreign exchange gains of approximately $2,633,000 recorded against net income.
If the Canadian dollar weakened 10% against the U.S. dollar, there would be an equal, and opposite impact, onnet income. This sensitivity analysis includes foreign currency denominated monetary items, and adjusts theirtranslation at year-end, for a 10% change in foreign currency rates.
BALLARD POWER SYSTEMS INC.Notes to Consolidated Financial StatementsYears ended December 31, 2018, and 2017(Tabular amounts expressed in thousands of U.S. dollars, except per share amounts and numbers of shares)
D-114

33. Financial instruments (cont'd):
(b) Financial risk management (cont'd):
Commodity risk
Commodity risk is the risk of financial loss due to fluctuations in commodity prices, in particular, for the price ofplatinum and palladium, which are key components of the Corporation’s fuel cell products. Platinum and palladiumare scarce natural resources and therefore the Corporation is dependent upon a sufficient supply of thesecommodities. To manage its exposure to commodity price fluctuations, the Corporation may include platinum andor palladium pricing adjustments directly into certain significant customer contracts, and may also periodically enterinto platinum and or palladium forward contracts. At December 31, 2018, there were no outstanding forwardplatinum contracts under the Forward Contract Facility.
Interest rate risk
Interest rate risk is the risk that the fair value of deferred cash flows of a financial instrument will fluctuate becauseof changes in market interest rates. The Corporation is exposed to interest rate risk arising primarily from fluctuationsin interest rates on its cash and cash equivalents. The Corporation limits its exposure to interest rate risk bycontinually monitoring and adjusting portfolio duration to align to forecasted cash requirements and anticipatedchanges in interest rates.
Based on cash and cash equivalents at December 31, 2018, a 0.25% decline in interest rates, with all other variablesheld constant, would result in a decrease in investment income of $481,000. If interest rates had been 0.25%higher, there would be an equal and opposite impact on net income.
Credit risk
Credit risk is the risk of financial loss to the Corporation if a counterparty to a financial instrument fails to meet itscontractual obligations and arises principally from the Corporation’s accounts receivable. The Corporation managesits exposure to credit risk on accounts receivable by assessing the ability of counterparties to fulfill their obligationsunder the related contracts prior to entering into such contracts, and continuously monitors these exposures.
BALLARD POWER SYSTEMS INC.Notes to Consolidated Financial StatementsYears ended December 31, 2018, and 2017(Tabular amounts expressed in thousands of U.S. dollars, except per share amounts and numbers of shares)
34. Subsequent Event:
In February 2019, the Corporation made a committed capital contribution of $14,506,000 (RMB 98,000,000equivalent) to Weichai Ballard JV (note 12).
D-115

This page intentionally left blank.
CORPORATE INFORMATION
CORPORATE OFFICES EXECUTIVE MANAGEMENT BOARD OF DIRECTORS Ballard Power Systems Inc. Corporate Headquarters 9000 Glenlyon Parkway Burnaby, BC Canada V5J 5J8 T: 604.454.0900 F: 604.412.4700 TRANSFER AGENT Computershare Trust Company of Canada Shareholder Services Department 510 Burrard Street Vancouver, BC Canada V6C 3B9 T: 1.800.564.6253 F: 1.866.249.7775 STOCK LISTING Ballard’s common shares are listed on the Toronto Stock Exchange and on the NASDAQ Global Market under the trading symbol BLDP. INVESTOR RELATIONS To obtain additional information, please contact: Ballard Power Systems Investor Relations 9000 Glenlyon Parkway Burnaby, BC Canada V5J 5J8 T: 604.412.3195 E: [email protected] W: www.ballard.com
R. Randall MacEwen President & Chief Executive Officer Robert Campbell Vice President & Chief Commercial Officer Tony Guglielmin Vice President & Chief Financial Officer Kevin Colbow Vice President, Technology and Product Development Jyoti Sidhu Vice President, Operations Jan Laishley Vice President, Human Resources INDEPENDENT AUDITORS KPMG LLP Vancouver, BC Canada
LEGAL COUNSEL Canada: Stikeman Elliott, LLP Vancouver, BC Canada United States: Dorsey & Whitney LLP Seattle, WA USA Intellectual Property: Seed Intellectual Property Law Group, LLC Seattle, WA USA
Douglas P. Hayhurst Corporate Director British Columbia, Canada Kevin Jiang Corporate Director Shandong, China Duy-Loan Le Corporate Director Texas, USA R. Randall MacEwen President & Chief Executive Officer British Columbia, Canada Marty Neese Corporate Director California, USA James Roche Chairman of the Board Ontario, Canada Sherman Sun Corporate Director Shandong, China Ian Sutcliffe Corporate Director Ontario, Canada Janet Woodruff Corporate Director British Columbia, Canada

www.ballard.com
Recommended