Media Streaming Observations: Trends in UDP toTCP Ratio
DongJin Lee, Brian E. Carpenter, Nevil Brownlee{dongjin, brian}@cs.auckland.ac.nz, [email protected]
Department of Computer ScienceThe University of Auckland, New Zealand
Abstract—Widely used protocols (UDP and TCP) are observedfor variations of the UDP to TCP ratio, elastic (and inelastic)flow behaviors, and of port number distribution, both over timeand between different networks. The purpose of the study wasto understand the impact of application trends, especially thegrowth in media streaming, on traffic characteristics. The resultsshowed substantial variability but little sign of a systematic trendover time, and only wide spreads of port number usage. Despitethe large network traces, the ratios appear to be rather dependenton application popularity (and their diversities), and so onecannot extrapolate from usage patterns on one network to thoseon another without allowing for at least as much variability aswe have observed in this work.
Index Terms—network traffic statistics; observation; UDP toTCP ratio; flow; volume; port number; streaming
I. INTRODUCTION
Along with annual bandwidth growth rates reported to be50% to 60% per year both in the U.S. and worldwide [7],Internet traffic types, characteristics and their distributions arealways changing. For example, recent Internet observations[15] [21] find that the majority of traffic and infrastructureshave migrated to a small number of very large providers,such as those supporting cloud computing. Also, it has beenwidely predicted that within a few years, a large majority ofnetwork traffic will be audio and video streaming. Cisco’sVisual Networking Index [4] has been actively involved intraffic forecasting, e.g., Hyperconnectivity and the Approach-ing Zettabyte Era [5]. Those reports assert that in 2010 videowill exceed p2p in volume, becoming the main source of futureIP traffic growth, and over 60% of all consumer Internet trafficwill be video by 2013. They also state that video traffic canchange the economic equation for service providers, giventhat video traffic is many times less valuable per bit thanother content such as SMS service. Additional to the increasedcomputational resources, increases in monitor screen size andits resolution give rise to larger document sizes (such as morepixels in images and videos), thus generating more traffic thanbefore.
A common expectation in the technical community has beenthat streaming traffic would naturally be transmitted over UDP,probably using RTP, or perhaps in future over DCCP. Anotherview is that UDP and TCP might replace IP as the lowestcommon denominator [28] to achieve transparency throughNATs and firewalls. Then, if non-TCP congestion control,signaling or other features are needed, a protocol must be
layered on top of UDP instead of developing a better transportlayer. This, if accompanied by a vast increase in streaming,would change the historic pattern whereby most traffic benefitsfrom TCP’s congestion management. Indeed, if the predictedincrease in streaming traffic were to remove most flows fromany form of congestion control, the consequences would beserious. Therefore, the evolution of the observed UDP to TCPratio in actual Internet traffic is a subject of interest. Also,observing for trends in network statistics such as distributionsof port numbers and flow characteristics are beneficial innetwork management. This paper is an expanded version ofour earlier work on these topics [23].
We note that audio/video ‘streaming’ is not really a well-defined term, and it covers a variety of technologies. Forexample, video-on-demand packets are usually transmittedover TCP; streams are downloaded fully, then played fromthe local copy. This is suitable when the timeliness andbandwidth variability are not crucial. In others such as voice-over-IP solutions, with timeliness a high priority, streams aretransmitted over UDP. Also, recent application advances allowstreaming concepts to be much more diverse, such as p2p-based streaming and practical use of progressive download ona faster-than-real-time basis [25]. Furthermore, some stream-ing applications choose dynamically whether to use UDP, rawTCP or HTTP over TCP.
The UDP to TCP ratio has been briefly observed in [1],where UDP flows are often responsible for the largest fractionof traffic. Their summary indeed suggests that the current ratiocan change with increasing demand for IPTV and UDP-basedreal-time applications. We note that both TCP and UDP trafficare useful in distinctive ways. UDP can be advantageous duelow overheads especially in an organization’s high performingstorage systems, such as in SANs and NFS. In other words,traffic statistics can be largely different by the environmentsand our measurement scope is at Internet scale.
Our expectation was that the growth in streaming trafficwould be reflected in a steady growth in the UDP to TCP ratio,or in a systematic change in the relative usage of various portnumbers, or both. We conducted a preliminary survey on thebasis of readily available data from a variety of measurements,in both commercial and academic networks, between 1998and 2008. It showed that the UDP to TCP ratio, measured bynumber of packets, varied between 5% and 20%, but withno consistent pattern over the ten years. A report in [22]
147
International Journal on Advances in Systems and Measurements, vol 3 no 3 & 4, year 2010, http://www.iariajournals.org/systems_and_measurements/
2010, © Copyright by authors, Published under agreement with IARIA - www.iaria.org
Fig. 1. CAIDA (2008–2009), Left: DirA – 4 weeks (bits), Center: Dir DirA – 20 months (bits), Right: DirB – 4 weeks (flows)
01/01/02 01/01/04 01/01/06 01/01/08 01/01/100
0.1
0.2
0.3
0.4
0.5
Year
UDP/
TCP
Rat
io
Internet2 [Feb−2002 to Nov−2009]
bytespackets
01/01/02 01/01/04 01/01/06 01/01/08 01/01/100
0.2
0.4
0.6
0.8
Year
Frac
tion
Internet2 [Feb−2002 to Nov−2009]
audio/videop2pdataother
Fig. 2. Internet2 (2002-2009), Left: UDP to TCP ratio, Right: volume fractions of four application types (assigned from the Internet2)
observed an average ratio of 0.07 over the 78 ISPs globally.For Internet2, it was 0.05 in 2002, 0.22 in 2006, and 0.15 in2008. Similar inconsistencies showed up in partial data fromobservations in Norway, Sweden [18], Japan, Germany, theUK, and elsewhere. These inconsistencies were surprising, anddid not suggest a steady growth in UDP streaming. To betterunderstand these issues, we observe how TCP and UDP traffichave varied over the years, either by number of flows, by theirvolume/duration, or by their traffic kinds.
We consider this study to be valuable to service providersand network administrators managing their traffic. This in-cludes outlining observed statistical datasets to derive strate-gies, such as classifying application types, prioritizing specificflow types and provisioning based on usage scenarios. Also,a definite trend in the fraction of non-flow-controlled UDPtraffic might affect router design as far as congestion andqueue management is concerned. In this paper, we particularlyobserve two behaviors, 1) variation of UDP to TCP ratioover time, and 2) port numbers and elastic/inelastic flowdistributions. As far as is possible from the data, we alsoobserve application trends. We use the term “flow ratio” and“volume ratio” to represent the ratio of UDP
TCP for their flowcounts and data volumes respectively.
II. LONGITUDINAL DATA
Long term protocol usage is observed from two locations:the CAIDA [2] and Internet2 [6] traffic1. CAIDA traffic data
1Note that the datasets contained some irregular anomalies throughout theperiod which have been removed from the plots. For example, short but veryhigh peak usage of unidentified protocol, missing-data and inconsistent datavalues were observed and discussed with the corresponding authors at CAIDAand Internet2. They are presumed to be due to occasional instrumentationerrors or, in some cases, to overwhelming bursts of malicious traffic. Ifincluded in the analysis, they would dominate the traffic averages andinvalidate overall protocol trends. The original data including these anomalouspeaks are available at the cited web sites.
is from the OC192 backbone link of a Tier 1 ISP betweenChicago and Seattle (direction A and B), reflecting various end-user aggregates. The Internet2 traffic reflects usage patternsby the US research and education community. Both datasetshave HTTP and DNS traffic as the most widely used protocolsfor TCP and UDP respectively, but no particular specificapplication protocol was used predominantly.
Figure 1 shows plots for the CAIDA data. Although pro-tocols such as ICMP, ESP and GRE are observed as well,TCP and UDP are in general most widely observed. We didnot see a noticeable amount of SCTP or DCCP traffic. Weobserve that both DirA and DirB traffic contained about95% TCP and 4% UDP bytes, measured daily and monthly(left and right). The volume ratio varied around an averageof 0.05; the diurnal variation shows that during the peak timeTCP volume (mainly HTTP) contributed as high as 98%, andduring the offpeak time UDP volume can increase to 18%.Flow proportions (DirB, right plot) varied greatly as UDPflows are a lot more observed than TCP flows, e.g., on average70% and as high as 77% of all flows are UDP. ICMP flowsare observed stably, contributing about 2%.
The dataset from Internet2 (Figure 2) covers a longer periodof measurement, from February 2002 to November 2009. Onthe left, we observe that the volume ratio has increased fromearly 2002 to mid 2004, then decreased from late 2006 to mid2007, and again slight variations are observed from mid 2007on. The UDP decrease observed in 2006 to 2007 may be dueto the University of Oregon switching off a continuous videostreaming service [17]. Generally the volume ratio variedbetween 5% and 20%, showing a higher variation than thatof the CAIDA data. Comparing between 2002 and 2009, wefind that the ratio of both bytes and packets has increasedslightly by about 5%.
In this, there seems to be little evidence of change in
148
International Journal on Advances in Systems and Measurements, vol 3 no 3 & 4, year 2010, http://www.iariajournals.org/systems_and_measurements/
2010, © Copyright by authors, Published under agreement with IARIA - www.iaria.org
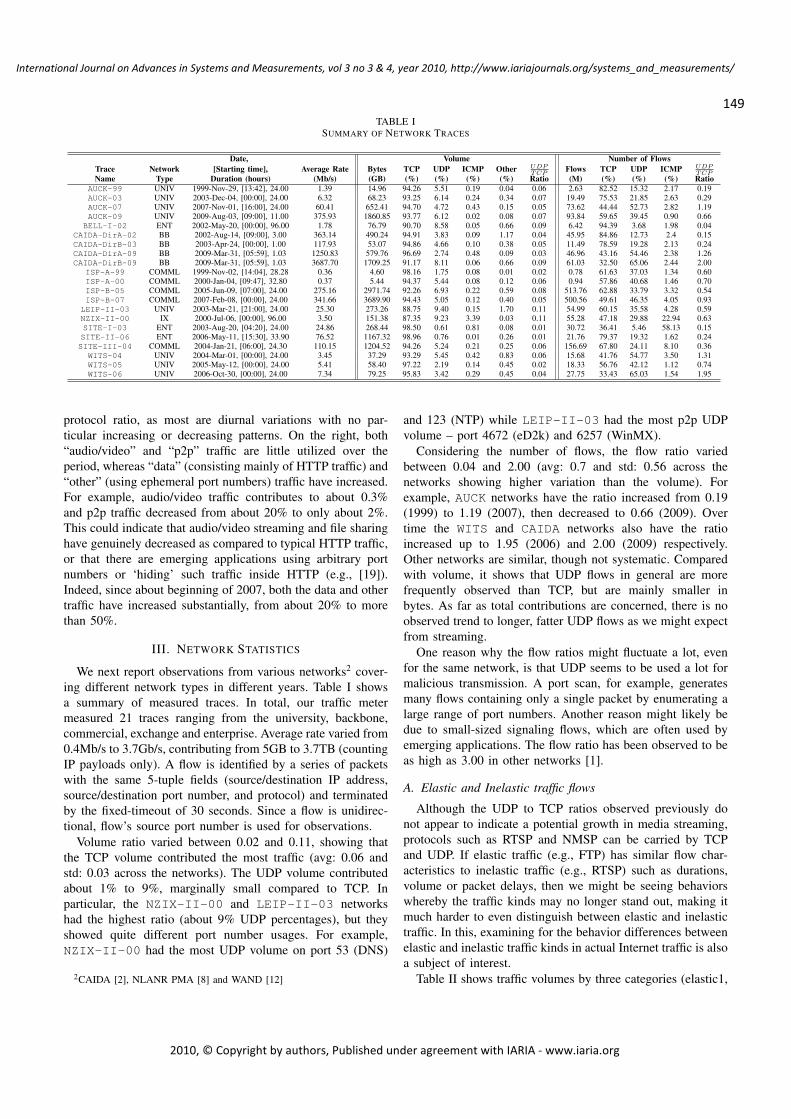
TABLE ISUMMARY OF NETWORK TRACES
Date, Volume Number of FlowsTrace Network [Starting time], Average Rate Bytes TCP UDP ICMP Other UDP
TCPFlows TCP UDP ICMP UDP
TCPName Type Duration (hours) (Mb/s) (GB) (%) (%) (%) (%) Ratio (M) (%) (%) (%) Ratio
AUCK-99 UNIV 1999-Nov-29, [13:42], 24.00 1.39 14.96 94.26 5.51 0.19 0.04 0.06 2.63 82.52 15.32 2.17 0.19AUCK-03 UNIV 2003-Dec-04, [00:00], 24.00 6.32 68.23 93.25 6.14 0.24 0.34 0.07 19.49 75.53 21.85 2.63 0.29AUCK-07 UNIV 2007-Nov-01, [16:00], 24.00 60.41 652.41 94.70 4.72 0.43 0.15 0.05 73.62 44.44 52.73 2.82 1.19AUCK-09 UNIV 2009-Aug-03, [09:00], 11.00 375.93 1860.85 93.77 6.12 0.02 0.08 0.07 93.84 59.65 39.45 0.90 0.66
BELL-I-02 ENT 2002-May-20, [00:00], 96.00 1.78 76.79 90.70 8.58 0.05 0.66 0.09 6.42 94.39 3.68 1.98 0.04CAIDA-DirA-02 BB 2002-Aug-14, [09:00], 3.00 363.14 490.24 94.91 3.83 0.09 1.17 0.04 45.95 84.86 12.73 2.4 0.15CAIDA-DirB-03 BB 2003-Apr-24, [00:00], 1.00 117.93 53.07 94.86 4.66 0.10 0.38 0.05 11.49 78.59 19.28 2.13 0.24CAIDA-DirA-09 BB 2009-Mar-31, [05:59], 1.03 1250.83 579.76 96.69 2.74 0.48 0.09 0.03 46.96 43.16 54.46 2.38 1.26CAIDA-DirB-09 BB 2009-Mar-31, [05:59], 1.03 3687.70 1709.25 91.17 8.11 0.06 0.66 0.09 61.03 32.50 65.06 2.44 2.00
ISP-A-99 COMML 1999-Nov-02, [14:04], 28.28 0.36 4.60 98.16 1.75 0.08 0.01 0.02 0.78 61.63 37.03 1.34 0.60ISP-A-00 COMML 2000-Jan-04, [09:47], 32.80 0.37 5.44 94.37 5.44 0.08 0.12 0.06 0.94 57.86 40.68 1.46 0.70ISP-B-05 COMML 2005-Jun-09, [07:00], 24.00 275.16 2971.74 92.26 6.93 0.22 0.59 0.08 513.76 62.88 33.79 3.32 0.54ISP-B-07 COMML 2007-Feb-08, [00:00], 24.00 341.66 3689.90 94.43 5.05 0.12 0.40 0.05 500.56 49.61 46.35 4.05 0.93LEIP-II-03 UNIV 2003-Mar-21, [21:00], 24.00 25.30 273.26 88.75 9.40 0.15 1.70 0.11 54.99 60.15 35.58 4.28 0.59NZIX-II-00 IX 2000-Jul-06, [00:00], 96.00 3.50 151.38 87.35 9.23 3.39 0.03 0.11 55.28 47.18 29.88 22.94 0.63SITE-I-03 ENT 2003-Aug-20, [04:20], 24.00 24.86 268.44 98.50 0.61 0.81 0.08 0.01 30.72 36.41 5.46 58.13 0.15SITE-II-06 ENT 2006-May-11, [15:30], 33.90 76.52 1167.32 98.96 0.76 0.01 0.26 0.01 21.76 79.37 19.32 1.62 0.24SITE-III-04 COMML 2004-Jan-21, [06:00], 24.30 110.15 1204.52 94.26 5.24 0.21 0.25 0.06 156.69 67.80 24.11 8.10 0.36
WITS-04 UNIV 2004-Mar-01, [00:00], 24.00 3.45 37.29 93.29 5.45 0.42 0.83 0.06 15.68 41.76 54.77 3.50 1.31WITS-05 UNIV 2005-May-12, [00:00], 24.00 5.41 58.40 97.22 2.19 0.14 0.45 0.02 18.33 56.76 42.12 1.12 0.74WITS-06 UNIV 2006-Oct-30, [00:00], 24.00 7.34 79.25 95.83 3.42 0.29 0.45 0.04 27.75 33.43 65.03 1.54 1.95
protocol ratio, as most are diurnal variations with no par-ticular increasing or decreasing patterns. On the right, both“audio/video” and “p2p” traffic are little utilized over theperiod, whereas “data” (consisting mainly of HTTP traffic) and“other” (using ephemeral port numbers) traffic have increased.For example, audio/video traffic contributes to about 0.3%and p2p traffic decreased from about 20% to only about 2%.This could indicate that audio/video streaming and file sharinghave genuinely decreased as compared to typical HTTP traffic,or that there are emerging applications using arbitrary portnumbers or ‘hiding’ such traffic inside HTTP (e.g., [19]).Indeed, since about beginning of 2007, both the data and othertraffic have increased substantially, from about 20% to morethan 50%.
III. NETWORK STATISTICS
We next report observations from various networks2 cover-ing different network types in different years. Table I showsa summary of measured traces. In total, our traffic metermeasured 21 traces ranging from the university, backbone,commercial, exchange and enterprise. Average rate varied from0.4Mb/s to 3.7Gb/s, contributing from 5GB to 3.7TB (countingIP payloads only). A flow is identified by a series of packetswith the same 5-tuple fields (source/destination IP address,source/destination port number, and protocol) and terminatedby the fixed-timeout of 30 seconds. Since a flow is unidirec-tional, flow’s source port number is used for observations.
Volume ratio varied between 0.02 and 0.11, showing thatthe TCP volume contributed the most traffic (avg: 0.06 andstd: 0.03 across the networks). The UDP volume contributedabout 1% to 9%, marginally small compared to TCP. Inparticular, the NZIX-II-00 and LEIP-II-03 networkshad the highest ratio (about 9% UDP percentages), but theyshowed quite different port number usages. For example,NZIX-II-00 had the most UDP volume on port 53 (DNS)
2CAIDA [2], NLANR PMA [8] and WAND [12]
and 123 (NTP) while LEIP-II-03 had the most p2p UDPvolume – port 4672 (eD2k) and 6257 (WinMX).
Considering the number of flows, the flow ratio variedbetween 0.04 and 2.00 (avg: 0.7 and std: 0.56 across thenetworks showing higher variation than the volume). Forexample, AUCK networks have the ratio increased from 0.19(1999) to 1.19 (2007), then decreased to 0.66 (2009). Overtime the WITS and CAIDA networks also have the ratioincreased up to 1.95 (2006) and 2.00 (2009) respectively.Other networks are similar, though not systematic. Comparedwith volume, it shows that UDP flows in general are morefrequently observed than TCP, but are mainly smaller inbytes. As far as total contributions are concerned, there is noobserved trend to longer, fatter UDP flows as we might expectfrom streaming.
One reason why the flow ratios might fluctuate a lot, evenfor the same network, is that UDP seems to be used a lot formalicious transmission. A port scan, for example, generatesmany flows containing only a single packet by enumerating alarge range of port numbers. Another reason might likely bedue to small-sized signaling flows, which are often used byemerging applications. The flow ratio has been observed to beas high as 3.00 in other networks [1].
A. Elastic and Inelastic traffic flows
Although the UDP to TCP ratios observed previously donot appear to indicate a potential growth in media streaming,protocols such as RTSP and NMSP can be carried by TCPand UDP. If elastic traffic (e.g., FTP) has similar flow char-acteristics to inelastic traffic (e.g., RTSP) such as durations,volume or packet delays, then we might be seeing behaviorswhereby the traffic kinds may no longer stand out, making itmuch harder to even distinguish between elastic and inelastictraffic. In this, examining for the behavior differences betweenelastic and inelastic traffic kinds in actual Internet traffic is alsoa subject of interest.
Table II shows traffic volumes by three categories (elastic1,
149
International Journal on Advances in Systems and Measurements, vol 3 no 3 & 4, year 2010, http://www.iariajournals.org/systems_and_measurements/
2010, © Copyright by authors, Published under agreement with IARIA - www.iaria.org
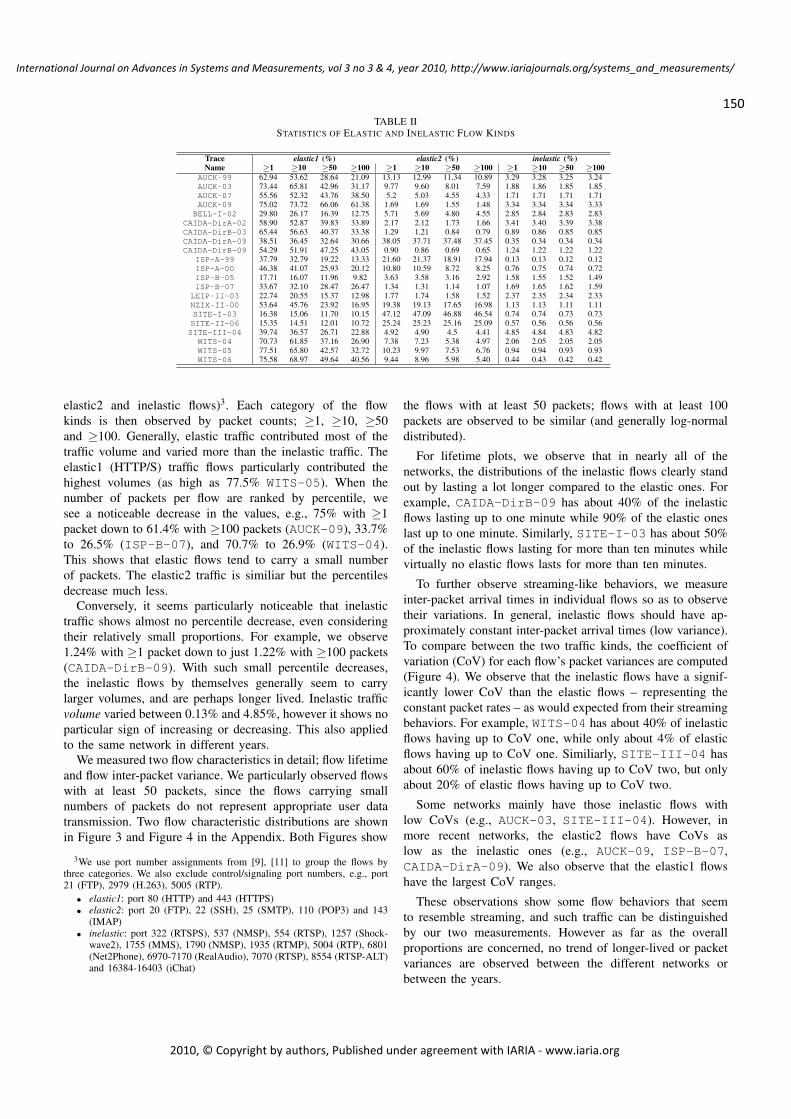
TABLE IISTATISTICS OF ELASTIC AND INELASTIC FLOW KINDS
Trace elastic1 (%) elastic2 (%) inelastic (%)Name ≥1 ≥10 ≥50 ≥100 ≥1 ≥10 ≥50 ≥100 ≥1 ≥10 ≥50 ≥100
AUCK-99 62.94 53.62 28.64 21.09 13.13 12.99 11.34 10.89 3.29 3.28 3.25 3.24AUCK-03 73.44 65.81 42.96 31.17 9.77 9.60 8.01 7.59 1.88 1.86 1.85 1.85AUCK-07 55.56 52.32 43.76 38.50 5.2 5.03 4.55 4.33 1.71 1.71 1.71 1.71AUCK-09 75.02 73.72 66.06 61.38 1.69 1.69 1.55 1.48 3.34 3.34 3.34 3.33
BELL-I-02 29.80 26.17 16.39 12.75 5.71 5.69 4.80 4.55 2.85 2.84 2.83 2.83CAIDA-DirA-02 58.90 52.87 39.83 33.89 2.17 2.12 1.73 1.66 3.41 3.40 3.39 3.38CAIDA-DirB-03 65.44 56.63 40.37 33.38 1.29 1.21 0.84 0.79 0.89 0.86 0.85 0.85CAIDA-DirA-09 38.51 36.45 32.64 30.66 38.05 37.71 37.48 37.45 0.35 0.34 0.34 0.34CAIDA-DirB-09 54.29 51.91 47.25 43.05 0.90 0.86 0.69 0.65 1.24 1.22 1.22 1.22
ISP-A-99 37.79 32.79 19.22 13.33 21.60 21.37 18.91 17.94 0.13 0.13 0.12 0.12ISP-A-00 46.38 41.07 25.93 20.12 10.80 10.59 8.72 8.25 0.76 0.75 0.74 0.72ISP-B-05 17.71 16.07 11.96 9.82 3.63 3.58 3.16 2.92 1.58 1.55 1.52 1.49ISP-B-07 33.67 32.10 28.47 26.47 1.34 1.31 1.14 1.07 1.69 1.65 1.62 1.59LEIP-II-03 22.74 20.55 15.37 12.98 1.77 1.74 1.58 1.52 2.37 2.35 2.34 2.33NZIX-II-00 53.64 45.76 23.92 16.95 19.38 19.13 17.65 16.98 1.13 1.13 1.11 1.11SITE-I-03 16.38 15.06 11.70 10.15 47.12 47.09 46.88 46.54 0.74 0.74 0.73 0.73SITE-II-06 15.35 14.51 12.01 10.72 25.24 25.23 25.16 25.09 0.57 0.56 0.56 0.56SITE-III-04 39.74 36.57 26.71 22.88 4.92 4.90 4.5 4.41 4.85 4.84 4.83 4.82WITS-04 70.73 61.85 37.16 26.90 7.38 7.23 5.38 4.97 2.06 2.05 2.05 2.05WITS-05 77.51 65.80 42.57 32.72 10.23 9.97 7.53 6.76 0.94 0.94 0.93 0.93WITS-06 75.58 68.97 49.64 40.56 9.44 8.96 5.98 5.40 0.44 0.43 0.42 0.42
elastic2 and inelastic flows)3. Each category of the flowkinds is then observed by packet counts; ≥1, ≥10, ≥50and ≥100. Generally, elastic traffic contributed most of thetraffic volume and varied more than the inelastic traffic. Theelastic1 (HTTP/S) traffic flows particularly contributed thehighest volumes (as high as 77.5% WITS-05). When thenumber of packets per flow are ranked by percentile, wesee a noticeable decrease in the values, e.g., 75% with ≥1packet down to 61.4% with ≥100 packets (AUCK-09), 33.7%to 26.5% (ISP-B-07), and 70.7% to 26.9% (WITS-04).This shows that elastic flows tend to carry a small numberof packets. The elastic2 traffic is similiar but the percentilesdecrease much less.
Conversely, it seems particularly noticeable that inelastictraffic shows almost no percentile decrease, even consideringtheir relatively small proportions. For example, we observe1.24% with ≥1 packet down to just 1.22% with ≥100 packets(CAIDA-DirB-09). With such small percentile decreases,the inelastic flows by themselves generally seem to carrylarger volumes, and are perhaps longer lived. Inelastic trafficvolume varied between 0.13% and 4.85%, however it shows noparticular sign of increasing or decreasing. This also appliedto the same network in different years.
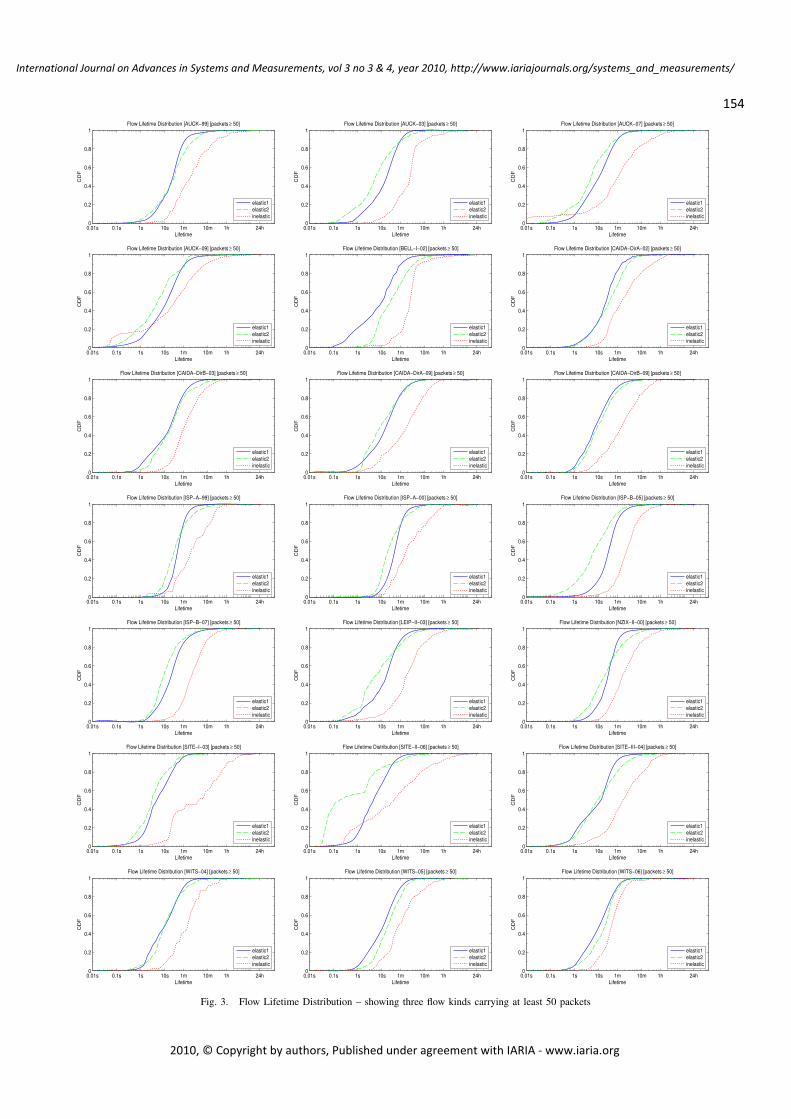
We measured two flow characteristics in detail; flow lifetimeand flow inter-packet variance. We particularly observed flowswith at least 50 packets, since the flows carrying smallnumbers of packets do not represent appropriate user datatransmission. Two flow characteristic distributions are shownin Figure 3 and Figure 4 in the Appendix. Both Figures show
3We use port number assignments from [9], [11] to group the flows bythree categories. We also exclude control/signaling port numbers, e.g., port21 (FTP), 2979 (H.263), 5005 (RTP).
• elastic1: port 80 (HTTP) and 443 (HTTPS)• elastic2: port 20 (FTP), 22 (SSH), 25 (SMTP), 110 (POP3) and 143
(IMAP)• inelastic: port 322 (RTSPS), 537 (NMSP), 554 (RTSP), 1257 (Shock-
wave2), 1755 (MMS), 1790 (NMSP), 1935 (RTMP), 5004 (RTP), 6801(Net2Phone), 6970-7170 (RealAudio), 7070 (RTSP), 8554 (RTSP-ALT)and 16384-16403 (iChat)
the flows with at least 50 packets; flows with at least 100packets are observed to be similar (and generally log-normaldistributed).
For lifetime plots, we observe that in nearly all of thenetworks, the distributions of the inelastic flows clearly standout by lasting a lot longer compared to the elastic ones. Forexample, CAIDA-DirB-09 has about 40% of the inelasticflows lasting up to one minute while 90% of the elastic oneslast up to one minute. Similarly, SITE-I-03 has about 50%of the inelastic flows lasting for more than ten minutes whilevirtually no elastic flows lasts for more than ten minutes.
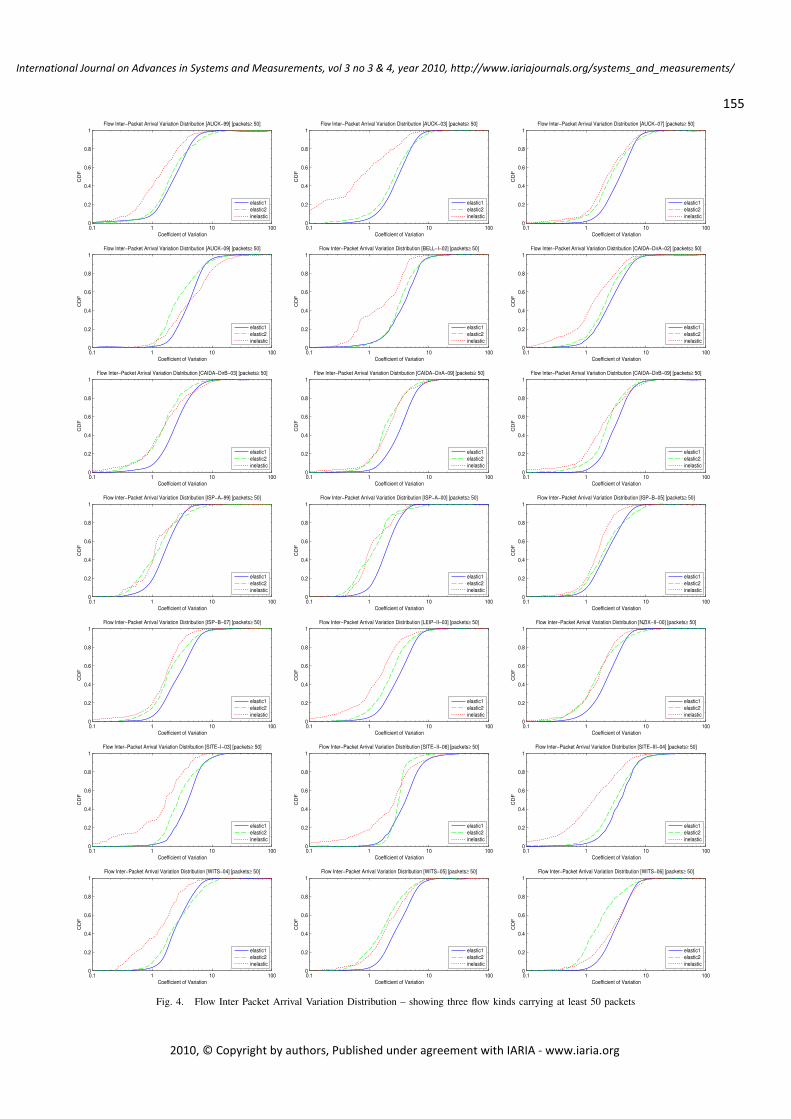
To further observe streaming-like behaviors, we measureinter-packet arrival times in individual flows so as to observetheir variations. In general, inelastic flows should have ap-proximately constant inter-packet arrival times (low variance).To compare between the two traffic kinds, the coefficient ofvariation (CoV) for each flow’s packet variances are computed(Figure 4). We observe that the inelastic flows have a signif-icantly lower CoV than the elastic flows – representing theconstant packet rates – as would expected from their streamingbehaviors. For example, WITS-04 has about 40% of inelasticflows having up to CoV one, while only about 4% of elasticflows having up to CoV one. Similiarly, SITE-III-04 hasabout 60% of inelastic flows having up to CoV two, but onlyabout 20% of elastic flows having up to CoV two.
Some networks mainly have those inelastic flows withlow CoVs (e.g., AUCK-03, SITE-III-04). However, inmore recent networks, the elastic2 flows have CoVs aslow as the inelastic ones (e.g., AUCK-09, ISP-B-07,CAIDA-DirA-09). We also observe that the elastic1 flowshave the largest CoV ranges.
These observations show some flow behaviors that seemto resemble streaming, and such traffic can be distinguishedby our two measurements. However as far as the overallproportions are concerned, no trend of longer-lived or packetvariances are observed between the different networks orbetween the years.
150
International Journal on Advances in Systems and Measurements, vol 3 no 3 & 4, year 2010, http://www.iariajournals.org/systems_and_measurements/
2010, © Copyright by authors, Published under agreement with IARIA - www.iaria.org
B. Port Numbers
The rest of the plots in the Appendix show our observedport numbers. For example, each page shows three networks;Table III shows top10 most used port numbers, ranked ac-cording to their proportions for flows, volume and duration.It also shows a cumulated percentage of these top10 andtop20 ports. In the middle (Figure 5), the port rank distri-butions are displayed as log-log plots. The left plots are theAUCK-99, center plots are the AUCK-03, and right plots arethe AUCK-07 networks. The bottom (Figure 6) shows thecumulative distribution function (CDF) plot – the top two plotsare for TCP, showing port numbers on a linear and a log scalerespectively, and the bottom two plots are for UDP. The restof the plots follow the same arrangement for other networks.
Overall, the top10 flows together contributed about 18%(ISP-B-05) to 60% (CAIDA-DirA-09) for TCP, and9% (CAIDA-DirB-09) to 76% (SITE-I-03) for UDP.The ranges for the top10 volumes were greater, i.e.,33% (ISP-B-05) to 88% (AUCK-09) for TCP, and 11%(CAIDA-DirB-09) to 86% (BELL-I-02) for UDP. UsingCoV metric across the networks, we find that TCP vol-ume/flows and UDP volume/flows varied in ratio 0.22/0.25 and0.45/0.42 respectively; UDP traffic is clearly more fluctuating.Again, we find little systematic trend for both TCP and UDP;those variabilities show that the traffic can either be heavilydominated by a few port numbers, or diversely dispersed.Various other well-known port numbers (up to 1023) alsocontributed to the top10. The individual port usages are lesssignificantly contributed for higher ranks, e.g., top20 increasestotal percentages only slightly.
For TCP, we observe that HTTP/S traffic contributed themost and often appeared in the top rank. We also observe thatgenerally recent networks have more high-end port numberscompared to the older networks. For UDP, DNS traffic werethe most common, although rank distributions appear similarbetween the networks, we observe that the distributions areless skewed over the years, given that their volumes arealready marginally small. Volumes on the port numbers aremore diversely spread over the years, e.g., top10 volumeshave reduced from 77% to 53% (WITS-04 to WITS-06),and only less than 17% of UDP volumes (CAIDA-DirA-09,CAIDA-DirB-09, ISP-B-07) are observed. These changesshow that there are more applications using different portnumbers in recent years. None of these ports however indicateany plausible evidence of incremental streaming traffic.
We observe how the port numbers are distributed by theirattributes – number of flows and volume/duration. Measuringthe volume for a particular port number is the same as mea-suring an aggregated flow size on that port number. Similarly,duration measures the total aggregated flow lifetimes of agiven port number.
Here, we find that often up to 70% to 90% of port numbersused are below 10,000. The rest of the port usage appearsquite uniformly distributed, although not strictly linear. A stepin the CDF for one particular port number shows that this port
is heavily used in the network being studied, e.g., FTP/SMTPand HTTP/S traffic, which is to be expected for well-knownports or registered ports. The registered ports are those from1024 to 49151, so steps in the CDF are to be expectedthroughout this range. We do see this in several plots, for bothUDP and TCP. We also see a roughly linear CDF for portsin the dynamic range above 49151, which is to be expectedif they are chosen pseudo-randomly, as good security practicerequires. The situation between 1024 and 49151 is somewhatconfused, because many TCP/IP implementations appear touse arbitrary ranges between 1024 and 65535 for dynamicports (often referred to as “ephemeral” ports, which is not aterm defined in the TCP or UDP standards or in the IANA portallocations). It appears different Operating Systems, as well astheir different versions, use a different range by default [10].
Both volume and duration distributions appear similar tothe flow distribution, i.e., increase in the number of flows alsoincreases total volume and durations. Some port numbers donot correlate equally with flows, volume and duration. Forexample, BELL-I-02 contained almost no flows on port7331, but those flows carried more than 70% of volume andduration. Similarly, SITE-I-03 contained 0.4% of FTP dataflows, but those contributed more than 43% of volume.
For older traces, a majority of protocols are low numbered,e.g., ISP-A-99 have more than 90% of traffic flows andvolumes contributed to port number below 10,000, for bothTCP and UDP. Conversely, recent traces have only up toabout 50% (ISP-B-07). UDP traffic is a lot more linearlydistributed across the port range, e.g., both CAIDA-DirB-09and ISP-B-07. Also, DNS traffic volumes are no longersignificant, e.g., contributing from 42% (ISP-A-99) to lessthan 2% (ISP-B-07). These changes appear to be the majordifferences between the older and newer traces, given that thevolume ratios hardly changed.
IV. DISCUSSION
The UDP to TCP ratio does not seem to show any system-atic trend; there are variations over time and between networks,but nothing we can identify as characteristic. In particular,there is nothing in the data to suggest a sustained growthin the share of UDP traffic caused by growth in audio andvideo streaming. Within TCP, we have seen some indicationof streaming by well-known ports, e.g., those flows generallylast much longer and have distinctly low variance of inter-packet arrival times.
Although we have observed a diversity of port numbersincreasing over time, recent (2009) traffic volume appears tobe aggregated on HTTP/S, and thus a prediction of increasingweb traffic could be reasonable (e.g., [5]). It appears that alarge number of application developers are taking advantageof and utilizing web traffic to increase interoperability throughNATs and firewalls, mitigating deployment and operationissues [21], and in some cases to benefit from HTTP caching.From this, we may again observe the top port ranks contribut-ing a lot more HTTP/S traffic, making the volume distributionssimilar to older network traffic.
151
International Journal on Advances in Systems and Measurements, vol 3 no 3 & 4, year 2010, http://www.iariajournals.org/systems_and_measurements/
2010, © Copyright by authors, Published under agreement with IARIA - www.iaria.org
It also appears that DNS traffic that was once a maincontributor of UDP volume no longer stands out; insteadUDP port numbers are more spread, presumably due toapplication diversities, possibly including streaming traffic.In fact, superficial evidence suggests that popular streamingsolutions are at least as likely to use TCP (with or withoutHTTP) as they are to use UDP (with or without RTP). Ourobservations cannot directly detect this, but it is certain thatwe are not seeing a significant volume shift from TCP toUDP. Since streaming traffic is believed to be increasing, wemust have an increase in the amount of TCP traffic for whichTCP’s response to congestion and loss (slowing down andretransmitting) is counter-productive.
In many cases, there are correlations of our three attributes,e.g., port 80 with a high proportion of flows is also likely tohave a high proportion of both volume and duration. Similarly,an unpopular port number is likely to have low values forflows, volume and duration. However, certain ports with a lownumber of flows could contribute a high volume of traffic. Portusage trends are obviously dependent on application trends.As we have seen, these vary between networks, so localobservations are the only valid guide. This could be significantif a service provider is planning to use any kind of addresssharing by restricting the port range per subscriber [26]. Thereseems to be no general rule about which ports are popular,except for the few very well-known service ports.
Our observations of port usage also shows considerable butnot systematic variation between networks. This is somewhatsurprising; all the networks are large enough that we wouldexpect usage patterns to average out and be similar in allcases. We can speculate that the demographics of the varioususer populations (e.g., students and academics versus generalpopulation) cause them to use rather different sets of operatingsystems and applications. However, the main lesson is that onecannot extrapolate from usage patterns on one network to thoseon another without allowing for at least as much variability aswe have observed in this study.
From this, our observations also suggest several guidelinesfor potential measurements on operational networks. First,variation in the number of flows may indicate network in-stabilities and abnormal behaviors. The observed variabilityimplies that one needs to be flexible when configuring themeasurement parameters, e.g., the traffic meter’s flow tablesize, perhaps adjusting the flow timeout differently for eachport number. Second, the volume and duration of flows indi-cate potential network improvements based on port usages;in the port and rank distribution, the slopes indicate howthe port numbers are concentrated in small or large ranges.This information can be considered for purposes such asprioritizing specific applications of interest, or new strategy inload balancing and accounting/billing. Flow-based routing (forexample, [27]) has the ability to resolve integrity of inelastic(including VoIP and p2p) traffic by keeping track of flows forfaster routing, though little evidence of applications has beenreported.
V. RELATED WORK
Our observations share a similar view with measurementdone in [1], i.e., a high UDP flow count and potential signalingflows. However, we detailed each network’s traffic statistics,observed for per-flow behaviors of wide variabilities of theport number ranges, covering wider network traces. Our studyextends the work in [23]; we included elastic and inelasticflow behaviors to observe potential streaming traffic, and allnetwork summaries are detailed in this work. We note thatport-based observations can give inaccurate protocol identi-fication; however studies have shown (e.g., [20], [21]) thatport numbers still give reasonable insights into applicationsand trends. Faber [14] suggested that IP hosts producingUDP flows could be characterized by weight functions, e.g.,between p2p and scans. Also, McNutt and De Shon [24]have computed correlations in the usage of ephemeral ports toidentify potential malicious traffic patterns. Wang et al. [29]reported on a short term study of the distribution of ephemeralport usage; they consider any port above 1024 to be ephemeral,not distinguishing between the registered and dynamic ports.Ephemeral port number cycling can be visualized so as todetect hidden services [16]. Allman [13] suggested differentways to select ephemeral ports that are more diverse androbust against security threats. Much interest in the choice ofephemeral port numbers was aroused by the DNS vulnerabilitypublicized in 2008 [3]. It is to be expected that as developerslearn the lesson of this vulnerability, randomization of portnumbers may become more prevalent.
VI. CONCLUSION
In this paper, we have have observed the two widely usedprotocols (UDP and TCP) to measure how their UDP to TCPratio varied. Particularly we observed that there is no clearevidence that the ratio is increasing or decreasing. The ratio israther dependent on application popularity and, consequently,on user choices. The volume ratio had subtle variations –the majority of volume is dominated by TCP, with a diurnalpattern. The flow ratio had larger variations – many flows areUDP but with very small volume.
Although the ratio does not vary systematically among thenetworks, each had quite different port number distributions.For example, data from recent years of ISP networks containeda large amount of p2p traffic, while enterprise networkscontained a large amount of FTP traffic. Again, user choicesare at work. Well-known streaming flows such as RTP, NMSP,and RTMP are visible especially in recent years, however thereare no particular signs of incremental use of them.
As we note that emerging applications use arbitrary portnumbers, identifying applications solely based on port num-bers alone could lead to inaccurate assumptions; deep packetinspection may be the only approach in practice to determinethe streaming traffic, provided that the packets are not en-crypted. It could continue to be, on the other hand, that thestreaming methods may simply further be evolved or inte-grated into elastic data traffic, provided that over-provisioningis widely practiced. Nevertheless, the trend towards more
152
International Journal on Advances in Systems and Measurements, vol 3 no 3 & 4, year 2010, http://www.iariajournals.org/systems_and_measurements/
2010, © Copyright by authors, Published under agreement with IARIA - www.iaria.org
streaming traffic seems undeniable. However, contrary to whatmight naively be expected, there is no evidence of a resultingtrend to relatively more use of UDP to carry it. In fact, theevidence is of widespread variability in the fraction of UDPtraffic. Similarly, there is no clear trend in port usage, onlyevidence of widespread variability.
We had hoped to derive some general guidelines aboutthe likely trend in traffic patterns, particularly concerning thefraction of non-congestion-controlled flows and the distribu-tion of port usage. There appear to be no such guidelinesin the available data. We consider that router and switchdesigners, as well as network operators, should be well awareof high variability in these basic characteristics, and design andprovision their systems accordingly. In particular, one cannotextrapolate from measurements of one user population to thelikely traffic patterns of another. It seems that all networkoperators need to measure their own protocol and port usageprofiles.
ACKNOWLEDGMENTS
Preliminary data on UDP to TCP ratios was kindly suppliedby Arnold Nipper, Toshinori Ishii, Kjetil Olsen, Mike Hughesand Arne Oslebo. We are grateful to Ryan Koga of CAIDA andto Stanislav Shalunov, formerly of Internet2, for informationabout their respective datasets.
REFERENCES
[1] “Analyzing UDP usage in Internet traffic,” http://www.caida.org/research/traffic-analysis/tcpudpratio/, [Online; accessed 01-Aug-2009].
[2] “CAIDA Internet Data – Realtime Monitors,” http://www.caida.org/data/realtime/index.xml, [Online; accessed 30-Oct-2009].
[3] “CERT Vulnerability Note VU#800113,” http://www.kb.cert.org/vuls/id/800113/, [Online; accessed 10-Jun-2009].
[4] “Cisco Visual Networking Index: Usage Study,” http://www.cisco.com/en/US/solutions/collateral/ns341/ns525/ns537/ns705/Cisco VNIUsage WP.pdf, [Online; accessed 20-August-2009].
[5] “Hyperconnectivity and the Approaching Zettabyte Era,”http://www.cisco.com/en/US/solutions/collateral/ns341/ns525/ns537/ns705/ns827/VNI Hyperconnectivity WP.pdf, [Online; accessed20-August-2009].
[6] “Internet2 NetFlow: Weekly Reports,” http://netflow.internet2.edu/weekly/, [Online; accessed 30-Oct-2009].
[7] “Minnesota Internet Traffic Studies (MINTS),” http://www.dtc.umn.edu/mints/home.php, [Online; accessed 20-August-2009].
[8] “Passive Measurement and Analysis (PMA),” http://pma.nlanr.net/, [On-line; accessed 01-Nov-2008].
[9] “Port Numbers,” http://www.iana.org/assignments/port-numbers, [On-line; accessed 30-October-2009].
[10] “The Ephemeral Port Range,” http://www.ncftp.com/ncftpd/doc/misc/ephemeral ports.html, [Online; accessed 30-October-2009].
[11] ““Well Known” TCP and UDP ports used by Apple software products,”http://support.apple.com/kb/ts1629.
[12] “WITS: Waikato Internet Traffic Storage,” http://www.wand.net.nz/wits/,[Online; accessed 01-Nov-2008].
[13] M. Allman, “Comments on selecting ephemeral ports,” SIGCOMMComput. Commun. Rev., vol. 39, no. 2, pp. 13–19, 2009.
[14] S. Faber, “Is there any value in bulk network traces?” FloCon, 2009.[15] P. Gill, M. F. Arlitt, Z. Li, and A. Mahanti, “The flattening internet
topology: Natural evolution, unsightly barnacles or contrived collapse?”in PAM, 2008, pp. 1–10.
[16] J. Janies, “Existence plots: A low-resolution time series for port behavioranalysis,” in VizSec ’08: Proceedings of the 5th international workshopon Visualization for Computer Security. Berlin, Heidelberg: Springer-Verlag, 2008, pp. 161–168.
[17] Joe St Sauver, University of Oregon, “Personal communication,” 2008.[18] W. John and S. Tafvelin, “Analysis of internet backbone traffic and
header anomalies observed,” in IMC ’07: Proceedings of the 7th ACMSIGCOMM conference on Internet measurement. New York, NY, USA:ACM, 2007, pp. 111–116.
[19] T. Karagiannis, A. Broido, N. Brownlee, K. Claffy, and M. Faloutsos, “Isp2p dying or just hiding?” in Global Telecommunications Conference,2004. GLOBECOM ’04. IEEE, 2004, pp. 1532–1538.
[20] H. Kim, K. Claffy, M. Fomenkov, D. Barman, M. Faloutsos, and K. Lee,“Internet traffic classification demystified: myths, caveats, and the bestpractices,” in CONEXT ’08: Proceedings of the 2008 ACM CoNEXTConference. New York, NY, USA: ACM, 2008, pp. 1–12.
[21] C. Labovitz, S. Iekel-Johnson, D. McPherson, J. Oberheide,F. Jahanian, and M. Karir, “2009 Internet Observatory Report,”http://www.nanog.org/meetings/nanog47/presentations/Monday/Labovitz ObserveReport N47 Mon.pdf, 2009.
[22] C. Labovitz, D. McPherson, S. Iekel-Johnson, and M. Holly-man, “Internet Traffic Trends,” http://www.nanog.org/meetings/nanog43/presentations/Labovitz internetstats N43.pdf, 2008.
[23] D. Lee, B. E. Carpenter, and N. Brownlee, “Observations of UDP toTCP Ratio and Port Numbers,” in Fifth International Conference onInternet Monitoring and Protection (ICIMP). IEEE, 2010, pp. 99–104.
[24] J. McNutt and M. D. Shon, “Correlations between quiescent ports innetwork flows,” FloCon, 2005.
[25] A. Odlyzko, “The Delusions of Net Neutrality,” in TelecommunicationsPolicy Research Conference, 2008.
[26] R. Bush (ed.), “The A+P Approach to the IPv4 Address Shortage (workin progress),” http://tools.ietf.org/id/draft-ymbk-aplusp, 2009.
[27] L. Roberts, “A radical new router,” Spectrum, IEEE, vol. 46, no. 7, pp.34–39, July 2009.
[28] J. Rosenberg, “UDP and TCP as the New Waistof the Internet Hourglass,” http://tools.ietf.org/id/draft-rosenberg-internet-waist-hourglass-00.txt.
[29] H. Wang, R. Zhou, and Y. He, “An Information Acquisition MethodBased on NetFlow for Network Situation Awareness,” Advanced Soft-ware Engineering and Its Applications, pp. 23–26, 2008.
APPENDIXPLOTS
153
International Journal on Advances in Systems and Measurements, vol 3 no 3 & 4, year 2010, http://www.iariajournals.org/systems_and_measurements/
2010, © Copyright by authors, Published under agreement with IARIA - www.iaria.org
0.01s 0.1s 1s 10s 1m 10m 1h 24h0
0.2
0.4
0.6
0.8
1
Lifetime
CD
F
Flow Lifetime Distribution [AUCK−99] [packets ≥ 50]
elastic1elastic2inelastic
0.01s 0.1s 1s 10s 1m 10m 1h 24h0
0.2
0.4
0.6
0.8
1
Lifetime
CD
F
Flow Lifetime Distribution [AUCK−03] [packets ≥ 50]
elastic1elastic2inelastic
0.01s 0.1s 1s 10s 1m 10m 1h 24h0
0.2
0.4
0.6
0.8
1
Lifetime
CD
F
Flow Lifetime Distribution [AUCK−07] [packets ≥ 50]
elastic1elastic2inelastic
0.01s 0.1s 1s 10s 1m 10m 1h 24h0
0.2
0.4
0.6
0.8
1
Lifetime
CD
F
Flow Lifetime Distribution [AUCK−09] [packets ≥ 50]
elastic1elastic2inelastic
0.01s 0.1s 1s 10s 1m 10m 1h 24h0
0.2
0.4
0.6
0.8
1
Lifetime
CD
F
Flow Lifetime Distribution [BELL−I−02] [packets ≥ 50]
elastic1elastic2inelastic
0.01s 0.1s 1s 10s 1m 10m 1h 24h0
0.2
0.4
0.6
0.8
1
Lifetime
CD
F
Flow Lifetime Distribution [CAIDA−DirA−02] [packets ≥ 50]
elastic1elastic2inelastic
0.01s 0.1s 1s 10s 1m 10m 1h 24h0
0.2
0.4
0.6
0.8
1
Lifetime
CD
F
Flow Lifetime Distribution [CAIDA−DirB−03] [packets ≥ 50]
elastic1elastic2inelastic
0.01s 0.1s 1s 10s 1m 10m 1h 24h0
0.2
0.4
0.6
0.8
1
Lifetime
CD
F
Flow Lifetime Distribution [CAIDA−DirA−09] [packets ≥ 50]
elastic1elastic2inelastic
0.01s 0.1s 1s 10s 1m 10m 1h 24h0
0.2
0.4
0.6
0.8
1
Lifetime
CD
F
Flow Lifetime Distribution [CAIDA−DirB−09] [packets ≥ 50]
elastic1elastic2inelastic
0.01s 0.1s 1s 10s 1m 10m 1h 24h0
0.2
0.4
0.6
0.8
1
Lifetime
CD
F
Flow Lifetime Distribution [ISP−A−99] [packets ≥ 50]
elastic1elastic2inelastic
0.01s 0.1s 1s 10s 1m 10m 1h 24h0
0.2
0.4
0.6
0.8
1
Lifetime
CD
F
Flow Lifetime Distribution [ISP−A−00] [packets ≥ 50]
elastic1elastic2inelastic
0.01s 0.1s 1s 10s 1m 10m 1h 24h0
0.2
0.4
0.6
0.8
1
Lifetime
CD
F
Flow Lifetime Distribution [ISP−B−05] [packets ≥ 50]
elastic1elastic2inelastic
0.01s 0.1s 1s 10s 1m 10m 1h 24h0
0.2
0.4
0.6
0.8
1
Lifetime
CD
F
Flow Lifetime Distribution [ISP−B−07] [packets ≥ 50]
elastic1elastic2inelastic
0.01s 0.1s 1s 10s 1m 10m 1h 24h0
0.2
0.4
0.6
0.8
1
Lifetime
CD
F
Flow Lifetime Distribution [LEIP−II−03] [packets ≥ 50]
elastic1elastic2inelastic
0.01s 0.1s 1s 10s 1m 10m 1h 24h0
0.2
0.4
0.6
0.8
1
Lifetime
CD
F
Flow Lifetime Distribution [NZIX−II−00] [packets ≥ 50]
elastic1elastic2inelastic
0.01s 0.1s 1s 10s 1m 10m 1h 24h0
0.2
0.4
0.6
0.8
1
Lifetime
CD
F
Flow Lifetime Distribution [SITE−I−03] [packets ≥ 50]
elastic1elastic2inelastic
0.01s 0.1s 1s 10s 1m 10m 1h 24h0
0.2
0.4
0.6
0.8
1
Lifetime
CD
F
Flow Lifetime Distribution [SITE−II−06] [packets ≥ 50]
elastic1elastic2inelastic
0.01s 0.1s 1s 10s 1m 10m 1h 24h0
0.2
0.4
0.6
0.8
1
Lifetime
CD
F
Flow Lifetime Distribution [SITE−III−04] [packets ≥ 50]
elastic1elastic2inelastic
0.01s 0.1s 1s 10s 1m 10m 1h 24h0
0.2
0.4
0.6
0.8
1
Lifetime
CD
F
Flow Lifetime Distribution [WITS−04] [packets ≥ 50]
elastic1elastic2inelastic
0.01s 0.1s 1s 10s 1m 10m 1h 24h0
0.2
0.4
0.6
0.8
1
Lifetime
CD
F
Flow Lifetime Distribution [WITS−05] [packets ≥ 50]
elastic1elastic2inelastic
0.01s 0.1s 1s 10s 1m 10m 1h 24h0
0.2
0.4
0.6
0.8
1
Lifetime
CD
F
Flow Lifetime Distribution [WITS−06] [packets ≥ 50]
elastic1elastic2inelastic
Fig. 3. Flow Lifetime Distribution – showing three flow kinds carrying at least 50 packets
154
International Journal on Advances in Systems and Measurements, vol 3 no 3 & 4, year 2010, http://www.iariajournals.org/systems_and_measurements/
2010, © Copyright by authors, Published under agreement with IARIA - www.iaria.org
0.1 1 10 1000
0.2
0.4
0.6
0.8
1
Coefficient of Variation
CD
F
Flow Inter−Packet Arrival Variation Distribution [AUCK−99] [packets ≥ 50]
elastic1elastic2inelastic
0.1 1 10 1000
0.2
0.4
0.6
0.8
1
Coefficient of Variation
CD
F
Flow Inter−Packet Arrival Variation Distribution [AUCK−03] [packets ≥ 50]
elastic1elastic2inelastic
0.1 1 10 1000
0.2
0.4
0.6
0.8
1
Coefficient of Variation
CD
F
Flow Inter−Packet Arrival Variation Distribution [AUCK−07] [packets ≥ 50]
elastic1elastic2inelastic
0.1 1 10 1000
0.2
0.4
0.6
0.8
1
Coefficient of Variation
CD
F
Flow Inter−Packet Arrival Variation Distribution [AUCK−09] [packets ≥ 50]
elastic1elastic2inelastic
0.1 1 10 1000
0.2
0.4
0.6
0.8
1
Coefficient of Variation
CD
F
Flow Inter−Packet Arrival Variation Distribution [BELL−I−02] [packets ≥ 50]
elastic1elastic2inelastic
0.1 1 10 1000
0.2
0.4
0.6
0.8
1
Coefficient of Variation
CD
F
Flow Inter−Packet Arrival Variation Distribution [CAIDA−DirA−02] [packets ≥ 50]
elastic1elastic2inelastic
0.1 1 10 1000
0.2
0.4
0.6
0.8
1
Coefficient of Variation
CD
F
Flow Inter−Packet Arrival Variation Distribution [CAIDA−DirB−03] [packets ≥ 50]
elastic1elastic2inelastic
0.1 1 10 1000
0.2
0.4
0.6
0.8
1
Coefficient of Variation
CD
F
Flow Inter−Packet Arrival Variation Distribution [CAIDA−DirA−09] [packets ≥ 50]
elastic1elastic2inelastic
0.1 1 10 1000
0.2
0.4
0.6
0.8
1
Coefficient of Variation
CD
F
Flow Inter−Packet Arrival Variation Distribution [CAIDA−DirB−09] [packets ≥ 50]
elastic1elastic2inelastic
0.1 1 10 1000
0.2
0.4
0.6
0.8
1
Coefficient of Variation
CD
F
Flow Inter−Packet Arrival Variation Distribution [ISP−A−99] [packets ≥ 50]
elastic1elastic2inelastic
0.1 1 10 1000
0.2
0.4
0.6
0.8
1
Coefficient of Variation
CD
F
Flow Inter−Packet Arrival Variation Distribution [ISP−A−00] [packets ≥ 50]
elastic1elastic2inelastic
0.1 1 10 1000
0.2
0.4
0.6
0.8
1
Coefficient of Variation
CD
F
Flow Inter−Packet Arrival Variation Distribution [ISP−B−05] [packets ≥ 50]
elastic1elastic2inelastic
0.1 1 10 1000
0.2
0.4
0.6
0.8
1
Coefficient of Variation
CD
F
Flow Inter−Packet Arrival Variation Distribution [ISP−B−07] [packets ≥ 50]
elastic1elastic2inelastic
0.1 1 10 1000
0.2
0.4
0.6
0.8
1
Coefficient of Variation
CD
F
Flow Inter−Packet Arrival Variation Distribution [LEIP−II−03] [packets ≥ 50]
elastic1elastic2inelastic
0.1 1 10 1000
0.2
0.4
0.6
0.8
1
Coefficient of Variation
CD
F
Flow Inter−Packet Arrival Variation Distribution [NZIX−II−00] [packets ≥ 50]
elastic1elastic2inelastic
0.1 1 10 1000
0.2
0.4
0.6
0.8
1
Coefficient of Variation
CD
F
Flow Inter−Packet Arrival Variation Distribution [SITE−I−03] [packets ≥ 50]
elastic1elastic2inelastic
0.1 1 10 1000
0.2
0.4
0.6
0.8
1
Coefficient of Variation
CD
F
Flow Inter−Packet Arrival Variation Distribution [SITE−II−06] [packets ≥ 50]
elastic1elastic2inelastic
0.1 1 10 1000
0.2
0.4
0.6
0.8
1
Coefficient of Variation
CD
F
Flow Inter−Packet Arrival Variation Distribution [SITE−III−04] [packets ≥ 50]
elastic1elastic2inelastic
0.1 1 10 1000
0.2
0.4
0.6
0.8
1
Coefficient of Variation
CD
F
Flow Inter−Packet Arrival Variation Distribution [WITS−04] [packets ≥ 50]
elastic1elastic2inelastic
0.1 1 10 1000
0.2
0.4
0.6
0.8
1
Coefficient of Variation
CD
F
Flow Inter−Packet Arrival Variation Distribution [WITS−05] [packets ≥ 50]
elastic1elastic2inelastic
0.1 1 10 1000
0.2
0.4
0.6
0.8
1
Coefficient of Variation
CD
F
Flow Inter−Packet Arrival Variation Distribution [WITS−06] [packets ≥ 50]
elastic1elastic2inelastic
Fig. 4. Flow Inter Packet Arrival Variation Distribution – showing three flow kinds carrying at least 50 packets
155
International Journal on Advances in Systems and Measurements, vol 3 no 3 & 4, year 2010, http://www.iariajournals.org/systems_and_measurements/
2010, © Copyright by authors, Published under agreement with IARIA - www.iaria.org
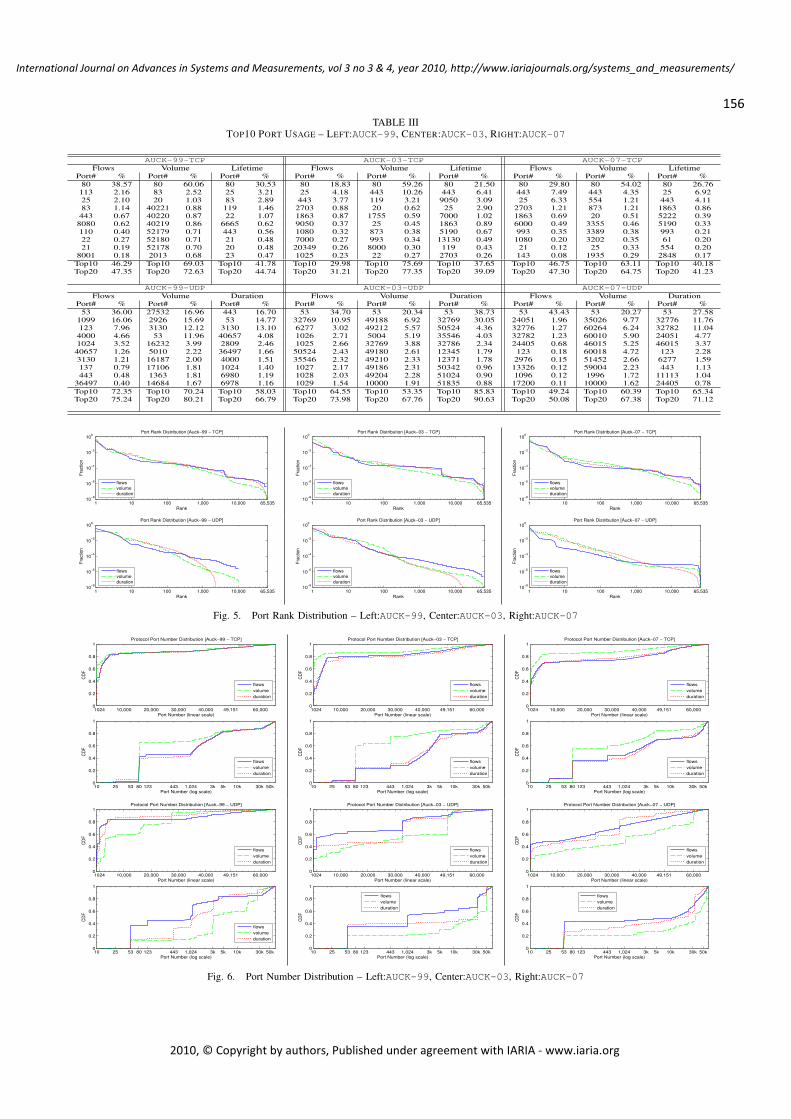
TABLE IIITOP10 PORT USAGE – LEFT:AUCK-99, CENTER:AUCK-03, RIGHT:AUCK-07
AUCK-99-TCP AUCK-03-TCP AUCK-07-TCPFlows Volume Lifetime Flows Volume Lifetime Flows Volume Lifetime
Port# % Port# % Port# % Port# % Port# % Port# % Port# % Port# % Port# %80 38.57 80 60.06 80 30.53 80 18.83 80 59.26 80 21.50 80 29.80 80 54.02 80 26.76113 2.16 83 2.52 25 3.21 25 4.18 443 10.26 443 6.41 443 7.49 443 4.35 25 6.9225 2.10 20 1.03 83 2.89 443 3.77 119 3.21 9050 3.09 25 6.33 554 1.21 443 4.1183 1.14 40221 0.88 119 1.46 2703 0.88 20 0.62 25 2.90 2703 1.21 873 1.21 1863 0.86
443 0.67 40220 0.87 22 1.07 1863 0.87 1755 0.59 7000 1.02 1863 0.69 20 0.51 5222 0.398080 0.62 40219 0.86 6665 0.62 9050 0.37 25 0.45 1863 0.89 6000 0.49 3355 0.46 5190 0.33110 0.40 52179 0.71 443 0.56 1080 0.32 873 0.38 5190 0.67 993 0.35 3389 0.38 993 0.2122 0.27 52180 0.71 21 0.48 7000 0.27 993 0.34 13130 0.49 1080 0.20 3202 0.35 61 0.2021 0.19 52178 0.70 20 0.48 20349 0.26 8000 0.30 119 0.43 21 0.12 25 0.33 554 0.20
8001 0.18 2013 0.68 23 0.47 1025 0.23 22 0.27 2703 0.26 143 0.08 1935 0.29 2848 0.17Top10 46.29 Top10 69.03 Top10 41.78 Top10 29.98 Top10 75.69 Top10 37.65 Top10 46.75 Top10 63.11 Top10 40.18Top20 47.35 Top20 72.63 Top20 44.74 Top20 31.21 Top20 77.35 Top20 39.09 Top20 47.30 Top20 64.75 Top20 41.23
AUCK-99-UDP AUCK-03-UDP AUCK-07-UDPFlows Volume Duration Flows Volume Duration Flows Volume Duration
Port# % Port# % Port# % Port# % Port# % Port# % Port# % Port# % Port# %53 36.00 27532 16.96 443 16.70 53 34.70 53 20.34 53 38.73 53 43.43 53 20.27 53 27.58
1099 16.06 2926 15.69 53 14.77 32769 10.95 49188 6.92 32769 30.05 24051 1.96 35026 9.77 32776 11.76123 7.96 3130 12.12 3130 13.10 6277 3.02 49212 5.57 50524 4.36 32776 1.27 60264 6.24 32782 11.044000 4.66 53 11.96 40657 4.08 1026 2.71 5004 5.19 35546 4.03 32782 1.23 60010 5.90 24051 4.771024 3.52 16232 3.99 2809 2.46 1025 2.66 32769 3.88 32786 2.34 24405 0.68 46015 5.25 46015 3.3740657 1.26 5010 2.22 36497 1.66 50524 2.43 49180 2.61 12345 1.79 123 0.18 60018 4.72 123 2.283130 1.21 16187 2.00 4000 1.51 35546 2.32 49210 2.33 12371 1.78 2976 0.15 51452 2.66 6277 1.59137 0.79 17106 1.81 1024 1.40 1027 2.17 49186 2.31 50342 0.96 13326 0.12 59004 2.23 443 1.13443 0.48 1363 1.81 6980 1.19 1028 2.03 49204 2.28 51024 0.90 1096 0.12 1996 1.72 11113 1.04
36497 0.40 14684 1.67 6978 1.16 1029 1.54 10000 1.91 51835 0.88 17200 0.11 10000 1.62 24405 0.78Top10 72.35 Top10 70.24 Top10 58.03 Top10 64.55 Top10 53.35 Top10 85.83 Top10 49.24 Top10 60.39 Top10 65.34Top20 75.24 Top20 80.21 Top20 66.79 Top20 73.98 Top20 67.76 Top20 90.63 Top20 50.08 Top20 67.38 Top20 71.12
1 10 100 1,000 10,000 65,53510
−8
10−6
10−4
10−2
100
Rank
Fra
ctio
n
Port Rank Distribution [Auck−99 − TCP]
flowsvolumeduration
1 10 100 1,000 10,000 65,53510
−8
10−6
10−4
10−2
100
Rank
Fra
ctio
n
Port Rank Distribution [Auck−03 − TCP]
flowsvolumeduration
1 10 100 1,000 10,000 65,53510
−8
10−6
10−4
10−2
100
RankF
ract
ion
Port Rank Distribution [Auck−07 − TCP]
flowsvolumeduration
1 10 100 1,000 10,000 65,53510
−8
10−6
10−4
10−2
100
Rank
Fra
ctio
n
Port Rank Distribution [Auck−99 − UDP]
flowsvolumeduration
1 10 100 1,000 10,000 65,53510
−8
10−6
10−4
10−2
100
Rank
Fra
ctio
n
Port Rank Distribution [Auck−03 − UDP]
flowsvolumeduration
1 10 100 1,000 10,000 65,53510
−8
10−6
10−4
10−2
100
Rank
Fra
ctio
nPort Rank Distribution [Auck−07 − UDP]
flowsvolumeduration
Fig. 5. Port Rank Distribution – Left:AUCK-99, Center:AUCK-03, Right:AUCK-07
1024 10,000 20,000 30,000 40,000 49,151 60,0000
0.2
0.4
0.6
0.8
1
Port Number (linear scale)
CD
F
Protocol Port Number Distribution [Auck−99 − TCP]
flowsvolumeduration
10 25 53 80 123 443 1,024 3k 5k 10k 30k 50k0
0.2
0.4
0.6
0.8
1
Port Number (log scale)
CD
F
flowsvolumeduration
1024 10,000 20,000 30,000 40,000 49,151 60,0000
0.2
0.4
0.6
0.8
1
Port Number (linear scale)
CD
F
Protocol Port Number Distribution [Auck−03 − TCP]
flowsvolumeduration
10 25 53 80 123 443 1,024 3k 5k 10k 30k 50k0
0.2
0.4
0.6
0.8
1
Port Number (log scale)
CD
F
flowsvolumeduration
1024 10,000 20,000 30,000 40,000 49,151 60,0000
0.2
0.4
0.6
0.8
1
Port Number (linear scale)
CD
F
Protocol Port Number Distribution [Auck−07 − TCP]
flowsvolumeduration
10 25 53 80 123 443 1,024 3k 5k 10k 30k 50k0
0.2
0.4
0.6
0.8
1
Port Number (log scale)
CD
F
flowsvolumeduration
1024 10,000 20,000 30,000 40,000 49,151 60,0000
0.2
0.4
0.6
0.8
1
Port Number (linear scale)
CD
F
Protocol Port Number Distribution [Auck−99 − UDP]
flowsvolumeduration
10 25 53 80 123 443 1,024 3k 5k 10k 30k 50k0
0.2
0.4
0.6
0.8
1
Port Number (log scale)
CD
F
flowsvolumeduration
1024 10,000 20,000 30,000 40,000 49,151 60,0000
0.2
0.4
0.6
0.8
1
Port Number (linear scale)
CD
F
Protocol Port Number Distribution [Auck−03 − UDP]
flowsvolumeduration
10 25 53 80 123 443 1,024 3k 5k 10k 30k 50k0
0.2
0.4
0.6
0.8
1
Port Number (log scale)
CD
F
flowsvolumeduration
1024 10,000 20,000 30,000 40,000 49,151 60,0000
0.2
0.4
0.6
0.8
1
Port Number (linear scale)
CD
F
Protocol Port Number Distribution [Auck−07 − UDP]
flowsvolumeduration
10 25 53 80 123 443 1,024 3k 5k 10k 30k 50k0
0.2
0.4
0.6
0.8
1
Port Number (log scale)
CD
F
flowsvolumeduration
Fig. 6. Port Number Distribution – Left:AUCK-99, Center:AUCK-03, Right:AUCK-07
156
International Journal on Advances in Systems and Measurements, vol 3 no 3 & 4, year 2010, http://www.iariajournals.org/systems_and_measurements/
2010, © Copyright by authors, Published under agreement with IARIA - www.iaria.org
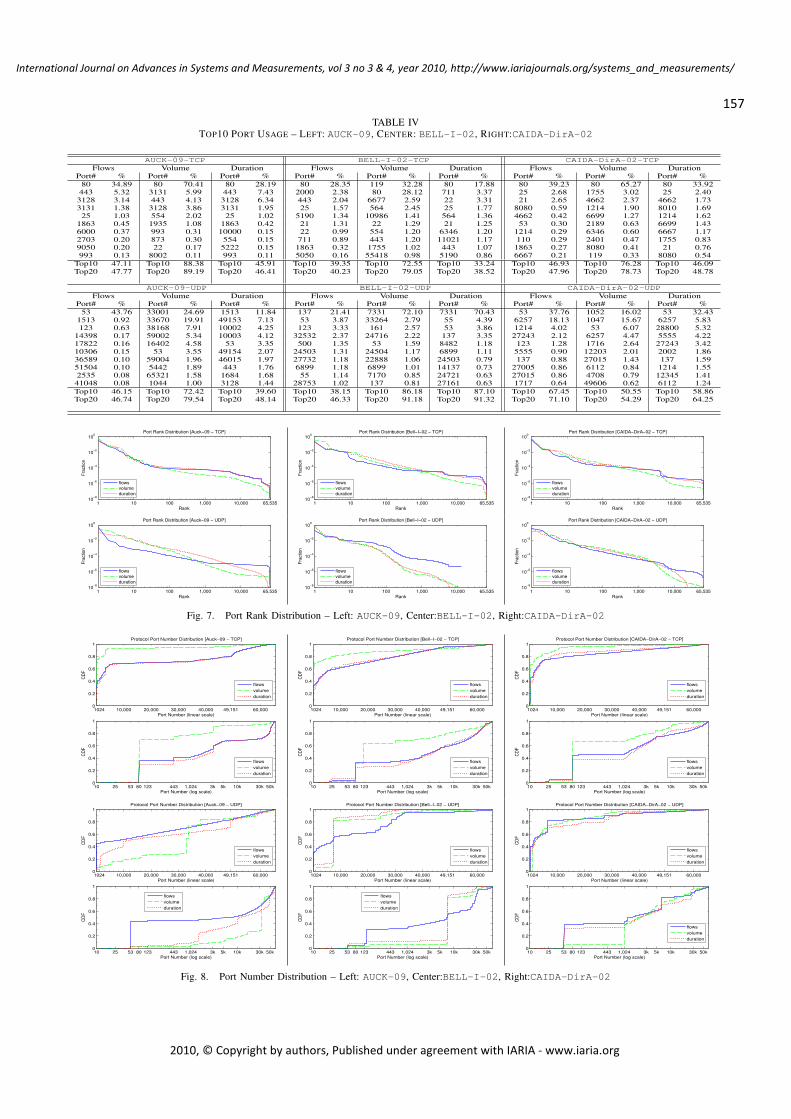
TABLE IVTOP10 PORT USAGE – LEFT: AUCK-09, CENTER: BELL-I-02, RIGHT:CAIDA-DirA-02
AUCK-09-TCP BELL-I-02-TCP CAIDA-DirA-02-TCPFlows Volume Duration Flows Volume Duration Flows Volume Duration
Port# % Port# % Port# % Port# % Port# % Port# % Port# % Port# % Port# %80 34.89 80 70.41 80 28.19 80 28.35 119 32.28 80 17.88 80 39.23 80 65.27 80 33.92443 5.32 3131 5.99 443 7.43 2000 2.38 80 28.12 711 3.37 25 2.68 1755 3.02 25 2.403128 3.14 443 4.13 3128 6.34 443 2.04 6677 2.59 22 3.31 21 2.65 4662 2.37 4662 1.733131 1.38 3128 3.86 3131 1.95 25 1.57 564 2.45 25 1.77 8080 0.59 1214 1.90 8010 1.6925 1.03 554 2.02 25 1.02 5190 1.34 10986 1.41 564 1.36 4662 0.42 6699 1.27 1214 1.62
1863 0.45 1935 1.08 1863 0.42 21 1.31 22 1.29 21 1.25 53 0.30 2189 0.63 6699 1.436000 0.37 993 0.31 10000 0.15 22 0.99 554 1.20 6346 1.20 1214 0.29 6346 0.60 6667 1.172703 0.20 873 0.30 554 0.15 711 0.89 443 1.20 11021 1.17 110 0.29 2401 0.47 1755 0.839050 0.20 22 0.17 5222 0.15 1863 0.32 1755 1.02 443 1.07 1863 0.27 8080 0.41 21 0.76993 0.13 8002 0.11 993 0.11 5050 0.16 55418 0.98 5190 0.86 6667 0.21 119 0.33 8080 0.54
Top10 47.11 Top10 88.38 Top10 45.91 Top10 39.35 Top10 72.55 Top10 33.24 Top10 46.93 Top10 76.28 Top10 46.09Top20 47.77 Top20 89.19 Top20 46.41 Top20 40.23 Top20 79.05 Top20 38.52 Top20 47.96 Top20 78.73 Top20 48.78
AUCK-09-UDP BELL-I-02-UDP CAIDA-DirA-02-UDPFlows Volume Duration Flows Volume Duration Flows Volume Duration
Port# % Port# % Port# % Port# % Port# % Port# % Port# % Port# % Port# %53 43.76 33001 24.69 1513 11.84 137 21.41 7331 72.10 7331 70.43 53 37.76 1052 16.02 53 32.43
1513 0.92 33670 19.91 49153 7.13 53 3.87 33264 2.79 55 4.39 6257 18.13 1047 15.67 6257 5.83123 0.63 38168 7.91 10002 4.25 123 3.33 161 2.57 53 3.86 1214 4.02 53 6.07 28800 5.32
14398 0.17 59002 5.34 10003 4.12 32532 2.37 24716 2.22 137 3.35 27243 2.12 6257 4.47 5555 4.2217822 0.16 16402 4.58 53 3.35 500 1.35 53 1.59 8482 1.18 123 1.28 1716 2.64 27243 3.4210306 0.15 53 3.55 49154 2.07 24503 1.31 24504 1.17 6899 1.11 5555 0.90 12203 2.01 2002 1.8636589 0.10 59004 1.96 46015 1.97 27732 1.18 22888 1.06 24503 0.79 137 0.88 27015 1.43 137 1.5951504 0.10 5442 1.89 443 1.76 6899 1.18 6899 1.01 14137 0.73 27005 0.86 6112 0.84 1214 1.552535 0.08 65321 1.58 1684 1.68 55 1.14 7170 0.85 24721 0.63 27015 0.86 4708 0.79 12345 1.41
41048 0.08 1044 1.00 3128 1.44 28753 1.02 137 0.81 27161 0.63 1717 0.64 49606 0.62 6112 1.24Top10 46.15 Top10 72.42 Top10 39.60 Top10 38.15 Top10 86.18 Top10 87.10 Top10 67.45 Top10 50.55 Top10 58.86Top20 46.74 Top20 79.54 Top20 48.14 Top20 46.33 Top20 91.18 Top20 91.32 Top20 71.10 Top20 54.29 Top20 64.25
1 10 100 1,000 10,000 65,53510
−8
10−6
10−4
10−2
100
Rank
Fra
ctio
n
Port Rank Distribution [Auck−09 − TCP]
flowsvolumeduration
1 10 100 1,000 10,000 65,53510
−8
10−6
10−4
10−2
100
Rank
Fra
ctio
n
Port Rank Distribution [Bell−I−02 − TCP]
flowsvolumeduration
1 10 100 1,000 10,000 65,53510
−8
10−6
10−4
10−2
100
Rank
Fra
ctio
n
Port Rank Distribution [CAIDA−DirA−02 − TCP]
flowsvolumeduration
1 10 100 1,000 10,000 65,53510
−8
10−6
10−4
10−2
100
Rank
Fra
ctio
n
Port Rank Distribution [Auck−09 − UDP]
flowsvolumeduration
1 10 100 1,000 10,000 65,53510
−8
10−6
10−4
10−2
100
Rank
Fra
ctio
n
Port Rank Distribution [Bell−I−02 − UDP]
flowsvolumeduration
1 10 100 1,000 10,000 65,53510
−8
10−6
10−4
10−2
100
Rank
Fra
ctio
nPort Rank Distribution [CAIDA−DirA−02 − UDP]
flowsvolumeduration
Fig. 7. Port Rank Distribution – Left: AUCK-09, Center:BELL-I-02, Right:CAIDA-DirA-02
1024 10,000 20,000 30,000 40,000 49,151 60,0000
0.2
0.4
0.6
0.8
1
Port Number (linear scale)
CD
F
Protocol Port Number Distribution [Auck−09 − TCP]
flowsvolumeduration
10 25 53 80 123 443 1,024 3k 5k 10k 30k 50k0
0.2
0.4
0.6
0.8
1
Port Number (log scale)
CD
F
flowsvolumeduration
1024 10,000 20,000 30,000 40,000 49,151 60,0000
0.2
0.4
0.6
0.8
1
Port Number (linear scale)
CD
F
Protocol Port Number Distribution [Bell−I−02 − TCP]
flowsvolumeduration
10 25 53 80 123 443 1,024 3k 5k 10k 30k 50k0
0.2
0.4
0.6
0.8
1
Port Number (log scale)
CD
F
flowsvolumeduration
1024 10,000 20,000 30,000 40,000 49,151 60,0000
0.2
0.4
0.6
0.8
1
Port Number (linear scale)
CD
F
Protocol Port Number Distribution [CAIDA−DirA−02 − TCP]
flowsvolumeduration
10 25 53 80 123 443 1,024 3k 5k 10k 30k 50k0
0.2
0.4
0.6
0.8
1
Port Number (log scale)
CD
F
flowsvolumeduration
1024 10,000 20,000 30,000 40,000 49,151 60,0000
0.2
0.4
0.6
0.8
1
Port Number (linear scale)
CD
F
Protocol Port Number Distribution [Auck−09 − UDP]
flowsvolumeduration
10 25 53 80 123 443 1,024 3k 5k 10k 30k 50k0
0.2
0.4
0.6
0.8
1
Port Number (log scale)
CD
F
flowsvolumeduration
1024 10,000 20,000 30,000 40,000 49,151 60,0000
0.2
0.4
0.6
0.8
1
Port Number (linear scale)
CD
F
Protocol Port Number Distribution [Bell−I−02 − UDP]
flowsvolumeduration
10 25 53 80 123 443 1,024 3k 5k 10k 30k 50k0
0.2
0.4
0.6
0.8
1
Port Number (log scale)
CD
F
flowsvolumeduration
1024 10,000 20,000 30,000 40,000 49,151 60,0000
0.2
0.4
0.6
0.8
1
Port Number (linear scale)
CD
F
Protocol Port Number Distribution [CAIDA−DirA−02 − UDP]
flowsvolumeduration
10 25 53 80 123 443 1,024 3k 5k 10k 30k 50k0
0.2
0.4
0.6
0.8
1
Port Number (log scale)
CD
F
flowsvolumeduration
Fig. 8. Port Number Distribution – Left: AUCK-09, Center:BELL-I-02, Right:CAIDA-DirA-02
157
International Journal on Advances in Systems and Measurements, vol 3 no 3 & 4, year 2010, http://www.iariajournals.org/systems_and_measurements/
2010, © Copyright by authors, Published under agreement with IARIA - www.iaria.org
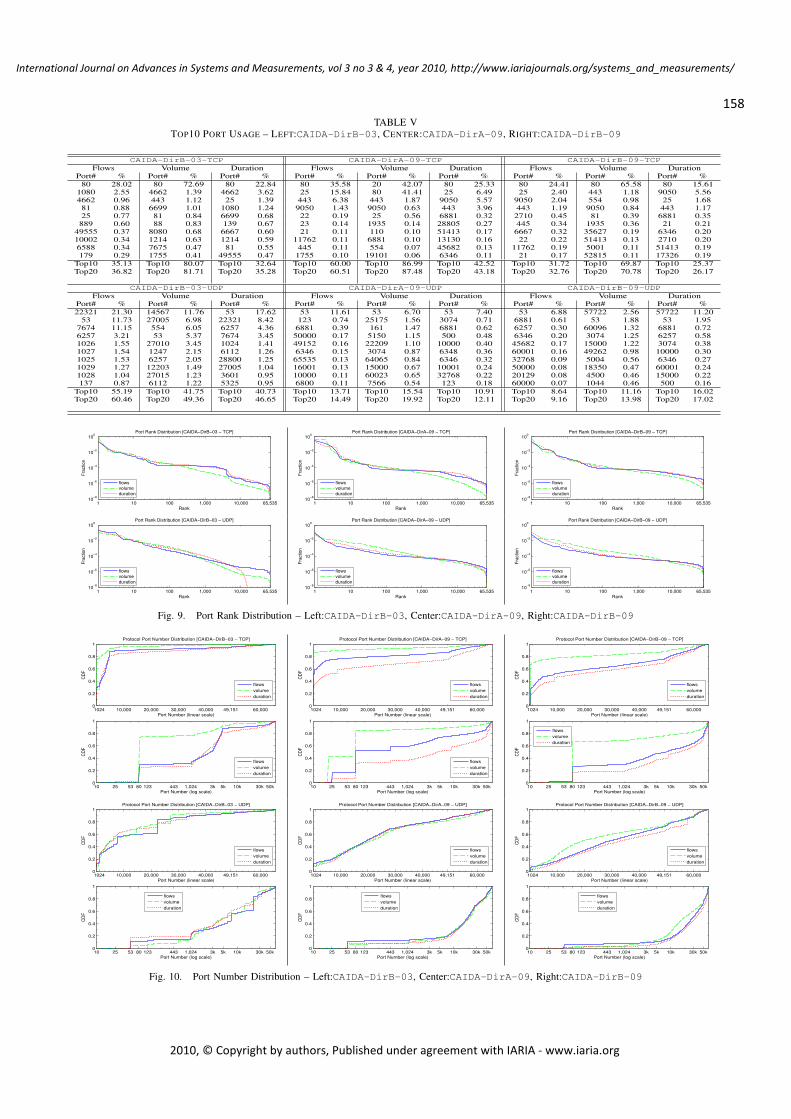
TABLE VTOP10 PORT USAGE – LEFT:CAIDA-DirB-03, CENTER:CAIDA-DirA-09, RIGHT:CAIDA-DirB-09
CAIDA-DirB-03-TCP CAIDA-DirA-09-TCP CAIDA-DirB-09-TCPFlows Volume Duration Flows Volume Duration Flows Volume Duration
Port# % Port# % Port# % Port# % Port# % Port# % Port# % Port# % Port# %80 28.02 80 72.69 80 22.84 80 35.58 20 42.07 80 25.33 80 24.41 80 65.58 80 15.61
1080 2.55 4662 1.39 4662 3.62 25 15.84 80 41.41 25 6.49 25 2.40 443 1.18 9050 5.564662 0.96 443 1.12 25 1.39 443 6.38 443 1.87 9050 5.57 9050 2.04 554 0.98 25 1.6881 0.88 6699 1.01 1080 1.24 9050 1.43 9050 0.63 443 3.96 443 1.19 9050 0.84 443 1.1725 0.77 81 0.84 6699 0.68 22 0.19 25 0.56 6881 0.32 2710 0.45 81 0.39 6881 0.35
889 0.60 88 0.83 139 0.67 23 0.14 1935 0.14 28805 0.27 445 0.34 1935 0.36 21 0.2149555 0.37 8080 0.68 6667 0.60 21 0.11 110 0.10 51413 0.17 6667 0.32 35627 0.19 6346 0.2010002 0.34 1214 0.63 1214 0.59 11762 0.11 6881 0.10 13130 0.16 22 0.22 51413 0.13 2710 0.206588 0.34 7675 0.47 81 0.55 445 0.11 554 0.07 45682 0.13 11762 0.19 5001 0.11 51413 0.19179 0.29 1755 0.41 49555 0.47 1755 0.10 19101 0.06 6346 0.11 21 0.17 52815 0.11 17326 0.19
Top10 35.13 Top10 80.07 Top10 32.64 Top10 60.00 Top10 86.99 Top10 42.52 Top10 31.72 Top10 69.87 Top10 25.37Top20 36.82 Top20 81.71 Top20 35.28 Top20 60.51 Top20 87.48 Top20 43.18 Top20 32.76 Top20 70.78 Top20 26.17
CAIDA-DirB-03-UDP CAIDA-DirA-09-UDP CAIDA-DirB-09-UDPFlows Volume Duration Flows Volume Duration Flows Volume Duration
Port# % Port# % Port# % Port# % Port# % Port# % Port# % Port# % Port# %22321 21.30 14567 11.76 53 17.62 53 11.61 53 6.70 53 7.40 53 6.88 57722 2.56 57722 11.20
53 11.73 27005 6.98 22321 8.42 123 0.74 25175 1.56 3074 0.71 6881 0.61 53 1.88 53 1.957674 11.15 554 6.05 6257 4.36 6881 0.39 161 1.47 6881 0.62 6257 0.30 60096 1.32 6881 0.726257 3.21 53 5.37 7674 3.45 50000 0.17 5150 1.15 500 0.48 6346 0.20 3074 1.25 6257 0.581026 1.55 27010 3.45 1024 1.41 49152 0.16 22209 1.10 10000 0.40 45682 0.17 15000 1.22 3074 0.381027 1.54 1247 2.15 6112 1.26 6346 0.15 3074 0.87 6348 0.36 60001 0.16 49262 0.98 10000 0.301025 1.53 6257 2.05 28800 1.25 65535 0.13 64065 0.84 6346 0.32 32768 0.09 5004 0.56 6346 0.271029 1.27 12203 1.49 27005 1.04 16001 0.13 15000 0.67 10001 0.24 50000 0.08 18350 0.47 60001 0.241028 1.04 27015 1.23 3601 0.95 10000 0.11 60023 0.65 32768 0.22 20129 0.08 4500 0.46 15000 0.22137 0.87 6112 1.22 5325 0.95 6800 0.11 7566 0.54 123 0.18 60000 0.07 1044 0.46 500 0.16
Top10 55.19 Top10 41.75 Top10 40.73 Top10 13.71 Top10 15.54 Top10 10.91 Top10 8.64 Top10 11.16 Top10 16.02Top20 60.46 Top20 49.36 Top20 46.65 Top20 14.49 Top20 19.92 Top20 12.11 Top20 9.16 Top20 13.98 Top20 17.02
1 10 100 1,000 10,000 65,53510
−8
10−6
10−4
10−2
100
Rank
Fra
ctio
n
Port Rank Distribution [CAIDA−DirB−03 − TCP]
flowsvolumeduration
1 10 100 1,000 10,000 65,53510
−8
10−6
10−4
10−2
100
Rank
Fra
ctio
n
Port Rank Distribution [CAIDA−DirA−09 − TCP]
flowsvolumeduration
1 10 100 1,000 10,000 65,53510
−8
10−6
10−4
10−2
100
Rank
Fra
ctio
n
Port Rank Distribution [CAIDA−DirB−09 − TCP]
flowsvolumeduration
1 10 100 1,000 10,000 65,53510
−8
10−6
10−4
10−2
100
Rank
Fra
ctio
n
Port Rank Distribution [CAIDA−DirB−03 − UDP]
flowsvolumeduration
1 10 100 1,000 10,000 65,53510
−8
10−6
10−4
10−2
100
Rank
Fra
ctio
n
Port Rank Distribution [CAIDA−DirA−09 − UDP]
flowsvolumeduration
1 10 100 1,000 10,000 65,53510
−8
10−6
10−4
10−2
100
Rank
Fra
ctio
nPort Rank Distribution [CAIDA−DirB−09 − UDP]
flowsvolumeduration
Fig. 9. Port Rank Distribution – Left:CAIDA-DirB-03, Center:CAIDA-DirA-09, Right:CAIDA-DirB-09
1024 10,000 20,000 30,000 40,000 49,151 60,0000
0.2
0.4
0.6
0.8
1
Port Number (linear scale)
CD
F
Protocol Port Number Distribution [CAIDA−DirB−03 − TCP]
flowsvolumeduration
10 25 53 80 123 443 1,024 3k 5k 10k 30k 50k0
0.2
0.4
0.6
0.8
1
Port Number (log scale)
CD
F
flowsvolumeduration
1024 10,000 20,000 30,000 40,000 49,151 60,0000
0.2
0.4
0.6
0.8
1
Port Number (linear scale)
CD
F
Protocol Port Number Distribution [CAIDA−DirA−09 − TCP]
flowsvolumeduration
10 25 53 80 123 443 1,024 3k 5k 10k 30k 50k0
0.2
0.4
0.6
0.8
1
Port Number (log scale)
CD
F
flowsvolumeduration
1024 10,000 20,000 30,000 40,000 49,151 60,0000
0.2
0.4
0.6
0.8
1
Port Number (linear scale)
CD
F
Protocol Port Number Distribution [CAIDA−DirB−09 − TCP]
flowsvolumeduration
10 25 53 80 123 443 1,024 3k 5k 10k 30k 50k0
0.2
0.4
0.6
0.8
1
Port Number (log scale)
CD
F
flowsvolumeduration
1024 10,000 20,000 30,000 40,000 49,151 60,0000
0.2
0.4
0.6
0.8
1
Port Number (linear scale)
CD
F
Protocol Port Number Distribution [CAIDA−DirB−03 − UDP]
flowsvolumeduration
10 25 53 80 123 443 1,024 3k 5k 10k 30k 50k0
0.2
0.4
0.6
0.8
1
Port Number (log scale)
CD
F
flowsvolumeduration
1024 10,000 20,000 30,000 40,000 49,151 60,0000
0.2
0.4
0.6
0.8
1
Port Number (linear scale)
CD
F
Protocol Port Number Distribution [CAIDA−DirA−09 − UDP]
flowsvolumeduration
10 25 53 80 123 443 1,024 3k 5k 10k 30k 50k0
0.2
0.4
0.6
0.8
1
Port Number (log scale)
CD
F
flowsvolumeduration
1024 10,000 20,000 30,000 40,000 49,151 60,0000
0.2
0.4
0.6
0.8
1
Port Number (linear scale)
CD
F
Protocol Port Number Distribution [CAIDA−DirB−09 − UDP]
flowsvolumeduration
10 25 53 80 123 443 1,024 3k 5k 10k 30k 50k0
0.2
0.4
0.6
0.8
1
Port Number (log scale)
CD
F
flowsvolumeduration
Fig. 10. Port Number Distribution – Left:CAIDA-DirB-03, Center:CAIDA-DirA-09, Right:CAIDA-DirB-09
158
International Journal on Advances in Systems and Measurements, vol 3 no 3 & 4, year 2010, http://www.iariajournals.org/systems_and_measurements/
2010, © Copyright by authors, Published under agreement with IARIA - www.iaria.org
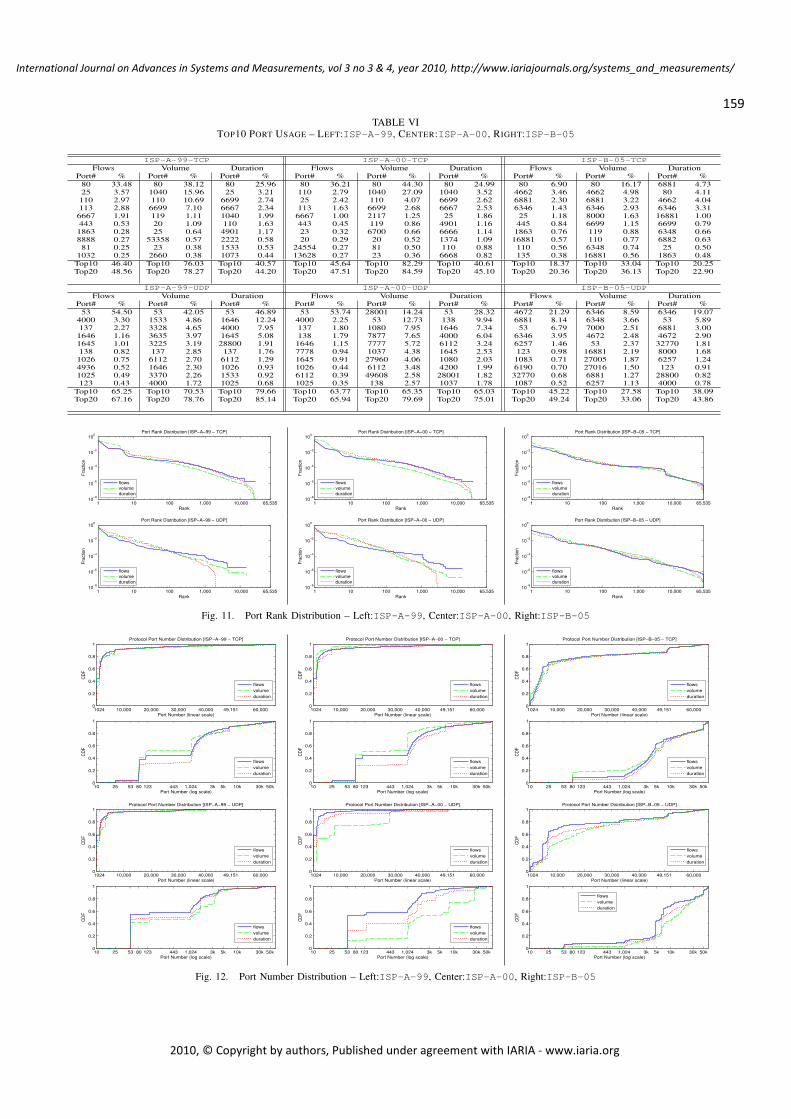
TABLE VITOP10 PORT USAGE – LEFT:ISP-A-99, CENTER:ISP-A-00, RIGHT:ISP-B-05
ISP-A-99-TCP ISP-A-00-TCP ISP-B-05-TCPFlows Volume Duration Flows Volume Duration Flows Volume Duration
Port# % Port# % Port# % Port# % Port# % Port# % Port# % Port# % Port# %80 33.48 80 38.12 80 25.96 80 36.21 80 44.30 80 24.99 80 6.90 80 16.17 6881 4.7325 3.57 1040 15.96 25 3.21 110 2.79 1040 27.09 1040 3.52 4662 3.46 4662 4.98 80 4.11110 2.97 110 10.69 6699 2.74 25 2.42 110 4.07 6699 2.62 6881 2.30 6881 3.22 4662 4.04113 2.88 6699 7.10 6667 2.34 113 1.63 6699 2.68 6667 2.53 6346 1.43 6346 2.93 6346 3.316667 1.91 119 1.11 1040 1.99 6667 1.00 2117 1.25 25 1.86 25 1.18 8000 1.63 16881 1.00443 0.53 20 1.09 110 1.63 443 0.45 119 0.86 4901 1.16 445 0.84 6699 1.15 6699 0.791863 0.28 25 0.64 4901 1.17 23 0.32 6700 0.66 6666 1.14 1863 0.76 119 0.88 6348 0.668888 0.27 53358 0.57 2222 0.58 20 0.29 20 0.52 1374 1.09 16881 0.57 110 0.77 6882 0.6381 0.25 23 0.38 1533 0.53 24554 0.27 81 0.50 110 0.88 110 0.56 6348 0.74 25 0.50
1032 0.25 2660 0.38 1073 0.44 13628 0.27 23 0.36 6668 0.82 135 0.38 16881 0.56 1863 0.48Top10 46.40 Top10 76.03 Top10 40.57 Top10 45.64 Top10 82.29 Top10 40.61 Top10 18.37 Top10 33.04 Top10 20.25Top20 48.56 Top20 78.27 Top20 44.20 Top20 47.51 Top20 84.59 Top20 45.10 Top20 20.36 Top20 36.13 Top20 22.90
ISP-A-99-UDP ISP-A-00-UDP ISP-B-05-UDPFlows Volume Duration Flows Volume Duration Flows Volume Duration
Port# % Port# % Port# % Port# % Port# % Port# % Port# % Port# % Port# %53 54.50 53 42.05 53 46.89 53 53.74 28001 14.24 53 28.32 4672 21.29 6346 8.59 6346 19.07
4000 3.30 1533 4.86 1646 12.24 4000 2.25 53 12.73 138 9.94 6881 8.14 6348 3.66 53 5.89137 2.27 3328 4.65 4000 7.95 137 1.80 1080 7.95 1646 7.34 53 6.79 7000 2.51 6881 3.001646 1.16 3635 3.97 1645 5.08 138 1.79 7877 7.65 4000 6.04 6346 3.95 4672 2.48 4672 2.901645 1.01 3225 3.19 28800 1.91 1646 1.15 7777 5.72 6112 3.24 6257 1.46 53 2.37 32770 1.81138 0.82 137 2.85 137 1.76 7778 0.94 1037 4.38 1645 2.53 123 0.98 16881 2.19 8000 1.681026 0.75 6112 2.70 6112 1.29 1645 0.91 27960 4.06 1080 2.03 1083 0.71 27005 1.87 6257 1.244936 0.52 1646 2.30 1026 0.93 1026 0.44 6112 3.48 4200 1.99 6190 0.70 27016 1.50 123 0.911025 0.49 3370 2.26 1533 0.92 6112 0.39 49608 2.58 28001 1.82 32770 0.68 6881 1.27 28800 0.82123 0.43 4000 1.72 1025 0.68 1025 0.35 138 2.57 1037 1.78 1087 0.52 6257 1.13 4000 0.78
Top10 65.25 Top10 70.53 Top10 79.66 Top10 63.77 Top10 65.35 Top10 65.03 Top10 45.22 Top10 27.58 Top10 38.09Top20 67.16 Top20 78.76 Top20 85.14 Top20 65.94 Top20 79.69 Top20 75.01 Top20 49.24 Top20 33.06 Top20 43.86
1 10 100 1,000 10,000 65,53510
−8
10−6
10−4
10−2
100
Rank
Fra
ctio
n
Port Rank Distribution [ISP−A−99 − TCP]
flowsvolumeduration
1 10 100 1,000 10,000 65,53510
−8
10−6
10−4
10−2
100
Rank
Fra
ctio
n
Port Rank Distribution [ISP−A−00 − TCP]
flowsvolumeduration
1 10 100 1,000 10,000 65,53510
−8
10−6
10−4
10−2
100
Rank
Fra
ctio
n
Port Rank Distribution [ISP−B−05 − TCP]
flowsvolumeduration
1 10 100 1,000 10,000 65,53510
−8
10−6
10−4
10−2
100
Rank
Fra
ctio
n
Port Rank Distribution [ISP−A−99 − UDP]
flowsvolumeduration
1 10 100 1,000 10,000 65,53510
−8
10−6
10−4
10−2
100
Rank
Fra
ctio
n
Port Rank Distribution [ISP−A−00 − UDP]
flowsvolumeduration
1 10 100 1,000 10,000 65,53510
−8
10−6
10−4
10−2
100
Rank
Fra
ctio
nPort Rank Distribution [ISP−B−05 − UDP]
flowsvolumeduration
Fig. 11. Port Rank Distribution – Left:ISP-A-99, Center:ISP-A-00, Right:ISP-B-05
1024 10,000 20,000 30,000 40,000 49,151 60,0000
0.2
0.4
0.6
0.8
1
Port Number (linear scale)
CD
F
Protocol Port Number Distribution [ISP−A−99 − TCP]
flowsvolumeduration
10 25 53 80 123 443 1,024 3k 5k 10k 30k 50k0
0.2
0.4
0.6
0.8
1
Port Number (log scale)
CD
F
flowsvolumeduration
1024 10,000 20,000 30,000 40,000 49,151 60,0000
0.2
0.4
0.6
0.8
1
Port Number (linear scale)
CD
F
Protocol Port Number Distribution [ISP−A−00 − TCP]
flowsvolumeduration
10 25 53 80 123 443 1,024 3k 5k 10k 30k 50k0
0.2
0.4
0.6
0.8
1
Port Number (log scale)
CD
F
flowsvolumeduration
1024 10,000 20,000 30,000 40,000 49,151 60,0000
0.2
0.4
0.6
0.8
1
Port Number (linear scale)
CD
F
Protocol Port Number Distribution [ISP−B−05 − TCP]
flowsvolumeduration
10 25 53 80 123 443 1,024 3k 5k 10k 30k 50k0
0.2
0.4
0.6
0.8
1
Port Number (log scale)
CD
F
flowsvolumeduration
1024 10,000 20,000 30,000 40,000 49,151 60,0000
0.2
0.4
0.6
0.8
1
Port Number (linear scale)
CD
F
Protocol Port Number Distribution [ISP−A−99 − UDP]
flowsvolumeduration
10 25 53 80 123 443 1,024 3k 5k 10k 30k 50k0
0.2
0.4
0.6
0.8
1
Port Number (log scale)
CD
F
flowsvolumeduration
1024 10,000 20,000 30,000 40,000 49,151 60,0000
0.2
0.4
0.6
0.8
1
Port Number (linear scale)
CD
F
Protocol Port Number Distribution [ISP−A−00 − UDP]
flowsvolumeduration
10 25 53 80 123 443 1,024 3k 5k 10k 30k 50k0
0.2
0.4
0.6
0.8
1
Port Number (log scale)
CD
F
flowsvolumeduration
1024 10,000 20,000 30,000 40,000 49,151 60,0000
0.2
0.4
0.6
0.8
1
Port Number (linear scale)
CD
F
Protocol Port Number Distribution [ISP−B−05 − UDP]
flowsvolumeduration
10 25 53 80 123 443 1,024 3k 5k 10k 30k 50k0
0.2
0.4
0.6
0.8
1
Port Number (log scale)
CD
F
flowsvolumeduration
Fig. 12. Port Number Distribution – Left:ISP-A-99, Center:ISP-A-00, Right:ISP-B-05
159
International Journal on Advances in Systems and Measurements, vol 3 no 3 & 4, year 2010, http://www.iariajournals.org/systems_and_measurements/
2010, © Copyright by authors, Published under agreement with IARIA - www.iaria.org
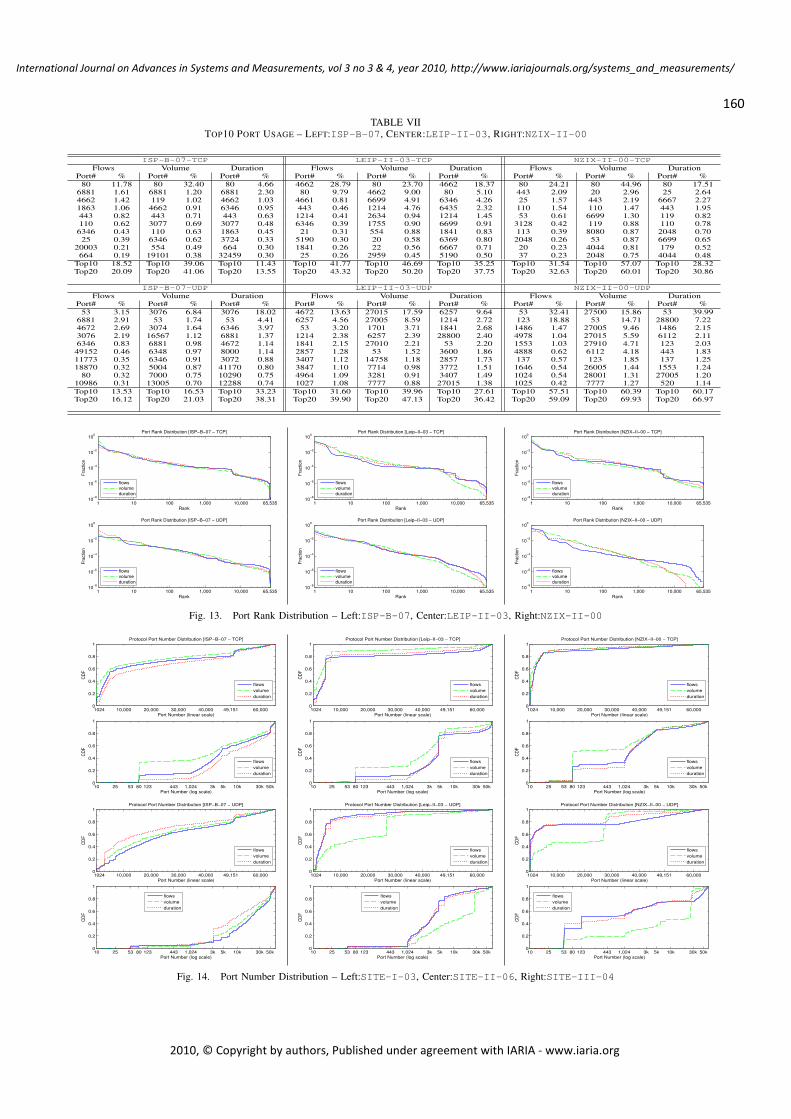
TABLE VIITOP10 PORT USAGE – LEFT:ISP-B-07, CENTER:LEIP-II-03, RIGHT:NZIX-II-00
ISP-B-07-TCP LEIP-II-03-TCP NZIX-II-00-TCPFlows Volume Duration Flows Volume Duration Flows Volume Duration
Port# % Port# % Port# % Port# % Port# % Port# % Port# % Port# % Port# %80 11.78 80 32.40 80 4.66 4662 28.79 80 23.70 4662 18.37 80 24.21 80 44.96 80 17.51
6881 1.61 6881 1.20 6881 2.30 80 9.79 4662 9.00 80 5.10 443 2.09 20 2.96 25 2.644662 1.42 119 1.02 4662 1.03 4661 0.81 6699 4.91 6346 4.26 25 1.57 443 2.19 6667 2.271863 1.06 4662 0.91 6346 0.95 443 0.46 1214 4.76 6435 2.32 110 1.54 110 1.47 443 1.95443 0.82 443 0.71 443 0.63 1214 0.41 2634 0.94 1214 1.45 53 0.61 6699 1.30 119 0.82110 0.62 3077 0.69 3077 0.48 6346 0.39 1755 0.90 6699 0.91 3128 0.42 119 0.88 110 0.78
6346 0.43 110 0.63 1863 0.45 21 0.31 554 0.88 1841 0.83 113 0.39 8080 0.87 2048 0.7025 0.39 6346 0.62 3724 0.33 5190 0.30 20 0.58 6369 0.80 2048 0.26 53 0.87 6699 0.65
20003 0.21 554 0.49 664 0.30 1841 0.26 22 0.56 6667 0.71 20 0.23 4044 0.81 179 0.52664 0.19 19101 0.38 32459 0.30 25 0.26 2959 0.45 5190 0.50 37 0.23 2048 0.75 4044 0.48
Top10 18.52 Top10 39.06 Top10 11.43 Top10 41.77 Top10 46.69 Top10 35.25 Top10 31.54 Top10 57.07 Top10 28.32Top20 20.09 Top20 41.06 Top20 13.55 Top20 43.32 Top20 50.20 Top20 37.75 Top20 32.63 Top20 60.01 Top20 30.86
ISP-B-07-UDP LEIP-II-03-UDP NZIX-II-00-UDPFlows Volume Duration Flows Volume Duration Flows Volume Duration
Port# % Port# % Port# % Port# % Port# % Port# % Port# % Port# % Port# %53 3.15 3076 6.84 3076 18.02 4672 13.63 27015 17.59 6257 9.64 53 32.41 27500 15.86 53 39.99
6881 2.91 53 1.74 53 4.41 6257 4.56 27005 8.59 1214 2.72 123 18.88 53 14.71 28800 7.224672 2.69 3074 1.64 6346 3.97 53 3.20 1701 3.71 1841 2.68 1486 1.47 27005 9.46 1486 2.153076 2.19 16567 1.12 6881 1.37 1214 2.38 6257 2.39 28800 2.40 4978 1.04 27015 5.59 6112 2.116346 0.83 6881 0.98 4672 1.14 1841 2.15 27010 2.21 53 2.20 1553 1.03 27910 4.71 123 2.03
49152 0.46 6348 0.97 8000 1.14 2857 1.28 53 1.52 3600 1.86 4888 0.62 6112 4.18 443 1.8311773 0.35 6346 0.91 3072 0.88 3407 1.12 14758 1.18 2857 1.73 137 0.57 123 1.85 137 1.2518870 0.32 5004 0.87 41170 0.80 3847 1.10 7714 0.98 3772 1.51 1646 0.54 26005 1.44 1553 1.24
80 0.32 7000 0.75 10290 0.75 4964 1.09 3281 0.91 3407 1.49 1024 0.54 28001 1.31 27005 1.2010986 0.31 13005 0.70 12288 0.74 1027 1.08 7777 0.88 27015 1.38 1025 0.42 7777 1.27 520 1.14Top10 13.53 Top10 16.53 Top10 33.23 Top10 31.60 Top10 39.96 Top10 27.61 Top10 57.51 Top10 60.39 Top10 60.17Top20 16.12 Top20 21.03 Top20 38.31 Top20 39.90 Top20 47.13 Top20 36.42 Top20 59.09 Top20 69.93 Top20 66.97
1 10 100 1,000 10,000 65,53510
−8
10−6
10−4
10−2
100
Rank
Fra
ctio
n
Port Rank Distribution [ISP−B−07 − TCP]
flowsvolumeduration
1 10 100 1,000 10,000 65,53510
−8
10−6
10−4
10−2
100
Rank
Fra
ctio
n
Port Rank Distribution [Leip−II−03 − TCP]
flowsvolumeduration
1 10 100 1,000 10,000 65,53510
−8
10−6
10−4
10−2
100
Rank
Fra
ctio
n
Port Rank Distribution [NZIX−II−00 − TCP]
flowsvolumeduration
1 10 100 1,000 10,000 65,53510
−8
10−6
10−4
10−2
100
Rank
Fra
ctio
n
Port Rank Distribution [ISP−B−07 − UDP]
flowsvolumeduration
1 10 100 1,000 10,000 65,53510
−8
10−6
10−4
10−2
100
Rank
Fra
ctio
n
Port Rank Distribution [Leip−II−03 − UDP]
flowsvolumeduration
1 10 100 1,000 10,000 65,53510
−8
10−6
10−4
10−2
100
Rank
Fra
ctio
nPort Rank Distribution [NZIX−II−00 − UDP]
flowsvolumeduration
Fig. 13. Port Rank Distribution – Left:ISP-B-07, Center:LEIP-II-03, Right:NZIX-II-00
1024 10,000 20,000 30,000 40,000 49,151 60,0000
0.2
0.4
0.6
0.8
1
Port Number (linear scale)
CD
F
Protocol Port Number Distribution [ISP−B−07 − TCP]
flowsvolumeduration
10 25 53 80 123 443 1,024 3k 5k 10k 30k 50k0
0.2
0.4
0.6
0.8
1
Port Number (log scale)
CD
F
flowsvolumeduration
1024 10,000 20,000 30,000 40,000 49,151 60,0000
0.2
0.4
0.6
0.8
1
Port Number (linear scale)
CD
F
Protocol Port Number Distribution [Leip−II−03 − TCP]
flowsvolumeduration
10 25 53 80 123 443 1,024 3k 5k 10k 30k 50k0
0.2
0.4
0.6
0.8
1
Port Number (log scale)
CD
F
flowsvolumeduration
1024 10,000 20,000 30,000 40,000 49,151 60,0000
0.2
0.4
0.6
0.8
1
Port Number (linear scale)
CD
F
Protocol Port Number Distribution [NZIX−II−00 − TCP]
flowsvolumeduration
10 25 53 80 123 443 1,024 3k 5k 10k 30k 50k0
0.2
0.4
0.6
0.8
1
Port Number (log scale)
CD
F
flowsvolumeduration
1024 10,000 20,000 30,000 40,000 49,151 60,0000
0.2
0.4
0.6
0.8
1
Port Number (linear scale)
CD
F
Protocol Port Number Distribution [ISP−B−07 − UDP]
flowsvolumeduration
10 25 53 80 123 443 1,024 3k 5k 10k 30k 50k0
0.2
0.4
0.6
0.8
1
Port Number (log scale)
CD
F
flowsvolumeduration
1024 10,000 20,000 30,000 40,000 49,151 60,0000
0.2
0.4
0.6
0.8
1
Port Number (linear scale)
CD
F
Protocol Port Number Distribution [Leip−II−03 − UDP]
flowsvolumeduration
10 25 53 80 123 443 1,024 3k 5k 10k 30k 50k0
0.2
0.4
0.6
0.8
1
Port Number (log scale)
CD
F
flowsvolumeduration
1024 10,000 20,000 30,000 40,000 49,151 60,0000
0.2
0.4
0.6
0.8
1
Port Number (linear scale)
CD
F
Protocol Port Number Distribution [NZIX−II−00 − UDP]
flowsvolumeduration
10 25 53 80 123 443 1,024 3k 5k 10k 30k 50k0
0.2
0.4
0.6
0.8
1
Port Number (log scale)
CD
F
flowsvolumeduration
Fig. 14. Port Number Distribution – Left:SITE-I-03, Center:SITE-II-06, Right:SITE-III-04
160
International Journal on Advances in Systems and Measurements, vol 3 no 3 & 4, year 2010, http://www.iariajournals.org/systems_and_measurements/
2010, © Copyright by authors, Published under agreement with IARIA - www.iaria.org
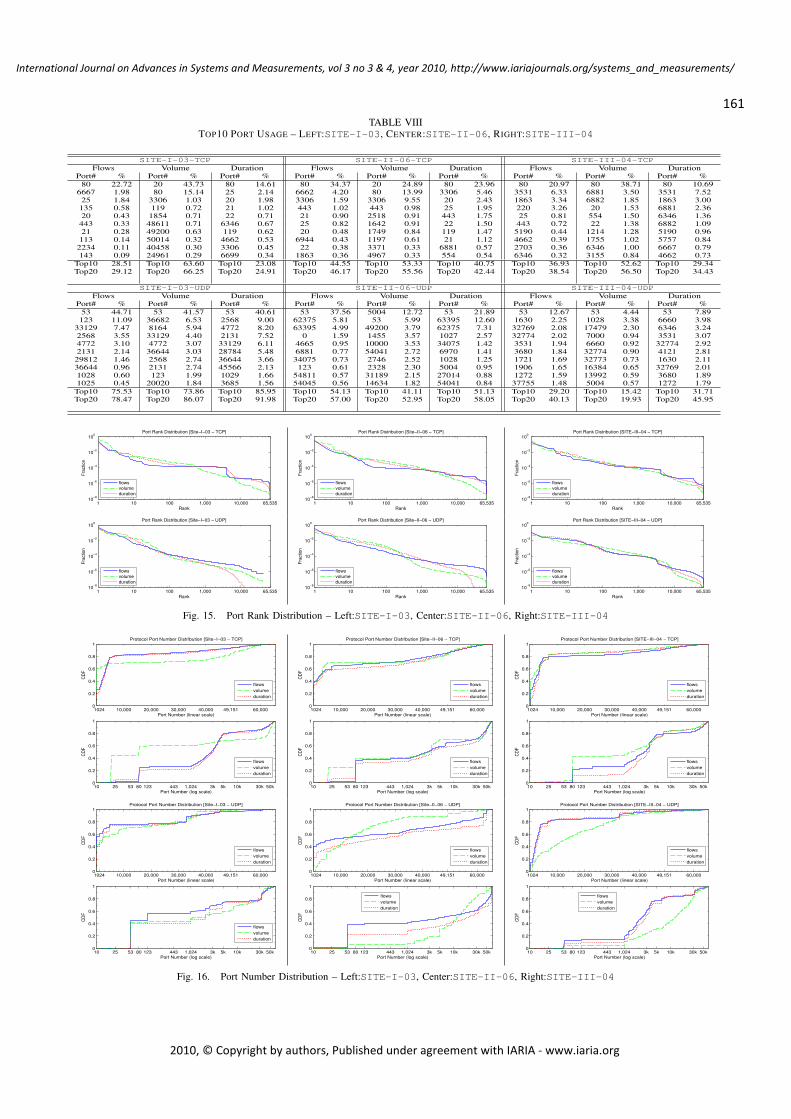
TABLE VIIITOP10 PORT USAGE – LEFT:SITE-I-03, CENTER:SITE-II-06, RIGHT:SITE-III-04
SITE-I-03-TCP SITE-II-06-TCP SITE-III-04-TCPFlows Volume Duration Flows Volume Duration Flows Volume Duration
Port# % Port# % Port# % Port# % Port# % Port# % Port# % Port# % Port# %80 22.72 20 43.73 80 14.61 80 34.37 20 24.89 80 23.96 80 20.97 80 38.71 80 10.69
6667 1.98 80 15.14 25 2.14 6662 4.20 80 13.99 3306 5.46 3531 6.33 6881 3.50 3531 7.5225 1.84 3306 1.03 20 1.98 3306 1.59 3306 9.55 20 2.43 1863 3.34 6882 1.85 1863 3.00135 0.58 119 0.72 21 1.02 443 1.02 443 0.98 25 1.95 220 3.26 20 1.53 6881 2.3620 0.43 1854 0.71 22 0.71 21 0.90 2518 0.91 443 1.75 25 0.81 554 1.50 6346 1.36443 0.33 48611 0.71 6346 0.67 25 0.82 1642 0.91 22 1.50 443 0.72 22 1.38 6882 1.0921 0.28 49200 0.63 119 0.62 20 0.48 1749 0.84 119 1.47 5190 0.44 1214 1.28 5190 0.96113 0.14 50014 0.32 4662 0.53 6944 0.43 1197 0.61 21 1.12 4662 0.39 1755 1.02 5757 0.842234 0.11 40458 0.30 3306 0.45 22 0.38 3371 0.33 6881 0.57 2703 0.36 6346 1.00 6667 0.79143 0.09 24961 0.29 6699 0.34 1863 0.36 4967 0.33 554 0.54 6346 0.32 3155 0.84 4662 0.73
Top10 28.51 Top10 63.60 Top10 23.08 Top10 44.55 Top10 53.33 Top10 40.75 Top10 36.93 Top10 52.62 Top10 29.34Top20 29.12 Top20 66.25 Top20 24.91 Top20 46.17 Top20 55.56 Top20 42.44 Top20 38.54 Top20 56.50 Top20 34.43
SITE-I-03-UDP SITE-II-06-UDP SITE-III-04-UDPFlows Volume Duration Flows Volume Duration Flows Volume Duration
Port# % Port# % Port# % Port# % Port# % Port# % Port# % Port# % Port# %53 44.71 53 41.57 53 40.61 53 37.56 5004 12.72 53 21.89 53 12.67 53 4.44 53 7.89123 11.09 36682 6.53 2568 9.00 62375 5.81 53 5.99 63395 12.60 1630 2.25 1028 3.38 6660 3.98
33129 7.47 8164 5.94 4772 8.20 63395 4.99 49200 3.79 62375 7.31 32769 2.08 17479 2.30 6346 3.242568 3.55 33129 4.40 2131 7.52 0 1.59 1455 3.57 1027 2.57 32774 2.02 7000 0.94 3531 3.074772 3.10 4772 3.07 33129 6.11 4665 0.95 10000 3.53 34075 1.42 3531 1.94 6660 0.92 32774 2.922131 2.14 36644 3.03 28784 5.48 6881 0.77 54041 2.72 6970 1.41 3680 1.84 32774 0.90 4121 2.81
29812 1.46 2568 2.74 36644 3.66 34075 0.73 2746 2.52 1028 1.25 1721 1.69 32773 0.73 1630 2.1136644 0.96 2131 2.74 45566 2.13 123 0.61 2328 2.30 5004 0.95 1906 1.65 16384 0.65 32769 2.011028 0.60 123 1.99 1029 1.66 54811 0.57 31189 2.15 27014 0.88 1272 1.59 13992 0.59 3680 1.891025 0.45 20020 1.84 3685 1.56 54045 0.56 14634 1.82 54041 0.84 37755 1.48 5004 0.57 1272 1.79
Top10 75.53 Top10 73.86 Top10 85.95 Top10 54.13 Top10 41.11 Top10 51.13 Top10 29.20 Top10 15.42 Top10 31.71Top20 78.47 Top20 86.07 Top20 91.98 Top20 57.00 Top20 52.95 Top20 58.05 Top20 40.13 Top20 19.93 Top20 45.95
1 10 100 1,000 10,000 65,53510
−8
10−6
10−4
10−2
100
Rank
Fra
ctio
n
Port Rank Distribution [Site−I−03 − TCP]
flowsvolumeduration
1 10 100 1,000 10,000 65,53510
−8
10−6
10−4
10−2
100
Rank
Fra
ctio
n
Port Rank Distribution [Site−II−06 − TCP]
flowsvolumeduration
1 10 100 1,000 10,000 65,53510
−8
10−6
10−4
10−2
100
Rank
Fra
ctio
n
Port Rank Distribution [SITE−III−04 − TCP]
flowsvolumeduration
1 10 100 1,000 10,000 65,53510
−8
10−6
10−4
10−2
100
Rank
Fra
ctio
n
Port Rank Distribution [Site−I−03 − UDP]
flowsvolumeduration
1 10 100 1,000 10,000 65,53510
−8
10−6
10−4
10−2
100
Rank
Fra
ctio
n
Port Rank Distribution [Site−II−06 − UDP]
flowsvolumeduration
1 10 100 1,000 10,000 65,53510
−8
10−6
10−4
10−2
100
Rank
Fra
ctio
nPort Rank Distribution [SITE−III−04 − UDP]
flowsvolumeduration
Fig. 15. Port Rank Distribution – Left:SITE-I-03, Center:SITE-II-06, Right:SITE-III-04
1024 10,000 20,000 30,000 40,000 49,151 60,0000
0.2
0.4
0.6
0.8
1
Port Number (linear scale)
CD
F
Protocol Port Number Distribution [Site−I−03 − TCP]
flowsvolumeduration
10 25 53 80 123 443 1,024 3k 5k 10k 30k 50k0
0.2
0.4
0.6
0.8
1
Port Number (log scale)
CD
F
flowsvolumeduration
1024 10,000 20,000 30,000 40,000 49,151 60,0000
0.2
0.4
0.6
0.8
1
Port Number (linear scale)
CD
F
Protocol Port Number Distribution [Site−II−06 − TCP]
flowsvolumeduration
10 25 53 80 123 443 1,024 3k 5k 10k 30k 50k0
0.2
0.4
0.6
0.8
1
Port Number (log scale)
CD
F
flowsvolumeduration
1024 10,000 20,000 30,000 40,000 49,151 60,0000
0.2
0.4
0.6
0.8
1
Port Number (linear scale)
CD
F
Protocol Port Number Distribution [SITE−III−04 − TCP]
flowsvolumeduration
10 25 53 80 123 443 1,024 3k 5k 10k 30k 50k0
0.2
0.4
0.6
0.8
1
Port Number (log scale)
CD
F
flowsvolumeduration
1024 10,000 20,000 30,000 40,000 49,151 60,0000
0.2
0.4
0.6
0.8
1
Port Number (linear scale)
CD
F
Protocol Port Number Distribution [Site−I−03 − UDP]
flowsvolumeduration
10 25 53 80 123 443 1,024 3k 5k 10k 30k 50k0
0.2
0.4
0.6
0.8
1
Port Number (log scale)
CD
F
flowsvolumeduration
1024 10,000 20,000 30,000 40,000 49,151 60,0000
0.2
0.4
0.6
0.8
1
Port Number (linear scale)
CD
F
Protocol Port Number Distribution [Site−II−06 − UDP]
flowsvolumeduration
10 25 53 80 123 443 1,024 3k 5k 10k 30k 50k0
0.2
0.4
0.6
0.8
1
Port Number (log scale)
CD
F
flowsvolumeduration
1024 10,000 20,000 30,000 40,000 49,151 60,0000
0.2
0.4
0.6
0.8
1
Port Number (linear scale)
CD
F
Protocol Port Number Distribution [SITE−III−04 − UDP]
flowsvolumeduration
10 25 53 80 123 443 1,024 3k 5k 10k 30k 50k0
0.2
0.4
0.6
0.8
1
Port Number (log scale)
CD
F
flowsvolumeduration
Fig. 16. Port Number Distribution – Left:SITE-I-03, Center:SITE-II-06, Right:SITE-III-04
161
International Journal on Advances in Systems and Measurements, vol 3 no 3 & 4, year 2010, http://www.iariajournals.org/systems_and_measurements/
2010, © Copyright by authors, Published under agreement with IARIA - www.iaria.org
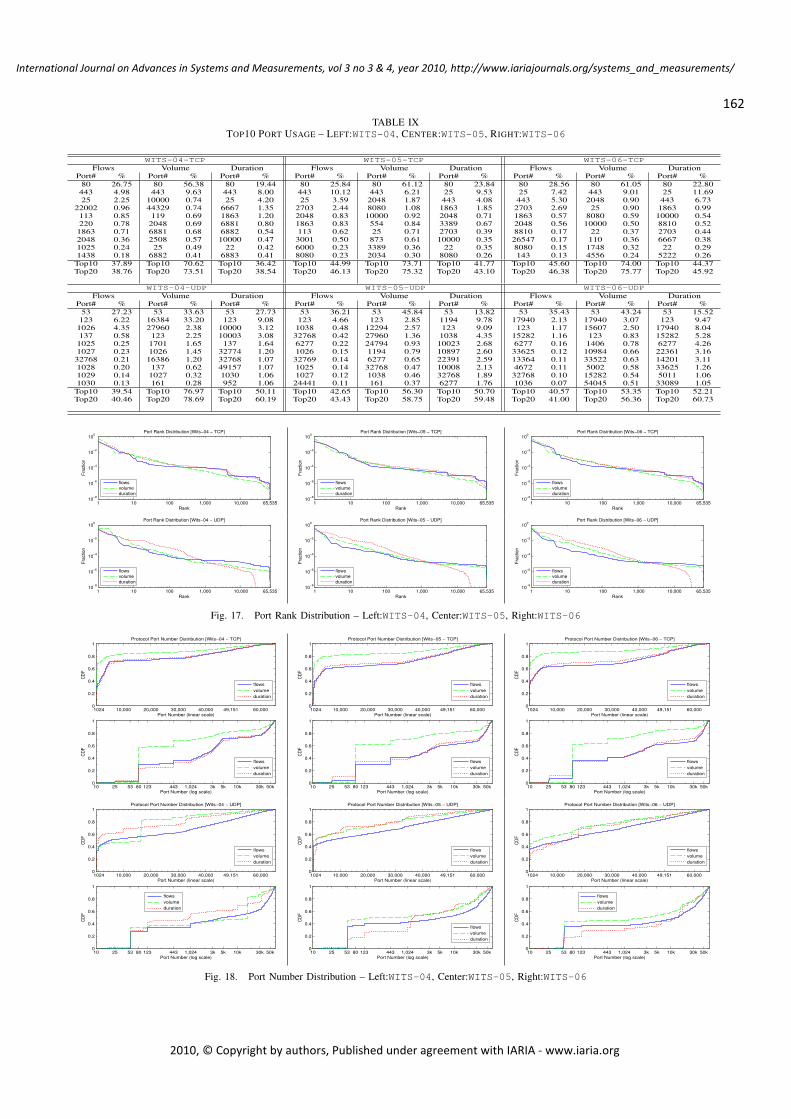
TABLE IXTOP10 PORT USAGE – LEFT:WITS-04, CENTER:WITS-05, RIGHT:WITS-06
WITS-04-TCP WITS-05-TCP WITS-06-TCPFlows Volume Duration Flows Volume Duration Flows Volume Duration
Port# % Port# % Port# % Port# % Port# % Port# % Port# % Port# % Port# %80 26.75 80 56.38 80 19.44 80 25.84 80 61.12 80 23.84 80 28.56 80 61.05 80 22.80443 4.98 443 9.63 443 8.00 443 10.12 443 6.21 25 9.53 25 7.42 443 9.01 25 11.6925 2.25 10000 0.74 25 4.20 25 3.59 2048 1.87 443 4.08 443 5.30 2048 0.90 443 6.73
22002 0.96 44329 0.74 6667 1.35 2703 2.44 8080 1.08 1863 1.85 2703 2.69 25 0.90 1863 0.99113 0.85 119 0.69 1863 1.20 2048 0.83 10000 0.92 2048 0.71 1863 0.57 8080 0.59 10000 0.54220 0.78 2048 0.69 6881 0.80 1863 0.83 554 0.84 3389 0.67 2048 0.56 10000 0.50 8810 0.521863 0.71 6881 0.68 6882 0.54 113 0.62 25 0.71 2703 0.39 8810 0.17 22 0.37 2703 0.442048 0.36 2508 0.57 10000 0.47 3001 0.50 873 0.61 10000 0.35 26547 0.17 110 0.36 6667 0.381025 0.24 25 0.49 22 0.42 6000 0.23 3389 0.36 22 0.35 8080 0.15 1748 0.32 22 0.291438 0.18 6882 0.41 6883 0.41 8080 0.23 2034 0.30 8080 0.26 143 0.13 4556 0.24 5222 0.26
Top10 37.89 Top10 70.62 Top10 36.42 Top10 44.99 Top10 73.71 Top10 41.77 Top10 45.60 Top10 74.00 Top10 44.37Top20 38.76 Top20 73.51 Top20 38.54 Top20 46.13 Top20 75.32 Top20 43.10 Top20 46.38 Top20 75.77 Top20 45.92
WITS-04-UDP WITS-05-UDP WITS-06-UDPFlows Volume Duration Flows Volume Duration Flows Volume Duration
Port# % Port# % Port# % Port# % Port# % Port# % Port# % Port# % Port# %53 27.23 53 33.63 53 27.73 53 36.21 53 45.84 53 13.82 53 35.43 53 43.24 53 15.52123 6.22 16384 33.20 123 9.08 123 4.66 123 2.85 1194 9.78 17940 2.13 17940 3.07 123 9.471026 4.35 27960 2.38 10000 3.12 1038 0.48 12294 2.57 123 9.09 123 1.17 15607 2.50 17940 8.04137 0.58 123 2.25 10003 3.08 32768 0.42 27960 1.36 1038 4.35 15282 1.16 123 0.83 15282 5.281025 0.25 1701 1.65 137 1.64 6277 0.22 24794 0.93 10023 2.68 6277 0.16 1406 0.78 6277 4.261027 0.23 1026 1.45 32774 1.20 1026 0.15 1194 0.79 10897 2.60 33625 0.12 10984 0.66 22361 3.16
32768 0.21 16386 1.20 32768 1.07 32769 0.14 6277 0.65 22391 2.59 13364 0.11 33522 0.63 14201 3.111028 0.20 137 0.62 49157 1.07 1025 0.14 32768 0.47 10008 2.13 4672 0.11 5002 0.58 33625 1.261029 0.14 1027 0.32 1030 1.06 1027 0.12 1038 0.46 32768 1.89 32768 0.10 15282 0.54 5011 1.061030 0.13 161 0.28 952 1.06 24441 0.11 161 0.37 6277 1.76 1036 0.07 54045 0.51 33089 1.05
Top10 39.54 Top10 76.97 Top10 50.11 Top10 42.65 Top10 56.30 Top10 50.70 Top10 40.57 Top10 53.35 Top10 52.21Top20 40.46 Top20 78.69 Top20 60.19 Top20 43.43 Top20 58.75 Top20 59.48 Top20 41.00 Top20 56.36 Top20 60.73
1 10 100 1,000 10,000 65,53510
−8
10−6
10−4
10−2
100
Rank
Fra
ctio
n
Port Rank Distribution [Wits−04 − TCP]
flowsvolumeduration
1 10 100 1,000 10,000 65,53510
−8
10−6
10−4
10−2
100
Rank
Fra
ctio
n
Port Rank Distribution [Wits−05 − TCP]
flowsvolumeduration
1 10 100 1,000 10,000 65,53510
−8
10−6
10−4
10−2
100
Rank
Fra
ctio
n
Port Rank Distribution [Wits−06 − TCP]
flowsvolumeduration
1 10 100 1,000 10,000 65,53510
−8
10−6
10−4
10−2
100
Rank
Fra
ctio
n
Port Rank Distribution [Wits−04 − UDP]
flowsvolumeduration
1 10 100 1,000 10,000 65,53510
−8
10−6
10−4
10−2
100
Rank
Fra
ctio
n
Port Rank Distribution [Wits−05 − UDP]
flowsvolumeduration
1 10 100 1,000 10,000 65,53510
−8
10−6
10−4
10−2
100
Rank
Fra
ctio
nPort Rank Distribution [Wits−06 − UDP]
flowsvolumeduration
Fig. 17. Port Rank Distribution – Left:WITS-04, Center:WITS-05, Right:WITS-06
1024 10,000 20,000 30,000 40,000 49,151 60,0000
0.2
0.4
0.6
0.8
1
Port Number (linear scale)
CD
F
Protocol Port Number Distribution [Wits−04 − TCP]
flowsvolumeduration
10 25 53 80 123 443 1,024 3k 5k 10k 30k 50k0
0.2
0.4
0.6
0.8
1
Port Number (log scale)
CD
F
flowsvolumeduration
1024 10,000 20,000 30,000 40,000 49,151 60,0000
0.2
0.4
0.6
0.8
1
Port Number (linear scale)
CD
F
Protocol Port Number Distribution [Wits−05 − TCP]
flowsvolumeduration
10 25 53 80 123 443 1,024 3k 5k 10k 30k 50k0
0.2
0.4
0.6
0.8
1
Port Number (log scale)
CD
F
flowsvolumeduration
1024 10,000 20,000 30,000 40,000 49,151 60,0000
0.2
0.4
0.6
0.8
1
Port Number (linear scale)
CD
F
Protocol Port Number Distribution [Wits−06 − TCP]
flowsvolumeduration
10 25 53 80 123 443 1,024 3k 5k 10k 30k 50k0
0.2
0.4
0.6
0.8
1
Port Number (log scale)
CD
F
flowsvolumeduration
1024 10,000 20,000 30,000 40,000 49,151 60,0000
0.2
0.4
0.6
0.8
1
Port Number (linear scale)
CD
F
Protocol Port Number Distribution [Wits−04 − UDP]
flowsvolumeduration
10 25 53 80 123 443 1,024 3k 5k 10k 30k 50k0
0.2
0.4
0.6
0.8
1
Port Number (log scale)
CD
F
flowsvolumeduration
1024 10,000 20,000 30,000 40,000 49,151 60,0000
0.2
0.4
0.6
0.8
1
Port Number (linear scale)
CD
F
Protocol Port Number Distribution [Wits−05 − UDP]
flowsvolumeduration
10 25 53 80 123 443 1,024 3k 5k 10k 30k 50k0
0.2
0.4
0.6
0.8
1
Port Number (log scale)
CD
F
flowsvolumeduration
1024 10,000 20,000 30,000 40,000 49,151 60,0000
0.2
0.4
0.6
0.8
1
Port Number (linear scale)
CD
F
Protocol Port Number Distribution [Wits−06 − UDP]
flowsvolumeduration
10 25 53 80 123 443 1,024 3k 5k 10k 30k 50k0
0.2
0.4
0.6
0.8
1
Port Number (log scale)
CD
F
flowsvolumeduration
Fig. 18. Port Number Distribution – Left:WITS-04, Center:WITS-05, Right:WITS-06
162
International Journal on Advances in Systems and Measurements, vol 3 no 3 & 4, year 2010, http://www.iariajournals.org/systems_and_measurements/
2010, © Copyright by authors, Published under agreement with IARIA - www.iaria.org
Recommended