1 `
Source Attribution of Mobile Source Air Toxics
Eric M. Fujita, David E. Campbell, William P. Arnott and Barbara Zielinska
Division of Atmospheric SciencesDesert Research InstituteUniversity and Community College System of
NevadaReno, Nevada
2006 CRC MSAT WorkshopPhoenix, AZ
October 23-25, 2006

2 `
Source Apportionment of SI and CI Exhaust to Ambient MSAT Concentrations
• Receptor Modeling – Chemical Mass Balance
• Correlations of MSAT with CO, NMHC, NOx or BC/EC.
• Multivariate regression of CO, NOx, PM2.5 or BC with LDV and HDV traffic volumes
• Spatial variations ambient MSAT relative to known variations in LDV and HDV traffic volumes.
• Temporal variations in ambient pollutant concentrations (e.g., day of week).

3 `
Acknowledgments• Weekend Ozone Study
– Sponsor: DOE’s Office of FreedomCAR and Vehicle Technologies, Dr. James Eberhardt and National Renewable Energy Laboratory, Dr. Douglas Lawson
– Additional Support: South Coast Air Quality Management District
• Gasoline/Diesel PM Split Study
– Sponsor: DOE’s Office of FreedomCAR and Vehicle Technologies, Dr. James Eberhardt and National Renewable Energy Laboratory, Dr. Douglas Lawson
– Additional Support: U.S. Environmental Protection Agency. California Bureau of Automotive Repair, South Coast Air Quality Management District, Ralph’s Supermarket Distribution Center
• Assessing Exposure to Air Toxics in Microenvironments Dominated by Mobile Sources – Sponsor: Health Effects Institute, Dr. Debra Kaden
– Additional Support: South Coast Air Quality Management District.

4 `
0
1
2
3
4
5
Sat, 9/30 Sun, 10/1 Mon, 10/2 Tue, 10/3 Wed, 10/4 Thu, 10/5 Fri, 10/6 Sat, 10/7 Sun, 10/8
0
0.5
1
1.5
2
2.5
3
Black Carbon (ug/m3)
CO (ppm)
Weekday Variations in CO and Black Carbon at Azusa, 9/30/00 to 10/8/00Weekend Ozone Study

5 `
0
100
200
300
400
500
Sat, 9/30 Sun, 10/1 Mon, 10/2 Tue, 10/3 Wed, 10/4 Thu, 10/5 Fri, 10/6 Sat, 10/7 Sun, 10/8
0.0
0.4
0.8
1.2
1.6
2.0
NMHC
CO (ppm)
Weekday Variations in CO and at Azusa, 9/30/00 to 10/8/00Weekend Ozone Study

6 `
Black Carbon and NOx at Azusa, 9/30/00 to 10/8/00
0
1
2
3
4
5
Sat, 9/30 Sun, 10/1 Mon, 10/2 Tue, 10/3 Wed, 10/4 Thu, 10/5 Fri, 10/6 Sat, 10/7 Sun, 10/8
0
20
40
60
80
100BC (ug/m3)
NOx (ppb)
Weekday Variations in NOx and Black Carbon at Azusa, 9/30/00 to 10/8/00Weekend Ozone Study
7 `
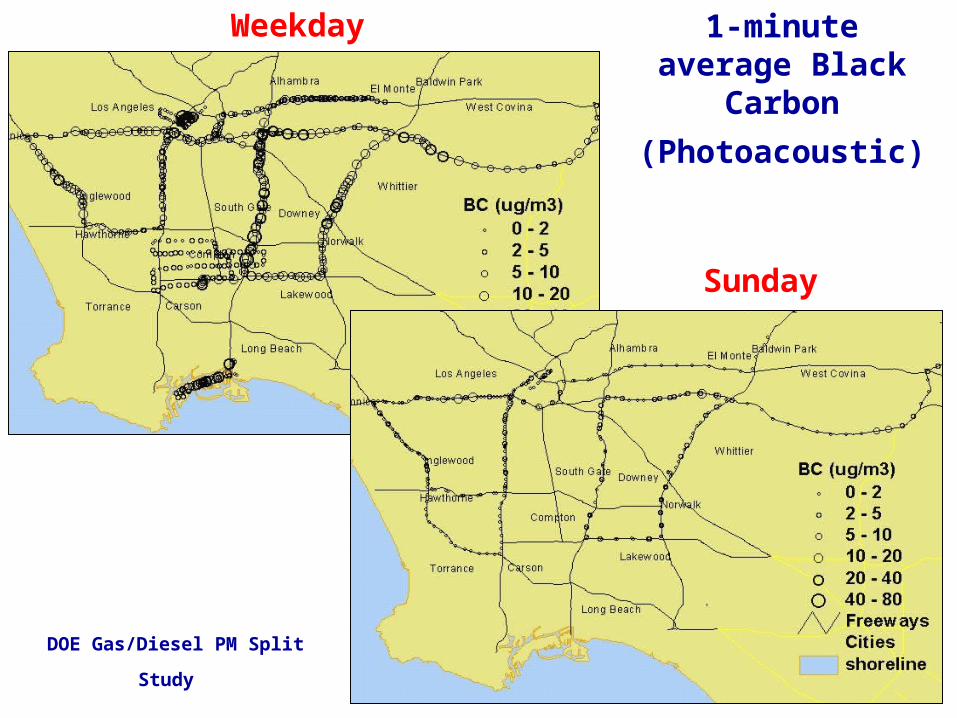
1-minute average Black Carbon
(Photoacoustic)
Sunday
Weekday
DOE Gas/Diesel PM Split Study

8 `
Carbon Monoxide
Health Effects Institute Project RFA03-1
405 110
60
710 605
91

9 `
Black Carbon (Photoacoustic)
Health Effects Institute Project RFA03-1
405 110
60
710 605
91

10 `
Sampling Locations During the Phase II Field MeasurementsWeekend Ozone Study
AzusaPAMS
Pico RiveraPAMS
ComptonLoop
CovinaLoop
PomonaLoop
Industry HillsConference Center
DodgerStadium
UplandPAMS
Los AngelesNorth Main
South Coast Air Basin
TruckStop
110 FreewayNo Trucks
Ambient VOC at PAMS
Regional/Background Sites
Source-Dominated Samples
AzusaPAMS
Pico RiveraPAMS
ComptonLoop
CovinaLoop
PomonaLoop
Industry HillsConference Center
DodgerStadium
UplandPAMS
Los AngelesNorth Main
South Coast Air Basin
TruckStop
110 FreewayNo Trucks
Ambient VOC at PAMS
Regional/Background Sites
Source-Dominated Samples
DSCVIH
PO
CO
DOE Weekend Ozone Study

11 `
Source Apportionment of BenzeneWeekend Ozone Study
Benzene
0.0
2.0
4.0
6.0
8.0
IH1 IH2 DS1 DS2 CV1 CV2 CO1 CO2 PO1
Gasoline Exhaust Diesel Exhaust Gasoline Vapor Coatings Consumer Products
0%
20%
40%
60%
80%
100%
IH1 IH2 DS1 DS2 CV1 CV2 CO1 CO2 PO1
Regional Sites Freeways
DOE Weekend Ozone Study

12 `
Source Apportionment of TolueneWeekend Ozone Study
Toluene
0
4
8
12
16
20
IH1 IH2 DS1 DS2 CV1 CV2 CO1 CO2 PO1
Gasoline Exhaust Diesel Exhaust Gasoline Vapor Coatings Consumer Products
0%
20%
40%
60%
80%
100%
IH1 IH2 DS1 DS2 CV1 CV2 CO1 CO2 PO1
Regional Sites Freeways
DOE Weekend Ozone Study

13 `
Source Apportionment of StyreneWeekend Ozone Study
0.0
0.5
1.0
1.5
2.0
IH1 IH2 DS1 DS2 CV1 CV2 CO1 CO2 PO1
Gasoline Exhaust Diesel Exhaust Gasoline Vapor Coatings Consumer Products
0%
20%
40%
60%
80%
100%
IH1 IH2 DS1 DS2 CV1 CV2 CO1 CO2 PO1
Regional Sites Freeways
DOE Weekend Ozone Study

14 `
Source Apportionment of 1,3-ButadieneWeekend Ozone Study
0.0
0.5
1.0
1.5
2.0
IH1 IH2 DS1 DS2 CV1 CV2 CO1 CO2 PO1
Gasoline Exhaust Diesel Exhaust Gasoline Vapor Coatings Consumer Products
0%
20%
40%
60%
80%
100%
IH1 IH2 DS1 DS2 CV1 CV2 CO1 CO2 PO1
Regional Sites Freeways
DOE Weekend Ozone Study

15 `
Source Apportionment of MTBEWeekend Ozone Study
0
4
8
12
16
20
24
IH1 IH2 DS1 DS2 CV1 CV2 CO1 CO2 PO1
Gasoline Exhaust Diesel Exhaust Gasoline Vapor Coatings Consumer Products
0%
20%
40%
60%
80%
100%
IH1 IH2 DS1 DS2 CV1 CV2 CO1 CO2 PO1
Regional Sites Freeways
DOE Weekend Ozone Study

16 `
Source Apportionment of CO, NO, PM2.5, and BC by Multivariate Analysis Using Traffic Counts
• Where:
– Pe = estimated on-road pollutant concentration
– VD = heavy-duty trucks per hour (a metric of diesel engine emissions)
– VG = light and medium duty vehicles per hour (a metric of gasoline engine emissions)
• Source of uncertainty
– Traffic volumes are annual hourly averages.
– On-road measurements can be influenced by surrounding traffic.
[ ] GDe bVaVP +=
Health Effects Institute Project RFA03-1

17 `
2005 Hourly Traffic Volumes
0
5,000
10,000
15,000
20,000
25,000
Hourly Traffic Count
0%
25%
50%
75%
100%
405N
405N/110N
60W to605
60W from
605405S
110S/405S60E to 60560E from
605 710N60E 605S 91W 710N
60E 605S 91W 710N60E 605S 91W
7-8 am 5-6 pm 7-8 am 11-noon 5-6 pm
Cars Trucks
Commute Routes Truck Routes
Health Effects Institute Project RFA03-1

18 `
Contribution of SI and CI Exhaust to On-road CO, NO, PM2.5 and BC Concentrations*
CO (ppm)
0%
10%
20%
30%
40%
50%
60%
70%
80%
90%
100%
I405N, I110NI110S, I405S
I405N I405S
SR60W toI605
SR60W from
I605 SR60E toI605
SR60E from
I605I710N SR60E I605S
SR91W
% from diesel % from gasoline
< TRUCK ROUTES >
NO (ppb)
0%
10%
20%
30%
40%
50%
60%
70%
80%
90%
100%
I405N, I110NI110S, I405S
I405N I405S
SR60W toI605
SR60W from
I605 SR60E toI605
SR60E from
I605I710N SR60E I605S
SR91W
% from diesel % from gasoline
< TRUCK ROUTES >
PM2.5 (µg/m3)
0%
10%
20%
30%
40%
50%
60%
70%
80%
90%
100%
I405N, I110NI110S, I405S
I405N I405S
SR60W toI605
SR60W from
I605 SR60E toI605
SR60E from
I605I710N SR60E I605S
SR91W
% from diesel % from gasoline
< TRUCK ROUTES >
BC (ug/m3)
0%
10%
20%
30%
40%
50%
60%
70%
80%
90%
100%
I405N, I110NI110S, I405S
I405N I405S
SR60W toI605
SR60W from
I605 SR60E toI605
SR60E from
I605I710N SR60E I605S
SR91W
% from diesel % from gasoline
< TRUCK ROUTES >
Health Effects Institute Project RFA03-1 * Estimated from correlations of on-road measurements and traffic volumes.

19 `
Correlations with CO at Los Angeles-N. Main 1990-95 and 1996-02 Benzene
y = 1.05x + 0.66
R 2 = 0.62
y = 0.94x + 0.04
R 2 = 0.91
0
2
4
6
8
10
0 2 4 6 8
CO (ppm)
Benzene (ppbv)
Toluene
y = 2.49x + 0.56
R 2 = 0.62
y = 2.20x + 0.22
R 2 = 0.78
0
5
10
15
20
25
0 2 4 6 8
CO (ppm)
Toluene (ppbv)
1990 to 1995
1996 to 2002
n-Butane
y = 0.30x + 0.01
R 2 = 0.71
y = 0.29x + 0.02
R2 = 0.90
0
1
2
3
4
0 2 4 6 8
CO (ppm)
Butane (ppbv)
PAH (ng/m3) PAH (ng/m3)
Formaldehyde
y = 1.36x + 0.45
R 2 = 0.41
y = 1.56x + 2.06
R2 = 0.27
0
3
6
9
12
15
0 2 4 6 8
CO (ppm)
Formaldehyde (ppbv)
Data from ARB Air Toxic Monitoring

20 `
Total Carbon (IMPROVE)
0.0
0.2
0.4
0.6
0.8
1.0
Fractional SCE
Diesel Gasoline Residual
Total Carbon (STN)
0.0
0.2
0.4
0.6
0.8
1.0
Azusa SunAzusa MonAzusa TueAzusa WedAzusa ThuAzusa FriAzusa SatLANM SunLANM MonLANM TueLANM WedLANM Thu
LANM FriLANM Sat
San Dimas Mon
Venice Sat
Rose Bowl Sat
I-405 Sun
Fractional SCE
Total Carbon Source Contributions
DOE Gas/Diesel PM Split Study
21 `
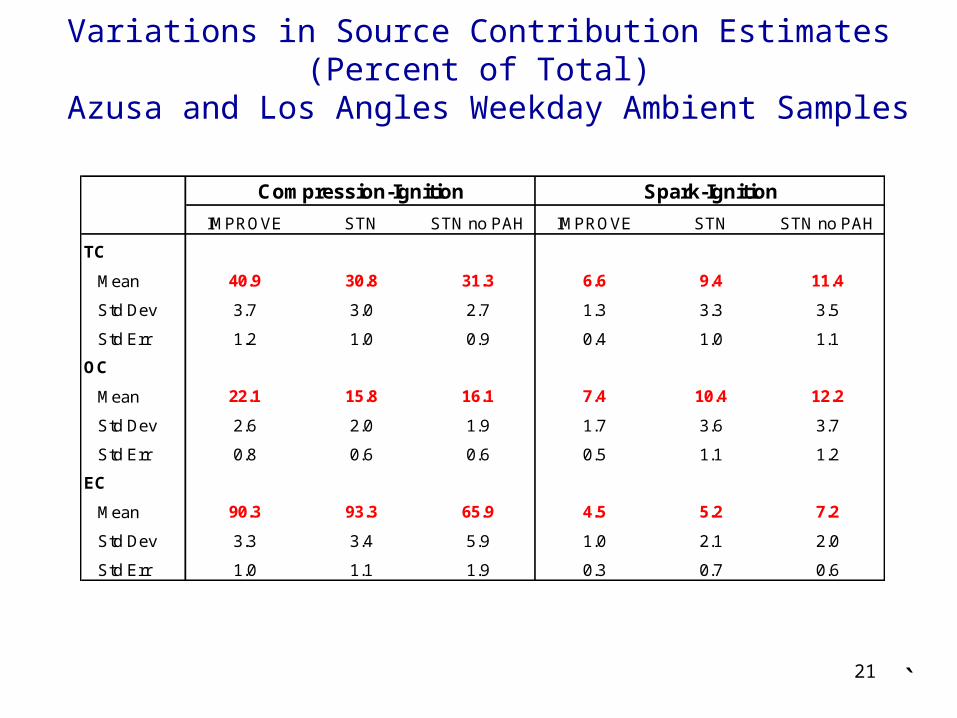
Variations in Source Contribution Estimates (Percent of Total) Azusa and Los Angles Weekday Ambient Samples
Compression-Ignition Spark-Ignition
IMPROVE STN STN no PAH IMPROVE STN STN no PAH
TC
Mean 40.9 30.8 31.3 6.6 9.4 11.4
Std Dev 3.7 3.0 2.7 1.3 3.3 3.5
Std Err 1.2 1.0 0.9 0.4 1.0 1.1
OC
Mean 22.1 15.8 16.1 7.4 10.4 12.2
Std Dev 2.6 2.0 1.9 1.7 3.6 3.7
Std Err 0.8 0.6 0.6 0.5 1.1 1.2
EC
Mean 90.3 93.3 65.9 4.5 5.2 7.2
Std Dev 3.3 3.4 5.9 1.0 2.1 2.0
Std Err 1.0 1.1 1.9 0.3 0.7 0.6

22 `
Summary
• Ambient levels of volatile organic MSATs in the SoCAB were mainly associated with SI vehicle exhaust. However, SI and CI contributions were comparable for styrene.
• Evaporative contributions to volatile organic MSAT in the SoCAB were minor.
• CI and SI apportionments varied with location and time.
– CI vehicles were the dominant mobile source of EC and TC at Azusa and LANM.
– More equal apportionment at other locations that are more regionally representative.
– SI vehicles were the dominant mobile source of OC and EC in locations and times with minimal truck traffic.
– EC is a reasonable surrogate of PM emissions from CI vehicles in the SoCAB.
• Short-term on-road exposures (few minute or less) can be substantially higher and depend on proximity of high gasoline emitters and diesel trucks.
• Over half of the organic carbon during summer in the SoCAB could not be apportioned to directly-emitted PM emissions from motor vehicles.

23 `
References
Fujita, E.M., W.R. Stockwell, D.E. Campbell, R.E. Keislar and D.R. Lawson (2003). Evolution of the Magnitude and Spatial Extent of the Weekend Ozone Effect in California’s South Coast Air Basin from 1981 to 2000. J. Air & Waste Manage. Assoc. 53:802-815
Fujita, E.M., D.E. Campbell, B. Zielinska, J.C. Sagebiel, J.L. Bowen, W. Goliff, W.R. Stockwell, and D.R. Lawson (2003). Diurnal and Weekday Variations in Source Contributions of Ozone Precursors in California’s South Coast Air Basin. J. Air & Waste Manage. Assoc. 53: 844-863.
Fujita, E.M. and D.E. Campbell (2006). Spatial and Temporal Variations in Exposure to Air Toxics in the South Coast Air Basin. Draft final report submitted by Desert Research Institute to the National Renewable Energy Laboratory, Golden, CO, August 31, 2006.
Fujita, E.M., D.E. Campbell, B. Zielinska, W.P. Arnott and J.C. Chow (2006). Exposure to Air Toxics in Mobile Source Dominated Microenvironments. Draft report submitted by Desert Research Institute to the Health Effects Institute, Boston, MA, July 27, 2006.
Fujita, E.M., B. Zielinska, W.P. Arnott, D.E. Campbell, L. Rinehart, J.C. Sagebiel and J.C. Chow (2006). Gasoline/Diesel PM Split Study: Source and Ambient Sampling, Chemical Analysis, and Apportionment Phase. Final report submitted to the U.S. Department of Energy National Renewable Energy Laboratory, Golden, CO, January 19, 2006. Data are available at: http://www.nrel.gov/vehiclesandfuels/nfti/feat_split_study.html
Fujita, E.M., B. Zielinska, D.E. Campbell, W.P. Arnott, J. Sagebiel, L. Reinhart, J.C. Chow, N. P.A. Gabele, W. Crews, R. Snow, N. Clark, S. Wayne and D.R. Lawson. Variations in speciated emissions from spark-ignition and compression ignition motor vehicles in the California's South Coast Air Basin. In Press.
Fujita, E. M., D. E. Campbell, W. P. Arnott, B. Zielinska. Evaluations Of Source Apportionment Methods for Determining Contributions Of Gasoline and Diesel Exhaust to Ambient Carbonaceous Aerosols. Submitted.
Recommended