Embed Size (px)
DESCRIPTION
Unaudited results for the first 6 months ended 30 June 2014
Citation preview
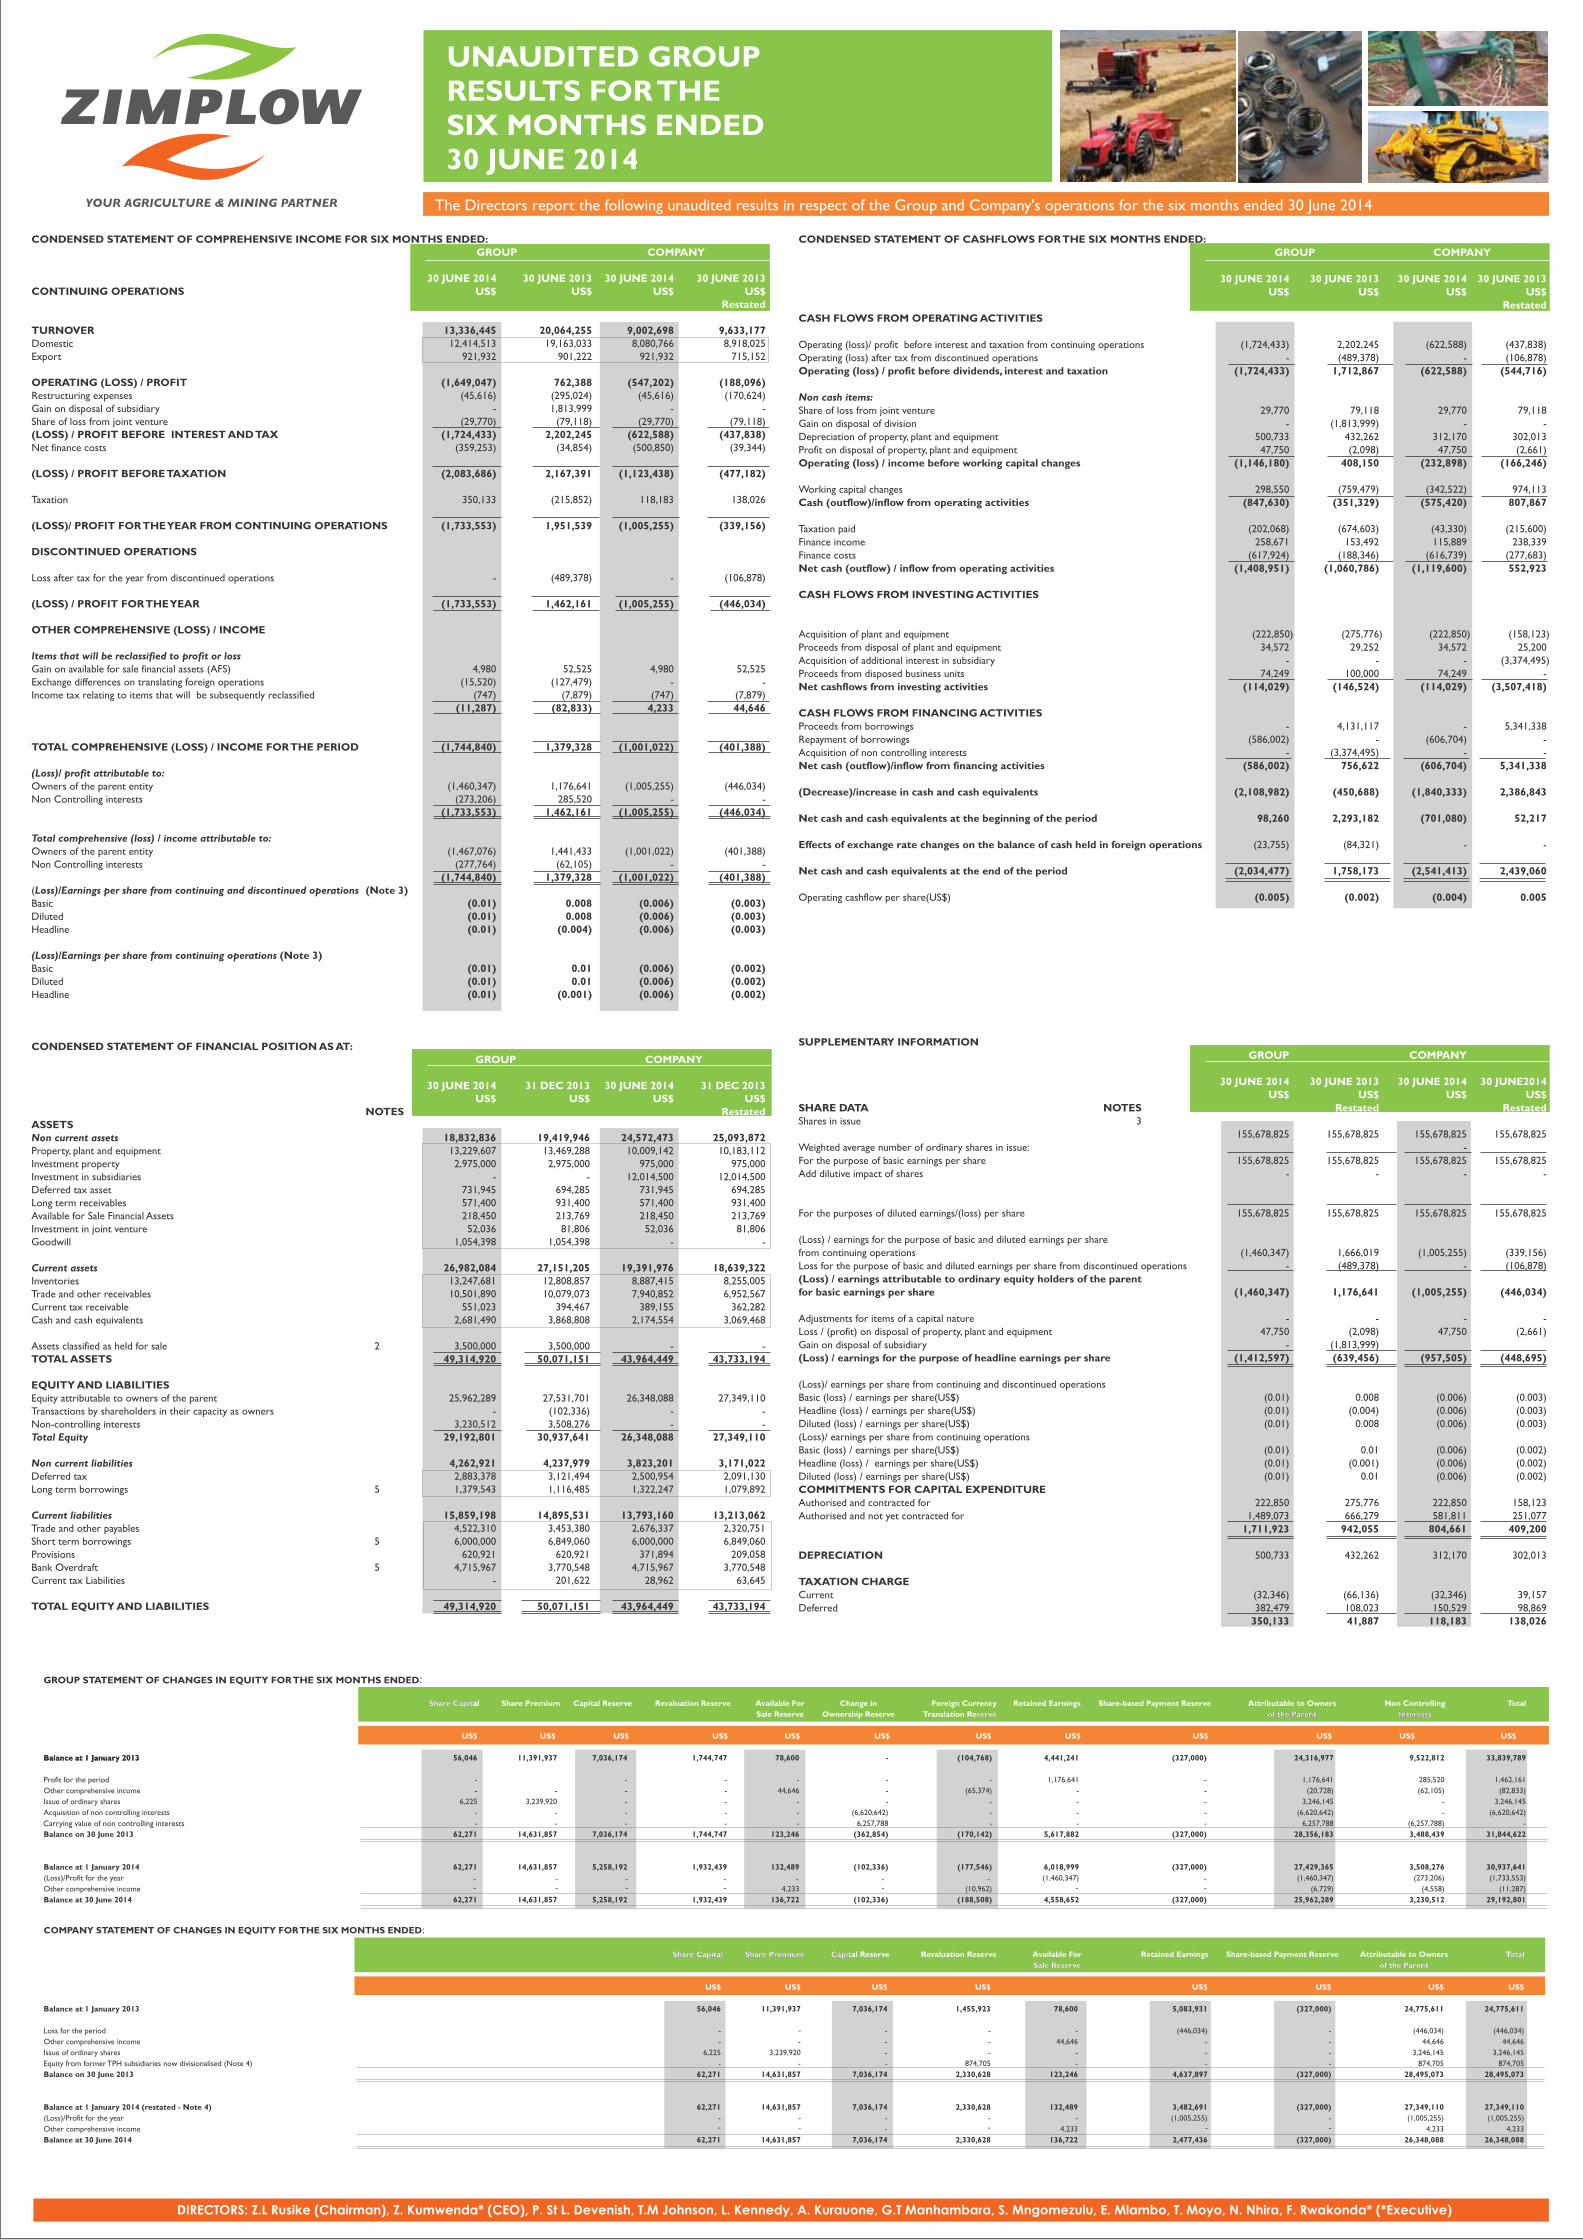
UNAUDITED GROUP RESULTS FOR THE SIX MONTHS ENDED 30 JUNE 2014
The Directors report the following unaudited results in respect of the Group and Company's operations for the six months ended 30 June 2014
DIRECTORS: Z.L Rusike (Chairman), Z. Kumwenda* (CEO), P. St L. Devenish, T.M Johnson, L. Kennedy, A. Kurauone, G.T Manhambara, S. Mngomezulu, E. Mlambo, T. Moyo, N. Nhira, F. Rwakonda* (*Executive)
CONDENSED STATEMENT OF COMPREHENSIVE INCOME FOR SIX MONTHS ENDED: GROUP COMPANY 30 JUNE 2014 30 JUNE 2013 30 JUNE 2014 30 JUNE 2013 CONTINUING OPERATIONS US$ US$ US$ US$ Restated
TURNOVER 13,336,445 20,064,255 9,002,698 9,633,177 Domestic 12,414,513 19,163,033 8,080,766 8,918,025 Export 921,932 901,222 921,932 715,152 OPERATING (LOSS) / PROFIT (1,649,047) 762,388 (547,202) (188,096)Restructuring expenses (45,616) (295,024) (45,616) (170,624)Gain on disposal of subsidiary - 1,813,999 - - Share of loss from joint venture (29,770) (79,118) (29,770) (79,118)(LOSS) / PROFIT BEFORE INTEREST AND TAX (1,724,433) 2,202,245 (622,588) (437,838)Net finance costs (359,253) (34,854) (500,850) (39,344) (LOSS) / PROFIT BEFORE TAXATION (2,083,686) 2,167,391 (1,123,438) (477,182) Taxation 350,133 (215,852) 118,183 138,026 (LOSS)/ PROFIT FOR THE YEAR FROM CONTINUING OPERATIONS (1,733,553) 1,951,539 (1,005,255) (339,156) DISCONTINUED OPERATIONS Loss after tax for the year from discontinued operations - (489,378) - (106,878) (LOSS) / PROFIT FOR THE YEAR (1,733,553) 1,462,161 (1,005,255) (446,034) OTHER COMPREHENSIVE (LOSS) / INCOME Items that will be reclassified to profit or loss Gain on available for sale financial assets (AFS) 4,980 52,525 4,980 52,525 Exchange differences on translating foreign operations (15,520) (127,479) - - Income tax relating to items that will be subsequently reclassified (747) (7,879) (747) (7,879) (11,287) (82,833) 4,233 44,646
TOTAL COMPREHENSIVE (LOSS) / INCOME FOR THE PERIOD (1,744,840) 1,379,328 (1,001,022) (401,388) (Loss)/ profit attributable to: Owners of the parent entity (1,460,347) 1,176,641 (1,005,255) (446,034)Non Controlling interests (273,206) 285,520 - - (1,733,553) 1,462,161 (1,005,255) (446,034) Total comprehensive (loss) / income attributable to: Owners of the parent entity (1,467,076) 1,441,433 (1,001,022) (401,388)Non Controlling interests (277,764) (62,105) - - (1,744,840) 1,379,328 (1,001,022) (401,388)(Loss)/Earnings per share from continuing and discontinued operations (Note 3) Basic (0.01) 0.008 (0.006) (0.003)Diluted (0.01) 0.008 (0.006) (0.003)Headline (0.01) (0.004) (0.006) (0.003) (Loss)/Earnings per share from continuing operations (Note 3) Basic (0.01) 0.01 (0.006) (0.002)Diluted (0.01) 0.01 (0.006) (0.002)Headline (0.01) (0.001) (0.006) (0.002) CONDENSED STATEMENT OF FINANCIAL POSITION AS AT: GROUP COMPANY 30 JUNE 2014 31 DEC 2013 30 JUNE 2014 31 DEC 2013 US$ US$ US$ US$ NOTES Restated ASSETS Non current assets 18,832,836 19,419,946 24,572,473 25,093,872 Property, plant and equipment 13,229,607 13,469,288 10,009,142 10,183,112 Investment property 2,975,000 2,975,000 975,000 975,000 Investment in subsidiaries - - 12,014,500 12,014,500 Deferred tax asset 731,945 694,285 731,945 694,285 Long term receivables 571,400 931,400 571,400 931,400 Available for Sale Financial Assets 218,450 213,769 218,450 213,769 Investment in joint venture 52,036 81,806 52,036 81,806 Goodwill 1,054,398 1,054,398 - - Current assets 26,982,084 27,151,205 19,391,976 18,639,322 Inventories 13,247,681 12,808,857 8,887,415 8,255,005 Trade and other receivables 10,501,890 10,079,073 7,940,852 6,952,567 Current tax receivable 551,023 394,467 389,155 362,282 Cash and cash equivalents 2,681,490 3,868,808 2,174,554 3,069,468 Assets classified as held for sale 2 3,500,000 3,500,000 - - TOTAL ASSETS 49,314,920 50,071,151 43,964,449 43,733,194 EQUITY AND LIABILITIES Equity attributable to owners of the parent 25,962,289 27,531,701 26,348,088 27,349,110 Transactions by shareholders in their capacity as owners - (102,336) - - Non-controlling interests 3,230,512 3,508,276 - - Total Equity 29,192,801 30,937,641 26,348,088 27,349,110 Non current liabilities 4,262,921 4,237,979 3,823,201 3,171,022 Deferred tax 2,883,378 3,121,494 2,500,954 2,091,130 Long term borrowings 5 1,379,543 1,116,485 1,322,247 1,079,892 Current liabilities 15,859,198 14,895,531 13,793,160 13,213,062 Trade and other payables 4,522,310 3,453,380 2,676,337 2,320,751 Short term borrowings 5 6,000,000 6,849,060 6,000,000 6,849,060 Provisions 620,921 620,921 371,894 209,058 Bank Overdraft 5 4,715,967 3,770,548 4,715,967 3,770,548 Current tax Liabilities - 201,622 28,962 63,645 TOTAL EQUITY AND LIABILITIES 49,314,920 50,071,151 43,964,449 43,733,194
----
-
-- - - -
- ----- ---------
CONDENSED STATEMENT OF CASHFLOWS FOR THE SIX MONTHS ENDED: GROUP COMPANY 30 JUNE 2014 30 JUNE 2013 30 JUNE 2014 30 JUNE 2013 US$ US$ US$ US$ Restated CASH FLOWS FROM OPERATING ACTIVITIES Operating (loss)/ profit before interest and taxation from continuing operations (1,724,433) 2,202,245 (622,588) (437,838)Operating (loss) after tax from discontinued operations - (489,378) - (106,878)Operating (loss) / profit before dividends, interest and taxation (1,724,433) 1,712,867 (622,588) (544,716) Non cash items: Share of loss from joint venture 29,770 79,118 29,770 79,118 Gain on disposal of division - (1,813,999) - - Depreciation of property, plant and equipment 500,733 432,262 312,170 302,013 Profit on disposal of property, plant and equipment 47,750 (2,098) 47,750 (2,661)Operating (loss) / income before working capital changes (1,146,180) 408,150 (232,898) (166,246) Working capital changes 298,550 (759,479) (342,522) 974,113 Cash (outflow)/inflow from operating activities (847,630) (351,329) (575,420) 807,867 Taxation paid (202,068) (674,603) (43,330) (215,600)Finance income 258,671 153,492 115,889 238,339Finance costs (617,924) (188,346) (616,739) (277,683) Net cash (outflow) / inflow from operating activities (1,408,951) (1,060,786) (1,119,600) 552,923 CASH FLOWS FROM INVESTING ACTIVITIES Acquisition of plant and equipment (222,850) (275,776) (222,850) (158,123)Proceeds from disposal of plant and equipment 34,572 29,252 34,572 25,200 Acquisition of additional interest in subsidiary - - - (3,374,495)Proceeds from disposed business units 74,249 100,000 74,249 - Net cashflows from investing activities (114,029) (146,524) (114,029) (3,507,418) CASH FLOWS FROM FINANCING ACTIVITIES Proceeds from borrowings - 4,131,117 - 5,341,338 Repayment of borrowings (586,002) - (606,704) - Acquisition of non controlling interests - (3,374,495) - -Net cash (outflow)/inflow from financing activities (586,002) 756,622 (606,704) 5,341,338 (Decrease)/increase in cash and cash equivalents (2,108,982) (450,688) (1,840,333) 2,386,843 Net cash and cash equivalents at the beginning of the period 98,260 2,293,182 (701,080) 52,217 Effects of exchange rate changes on the balance of cash held in foreign operations (23,755) (84,321) - - Net cash and cash equivalents at the end of the period (2,034,477) 1,758,173 (2,541,413) 2,439,060 Operating cashflow per share(US$) (0.005) (0.002) (0.004) 0.005
SUPPLEMENTARY INFORMATION GROUP COMPANY 30 JUNE 2014 30 JUNE 2013 30 JUNE 2014 30 JUNE2014 US$ US$ US$ US$SHARE DATA NOTES Restated Restated Shares in issue 3 155,678,825 155,678,825 155,678,825 155,678,825 Weighted average number of ordinary shares in issue: - For the purpose of basic earnings per share 155,678,825 155,678,825 155,678,825 155,678,825 Add dilutive impact of shares - - - - For the purposes of diluted earnings/(loss) per share 155,678,825 155,678,825 155,678,825 155,678,825 (Loss) / earnings for the purpose of basic and diluted earnings per share from continuing operations (1,460,347) 1,666,019 (1,005,255) (339,156)Loss for the purpose of basic and diluted earnings per share from discontinued operations - (489,378) - (106,878)(Loss) / earnings attributable to ordinary equity holders of the parent for basic earnings per share (1,460,347) 1,176,641 (1,005,255) (446,034)
Adjustments for items of a capital nature - - - - Loss / (profit) on disposal of property, plant and equipment 47,750 (2,098) 47,750 (2,661)Gain on disposal of subsidiary - (1,813,999) (Loss) / earnings for the purpose of headline earnings per share (1,412,597) (639,456) (957,505) (448,695) (Loss)/ earnings per share from continuing and discontinued operations Basic (loss) / earnings per share(US$) (0.01) 0.008 (0.006) (0.003)Headline (loss) / earnings per share(US$) (0.01) (0.004) (0.006) (0.003)Diluted (loss) / earnings per share(US$) (0.01) 0.008 (0.006) (0.003)(Loss)/ earnings per share from continuing operations Basic (loss) / earnings per share(US$) (0.01) 0.01 (0.006) (0.002)Headline (loss) / earnings per share(US$) (0.01) (0.001) (0.006) (0.002)Diluted (loss) / earnings per share(US$) (0.01) 0.01 (0.006) (0.002)COMMITMENTS FOR CAPITAL EXPENDITURE Authorised and contracted for 222,850 275,776 222,850 158,123 Authorised and not yet contracted for 1,489,073 666,279 581,811 251,077 1,711,923 942,055 804,661 409,200 DEPRECIATION 500,733 432,262 312,170 302,013
TAXATION CHARGE Current (32,346) (66,136) (32,346) 39,157 Deferred 382,479 108,023 150,529 98,869 350,133 41,887 118,183 138,026
Carrying value of non controlling interests
NOTES TO THE CONDENSED FINANCIAL STATEMENTS FOR THE YEAR ENDED 30 JUNE 2014
1. Presentation and statement of compliance
1.1 Basis of preparationThe condensed financial statements for the six months ended 30 June 2014 have been prepared in accordance with IAS 34 - Interim Financial Reporting, the Companies Act of Zimbabwe (Chapter 24:03) and the Zimbabwe Stock Exchange listing requirements.
1.2 Accounting policiesThe accounting policies applied in the preparation of these condensed financial statements for the period under review are in accordance with International Financial Reporting Standards ("IFRS") and are consistent with those applied in preparation of the Group's audited financial statements for the year ended 31 December 2013.
2. Asset held for saleAs previously disclosed in the financial results for the year ended 31 December 2013, the Group intends to dispose of one of its properties within the next 6 months. The property is located in the central business district of Harare on freehold land that previously housed the Group's disposed motoring operations. A buyer has been secured and the disposal transaction is expected to be completed by the third quarter.
DIRECTORS: Z.L Rusike (Chairman), Z. Kumwenda* (CEO), P. St L. Devenish, T.M Johnson, L. Kennedy, A. Kurauone, G.T Manhambara, S. Mngomezulu, E. Mlambo, T. Moyo, N. Nhira, F. Rwakonda* (*Executive)
UNAUDITED GROUP RESULTS FOR THE SIX MONTHS ENDED 30 JUNE 2014
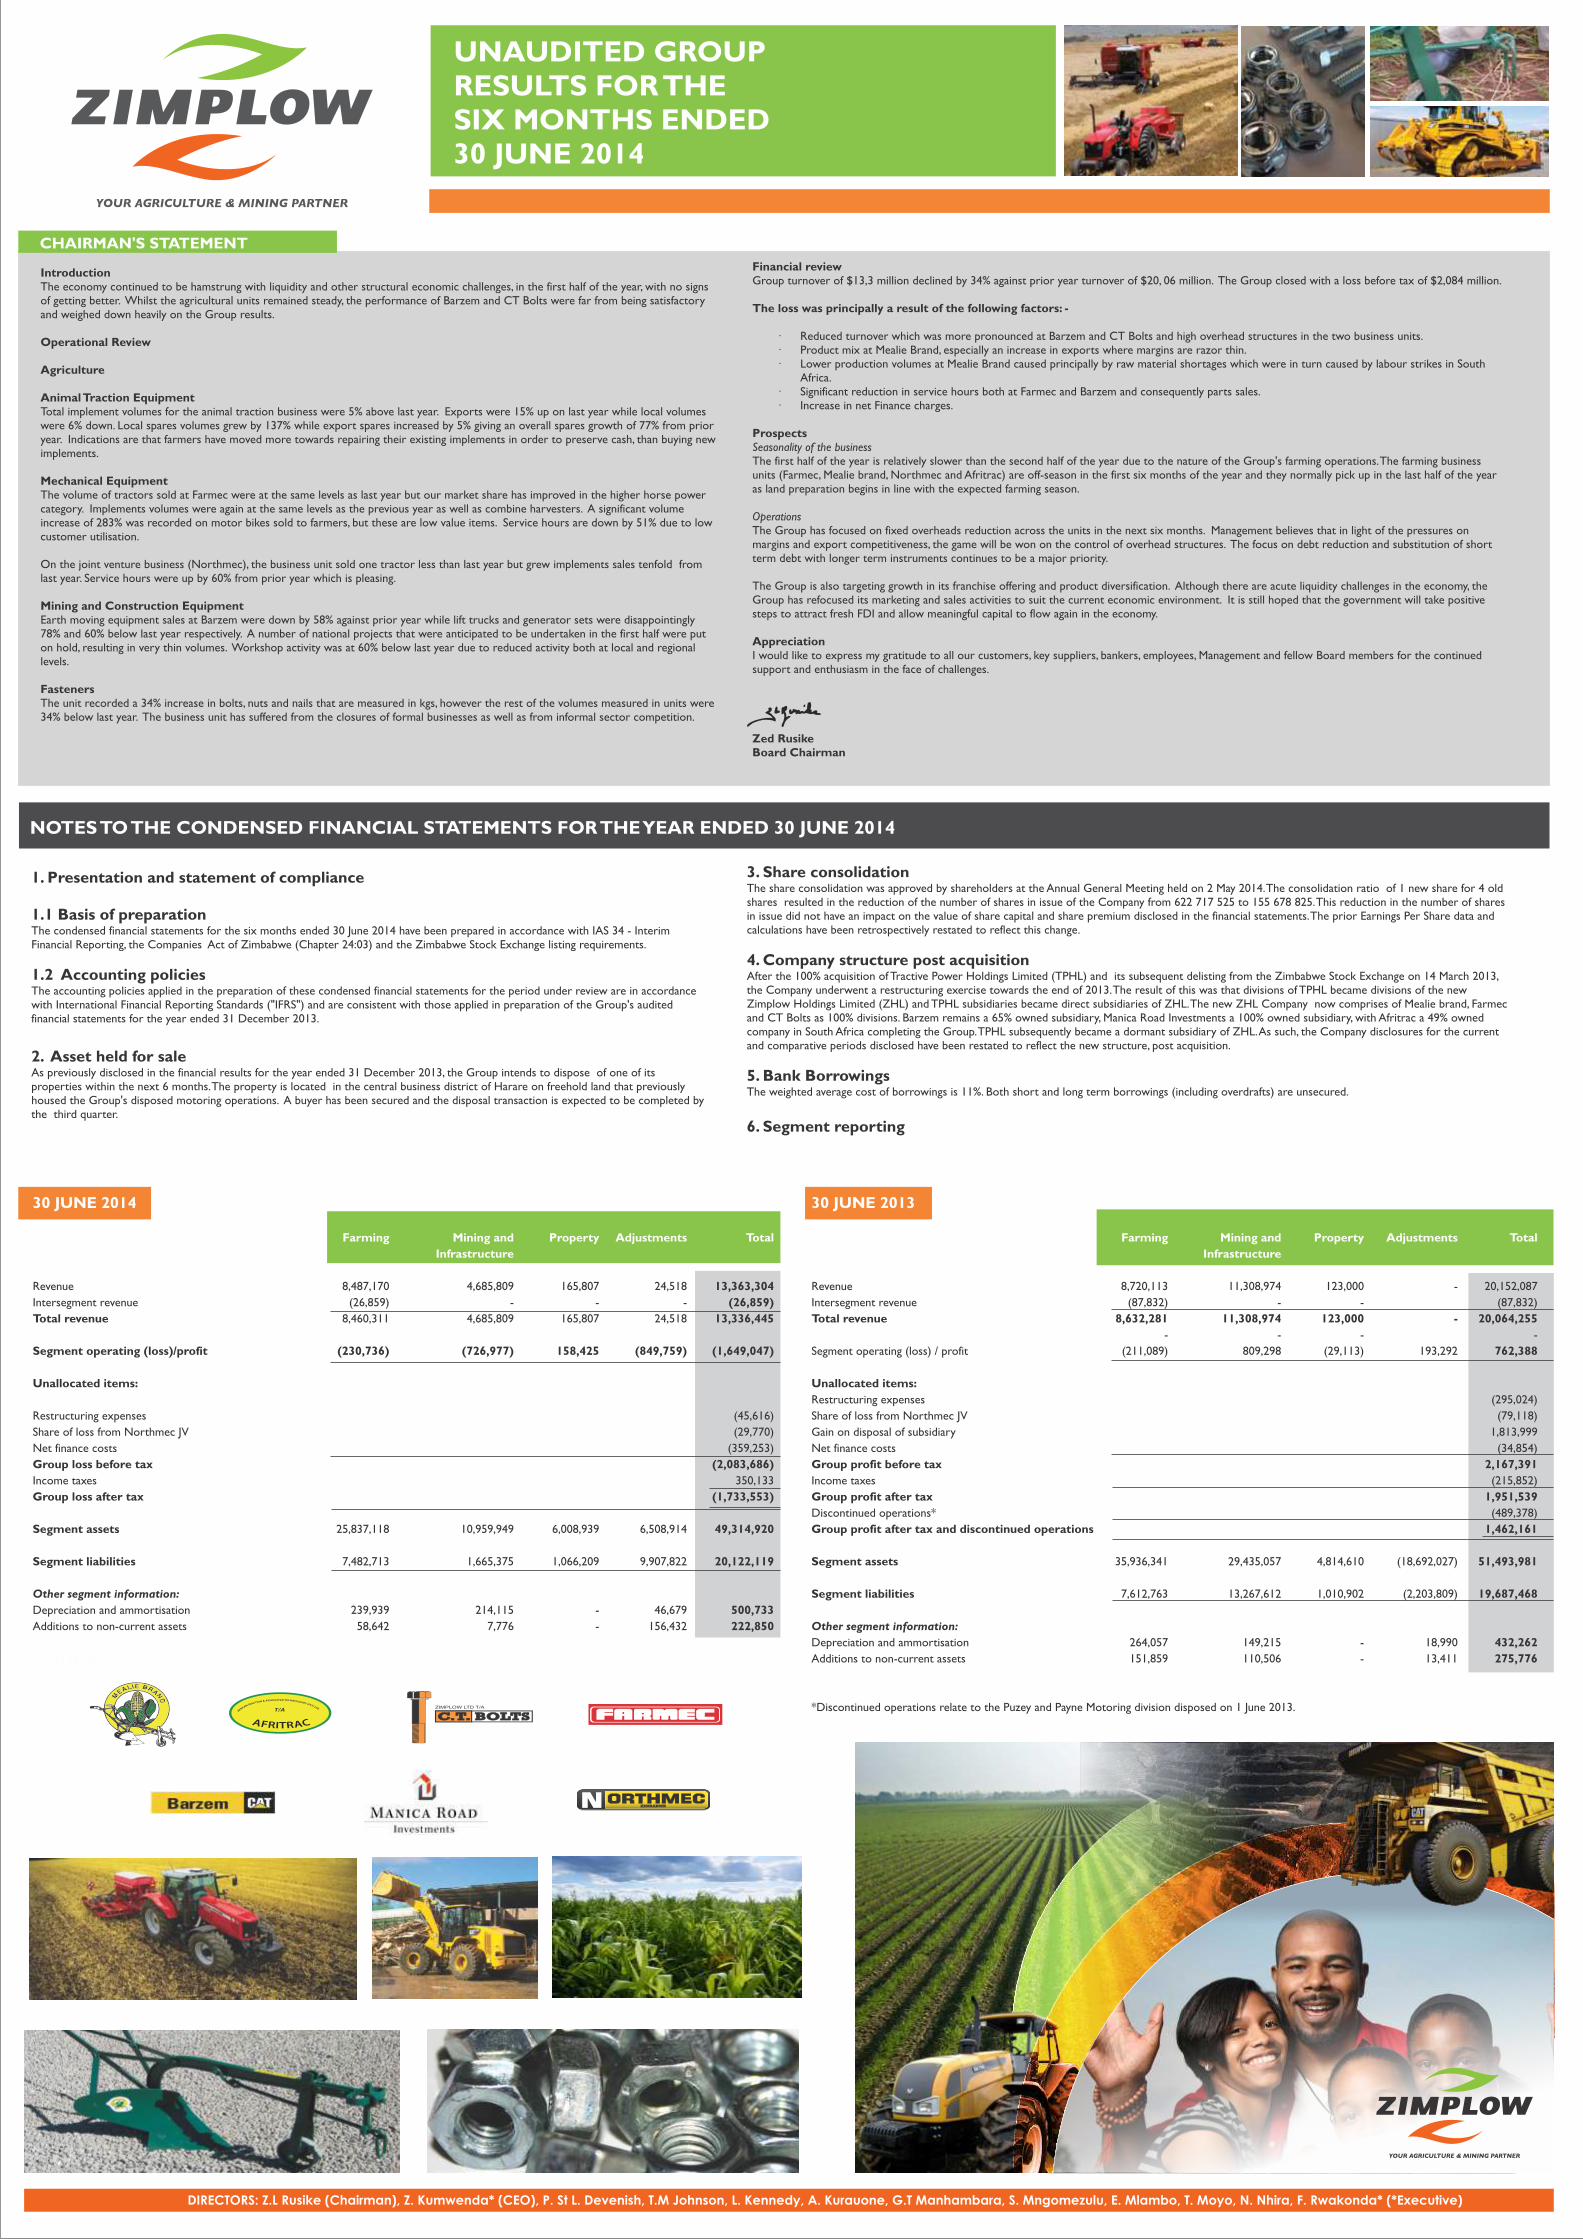
30 JUNE 2014
Farming Mining and Property Adjustments Total
Infrastructure
Revenue 8,487,170 4,685,809 165,807 24,518 13,363,304
Intersegment revenue (26,859) - - - (26,859)
Total revenue 8,460,311 4,685,809 165,807 24,518 13,336,445
Segment operating (loss)/profit (230,736) (726,977) 158,425 (849,759) (1,649,047)
Unallocated items:
Restructuring expenses (45,616)
Share of loss from Northmec JV (29,770)
Net finance costs (359,253)
Group loss before tax (2,083,686)
Income taxes 350,133
Group loss after tax (1,733,553)
Segment assets 25,837,118 10,959,949 6,008,939 6,508,914 49,314,920
Segment liabilities 7,482,713 1,665,375 1,066,209 9,907,822 20,122,119
Other segment information:
Depreciation and ammortisation 239,939 214,115 - 46,679 500,733
Additions to non-current assets 58,642 7,776 - 156,432 222,850
30 JUNE 2013
30 JUNE 2013
Farming Mining and Property Adjustments Total
Infrastructure
Revenue 8,720,113 11,308,974 123,000 - 20,152,087
Intersegment revenue (87,832) - - (87,832)
Total revenue 8,632,281 11,308,974 123,000 - 20,064,255
- - - -
Segment operating (loss) / profit (211,089) 809,298 (29,113) 193,292 762,388
Unallocated items:
Restructuring expenses (295,024)
Share of loss from Northmec JV (79,118)
Gain on disposal of subsidiary 1,813,999
Net finance costs (34,854)
Group profit before tax 2,167,391
Income taxes (215,852)
Group profit after tax 1,951,539
Discontinued operations* (489,378)
Group profit after tax and discontinued operations 1,462,161
Segment assets 35,936,341 29,435,057 4,814,610 (18,692,027) 51,493,981
Segment liabilities 7,612,763 13,267,612 1,010,902 (2,203,809) 19,687,468
Other segment information:
Depreciation and ammortisation 264,057 149,215 - 18,990 432,262
Additions to non-current assets 151,859 110,506 - 13,411 275,776
*Discontinued operations relate to the Puzey and Payne Motoring division disposed on 1 June 2013.
IntroductionThe economy continued to be hamstrung with liquidity and other structural economic challenges, in the first half of the year, with no signs of getting better. Whilst the agricultural units remained steady, the performance of Barzem and CT Bolts were far from being satisfactory and weighed down heavily on the Group results.
Operational Review
Agriculture
Animal Traction EquipmentTotal implement volumes for the animal traction business were 5% above last year. Exports were 15% up on last year while local volumes were 6% down. Local spares volumes grew by 137% while export spares increased by 5% giving an overall spares growth of 77% from prior year. Indications are that farmers have moved more towards repairing their existing implements in order to preserve cash, than buying new implements.
Mechanical EquipmentThe volume of tractors sold at Farmec were at the same levels as last year but our market share has improved in the higher horse power category. Implements volumes were again at the same levels as the previous year as well as combine harvesters. A significant volume increase of 283% was recorded on motor bikes sold to farmers, but these are low value items. Service hours are down by 51% due to low customer utilisation.
On the joint venture business (Northmec), the business unit sold one tractor less than last year but grew implements sales tenfold from last year. Service hours were up by 60% from prior year which is pleasing.
Mining and Construction EquipmentEarth moving equipment sales at Barzem were down by 58% against prior year while lift trucks and generator sets were disappointingly 78% and 60% below last year respectively. A number of national projects that were anticipated to be undertaken in the first half were put on hold, resulting in very thin volumes. Workshop activity was at 60% below last year due to reduced activity both at local and regional levels.
FastenersThe unit recorded a 34% increase in bolts, nuts and nails that are measured in kgs, however the rest of the volumes measured in units were 34% below last year. The business unit has suffered from the closures of formal businesses as well as from informal sector competition.
Financial reviewGroup turnover of $13,3 million declined by 34% against prior year turnover of $20, 06 million. The Group closed with a loss before tax of $2,084 million.
The loss was principally a result of the following factors: -
· Reduced turnover which was more pronounced at Barzem and CT Bolts and high overhead structures in the two business units.· Product mix at Mealie Brand, especially an increase in exports where margins are razor thin.· Lower production volumes at Mealie Brand caused principally by raw material shortages which were in turn caused by labour strikes in South
Africa.· Significant reduction in service hours both at Farmec and Barzem and consequently parts sales.· Increase in net Finance charges.
ProspectsSeasonality of the businessThe first half of the year is relatively slower than the second half of the year due to the nature of the Group's farming operations. The farming business units (Farmec, Mealie brand, Northmec and Afritrac) are off-season in the first six months of the year and they normally pick up in the last half of the year as land preparation begins in line with the expected farming season.
OperationsThe Group has focused on fixed overheads reduction across the units in the next six months. Management believes that in light of the pressures on margins and export competitiveness, the game will be won on the control of overhead structures. The focus on debt reduction and substitution of short term debt with longer term instruments continues to be a major priority.
The Group is also targeting growth in its franchise offering and product diversification. Although there are acute liquidity challenges in the economy, the Group has refocused its marketing and sales activities to suit the current economic environment. It is still hoped that the government will take positive steps to attract fresh FDI and allow meaningful capital to flow again in the economy.
AppreciationI would like to express my gratitude to all our customers, key suppliers, bankers, employees, Management and fellow Board members for the continued support and enthusiasm in the face of challenges.
Zed RusikeBoard Chairman
CHAIRMAN'S STATEMENT
3. Share consolidationThe share consolidation was approved by shareholders at the Annual General Meeting held on 2 May 2014. The consolidation ratio of 1 new share for 4 old shares resulted in the reduction of the number of shares in issue of the Company from 622 717 525 to 155 678 825. This reduction in the number of shares in issue did not have an impact on the value of share capital and share premium disclosed in the financial statements. The prior Earnings Per Share data and calculations have been retrospectively restated to reflect this change.
4. Company structure post acquisitionAfter the 100% acquisition of Tractive Power Holdings Limited (TPHL) and its subsequent delisting from the Zimbabwe Stock Exchange on 14 March 2013, the Company underwent a restructuring exercise towards the end of 2013. The result of this was that divisions of TPHL became divisions of the new Zimplow Holdings Limited (ZHL) and TPHL subsidiaries became direct subsidiaries of ZHL. The new ZHL Company now comprises of Mealie brand, Farmec and CT Bolts as 100% divisions. Barzem remains a 65% owned subsidiary, Manica Road Investments a 100% owned subsidiary, with Afritrac a 49% owned company in South Africa completing the Group. TPHL subsequently became a dormant subsidiary of ZHL. As such, the Company disclosures for the current and comparative periods disclosed have been restated to reflect the new structure, post acquisition.
5. Bank Borrowings The weighted average cost of borrowings is 11%. Both short and long term borrowings (including overdrafts) are unsecured.
6. Segment reporting
GROUP STATEMENT OF CHANGES IN EQUITY FOR THE SIX MONTHS ENDED 30 JUNE 2014
Share Capital Share premium Capital Reserve Revaluation reserve Available for Change in Foreign Currency Retained Earnings Share based payment reserve Attributable to Owners Non Controlling Total
sale Reserve ownership reserve Translation Reserve of the Parent Interest
US$ US$ US$ US$ US$ US$ US$ US$ US$ US$ US$ US$
Balance at 1 January 2013 56,046 11,391,937 7,036,174 1,744,747 78,600 - (104,768) 4,441,241 (327,000) 24,316,977 9,522,812 33,839,789
Profit for the period - - - - - - -1,176,641 - 1,176,641 285,520 1,462,161
Other comprehensive income - - - - 44,646 - (65,374) - - (20,728) (62,105) (82,833)
Issue of ordinary shares 6,225 3,239,920 - - - - - - - 3,246,145 - 3,246,145
Acquisition of non controlling interests - - - - - (6,620,642) - - - (6,620,642) - (6,620,642)
Caring value of none controlling interests - - - - - 6,257,788 - - - 6,257,788 (6,257,788) -
Balance on 30 June 2013 62,271 14,631,857 7,036,174 1,744,747 123,246 (362,854) (170,142) 5,617,882 (327,000) 28,356,183 3,488,439 31,844,622
Balance at 1 January 2014 62,271 14,631,857 5,258,192 1,932,439 132,489 (102,336) (177,546) 6,018,999 (327,000) 27,429,365 3,508,276 30,937,641
(Loss)/Profit for the year (1,460,347) (1,460,347) (273,206) (1,733,553)
Other comprehensive income 4,233 (10,962) (6,729) (4,558) (11,287)
Balance at 30 June 2014 62,271 14,631,857 5,258,192 1,932,439 136,722 (102,336) (188,508) 4,558,652 (327,000) 25,962,289 3,230,512 29,192,801
COMPANY STATEMENT OF CHANGES IN EQUITY FOR THE SIX MONTHS ENDED 30 JUNE 2014
Share Capital Share premium Capital Reserve Revaluation reserve Available for Retained Earnings Share based payment Attributable to Owners Total
sale Reserve of the Parent
US$ US$ US$ US$ US$ US$ US$ US$
Balance at 1 January 2013 56,046 11,391,937 7,036,174 1,455,923 78,600 5,083,931 (327,000) 24,775,611 24,775,611
Loss for the period - - - - (446,034) - (446,034) (446,034)
Other comprehensive income - - - - 44,646 - - 44,646 44,646
Issue of ordinary shares 6,225 3,239,920 - - - - - 3,246,145 3,246,145
Equity from former TPH subsidiaries now divisionalised (Note 4) - - - 874,705 - - - 874,705 874,705
Balance on 30 June 2013 62,271 14,631,857 7,036,174 2,330,628 123,246 4,637,897 (327,000) 28,495,073 28,495,073
Balance at 1 January 2014 (restated - Note 4) 62,271 14,631,857 7,036,174 2,330,628 132,489 3,482,691 (327,000) 27,349,110 27,349,110
(Loss)/Profit for the year - (1,005,255) - (1,005,255) (1,005,255)
Other comprehensive income - 4,233 4,233 4,233
Balance at 30 June 2014 62,271 14,631,857 7,036,174 2,330,628 136,722 2,477,436 (327,000) 26,348,088 26,348,088