Embed Size (px)
Citation preview
UNAUDITED ABRIDGED RESULTS
Half Year Ended 30 June 2015
Centenary Room, Royal Harare Gold Club26 August 2015
PresentersCaleb Musodza, Managing DirectorKenias Horonga, Finance Director
Operations OverviewOperations OverviewCaleb MusodzaCaleb Musodza
Financial OverviewFinancial OverviewKenias HorongaKenias Horonga
Strategic Issues and Strategic Issues and OutlookOutlook
Caleb MusodzaCaleb Musodza
Question and AnswerQuestion and AnswerTurnall ExecutivesTurnall Executives
Presentation OutlinePresentation Outline
33
Company Overview
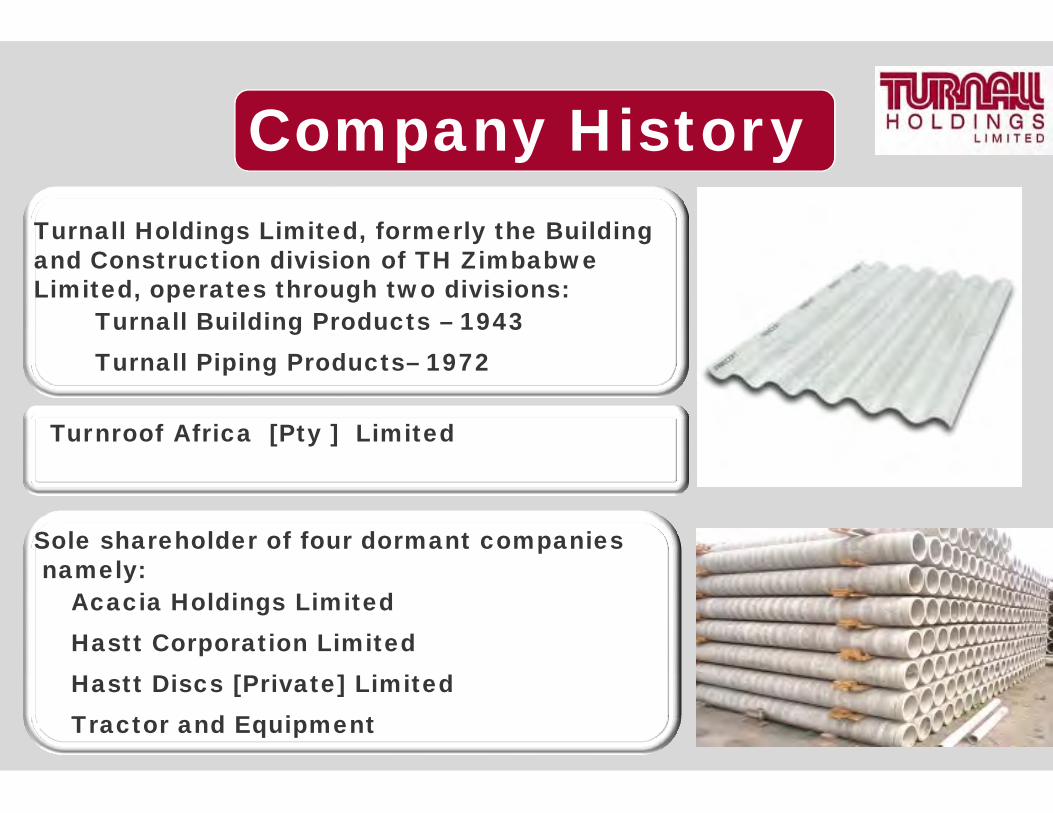
Company HistoryTurnall Holdings Limited, formerly the Building and Construction division of TH Zimbabwe Limited, operates through two divisions: Turnall Building Products – 1943 Turnall Piping Products– 1972
Sole shareholder of four dormant companies namely:
• Acacia Holdings Limited• Hastt Corporation Limited• Hastt Discs [Private] Limited• Tractor and Equipment
Turnroof Africa [Pty ] Limited
Directorate
• R Likukuma - Non Executive Chairperson• J. Mushayavanhu - Non Executive Deputy Chairman• C. Musodza - Executive• K. Horonga - Executive• C. E. Dhlembeu - Non Executive• L. Sasikwa - Non Executive• P. C. C. Moyo - Non Executive• C. M. Gadzikwa - Non Executive• K. Naik - Non Executive• J. P Mutizwa - Non Executive• P. Chingoka - Non Executive• P. Marufu - Non Executive
Executive Management
• Caleb Musodza - Managing Director
• Kenias Horonga - Finance Director
• Francis Chigwedere - Technical Director
• Roselyn Chisveto -Sales & Marketing Executive
• Tendayi Mhiribidi -Human Resources Executive
Management
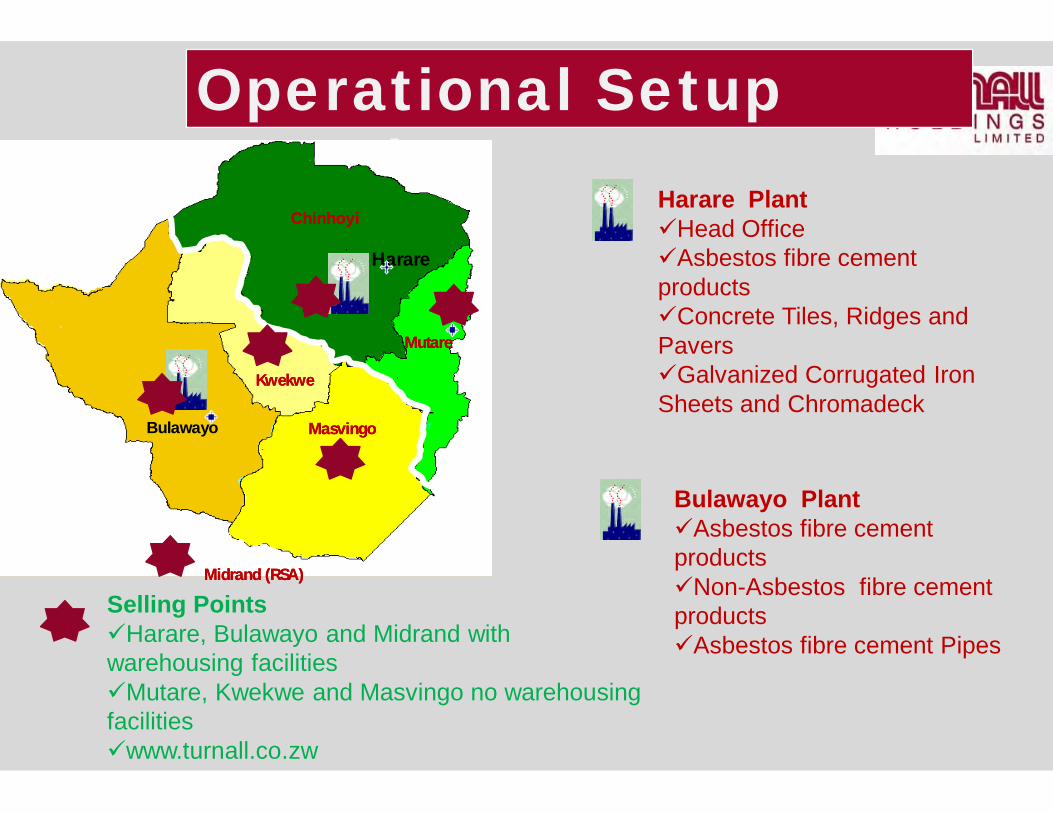
Operational Setup Overview
Harare
MutareMutare
Bulawayo MasvingoMasvingo
KwekweKwekwe
ChinhoyiChinhoyi
Midrand (RSA)Midrand (RSA)
Harare PlantHead OfficeAsbestos fibre cement products Concrete Tiles, Ridges and PaversGalvanized Corrugated Iron Sheets and Chromadeck
Bulawayo PlantAsbestos fibre cement productsNon-Asbestos fibre cement productsAsbestos fibre cement Pipes
Selling PointsHarare, Bulawayo and Midrand with warehousing facilitiesMutare, Kwekwe and Masvingo no warehousing facilitieswww.turnall.co.zw
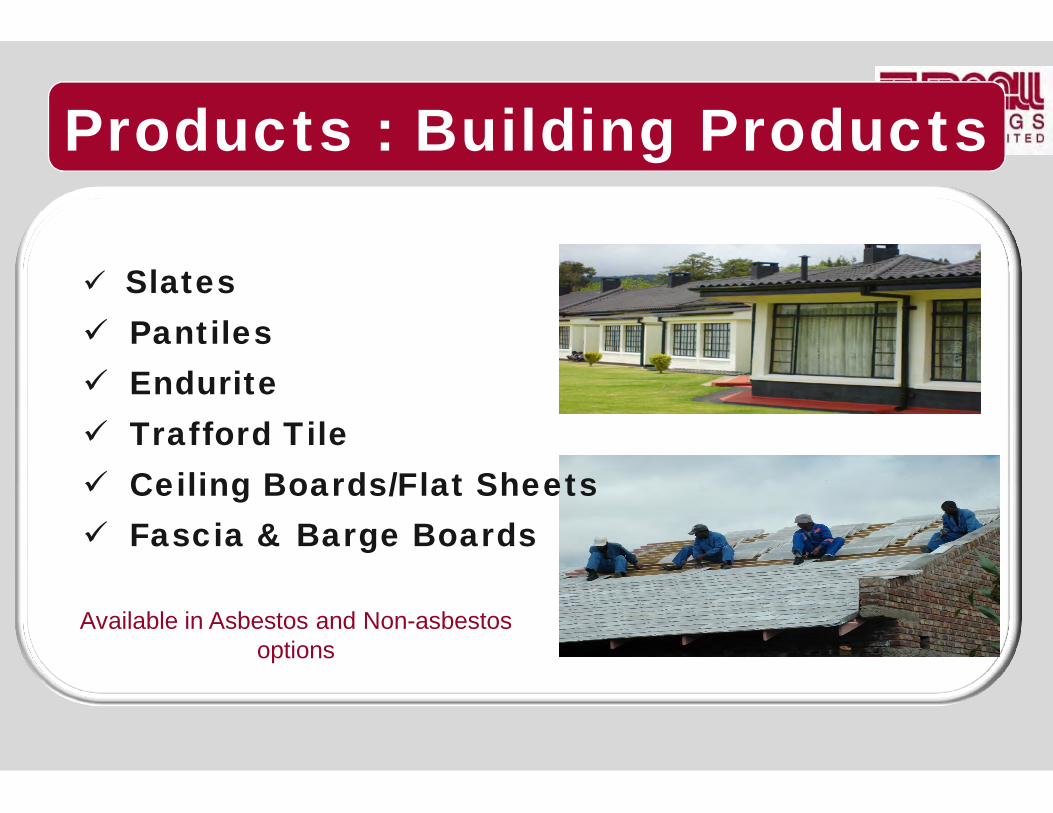
Products : Building Products
Available in Asbestos and Non-asbestos options
Slates Pantiles Endurite Trafford Tile Ceiling Boards/Flat Sheets Fascia & Barge Boards

Products : Turnallware
Office/Home market
Available in Asbestos and Non-asbestos options
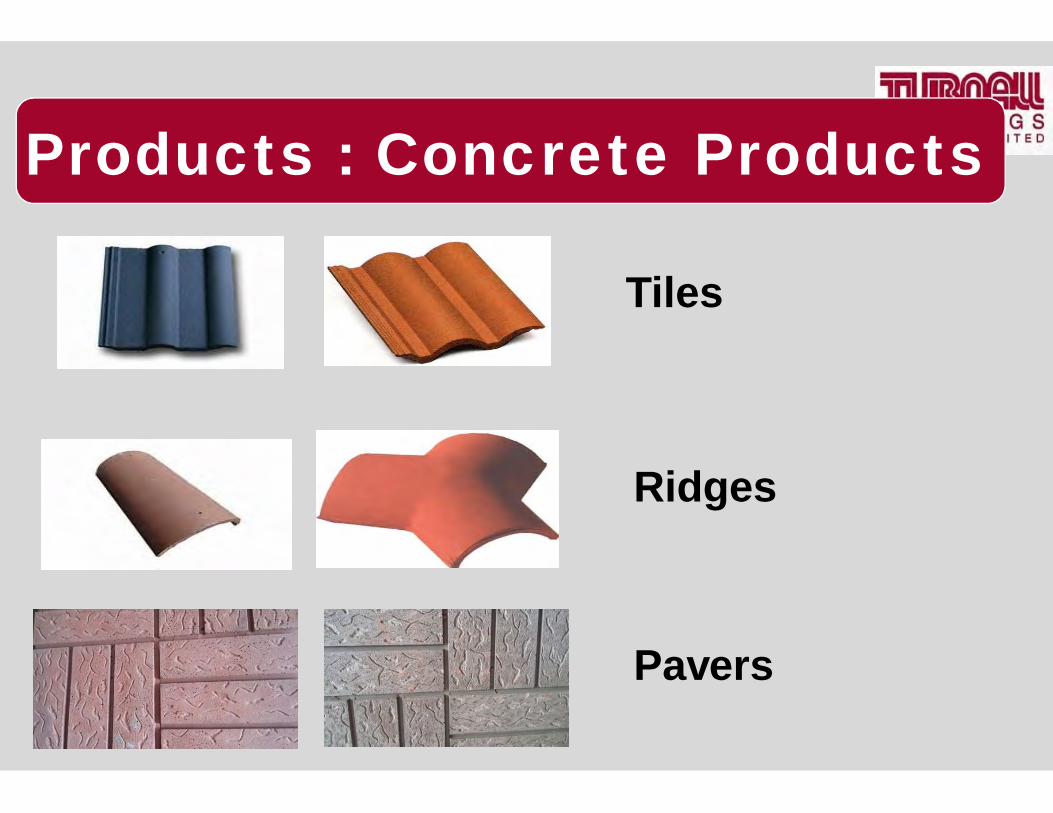
Products : Concrete Products
Tiles
Ridges
Pavers
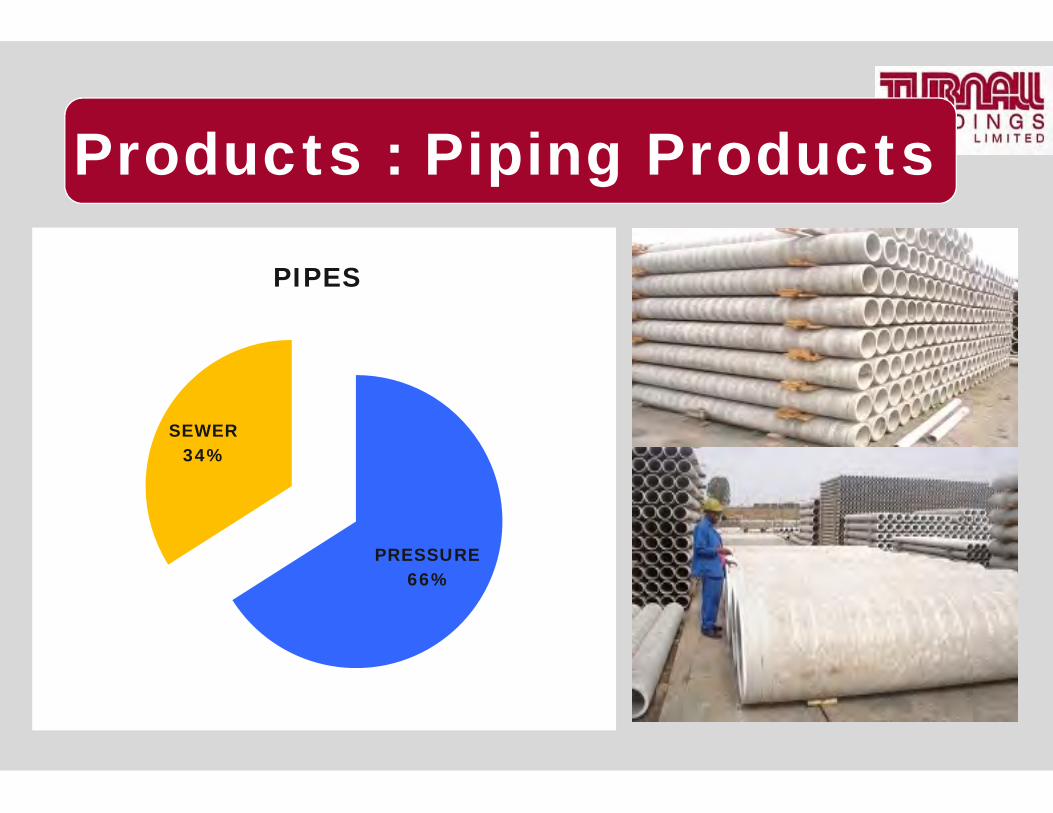
Products : Piping Products
PRESSURE66%
SEWER34%
PIPES
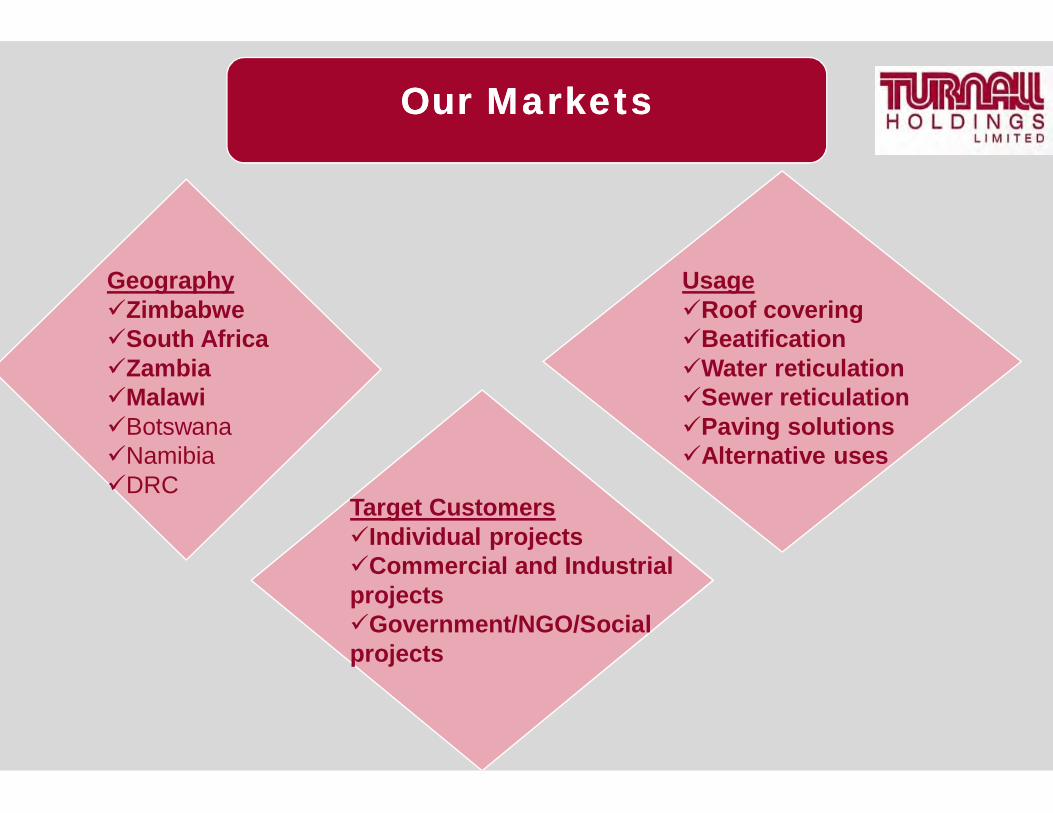
Our MarketsOur Markets
GeographyZimbabweSouth AfricaZambiaMalawiBotswanaNamibiaDRC
UsageRoof coveringBeatificationWater reticulationSewer reticulationPaving solutionsAlternative uses
Target CustomersIndividual projectsCommercial and Industrial projectsGovernment/NGO/Social projects
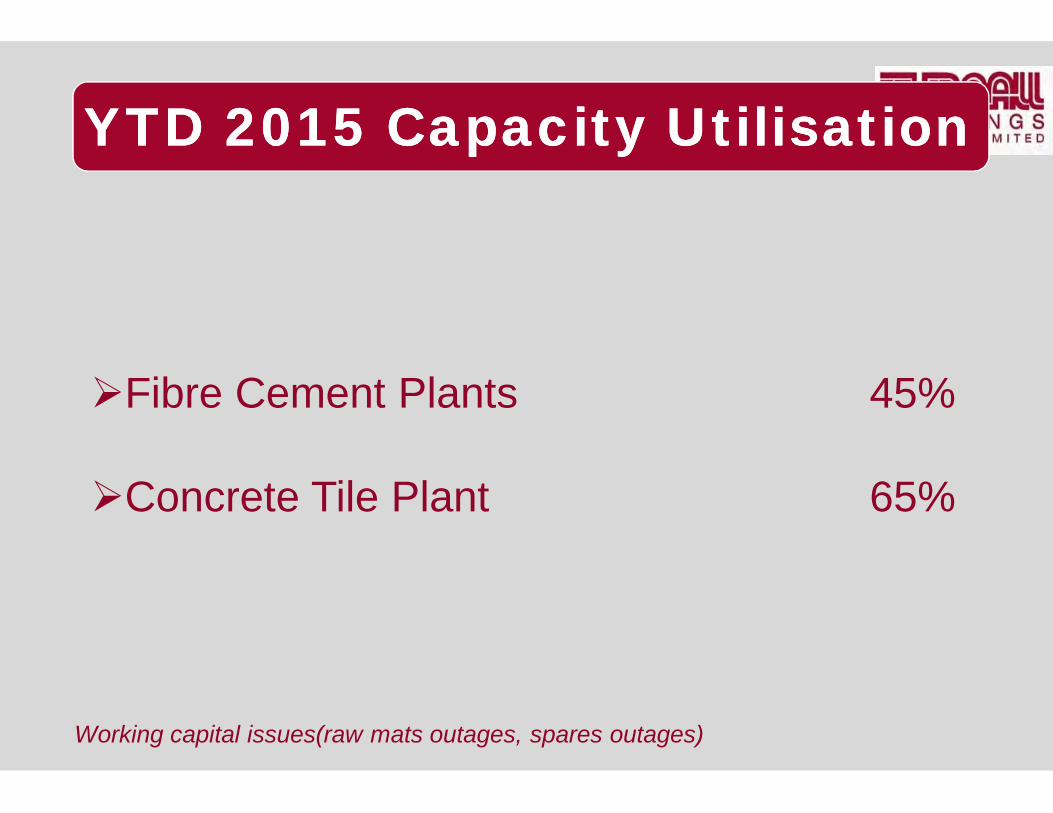
YTD 2015 Capacity UtilisationYTD 2015 Capacity Utilisation
Fibre Cement Plants 45%
Concrete Tile Plant 65%
Working capital issues(raw mats outages, spares outages)
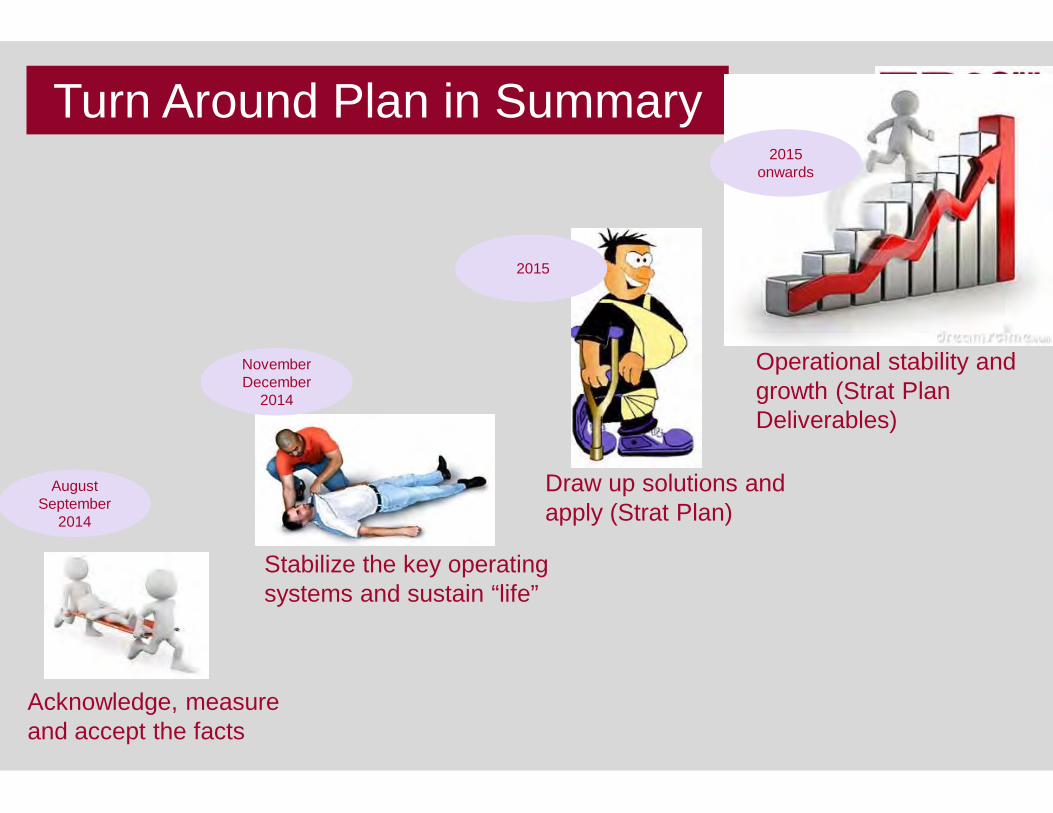
August September
2014
Turn Around Plan in Summary
Acknowledge, measure and accept the facts
Stabilize the key operating systems and sustain “life”
Draw up solutions and apply (Strat Plan)
Operational stability and growth (Strat Plan Deliverables)
November December
2014
2015
2015 onwards
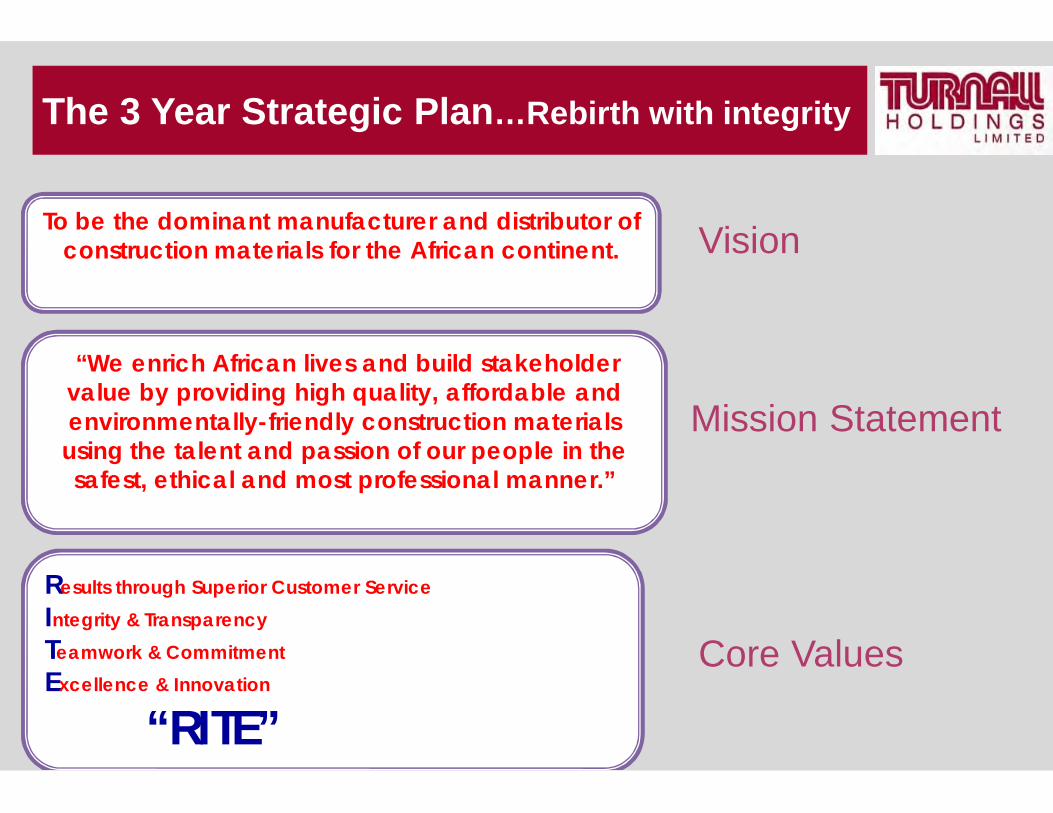
The 3 Year Strategic Plan…Rebirth with integrity
To be the dominant manufacturer and distributor of construction materials for the African continent.
“We enrich African lives and build stakeholder value by providing high quality, affordable and environmentally-friendly construction materials using the talent and passion of our people in the safest, ethical and most professional manner.”
Results through Superior Customer ServiceIntegrity & TransparencyTeamwork & CommitmentExcellence & Innovation
ACRONYM – “RITE”
Vision
Mission Statement
Core Values
H1 2015 Achievements
•Broadened our supplier base, and in the process achieved better pricing,
quality, terms and more efficient utilisation.
•Implemented and sustained a predominantly cash-trading selling model.
•Right sized the organization in line with the strategic plan.
•Developed good working relationships with all our creditors with win-win
solutions.
•Re-structured our loans to affordable terms.
•Implemented a robust cost base management process.
•Broadened our revenue base through better selling focus.
•Recovery of bad debts
1717
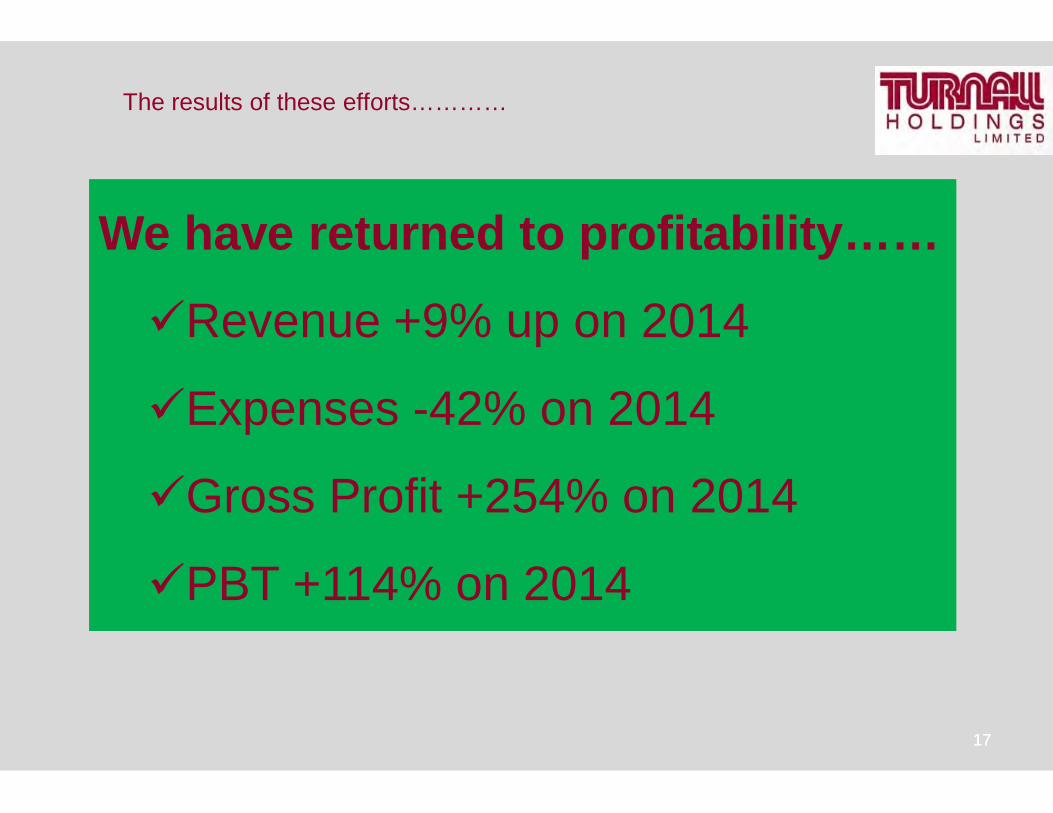
The results of these efforts…………
We have returned to profitability……
Revenue +9% up on 2014
Expenses -42% on 2014
Gross Profit +254% on 2014
PBT +114% on 2014
Financials
Basis of preparation
•Principal accounting policies of the Group have been consistently followed.•Financial statements were approved for issue by the Board of Directors on 20August 2015.
Statement of compliance•Finstats prepared in accordance with accounting policies consistent withInternational Financial Reporting Standards (IFRS) and in the manner requiredby the Zimbabwe Companies Act (Chapter 24:03).•Finstats on statutory records and have been prepared on the historical costbasis•Except for property, plant and equipment that is carried at revalued amounts.•Finstats are presented in United States dollars, which is the Group’s functionaland presentation currency.
Basis of preparation and Statement of compliance
Consolidated Statement of Profit or Loss and Other Comprehensive Income
2020

Note Unaudited UnauditedSix months Six months Audited year
ended ended ended30.06.2015 30.06.2014 31.12.2014
Revenue 1 14 014 935 12 878 086 33 834 344Cost of sales (10 928 832) (12 005 661) (32 367 915)Gross profit 3 086 103 872 425 1 466 429
Other income 79 526 18 195 65 223Selling and distribution expenses (699 638) (775 999) (1 839 248)Administration expense (1 289 729) (2 738 383) (13 046 329)Profit/(loss) from operating activities 1 176 262 (2 623 762) (13 353 925)Finance costs 2 (686 524) (892 261) (1 542 206)Profit/(loss) before tax 489 738 (3 516 023) (14 896 131)Tax (charge)/credit (89 984) 874 834 2 971 606Profit/(loss) for the year 399 754 (2 641 189) (11 924 525)Other comprehensive income/(loss) net of taxRevaluation of property, plant and equipment - - (3 496 112)Foreign currency translation differences 1 009 - 1 667Total comprehensive income/(loss) for the year 400 763 (2 641 189) (15 418 970)
Statement of Profit or loss and other comprehensive income
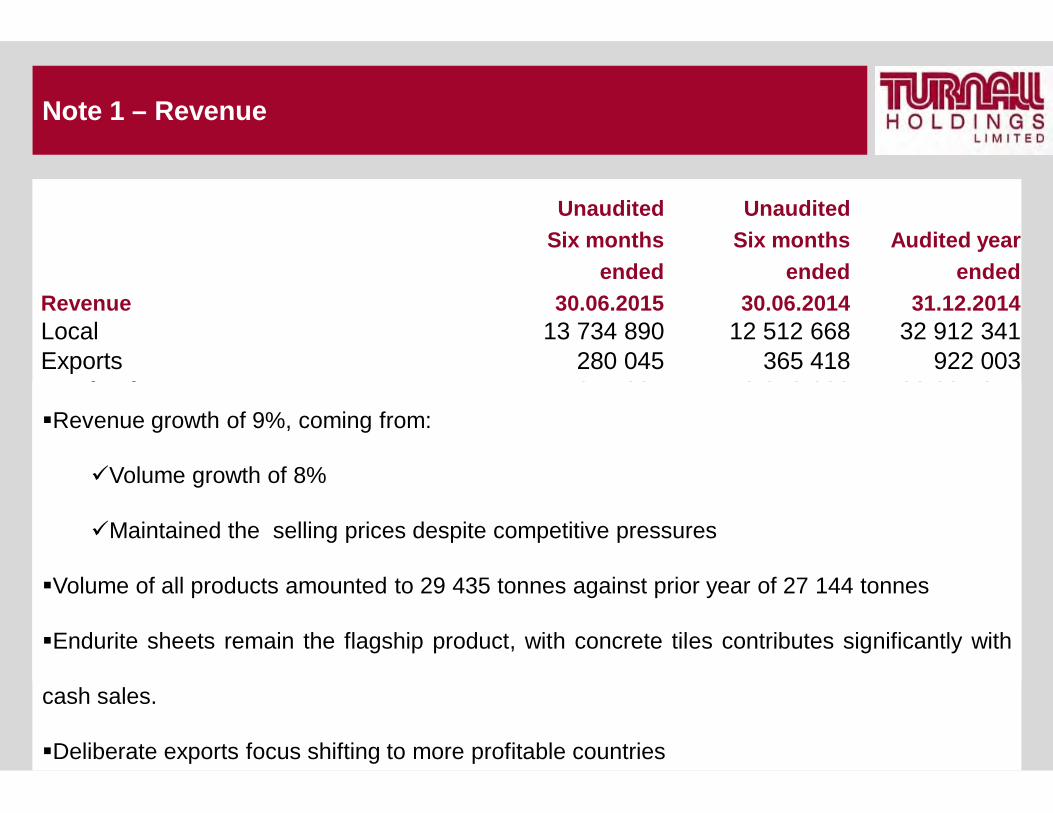
Unaudited UnauditedSix months Six months Audited year
ended ended endedRevenue 30.06.2015 30.06.2014 31.12.2014Local 13 734 890 12 512 668 32 912 341Exports 280 045 365 418 922 003Total sales 14 014 935 12 878 086 33 834 344
Note 1 – Revenue
Revenue growth of 9%, coming from:
Volume growth of 8%
Maintained the selling prices despite competitive pressures
Volume of all products amounted to 29 435 tonnes against prior year of 27 144 tonnes
Endurite sheets remain the flagship product, with concrete tiles contributes significantly with
cash sales.
Deliberate exports focus shifting to more profitable countries
Gross profit improvement from 7% to 22%
Mainly due to better overhead recovery and procurement savings initiatives.
68% of our cost of production consists of two main raw materials, namely fibre and
cement
A lot of work has been done on these two and significant reductions will be realised
in H2
Selling and distribution expenses decreased by10%
Administration expenses decreased by 53%
Strict cost control measures were put in place
Commentary
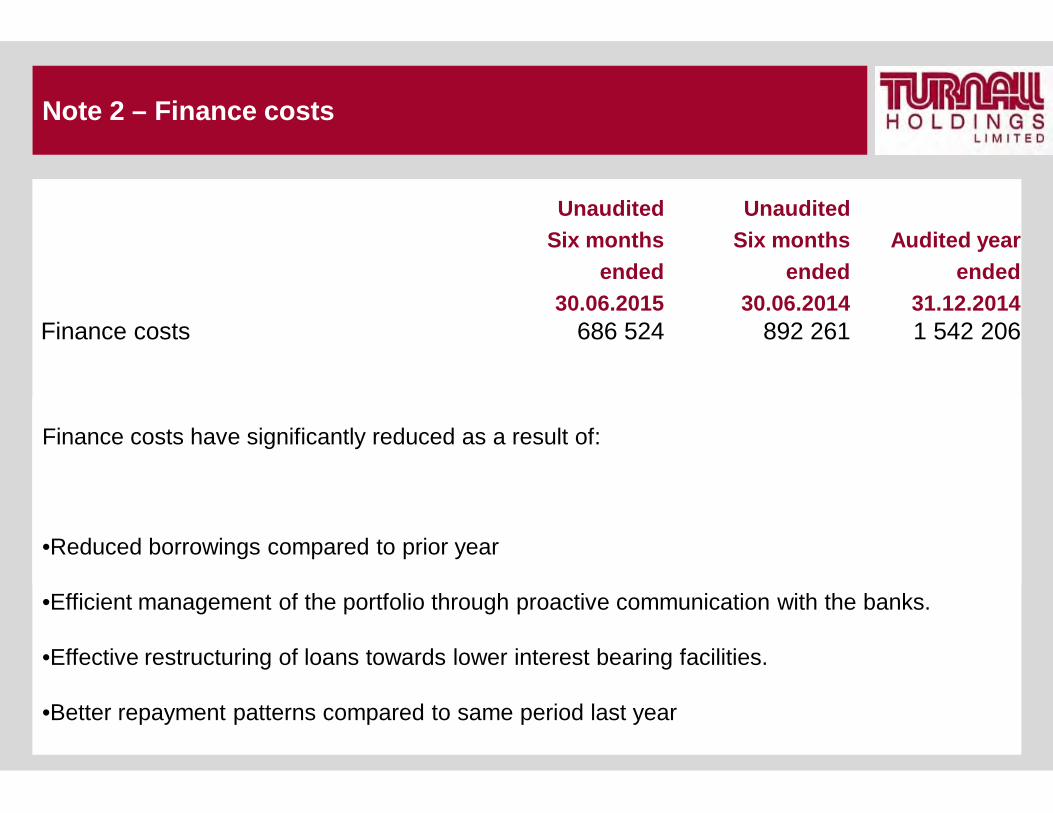
Unaudited UnauditedSix months Six months Audited year
ended ended ended30.06.2015 30.06.2014 31.12.2014
Finance costs 686 524 892 261 1 542 206
Note 2 – Finance costs
Finance costs have significantly reduced as a result of:
•Reduced borrowings compared to prior year
•Efficient management of the portfolio through proactive communication with the banks.
•Effective restructuring of loans towards lower interest bearing facilities.
•Better repayment patterns compared to same period last year
Consolidated Statement of Financial Position
2525
Consolidated Statement of Financial Position
Unaudited Unaudited Auditedas at as at as at
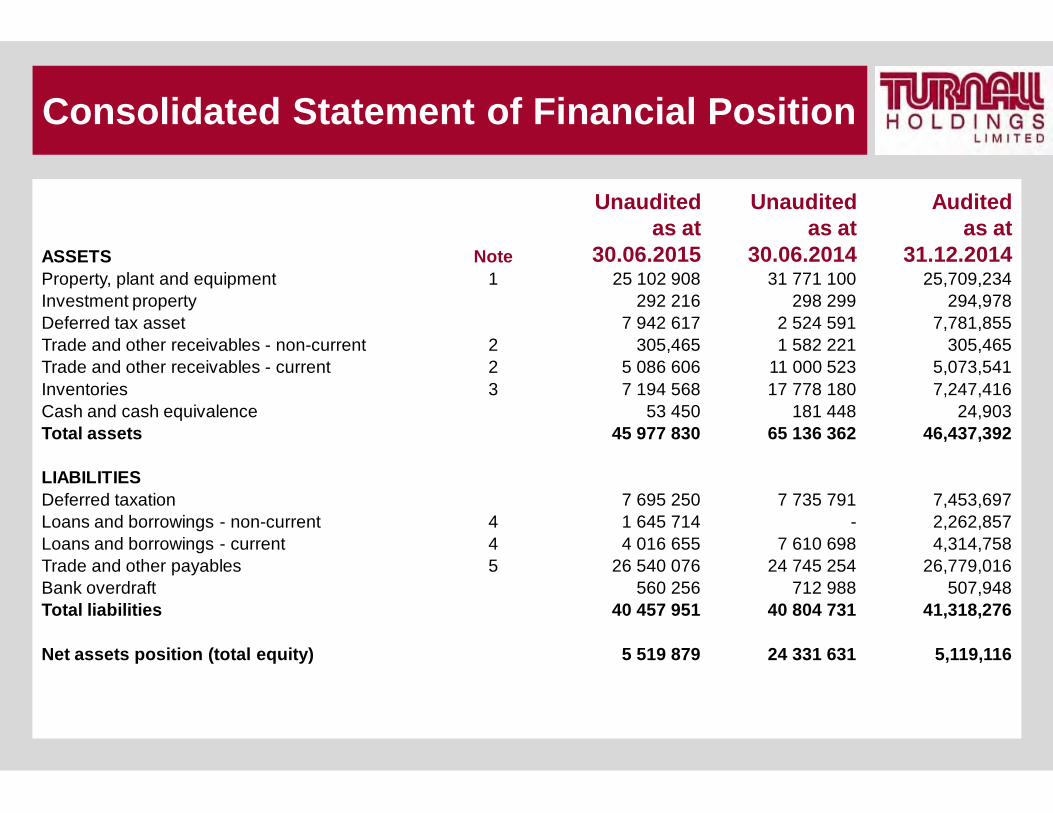
ASSETS Note 30.06.2015 30.06.2014 31.12.2014Property, plant and equipment 1 25 102 908 31 771 100 25,709,234 Investment property 292 216 298 299 294,978 Deferred tax asset 7 942 617 2 524 591 7,781,855 Trade and other receivables - non-current 2 305,465 1 582 221 305,465 Trade and other receivables - current 2 5 086 606 11 000 523 5,073,541 Inventories 3 7 194 568 17 778 180 7,247,416 Cash and cash equivalence 53 450 181 448 24,903 Total assets 45 977 830 65 136 362 46,437,392
LIABILITIESDeferred taxation 7 695 250 7 735 791 7,453,697 Loans and borrowings - non-current 4 1 645 714 - 2,262,857 Loans and borrowings - current 4 4 016 655 7 610 698 4,314,758 Trade and other payables 5 26 540 076 24 745 254 26,779,016 Bank overdraft 560 256 712 988 507,948 Total liabilities 40 457 951 40 804 731 41,318,276
Net assets position (total equity) 5 519 879 24 331 631 5,119,116
Additions-Additions amounted to US$192 625(2014: US$334 845).
-All the additions were for the maintenance of the current capacity
Assets pledged as securityThe Harare and Bulawayo properties are pledged as security for the FBC and BancABCloans.
Note 1 - Property, plant and equipment
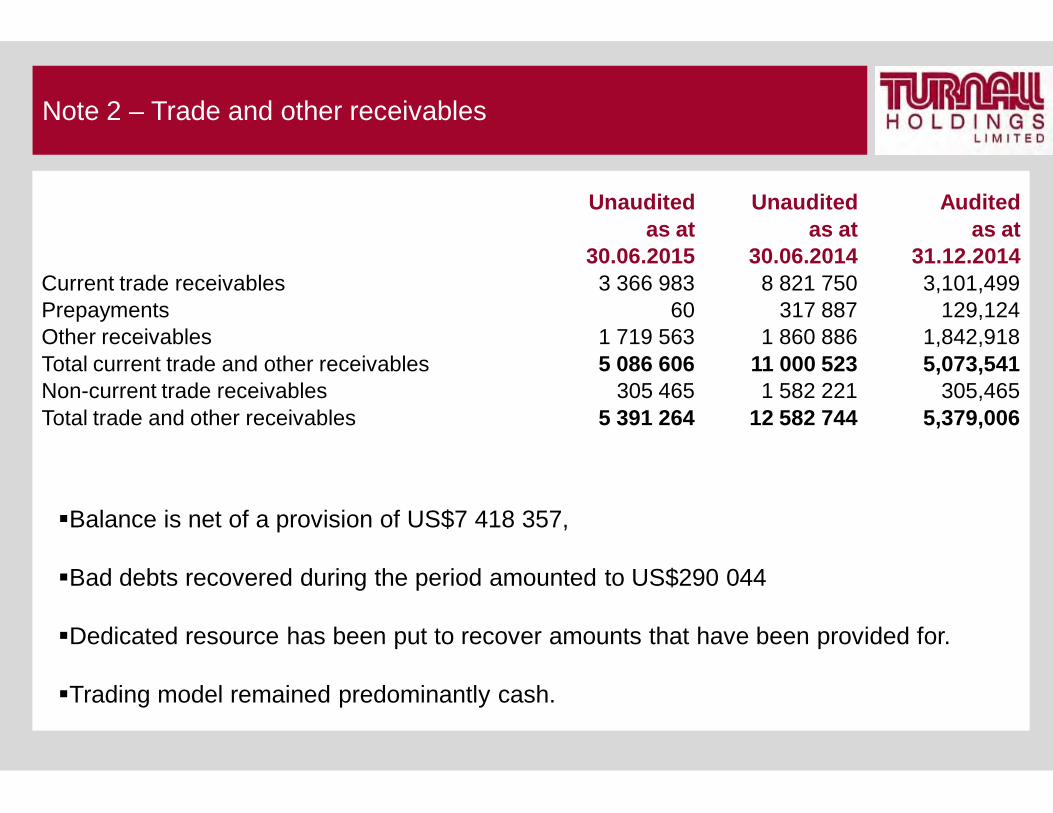
Note 2 – Trade and other receivables
Balance is net of a provision of US$7 418 357,
Bad debts recovered during the period amounted to US$290 044
Dedicated resource has been put to recover amounts that have been provided for.
Trading model remained predominantly cash.
Unaudited Unaudited Auditedas at as at as at
30.06.2015 30.06.2014 31.12.2014Current trade receivables 3 366 983 8 821 750 3,101,499 Prepayments 60 317 887 129,124 Other receivables 1 719 563 1 860 886 1,842,918 Total current trade and other receivables 5 086 606 11 000 523 5,073,541 Non-current trade receivables 305 465 1 582 221 305,465 Total trade and other receivables 5 391 264 12 582 744 5,379,006
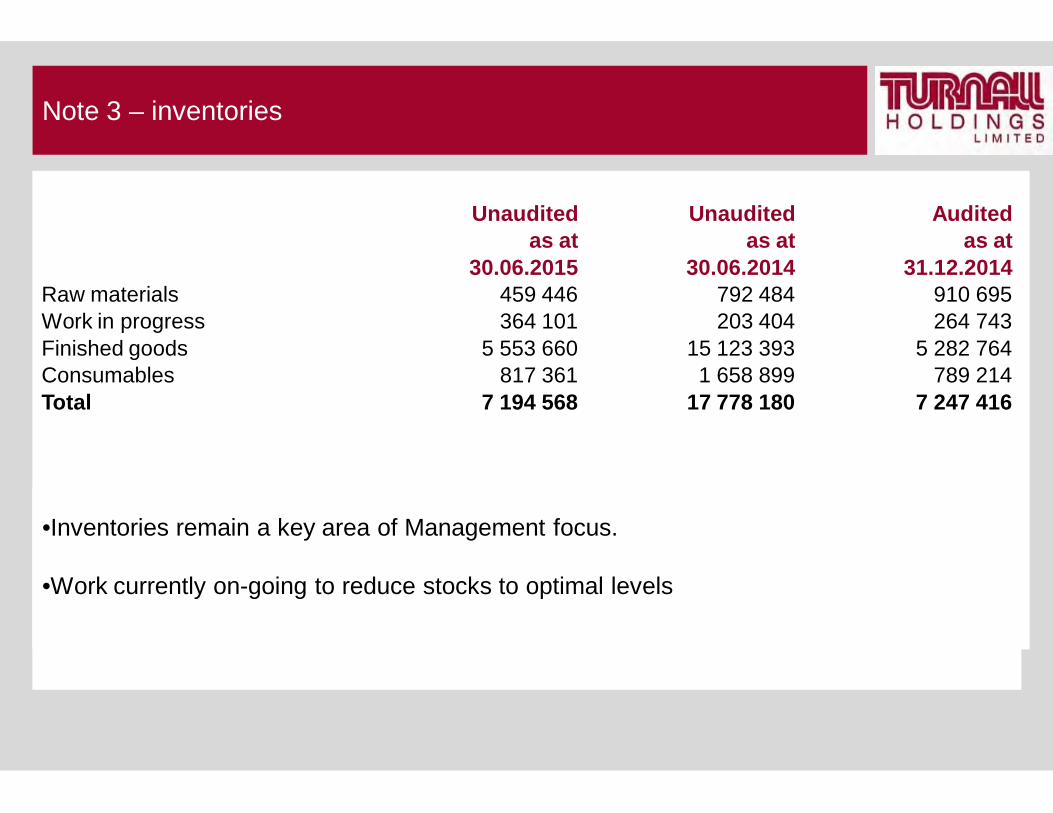
Note 3 – inventories
•Inventories remain a key area of Management focus.
•Work currently on-going to reduce stocks to optimal levels
Unaudited Unaudited Auditedas at as at as at
30.06.2015 30.06.2014 31.12.2014Raw materials 459 446 792 484 910 695 Work in progress 364 101 203 404 264 743 Finished goods 5 553 660 15 123 393 5 282 764 Consumables 817 361 1 658 899 789 214 Total 7 194 568 17 778 180 7 247 416
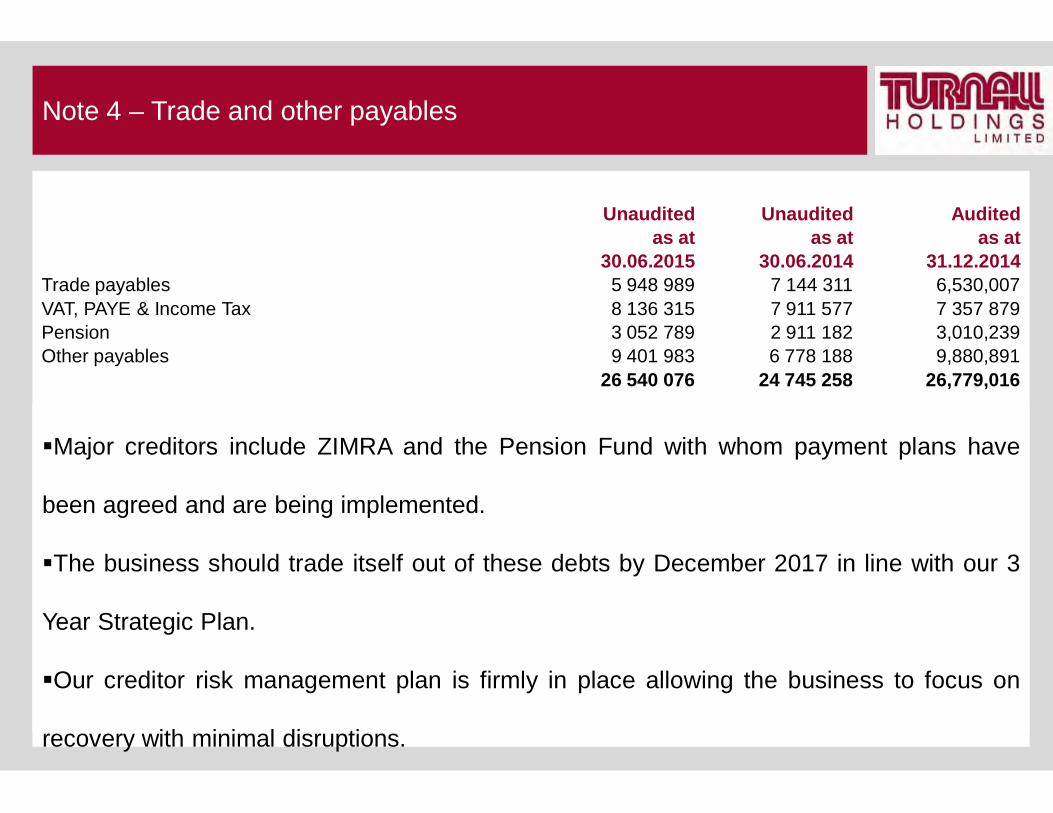
Note 4 – Trade and other payables
Major creditors include ZIMRA and the Pension Fund with whom payment plans have
been agreed and are being implemented.
The business should trade itself out of these debts by December 2017 in line with our 3
Year Strategic Plan.
Our creditor risk management plan is firmly in place allowing the business to focus on
recovery with minimal disruptions.
Unaudited Unaudited Auditedas at as at as at
30.06.2015 30.06.2014 31.12.2014Trade payables 5 948 989 7 144 311 6,530,007 VAT, PAYE & Income Tax 8 136 315 7 911 577 7 357 879 Pension 3 052 789 2 911 182 3,010,239 Other payables 9 401 983 6 778 188 9,880,891
26 540 076 24 745 258 26,779,016
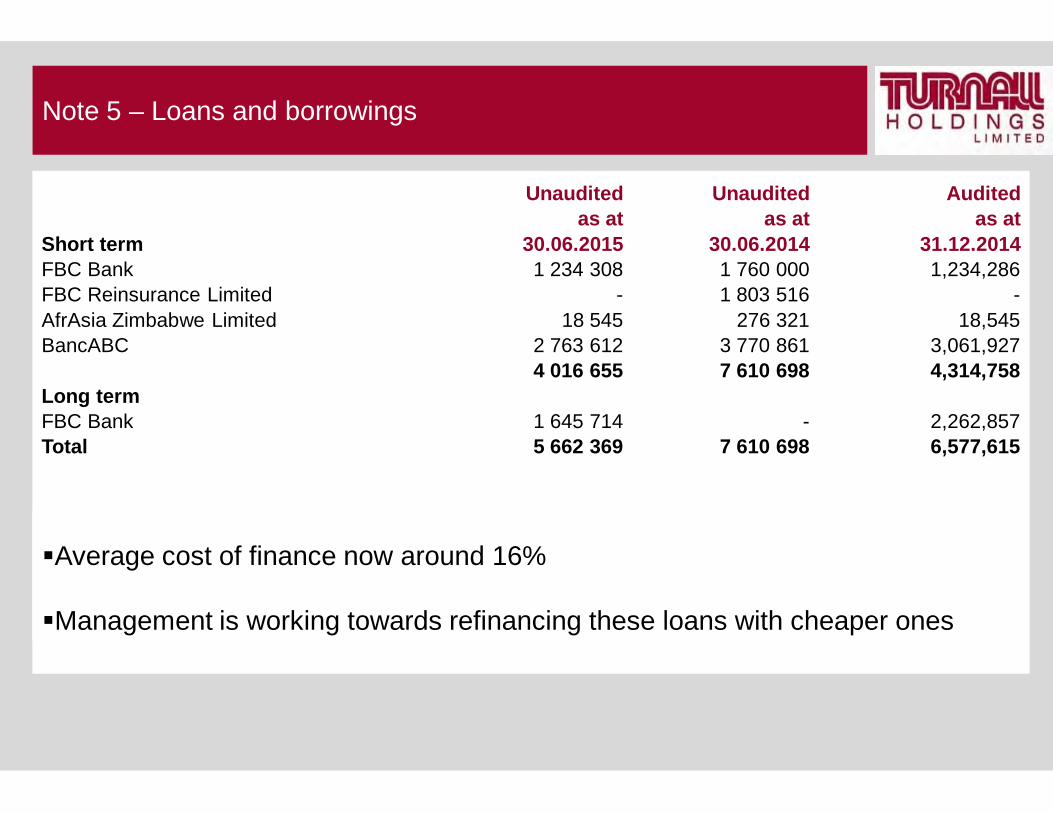
Note 5 – Loans and borrowings
Average cost of finance now around 16%
Management is working towards refinancing these loans with cheaper ones
Unaudited Unaudited Auditedas at as at as at
Short term 30.06.2015 30.06.2014 31.12.2014FBC Bank 1 234 308 1 760 000 1,234,286 FBC Reinsurance Limited - 1 803 516 -AfrAsia Zimbabwe Limited 18 545 276 321 18,545 BancABC 2 763 612 3 770 861 3,061,927
4 016 655 7 610 698 4,314,758 Long term FBC Bank 1 645 714 - 2,262,857 Total 5 662 369 7 610 698 6,577,615
Statement of cash flows
3232
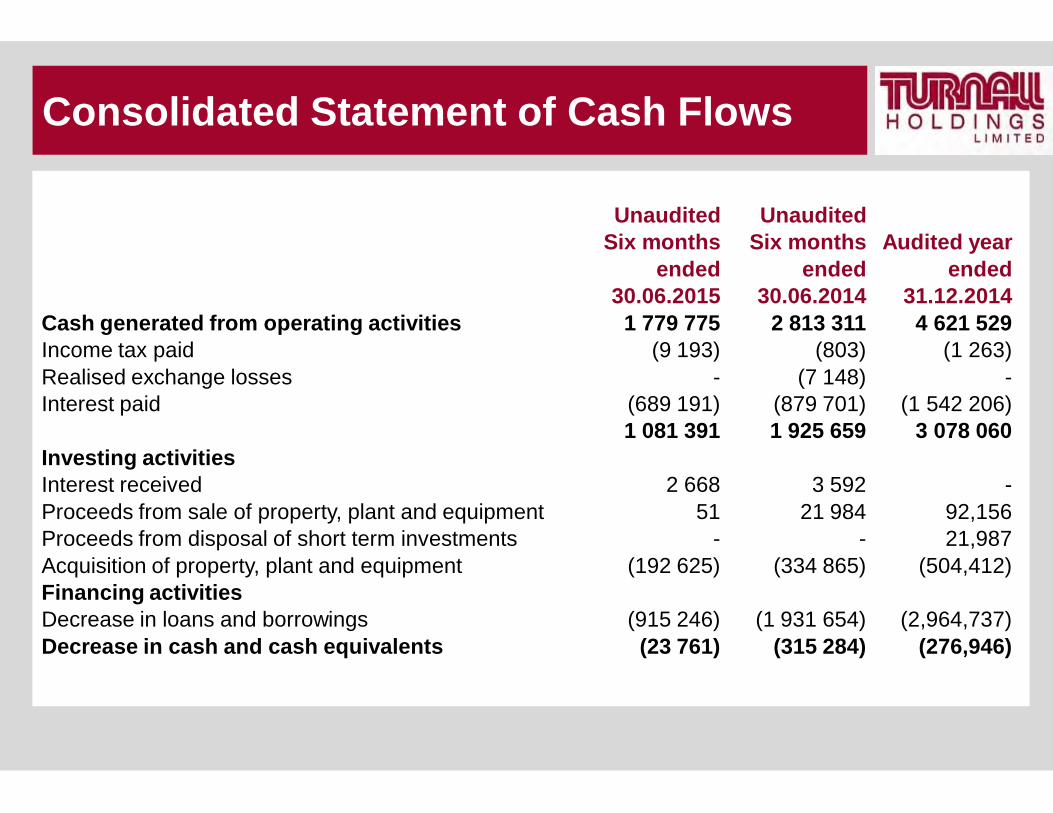
Consolidated Statement of Cash Flows
Unaudited UnauditedSix months Six months Audited year
ended ended ended30.06.2015 30.06.2014 31.12.2014
Cash generated from operating activities 1 779 775 2 813 311 4 621 529 Income tax paid (9 193) (803) (1 263)Realised exchange losses - (7 148) -Interest paid (689 191) (879 701) (1 542 206)
1 081 391 1 925 659 3 078 060 Investing activitiesInterest received 2 668 3 592 -Proceeds from sale of property, plant and equipment 51 21 984 92,156 Proceeds from disposal of short term investments - - 21,987 Acquisition of property, plant and equipment (192 625) (334 865) (504,412)Financing activitiesDecrease in loans and borrowings (915 246) (1 931 654) (2,964,737)Decrease in cash and cash equivalents (23 761) (315 284) (276,946)
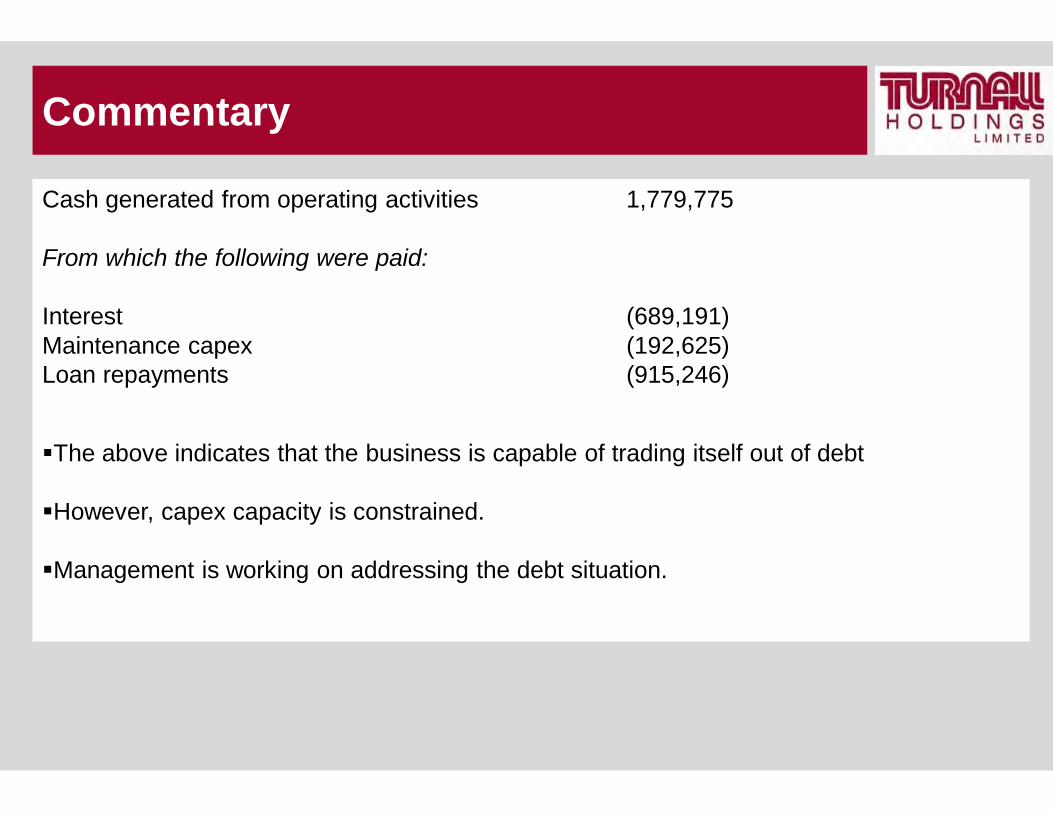
Cash generated from operating activities 1,779,775
From which the following were paid:
Interest (689,191)Maintenance capex (192,625)Loan repayments (915,246)
The above indicates that the business is capable of trading itself out of debt
However, capex capacity is constrained.
Management is working on addressing the debt situation.
Commentary
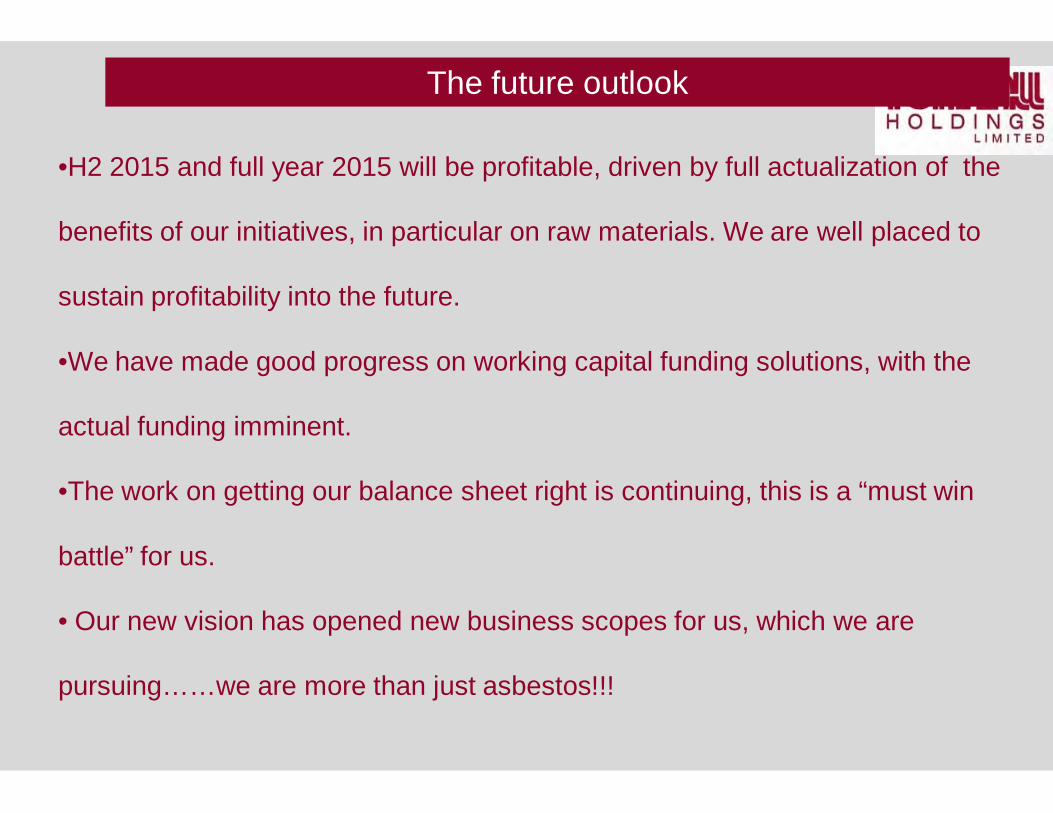
The future outlook
•H2 2015 and full year 2015 will be profitable, driven by full actualization of the
benefits of our initiatives, in particular on raw materials. We are well placed to
sustain profitability into the future.
•We have made good progress on working capital funding solutions, with the
actual funding imminent.
•The work on getting our balance sheet right is continuing, this is a “must win
battle” for us.
• Our new vision has opened new business scopes for us, which we are
pursuing……we are more than just asbestos!!!
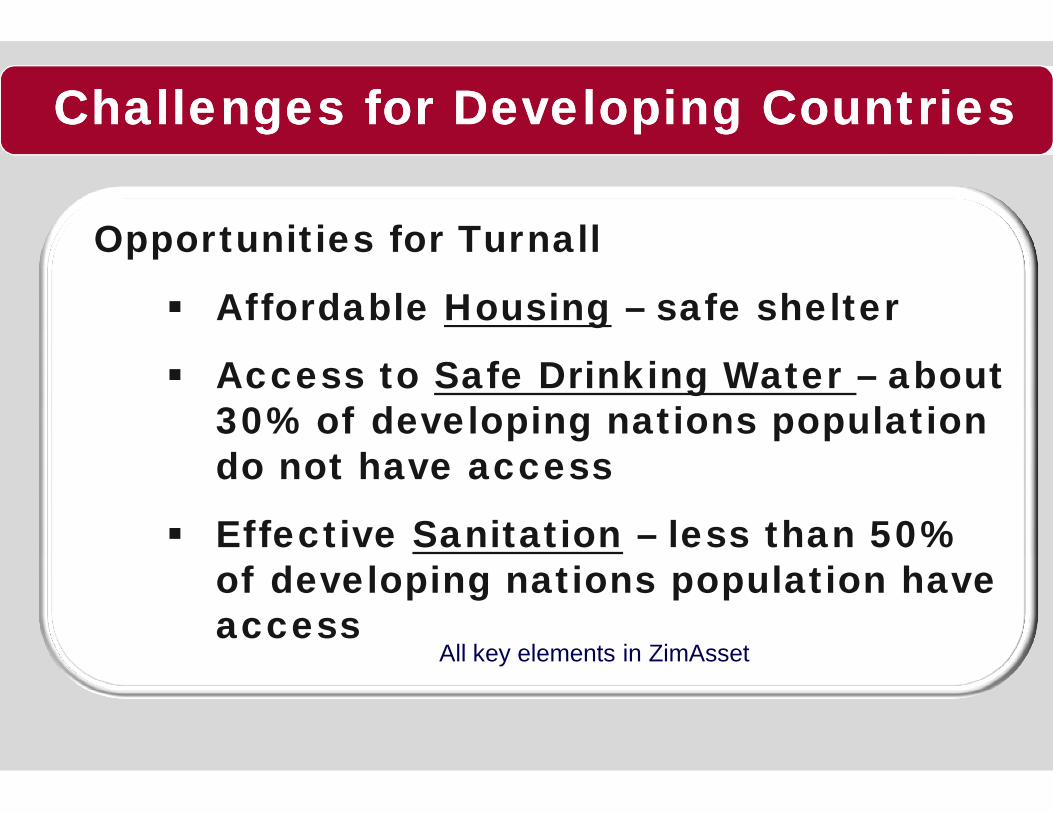
Challenges for Developing CountriesChallenges for Developing Countries
Opportunities for Turnall
Affordable Housing – safe shelter
Access to Safe Drinking Water – about 30% of developing nations population do not have access
Effective Sanitation – less than 50% of developing nations population have access
All key elements in ZimAsset

We see the potential….and we will achieve it!
3838
Thank youTinotendaSiyabonga
Questions &
Answers