Embed Size (px)
Citation preview

Year 8
Higher
Work Pack 4

Calculate the volume of these pyramids and cones. Volume of pyramid = area of base x height / 3; Volume of cone = x height / 3
Red Amber Green
Pyram
id
Cone
30 cm2
9.1 cm2
6 cm2
24 cm2 13 cm
Volume = 310 cm3
What is the height?
Volume = 156 cm3
What is the height?
6 cm
6 cm
8 cm
Height = 12 cm
Height = 6 cm
Height = 11 cm
Height = 8.5 cm
4 cm 4 cm
Height = 3 cm
Height = 18 cm
Height = 9 cm
Height = 12 cm
4 cm
3.1 cm
8 cm
7 cm
Height = 14 cm
Volume of Sphere
3cm
12cm
10cm
5cm
7cm
6cm
4cm
x
15cm
Volume = 600cm3
Volume = 270cm3
11cm
8cm
3cm
6cm
11cm 6cm
8cm
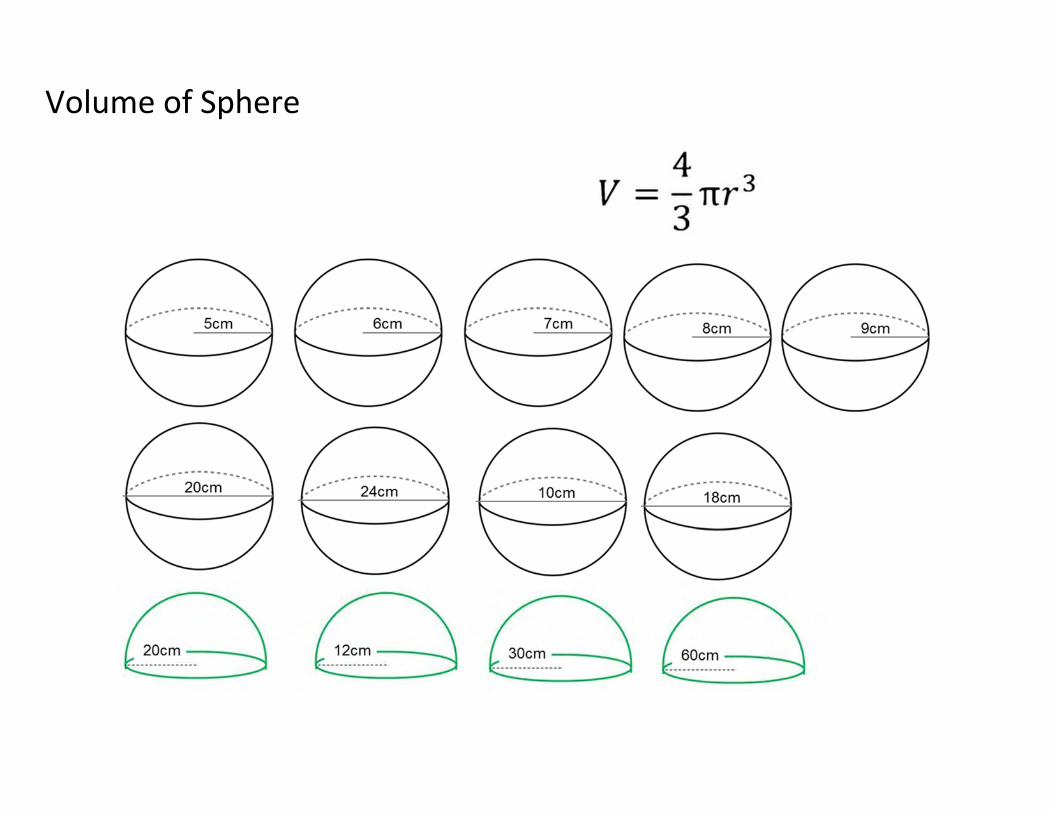
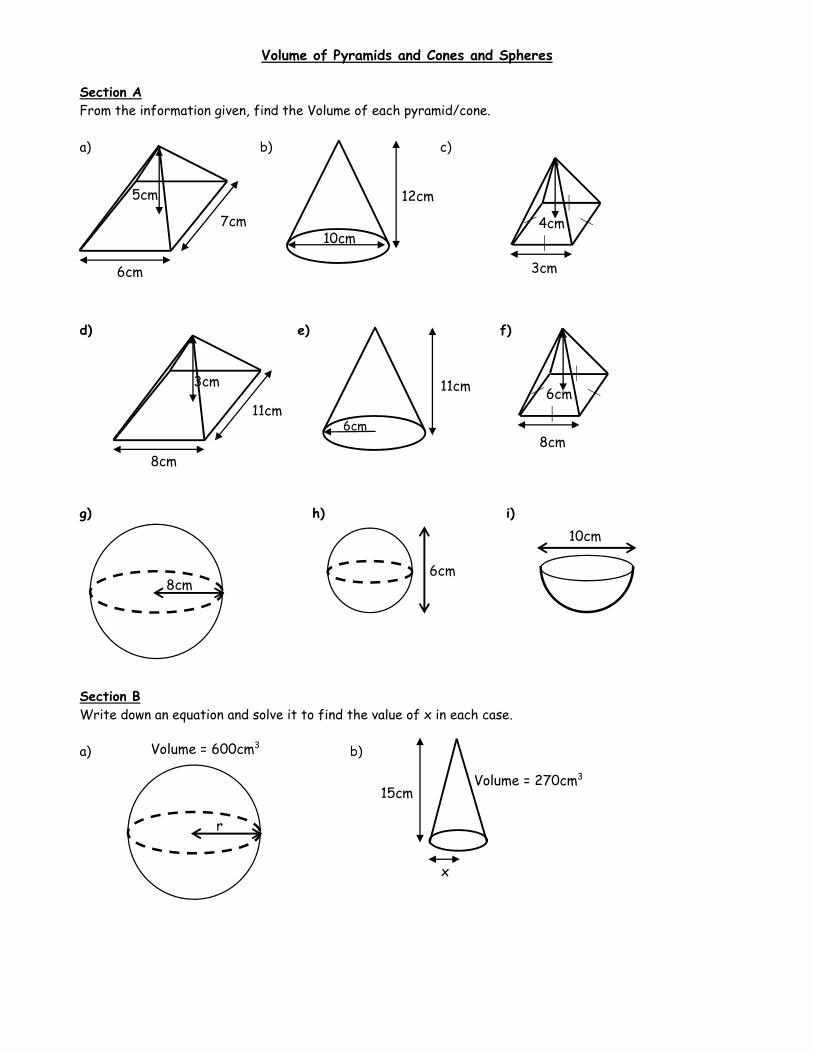
Volume of Pyramids and Cones and Spheres
Section A From the information given, find the Volume of each pyramid/cone. a) b) c) d) e) f) g) h) i) Section B Write down an equation and solve it to find the value of x in each case. a) b)
8cm
10cm
6cm
r

Surface Area of Cuboids
Area of front:
Area of back:
Area of side:
Area of side:
Area of top:
Area of bottom:
Total surface area:
Area of front:
Area of back:
Area of side:
Area of side:
Area of top:
Area of bottom:
Total surface area:
Area of front:
Area of back:
Area of side:
Area of side:
Area of top:
Area of bottom:
Total surface area:
3cm
7cm 2cm
6mm
4mm
1mm
10m
4m
8m

Area of front:
Area of back:
Area of side:
Area of side:
Area of top:
Area of bottom:
Total surface area:
Area of front:
Area of back:
Area of side:
Area of side:
Area of top:
Area of bottom:
Total surface area:
Area of front:
Area of back:
Area of side:
Area of side:
Area of top:
Area of bottom:
Total surface area:
9cm
1cm 5cm
15mm
7mm 10mm
12m
9m
4m
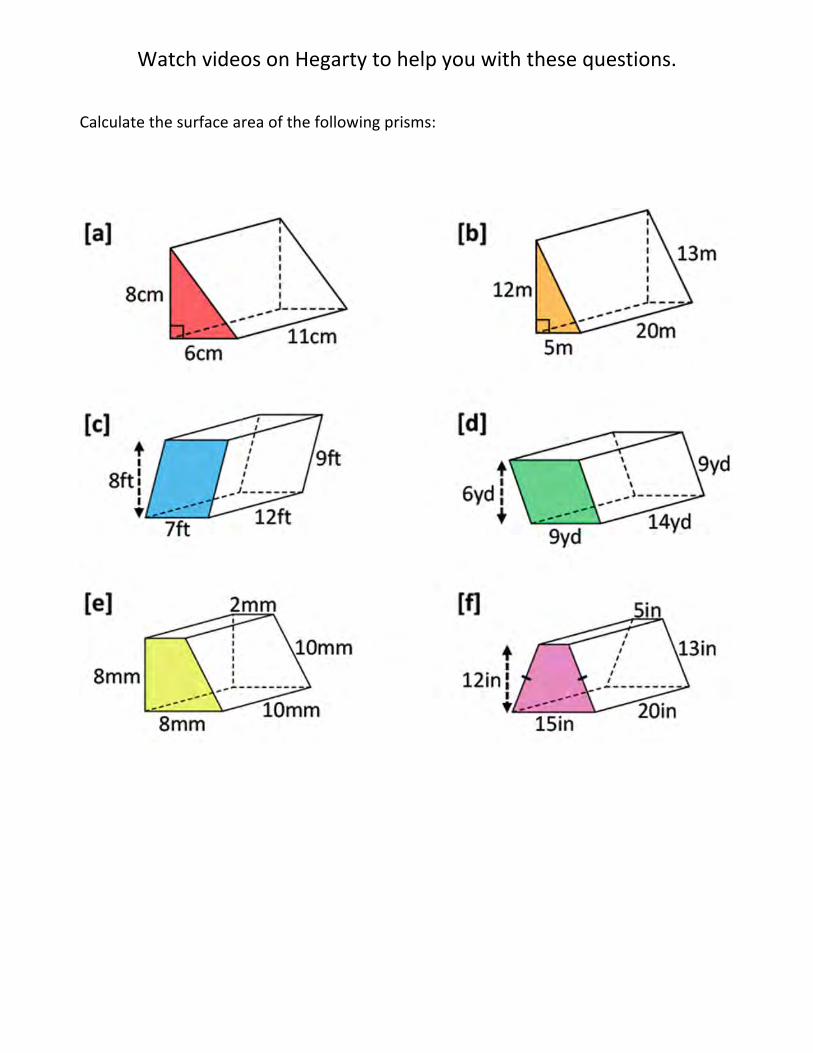
Watch videos on Hegarty to help you with these questions.
Calculate the surface area of the following prisms:

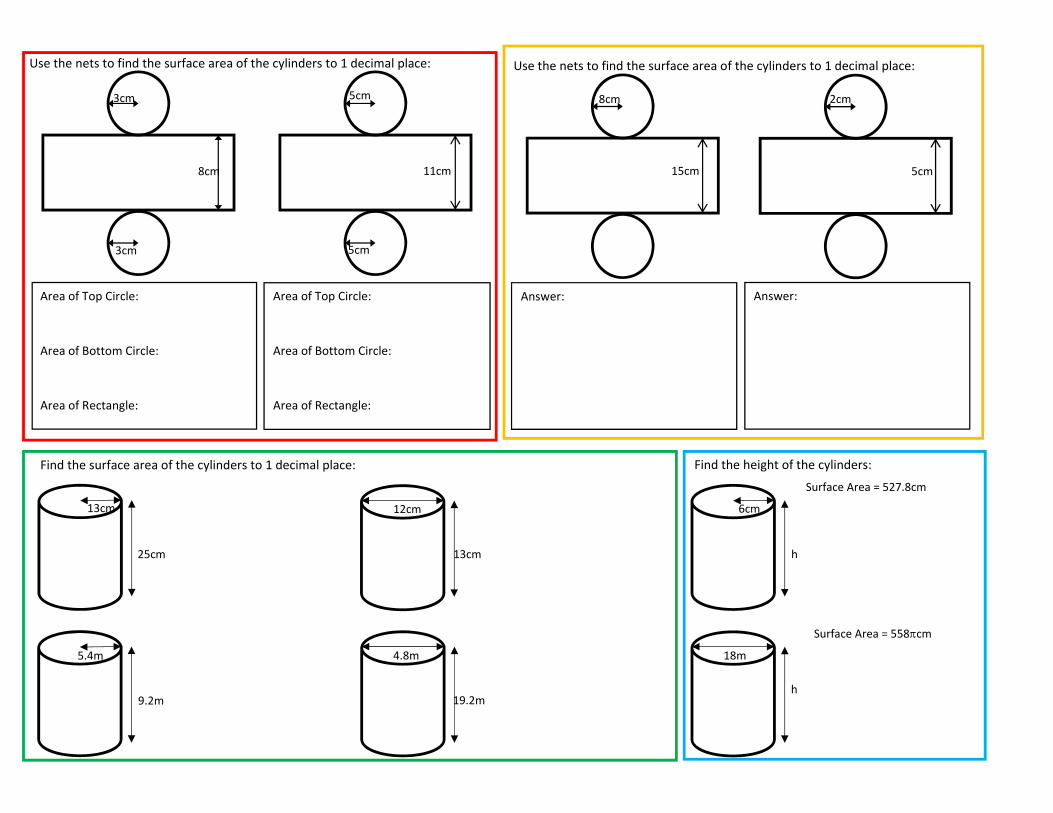
Area of Top Circle:
Area of Bottom Circle:
Area of Rectangle:
Area of Top Circle:
Area of Bottom Circle:
Area of Rectangle:
Answer: Answer:
Use the nets to find the surface area of the cylinders to 1 decimal place: Use the nets to find the surface area of the cylinders to 1 decimal place:
Find the surface area of the cylinders to 1 decimal place: Find the height of the cylinders:
3cm
3cm
5cm
5cm
8cm 2cm
8cm 11cm 15cm 5cm
13cm
25cm
12cm
13cm
5.4m
9.2m
4.8m
19.2m
6cm
18m
h
h
Surface Area = 527.8cm
Surface Area = 558cm

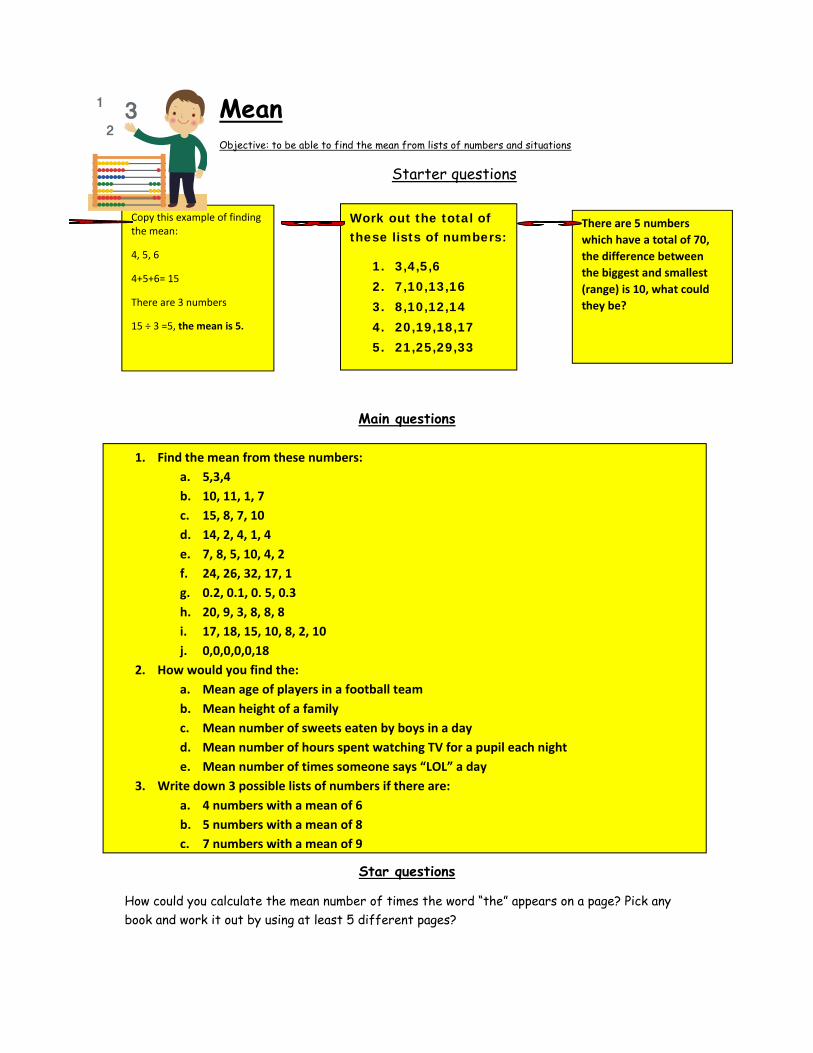
Mean Objective: to be able to find the mean from lists of numbers and situations
Starter questions
Main questions
Star questions
How could you calculate the mean number of times the word “the” appears on a page? Pick any book and work it out by using at least 5 different pages?
1. Find the mean from these numbers: a. 5,3,4 b. 10, 11, 1, 7 c. 15, 8, 7, 10 d. 14, 2, 4, 1, 4 e. 7, 8, 5, 10, 4, 2 f. 24, 26, 32, 17, 1 g. 0.2, 0.1, 0. 5, 0.3 h. 20, 9, 3, 8, 8, 8 i. 17, 18, 15, 10, 8, 2, 10 j. 0,0,0,0,0,18
2. How would you find the: a. Mean age of players in a football team b. Mean height of a family c. Mean number of sweets eaten by boys in a day d. Mean number of hours spent watching TV for a pupil each night e. Mean number of times someone says “LOL” a day
3. Write down 3 possible lists of numbers if there are: a. 4 numbers with a mean of 6 b. 5 numbers with a mean of 8 c. 7 numbers with a mean of 9
Work out the total of these lists of numbers:
1. 3,4,5,6 2. 7,10,13,16 3. 8,10,12,14 4. 20,19,18,17 5. 21,25,29,33
There are 5 numbers which have a total of 70, the difference between the biggest and smallest (range) is 10, what could they be?
Copy this example of finding the mean:
4, 5, 6
4+5+6= 15
There are 3 numbers
15 ÷ 3 =5, the mean is 5.

Averages Mode (Most Common)
The number that is in the list the most times.
E.G: 1 ,4 ,4 ,4 ,2 ,9 ,4
The most common number in this list is the number 4 so the MODE is 4.
Median (The Middle Number)
Once the list of numbers has been put in order smallest to biggest the Median is the number
in the middle of the list.
E.G: 1 ,4 ,4 ,4 ,2 ,9 ,4
1st put the numbers in order smallest to biggest – 1 ,2 ,4 ,4 ,4 ,4 ,9
2nd cross of each number (1 from each end of the list) until there is only 1 left in the middle
1 ,2 ,4 ,4 ,4 ,4 ,9
4 is the number in the middle of the list so the MEDIAN is 4.
Mean (The mean one!!!)
Add all the numbers in the list together then divide by how many numbers are in the list.
E.G: 1 ,4 ,4 ,4 ,2 ,9 ,4
1st add the numbers together 1+4+4+4+2+9+4 = 28
2nd divide the answer by how many numbers are in the list 28 ÷ 7 = 4
So the MEAN is 4.
Range (The difference)
Find the difference between the biggest and the smallest number.
E.G: 1 ,4 ,4 ,4 ,2 ,9 ,4
The biggest number is 9 and the smallest number is 1. Calculate: 9 – 1 = 8
The Range is 8.

Mode (Most Common) Find the Mode:‐
a) 1,7,7,8,9,2
b) 9,7,8,5,1,1,1
c) 2,2,2,2,2,2,2
d) 1,1,7,7,7,4,1
e) 2,1,3,3,4,4,3,4
f) 9,4,5,8,7,2
g) 1,7,4,3,2,1
h) 1,2,3,4,5,6
i) 1,1,3,1
j) 9,7,2,4,4,1,1
HINT:
You can have more than one number for the Mode
HINT:
If there is no mode then the answer is NO MODE!
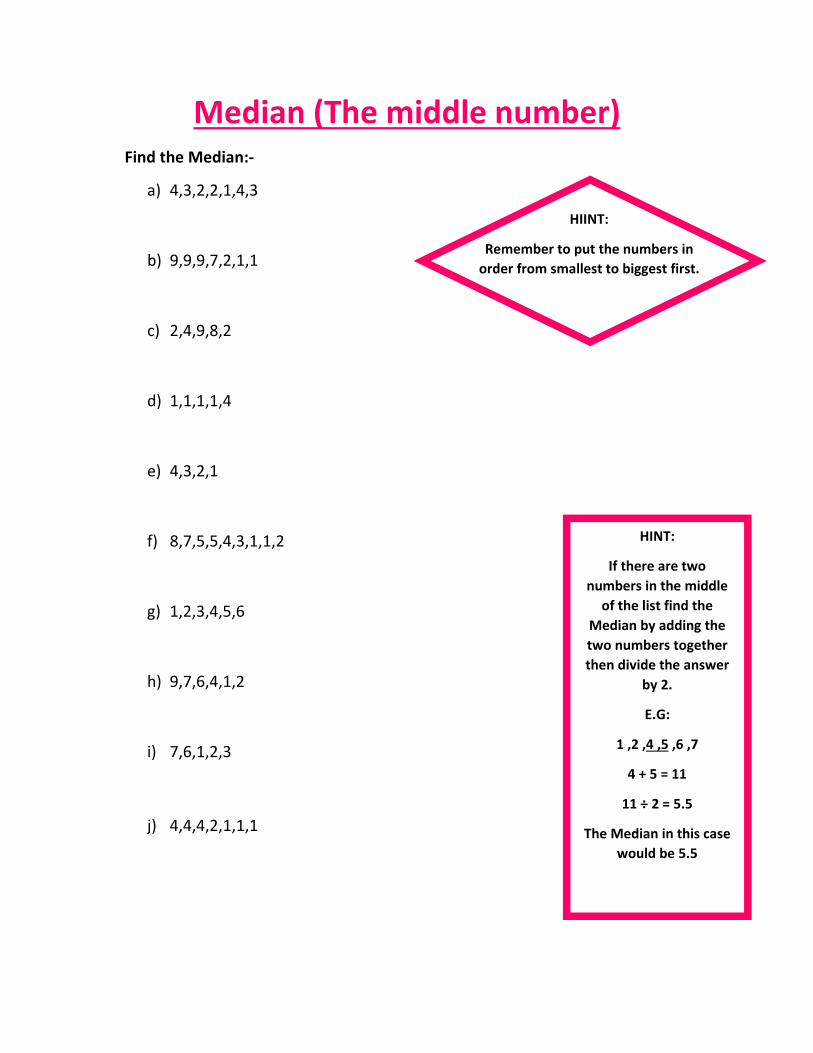
Median (The middle number) Find the Median:‐
a) 4,3,2,2,1,4,3
b) 9,9,9,7,2,1,1
c) 2,4,9,8,2
d) 1,1,1,1,4
e) 4,3,2,1
f) 8,7,5,5,4,3,1,1,2
g) 1,2,3,4,5,6
h) 9,7,6,4,1,2
i) 7,6,1,2,3
j) 4,4,4,2,1,1,1
HIINT:
Remember to put the numbers in order from smallest to biggest first.
HINT:
If there are two numbers in the middle of the list find the
Median by adding the two numbers together then divide the answer
by 2.
E.G:
1 ,2 ,4 ,5 ,6 ,7
4 + 5 = 11
11 ÷ 2 = 5.5
The Median in this case would be 5.5
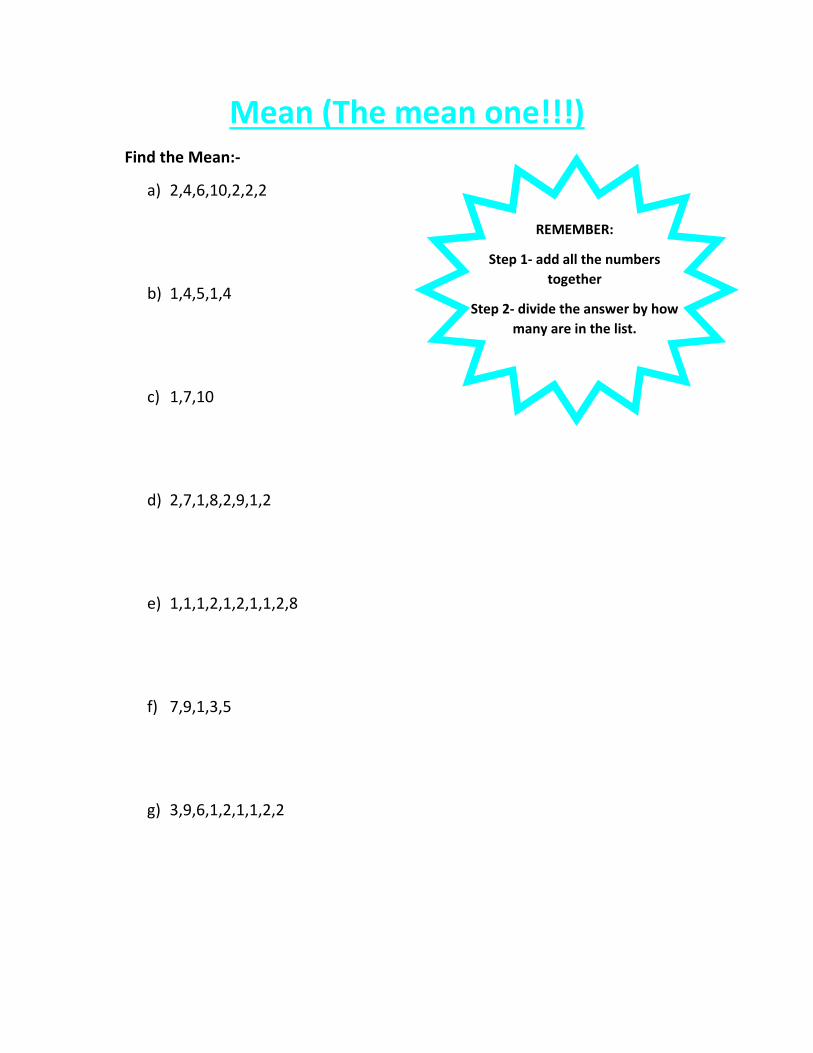
Mean (The mean one!!!) Find the Mean:‐
a) 2,4,6,10,2,2,2
b) 1,4,5,1,4
c) 1,7,10
d) 2,7,1,8,2,9,1,2
e) 1,1,1,2,1,2,1,1,2,8
f) 7,9,1,3,5
g) 3,9,6,1,2,1,1,2,2
REMEMBER:
Step 1‐ add all the numbers together
Step 2‐ divide the answer by how many are in the list.
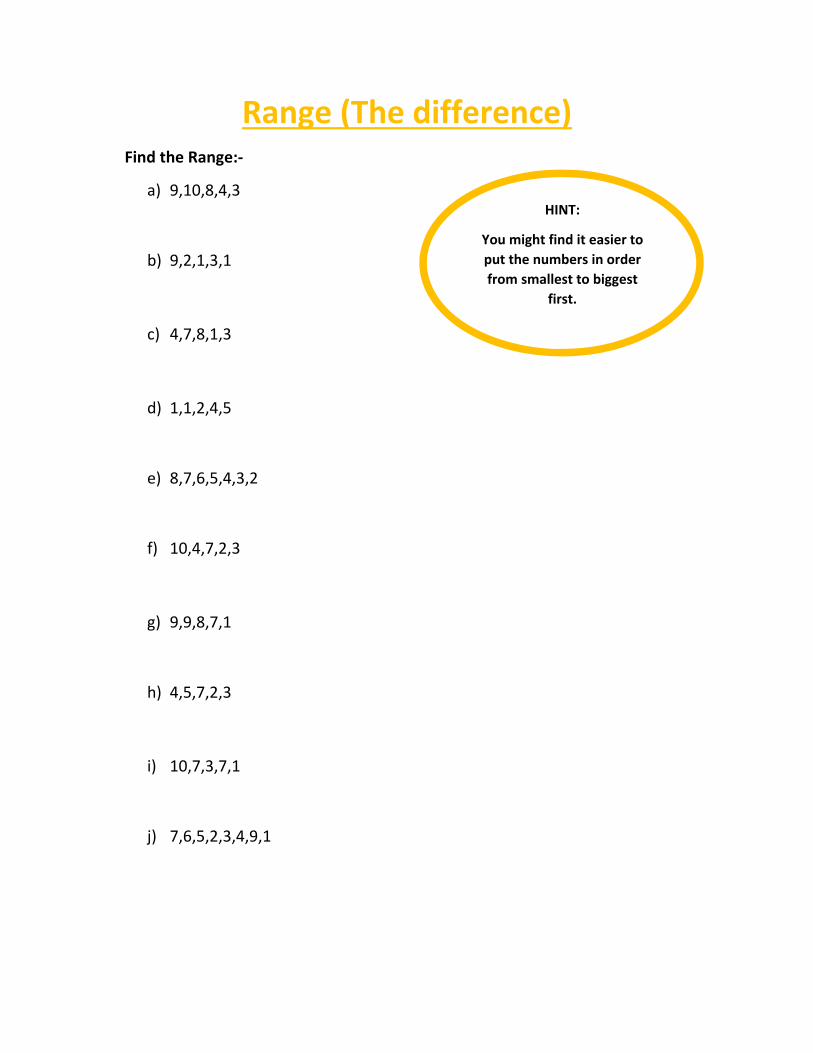
Range (The difference) Find the Range:‐
a) 9,10,8,4,3
b) 9,2,1,3,1
c) 4,7,8,1,3
d) 1,1,2,4,5
e) 8,7,6,5,4,3,2
f) 10,4,7,2,3
g) 9,9,8,7,1
h) 4,5,7,2,3
i) 10,7,3,7,1
j) 7,6,5,2,3,4,9,1
HINT:
You might find it easier to put the numbers in order from smallest to biggest
first.
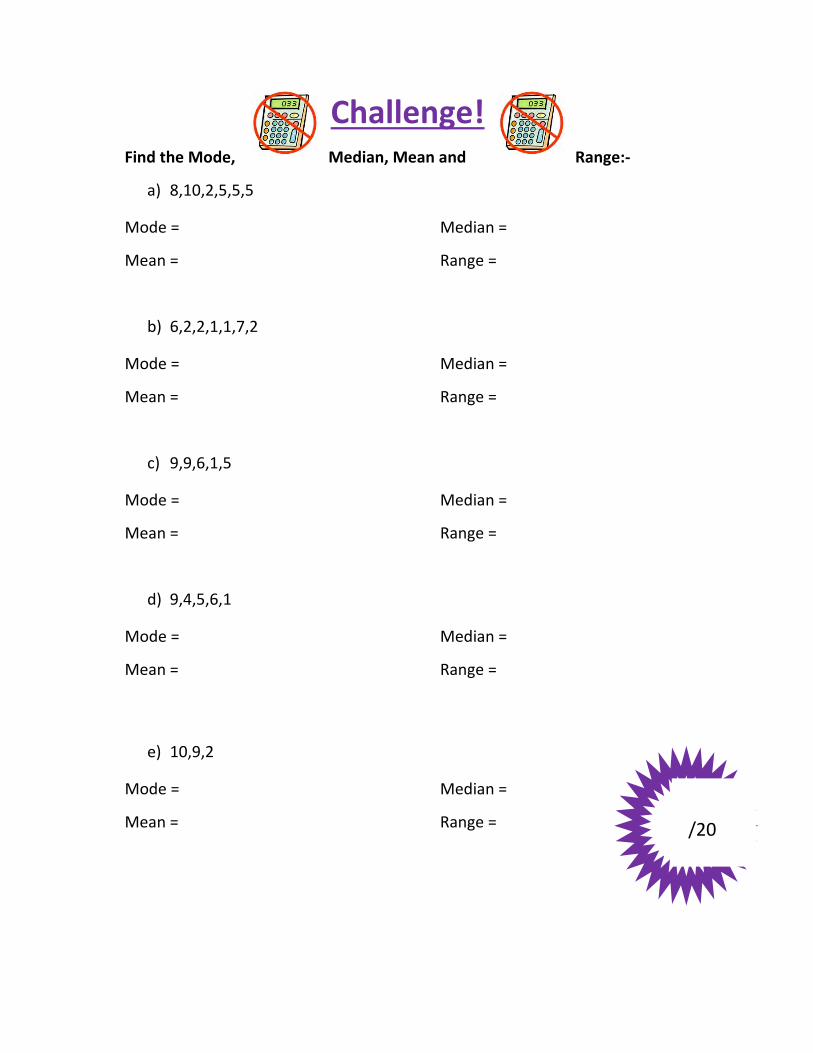
Challenge! Find the Mode, Median, Mean and Range:‐
a) 8,10,2,5,5,5
Mode = Median =
Mean = Range =
b) 6,2,2,1,1,7,2
Mode = Median =
Mean = Range =
c) 9,9,6,1,5
Mode = Median =
Mean = Range =
d) 9,4,5,6,1
Mode = Median =
Mean = Range =
e) 10,9,2
Mode = Median =
Mean = Range =
/20
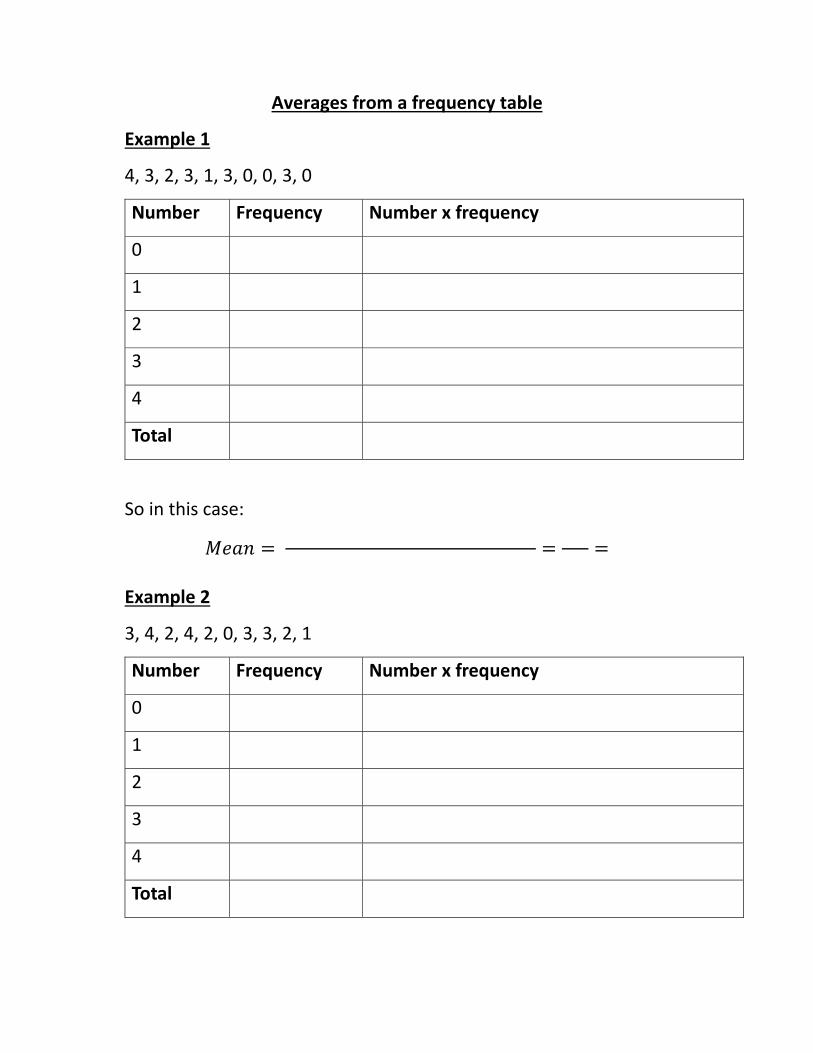
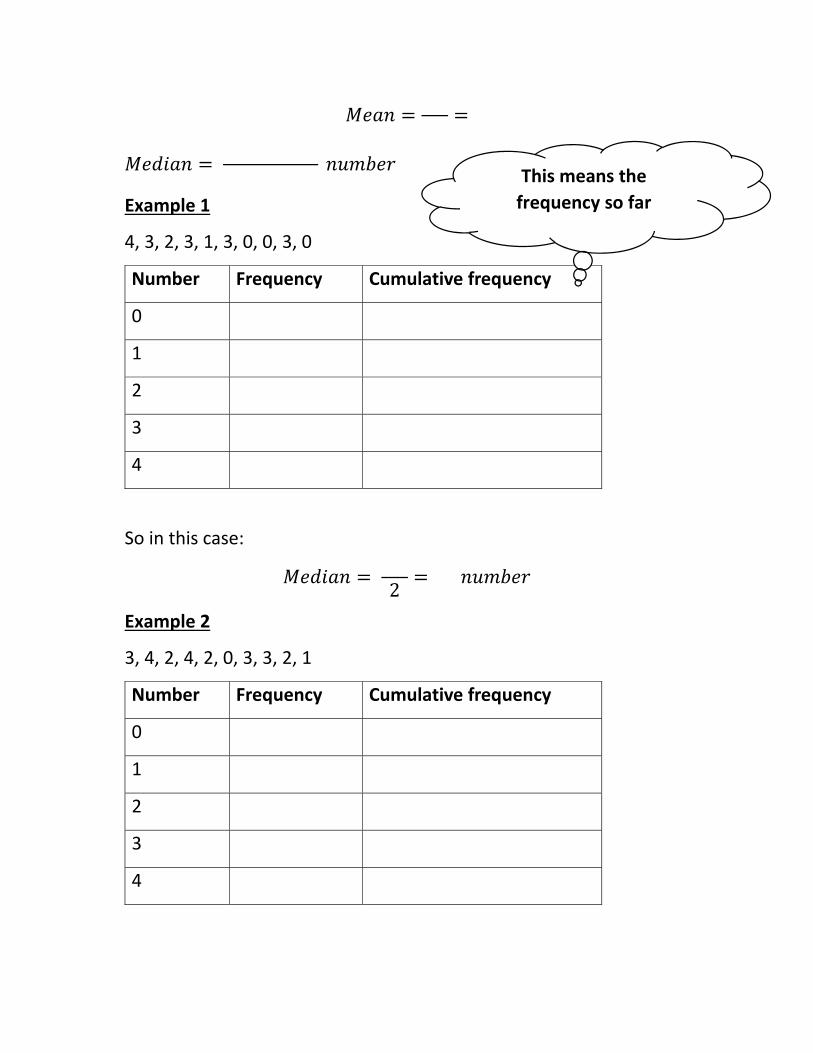
Averages from a frequency table
Example 1
4, 3, 2, 3, 1, 3, 0, 0, 3, 0
Number Frequency Number x frequency
0
1
2
3
4
Total
So in this case:
2789
Example 2
3, 4, 2, 4, 2, 0, 3, 3, 2, 1
Number Frequency Number x frequency
0
1
2
3
4
Total
2789
Example 1
4, 3, 2, 3, 1, 3, 0, 0, 3, 0
Number Frequency Cumulative frequency
0
1
2
3
4
So in this case:
272
10
Example 2
3, 4, 2, 4, 2, 0, 3, 3, 2, 1
Number Frequency Cumulative frequency
0
1
2
3
4
This means the frequency so far
272
10
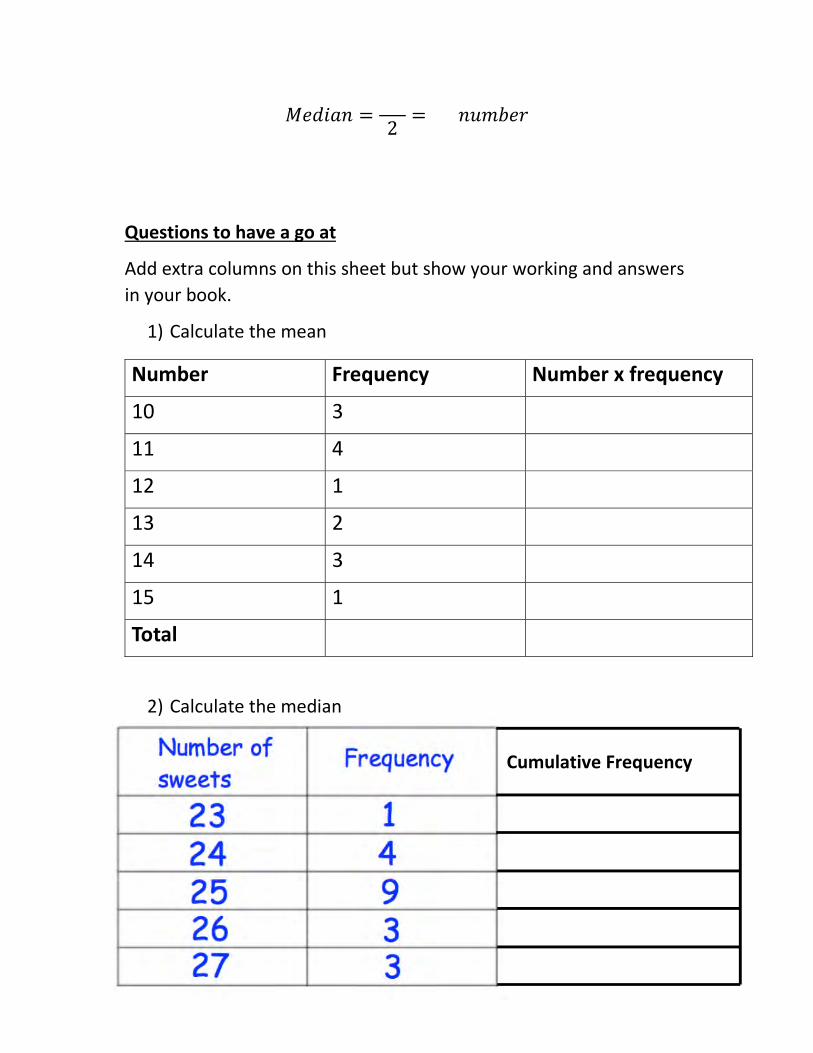
Questions to have a go at
Add extra columns on this sheet but show your working and answers
in your book.
1) Calculate the mean
Number Frequency Number x frequency
10 3
11 4
12 1
13 2
14 3
15 1
Total
2) Calculate the median
Cumulative Frequency
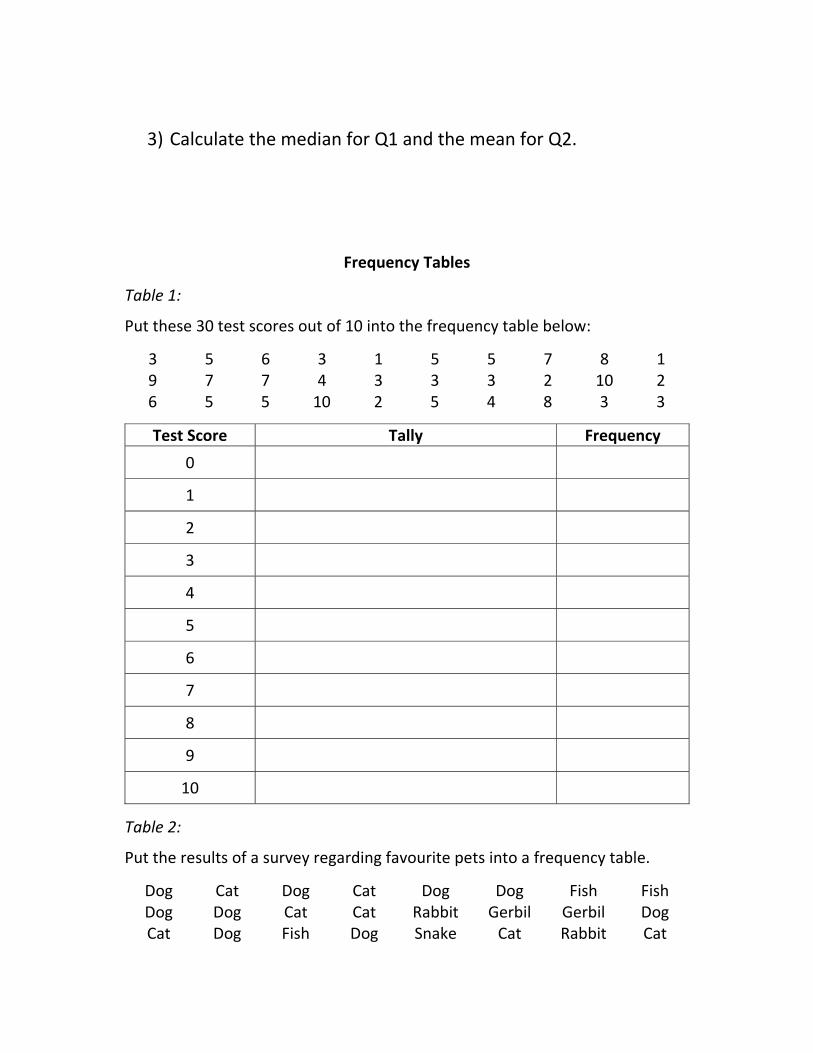
3) Calculate the median for Q1 and the mean for Q2.
Frequency Tables
Table 1:
Put these 30 test scores out of 10 into the frequency table below:
3 5 6 3 1 5 5 7 8 1 9 7 7 4 3 3 3 2 10 2 6 5 5 10 2 5 4 8 3 3
Test Score Tally Frequency 0
1
2
3
4
5
6
7
8
9
10
Table 2:
Put the results of a survey regarding favourite pets into a frequency table.
Dog Cat Dog Cat Dog Dog Fish Fish Dog Dog Cat Cat Rabbit Gerbil Gerbil Dog Cat Dog Fish Dog Snake Cat Rabbit Cat

Pet Tally Frequency
Table 3:
Fill in the speeds of 50 cars in the frequency table below.
31 53 66 21 43 57 87 22 29 54
47 32 40 55 25 38 16 71 64 61
52 9 27 29 51 92 49 37 50 29
62 38 17 22 75 88 67 43 81 44
13 7 30 46 19 28 84 70 41 56
Speed (mph) Tally Frequency
1‐10
11‐20
21‐30
31‐40
41‐50
51‐60
61‐70
71‐80
81‐90
91‐100
Why have we used groups for this frequency table?
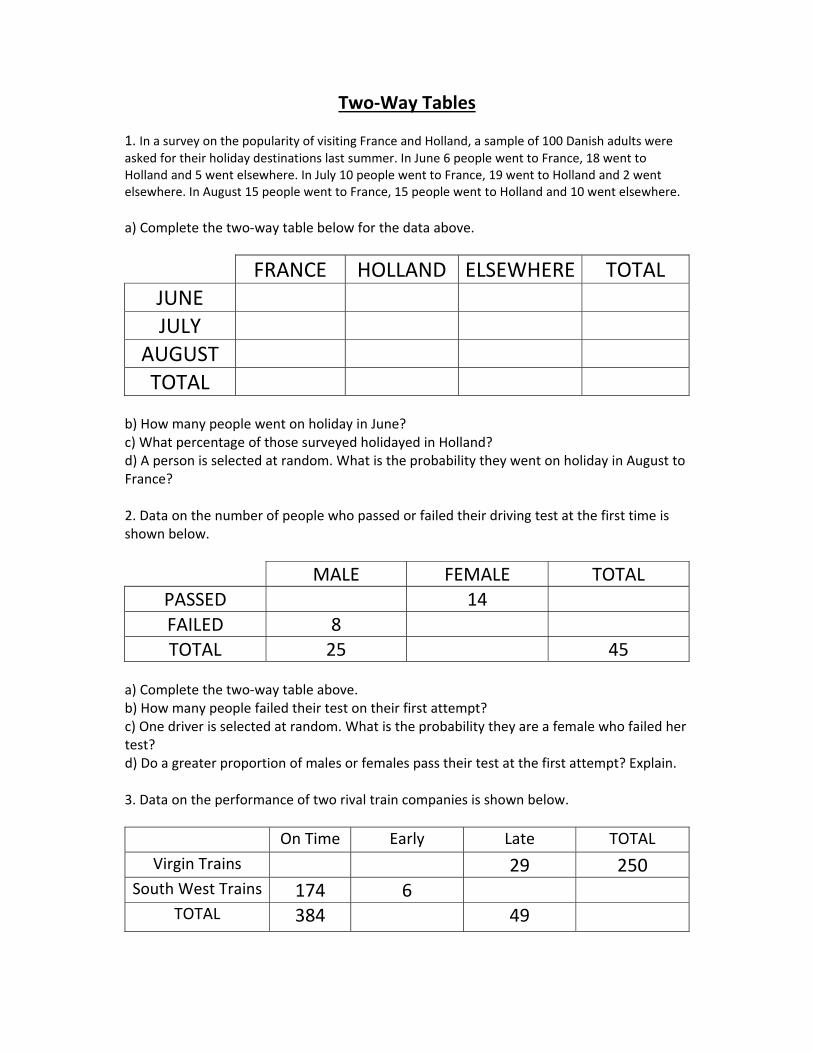
Two‐Way Tables
1. In a survey on the popularity of visiting France and Holland, a sample of 100 Danish adults were asked for their holiday destinations last summer. In June 6 people went to France, 18 went to Holland and 5 went elsewhere. In July 10 people went to France, 19 went to Holland and 2 went elsewhere. In August 15 people went to France, 15 people went to Holland and 10 went elsewhere.
a) Complete the two‐way table below for the data above.
FRANCE HOLLAND ELSEWHERE TOTAL JUNE JULY
AUGUST
TOTAL b) How many people went on holiday in June? c) What percentage of those surveyed holidayed in Holland? d) A person is selected at random. What is the probability they went on holiday in August to France? 2. Data on the number of people who passed or failed their driving test at the first time is shown below.
MALE FEMALE TOTAL
PASSED 14
FAILED 8 TOTAL 25 45
a) Complete the two‐way table above. b) How many people failed their test on their first attempt? c) One driver is selected at random. What is the probability they are a female who failed her test? d) Do a greater proportion of males or females pass their test at the first attempt? Explain. 3. Data on the performance of two rival train companies is shown below.
On Time Early Late TOTAL
Virgin Trains 29 250 South West Trains 174 6
TOTAL 384 49

a) Complete the two‐way table above. b) What percentage of each train company’s trains ran on time? c) Did a higher percentage of Virgin trains arrive late? Justify your answer. d) Given this data, in the next 5000 arrivals of South West Trains, how many would you expect to arrive early?
Bar charts 1. The amount of rainfall, in mm, was recorded at 10 different weather stations in January and July. The data is shown in the table below. Draw a comparative bar chart to represent the data.
Weather Station
A B C D E F G H I J
January 89 94 90 85 82 99 100 80 85 88
July 46 40 56 50 45 49 66 53 46 44

2. The number of different nationalities within two groups is shown in the table below. Draw a composite bar chart to represent the data.
British French German Spanish
Group 1 9 3 8 6
Group 2 7 4 5 4

3. Kirsten records the number of mugs sold in a table. She divides the year into ‘quarters’ (periods of three months). Draw a comparative bar chart for the data
Which quarter of the year did she sell the most? ________________________________________ Compare the sales of mugs in 2014 and 2013. _____________________________________________________________________________________________________________________________________________________________________________________________________________________________________________________________________
Weather Station
Jan‐Mar
Apr‐Jun
Jul‐Sept
Oct‐Dec
2013 470 420 510 630
2014 490 540 770 820

4. Kitty and George sell cars. The table shows the number of cars sold by Kitty and George in the first four months of 2014.
January February March April
Kitty 12 4 21 9
George 5 8 24 14
Draw a composite bar chart to show the information.
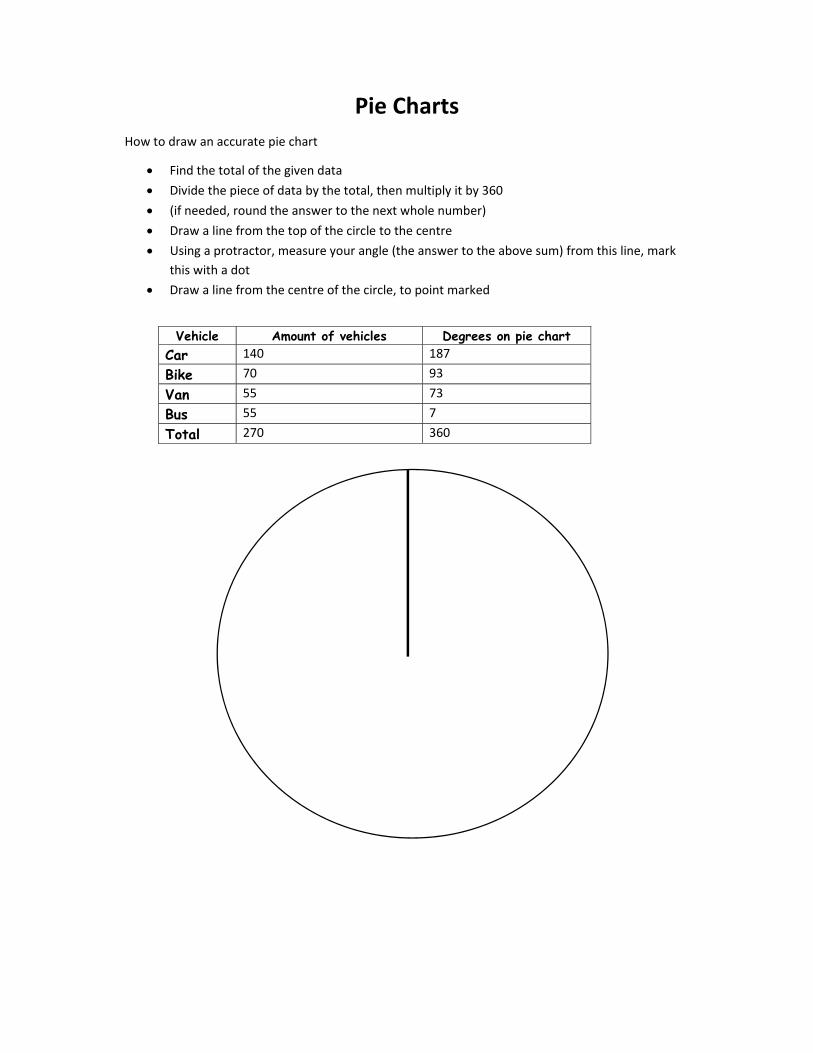
Pie Charts How to draw an accurate pie chart
Find the total of the given data
Divide the piece of data by the total, then multiply it by 360
(if needed, round the answer to the next whole number)
Draw a line from the top of the circle to the centre
Using a protractor, measure your angle (the answer to the above sum) from this line, mark
this with a dot
Draw a line from the centre of the circle, to point marked
Vehicle Amount of vehicles Degrees on pie chart Car 140 187
Bike 70 93
Van 55 73
Bus 55 7
Total 270 360
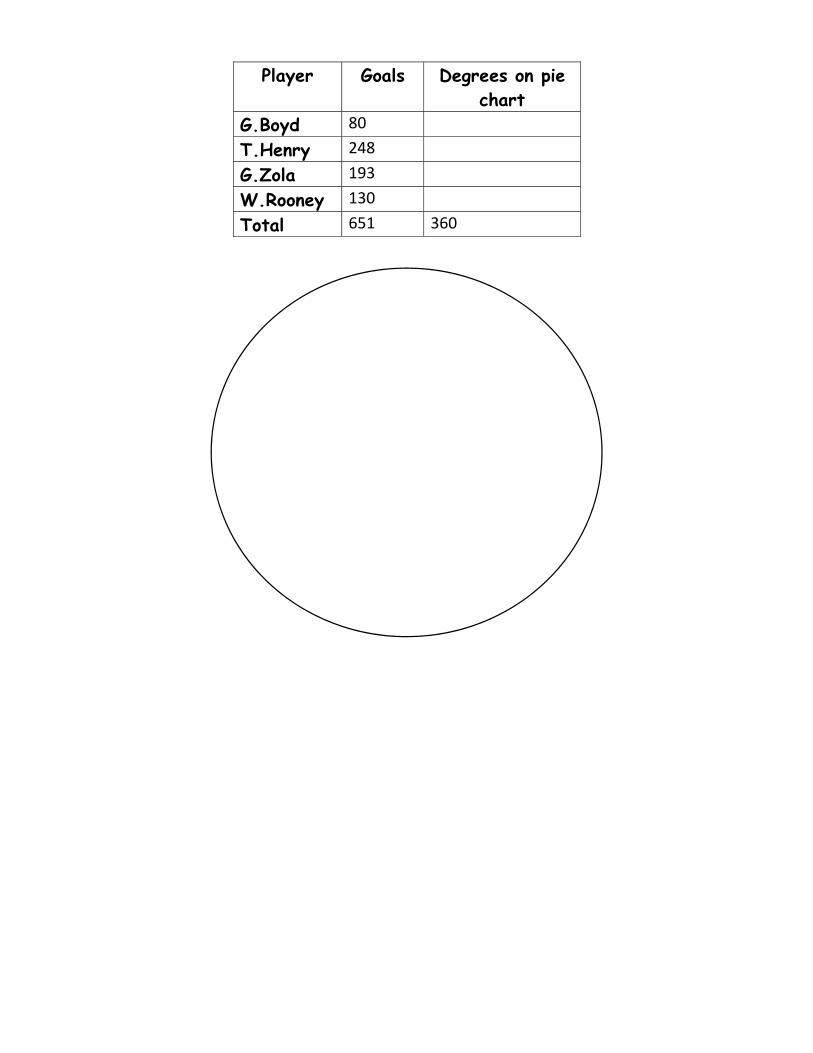
Player Goals Degrees on pie
chart G.Boyd 80
T.Henry 248
G.Zola 193
W.Rooney 130
Total 651 360