Embed Size (px)
Citation preview

Yakima County
2018 Homeless Point-in-time Count
Process and Survey Results
May 2018
Produced by ACR Business Consulting in partnership with the
Yakima Valley Conference of Governments

Table of Contents
The Homeless Point-in-time Count: Overview
The Homeless Point-in-time Count: iCount Yakima County
Yakima County 2018 PIT Count Results
2018 PIT Count: Demographic Data from 443 Surveys Collected
2018 PIT Count: Income and Housing Data
2018 PIT Count: Age Specific Analysis
2018 PIT Count: Income and Housing Data
Factors Affecting the PIT Count
Summary and Recommendations
2018 PIT Count Partner Agency / Roving Locations and Surveys Collected at Each
Questions / comments:
Questions, comments or to request a digital copy of this report please contact:
Crystal Testerman, Homeless Program Manager
Yakima Valley Conference of Governments
Aaron Rodriguez, 2018 Point-in-Time Count Project Manager
ACR Business Consulting

The Homeless Point-in-time Count: Overview1
The Homeless Point-in-Time (PIT) count is a requirement by the U.S. Department of Housing and
Urban Development (HUD). HUD requires communities to submit a count of the homeless
population in their area as well as information on specific sub-populations, including chronically
homeless persons, veterans, and unaccompanied youth. A PIT count is composed of two parts: a sheltered PIT count, which is required every year, and an
unsheltered PIT count, which is required at least every other year. Communities submit this data
annually through their Continuum of Care (CoC) applications for Homeless Assistance Grants. The
Washington State Homelessness Housing and Assistance Act (ESSHB 2163 - 2005) requires each
county to conduct an annual PIT count of sheltered and unsheltered homeless persons in
Washington State in accordance with the requirements of HUD2. The count takes place in January
each year with the date set by HUD. For 2018, the date of the count was Thursday, January 25. Many communities, including Yakima County, develop their sheltered count from their Homeless
Management Information System (HMIS) data. Yakima County also facilitates in-person surveys
to add additional demographic detail beyond just a number. HUD does not prescribe the survey
method to use but does provide guidance on survey techniques.
The unsheltered count is more complicated and costly to conduct than the sheltered count, and
HUD is stricter about the acceptable methodologies for performing this count. Because unsheltered
persons are not generally recorded in HMIS, communities have much more planning to do to
account for unsheltered individuals. There are 3 accepted methodologies provided by HUD to
conduct an unsheltered count:
1. Street counts. Community volunteers visit the streets and locations where they expect to
find homeless individuals and count them based on observation over a very specific period
(usually between dusk and dawn on a single night). This method is relatively easy to
organize, train volunteers to conduct, and carry out. However simple to carry out, this
method invariably misses some people, and little information is gained beyond the total
number of unsheltered persons.
2. Street count with an interview. With this approach, count participants are trained to
interview every person they encounter who appears to be unsheltered. The sample-with-
interview approach yields a much richer level of data to the community, but tends to be
more complicated to de-duplicate.
3. Service-based count. The community counts people as they receive homeless services
during the specific count period. Service-based counts can extend beyond 1 day, but
cannot exceed 7 days after the date of the count. Communities using the service-based
approach will often plan a specific event that is likely to attract homeless persons such as
a special breakfast or healthcare-related offering. Although this method requires the
community to carefully determine who has already been counted, it tends to reach a
particular homeless population that chooses to use the supportive services available,
including soup kitchens, drop-in centers, and street outreach teams, and who would
otherwise be difficult to count because of where they choose to sleep.
To determine the most appropriate methodology to use, communities need to evaluate, among
many things, their climate, size, and availability of resources. The number of anticipated
participants in the count and the size of the area often drive the method that is chosen. However,
several communities use a combination of these methodologies.
1 Office of Policy Development and Research (PD&R) U.S. Department of Housing and Urban Development:
https://www.huduser.gov/portal/periodicals/em/summer12/highlight2.html 2 Washington State Department of Commerce:
http://www.commerce.wa.gov/Programs/housing/Homeless/Pages/Annual-Point-In-Time-Count.aspx

In addition to homeless population data, HUD requires communities to submit subpopulation data
on chronically homeless individuals and families, veterans, severely mentally ill individuals,
chronic substance users, persons with HIV/AIDS, those fleeing domestic violence, and
unaccompanied children (under 18). When the subpopulation data is incomplete, communities use
sampling and extrapolation methods to derive their counts.
The Homeless Point-in-time Count: iCount Yakima County
For the 2018 Homeless Point-in-time (PIT) Count, Yakima County partnered with ACR Business
Consulting to facilitate the PIT Count. ACR Business Consulting has facilitated prior PIT Counts
for Thurston County and worked with the City of Olympia on homeless strategy. The firm aims to
collaborate with agencies and organizations that work with homeless neighbors, and utilizes the
overarching brand “iCount” to build local community support for volunteers, donations, and
outreach efforts.
The goals for the 2018 PIT count in Yakima County were to:
1) Maximize the scope of the one-day count through county-wide outreach efforts utilizing a
thorough and cost effective approach
2) Implement tools to assist with census efforts for future years
3) Pursue high quality data collection
4) Collect and report relevant information to inform and educate local community citizens,
policy makers, and funders.
Maximize the Scope of the One-day Count
Yakima County has a strong network of homeless service agencies. Together these agencies have
typically facilitated Project Homeless Connect Events as the backbone of the annual PIT Count.
For the 2018 PIT Count, ACR Business Consulting focused on utilizing the strength of the service
network to facilitate street counts with an interview and service-based counts to connect
with both sheltered and unsheltered homeless neighbors throughout Yakima County. This
approach was designed to minimize the cost to facilitate the PIT Count and align efforts with
agencies making connections with homeless neighbors through normal service activities.
The county was divided into 3 areas – Upper Valley, Mid Valley, South Valley – and partner
agencies and community volunteers were identified within each area. Volunteers were paired with
agency leads to serve as roving teams throughout the areas, looking to connect with as many
unsheltered neighbors as possible. However, due to the sensitivity and potential safety concerns,
the PIT Count did not include going into homeless encampments or wooded areas.
Implement Tools to Assist with Census Efforts for Future Years
ACR Business Consulting efforts were designed to build off of the strong community involvement
across Yakima County already in place. The iCount brand established a Facebook presence for the
Yakima County PIT for community members to continue to post and share information on issues
related to homelessness. A dedicated webpage for PIT volunteer recruitment, sponsorship and
donations was also established. This page is intended to assist in outreach and recruitment efforts
which will help in preparing for the count in future years. Additionally, through the iCount Yakima
County platform, the team recruited over 35 community volunteers and raised over $1200 in
community donations to be used to purchase sleeping bags to handout to survey participants.
Pursue High Quality Data Collection
To maintain data consistency and quality, revamped surveys were utilized by iCount Yakima
County volunteers and agencies for the 2018 PIT Count. As always, survey data quality relied on
participants authorizing the use of their information by way of signature. This allows duplicate
surveys to be identified, and it significantly reduced the likelihood of double entry into the
Homeless Management Information System (HMIS) across the unsheltered and sheltered counts.
For 2018 PIT Count, local agencies and the iCount Yakima County team of volunteers did a
tremendous job connecting with homeless neighbors to gather complete surveys. Throughout the
County, 443 surveys were collected encompassing 646 individuals.
Collect and Report Information to Inform Local Community Citizens, Policy Makers, and Funders
The 2018 PIT Count utilized the single census form for both sheltered and unsheltered survey
participants. The form is designed to make it easier for survey collectors to gather necessary
information from census participants and provide a consistent and wider sample set of data for
analysis and reporting. The facilitation of the PIT count is a HUD requirement and takes real time,
energy, and resources to be inclusive and impactful. Beyond the federally mandated survey
questions there is relevant information that can be collected utilizing the efforts already required
to facilitate the PIT Count. For the 2018 PIT Count, questions about the most critical services
benefiting homeless neighbors as well as questions on housing search efforts and household
income levels were incorporated. The topic of housing affordability and access is currently a major
focal point across the United States and in Yakima County. With median home prices continuing
to rise and accessibility for low and no income neighbors becoming more difficult, questions were
added to the survey this year to gauge efforts by homeless neighbors to secure housing, and to
better understand the reality of barriers these households face in finding stability. The results of
this data are attached to this report as a 1 page info graphic.
The following charts and graphs represent key data that was collected through the 2018 PIT
census efforts. The underlying data set has been submitted to the Yakima Valley Conference of
Governments and is available for additional analysis as needed. The goal of this report is to
support the efforts of public agencies and nonprofit service providers in securing and expanding
funding for programs assisting homeless neighbors in Yakima County. Hopefully this information
can also be used as an educational tool for the community to work together to understand the
reality of who is facing homelessness in Yakima County, and the efforts these neighbors pursue
and barriers they face in returning to stable housing.
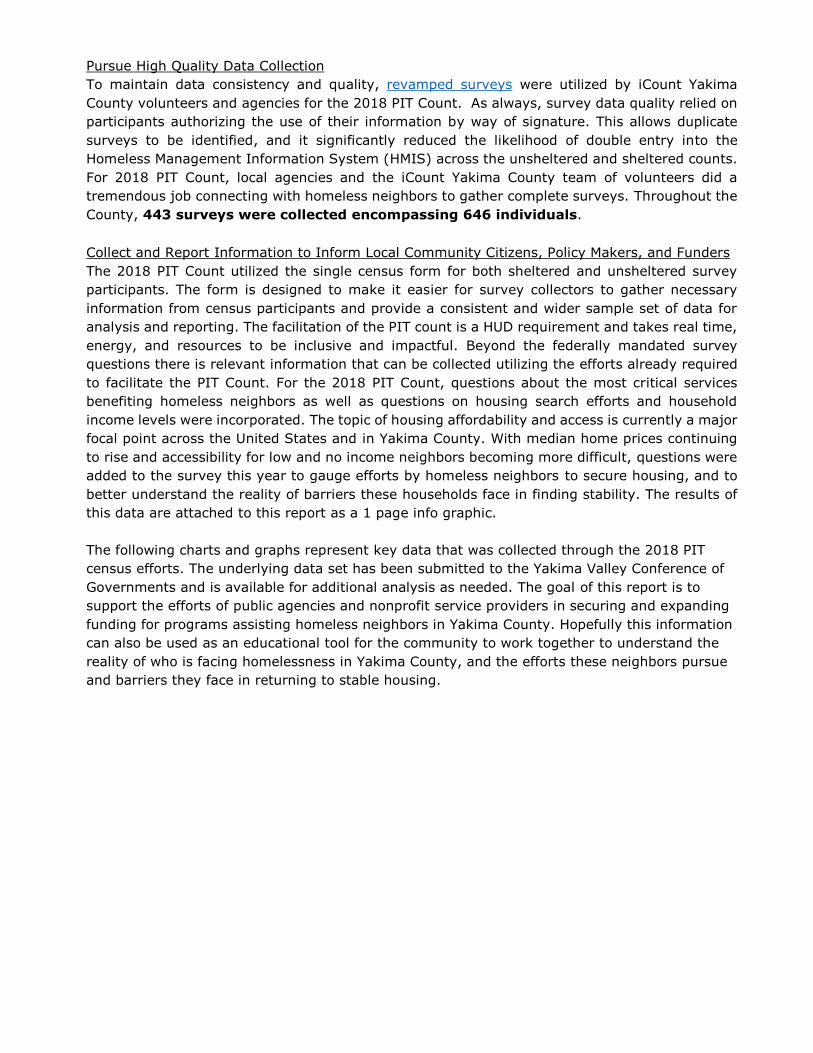
Yakima County 2018 PIT Count Results
3
3 Total PIT Count is the result of data derived from the combination of Surveys, HMIS Emergency Shelter and Transitional Housing entries on January 25, 2018 and de-duplicated in HMIS by the WA State Department of Commerce.
22836%
30548%
10516%
2018 Yakima County Homeless CountAs Reported by WA Department of Commerce
Unsheltered Emergency Shelter Transitional Housing
638
83 61 53 47 47 72 64 70
228
424399
472 516 486 466
348 287
305
115150
178 132 168 150
168215
105
622610
703 695 701 688
580 572638
0
200
400
600
800
2010 2011 2012 2013 2014 2015 2016 2017 2018
Yakima County PIT Count Totals: 2010 - 2018As Reported by WA Dept of Commerce
Unsheltered Emergency Shelter Transitional Housing Total

2018 PIT Count: Demographic Data from 443 Surveys Collected
The following section provides a look at key results from the surveys collected.
2018 PIT Count Census Map and Counts4
2018 PIT Count Key Demographic Data reported from Surveys and
Compared with HMIS Data from WA Department of Commerce
Surveys HMIS
Unaccompanied Youth <18 4 14
18 - 24 YR 35 46
Singles +24 342 445
Families with children 61 134
Dependents < 18 140 147
Seniors +55 136 N/A
Veterans 56 47
Chronic Homeless (total household members) 203 324
42018 PIT Count List of Locations and Surveys Collected at each can be found at the end of this report.
1
2 3
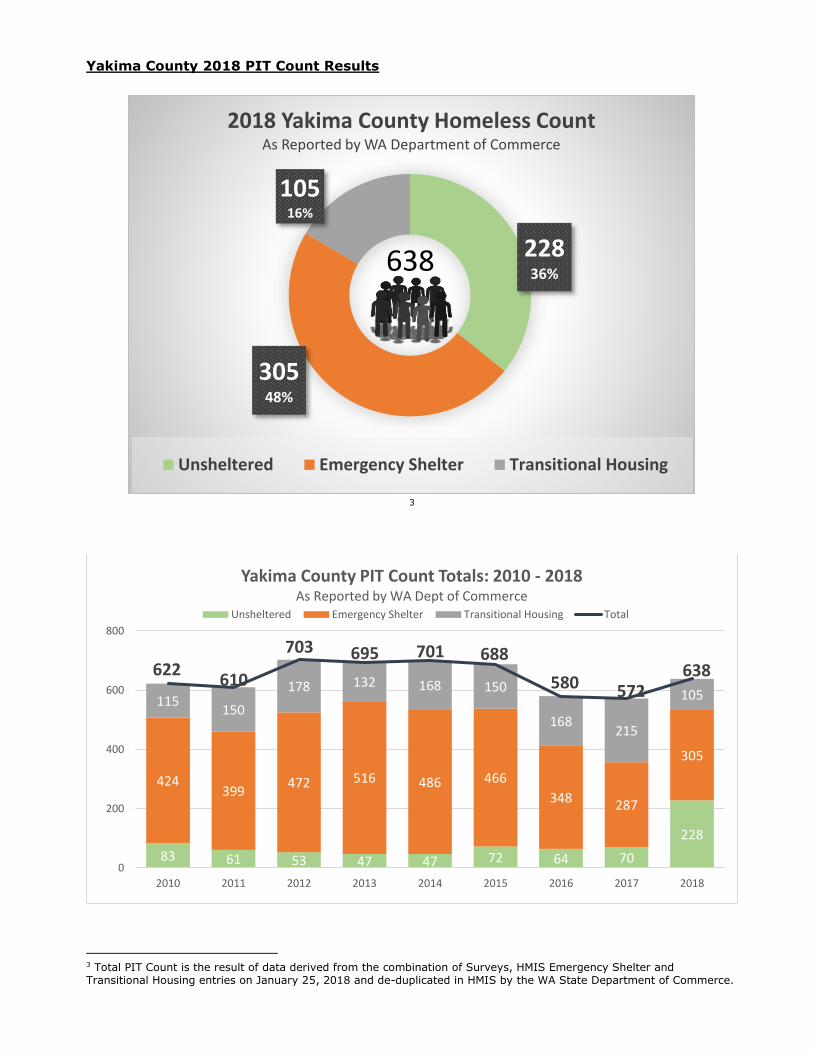
67%
33%
2018 Yakima County PIT Count Ethnicity Reported
Head of Household Data from 443 Surveys (321 responses)
Non Hispanic
Hispanic
Alaska Native0%
American Indian20% Asian
1%
Black/African American3%
Native Hawaiian1%
White67%
Other8%
2018 Yakima County PIT CountRace Classification
Head of Household Data from 443 Surveys (315 responses)
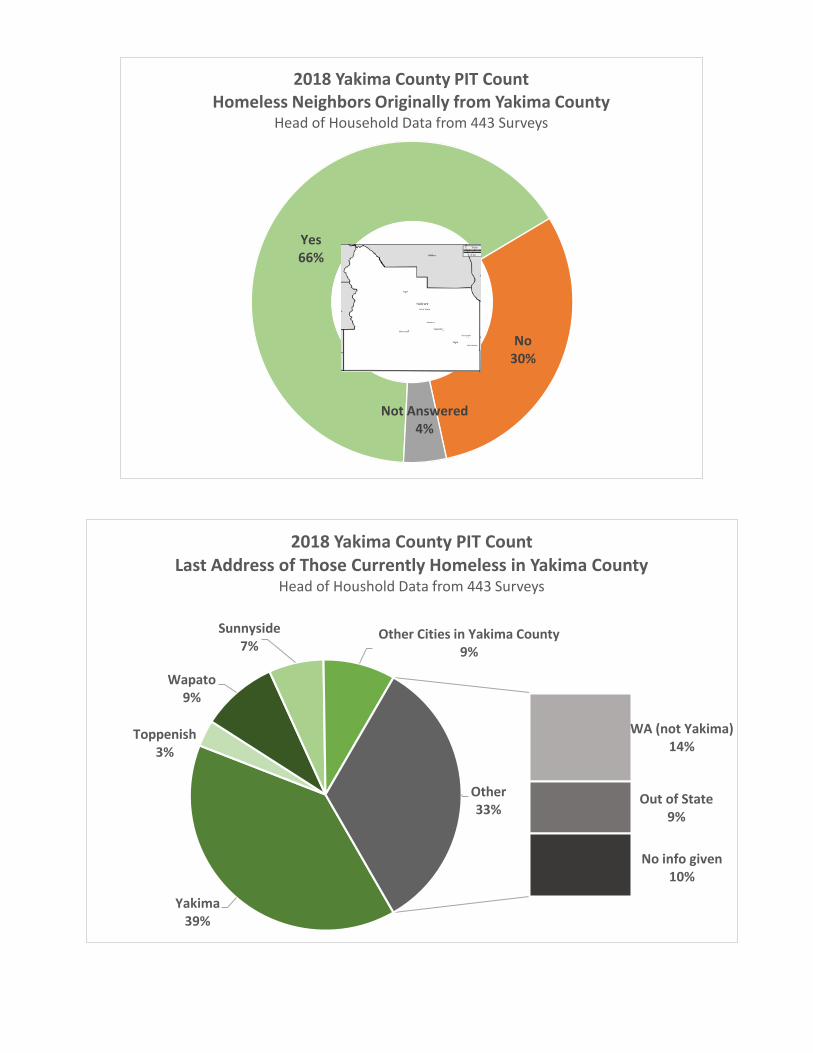
Yes66%
No30%
Not Answered4%
2018 Yakima County PIT CountHomeless Neighbors Originally from Yakima County
Head of Household Data from 443 Surveys
Yakima39%
Toppenish3%
Wapato9%
Sunnyside7%
Other Cities in Yakima County9%
WA (not Yakima)14%
Out of State9%
No info given10%
Other33%
2018 Yakima County PIT CountLast Address of Those Currently Homeless in Yakima County
Head of Houshold Data from 443 Surveys

336 197
4
109
0% 10% 20% 30% 40% 50% 60% 70% 80% 90% 100%
2018 Yakima County PIT CountGender Classification of Homeless Neighbors
Data From 646 Total Individuals Included in Surveys
Male Female Transgender / Do not Identify No info given
5623
254
2018 Yakima County PIT CountHomeless Neighbors Citing Veteran Status / Fleeing Domestic Violence / Disability
by Sub-Grouping Head of Household Data from 443 Surveys
Served in Military Currently Fleeing Domestic Violence Disabled
57% 5% 13%

5
5 This chart represents prior night locations identified by homeless neighbors who participated in the survey. The Department of Commerce reported a total emergency shelter count of 305, an unsheltered count of 228, and a transitional housing count of 105 for a total count of 638 homeless neighbors the night of the PIT Count.
13%
27%
12%
28%
20%
0%
2018 Yakima County PIT CountA Closer Look at Disabilities Reported by Homeless Neighbors
Head of Household Data from 443 Surveys
Chronic Substance Use - 45
Permanent Physical Disability - 97
Developmental Disability - 43
Mental Health - 102
Chronic Health Problem - 73
HIV/AIDS - 1
254Reportingat least 1 disability
294
111
56 47 45
328 29 33
EmergencyShelter
Covered -outside
Uncovered -outside
Vehicle InadequateStructure
Hospital / Jail TransitionalHousing
Hotel / Motel With Family /Friends
2018 Yakima County PIT CountWhere Homeless Neighbors Slept the Night Prior to the Count
Totals Include Head of Household, Partner/Spouse and Dependants Data from 443 Surveys
Not considered Homeless by HUD definition (93)
Considered Homeless by HUD definition (553)
6
6 The Department of Commerce reported 324 total individuals classified as chronically homeless the night of the 2018 PIT Count based on HMIS data. This would indicate that approximately 50% of all homeless neighbors included in the night of the PIT Count are chronically homeless.
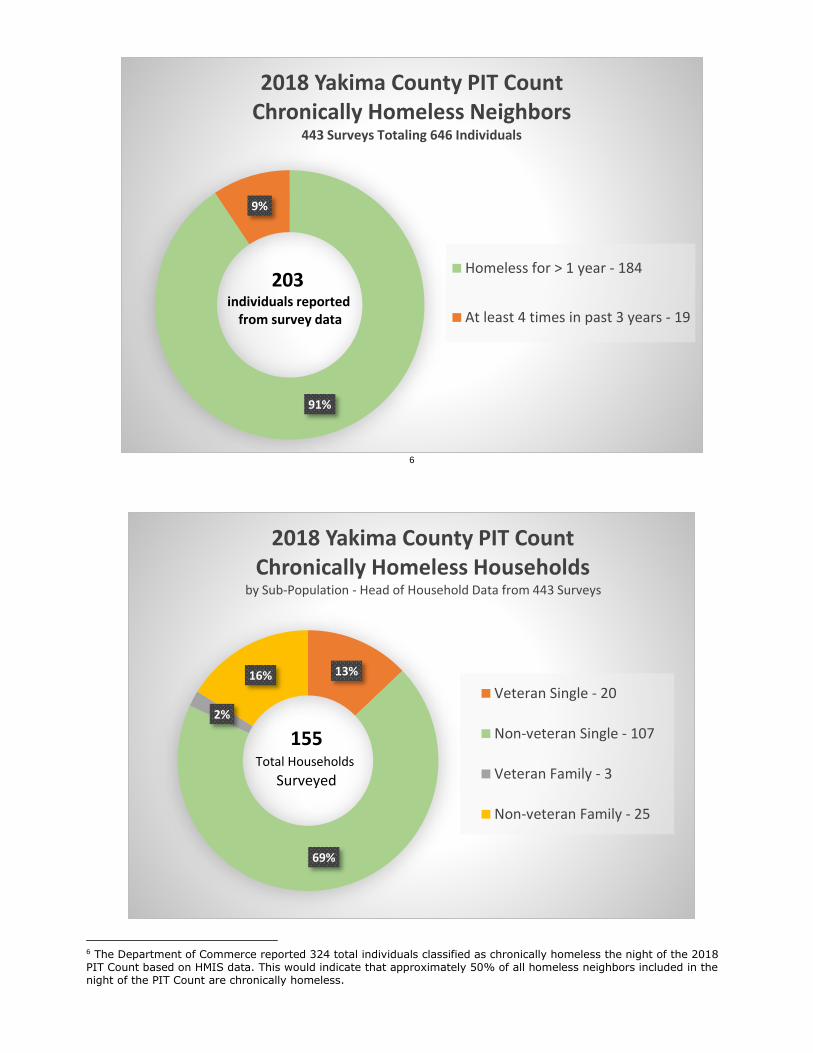
91%
9%
2018 Yakima County PIT CountChronically Homeless Neighbors
443 Surveys Totaling 646 Individuals
Homeless for > 1 year - 184
At least 4 times in past 3 years - 19
203 individuals reported
from survey data
13%
69%
2%
16%
2018 Yakima County PIT CountChronically Homeless Households
by Sub-Population - Head of Household Data from 443 Surveys
Veteran Single - 20
Non-veteran Single - 107
Veteran Family - 3
Non-veteran Family - 25
155Total Households
Surveyed

*2018 Data includes all members of a household considered to be chronically homeless by HUD definition
2018 PIT Count: Top Reasons Cited as Cause of Homelessness
(Participants could select more than one reason)
Number of Responses
1. Family Crisis 136
2. Alcohol / Substance Use 109
3. Job Loss 108
4. Economic 108
5. Lost Temporary Living Situation 97
6. Physical / Mental Disability 94
7. Mental Illness 86
8. Illness / Health Related 80
9. Eviction 74
10. Kicked Out / Left Home 65
695 701 688
580 572
638
71 86 89 7248
324*
0
200
400
600
800
2013 2014 2015 2016 2017 2018
Department of Commerce HMIS Reporting:Chronically Homeless Neighbors: 2013 - 2018
Based on Annual PIT Count Data from HMIS Reported by Department of Commerce
Total PIT Count Chronically Homeless
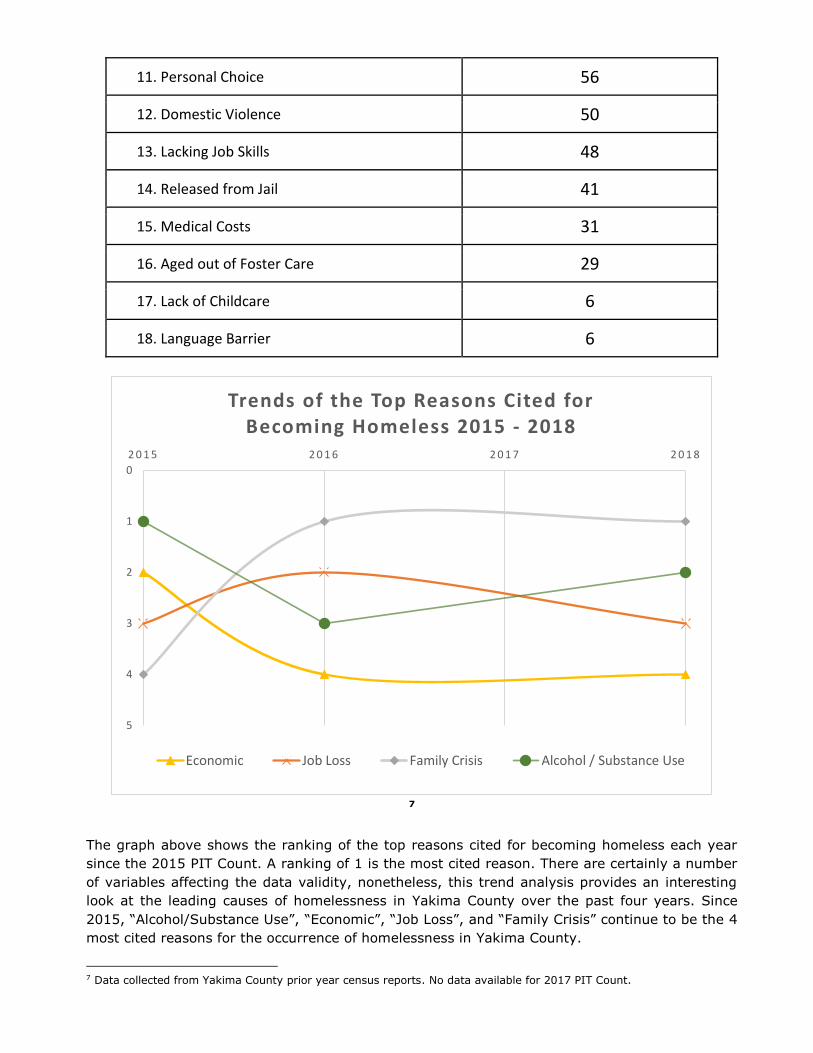
11. Personal Choice 56
12. Domestic Violence 50
13. Lacking Job Skills 48
14. Released from Jail 41
15. Medical Costs 31
16. Aged out of Foster Care 29
17. Lack of Childcare 6
18. Language Barrier 6
7
The graph above shows the ranking of the top reasons cited for becoming homeless each year
since the 2015 PIT Count. A ranking of 1 is the most cited reason. There are certainly a number
of variables affecting the data validity, nonetheless, this trend analysis provides an interesting
look at the leading causes of homelessness in Yakima County over the past four years. Since
2015, “Alcohol/Substance Use”, “Economic”, “Job Loss”, and “Family Crisis” continue to be the 4
most cited reasons for the occurrence of homelessness in Yakima County.
7 Data collected from Yakima County prior year census reports. No data available for 2017 PIT Count.
0
1
2
3
4
5
2 0 1 5 2 0 1 6 2 0 1 7 2 0 1 8
Trends of the Top Reasons Cited for Becoming Homeless 2015 - 2018
Economic Job Loss Family Crisis Alcohol / Substance Use
2018 PIT Count: Age Specific Analysis
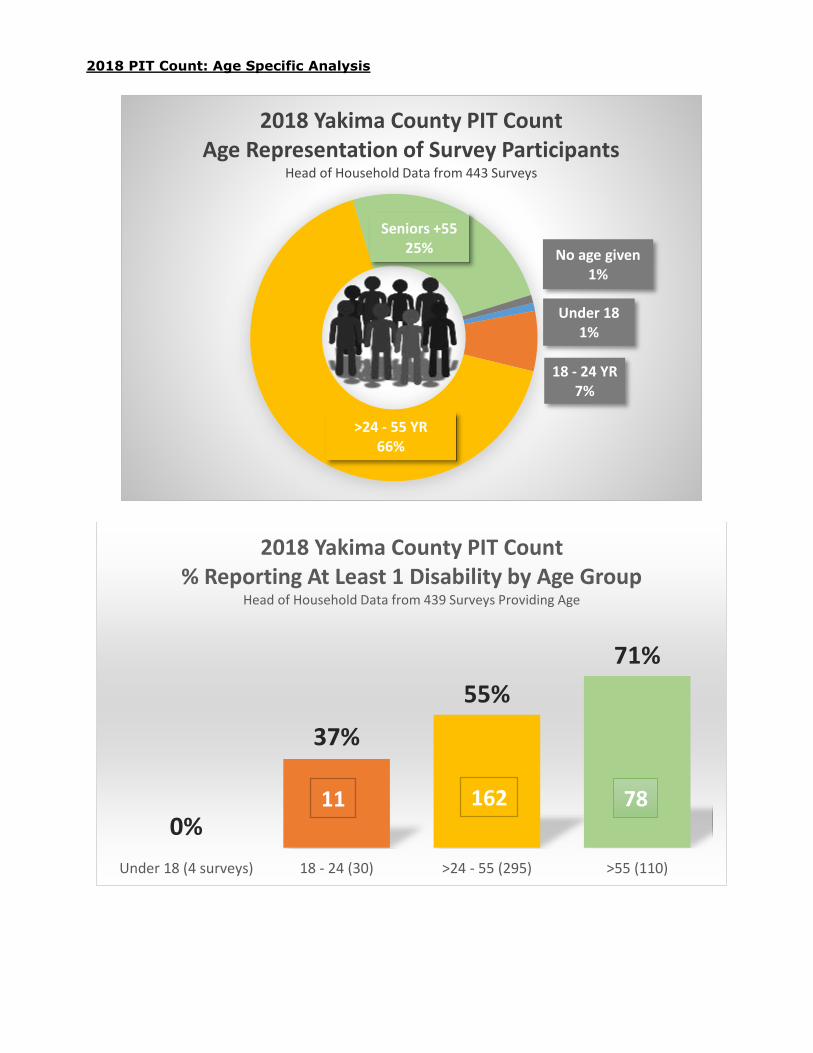
Under 181%
18 - 24 YR7%
>24 - 55 YR66%
Seniors +5525% No age given
1%
2018 Yakima County PIT CountAge Representation of Survey Participants
Head of Household Data from 443 Surveys
0%
37%
55%
71%
Under 18 (4 surveys) 18 - 24 (30) >24 - 55 (295) >55 (110)
2018 Yakima County PIT Count% Reporting At Least 1 Disability by Age Group
Head of Household Data from 439 Surveys Providing Age
78 162 11

The above 2 charts demonstrate that roughly 2 out of every 3 homeless neighbors
living with a disability are chronically homeless regardless of age group.
0%
23%
32%
47%
Under 18 (4 surveys) 18 - 24 (30) >24 - 55 (295) >55 (110)
2018 Yakima County PIT Count% Classified as Chronically Homeless by Age Group
Head of Household Data from 439 Surveys Providing Age
50% 25% 25%
0%
50%
0% 0% 0% 0%
25%25%
47%
20%17%
27%
20%
20%20%
10%
13%
37% 17%
32%
28%
34%
24%
24%
19%
23%
17%
21%
16%
12%
23% 15%23%
25%
16%
28%
10%
24%
8%
5%
12%
Family Crisis Alcohol /Substance
Use
Job Loss Economic LostTemporary
LivingSituation
Physical /Mental
Disability
MentalIllness
Illness /HealthRelated
Eviction Kicked Out /Left Home
PersonalChoice
2018 Yakima County PIT CountTop Reasons Leading to Homelessness - Cited by Age Group
Head of Household Data from 439 Surveys Providing Age
Under 18 (4 surveys) 18 - 24 (30) >24 - 55 (295) >55 (110)
52 94 7

2018 PIT Count: Income and Housing Data
For the 2018 PIT Count, additional questions regarding income relative to housing search efforts
were asked to survey participants in an effort to glean further insights from the broad macro-
economic factors cited as the leading causes of homelessness over the past several years. The
following graphics illustrate profiles of homeless neighbors who are seemingly “locked-out” of
access to stable housing due to income levels. This sample size reinforces the notion that the
disparity between market rate and affordable housing is perhaps the greatest influencer in the
ability for homeless neighbors to return to stable housing in Yakima County. These survey findings
may motivate a deeper look at the prevailing perception of the profile of homeless individuals and
families in the Yakima County community and the actual support they need to maintain or return
to housing stability.
Factors Affecting the PIT Count
As with all data collection, there are challenges regarding the validity of the data collection and
reporting process. For the 2018 PIT count, gathering survey participant signatures significantly
decreased the likelihood of data duplication on reported information. However, as has been the
struggle in previous years, the following variables must be acknowledged as it relates to data
integrity:
70%
of all households
surveyed reported they
are actively looking for
housing
1 in 2
households surveyed
has been looking for
housing for 6 months or
more
45%
of households surveyed
reported having monthly
income of $500 or more
90%
of families with children
surveyed are actively
looking for housing
2 in 3
households surveyed
identify insufficient
income as the main
barrier to housing
60%
of households surveyed
stated they need help
finding housing
1. Known sections of homeless neighbors not surveyed. Excluding entering into camps (even
those that are known) for safety reasons decreases the population surveyed and reduces
the number of homeless that are accounted for on the day of the PIT count. The 2018 PIT
Count efforts included volunteer assistance from formerly homeless individuals currently
affiliated with Entrust. These census facilitators had knowledge of areas to go and trust
established to connect with homeless neighbors that may have been reluctant to participate
or even be identified. Event with this strategy, the total number reported is still viewed by
service providers as only about one-third of the actual number of unique individuals and
households seeking homeless services. This tends to be supported by HMIS reports that
are pulled quarterly by agencies showing total new entries into the service system.
2. Rural Communities and the Yakama Nation lacking service agencies with which to partner.
Facilitators of the 2018 PIT count worked to partner with as many agencies as were willing
across the county. Some communities had only 1 agency that served homeless neighbors,
while others did not have any agency representation. Despite the collaboration from service
providers, in most cases, survey volunteers were restricted to working within the business
hours on the day of the count. In the case of the Yakama Nation, a known overnight
shelter was not included in the PIT efforts. It is worth noting that contact was established
post PIT Count and the goal is to have the shelter staffed with survey facilitators next year.
These factors most likely reduced the reporting in those communities.
3. HUD classification of “Inadequate Structure” as homeless not necessarily aligning with
people’s own perception of their circumstance. HUD classifies those living in structures
without any of the following: heat, running water, the ability to cook hot food, the ability
to bathe, as homeless. There is a high likelihood that individuals in these circumstances do
not equate themselves as being homeless and therefore are not seeking services nor
participating in PIT count activities. There were some survey participants who identified
their own home as an inadequate structure, but a very small number relative to the likely
potential of qualified dwellings.
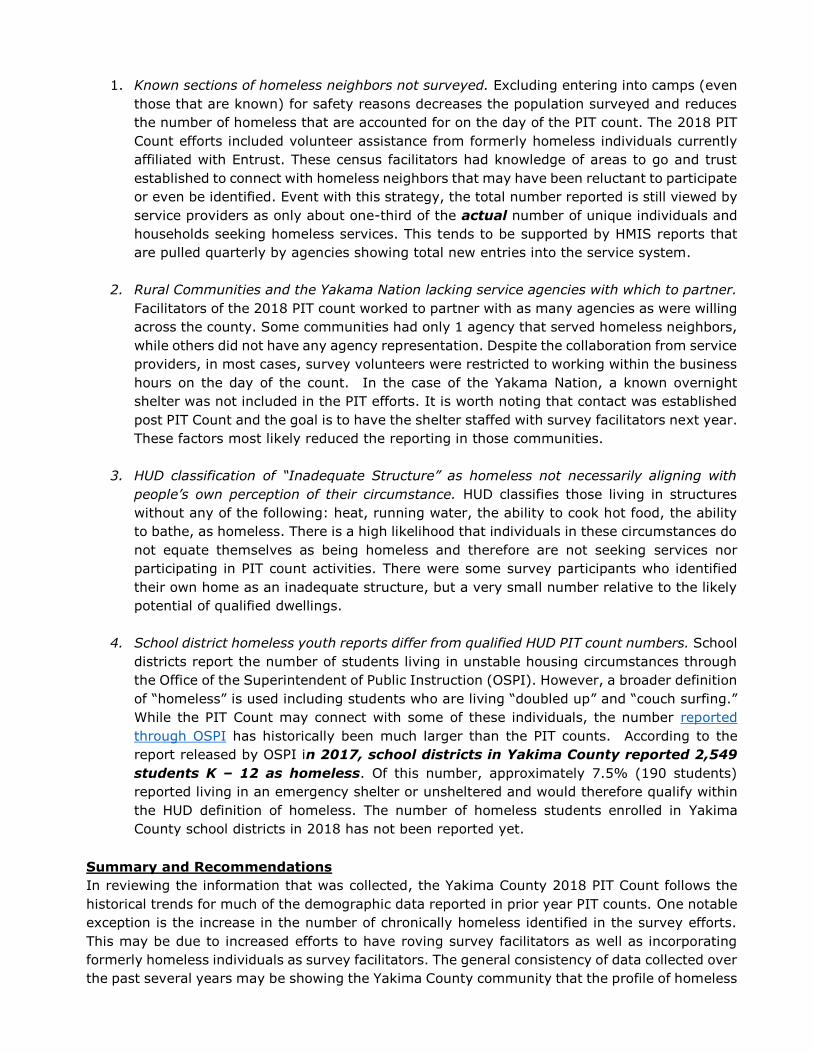
4. School district homeless youth reports differ from qualified HUD PIT count numbers. School
districts report the number of students living in unstable housing circumstances through
the Office of the Superintendent of Public Instruction (OSPI). However, a broader definition
of “homeless” is used including students who are living “doubled up” and “couch surfing.”
While the PIT Count may connect with some of these individuals, the number reported
through OSPI has historically been much larger than the PIT counts. According to the
report released by OSPI in 2017, school districts in Yakima County reported 2,549
students K – 12 as homeless. Of this number, approximately 7.5% (190 students)
reported living in an emergency shelter or unsheltered and would therefore qualify within
the HUD definition of homeless. The number of homeless students enrolled in Yakima
County school districts in 2018 has not been reported yet.
Summary and Recommendations
In reviewing the information that was collected, the Yakima County 2018 PIT Count follows the
historical trends for much of the demographic data reported in prior year PIT counts. One notable
exception is the increase in the number of chronically homeless identified in the survey efforts.
This may be due to increased efforts to have roving survey facilitators as well as incorporating
formerly homeless individuals as survey facilitators. The general consistency of data collected over
the past several years may be showing the Yakima County community that the profile of homeless
neighbors is perhaps becoming less speculative. This allows the County and service providers to
begin to look at the efficiency and effectiveness of the homeless service system in Yakima County
as it relates to serving specific homeless subpopulations. Continued efforts are underway to evolve
the homeless service system through refinement of the Coordinated Entry process and other
initiatives as outlined in the County’s revised 5 year plan to address homelessness and affordable
housing.
The trends in the data about causes cited for homelessness is one area that may benefit from
being further explored. Within the top reasons continually cited, those of “Economic,” “Family
Crisis,” and “Job Loss” present opportunities to formulate hypothesis and target more specific data
collection. For example: 1) insights into more exact “economic” reasons that make this category
a top cited reason, 2) data regarding time between the moment of job loss or family crisis and
seeking homeless service assistance, 3) identifying particular reasons that may benefit from more
targeted prevention. Furthermore, breaking these reasons down by age provides additional insight
into causes and circumstances that may have a greater impact on certain age groups.
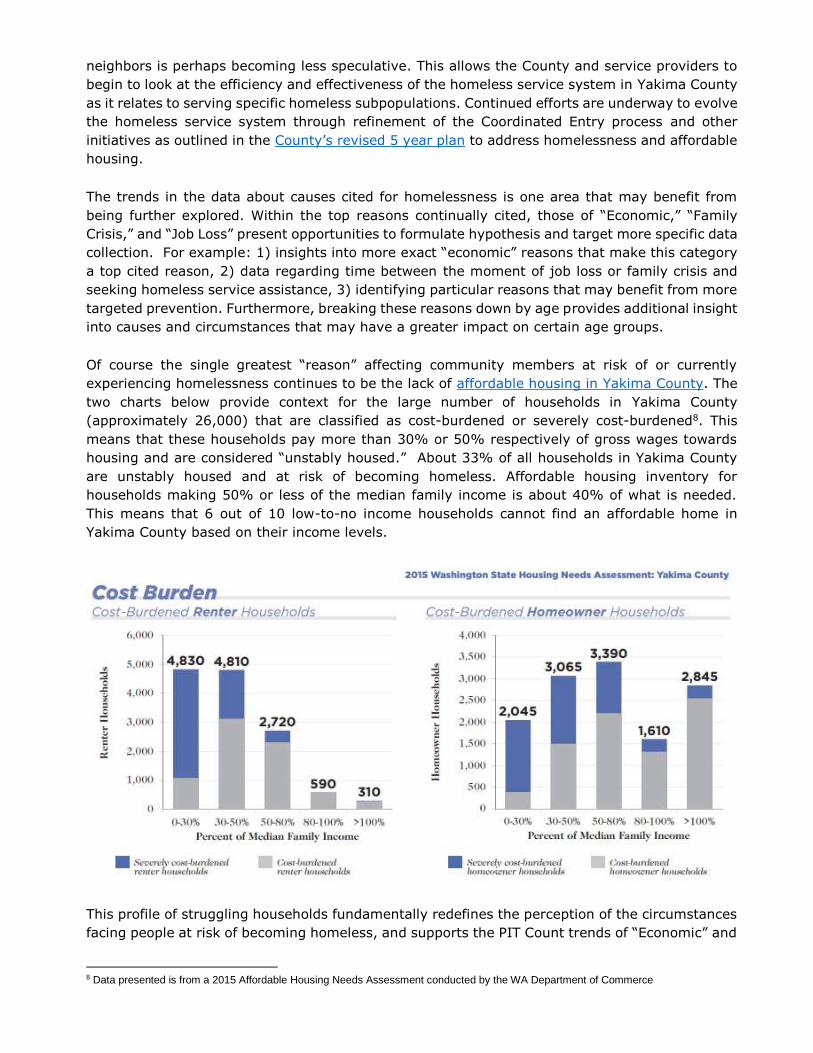
Of course the single greatest “reason” affecting community members at risk of or currently
experiencing homelessness continues to be the lack of affordable housing in Yakima County. The
two charts below provide context for the large number of households in Yakima County
(approximately 26,000) that are classified as cost-burdened or severely cost-burdened8. This
means that these households pay more than 30% or 50% respectively of gross wages towards
housing and are considered “unstably housed.” About 33% of all households in Yakima County
are unstably housed and at risk of becoming homeless. Affordable housing inventory for
households making 50% or less of the median family income is about 40% of what is needed.
This means that 6 out of 10 low-to-no income households cannot find an affordable home in
Yakima County based on their income levels.
This profile of struggling households fundamentally redefines the perception of the circumstances
facing people at risk of becoming homeless, and supports the PIT Count trends of “Economic” and
8 Data presented is from a 2015 Affordable Housing Needs Assessment conducted by the WA Department of Commerce

“Job Loss” as consistent reasons leading to homelessness. At this level of need for affordable
housing, government resources available to the homeless and affordable housing service system
are insufficient. Any viable strategy to address homeless and affordable housing in Yakima County
will need to explore and consider solutions involving private investment and public-private
partnerships in addition to funding provided by federal, state, and local governments.
The results of the 2018 PIT Count continue to illustrate the pursuit of more coordinated efforts
throughout the homeless service system to define both demographic data for trend analysis as
well as system performance metrics that look at the effectiveness of services and prioritization of
limited funding.
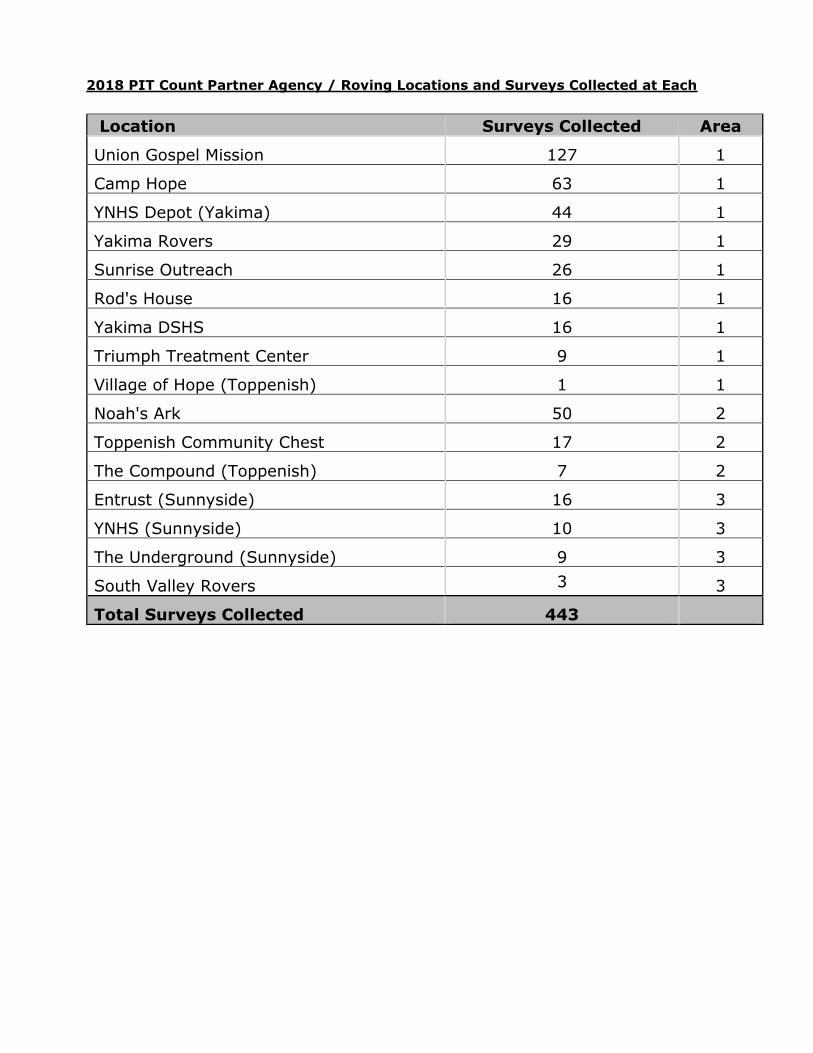
2018 PIT Count Partner Agency / Roving Locations and Surveys Collected at Each
Location Surveys Collected Area
Union Gospel Mission 127 1
Camp Hope 63 1
YNHS Depot (Yakima) 44 1
Yakima Rovers 29 1
Sunrise Outreach 26 1
Rod's House 16 1
Yakima DSHS 16 1
Triumph Treatment Center 9 1
Village of Hope (Toppenish) 1 1
Noah's Ark 50 2
Toppenish Community Chest 17 2
The Compound (Toppenish) 7 2
Entrust (Sunnyside) 16 3
YNHS (Sunnyside) 10 3
The Underground (Sunnyside) 9 3
South Valley Rovers 3 3
Total Surveys Collected 443

15%
19%
10%
56%
Time Spent Searching for Housing
<1 month 1-3 months
3-6 months >6 months
Eviction History15%
Income66%
No No ID16%
Rental History24%
Criminal Record20%
Employment42%
Poor Credit29%
Home Search Help 263 59%Hot Shower 224 51%
Laundry 219 49%
Safe Storage 216 49%
Access to a Restroom 193 44%
Day Center 178 40%
Job Search Help 162 37%
Dental Care 158 36%
Medical Care 139 31%
Counselor 102 23%
Utility Assistance 76 17%
Pet Care 68 15%
Support w/ Landlord Disputes 39 9%
Home Weatherization Help 33 7%
Most Requested Services
311Households
Currently Looking
7 in 10 Homeless Neighbors Surveyed in Yakima County are Currently Trying to Find Housing
Biggest Barriers to Housing Identified
Created by ACR Business ConsultingBased on survey data collected during the Jan 2018Yakima County Homeless Point-in-Time Count
77%Households
surveyed with monthly income 3 in 4
Chronically Homeless Households looking for housing for 6 months +
Some HS - 147
HS / GED - 147
Some College - 60
Associates - 16
Bachelors - 18
Masters - 4
Education Completed
419 total responses
1 in 7Households with monthly income
over $1000