Embed Size (px)
DESCRIPTION
Variability of Tropospheric & Stratospheric CO 2 From the Atmospheric Infrared Sounder. Xun Jiang 1 , Moustafa Chahine 2 , Edward Olsen 2 , Luke Chen 2 , and Yuk Yung 3. 1 Department of Earth & Atmospheric Sciences, Univ. of Houston 2 Science Division, Jet Propulsion Laboratory, Caltech - PowerPoint PPT Presentation
Citation preview

11
Xun Jiang1, Moustafa Chahine2, Edward Olsen2, Luke Chen2, and Yuk Yung3
Variability of Tropospheric & Stratospheric CO2 From the
Atmospheric Infrared Sounder
1 Department of Earth & Atmospheric Sciences, Univ. of Houston
2 Science Division, Jet Propulsion Laboratory, Caltech
3 Division of Geological & Planetary Sciences, Caltech
AGU Fall Meeting, Dec 13-17, 2010

22
Overview
Motivation
Data
Variability of Mid-tropospheric CO2
1. Trend & Seasonal Cycle2. ENSO
Stratospheric CO2
Conclusions
33
Motivation
Improve understanding of CO2 variability and its effect on the global climate change using satellite data
Investigate how natural variability (e.g., ENSO) influence the global CO2
Improve CO2 simulations from chemistry-transport models in the future

44
Data – AIRS Mid-Trop CO2 Product
• The AIRS Mid-Trop Contribution Function is a measure of the contribution of an atmospheric layer to the TOA radiance used in the AIRS CO2 retrieval
AIRS Mid-Trop Contribution Function
314 hPa
478 hPa
AIRS Mid-tropospheric CO2 Sensitivity Peak: 500-300 hPa (depending upon latitude)Chahine et al. [2005; 2008]

GEOS-Chem
AIRS
Comparison Between AIRS CO2 With Model Simulation
JULY 2003 Significant spatiotemporal variability in the AIRS CO2, which is supported by the aircraft observations [Chahine et al., GRL 2008].
Convective vertical transport flux is important for correct simulation of mid-tropospheric CO2 [Jiang et al., GBC 2008].
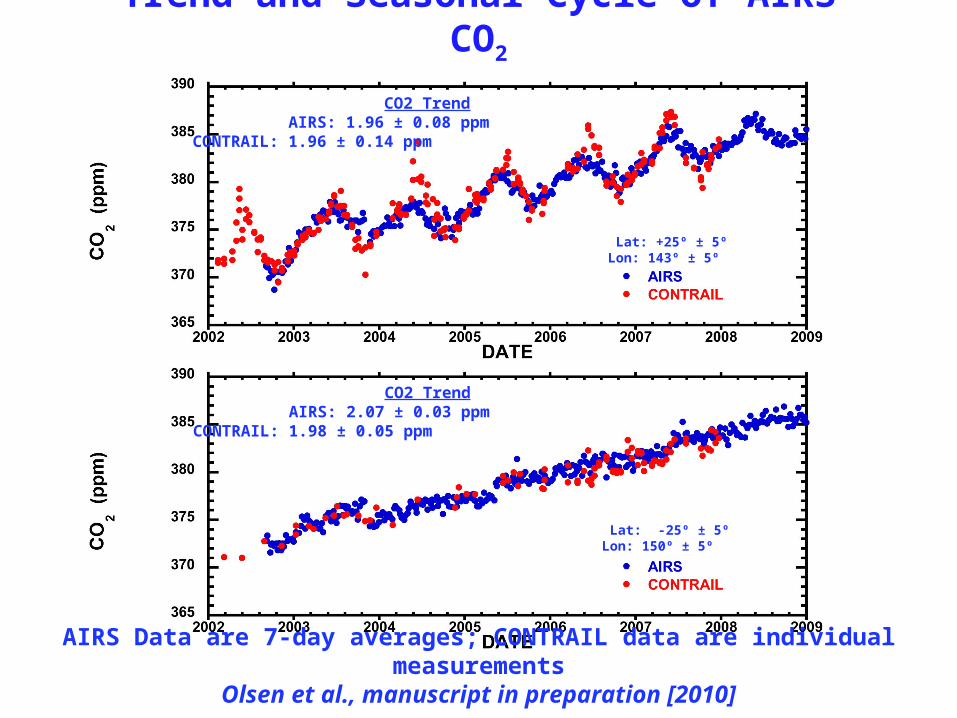
AIRS Data are 7-day averages; CONTRAIL data are individual measurementsOlsen et al., manuscript in preparation [2010]
CO2 Trend AIRS: 1.96 ± 0.08 ppmCONTRAIL: 1.96 ± 0.14 ppm
CO2 Trend AIRS: 2.07 ± 0.03 ppmCONTRAIL: 1.98 ± 0.05 ppm
Lat: +25º ± 5ºLon: 143º ± 5º
Lat: -25º ± 5ºLon: 150º ± 5º
Trend and Seasonal Cycle of AIRS CO2

7
Influence of El Niño/La Niña on AIRS CO2

8
Influence of El Niño/La Niña on AIRS CO2
El Niño: Feb 2005
La Niña: Feb 2008
El Niño: Feb 2010
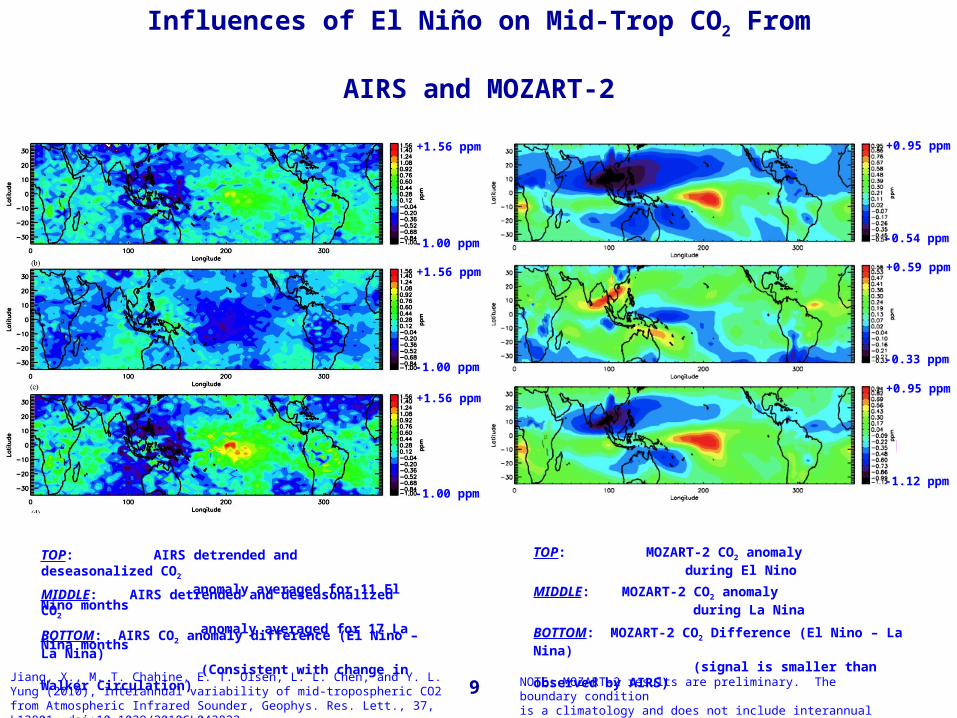
Influences of El Niño on Mid-Trop CO2 From AIRS and MOZART-2
9
TOP: AIRS detrended and deseasonalized CO2
anomaly averaged for 11 El Nino months
Jiang, X., M. T. Chahine, E. T. Olsen, L. L. Chen, and Y. L. Yung (2010), Interannual variability of mid-tropospheric CO2 from Atmospheric Infrared Sounder, Geophys. Res. Lett., 37, L13801, doi:10.1029/2010GL042823
MIDDLE: AIRS detrended and deseasonalized CO2
anomaly averaged for 17 La Nina months
BOTTOM: AIRS CO2 anomaly difference (El Nino – La Nina) (Consistent with change in Walker Circulation)
+1.56 ppm
+1.56 ppm
+1.56 ppm
-1.00 ppm
-1.00 ppm
-1.00 ppm
TOP: MOZART-2 CO2 anomaly during El Nino
MIDDLE: MOZART-2 CO2 anomaly during La Nina
BOTTOM: MOZART-2 CO2 Difference (El Nino – La Nina) (signal is smaller than observed by AIRS)
NOTE: MOZART-2 results are preliminary. The boundary conditionis a climatology and does not include interannual variability
+0.95 ppm
+0.59 ppm
+0.95 ppm
-0.54 ppm
-0.33 ppm
-1.12 ppm

10
Influence of El Niño/La Niña on AIRS CO2
Multiple regression method is applied to the AIRS CO2 data. We decompose CO2 concentrations to trend, annual cycle,
semi-annual cycle and ENSO signal.

1111
Data – AIRS Stratospheric CO2 Product
AIRS Stratospheric CO2 Sensitivity Peak: 20 hPa
23.5 hPa

AIRS Stratospheric CO2
(CO2 after subtracting <CO2> for |lat| ≤ 4 °)
Jan 2003
Color Bar Range: -15 to +15 ppm

Stratospheric CO2 From Models(CO2 after subtracting <CO2> for |lat| ≤ 4 °)
3-D GEOS-Chem3-D IMATCH
3-D MOZART-2 3-D Carbon Tracker
Color Bar Range: -5 to +5 ppm

Conclusions
Significant spatiotemporal variability in the AIRS CO2.
Trend and seasonal cycle of AIRS CO2 agree well with those from CONTRAIL CO2.
Mid-tropospheric AIRS CO2 is modulated by the natural variability (e.g. El Niño).
AIRS stratospheric CO2 offer a new opportunity to constrain the models in the stratosphere.
References: Chahine et al., GRL, doi:2005GL024165, 2005.Chahine et al., GRL, doi:2008GL035022, 2008.Jiang et al., GBC, doi:2008GL035022, 2008.Jiang et al., GRL, doi:2010GL042823, 2010.Olsen et al., Manuscript In Preparation, 2010.

1515
Thank you!


![Yuk Mendongeng Yuk [Compatibility Mode]](https://img.pdfslide.us/doc/110x75/577c78141a28abe0548ea308/yuk-mendongeng-yuk-compatibility-mode.jpg)