Embed Size (px)
Citation preview
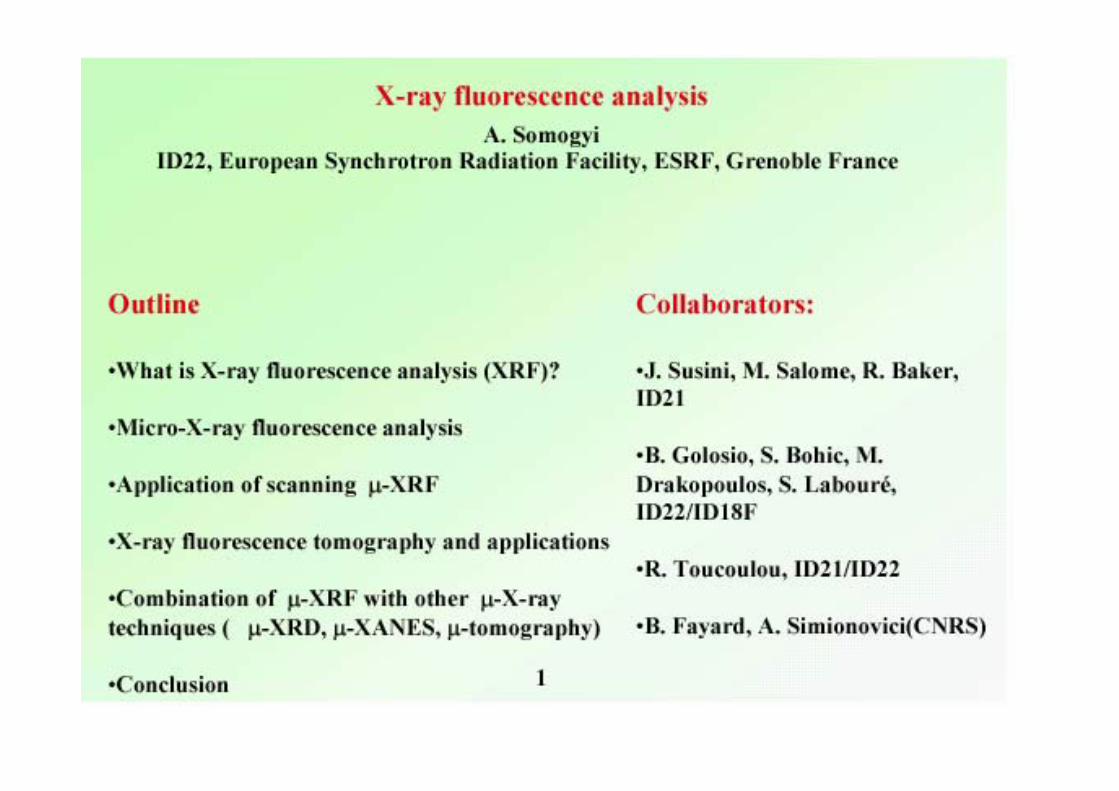
X-ray Fluorescence Analysis
A.Somogyi (ESRF)A.Iida (KEK-PF)
K.Sakurai (NIMS, Tsukuba)
T. Ohta (U.Tokyo)
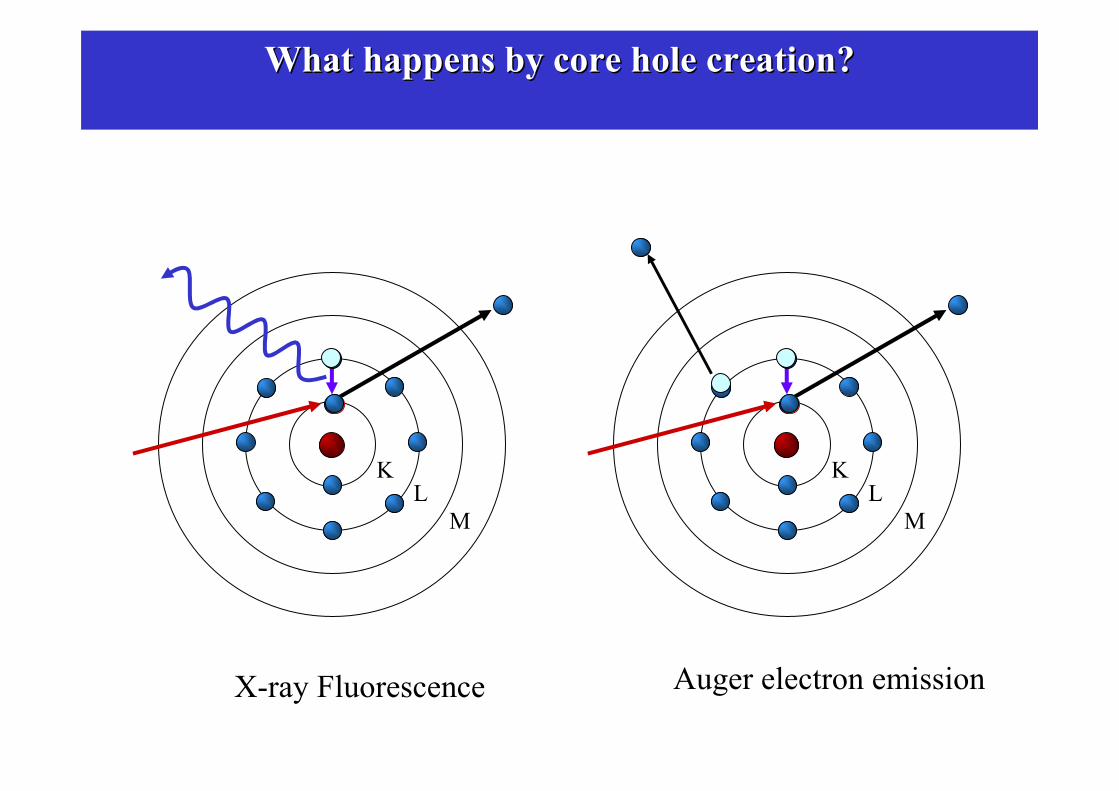
What happens by core hole creation?What happens by core hole creation?
KL
M
X-ray Fluorescence
KL
M
Auger electron emission


How can we create core holes?
• X-rays, Electrons, Ions which have higher energy than the core electron ionization energies.
• Electrons and ions produces many peaks with multiple excitations. X-ray excitation is preferable.
• Now, X-ray fluorescence analysis by X-ray excitation is a standard technique for trace element alalysis.
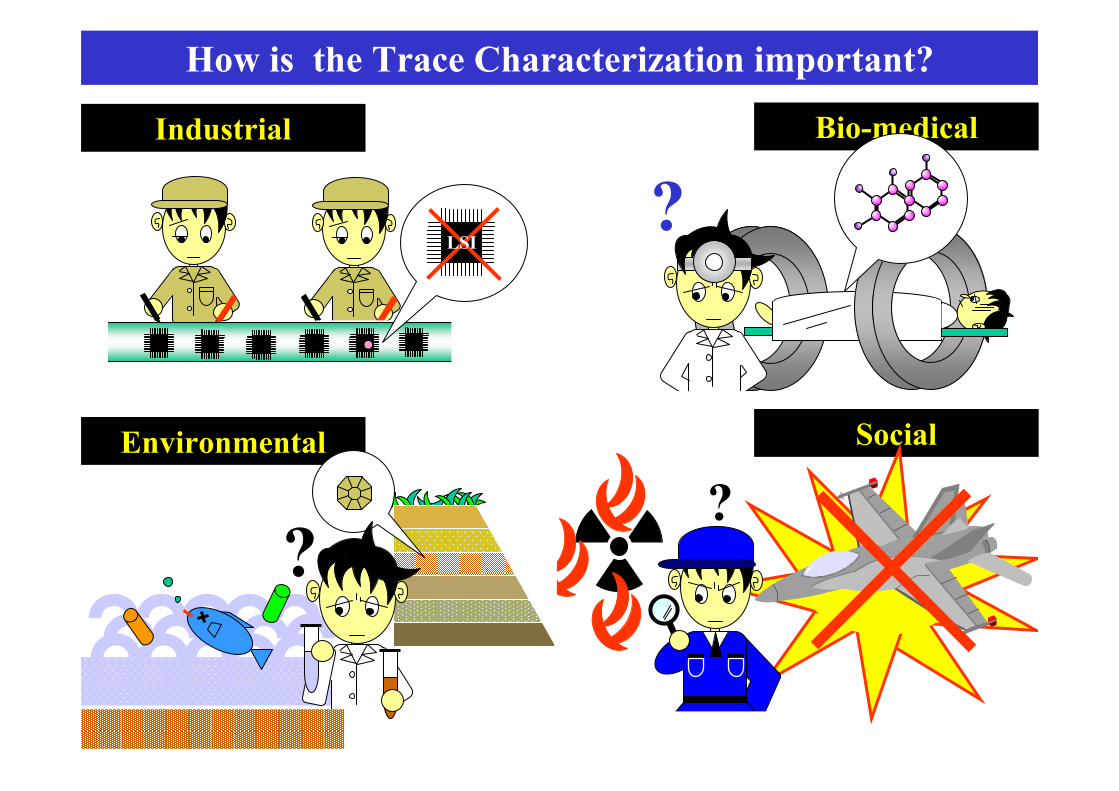
How is the Trace Characterization important?
Bio-medical
?
Social
?
Industrial
LSI
Environmental
?

Why synchrotron radiation x-rays ?
• Higher intensity higher sensitivity• Energy tunability Make the analysis
easier, chemical state analysis• Polarizablity Reduce background• Directionality applicable to tiny sample• Spectromicroscopy, Imaging
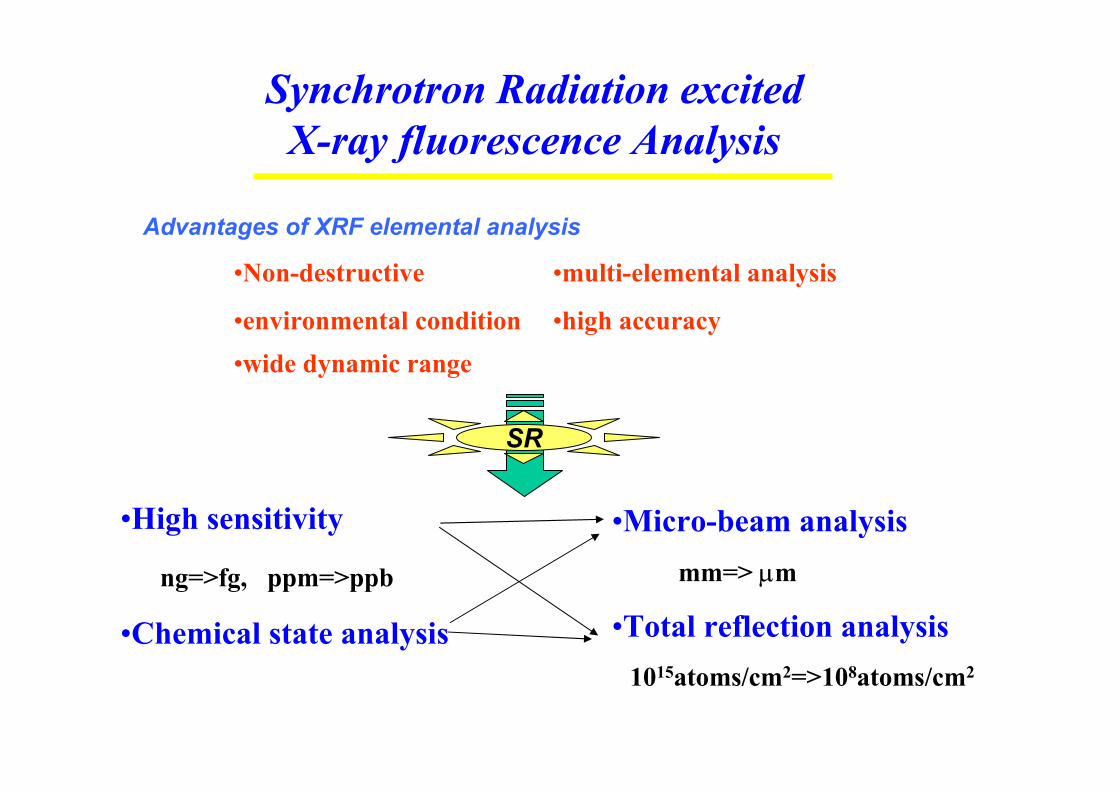
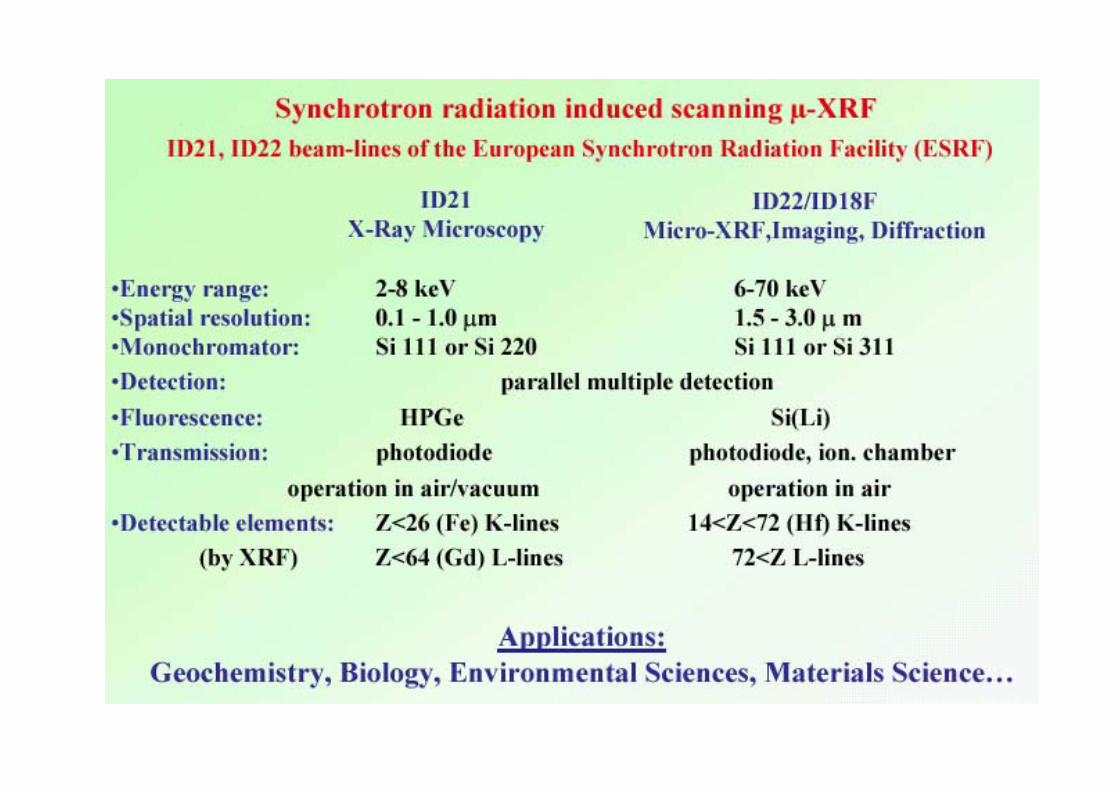
Synchrotron Radiation excited X-ray fluorescence Analysis
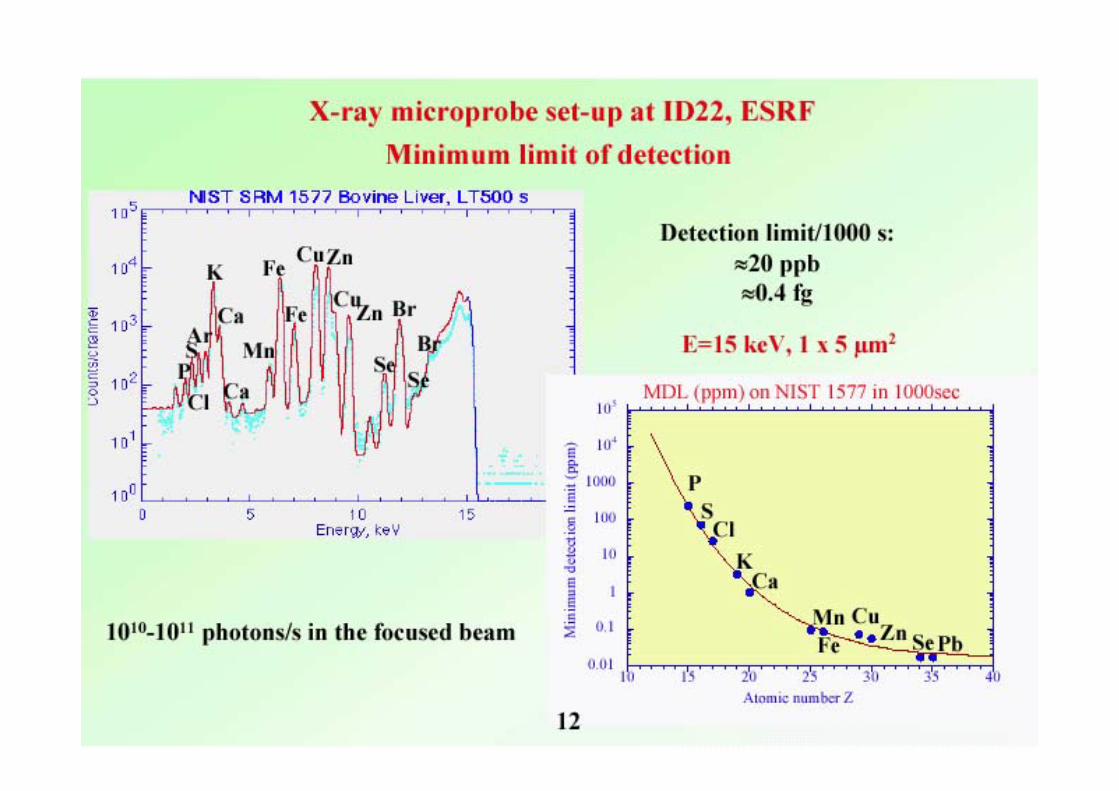
•High sensitivity
ng=>fg, ppm=>ppb
•Chemical state analysis
•Micro-beam analysismm=> µm
•Total reflection analysis1015atoms/cm2=>108atoms/cm2
•wide dynamic range•high accuracy•environmental condition
•multi-elemental analysis•Non-destructive
Advantages of XRF elemental analysis
SR

5 10 15 20 25
0.0
0.5
1.0Re
flect
ivity
Glancing Angle (mrad)
101
102
103
Penetration Depth (nm
)
Si ( Li )Detector
Sample
CriticalAngle
Total-refection X-Ray Fluorescence ( TXRF )Reduction of scattering background from the substrate(1)
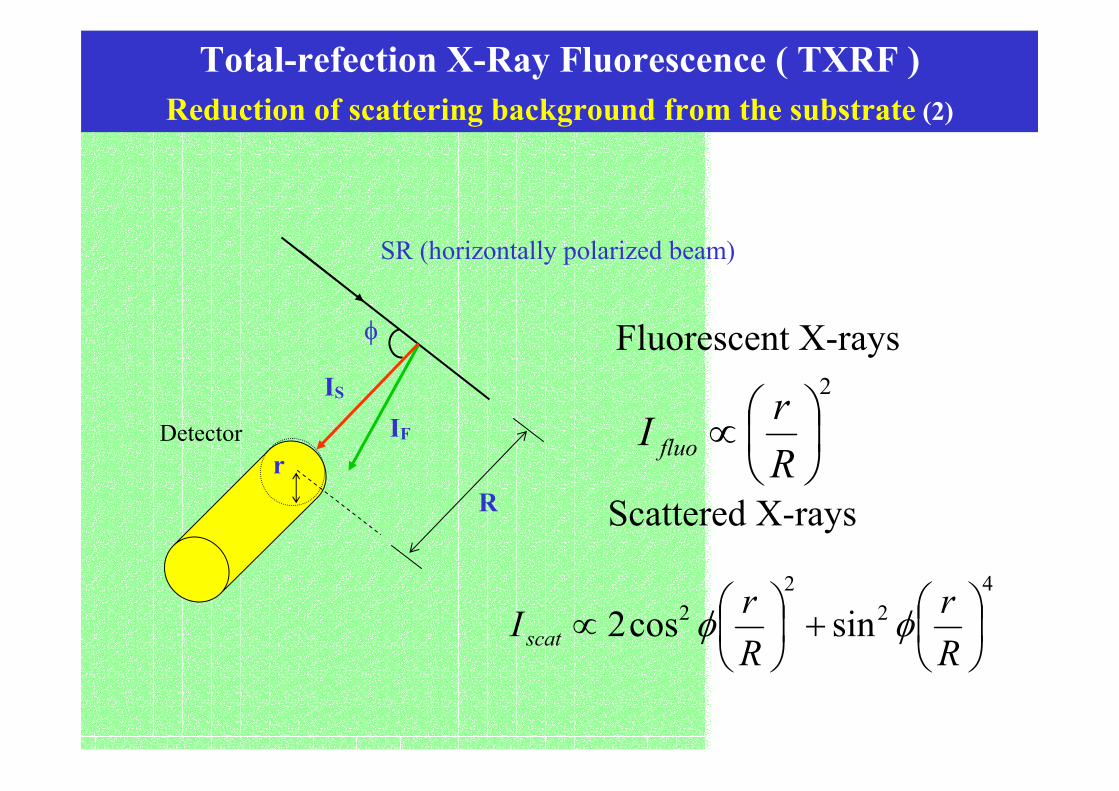
Detector
R
SR (horizontally polarized beam)
IS
IF
φ
r
Total-refection X-Ray Fluorescence ( TXRF )Reduction of scattering background from the substrate (2)
42
22 sincos2
+
∝
Rr
RrIscat φφ
2
∝RrI fluo
Fluorescent X-rays
Scattered X-rays
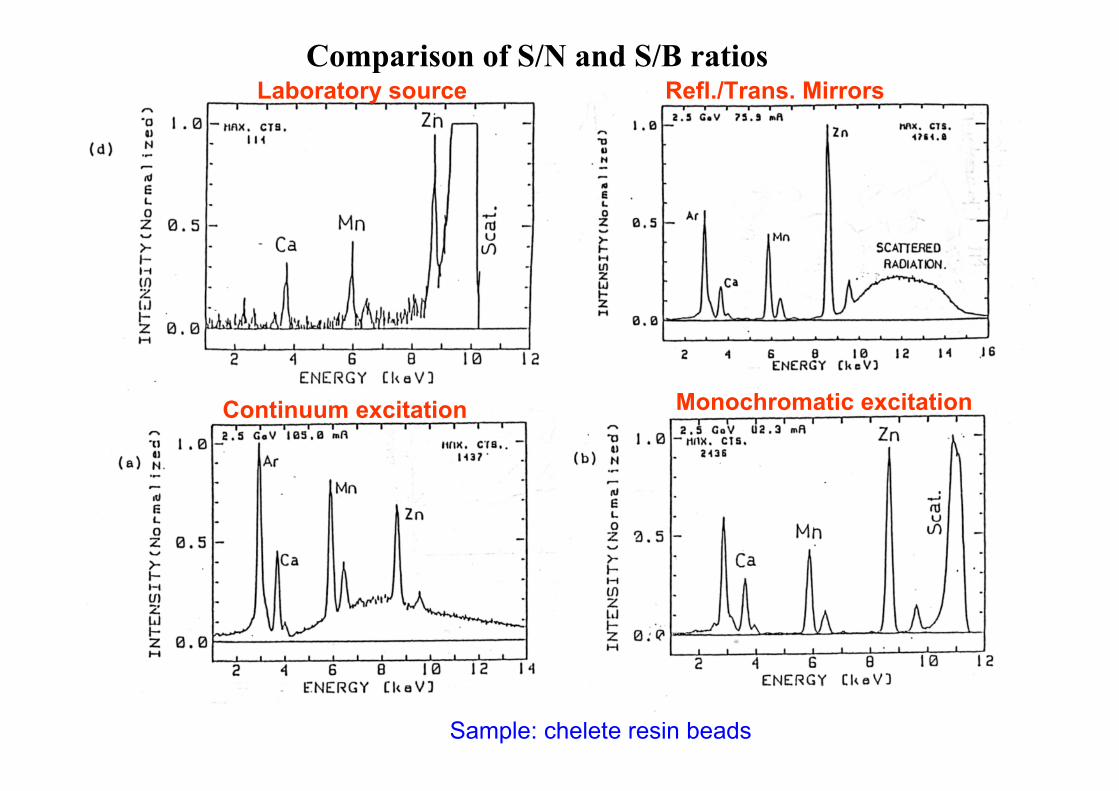
Sample: chelete resin beads
Monochromatic excitation
Laboratory source
Continuum excitation
Refl./Trans. MirrorsComparison of S/N and S/B ratios
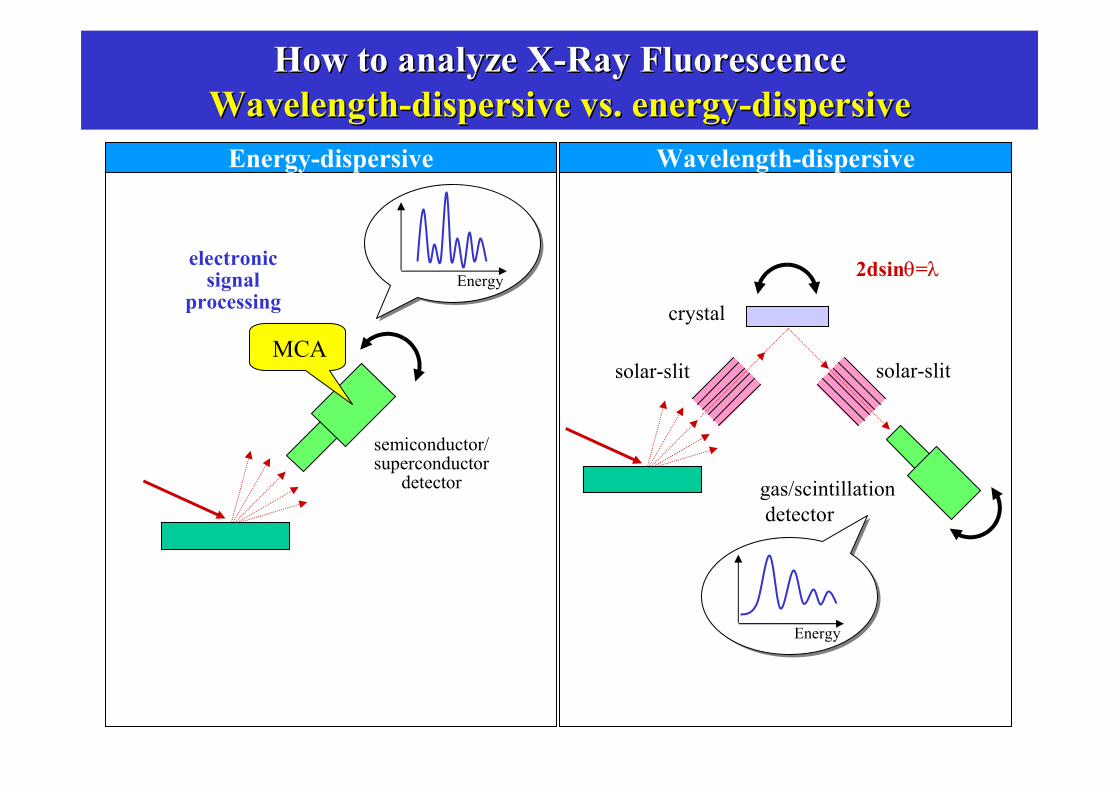
How to analyze XHow to analyze X--Ray FluorescenceRay FluorescenceWavelengthWavelength--dispersive vs. energydispersive vs. energy--dispersivedispersive
Wavelength-dispersive
solar-slit solar-slit
crystal
gas/scintillationdetector
Energy
2dsinθ=λ
Energy-dispersive
electronic signal
processing
MCA
Energy
semiconductor/superconductor
detector
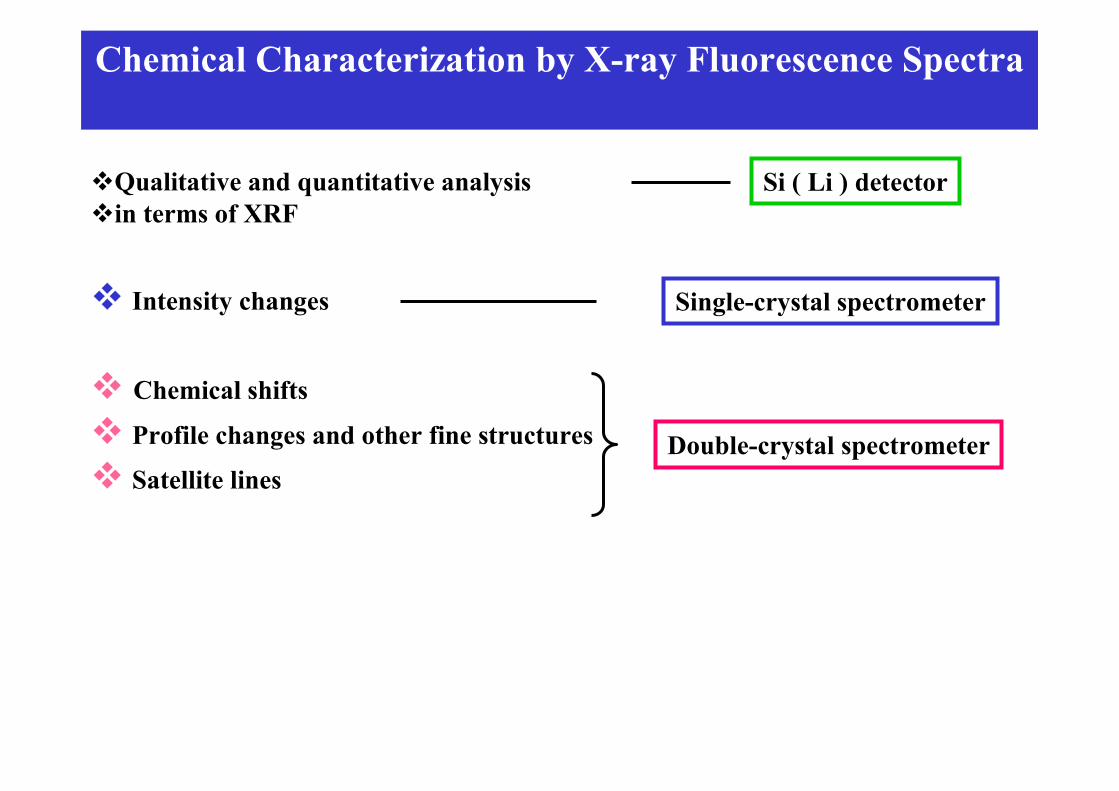
Qualitative and quantitative analysisin terms of XRF
Intensity changes
Chemical shifts
Profile changes and other fine structures
Satellite linesDouble-crystal spectrometer
Single-crystal spectrometer
Si ( Li ) detector
Chemical Characterization by X-ray Fluorescence Spectra
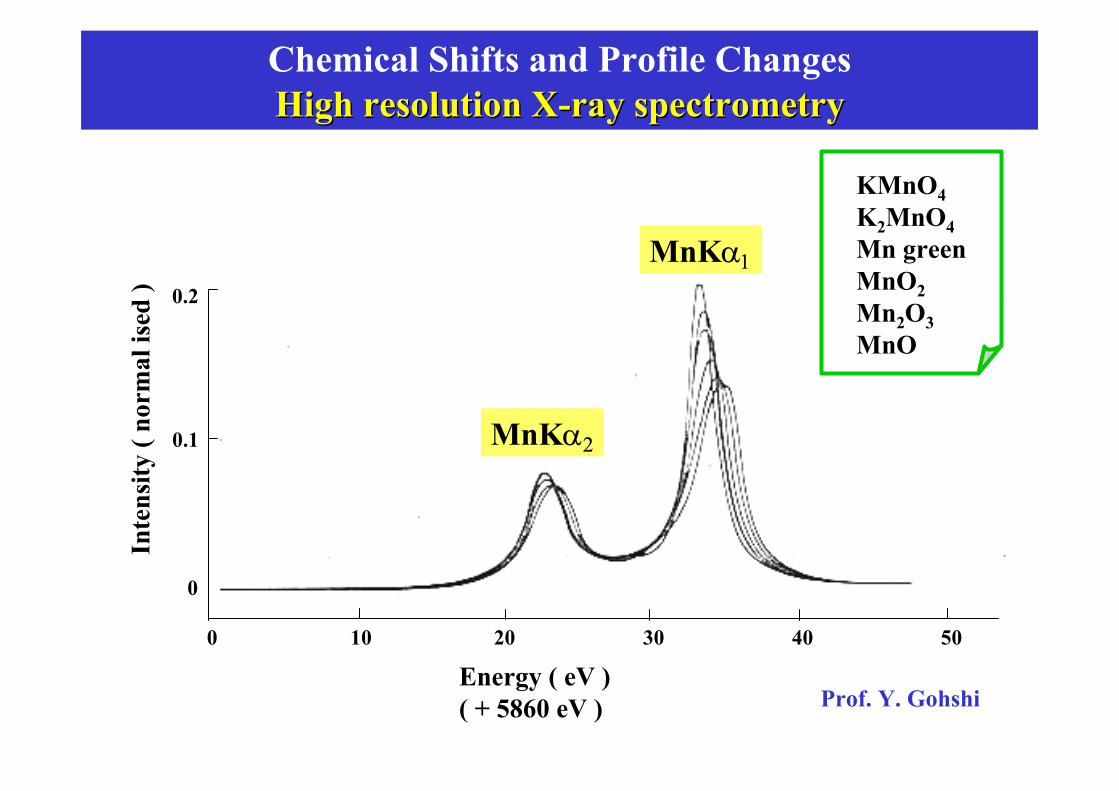
0 10 20 30 40 50
0.1
0.2
0
Inte
nsity
( no
rmal
ised
)
Energy ( eV ) ( + 5860 eV )
KMnO4K2MnO4Mn greenMnO2Mn2O3MnO
MnKα1
MnKα2
Chemical Shifts and Profile ChangesHigh resolution XHigh resolution X--ray spectrometryray spectrometry
Prof. Y. Gohshi
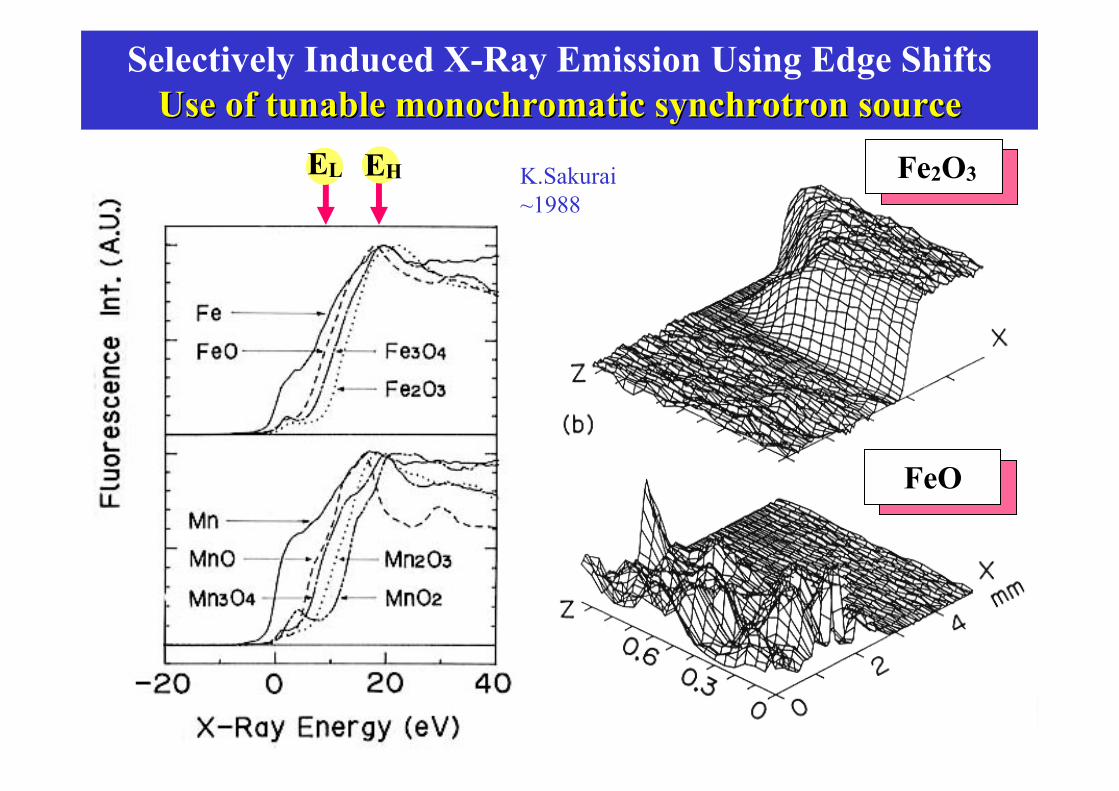
Fe2O3
FeO
EHEL
Selectively Induced X-Ray Emission Using Edge Shifts Use of tunable monochromatic synchrotron sourceUse of tunable monochromatic synchrotron source
K.Sakurai~1988
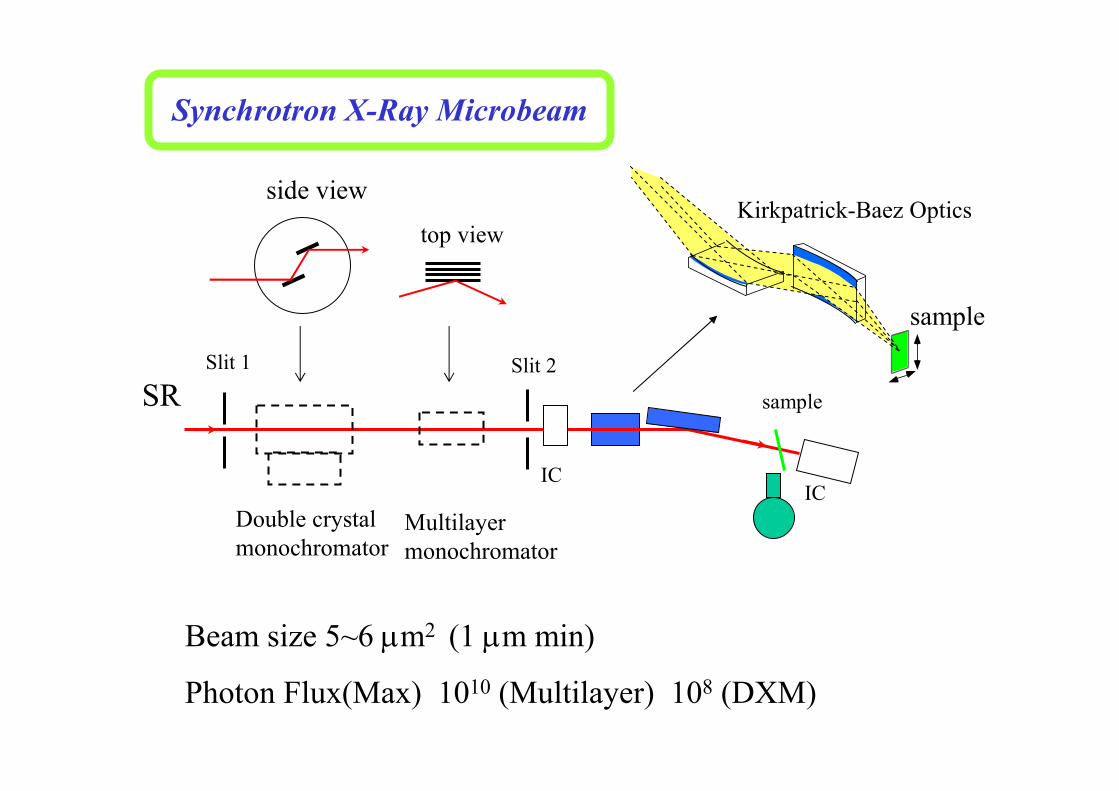
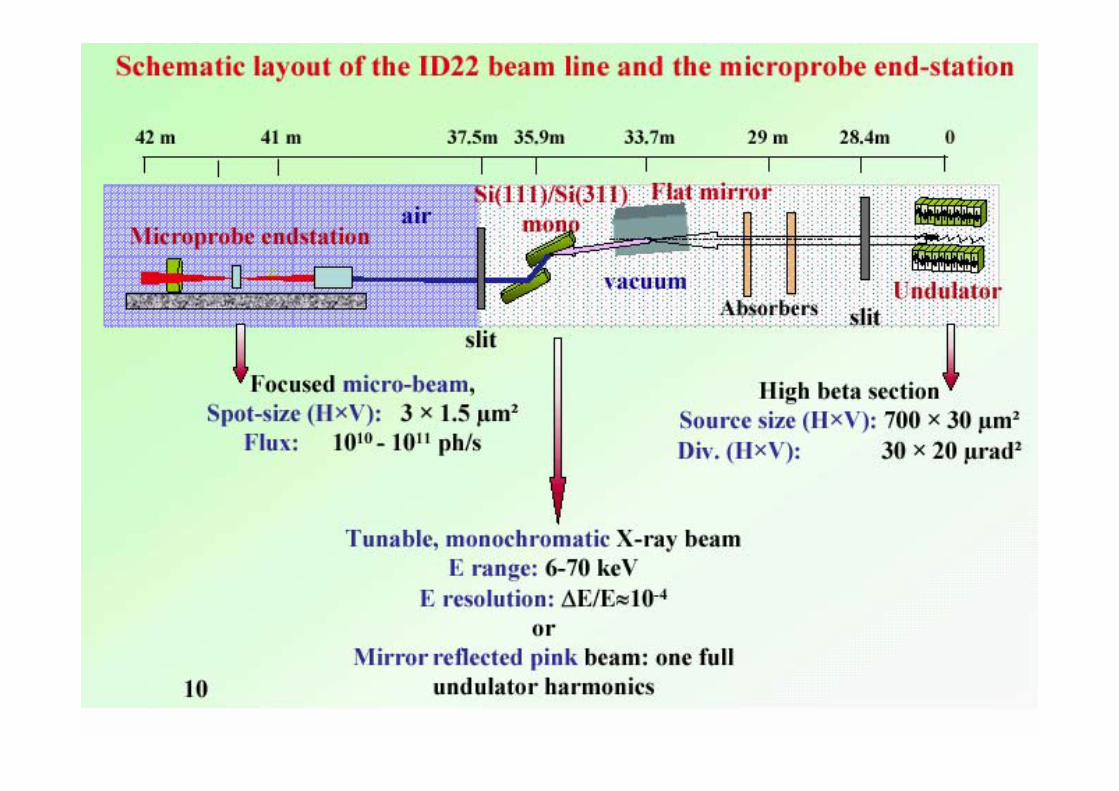
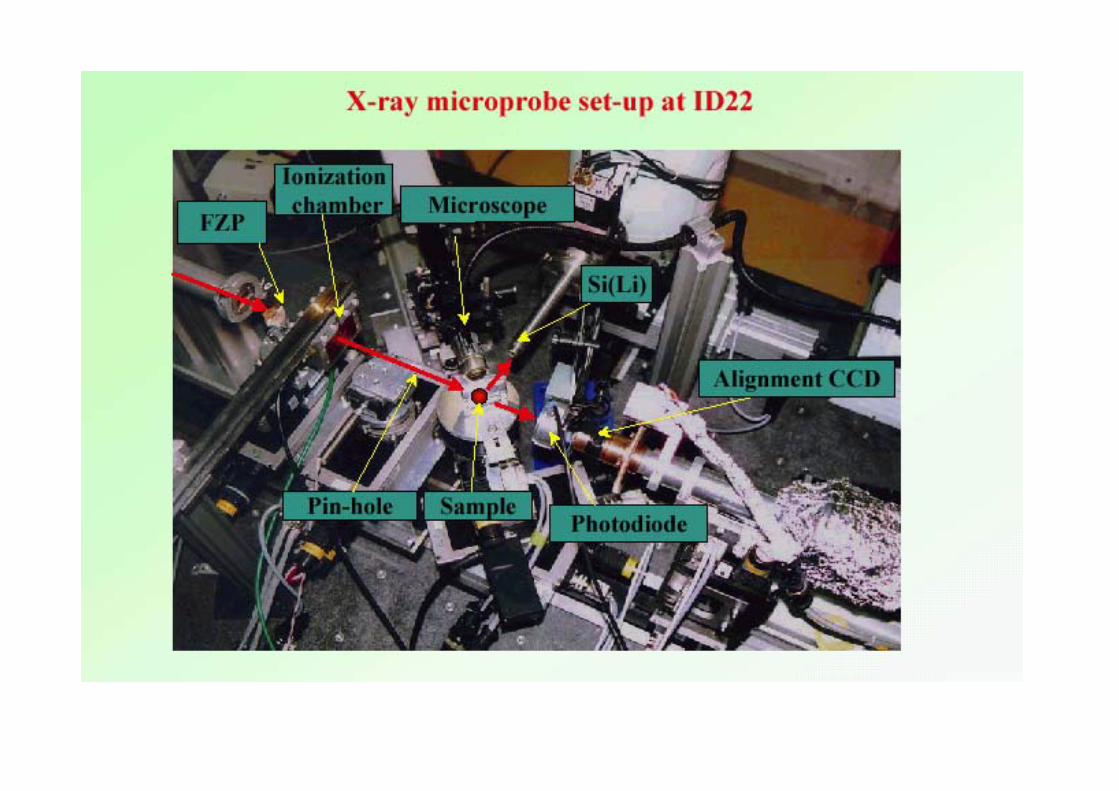
Kirkpatrick-Baez Optics
sample
SRSlit 1
Double crystalmonochromator
Multilayer monochromator
Slit 2
side viewtop view
ICIC
sample
Synchrotron X-Ray Microbeam
Beam size 5~6 µm2 (1 µm min)
Photon Flux(Max) 1010 (Multilayer) 108 (DXM)
Application to criminology
• A serious case of murder happened in a small town in Japan in 1999.
• White arsenic(arsenic oxide) was mixed in curry and 5 kids died of arsenic poisoning.
• No wittness and no confession, only presumptive evidence
• XFS technique works effectively.
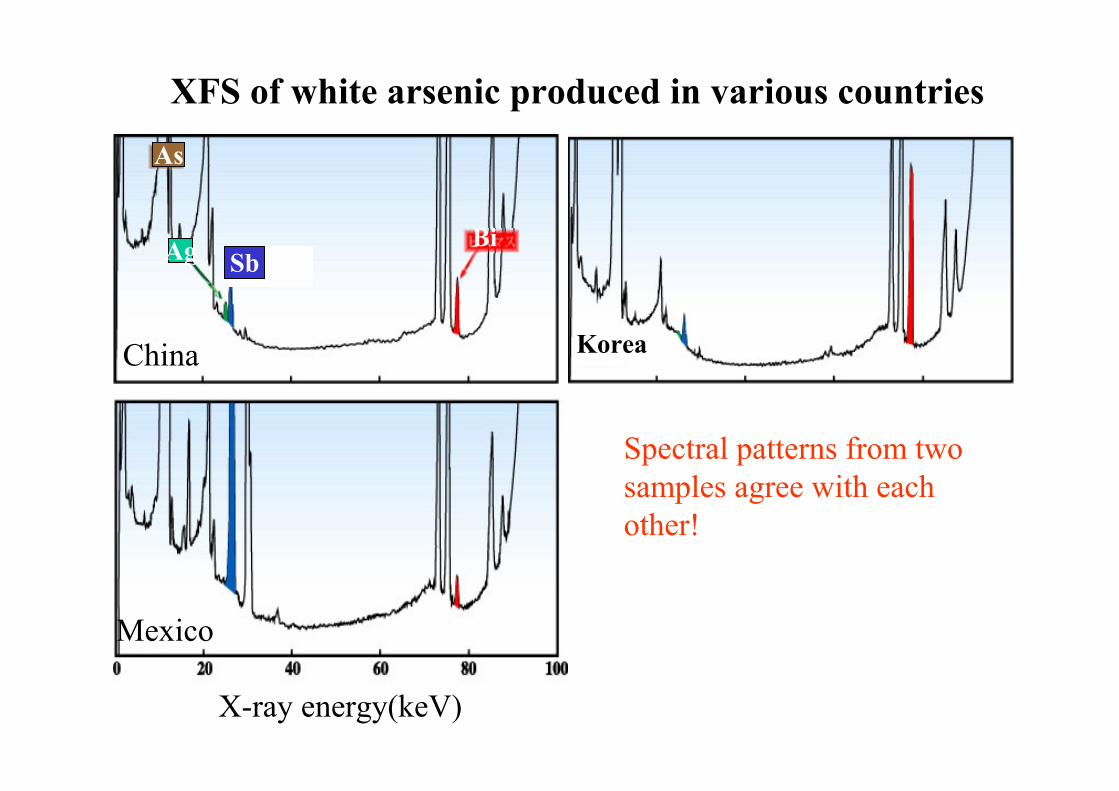
XFS of white arsenic produced in various countries
Sb
China
Mexico
X-ray energy(keV)
As
Ag SbBi
Korea
Spectral patterns from two samples agree with each other!
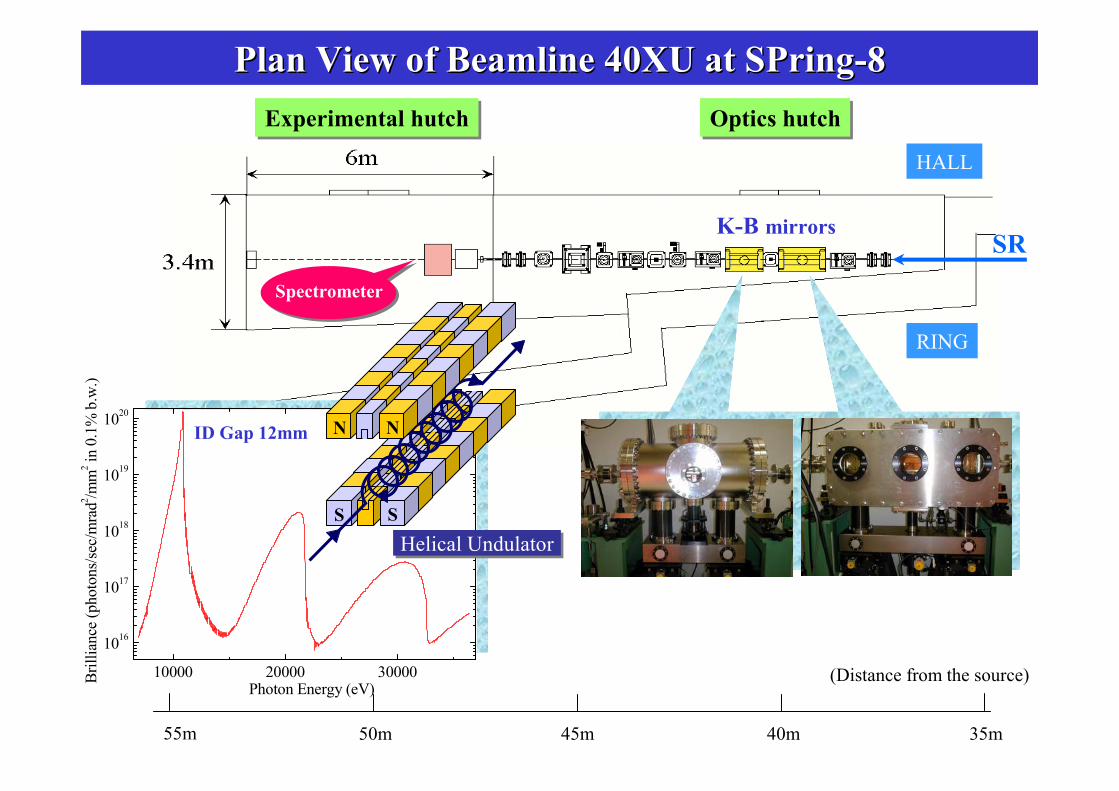
Plan View of Beamline 40XU at SPringPlan View of Beamline 40XU at SPring--8 8 Experimental hutchExperimental hutch Optics hutchOptics hutch
K-B mirrors
Spectrometer
HALL
RING
SR
10000 20000 30000
1016
1017
1018
1019
1020
Brill
ianc
e (p
hoto
ns/se
c/m
rad2 /m
m2 in
0.1
% b
.w.)
Photon Energy (eV)
ID Gap 12mm
S S
N N
Helical Undulator Helical Undulator
40m45m50m55m
(Distance from the source)
35m
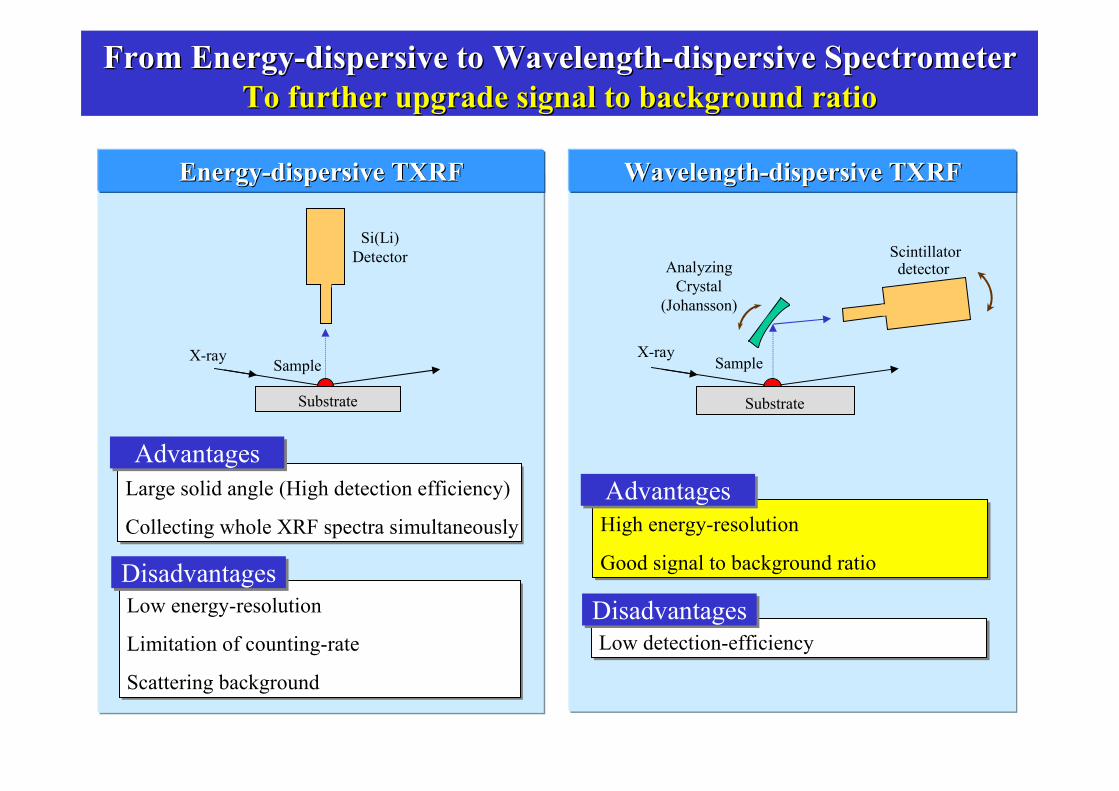
From EnergyFrom Energy--dispersive to Wavelengthdispersive to Wavelength--dispersive Spectrometerdispersive SpectrometerTo further upgrade signal to background ratio To further upgrade signal to background ratio
EnergyEnergy--dispersive TXRFdispersive TXRF
Sample
Si(Li)Detector
Substrate
X-ray
WavelengthWavelength--dispersive TXRFdispersive TXRF
Large solid angle (High detection efficiency)
Collecting whole XRF spectra simultaneously
Large solid angle (High detection efficiency)
Collecting whole XRF spectra simultaneously
Low energy-resolution
Limitation of counting-rate
Scattering background
Low energy-resolution
Limitation of counting-rate
Scattering background
AdvantagesAdvantages
DisadvantagesDisadvantages
High energy-resolution
Good signal to background ratio
High energy-resolution
Good signal to background ratio
AdvantagesAdvantages
Low detection-efficiencyLow detection-efficiencyDisadvantagesDisadvantages
AnalyzingCrystal
(Johansson)
Sample
Substrate
X-ray
Scintillatordetector

Design ConsiderationsDesign ConsiderationsFlexibility and feasibility for practical analytical applicationFlexibility and feasibility for practical analytical applicationss
Detector
SR
Entrance Slit
Curved Crystal Johansson Ge (220)
Receiving Slit
Sample
Rowland CircleR=120mm( flexible )
Rowland CircleR=120mm( flexible )
Vac. chamber
4 axes for scanning X-ray energy4 axes for scanning X-ray energy
4 axes for alignment and positioning of the sample4 axes for alignment and positioning of the sample
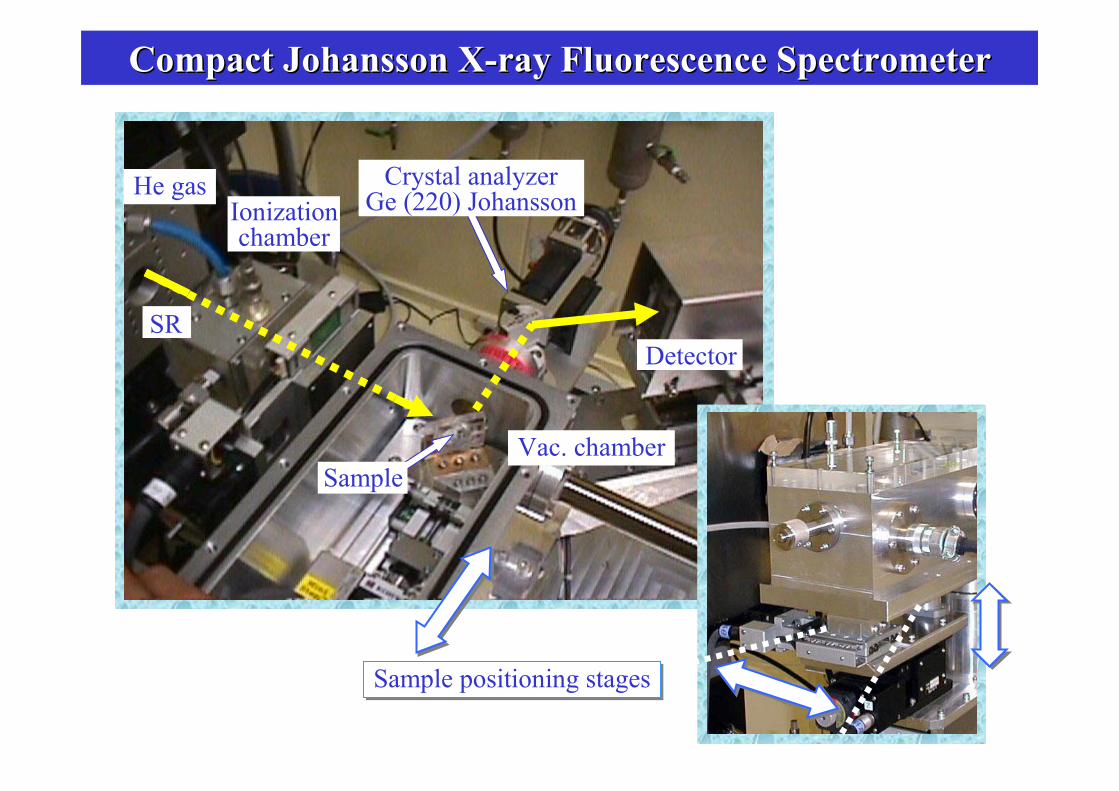
Compact Johansson XCompact Johansson X--ray Fluorescence Spectrometerray Fluorescence Spectrometer
Detector
Ionizationchamber
SR
Crystal analyzerGe (220) JohanssonHe gas
Sample
Sample positioning stagesSample positioning stages
Vac. chamber
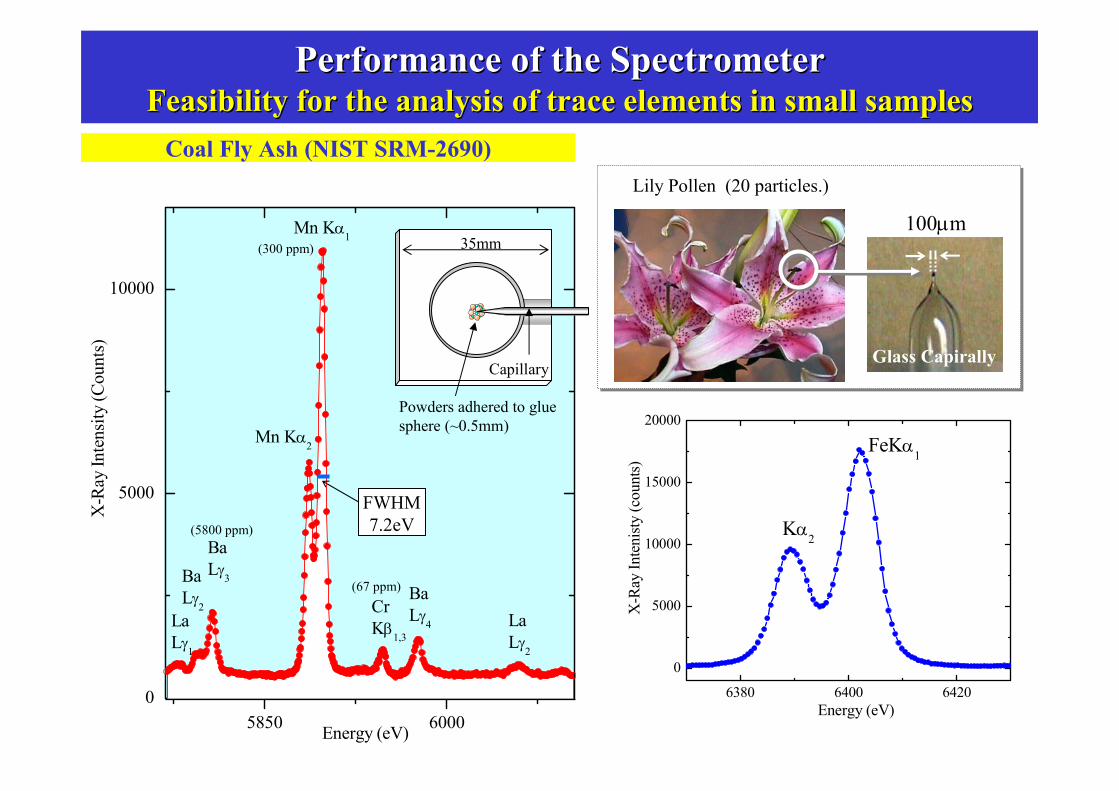
6380 6400 6420
0
5000
10000
15000
20000
Kα2
FeKα1
X-R
ay In
teni
sty (c
ount
s)
Energy (eV)
Performance of the SpectrometerPerformance of the SpectrometerFeasibility for the analysis of trace elements in small samplesFeasibility for the analysis of trace elements in small samples
100µm
Glass Capirally
Lily Pollen (20 particles.)
5850 60000
5000
10000
LaLγ2
BaLγ4
Cr Kβ1,3
BaLγ3Ba
Lγ2LaLγ1
Mn Kα2
Mn Kα1
X-R
ay In
tens
ity (C
ount
s)
Energy (eV)
(300 ppm)
(5800 ppm)
Coal Fly Ash (NIST SRM-2690)
(67 ppm)
Capillary
Powders adhered to glue sphere (~0.5mm)
35mm
FWHM7.2eV
6900 7000 7100 7400 7500 7600 77006350 6400 64500
5000
10000
15000
20000
25000
30000
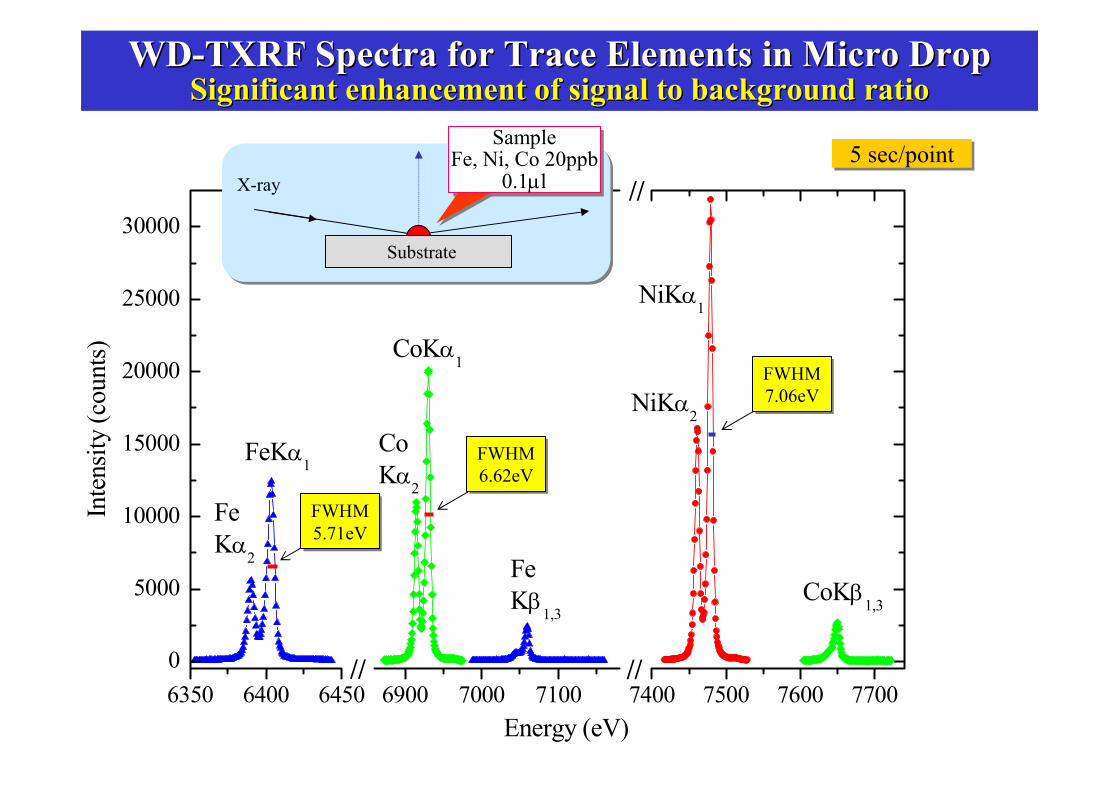
FeKα1
FeKα
2
Inte
nsity
(cou
nts)
Energy (eV)
NiKα2
FeKβ
1,3
CoKα1
CoKα2
////
// //
CoKβ1,3
NiKα1
Substrate
X-ray
SampleFe, Ni, Co 20ppb
0.1µl
FWHM5.71eVFWHM5.71eV
FWHM6.62eVFWHM6.62eV
FWHM7.06eVFWHM7.06eV
5 sec/point5 sec/point
WDWD--TXRF Spectra for Trace Elements in Micro DropTXRF Spectra for Trace Elements in Micro DropSignificant enhancement of signal to background ratioSignificant enhancement of signal to background ratio
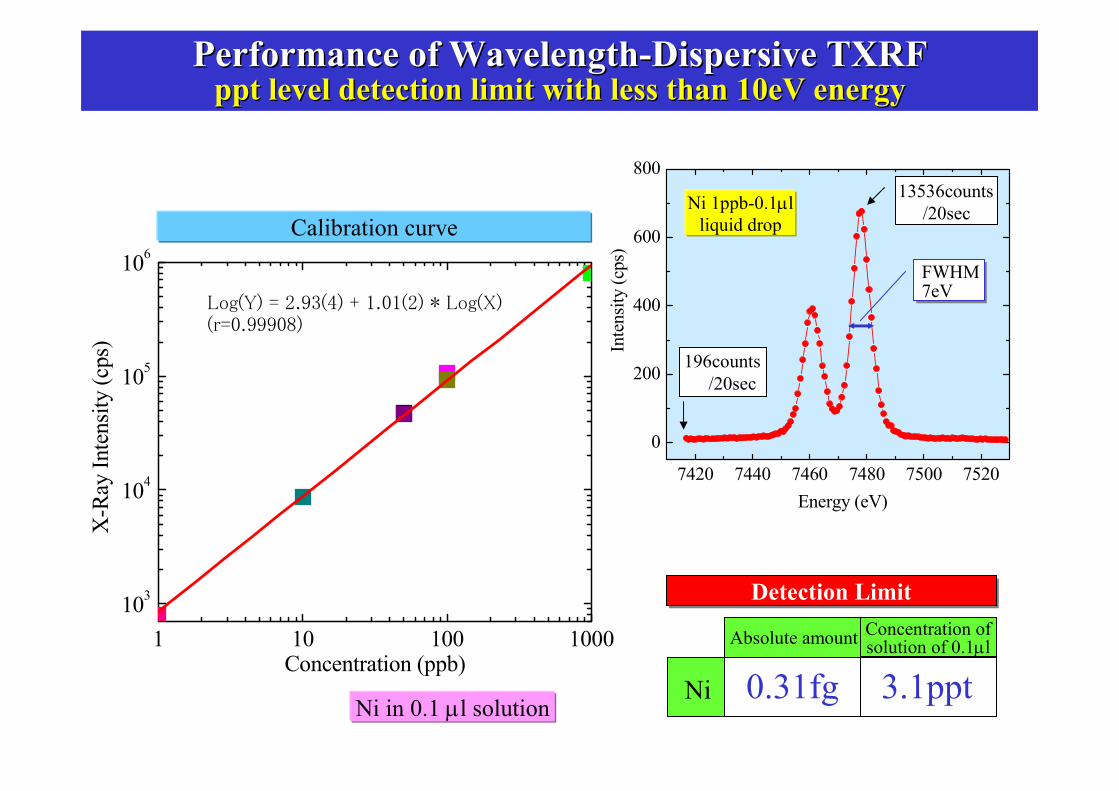
1 10 100 1000103
104
105
106
Log(Y) = 2.93(4) + 1.01(2) * Log(X)(r=0.99908)
X-R
ay In
tens
ity (c
ps)
Concentration (ppb)
Performance of WavelengthPerformance of Wavelength--Dispersive TXRFDispersive TXRFpptppt level detection limit with less than 10eV energy level detection limit with less than 10eV energy
Concentration of solution of 0.1µl
Detection LimitDetection Limit
Ni
Absolute amount
0.31fg 3.1pptNi in 0.1 µl solution
7420 7440 7460 7480 7500 7520
0
200
400
600
800
Inte
nsity
(cps
)
Energy (eV)
13536counts/20sec
196counts/20sec
Ni 1ppb-0.1µlliquid drop
FWHM7eV
Calibration curve
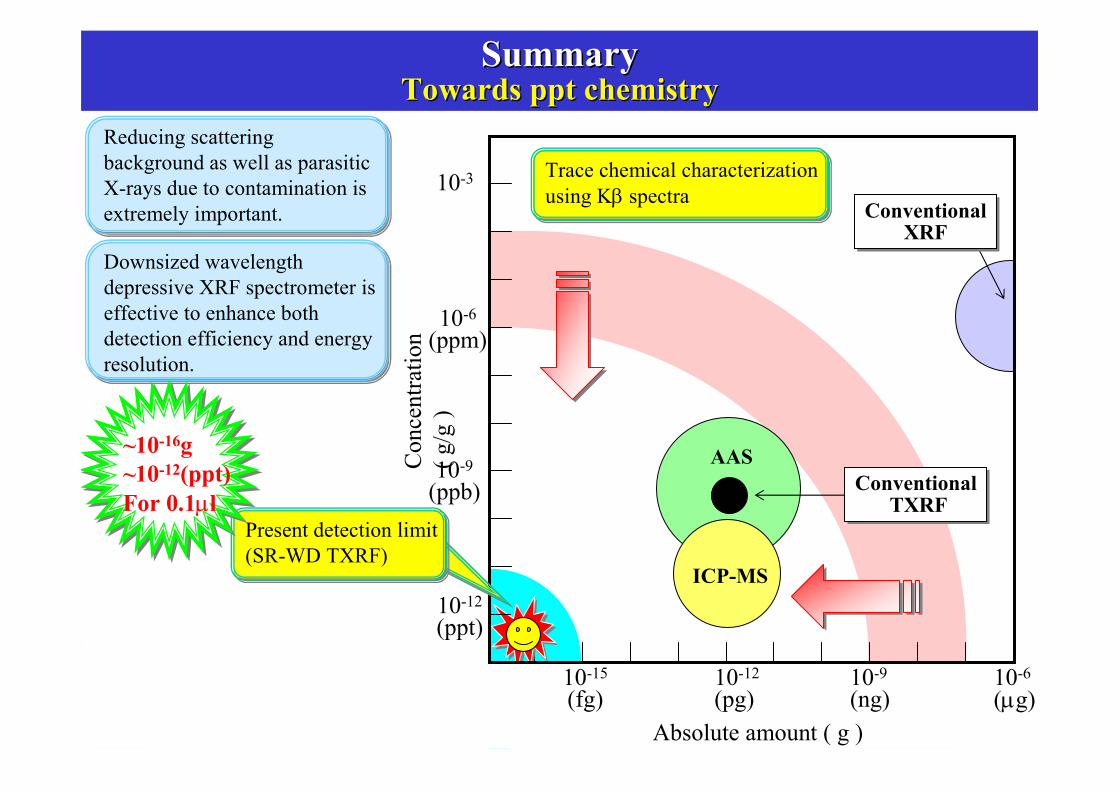
SummarySummaryTowards Towards pptppt chemistry chemistry
Con
cent
ratio
n ( g
/g )
AAS
ICP-MS
ConventionalXRF
ConventionalXRF
ConventionalTXRF
ConventionalTXRF
10-12
(pg)10-6
(µg)10-9
(ng)10-15
(fg)
10-12
(ppt)
10-9
(ppb)
10-6
(ppm)
10-3
Absolute amount ( g )
Trace chemical characterization using Kβ spectra
Reducing scattering background as well as parasitic X-rays due to contamination is extremely important.
Downsized wavelength depressive XRF spectrometer is effective to enhance both detection efficiency and energy resolution.
Present detection limit(SR-WD TXRF)
~10-16g~10-12(ppt)For 0.1µl


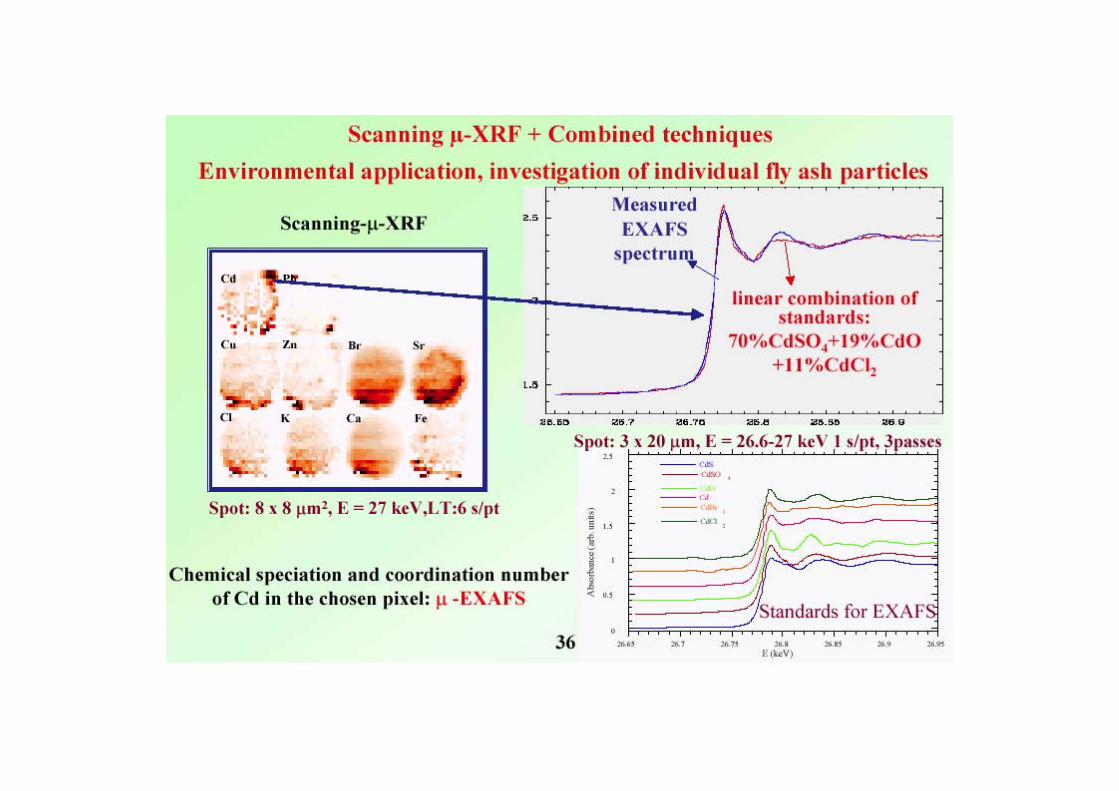
Conclusions SR-X-ray XRF technique is very powerful.
• Low detection limit down to fg, ppt level• applicable to samples of limited size• well analyzed due to energy tunability and high
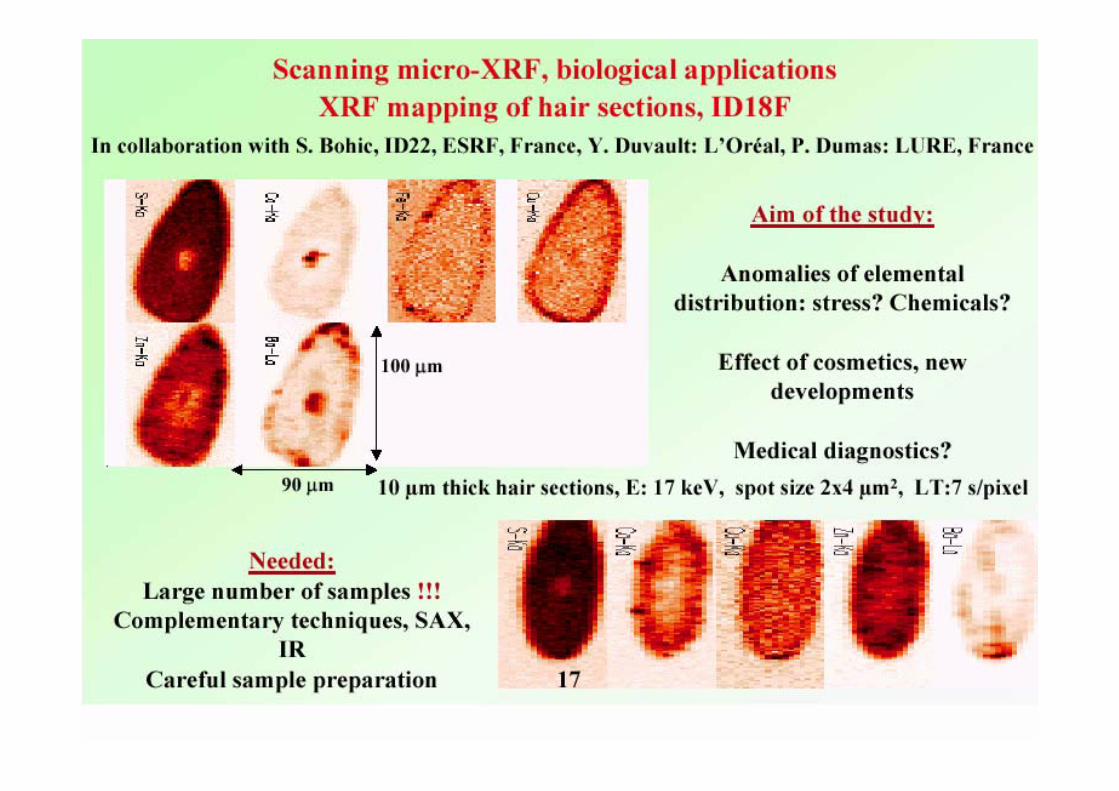
energy resolution• Development of XRF imaging• Combination with different micro techniques
(XRD, XANES and EXAFS)


![Welcome [cicc.or.jp]cicc.or.jp/japanese/hyoujyunka/pdf_ppt/04SEbangladesh.slide.pdf · ¾Bangladesh has already adopted ISO 9000, ISO 14000, HACCP and many other international standards,](https://img.pdfslide.us/doc/110x75/5e7e97ec6f2d5e4fef3b2170/welcome-ciccorjpciccorjpjapanesehyoujyunkapdfppt-bangladesh-has.jpg)