Embed Size (px)
Citation preview
ww
Organisation for Economic Co-operation and Development
STATISTICS BRIEF
Measuring inequality in income and consumption in a national accounts framework by Maryse Fesseau and Peter van de Ven1
Measurement and analysis of income inequality has long been a topic of OECD work2 and seized renewed attention with the OECD’s Better Life Initiative3. Measuring distributions across dimensions above and beyond income (health, education, etc.) are also at the heart of the OECD’s How’s Life?4 statistical agenda and form a prominent recommendation in the Stiglitz-Sen-Fitoussi report5. Similarly, the G20 Data Gaps Initiative launched by the International Monetary Fund (IMF) and the Financial Stability Board (FSB), and carried out jointly with other international organisations, aims at closing information gaps that became apparent during the economic and financial crisis, and recommended improving the statistical base for distributional measures of the household sector6. More recently, the OECD has taken up the measurement and analysis of Inclusive Growth. Again, distributional information is key to this endeavour. Differences in access to economic resources across households result in varying levels of exposure to economic risk, and in an uneven ability to absorb income shocks with potentially important consequences for economic and social stability.
Nearly universally, studies on the distribution of income, consumption and wealth have drawn on surveys of individuals or households as their primary statistical source. Surveys provide relevant and detailed information and so are the obvious source for measuring and analysing distributions. However, surveys generally focus on income, consumption and wealth separately, while consistent information on the joint distribution of these dimensions would be desirable. Furthermore, long time series are often not available and, with the exception of income7, microdata from household surveys do not follow international statistical standards, making comparisons across countries difficult. To address this issue, also as part of the statistical agenda under the Better Life Initiative, the OECD set up an Expert Group to develop an international framework for microdata on the distribution of household income, consumption and wealth, and to develop standard guidelines on wealth. Two reports were published in 20138.
November 2014 - No. 19
2 Distribution of which income, consumption and wealth?
4 A tool to assess the workings of re-distribution
6 Do poor households consume more than their income?
8 Does our picture of inequality change?
9 Conclusions and way forward
12 Further reading
2Statistics Brief - November 2014 - No. 19
National accounts data on households suffer from none of the above drawbacks. In addition, they provide an accounting framework that allows to track households’ economic resources in a consistent way, from their generation (for instance via wages), via their (re)distribution (for instance via interest, dividends, taxes and social benefits) to final disposable income. They also show how much of the income is being consumed and saved, and which types of assets are being accumulated with the savings. However, national accounts provide no information on how income, consumption and wealth are distributed across households. This makes them unsuitable for the analysis of distributional questions.
A logical way forward would appear to be to integrate the distributional information from household micro-surveys with the consistent and standardised macro-information from the national accounts. This is easier said than done, however. Many adjustments are needed to make sources comparable and to successfully integrate micro-information into a national accounts framework. There are differences in concepts, in coverage, and there are cases of significant under-reporting, and occasionally over-reporting, of some income, consumption and wealth items. The OECD and Eurostat decided to address these challenges and in 2011 set up a joint Expert Group on Disparities in national accounts (see Box). The Statistics Brief at hand presents the issues and main results from this work.
Distribution of which income, consumption and wealth?
While “income”, “consumption” or “wealth” seem to be well-defined measures, closer inspection shows that they hold many meanings. For instance, when people live in their own houses and so consume dwelling services even if no money changes hand, should dwelling services be considered part of consumption and income? When insurance companies invest funds collected from insurance holders and the returns generated
reduces premiums paid, should this reduction be considered income to the insurance holder? Few individuals would identify this as part of their income. Yet, the effects are real and captured in the national accounts. The answer to whether or not to include such items often depends on the purpose of the income or consumption statistic. For instance, if the purpose of income data is to describe household behaviour which is closely related to perceived income levels and developments, it may be useful to stick with income components that are readily identifiable as such by individuals. If the purpose is to paint a more comprehensive picture of the economic resources available to households, measures of income and consumption according to national accounts may prove to be more adequate. The two major sources for income and consumption data, household surveys and national accounts, can broadly be identified with these two aspects. The latter are more comprehensive in their measurement of income and consumption, the former offer more detail, in particular distributional detail and information on household characteristics. Making the most of both sources has been the key aspect of the work at hand.
The first step towards accomplishing this task is to develop a good understanding of the exact differences between micro-sources (household surveys) and macro-sources (national accounts). Such differences not only lie in the scope of what constitutes income or consumption, they also arise from differences in statistical coverage, classifications and other adjustments that are specific to each source. Similar issues arise also when household wealth is measured either by surveying households or in the context of national accounts that tend to draw on a host of statistical sources.
The OECD-Eurostat work thus started off by quantifying differences between micro- and macro-sources for each of the main components of income, for each of the main components of consumption, and for each of the main elements of household wealth. This comparison was
3 November 2014 - No. 19 - Statistics Brief
Box: The OECD-Eurostat Expert Group on Disparities in National Accounts(1)
The main objective of the work undertaken by the OECD-Eurostat Expert Group on Disparities in National Accounts (EG DNA) was to provide distributional information on household income, consumption and saving, consistent with the system of national accounts according to the following breakdowns:
(i) income quintiles;(ii) main sources of income; and(iii) household types.
The work was performed in two steps. First, country experts compared micro- and macro-data sources on households’ economic resources (i.e. income, consumption and wealth) to better understand similarities and divergences between the two data sources. The comparison was carried out at a very detailed level for each of the three components, for a given year, generally 2008, 2009 or 2010. Twenty countries covered all (or part) of the components for (adjusted) disposable income, twenty-one all or part of the components for (actual) final consumption, and seven all or part of the components for household wealth. In a second step, country experts allocated the national account totals of income and consumption to groups of households using distributive information from a range of micro-sources. Breakdowns were fully or partially completed by 16 countries. In parallel to the Expert Group work, Eurostat launched a so-called “a-minima exercise”, carried out at the centralised level and covering more European countries. This a-minima exercise followed to the extent possible the methodology agreed by the EG DNA. It covered data on household adjusted disposable income for 28 European countries and for the aggregate EU27. The breakdowns were performed for the year 2008, mainly using data from the harmonised European Survey on Income and Living Conditions (EU-SILC).
Detailed results of the work of the EG DNA have been published in two working papers, one showing the comparison between micro- and macro-sources on household income, consumption and wealth (step 1), the other one presenting the experimental results of the allocation of national account totals for household adjusted disposable income, actual final consumption and saving to the various household groups (step 2). Both working papers also include a comparison between the results of the EG DNA and the outcomes of the Eurostat a-minima exercise for the relevant countries. The two working papers are available at following links: http://dx.doi.org/10.1787/18152031 (papers 2013/03 and 2013/04).
1. Experts from Australia, Austria, Canada, Chile, Denmark, Finland, France, Germany, Israel, Italy, India, Japan, Korea, Mexico, the Netherlands, New Zealand, Poland, Portugal, Slovenia, Spain, Sweden, Switzerland, Turkey, the United Kingdom, the United States, as well as from the European Central Bank and the Luxembourg Income Study participated in the work of the Expert Group, which also benefited from financial support from France and Italy.
4Statistics Brief - November 2014 - No. 19
in surveys and in the national accounts, in particular insurance and financial services.
Finally, coverage rates were computed for household wealth. This was only possible for a smaller number of countries (6) and showed sizable differences between micro- and macro-sources in various wealth components, in particular shares and other equity where valuation methods may be vastly different between national accounts and households’ own assessments. Other explanations are differences in the population scope such as people living in retirement homes that are often not covered in wealth surveys and the lack of oversampling of rich households, needed to ensure full coverage of top wealth owners.
Overall, coverage rates provide useful information for both data compilers and users. In particular, when micro- and macro-totals are very different from each other without an adequate conceptual reason, this may signal issues with the accuracy of sources, either the microdata or the national accounts estimates or both. Experience from the OECD-Eurostat work has shown that a systematic assessment of coverage ratios generates useful interaction between survey statisticians and national accountants with positive feed-back loops for the quality and consistency of both source statistics.
A tool to assess the workings of re-distribution
One of the distinctive features of measuring distribution of economic resources in a national accounts setting is the possibility to track income of different groups of households from where it is being generated (primary income such as wages, interest or profits received) to where it ends (consumption and accumulation of assets). Between these measures lies a system of redistribution through taxes and social contributions paid by households and transfers in cash and in kind received by households. As different groups of households are differently affected by the system
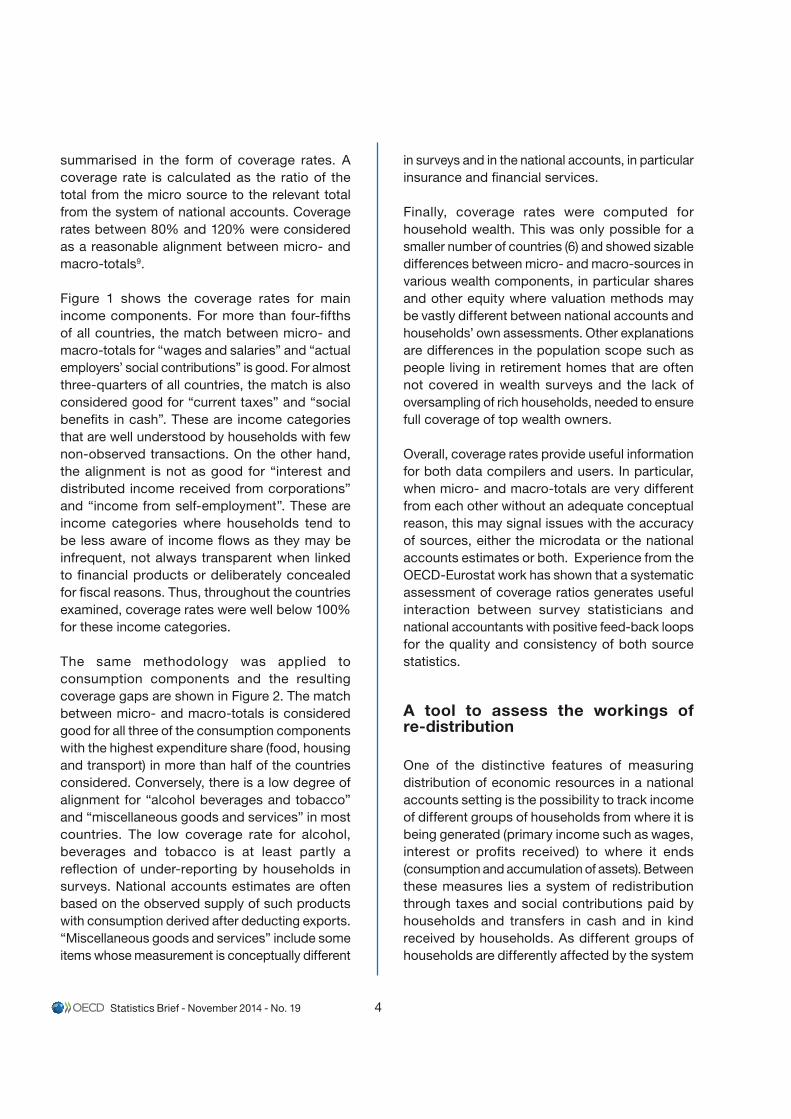
summarised in the form of coverage rates. A coverage rate is calculated as the ratio of the total from the micro source to the relevant total from the system of national accounts. Coverage rates between 80% and 120% were considered as a reasonable alignment between micro- and macro-totals9.
Figure 1 shows the coverage rates for main income components. For more than four-fifths of all countries, the match between micro- and macro-totals for “wages and salaries” and “actual employers’ social contributions” is good. For almost three-quarters of all countries, the match is also considered good for “current taxes” and “social benefits in cash”. These are income categories that are well understood by households with few non-observed transactions. On the other hand, the alignment is not as good for “interest and distributed income received from corporations” and “income from self-employment”. These are income categories where households tend to be less aware of income flows as they may be infrequent, not always transparent when linked to financial products or deliberately concealed for fiscal reasons. Thus, throughout the countries examined, coverage rates were well below 100% for these income categories.
The same methodology was applied to consumption components and the resulting coverage gaps are shown in Figure 2. The match between micro- and macro-totals is considered good for all three of the consumption components with the highest expenditure share (food, housing and transport) in more than half of the countries considered. Conversely, there is a low degree of alignment for “alcohol beverages and tobacco” and “miscellaneous goods and services” in most countries. The low coverage rate for alcohol, beverages and tobacco is at least partly a reflection of under-reporting by households in surveys. National accounts estimates are often based on the observed supply of such products with consumption derived after deducting exports. “Miscellaneous goods and services” include some items whose measurement is conceptually different
5 November 2014 - No. 19 - Statistics Brief
0%
20%
40%
60%
80%
100%
120%
140%
160%
180% Australia
Austria
Canada
Denmark
France
Israel
Italy
Japan
Korea
Mexico
Netherlands
New Zealand
Poland
Portugal
Slovenia
Sweden
Switzerland
United Kingdom
United States
Figure 1. Coverage rates by country for the main household income components
For each component, the coverage rate is calculated as the ratio of the total from the micro-sources to the relevant total from the system of national accounts. A coverage rate between 80% and 120% is considered as a relatively good alignment between the two sources.
0%
20%
40%
60%
80%
100%
120%
140%
160%
180% Australia
Austria
Canada
Denmark
France
Israel
Italy
Japan
Korea
Mexico
Netherlands
New Zealand
Poland
Portugal
Slovenia
Sweden
Switzerland
Turkey
United Kingdom
United States
Figure 2. Coverage rates for countries by major consumption component
For each component, the coverage rate is calculated as the ratio of the total from the micro-sources to the relevant total from the system of national accounts. A coverage rate between 80% and 120% is considered as a relatively good alignment between the two sources.
6Statistics Brief - November 2014 - No. 19
of re-distribution, the distribution of primary income can look quite different from the distribution of (adjusted) disposable income10. The national accounts setting thus informs in a consistent way, about the workings of re-distribution and social policies.
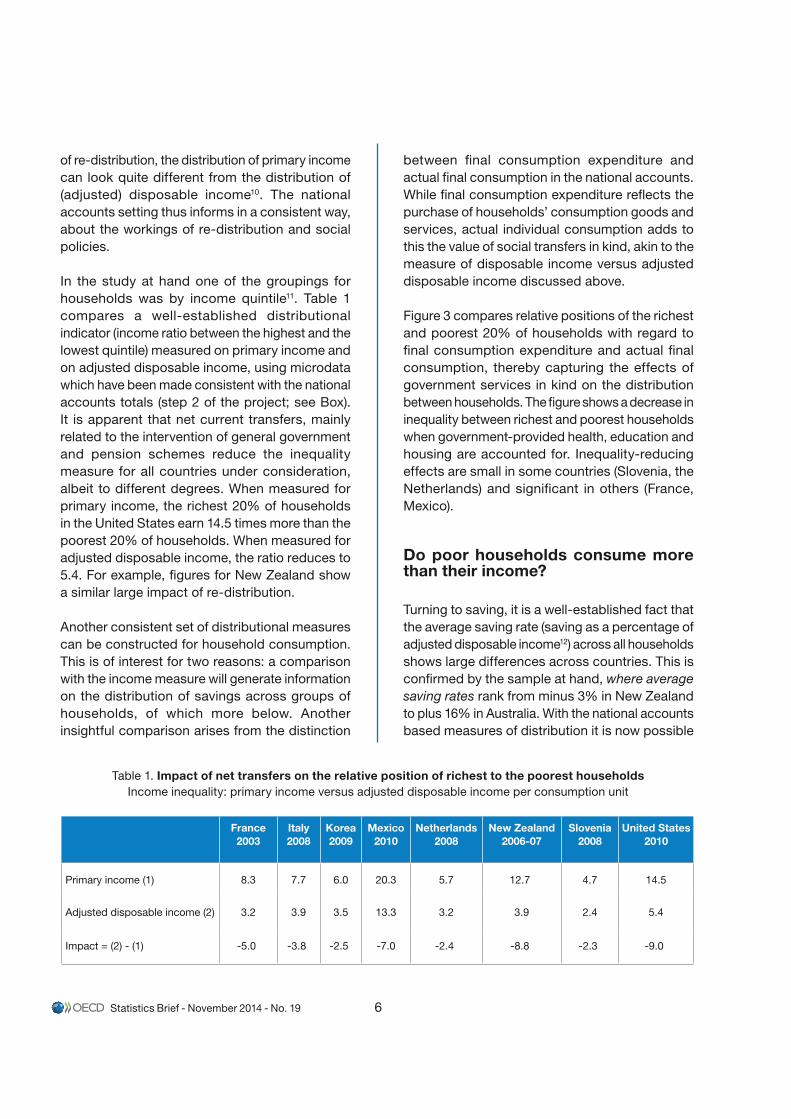
In the study at hand one of the groupings for households was by income quintile11. Table 1 compares a well-established distributional indicator (income ratio between the highest and the lowest quintile) measured on primary income and on adjusted disposable income, using microdata which have been made consistent with the national accounts totals (step 2 of the project; see Box). It is apparent that net current transfers, mainly related to the intervention of general government and pension schemes reduce the inequality measure for all countries under consideration, albeit to different degrees. When measured for primary income, the richest 20% of households in the United States earn 14.5 times more than the poorest 20% of households. When measured for adjusted disposable income, the ratio reduces to 5.4. For example, figures for New Zealand show a similar large impact of re-distribution.
Another consistent set of distributional measures can be constructed for household consumption. This is of interest for two reasons: a comparison with the income measure will generate information on the distribution of savings across groups of households, of which more below. Another insightful comparison arises from the distinction
between final consumption expenditure and actual final consumption in the national accounts. While final consumption expenditure reflects the purchase of households’ consumption goods and services, actual individual consumption adds to this the value of social transfers in kind, akin to the measure of disposable income versus adjusted disposable income discussed above.
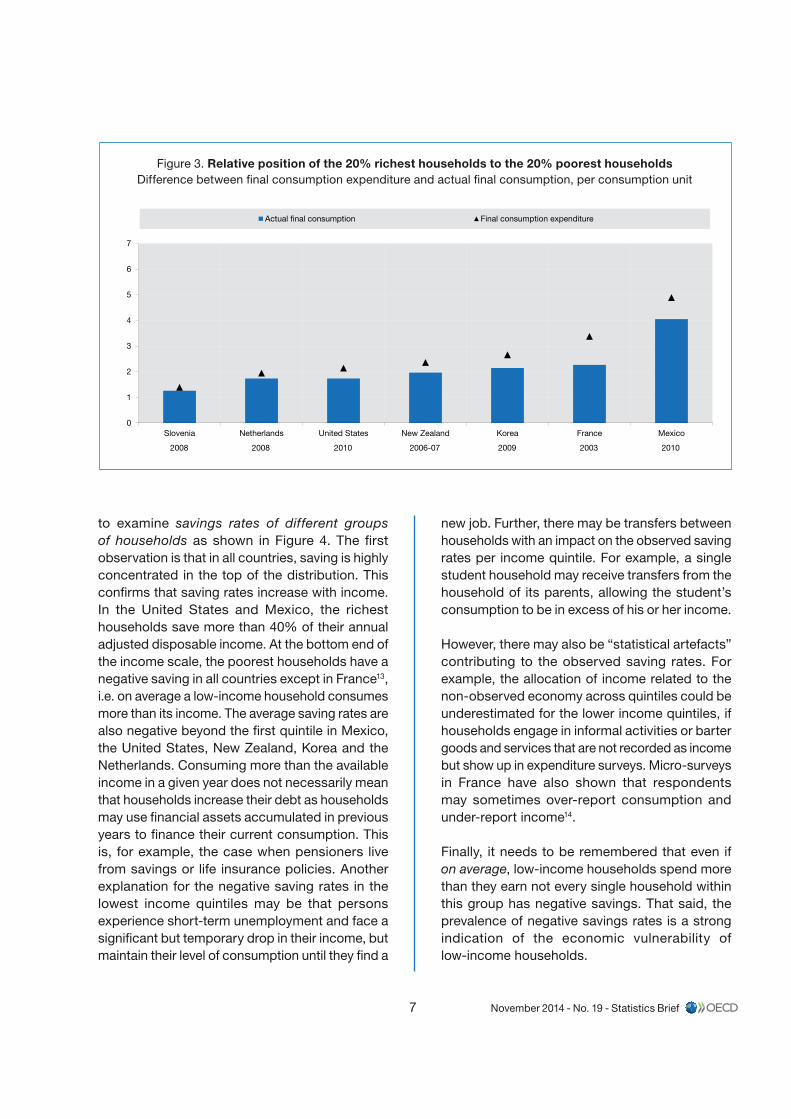
Figure 3 compares relative positions of the richest and poorest 20% of households with regard to final consumption expenditure and actual final consumption, thereby capturing the effects of government services in kind on the distribution between households. The figure shows a decrease in inequality between richest and poorest households when government-provided health, education and housing are accounted for. Inequality-reducing effects are small in some countries (Slovenia, the Netherlands) and significant in others (France, Mexico).
Do poor households consume more than their income?
Turning to saving, it is a well-established fact that the average saving rate (saving as a percentage of adjusted disposable income12) across all households shows large differences across countries. This is confirmed by the sample at hand, where average saving rates rank from minus 3% in New Zealand to plus 16% in Australia. With the national accounts based measures of distribution it is now possible
France 2003
Italy 2008
Korea 2009
Mexico 2010
Netherlands 2008
New Zealand 2006-07
Slovenia 2008
United States 2010
Primary income (1) 8.3 7.7 6.0 20.3 5.7 12.7 4.7 14.5
Adjusted disposable income (2) 3.2 3.9 3.5 13.3 3.2 3.9 2.4 5.4
Impact = (2) - (1) -5.0 -3.8 -2.5 -7.0 -2.4 -8.8 -2.3 -9.0
Table 1. Impact of net transfers on the relative position of richest to the poorest households Income inequality: primary income versus adjusted disposable income per consumption unit
7 November 2014 - No. 19 - Statistics Brief
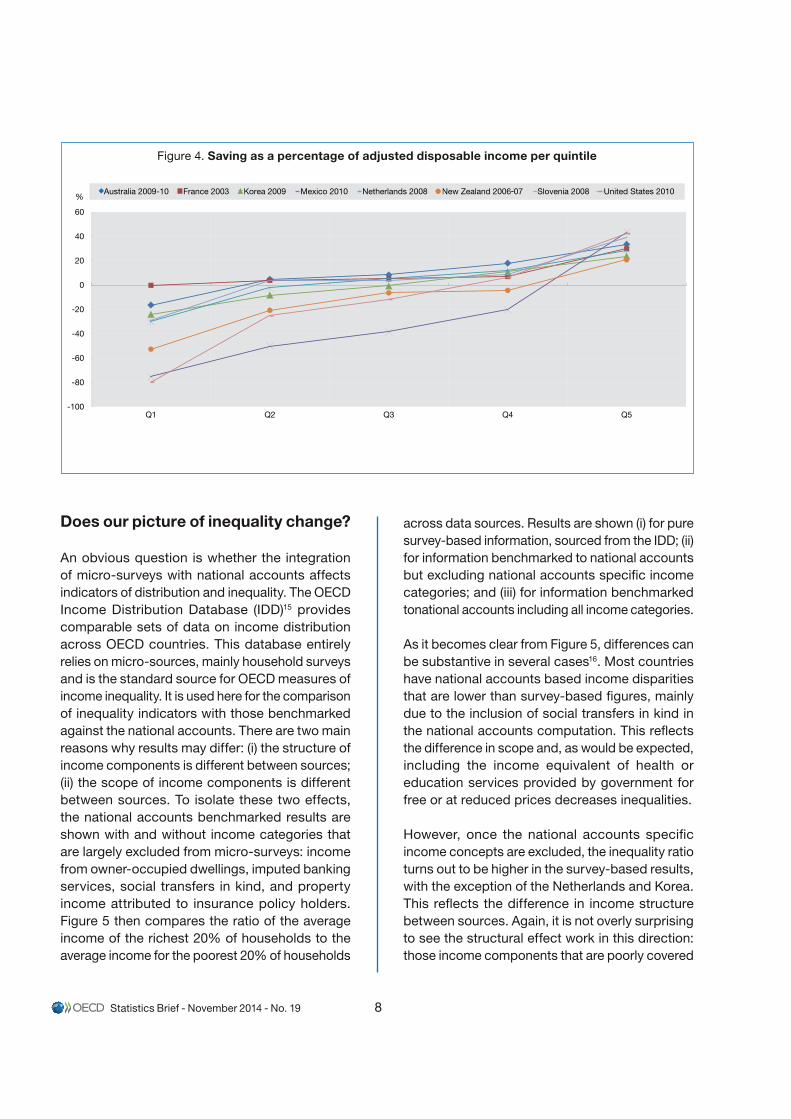
to examine savings rates of different groups of households as shown in Figure 4. The first observation is that in all countries, saving is highly concentrated in the top of the distribution. This confirms that saving rates increase with income. In the United States and Mexico, the richest households save more than 40% of their annual adjusted disposable income. At the bottom end of the income scale, the poorest households have a negative saving in all countries except in France13, i.e. on average a low-income household consumes more than its income. The average saving rates are also negative beyond the first quintile in Mexico, the United States, New Zealand, Korea and the Netherlands. Consuming more than the available income in a given year does not necessarily mean that households increase their debt as households may use financial assets accumulated in previous years to finance their current consumption. This is, for example, the case when pensioners live from savings or life insurance policies. Another explanation for the negative saving rates in the lowest income quintiles may be that persons experience short-term unemployment and face a significant but temporary drop in their income, but maintain their level of consumption until they find a
new job. Further, there may be transfers between households with an impact on the observed saving rates per income quintile. For example, a single student household may receive transfers from the household of its parents, allowing the student’s consumption to be in excess of his or her income.
However, there may also be “statistical artefacts” contributing to the observed saving rates. For example, the allocation of income related to the non-observed economy across quintiles could be underestimated for the lower income quintiles, if households engage in informal activities or barter goods and services that are not recorded as income but show up in expenditure surveys. Micro-surveys in France have also shown that respondents may sometimes over-report consumption and under-report income14.
Finally, it needs to be remembered that even if on average, low-income households spend more than they earn not every single household within this group has negative savings. That said, the prevalence of negative savings rates is a strong indication of the economic vulnerability of low-income households.
0
1
2
3
4
5
6
7
Slovenia Netherlands United States New Zealand Korea France Mexico
Actual final consumption Final consumption expenditure
2008 2008 2010 2010200320092006-07
Figure 3. Relative position of the 20% richest households to the 20% poorest households Difference between final consumption expenditure and actual final consumption, per consumption unit
8Statistics Brief - November 2014 - No. 19
Does our picture of inequality change?
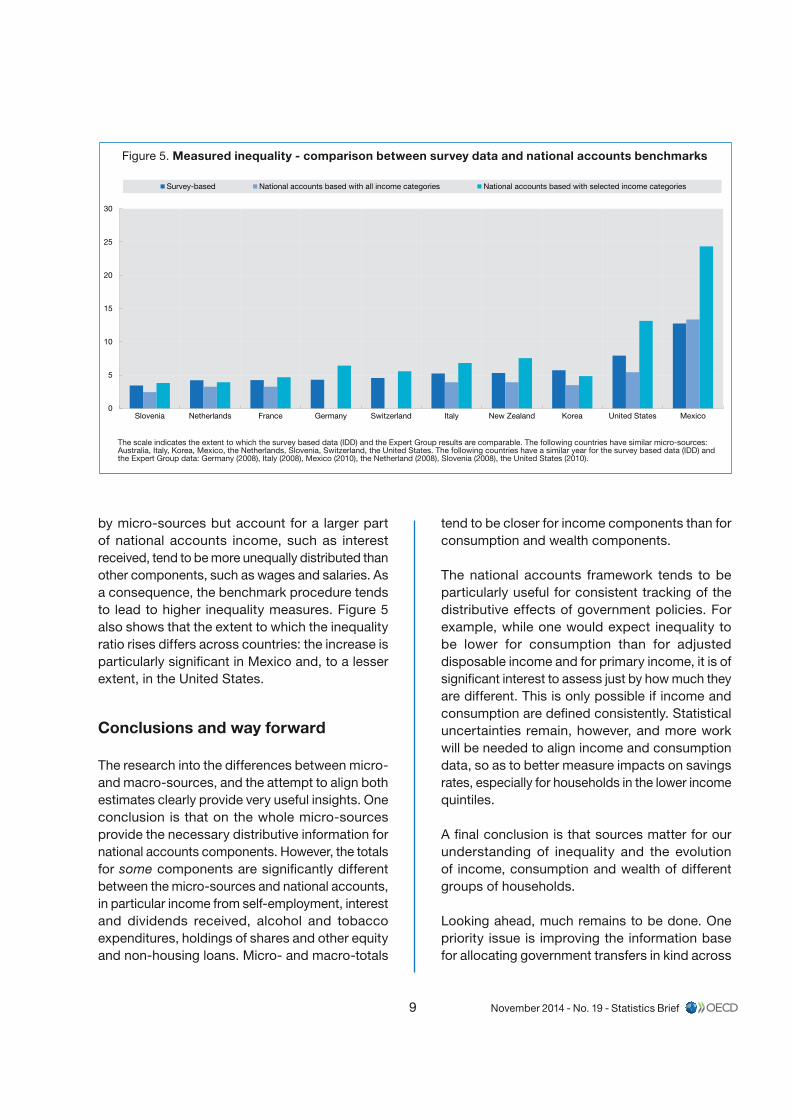
An obvious question is whether the integration of micro-surveys with national accounts affects indicators of distribution and inequality. The OECD Income Distribution Database (IDD)15 provides comparable sets of data on income distribution across OECD countries. This database entirely relies on micro-sources, mainly household surveys and is the standard source for OECD measures of income inequality. It is used here for the comparison of inequality indicators with those benchmarked against the national accounts. There are two main reasons why results may differ: (i) the structure of income components is different between sources; (ii) the scope of income components is different between sources. To isolate these two effects, the national accounts benchmarked results are shown with and without income categories that are largely excluded from micro-surveys: income from owner-occupied dwellings, imputed banking services, social transfers in kind, and property income attributed to insurance policy holders. Figure 5 then compares the ratio of the average income of the richest 20% of households to the average income for the poorest 20% of households
across data sources. Results are shown (i) for pure survey-based information, sourced from the IDD; (ii) for information benchmarked to national accounts but excluding national accounts specific income categories; and (iii) for information benchmarked tonational accounts including all income categories.
As it becomes clear from Figure 5, differences can be substantive in several cases16. Most countries have national accounts based income disparities that are lower than survey-based figures, mainly due to the inclusion of social transfers in kind in the national accounts computation. This reflects the difference in scope and, as would be expected, including the income equivalent of health or education services provided by government for free or at reduced prices decreases inequalities.
However, once the national accounts specific income concepts are excluded, the inequality ratio turns out to be higher in the survey-based results, with the exception of the Netherlands and Korea. This reflects the difference in income structure between sources. Again, it is not overly surprising to see the structural effect work in this direction: those income components that are poorly covered
-100
-80
-60
-40
-20
0
20
40
60
Q1 Q2 Q3 Q4 Q5
Australia 2009-10 France 2003 Korea 2009 Mexico 2010 Netherlands 2008 New Zealand 2006/07 Slovenia 2008 United States 2010%
-
Figure 4. Saving as a percentage of adjusted disposable income per quintile
9 November 2014 - No. 19 - Statistics Brief
by micro-sources but account for a larger part of national accounts income, such as interest received, tend to be more unequally distributed than other components, such as wages and salaries. As a consequence, the benchmark procedure tends to lead to higher inequality measures. Figure 5 also shows that the extent to which the inequality ratio rises differs across countries: the increase is particularly significant in Mexico and, to a lesser extent, in the United States.
Conclusions and way forward
The research into the differences between micro- and macro-sources, and the attempt to align both estimates clearly provide very useful insights. One conclusion is that on the whole micro-sources provide the necessary distributive information for national accounts components. However, the totals for some components are significantly different between the micro-sources and national accounts, in particular income from self-employment, interest and dividends received, alcohol and tobacco expenditures, holdings of shares and other equity and non-housing loans. Micro- and macro-totals
tend to be closer for income components than for consumption and wealth components.
The national accounts framework tends to be particularly useful for consistent tracking of the distributive effects of government policies. For example, while one would expect inequality to be lower for consumption than for adjusted disposable income and for primary income, it is of significant interest to assess just by how much they are different. This is only possible if income and consumption are defined consistently. Statistical uncertainties remain, however, and more work will be needed to align income and consumption data, so as to better measure impacts on savings rates, especially for households in the lower income quintiles.
A final conclusion is that sources matter for our understanding of inequality and the evolution of income, consumption and wealth of different groups of households.
Looking ahead, much remains to be done. One priority issue is improving the information base for allocating government transfers in kind across
0
5
10
15
20
25
30
Slovenia Netherlands France Germany Switzerland Italy New Zealand Korea United States Mexico
Survey-based National accounts based with all income categories National accounts based with selected income categories
Figure 5. Measured inequality - comparison between survey data and national accounts benchmarks
The scale indicates the extent to which the survey based data (IDD) and the Expert Group results are comparable. The following countries have similar micro-sources: Australia, Italy, Korea, Mexico, the Netherlands, Slovenia, Switzerland, the United States. The following countries have a similar year for the survey based data (IDD) and the Expert Group data: Germany (2008), Italy (2008), Mexico (2010), the Netherland (2008), Slovenia (2008), the United States (2010).
10Statistics Brief - November 2014 - No. 19
household groups – current estimates are still based on assumptions that need further testing. Another priority task is carrying out computations for more than one year so as to allow for comparisons in time. Finally, if distributional measures in the national accounts should ever become a “headline” figure, they have to be produced regularly and in a timely fashion. This will require devising new methods to combine timely macro-data with less timely distributional information from micro-sources.
At the institutional and organisational level, countries are encouraged to strengthen interaction between micro and macro compilers. The integration of distributional information in a national accounts framework can be instrumental in this respect and produce not only new policy-relevant sets of information but also help increasing the quality of existing data, be they in the national accounts or in household surveys.
1. The authors would like to thank Paul Schreyer for his valuable comments and suggestions to the drafting of this Statistics Brief.
2. OECD (2008), Growing Unequal?: Income Distribution and Poverty in OECD Countries, OECD Publishing. http://dx.doi.org/10.1787/9789264044197-en
OECD (2011), Divided We Stand, Why Inequality Keeps Rising, OECD Publishing. http://dx.doi.org/10.1787/9789264119536-en
3. www.oecdbetterlifeinitiative.org
4. OECD (2013), How’s Life? Measuring Well-being, OECD Publishing. http://dx.doi.org/10.1787/9789264121164-en
5. www.stiglitz-sen-fitoussi.fr
6. www.imf.org/external/np/g20/pdf/093012.pdf
7. Handbook on Household Income Statistics by the Canberra Group (2011), www.unece.org/fileadmin/DAM/stats/groups/cgh/Canbera_Handbook_2011_WEB.pdf
8. These are available at: www.oecd.org/statistics/icw-framework.htm and www.oecd.org/statistics/guidelines-for-micro-statistics-on-household-wealth.htm.
9. Overall measures of differences were also computed in the form of average gap indicators, calculated as a weighted average of coverage ratios of the various components of income, consumption or wealth.
10. Adjusted disposable income reflects the income available to households once account is taken of current transfers (taxes, social contributions, cash transfers) and ‘social transfers in kind’, i.e., the services provided by government for free or at reduced prices – typically health, education and housing services.
11. Other groupings were by main source of income and by household type. For the income quintile grouping households were ranked according to the value of their equivalised disposable income and
allocated to five equal groups (quintiles), each of them containing 20% of all households. The Oxford-modified equivalence scale (also called the OECD-modified scale) has been used to calculate equivalised disposable income. This scale assigns a value of 1 to the household head, of 0.5 to each additional adult member and of 0.3 to each child.
12. Saving is the difference between adjusted disposable income and actual consumption plus the change in net equity of households in pension funds. The adjustment for net equity in pension funds is made, to arrive at a measure that includes savings made via participation in (partially) funded pension schemes.
13. Prior to the use of the household budget survey to distribute the national accounts totals, the French experts corrected the microdata. Thus, the income level of the households who declared to consume much more than they earn and declared having no financial difficulty were corrected to ensure that their income level covers their level of expenditure. Without this correction on the microdata the average saving rate of the first quintile would be negative as well.
14. A more subtle statistical reason for possible overestimation of dis-saving in the lowest quintile is possible inconsistencies between micro-sources on income and on consumption. If the household income rankings used in the calculation of consumption variables are less accurate than the household rankings for disposable income, then the consumption of higher income households would erroneously show up in the lowest quintile and push up the estimates of the consumption variables. That said, three countries in the sample (Korea, New Zealand, Mexico) use a single survey for consumption and income and still show significant negative savings rates in the lowest quintile.
15. See www.oecd.org/social/income-distribution-database.htm
16. Some caution regarding the interpretation of the results is warranted. For example, the national micro-source used by the EG DNA may be different from the one used in IDD. The data may also relate to a different year. Moreover the IDD indicators have individuals as a starting point. Each individual is given the equivalised income of his/her household. Instead, the EG DNA analyses households. If the poorest are larger households than the other households, the first quintile in the EG DNA’s study will include more than 20% individuals.
11 November 2014 - No. 19 - Statistics Brief
OECD Guidelines for micro statistics on household wealth
This publication presents an internationally agreed set of guidelines for producing micro statistics on household wealth. It addresses the common conceptual, definitional and practical problems that countries face in producing such statistics, and are meant to improve the comparability of the currently available country data. The Guidelines, prepared by an international expert group working under the auspices of the OECD, propose a set of standard concepts, definitions and classifications for micro wealth statistics, and cover different phases in the statistical production process, including sources and methods for measuring particular forms of wealth, best practice in using household surveys or other sources to compile wealth statistics, the development
of analytic measures, the dissemination of data, and data quality assurance.
OECD (2013), OECD Guidelines for Micro Statistics on Household Wealth, OECD Publishing. www.oecd.org/statistics/guidelines-for-micro-statistics-on-household-wealth.htm
OECD Framework for statistics on the distribution of household income, consumption, and wealth
This publication presents an internationally agreed framework to support the joint analysis of micro-level statistics on household income, consumption and wealth. Its aim is to extend the existing international frameworks for measuring household income and consumption at the micro level to include wealth, and describes income, consumption and wealth as three separate but interrelated dimensions of people’s economic well-being. The framework, prepared by an international expert group working under the auspices of the OECD, is intended to assist national statistical offices and other data producers to develop data sets at the household level that are suitable for integrated analysis, and for facilitating comparisons between countries. The Framework is
widely applicable, with relevance to countries that are at different stages of statistical development, that have different statistical infrastructures, and that operate in different economic and social environments.
OECD (2013), OECD Framework for Statistics on the Distribution of Household Income, Consumption and Wealth, OECD Publishing. www.oecd.org/statistics/icw-framework.htm
The Framework and the Guidelines have been produced as part of the OECD Better Life Initiative, a pioneering project launched in 2011, with the objective to measure society’s progress across eleven domains of well-being, ranging from jobs, health and housing, through to civic engagement and the environment.
November 2014 - No. 19 - Statistics Brief12
The Statistics Brief is published by the OECD Statistics Directorate.
This issue and previous issues can be downloaded from the OECD website at: www.oecd.org/std/statisticsbrief
Editor in chief: Martine Durand Editor: David Brackfield Editorial Team: Maryse Fesseau, Peter van de Ven Technical support: Sonia Primot
For further information contact the Editor at [email protected]
Further reading
» Fesseau, M. and M. L. Mattonetti (2013), “Distributional Measures Across Household Groups in a National Accounts Framework: Results from an Experimental Cross-country Exercise on Household Income, Consumption and Saving”, OECD Statistics Working Papers, No. 2013/04, OECD Publishing. http://dx.doi.org/10.1787/5k3wdjqr775f-en
» Fesseau, M., F. Wolff and M. L. Mattonetti (2013), “A Cross-country Comparison of Household Income, Consumption and Wealth between Micro Sources and National Accounts Aggregates”, OECD Statistics Working Papers, No. 2013/03, OECD Publishing. http://dx.doi.org/10.1787/5k3wdjrnh7mv-en
» OECD (2013), OECD Framework for Statistics on the Distribution of Household Income, Consumption and Wealth, OECD Publishing. www.oecd.org/statistics/icw-framework.htm
» OECD (2013), OECD Guidelines for Micro Statistics on Household Wealth, OECD Publishing. www.oecd.org/statistics/guidelines-for-micro-statistics-on-household-wealth.htm
» OECD (2013), How’s Life? Measuring Well-being, OECD Publishing. http://dx.doi.org/10.1787/9789264121164-en
» OECD Better Life Initiative, www.oecdbetterlifeinitiative.org
» OECD (2008), Growing Unequal?: Income Distribution and Poverty in OECD Countries, OECD Publishing. http://dx.doi.org/10.1787/9789264044197-en
» OECD (2011), Divided We Stand, Why Inequality Keeps Rising, OECD Publishing. http://dx.doi.org/10.1787/9789264119536-en
» Stiglitz, J., A. Sen, and J-P. Fitoussi (2009), “Report of the Commission on the Measurement of Economic Performance and Social Progress”, www.stiglitz-sen-fitoussi.fr
» IMF and FSB (2012), Progress Report on the G-20 Data Gaps Initiative: Status, Action Plans, and Timetables, www.imf.org/external/np/g20/pdf/093012.pdf
» Handbook on Household Income Statistics by the Canberra Group (2011), www.unece.org/fileadmin/DAM/stats/groups/cgh/Canbera_Handbook_2011_WEB.pdf
» OECD Income and Distribution Database (IDD), www.oecd.org/social/income-distribution-database.htm
STATISTICS BRIEF