Embed Size (px)
Citation preview

ww
Organisation for Economic Co-operation and Development
STATISTICS BRIEF
New standards for compiling national accounts: what’s the impact on GDP and other macro-economic indicators?by Peter van de Ven1
In 2009, the United Nations Statistical Commission endorsed a revised set of international standards for the compilation of national accounts: the System of National Accounts (SNA) 20082, replacing the 1993 version of the SNA. This was followed by a revision of the European equivalent of the SNA, the European System of Accounts (ESA) 20103. Although more detailed and more precise in its definitions of transactions and positions, the latter standards are, with a few exceptions, fully compatible with the SNA 20084.
By December 2014, most OECD countries had implemented the new standards. The actual implementation however varied depending on country circumstances. Australia already changed over to the new standards in 2009, followed by Canada, in 2012, and Israel, Mexico and the United States, in 2013. In the course of 2014, Korea implemented the standards, whereas EU countries, including Iceland and Switzerland, changed over in September and early October 2014, in line with the EU legislation on the implementation of the ESA 2010. Norway and New Zealand followed in November 2014. Turkey has indicated that they will publish their results in 2015, while Chile and Japan will close the ranks of OECD countries in 2016.
Section 2 of this Statistics Brief briefly explains the quantitatively most important conceptual changes in the international standards for compiling national accounts: enlarging the capital base with Research and Development (R&D) and military weapon systems; the recording of pension entitlements; the classification of head offices, holding companies and Special Purpose Entities (SPEs); and some of the changes related to globalisation. Although quantitatively less important, attention is also paid to the heavily disputed measurement of financial services. In section 3, the impact of the changeover on main economic indicators, like Gross Domestic Product (GDP) and Net National Income (NNI), are presented.
The primary goal of national accounts is the compilation of macro-economic aggregates that are consistent over time. For this reason, national accounts typically try to avoid the regular introduction of changes in standards, data sources and methodologies that would affect over-time consistency. Newly developed source data and latest available methodologies are only introduced when compiling a new
February 2015 - No. 20
2 The main changes in the international standards
Enlarging the capital base: Research and Development (R&D)
Enlarging the capital base: military weapons systems
Accounting for pensions
Head offices, holding companies and Special Purpose Entities (SPEs)
Goods for processing and merchanting
The measurement of financial services
7 Impact of the changeover to the SNA 2008 and of the statistical benchmark revisions
Overall impact on GDP levels
Overall impact on GDP growth
Overall impact on NNI levels
Overall impact on households’ saving rates
12 Illegal activities
14 Concluding remarks
2Statistics Brief - February 2015 - No. 20
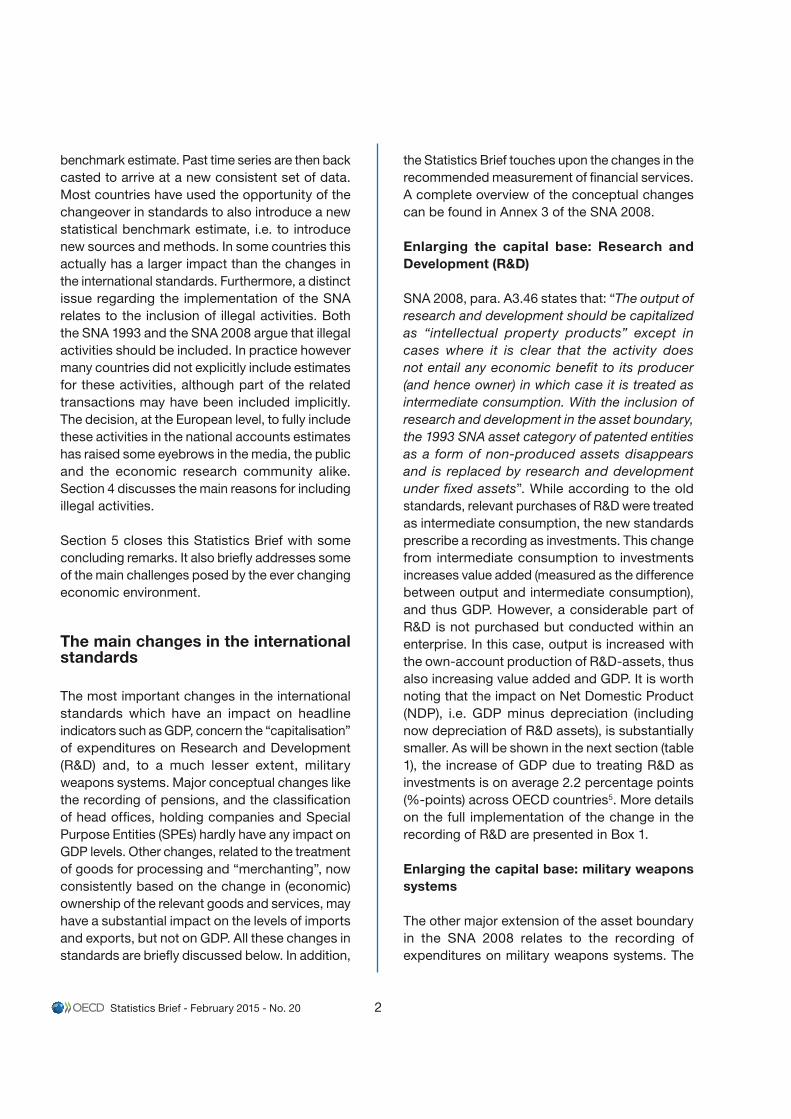
benchmark estimate. Past time series are then back casted to arrive at a new consistent set of data. Most countries have used the opportunity of the changeover in standards to also introduce a new statistical benchmark estimate, i.e. to introduce new sources and methods. In some countries this actually has a larger impact than the changes in the international standards. Furthermore, a distinct issue regarding the implementation of the SNA relates to the inclusion of illegal activities. Both the SNA 1993 and the SNA 2008 argue that illegal activities should be included. In practice however many countries did not explicitly include estimates for these activities, although part of the related transactions may have been included implicitly. The decision, at the European level, to fully include these activities in the national accounts estimates has raised some eyebrows in the media, the public and the economic research community alike. Section 4 discusses the main reasons for including illegal activities.
Section 5 closes this Statistics Brief with some concluding remarks. It also briefly addresses some of the main challenges posed by the ever changing economic environment.
The main changes in the international standards
The most important changes in the international standards which have an impact on headline indicators such as GDP, concern the “capitalisation” of expenditures on Research and Development (R&D) and, to a much lesser extent, military weapons systems. Major conceptual changes like the recording of pensions, and the classification of head offices, holding companies and Special Purpose Entities (SPEs) hardly have any impact on GDP levels. Other changes, related to the treatment of goods for processing and “merchanting”, now consistently based on the change in (economic) ownership of the relevant goods and services, may have a substantial impact on the levels of imports and exports, but not on GDP. All these changes in standards are briefly discussed below. In addition,
the Statistics Brief touches upon the changes in the recommended measurement of financial services. A complete overview of the conceptual changes can be found in Annex 3 of the SNA 2008.
Enlarging the capital base: Research and Development (R&D)
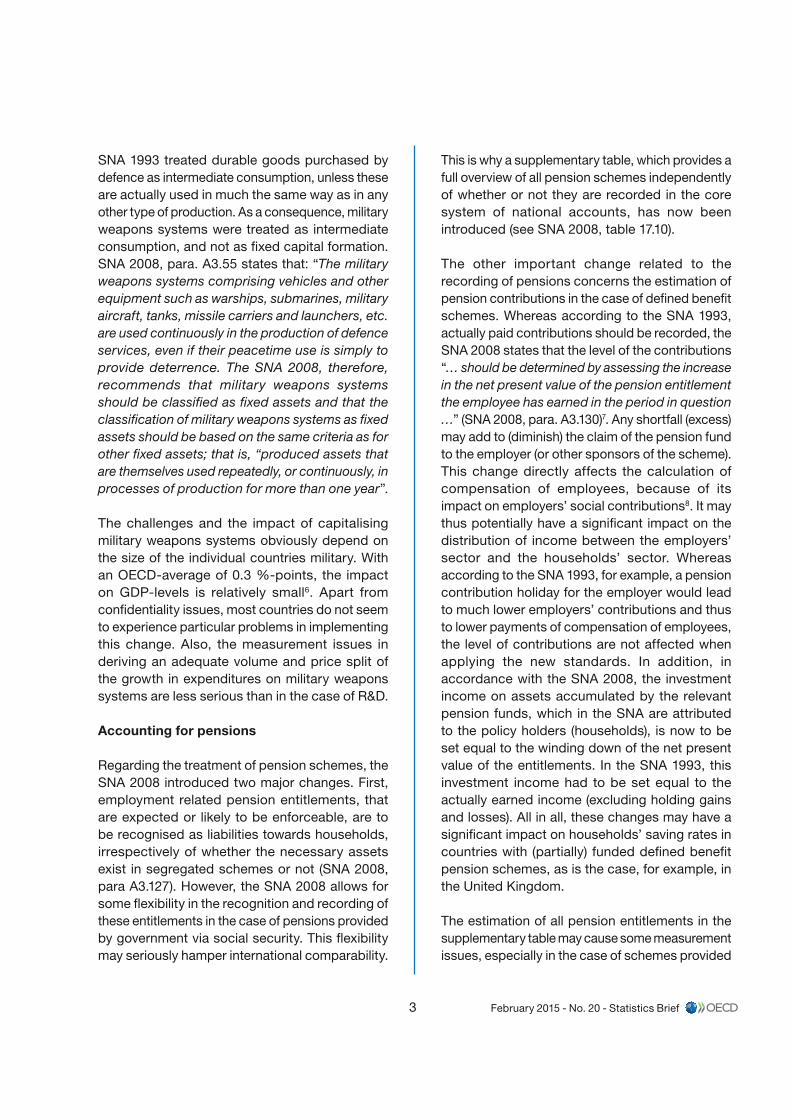
SNA 2008, para. A3.46 states that: “The output of research and development should be capitalized as “intellectual property products” except in cases where it is clear that the activity does not entail any economic benefit to its producer (and hence owner) in which case it is treated as intermediate consumption. With the inclusion of research and development in the asset boundary, the 1993 SNA asset category of patented entities as a form of non-produced assets disappears and is replaced by research and development under fixed assets”. While according to the old standards, relevant purchases of R&D were treated as intermediate consumption, the new standards prescribe a recording as investments. This change from intermediate consumption to investments increases value added (measured as the difference between output and intermediate consumption), and thus GDP. However, a considerable part of R&D is not purchased but conducted within an enterprise. In this case, output is increased with the own-account production of R&D-assets, thus also increasing value added and GDP. It is worth noting that the impact on Net Domestic Product (NDP), i.e. GDP minus depreciation (including now depreciation of R&D assets), is substantially smaller. As will be shown in the next section (table 1), the increase of GDP due to treating R&D as investments is on average 2.2 percentage points (%-points) across OECD countries5. More details on the full implementation of the change in the recording of R&D are presented in Box 1.
Enlarging the capital base: military weapons systems
The other major extension of the asset boundary in the SNA 2008 relates to the recording of expenditures on military weapons systems. The
3 February 2015 - No. 20 - Statistics Brief
SNA 1993 treated durable goods purchased by defence as intermediate consumption, unless these are actually used in much the same way as in any other type of production. As a consequence, military weapons systems were treated as intermediate consumption, and not as fixed capital formation. SNA 2008, para. A3.55 states that: “The military weapons systems comprising vehicles and other equipment such as warships, submarines, military aircraft, tanks, missile carriers and launchers, etc. are used continuously in the production of defence services, even if their peacetime use is simply to provide deterrence. The SNA 2008, therefore, recommends that military weapons systems should be classified as fixed assets and that the classification of military weapons systems as fixed assets should be based on the same criteria as for other fixed assets; that is, “produced assets that are themselves used repeatedly, or continuously, in processes of production for more than one year”.
The challenges and the impact of capitalising military weapons systems obviously depend on the size of the individual countries military. With an OECD-average of 0.3 %-points, the impact on GDP-levels is relatively small6. Apart from confidentiality issues, most countries do not seem to experience particular problems in implementing this change. Also, the measurement issues in deriving an adequate volume and price split of the growth in expenditures on military weapons systems are less serious than in the case of R&D.
Accounting for pensions
Regarding the treatment of pension schemes, the SNA 2008 introduced two major changes. First, employment related pension entitlements, that are expected or likely to be enforceable, are to be recognised as liabilities towards households, irrespectively of whether the necessary assets exist in segregated schemes or not (SNA 2008, para A3.127). However, the SNA 2008 allows for some flexibility in the recognition and recording of these entitlements in the case of pensions provided by government via social security. This flexibility may seriously hamper international comparability.
This is why a supplementary table, which provides a full overview of all pension schemes independently of whether or not they are recorded in the core system of national accounts, has now been introduced (see SNA 2008, table 17.10).
The other important change related to the recording of pensions concerns the estimation of pension contributions in the case of defined benefit schemes. Whereas according to the SNA 1993, actually paid contributions should be recorded, the SNA 2008 states that the level of the contributions “… should be determined by assessing the increase in the net present value of the pension entitlement the employee has earned in the period in question …” (SNA 2008, para. A3.130)7. Any shortfall (excess) may add to (diminish) the claim of the pension fund to the employer (or other sponsors of the scheme). This change directly affects the calculation of compensation of employees, because of its impact on employers’ social contributions8. It may thus potentially have a significant impact on the distribution of income between the employers’ sector and the households’ sector. Whereas according to the SNA 1993, for example, a pension contribution holiday for the employer would lead to much lower employers’ contributions and thus to lower payments of compensation of employees, the level of contributions are not affected when applying the new standards. In addition, in accordance with the SNA 2008, the investment income on assets accumulated by the relevant pension funds, which in the SNA are attributed to the policy holders (households), is now to be set equal to the winding down of the net present value of the entitlements. In the SNA 1993, this investment income had to be set equal to the actually earned income (excluding holding gains and losses). All in all, these changes may have a significant impact on households’ saving rates in countries with (partially) funded defined benefit pension schemes, as is the case, for example, in the United Kingdom.
The estimation of all pension entitlements in the supplementary table may cause some measurement issues, especially in the case of schemes provided
4Statistics Brief - February 2015 - No. 20
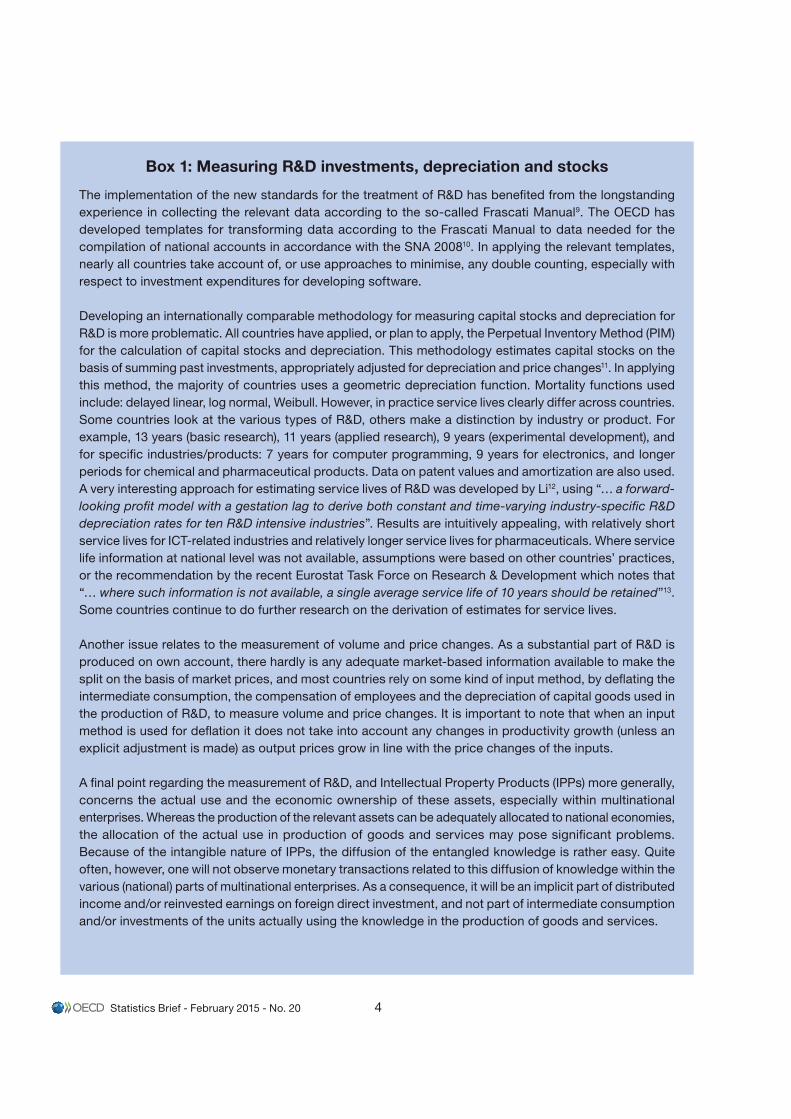
Box 1: Measuring R&D investments, depreciation and stocks
The implementation of the new standards for the treatment of R&D has benefited from the longstanding experience in collecting the relevant data according to the so-called Frascati Manual9. The OECD has developed templates for transforming data according to the Frascati Manual to data needed for the compilation of national accounts in accordance with the SNA 200810. In applying the relevant templates, nearly all countries take account of, or use approaches to minimise, any double counting, especially with respect to investment expenditures for developing software.
Developing an internationally comparable methodology for measuring capital stocks and depreciation for R&D is more problematic. All countries have applied, or plan to apply, the Perpetual Inventory Method (PIM) for the calculation of capital stocks and depreciation. This methodology estimates capital stocks on the basis of summing past investments, appropriately adjusted for depreciation and price changes11. In applying this method, the majority of countries uses a geometric depreciation function. Mortality functions used include: delayed linear, log normal, Weibull. However, in practice service lives clearly differ across countries. Some countries look at the various types of R&D, others make a distinction by industry or product. For example, 13 years (basic research), 11 years (applied research), 9 years (experimental development), and for specific industries/products: 7 years for computer programming, 9 years for electronics, and longer periods for chemical and pharmaceutical products. Data on patent values and amortization are also used. A very interesting approach for estimating service lives of R&D was developed by Li12, using “… a forward-looking profit model with a gestation lag to derive both constant and time-varying industry-specific R&D depreciation rates for ten R&D intensive industries”. Results are intuitively appealing, with relatively short service lives for ICT-related industries and relatively longer service lives for pharmaceuticals. Where service life information at national level was not available, assumptions were based on other countries’ practices, or the recommendation by the recent Eurostat Task Force on Research & Development which notes that “… where such information is not available, a single average service life of 10 years should be retained”13. Some countries continue to do further research on the derivation of estimates for service lives.
Another issue relates to the measurement of volume and price changes. As a substantial part of R&D is produced on own account, there hardly is any adequate market-based information available to make the split on the basis of market prices, and most countries rely on some kind of input method, by deflating the intermediate consumption, the compensation of employees and the depreciation of capital goods used in the production of R&D, to measure volume and price changes. It is important to note that when an input method is used for deflation it does not take into account any changes in productivity growth (unless an explicit adjustment is made) as output prices grow in line with the price changes of the inputs.
A final point regarding the measurement of R&D, and Intellectual Property Products (IPPs) more generally, concerns the actual use and the economic ownership of these assets, especially within multinational enterprises. Whereas the production of the relevant assets can be adequately allocated to national economies, the allocation of the actual use in production of goods and services may pose significant problems. Because of the intangible nature of IPPs, the diffusion of the entangled knowledge is rather easy. Quite often, however, one will not observe monetary transactions related to this diffusion of knowledge within the various (national) parts of multinational enterprises. As a consequence, it will be an implicit part of distributed income and/or reinvested earnings on foreign direct investment, and not part of intermediate consumption and/or investments of the units actually using the knowledge in the production of goods and services.
5 February 2015 - No. 20 - Statistics Brief
by government via social security, for which actuarial estimates are usually not available and source information underlying the methodology for compiling such estimates is often (still) lacking. More generally, as these entitlements are usually based on an estimation of the net present value of future pension benefits, an important decision, which may have a very significant impact on the results, concerns the discount rate to be applied in the estimation procedure. One also needs to decide upon the type of entitlements to be calculated: the entitlements accrued up to a particular point in time (accrued benefit obligations, ABO) versus projected benefit obligations (PBO) which also take into account average increases in future earnings. Substantial work on these and related issues is ongoing. Within the European Union, it has been agreed that this information has to be provided on a mandatory basis starting 2017. For non-EU OECD countries, a similar timeline is targeted. As the institutional set-up of pension schemes differs widely across countries and estimates of pension entitlements heavily depend on the assumptions used for the estimations, it has also been agreed to provide more extensive fact sheets including adequate metadata for the purpose of international comparison.
More generally, in view of ageing societies, the topic of financial sustainability of pension arrangements is expected to get more and more prominence on the policy agenda of many countries, thus the importance of having adequate and reliable data at a macro-level.
Head offices, holding companies and Special Purpose Entities (SPEs)
The SNA 2008 also introduced a substantial change in the classification of holding companies. When recognised as separate institutional units, these companies are to be allocated to the financial corporations’ sector, instead of being allocated to the sector of the predominant activities of the related parents/subsidiaries. This change does not affect GDP levels, but it may have a significant impact on, for example, the debt levels of the
various institutional sectors, at a time, in the aftermath of the financial crisis, when debt related indicators have gained much more attention.
In addition, the SNA 2008 explicitly recognises and provides further guidance on the recording of Special Purpose Entities (SPEs); see para. 4.55-58. In this respect, the term “SPEs” is restricted to those units that are ultimately controlled by a non-resident parent, directly or indirectly, with no or few employees, and whose core business consists of group financing or holding activities, i.e. channelling of funds from non-residents to other non-residents. In some countries, these units’ balance sheets and related income flows can be very substantial. It has therefore been recommended, for analytical purposes, to present certain national accounts data including and excluding SPEs. In addition, recommendations were also made on the typology, classification and recording of common types of SPE type of units, such as shell companies, units for holding and managing assets of individuals and families, securitisation companies, conduits, royalty and licensing companies, captive leasing companies, factoring and invoicing companies, etc.
More detailed guidance on the treatment of holdings and SPEs can be found under the following link: http://unstats.un.org/unsd/nationalaccount/aeg/2013/M8b-3.pdf, and in SNA News and Notes, Number 37: http://unstats.un.org/unsd/nationalaccount/sna/nn37-en.pdf.
Goods for processing and merchanting
The SNA 2008 contains two important changes affecting the recording of international trade flows. These changes may have a significant impact on the resulting national accounts aggregates for imports and exports of goods and services, but from a purely conceptual point of view they do not affect GDP levels14. The first of these changes concerns goods for processing. Processing relates to an activity in which goods are sent abroad for assembly, packing, labelling, or processing more generally by an entity that typically does not own

6Statistics Brief - February 2015 - No. 20
value of 80. In addition, the imports of country A from country B are to be recorded not as positive imports, but as negative exports from country A to country B, to prevent imports and exports of goods to be in� ated by wholesale trading. Figure 2 illustrates this change.
The above changes to the recording of imports and exports based on change in (economic) ownership are better aligned to business accounting. On the other hand, however, this new approach introduces important changes to the traditional merchandise trade statistics which are usually based on the physical movement of goods crossing the borders. Furthermore, the appropriate recording of goods for processing and merchanting, especially at a time of growing international fragmentation of production processes, requires dedicated surveying of the relevant internationally operating enterprises. More guidance is provided in the Guide on the Impact of Globalisation on National Accounts15. Additional in-depth work on the recording and measurement of global production arrangements is being pursued, the results of which will become available in the � rst half of 201516.
the goods concerned. It has now been agreed to always record the transfers of these goods, both before and after processing, on the basis of a change in (economic) ownership. Only in the case of a change in ownership, the exports of goods to be processed as well as the (higher valued) imports of the processed goods are recorded (on a gross basis). If no change in ownership occurs, the difference of the two � ows is to be recorded as imports of processing services. This change is graphically represented in Figure 1.
The other change in recording relates to “merchanting”. This activity concerns wholesale trade in which a domestic trader in country A purchases goods in country B to re-sell them in country C. The SNA 1993 did not provide speci� c guidance on the recording of merchanting, but the imports of such goods into country C (e.g. at the value of 80), were implicitly recorded as exports from country B (e.g. at the value of 50), supplemented by exports of wholesale services from country A for the difference between the selling and purchasing value (30). This resulted in an asymmetric recording at the worldwide level for goods and services. According to the SNA 2008, as in the case of goods for processing, imports and exports of goods related to merchanting have to be recorded on the basis of a change in (economic) ownership. As a consequence, the relevant goods are to be recorded as exports from country B to country A (the country in which the merchant is resident), at the value of 50, and subsequently as exports from country A to country C, at the
Figure 1
SNA 1993 recording (“gross”)
SNA 2008 recording (“net”), based on change in ownership
ProcessorPrincipalExports of goods (50)
Imports of goods (80)
Principal ProcessorImports of services (30)
Figure 2
SNA 1993 recording services
SNA 2008 recording (negative) goods
Merchant in country A
Exports of goods (50)
Merchant in country A
Exports of goods (80)
Country B
Country CExports of services (30)
Country B
Country C
Imports of goods, recorded as negative exports (-50)
7 February 2015 - No. 20 - Statistics Brief
The measurement of financial services
Financial services comprise services provided by banks and other financial intermediaries and services provided by insurance corporations. Several changes have been made to the recording and measurement of these services. Most of them only have a minor impact on GDP and other macro-economic indicators. The first change worth mentioning relates to the provision of explicit guidance on the treatment of the output of central banks. The SNA 2008 more clearly distinguishes between the various types of central bank output: financial intermediation, monetary policy services, and supervisory services. The first type of service is to be considered as market output, the second type as non-market output to be measured at the sum of costs, whereas the treatment of supervisory services depends on whether or not fees are charged that are sufficient to cover the costs of providing these services. In some cases, the measurement of the first type of services, the financial intermediation services of central banks, poses significant problems, in the sense that the typical measurement of these services on the basis of the difference between a reference rate and the actual interest rate may result in very volatile and sometimes negative estimates of output. If this shows to be the case, the SNA 2008 explicitly recommends to value the total output of central banks at the sum of costs. Furthermore, the new standards explicitly recommend that government is to be considered as the user of these services17. More information on the treatment of central banks can be found in the SNA 2008, para. 6.151-156, para. 7.122-126, and para. A3.28-31.
Another change relates to the enlargement of the definition of financial services. The SNA 2008 is more explicit in stating that financial services also include monitoring services, convenience services, liquidity provision, risk assumption, underwriting and trading services. Furthermore, the method for calculating the so-called Financial Intermediation Services Indirectly Measured (FISIM) has been refined. Whereas the SNA 1993 calculated FISIM as the difference between property income receivable
(excluding that part which was receivable from the investment of own funds) and interest payable of financial intermediaries, the SNA 2008 clearly limits the extent of FISIM to loans and deposits provided by the financial intermediaries. In the aftermath of the 2008 economic and financial crisis, the measurement of these services has become an issue of considerable public debate, some researchers and columnists arguing that the present methodology for measuring financial services leads to a serious overestimation of the value added generated by the financial industry. Box 2 provides some of the details regarding the measurement of FISIM.
Finally, the standards for measuring non-life insurance services have been changed in the SNA 2008. The past method, according to the SNA 1993, computes the output of non-life insurance services as the difference between premiums received (including investment income on insurance technical reserves) and claims paid. However, in the occurrence of catastrophic events which can result in unexpectedly high claims, this method led to counterintuitively volatile and even negative output. Therefore, the SNA 2008 now recommends the use of “adjusted claims” in the calculation of non-life insurance output, whereby the adjusted claims may be based on expected claims, usually derived from a long-term moving average of actual claims paid, or on an accounting approach taking into account changes in equalisation provisions.
Impact of the changeover to the SNA 2008 and of the statistical benchmark revisions
This section summarises the impact of the changeover from the SNA 1993 to the SNA 2008. As stated before, the impact of the recent benchmark revision usually is not confined to the changes in the international standards, as most countries have used this window of opportunity to also undertake a “statistical” benchmark revision, by including newly developed and/or enhanced data sources, and by improving the methodologies
8Statistics Brief - February 2015 - No. 20
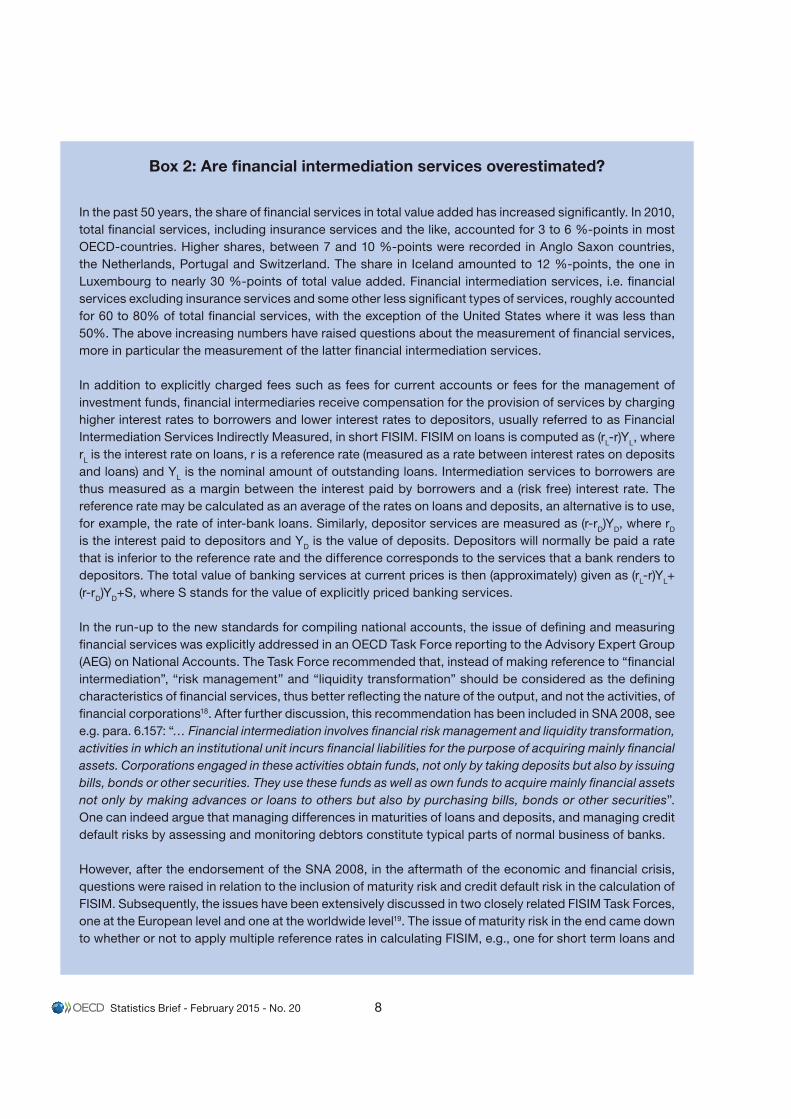
Box 2: Are financial intermediation services overestimated?
In the past 50 years, the share of financial services in total value added has increased significantly. In 2010, total financial services, including insurance services and the like, accounted for 3 to 6 %-points in most OECD-countries. Higher shares, between 7 and 10 %-points were recorded in Anglo Saxon countries, the Netherlands, Portugal and Switzerland. The share in Iceland amounted to 12 %-points, the one in Luxembourg to nearly 30 %-points of total value added. Financial intermediation services, i.e. financial services excluding insurance services and some other less significant types of services, roughly accounted for 60 to 80% of total financial services, with the exception of the United States where it was less than 50%. The above increasing numbers have raised questions about the measurement of financial services, more in particular the measurement of the latter financial intermediation services.
In addition to explicitly charged fees such as fees for current accounts or fees for the management of investment funds, financial intermediaries receive compensation for the provision of services by charging higher interest rates to borrowers and lower interest rates to depositors, usually referred to as Financial Intermediation Services Indirectly Measured, in short FISIM. FISIM on loans is computed as (rL-r)YL, where rL is the interest rate on loans, r is a reference rate (measured as a rate between interest rates on deposits and loans) and YL is the nominal amount of outstanding loans. Intermediation services to borrowers are thus measured as a margin between the interest paid by borrowers and a (risk free) interest rate. The reference rate may be calculated as an average of the rates on loans and deposits, an alternative is to use, for example, the rate of inter-bank loans. Similarly, depositor services are measured as (r-rD)YD, where rD is the interest paid to depositors and YD is the value of deposits. Depositors will normally be paid a rate that is inferior to the reference rate and the difference corresponds to the services that a bank renders to depositors. The total value of banking services at current prices is then (approximately) given as (rL-r)YL+ (r-rD)YD+S, where S stands for the value of explicitly priced banking services.
In the run-up to the new standards for compiling national accounts, the issue of defining and measuring financial services was explicitly addressed in an OECD Task Force reporting to the Advisory Expert Group (AEG) on National Accounts. The Task Force recommended that, instead of making reference to “financial intermediation”, “risk management” and “liquidity transformation” should be considered as the defining characteristics of financial services, thus better reflecting the nature of the output, and not the activities, of financial corporations18. After further discussion, this recommendation has been included in SNA 2008, see e.g. para. 6.157: “… Financial intermediation involves financial risk management and liquidity transformation, activities in which an institutional unit incurs financial liabilities for the purpose of acquiring mainly financial assets. Corporations engaged in these activities obtain funds, not only by taking deposits but also by issuing bills, bonds or other securities. They use these funds as well as own funds to acquire mainly financial assets not only by making advances or loans to others but also by purchasing bills, bonds or other securities”. One can indeed argue that managing differences in maturities of loans and deposits, and managing credit default risks by assessing and monitoring debtors constitute typical parts of normal business of banks.
However, after the endorsement of the SNA 2008, in the aftermath of the economic and financial crisis, questions were raised in relation to the inclusion of maturity risk and credit default risk in the calculation of FISIM. Subsequently, the issues have been extensively discussed in two closely related FISIM Task Forces, one at the European level and one at the worldwide level19. The issue of maturity risk in the end came down to whether or not to apply multiple reference rates in calculating FISIM, e.g., one for short term loans and
9 February 2015 - No. 20 - Statistics Brief
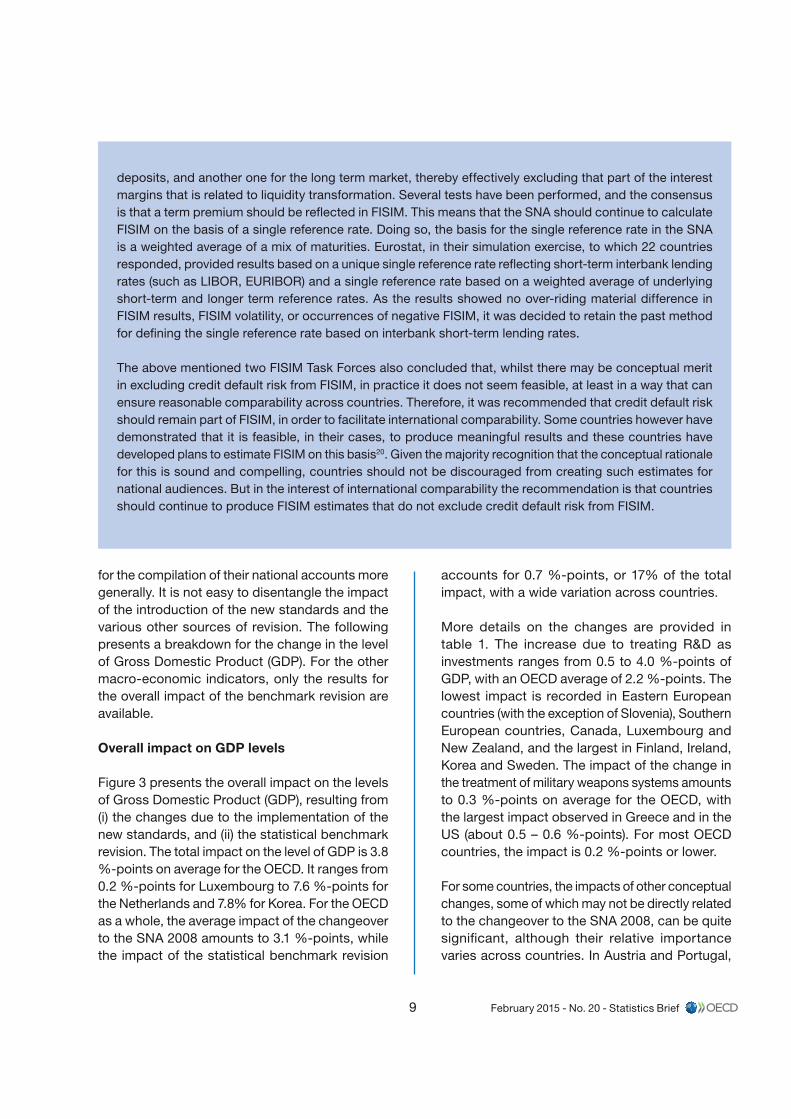
deposits, and another one for the long term market, thereby effectively excluding that part of the interest margins that is related to liquidity transformation. Several tests have been performed, and the consensus is that a term premium should be reflected in FISIM. This means that the SNA should continue to calculate FISIM on the basis of a single reference rate. Doing so, the basis for the single reference rate in the SNA is a weighted average of a mix of maturities. Eurostat, in their simulation exercise, to which 22 countries responded, provided results based on a unique single reference rate reflecting short-term interbank lending rates (such as LIBOR, EURIBOR) and a single reference rate based on a weighted average of underlying short-term and longer term reference rates. As the results showed no over-riding material difference in FISIM results, FISIM volatility, or occurrences of negative FISIM, it was decided to retain the past method for defining the single reference rate based on interbank short-term lending rates.
The above mentioned two FISIM Task Forces also concluded that, whilst there may be conceptual merit in excluding credit default risk from FISIM, in practice it does not seem feasible, at least in a way that can ensure reasonable comparability across countries. Therefore, it was recommended that credit default risk should remain part of FISIM, in order to facilitate international comparability. Some countries however have demonstrated that it is feasible, in their cases, to produce meaningful results and these countries have developed plans to estimate FISIM on this basis20. Given the majority recognition that the conceptual rationale for this is sound and compelling, countries should not be discouraged from creating such estimates for national audiences. But in the interest of international comparability the recommendation is that countries should continue to produce FISIM estimates that do not exclude credit default risk from FISIM.
for the compilation of their national accounts more generally. It is not easy to disentangle the impact of the introduction of the new standards and the various other sources of revision. The following presents a breakdown for the change in the level of Gross Domestic Product (GDP). For the other macro-economic indicators, only the results for the overall impact of the benchmark revision are available.
Overall impact on GDP levels
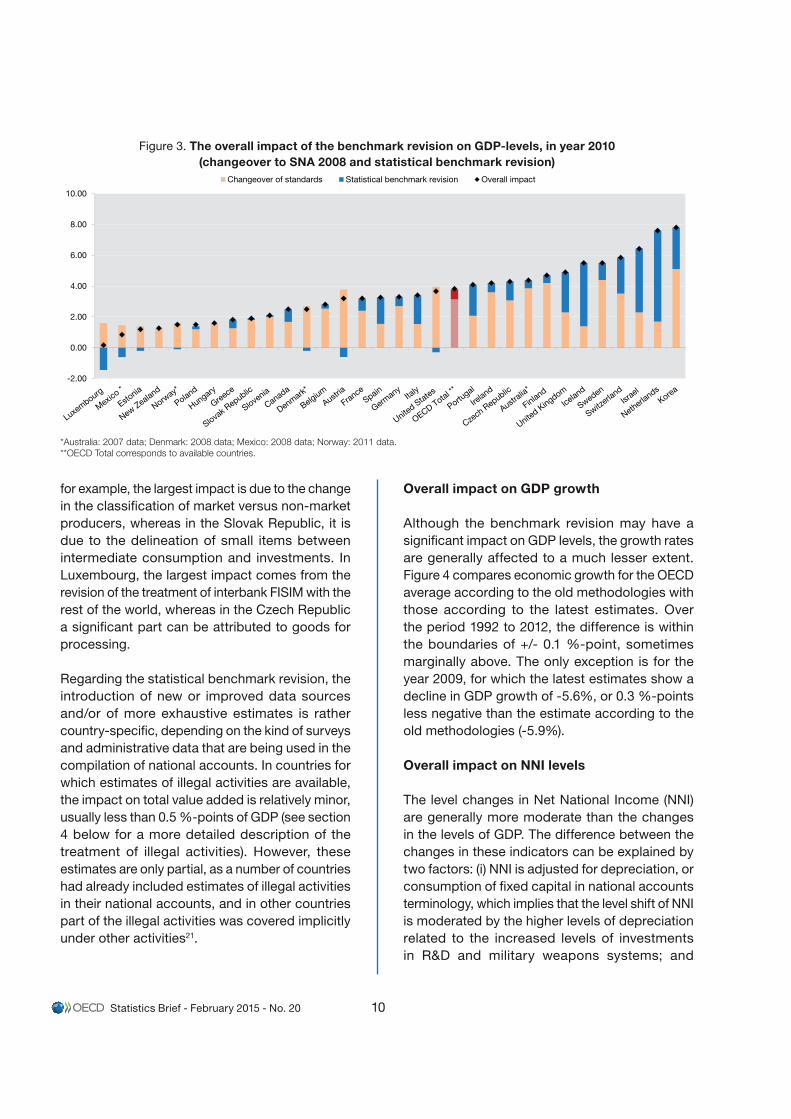
Figure 3 presents the overall impact on the levels of Gross Domestic Product (GDP), resulting from (i) the changes due to the implementation of the new standards, and (ii) the statistical benchmark revision. The total impact on the level of GDP is 3.8 %-points on average for the OECD. It ranges from 0.2 %-points for Luxembourg to 7.6 %-points for the Netherlands and 7.8% for Korea. For the OECD as a whole, the average impact of the changeover to the SNA 2008 amounts to 3.1 %-points, while the impact of the statistical benchmark revision
accounts for 0.7 %-points, or 17% of the total impact, with a wide variation across countries.
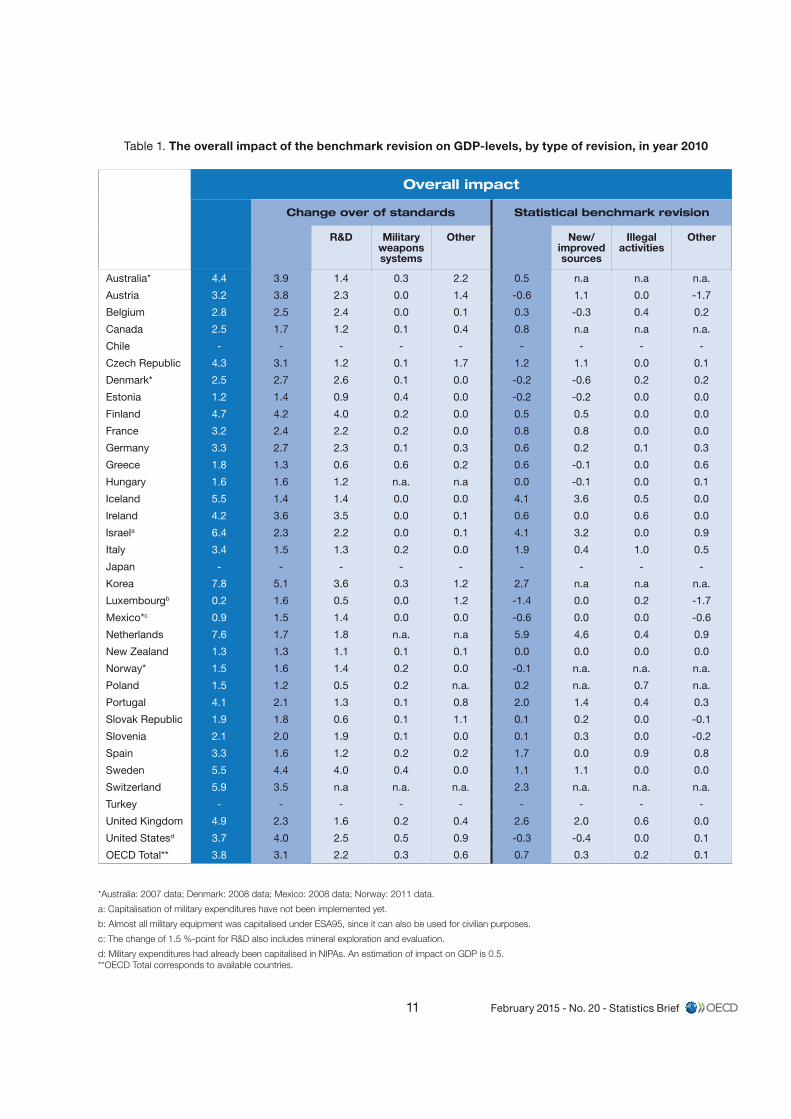
More details on the changes are provided in table 1. The increase due to treating R&D as investments ranges from 0.5 to 4.0 %-points of GDP, with an OECD average of 2.2 %-points. The lowest impact is recorded in Eastern European countries (with the exception of Slovenia), Southern European countries, Canada, Luxembourg and New Zealand, and the largest in Finland, Ireland, Korea and Sweden. The impact of the change in the treatment of military weapons systems amounts to 0.3 %-points on average for the OECD, with the largest impact observed in Greece and in the US (about 0.5 – 0.6 %-points). For most OECD countries, the impact is 0.2 %-points or lower.
For some countries, the impacts of other conceptual changes, some of which may not be directly related to the changeover to the SNA 2008, can be quite significant, although their relative importance varies across countries. In Austria and Portugal,
10Statistics Brief - February 2015 - No. 20
-2.00
0.00
2.00
4.00
6.00
8.00
10.00
Changeover of standards Statistical benchmark revision Overall impact
Figure 3. The overall impact of the benchmark revision on GDP-levels, in year 2010 (changeover to SNA 2008 and statistical benchmark revision)
for example, the largest impact is due to the change in the classification of market versus non-market producers, whereas in the Slovak Republic, it is due to the delineation of small items between intermediate consumption and investments. In Luxembourg, the largest impact comes from the revision of the treatment of interbank FISIM with the rest of the world, whereas in the Czech Republic a significant part can be attributed to goods for processing.
Regarding the statistical benchmark revision, the introduction of new or improved data sources and/or of more exhaustive estimates is rather country-specific, depending on the kind of surveys and administrative data that are being used in the compilation of national accounts. In countries for which estimates of illegal activities are available, the impact on total value added is relatively minor, usually less than 0.5 %-points of GDP (see section 4 below for a more detailed description of the treatment of illegal activities). However, these estimates are only partial, as a number of countries had already included estimates of illegal activities in their national accounts, and in other countries part of the illegal activities was covered implicitly under other activities21.
Overall impact on GDP growth
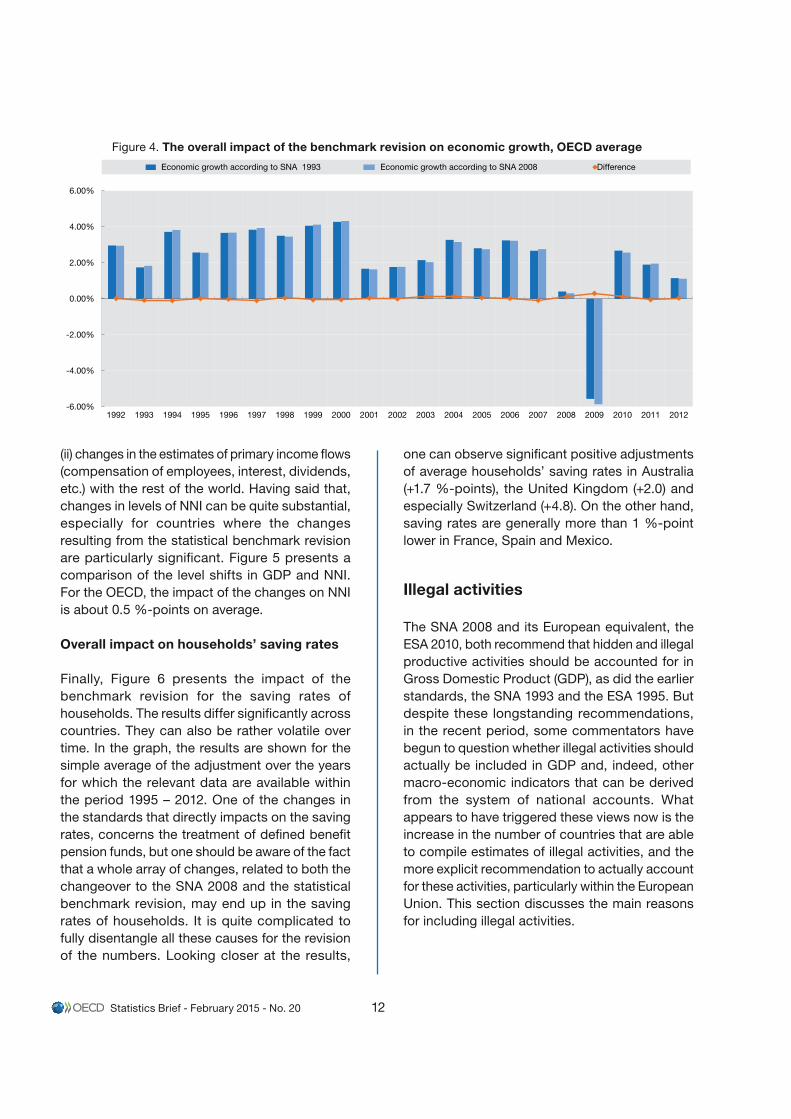
Although the benchmark revision may have a significant impact on GDP levels, the growth rates are generally affected to a much lesser extent. Figure 4 compares economic growth for the OECD average according to the old methodologies with those according to the latest estimates. Over the period 1992 to 2012, the difference is within the boundaries of +/- 0.1 %-point, sometimes marginally above. The only exception is for the year 2009, for which the latest estimates show a decline in GDP growth of -5.6%, or 0.3 %-points less negative than the estimate according to the old methodologies (-5.9%).
Overall impact on NNI levels
The level changes in Net National Income (NNI) are generally more moderate than the changes in the levels of GDP. The difference between the changes in these indicators can be explained by two factors: (i) NNI is adjusted for depreciation, or consumption of fixed capital in national accounts terminology, which implies that the level shift of NNI is moderated by the higher levels of depreciation related to the increased levels of investments in R&D and military weapons systems; and
*Australia: 2007 data; Denmark: 2008 data; Mexico: 2008 data; Norway: 2011 data.**OECD Total corresponds to available countries.
11 February 2015 - No. 20 - Statistics Brief
Table 1. The overall impact of the benchmark revision on GDP-levels, by type of revision, in year 2010
*Australia: 2007 data; Denmark: 2008 data; Mexico: 2008 data; Norway: 2011 data.
a: Capitalisation of military expenditures have not been implemented yet.
b: Almost all military equipment was capitalised under ESA95, since it can also be used for civilian purposes.
c: The change of 1.5 %-point for R&D also includes mineral exploration and evaluation.
d: Military expenditures had already been capitalised in NIPAs. An estimation of impact on GDP is 0.5.**OECD Total corresponds to available countries.
Overall impact
Change over of standards Statistical benchmark revision
R&D Military weapons systems
Other New/improved sources
Illegal activities
Other
Australia* 4.4 3.9 1.4 0.3 2.2 0.5 n.a n.a n.a.
Austria 3.2 3.8 2.3 0.0 1.4 -0.6 1.1 0.0 -1.7
Belgium 2.8 2.5 2.4 0.0 0.1 0.3 -0.3 0.4 0.2
Canada 2.5 1.7 1.2 0.1 0.4 0.8 n.a n.a n.a.
Chile - - - - - - - - -
Czech Republic 4.3 3.1 1.2 0.1 1.7 1.2 1.1 0.0 0.1
Denmark* 2.5 2.7 2.6 0.1 0.0 -0.2 -0.6 0.2 0.2
Estonia 1.2 1.4 0.9 0.4 0.0 -0.2 -0.2 0.0 0.0
Finland 4.7 4.2 4.0 0.2 0.0 0.5 0.5 0.0 0.0
France 3.2 2.4 2.2 0.2 0.0 0.8 0.8 0.0 0.0
Germany 3.3 2.7 2.3 0.1 0.3 0.6 0.2 0.1 0.3
Greece 1.8 1.3 0.6 0.6 0.2 0.6 -0.1 0.0 0.6
Hungary 1.6 1.6 1.2 n.a. n.a 0.0 -0.1 0.0 0.1
Iceland 5.5 1.4 1.4 0.0 0.0 4.1 3.6 0.5 0.0
Ireland 4.2 3.6 3.5 0.0 0.1 0.6 0.0 0.6 0.0
Israela 6.4 2.3 2.2 0.0 0.1 4.1 3.2 0.0 0.9
Italy 3.4 1.5 1.3 0.2 0.0 1.9 0.4 1.0 0.5
Japan - - - - - - - - -
Korea 7.8 5.1 3.6 0.3 1.2 2.7 n.a n.a n.a.
Luxembourgb 0.2 1.6 0.5 0.0 1.2 -1.4 0.0 0.2 -1.7
Mexico*c 0.9 1.5 1.4 0.0 0.0 -0.6 0.0 0.0 -0.6
Netherlands 7.6 1.7 1.8 n.a. n.a 5.9 4.6 0.4 0.9
New Zealand 1.3 1.3 1.1 0.1 0.1 0.0 0.0 0.0 0.0
Norway* 1.5 1.6 1.4 0.2 0.0 -0.1 n.a. n.a. n.a.
Poland 1.5 1.2 0.5 0.2 n.a. 0.2 n.a. 0.7 n.a.
Portugal 4.1 2.1 1.3 0.1 0.8 2.0 1.4 0.4 0.3
Slovak Republic 1.9 1.8 0.6 0.1 1.1 0.1 0.2 0.0 -0.1
Slovenia 2.1 2.0 1.9 0.1 0.0 0.1 0.3 0.0 -0.2
Spain 3.3 1.6 1.2 0.2 0.2 1.7 0.0 0.9 0.8
Sweden 5.5 4.4 4.0 0.4 0.0 1.1 1.1 0.0 0.0
Switzerland 5.9 3.5 n.a n.a. n.a. 2.3 n.a. n.a. n.a.
Turkey - - - - - - - - -
United Kingdom 4.9 2.3 1.6 0.2 0.4 2.6 2.0 0.6 0.0
United Statesd 3.7 4.0 2.5 0.5 0.9 -0.3 -0.4 0.0 0.1
OECD Total** 3.8 3.1 2.2 0.3 0.6 0.7 0.3 0.2 0.1
12Statistics Brief - February 2015 - No. 20
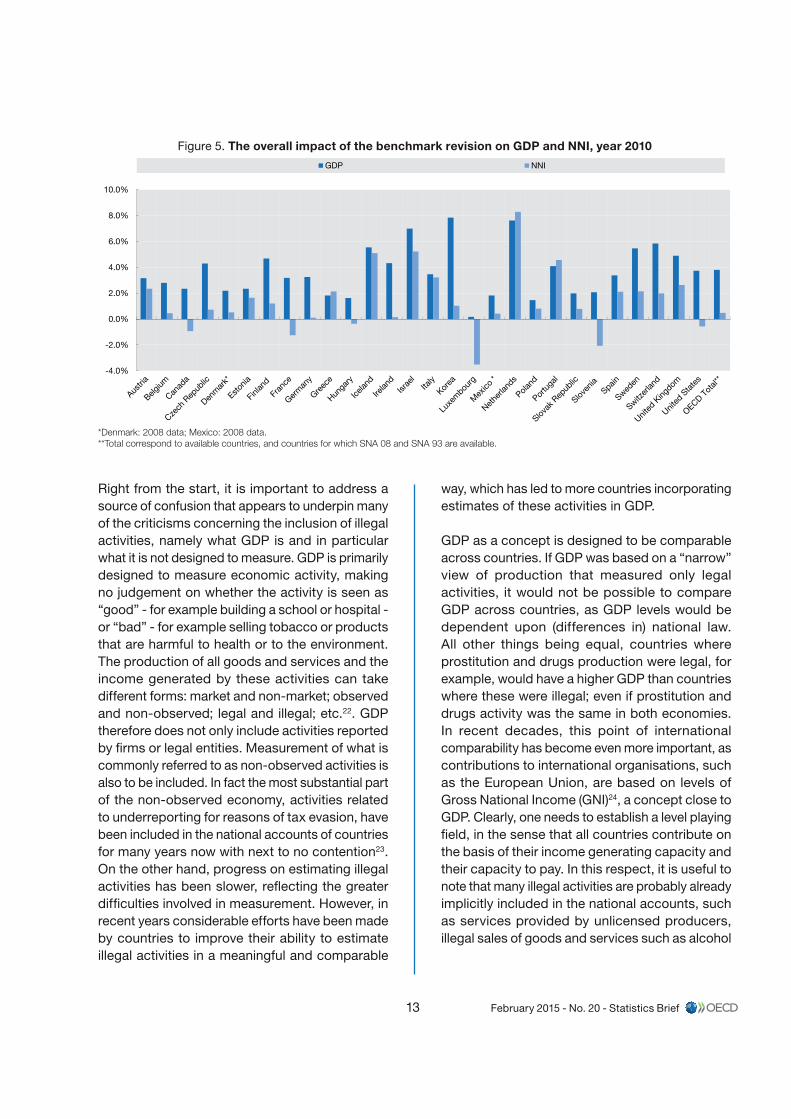
(ii) changes in the estimates of primary income flows (compensation of employees, interest, dividends, etc.) with the rest of the world. Having said that, changes in levels of NNI can be quite substantial, especially for countries where the changes resulting from the statistical benchmark revision are particularly significant. Figure 5 presents a comparison of the level shifts in GDP and NNI. For the OECD, the impact of the changes on NNI is about 0.5 %-points on average.
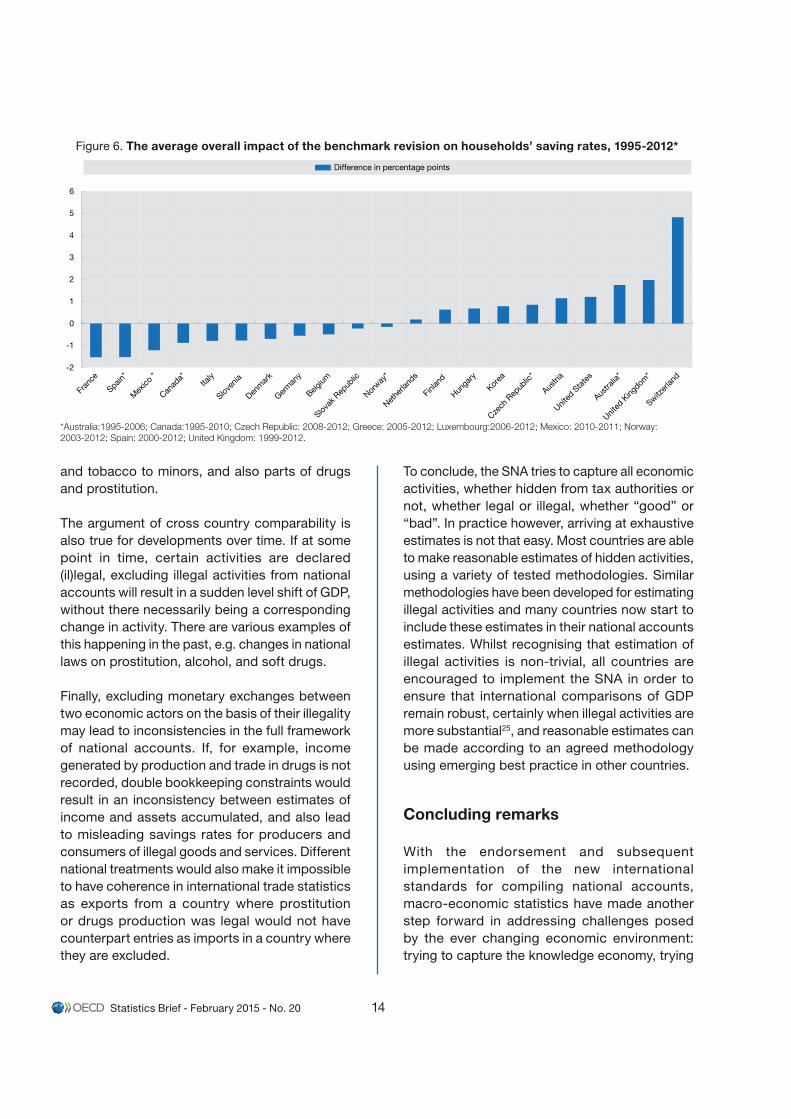
Overall impact on households’ saving rates
Finally, Figure 6 presents the impact of the benchmark revision for the saving rates of households. The results differ significantly across countries. They can also be rather volatile over time. In the graph, the results are shown for the simple average of the adjustment over the years for which the relevant data are available within the period 1995 – 2012. One of the changes in the standards that directly impacts on the saving rates, concerns the treatment of defined benefit pension funds, but one should be aware of the fact that a whole array of changes, related to both the changeover to the SNA 2008 and the statistical benchmark revision, may end up in the saving rates of households. It is quite complicated to fully disentangle all these causes for the revision of the numbers. Looking closer at the results,
one can observe significant positive adjustments of average households’ saving rates in Australia (+1.7 %-points), the United Kingdom (+2.0) and especially Switzerland (+4.8). On the other hand, saving rates are generally more than 1 %-point lower in France, Spain and Mexico.
Illegal activities
The SNA 2008 and its European equivalent, the ESA 2010, both recommend that hidden and illegal productive activities should be accounted for in Gross Domestic Product (GDP), as did the earlier standards, the SNA 1993 and the ESA 1995. But despite these longstanding recommendations, in the recent period, some commentators have begun to question whether illegal activities should actually be included in GDP and, indeed, other macro-economic indicators that can be derived from the system of national accounts. What appears to have triggered these views now is the increase in the number of countries that are able to compile estimates of illegal activities, and the more explicit recommendation to actually account for these activities, particularly within the European Union. This section discusses the main reasons for including illegal activities.
-6.00%
-4.00%
-2.00%
0.00%
2.00%
4.00%
6.00%
1992 1993 1994 1995 1996 1997 1998 1999 2000 2001 2002 2003 2004 2005 2006 2007 2008 2009 2010 2011 2012
Economic growth according to SNA 1993 Economic growth according to SNA 2008 Difference
Figure 4. The overall impact of the benchmark revision on economic growth, OECD average
13 February 2015 - No. 20 - Statistics Brief
Right from the start, it is important to address a source of confusion that appears to underpin many of the criticisms concerning the inclusion of illegal activities, namely what GDP is and in particular what it is not designed to measure. GDP is primarily designed to measure economic activity, making no judgement on whether the activity is seen as “good” - for example building a school or hospital - or “bad” - for example selling tobacco or products that are harmful to health or to the environment. The production of all goods and services and the income generated by these activities can take different forms: market and non-market; observed and non-observed; legal and illegal; etc.22. GDP therefore does not only include activities reported by firms or legal entities. Measurement of what is commonly referred to as non-observed activities is also to be included. In fact the most substantial part of the non-observed economy, activities related to underreporting for reasons of tax evasion, have been included in the national accounts of countries for many years now with next to no contention23. On the other hand, progress on estimating illegal activities has been slower, reflecting the greater difficulties involved in measurement. However, in recent years considerable efforts have been made by countries to improve their ability to estimate illegal activities in a meaningful and comparable
way, which has led to more countries incorporating estimates of these activities in GDP.
GDP as a concept is designed to be comparable across countries. If GDP was based on a “narrow” view of production that measured only legal activities, it would not be possible to compare GDP across countries, as GDP levels would be dependent upon (differences in) national law. All other things being equal, countries where prostitution and drugs production were legal, for example, would have a higher GDP than countries where these were illegal; even if prostitution and drugs activity was the same in both economies. In recent decades, this point of international comparability has become even more important, as contributions to international organisations, such as the European Union, are based on levels of Gross National Income (GNI)24, a concept close to GDP. Clearly, one needs to establish a level playing field, in the sense that all countries contribute on the basis of their income generating capacity and their capacity to pay. In this respect, it is useful to note that many illegal activities are probably already implicitly included in the national accounts, such as services provided by unlicensed producers, illegal sales of goods and services such as alcohol
-4.0%
-2.0%
0.0%
2.0%
4.0%
6.0%
8.0%
10.0%
GDP NNI
Figure 5. The overall impact of the benchmark revision on GDP and NNI, year 2010
*Denmark: 2008 data; Mexico: 2008 data.**Total correspond to available countries, and countries for which SNA 08 and SNA 93 are available.
14Statistics Brief - February 2015 - No. 20
and tobacco to minors, and also parts of drugs and prostitution.
The argument of cross country comparability is also true for developments over time. If at some point in time, certain activities are declared (il)legal, excluding illegal activities from national accounts will result in a sudden level shift of GDP, without there necessarily being a corresponding change in activity. There are various examples of this happening in the past, e.g. changes in national laws on prostitution, alcohol, and soft drugs.
Finally, excluding monetary exchanges between two economic actors on the basis of their illegality may lead to inconsistencies in the full framework of national accounts. If, for example, income generated by production and trade in drugs is not recorded, double bookkeeping constraints would result in an inconsistency between estimates of income and assets accumulated, and also lead to misleading savings rates for producers and consumers of illegal goods and services. Different national treatments would also make it impossible to have coherence in international trade statistics as exports from a country where prostitution or drugs production was legal would not have counterpart entries as imports in a country where they are excluded.
-2
-1
0
1
2
3
4
5
6
Difference in percentage points
Figure 6. The average overall impact of the benchmark revision on households’ saving rates, 1995-2012*
To conclude, the SNA tries to capture all economic activities, whether hidden from tax authorities or not, whether legal or illegal, whether “good” or “bad”. In practice however, arriving at exhaustive estimates is not that easy. Most countries are able to make reasonable estimates of hidden activities, using a variety of tested methodologies. Similar methodologies have been developed for estimating illegal activities and many countries now start to include these estimates in their national accounts estimates. Whilst recognising that estimation of illegal activities is non-trivial, all countries are encouraged to implement the SNA in order to ensure that international comparisons of GDP remain robust, certainly when illegal activities are more substantial25, and reasonable estimates can be made according to an agreed methodology using emerging best practice in other countries.
Concluding remarks
With the endorsement and subsequent implementation of the new international standards for compiling national accounts, macro-economic statistics have made another step forward in addressing challenges posed by the ever changing economic environment: trying to capture the knowledge economy, trying
*Australia:1995-2006; Canada:1995-2010; Czech Republic: 2008-2012; Greece: 2005-2012; Luxembourg:2006-2012; Mexico: 2010-2011; Norway: 2003-2012; Spain: 2000-2012; United Kingdom: 1999-2012.

15 February 2015 - No. 20 - Statistics Brief
to cope with the impact of globalisation on the compilation of national statistics, dealing with the measurement of financial services, accounting for pensions, etc. Furthermore, considerable progress has been made in aligning various international standards, such as those for balance of payments and government finance statistics, to the System of National Accounts. The latter developments are extremely important, as it will help to create a consistent set of macro-economic statistics.
On the other hand, this success has also created expectations and growing user demands. National accounts also increasingly have become the object of criticism in media and academic research, the most notable recent examples being the measurement of financial services and the treatment of illegal activities. Sometimes these critiques are justified and call for further investigation. In other instances the comments and remarks simply show a certain ignorance of the standards and what they intend to measure, and call for enhanced communication from the national accounts community.
However, various issues remain on the statistical agenda. The recording and measurement of the knowledge component within the economy, by possibly further broadening the scope of intangible investments, and by addressing the way in which the use of intellectual property products can/will be reflected is only one example. Also the way in which to deal with the international fragmentation of production processes remains a challenge, including the recording of multinational enterprises. The economic and financial crisis has increased the demand for data on risks and vulnerabilities: data on wealth and indebtedness, more granular information on the interconnectedness of sectors and economies, etc. An increasing demand for data related to the ageing of societies also becomes apparent. A final point to be mentioned here is the continuing discussion on the concept of income in the system of national accounts. Up to now, income items are generally defined excluding gains/losses from holding assets. However, this is more and more questioned, given the importance of holding
gains and losses, and the impact that this type of income can have on final consumption.
1. The author would like to thank Esther Bolton for her support in collecting the data and providing other support in the finalisation of this Brief.
2. http://unstats.un.org/unsd/nationalaccount/docs/SNA2008.pdf.
3. www.lb.lt/n22873/esa_2010-en_book.pdf.
4. The goal has always been to have fully compatible standards. However, on some, mostly minor, issues, for example the recording of the use of the services provided by the central bank, differences may exist.
5. When reference is made to OECD-averages in this Statistics Brief, it usually refers to the weighted average of all OECD-countries excluding the ones who have not yet implemented the new standards (Chile, Japan and Turkey). For some countries that have implemented the new standards, the full details of national accounts data according to the SNA 2008 may not yet be available. In these cases, the relevant countries are also not included in the “OECD-average”.
6. This change in standards does not have an impact in the United States National Income and Production Accounts (NIPA), as the US-system of national accounts already treated these expenditures as investments. However, when delivering national accounts data to international organisations, the US Bureau of Economic Analysis (BEA) adjusted the relevant data to better align them to the international standards. Doing so, the BEA also made an adjustment for the treatment of military weapons systems. As a consequence, the relevant change does have an impact on the internationally delivered data for the US.
7. The accrual recording of pension contributions is not prescribed for pension schemes for which the liabilities are not recognised in the core system of national accounts.
8. It may also have, usually quite minor, consequences for GDP, in the case that compensation of employees of non-market producers (e.g. government) is affected. For these producers, output is estimated at the sum of costs, among which compensation of employees is a major component.
9. www.oecd.org/sti/frascatimanual
10. See Handbook on Deriving Capital Measures of Intellectual Property Products, OECD, Paris, 2010: www.oecd.org/std/na/44312350.pdf.
11. For more details, reference is made to the OECD Manual on Measuring Capital: www.oecd.org/std/productivity-stats/43734711.pdf.
February 2015 - No. 20 - Statistics Brief16
The Statistics Brief is published by the OECD Statistics Directorate.
This issue and previous issues can be downloaded from the OECD website at: www.oecd.org/std/statisticsbrief
Editor in chief: Martine Durand Editor: David Brackfield Authors: Peter van de Ven Editorial and technical support: Sonia Primot
For further information contact the Editor at [email protected]
STATISTICS BRIEF
12. Wendy C.Y. Li, “Depreciation of Business R&D Capital”, paper presented at the 32nd General Conference of the IARIW, Boston, USA, 2012: www.bea.gov/national/pdf/WendyLiDepreciationBusinessR&DCapital20130314BEAwebversion.pdf.
13. “Manual on Measuring Research and Development in ESA 2010”, Eurostat, Luxembourg, 2013: http://dx.doi.org/10.2785/52718.
14. In practice, there are examples where further research into these and similar types of transactions, including various forms of global production arrangements, has actually led to changes in GDP-levels.
15. www.unece.org/fileadmin/DAM/stats/publications/Guide_on_Impact_of_global izat ion_on_nat ional_accounts__web_.pdf.
16. For provisional results, see www.unece.org/stats/documents/2013.01.sna.html.
17. ESA 2010 on the other hand considers all output of central banks as market output, to be valued at the sum of costs, and to be considered as being used by the financial corporations’ sector. This difference in treatment, although quantitatively not very substantial, also affects the international comparability of GDP.
18. Paul Schreyer (OECD) and Philippe Stauffer (SFSO, Switzerland), “SNA Revision Process: Provisional Recommendations on the Measurement of the Production of (Non-insurance) Financial Corporations”, presented at the 1st meeting of Advisory Expert Group on National Accounts, 16-20 February 2004, Washington D.C., USA (SNA/M1.04/15): http://unstats.un.org/unsd/nationalaccount/aeg/papers/m1(p)fisim.PDF.
19. See “Issue paper prepared by the ISWGNA Task Force on FISIM”, presented at the 7th Meeting of the Advisory Expert Group on National Accounts, 23-25 April 2012, New York, USA (SNA/M1.12/2.1): http://unstats.un.org/unsd/nationalaccount/aeg/2012/M7-21.pdf.
20. The USA has, for example, developed a methodology in which a smoothed measure of loan charge-offs is deducted from the difference between the interest rate charged by banks and the reference rate; see e.g. Kyle K. Hood, “Measuring the Services of Commercial Banks in the National Income and Products Accounts”, Bureau of Economic Analysis, Washington D.C., 2013: www.bea.gov/scb/pdf/2013/02%20February/0213_nipa-rev.pdf.
21. In addition, it can be noted that the value added generated through illegal activities is often exaggerated. In the case of drugs, for example, one tends to think in terms of street prices for drugs; however, for imported drugs the income generated in the domestic economy only concerns the domestically generated trade margins on these products.
22. In this context, reference is often made to the criterion of “mutual agreement” for including a certain transaction in the system of national accounts. Here, the only fundamental qualifying criteria that is required for a transaction to be included in GDP is that a good or service is produced and that it can be sold by mutual agreement to a third party. Illegal activities usually satisfy this criterion in precisely the same way that many legal activities do.
23. See György Gyomai and Peter van de Ven, “The Non-observed Economy in the System of National Accounts”, OECD Statistics Brief, No. 18, June 2014: www.oecd.org/std/na/Statistics%20Brief%2018.pdf.
24. GNI equals GDP plus net receipts of primary income (compensation of employees, interest, dividends, etc.) from the rest of the world.
25. In this respect, as stated before, it can be noted that, when looking at countries for which separate estimates are available, the extent of illegal activities are relatively modest, in the range of 1% of GDP. Furthermore, part of these activities is in fact already implicitly included in the system of national accounts.