Embed Size (px)
Citation preview
WS Atkins plc
Interim results for the six months ended
30 September 2009
25 November 2009
1
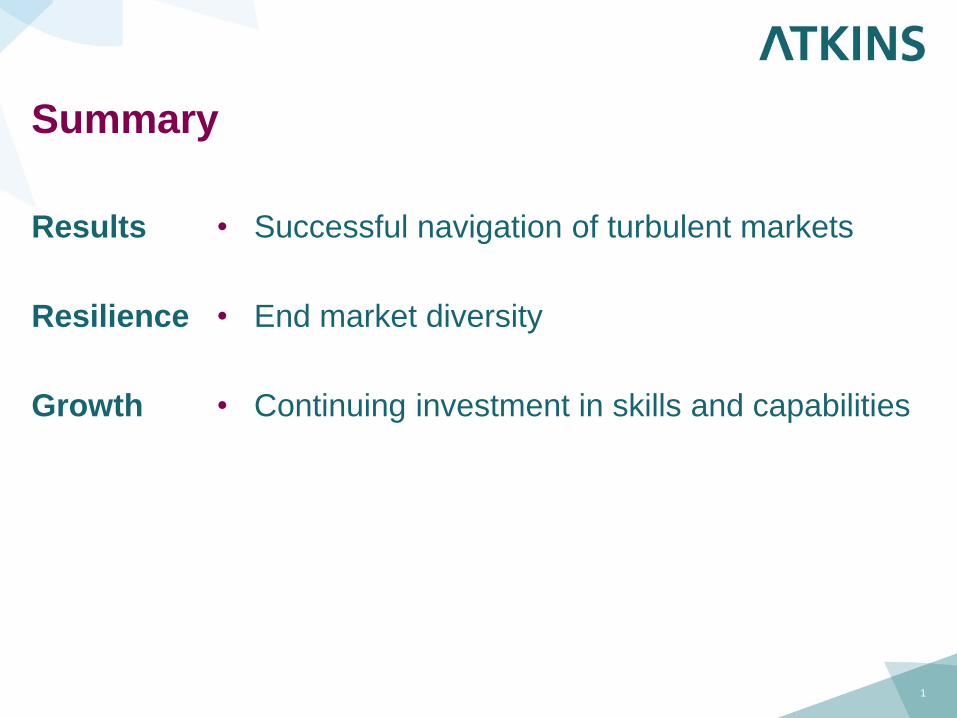
Summary
Results
Resilience
Growth
• Successful navigation of turbulent markets
• End market diversity
• Continuing investment in skills and capabilities

Heath Drewett
Group Finance Director

3
Financial highlights
30 Sep 2009 30 Sep 2008
Revenue £701.2 m £710.8 m (1)%
Operating profit £51.1 m £48.2 m 6 %
Operating margin 7.3 % 6.8 % 50 bp
Operating margin * 6.9 % 6.8 % 10 bp
Profit before tax * £40.9 m £47.5 m (14)%
Fully diluted eps * 31.6 p 36.4 p (13)%
Dividend per share 9.25 p 8.75 p 6 %
Work in hand 90 % 87 % Good
30 Sep 2009 31 Mar 2009
Headcount 16,235 18,017 (10)%
Net funds £230.6 m £234.2 m
* excluding pension gain in 2009 and JV disposal in 2008
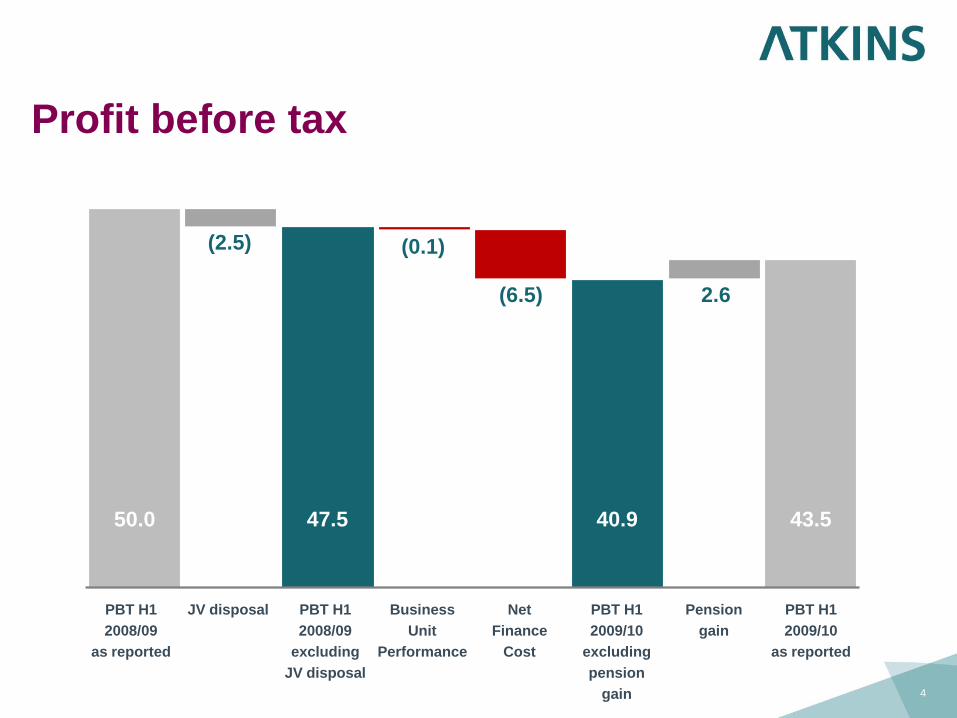
Profit before tax
4
PBT H1
2008/09
as reported
PBT H1
2009/10
as reported
Business
Unit
Performance
Net
Finance
Cost
PBT H1
2009/10
excluding
pension
gain
Pension
gain
50.0 40.9 43.5
2.6(6.5)
(0.1)
PBT H1
2008/09
excluding
JV disposal
JV disposal
47.5
(2.5)

5
Design and Engineering Solutions
30 Sep 2009 30 Sep 2008
Revenue (£m) 197.1 202.6 (3)%
Operating profit (£m) 13.0 16.9 (23)%
Operating margin 6.6 % 8.3 % (170)bp
Work in hand 88 % 87 % Good
Average headcount 4,820 5,057 (5)%
30 Sep 2009 31 Mar 2009
Headcount 4,616 5,167 (11)%
• Defence, Nuclear and Oil & Gas markets good
• Challenges in Water and UK building design markets as expected
• Operating profit includes reorganisation/redundancy costs of c.£2m
• Near term outlook good following restructuring

6
Highways and Transportation
30 Sep 2009 30 Sep 2008
Revenue (£m) 143.4 138.0 4 %
Operating profit (£m) 12.0 8.4 43 %
Operating margin 8.4 % 6.1 % 230 bp
Work in hand 93 % 86 % Very Good
Average headcount 2,967 2,937 1 %
30 Sep 2009 31 Mar 2009
Headcount 2,935 3,075 (5 )%
• Good performance – M25 DBFO progressing well
• Secure workload in highways services – success in Somerset and Gloucester
• Strong demand in transport planning and design
• Full year outlook good
7
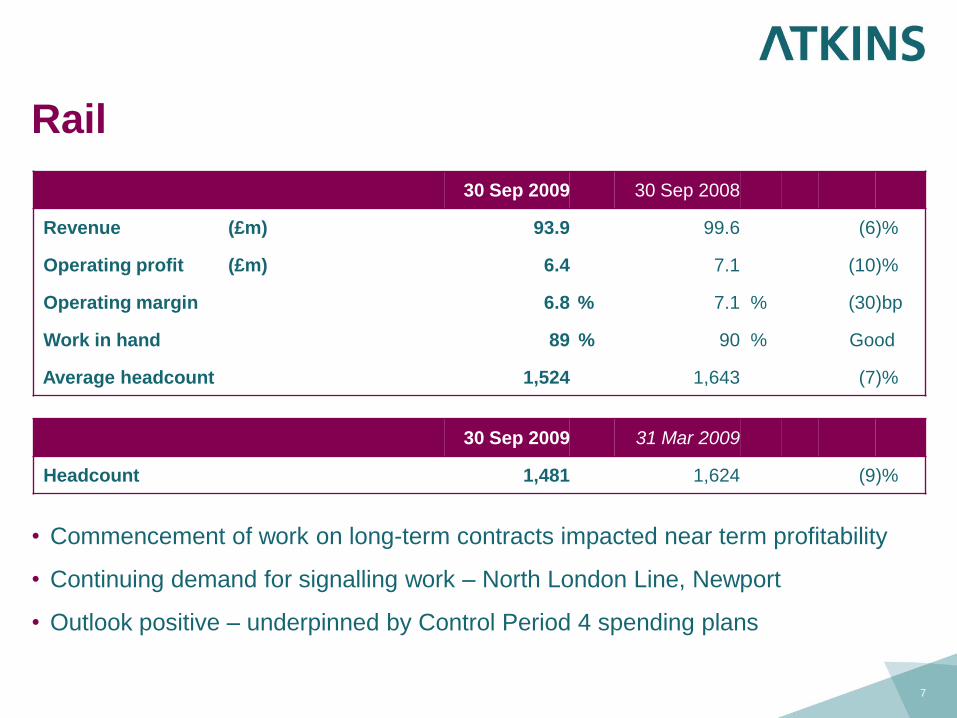
Rail
30 Sep 2009 30 Sep 2008
Revenue (£m) 93.9 99.6 (6)%
Operating profit (£m) 6.4 7.1 (10)%
Operating margin 6.8 % 7.1 % (30)bp
Work in hand 89 % 90 % Good
Average headcount 1,524 1,643 (7)%
30 Sep 2009 31 Mar 2009
Headcount 1,481 1,624 (9 )%
• Commencement of work on long-term contracts impacted near term profitability
• Continuing demand for signalling work – North London Line, Newport
• Outlook positive – underpinned by Control Period 4 spending plans
8
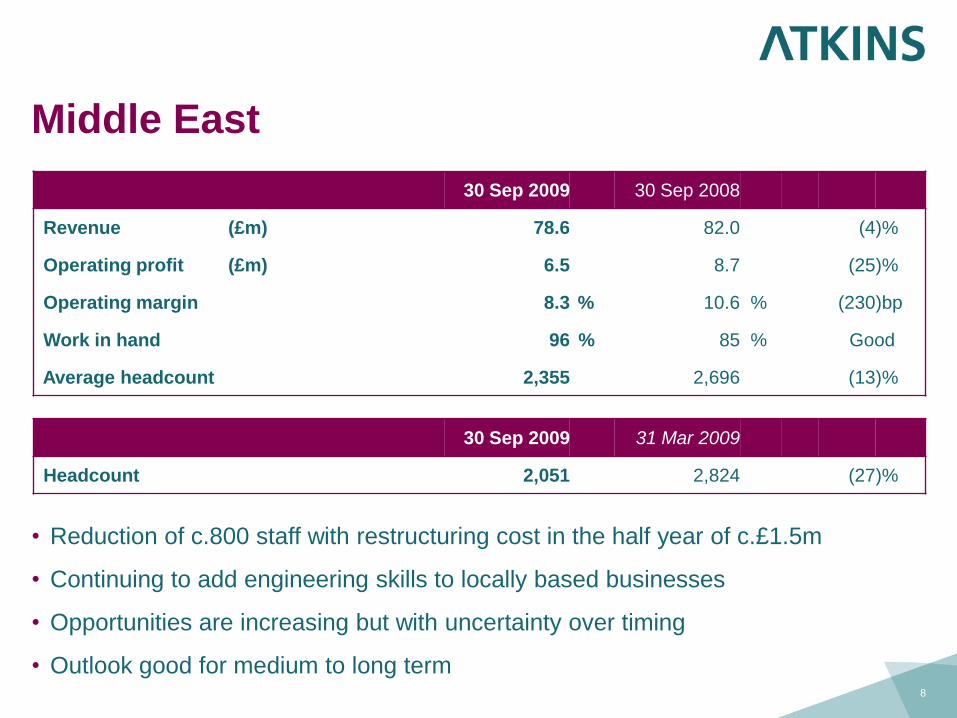
Middle East
30 Sep 2009 30 Sep 2008
Revenue (£m) 78.6 82.0 (4)%
Operating profit (£m) 6.5 8.7 (25)%
Operating margin 8.3 % 10.6 % (230)bp
Work in hand 96 % 85 % Good
Average headcount 2,355 2,696 (13)%
30 Sep 2009 31 Mar 2009
Headcount 2,051 2,824 (27 )%
• Reduction of c.800 staff with restructuring cost in the half year of c.£1.5m
• Continuing to add engineering skills to locally based businesses
• Opportunities are increasing but with uncertainty over timing
• Outlook good for medium to long term
9
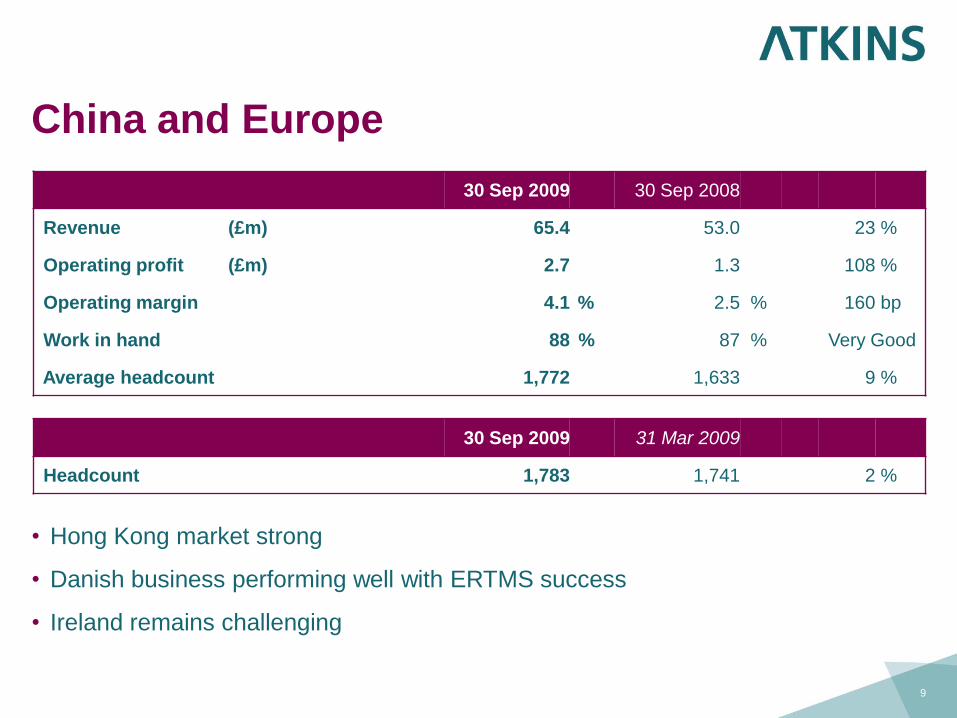
China and Europe
30 Sep 2009 30 Sep 2008
Revenue (£m) 65.4 53.0 23 %
Operating profit (£m) 2.7 1.3 108 %
Operating margin 4.1 % 2.5 % 160 bp
Work in hand 88 % 87 % Very Good
Average headcount 1,772 1,633 9 %
30 Sep 2009 31 Mar 2009
Headcount 1,783 1,741 2 %
• Hong Kong market strong
• Danish business performing well with ERTMS success
• Ireland remains challenging
10
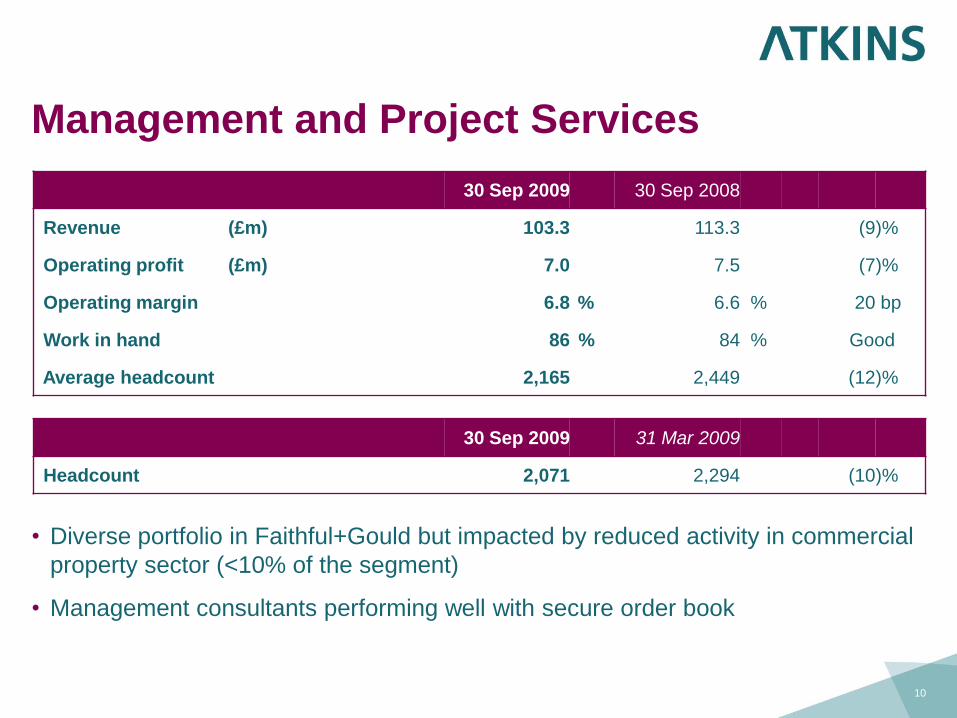
Management and Project Services
30 Sep 2009 30 Sep 2008
Revenue (£m) 103.3 113.3 (9)%
Operating profit (£m) 7.0 7.5 (7)%
Operating margin 6.8 % 6.6 % 20 bp
Work in hand 86 % 84 % Good
Average headcount 2,165 2,449 (12)%
30 Sep 2009 31 Mar 2009
Headcount 2,071 2,294 (10 )%
• Diverse portfolio in Faithful+Gould but impacted by reduced activity in commercial
property sector (<10% of the segment)
• Management consultants performing well with secure order book
11
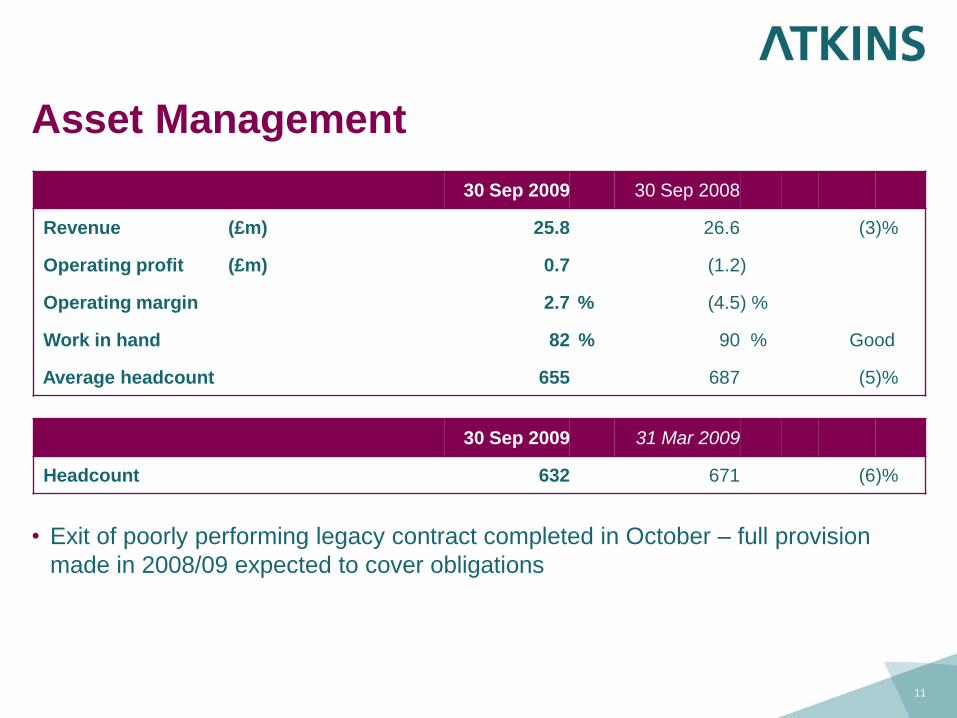
Asset Management
30 Sep 2009 30 Sep 2008
Revenue (£m) 25.8 26.6 (3)%
Operating profit (£m) 0.7 (1.2)
Operating margin 2.7 % (4.5) %
Work in hand 82 % 90 % Good
Average headcount 655 687 (5)%
30 Sep 2009 31 Mar 2009
Headcount 632 671 (6 )%
• Exit of poorly performing legacy contract completed in October – full provision
made in 2008/09 expected to cover obligations
12
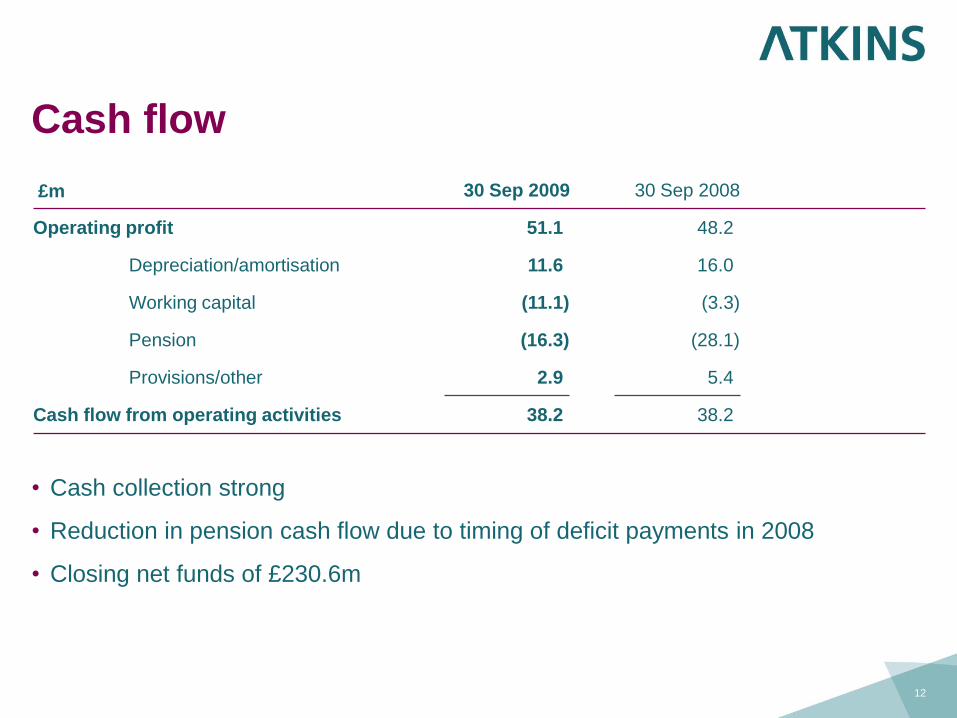
Cash flow
£m 30 Sep 2009 30 Sep 2008
Operating profit 51.1 48.2
Depreciation/amortisation 11.6 16.0
Working capital (11.1) (3.3)
Pension (16.3) (28.1)
Provisions/other 2.9 5.4
Cash flow from operating activities 38.2 38.2
• Cash collection strong
• Reduction in pension cash flow due to timing of deficit payments in 2008
• Closing net funds of £230.6m
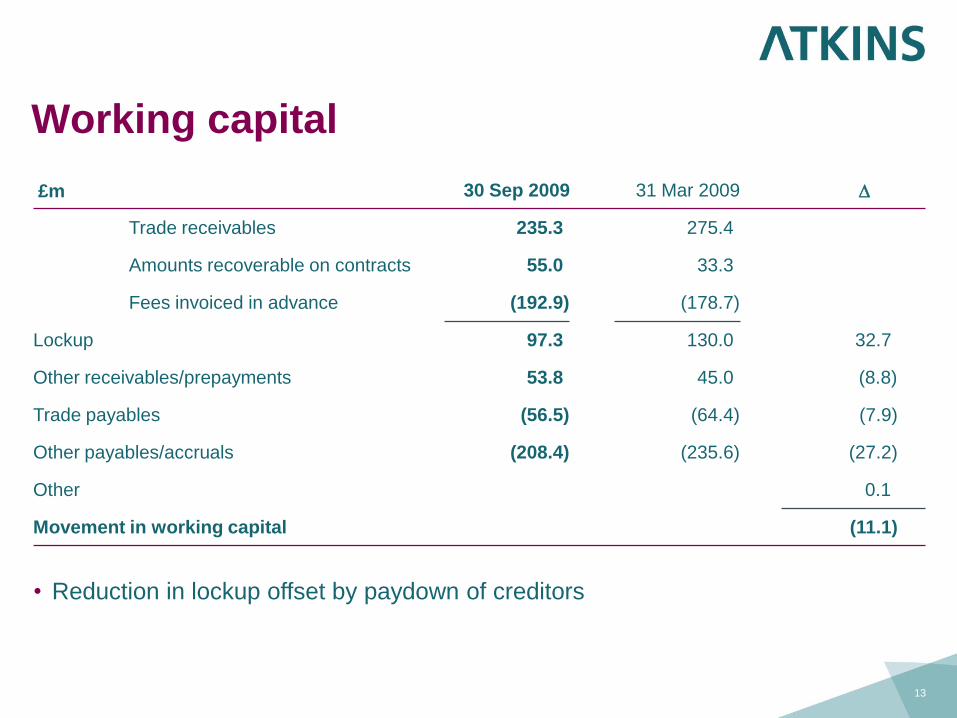
Working capital
13
£m 30 Sep 2009 31 Mar 2009 D
Trade receivables 235.3 275.4
Amounts recoverable on contracts 55.0 33.3
Fees invoiced in advance (192.9) (178.7)
Lockup 97.3 130.0 32.7
Other receivables/prepayments 53.8 45.0 (8.8)
Trade payables (56.5) (64.4) (7.9)
Other payables/accruals (208.4) (235.6) (27.2)
Other 0.1
Movement in working capital (11.1)
• Reduction in lockup offset by paydown of creditors

14
• IAS19 deficit increase due to decrease in discount rate from 6.3% to 5.3% despite
increase in value of scheme assets
• £16m deficit funding in first half year in line with agreed funding plan
• Next actuarial valuation due as at 1 April 2010
Pension
£m Gross Net of def tax
Net deficit at 1 April 2009 (298.4) (215.4)
Service cost (3.0)
Net finance cost (7.5)
Contributions 19.2
Actuarial loss (131.2)
Other 2.6
Net deficit at 30 September 2009 (418.3) (301.6)
Results summary
• Improving margin
• Generating cash
• Increased interim dividend
15

Keith Clarke
Chief Executive

17
Overview
Results
Resilience
Growth
• Successful navigation of turbulent markets
• End market diversity
• Continuing investment in skills and capabilities

0%
1%
2%
3%
4%
5%
6%
7%
8%
0
20
40
60
80
100
120
140
2004 2005 2006 2007 2008 2009 2010
£m
Year ended 31 March
Full year operating profit
First half operating profit
Full year operating margin
Margin progression
18
19
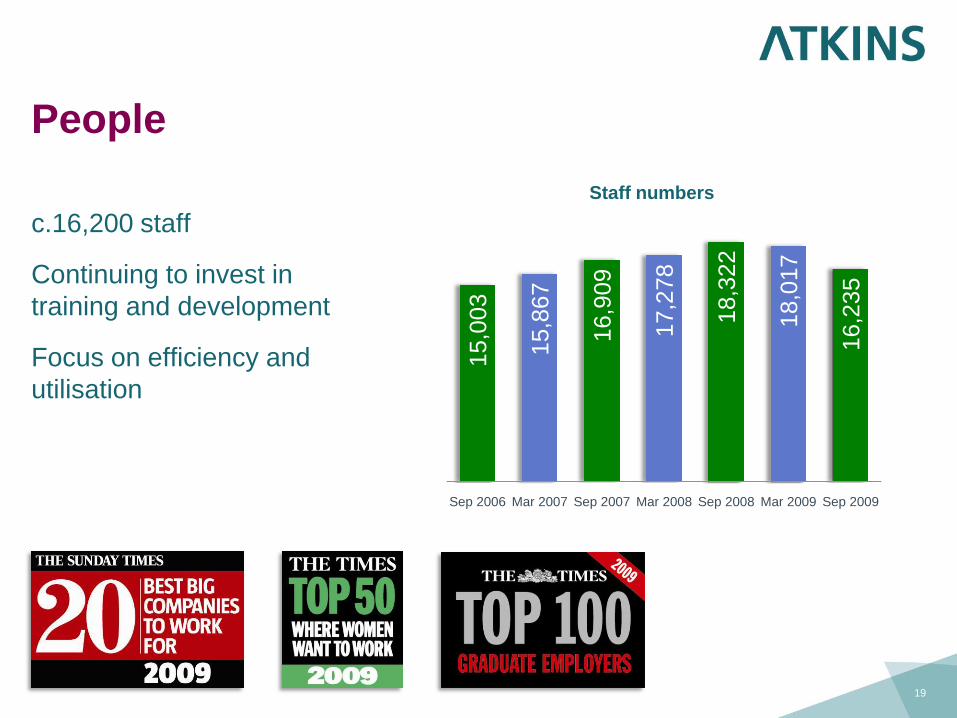
People
c.16,200 staff
Continuing to invest in
training and development
Focus on efficiency and
utilisation
15,0
03
15,8
67
16,9
09
17,2
78
18,3
22
18,0
17
16,2
35
Sep 2006 Mar 2007 Sep 2007 Mar 2008 Sep 2008 Mar 2009 Sep 2009
Staff numbers
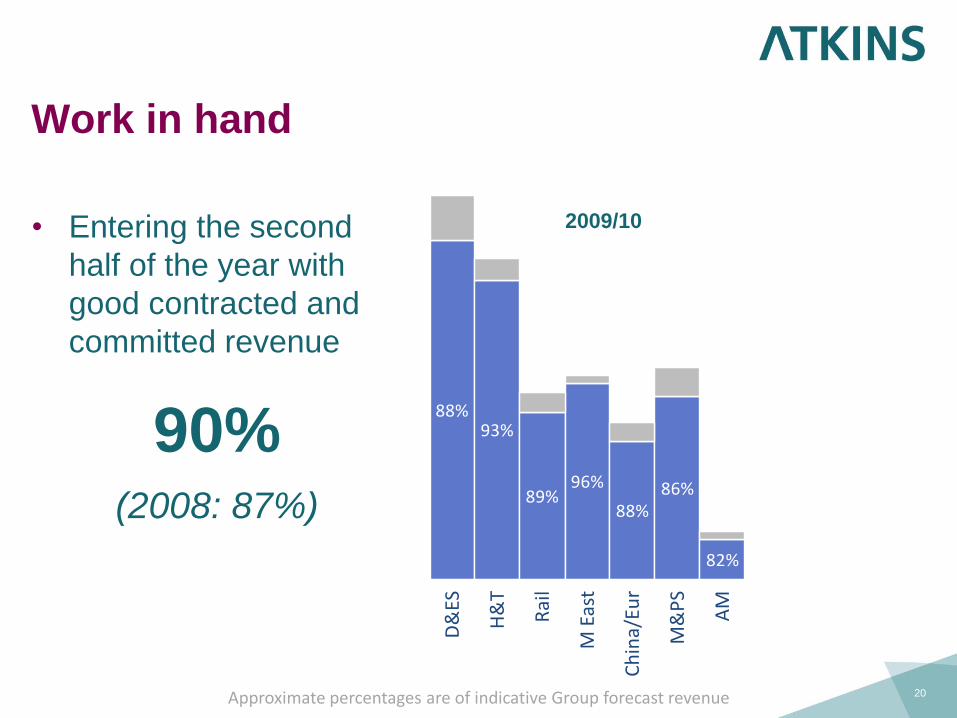
88%93%
89%96%
88%86%
82%
Work in hand
• Entering the second
half of the year with
good contracted and
committed revenue
20
D&
ES
H&
T
Rai
l
M E
ast
Ch
ina/
Eur
M&
PS
AM
2009/10
Approximate percentages are of indicative Group forecast revenue
90%(2008: 87%)

Resilience
• Diversified exposure to end markets
• Strong Group
– Scale
– Breadth
– Cash resources
– Higher end activity
– Adjacencies / skill transfer
• Market demands work on existing as well as new
infrastructure
21
22
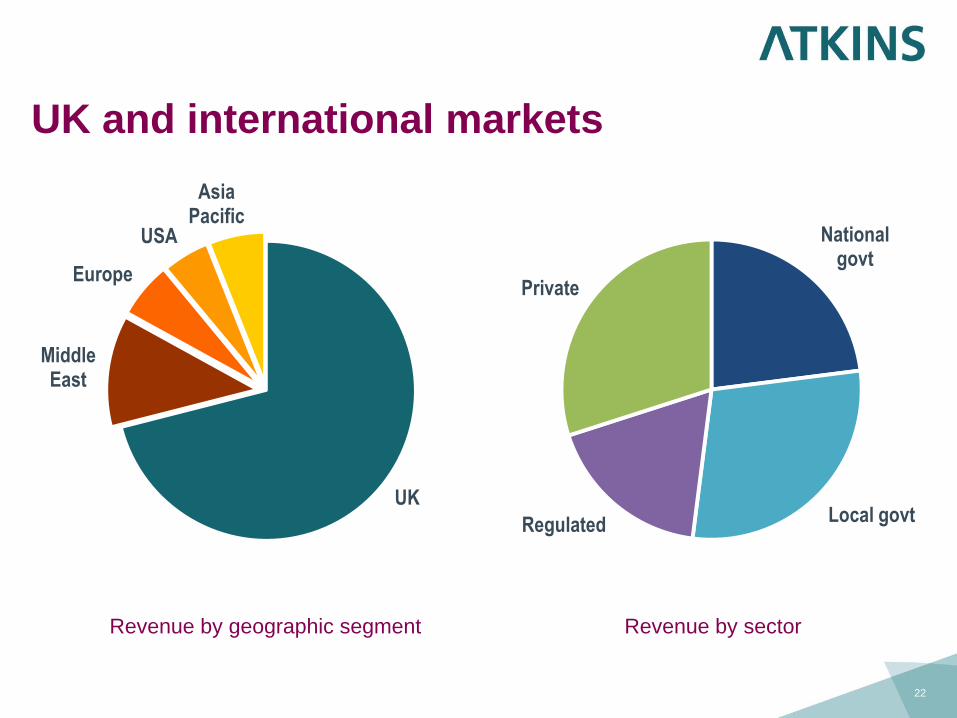
UK and international markets
UK
Middle East
Europe
USA
Asia Pacific
National govt
Local govtRegulated
Private
Revenue by geographic segment Revenue by sector
7%
1%
7%
2%
1%
2%
3%
1%
11%
4%
1%
2%
3%
2%
1%
1%
3%
10%
3%
2%
1%
2%
1%
1%
1%
2%
1%
1%
6%
8%
2%
4%
3%
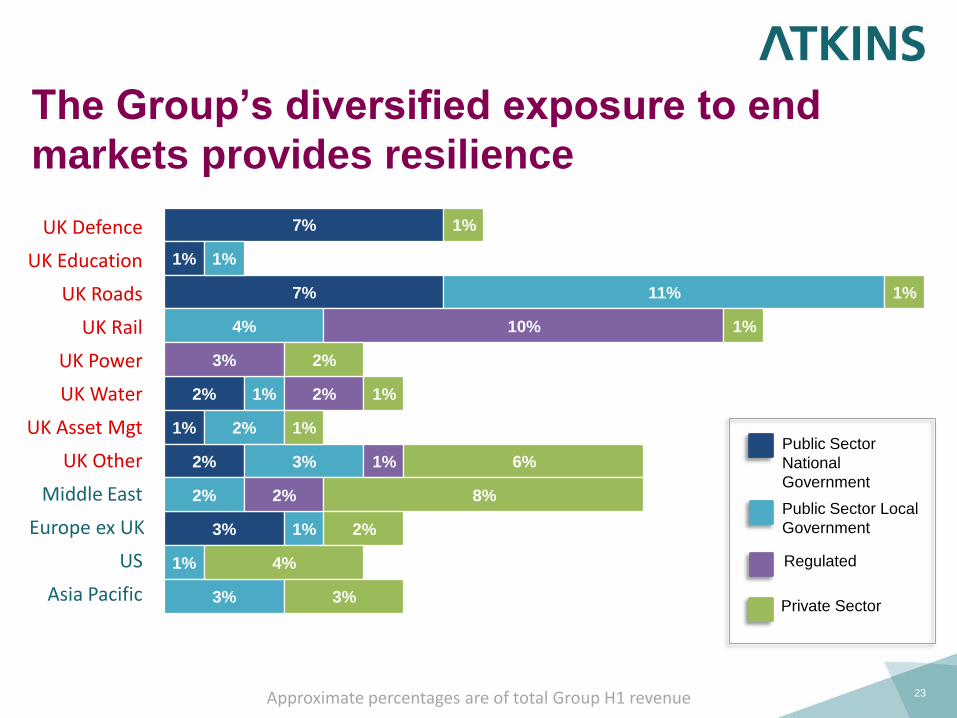
The Group’s diversified exposure to end
markets provides resilience
23
Public Sector
National
Government
Public Sector Local
Government
Regulated
Private Sector
UK Roads
UK Rail
UK Power
UK Water
UK Defence
UK Education
UK Other
UK Asset Mgt
Middle East
Europe ex UK
US
Asia Pacific
Approximate percentages are of total Group H1 revenue

24
Middle East
• Confident liquidity slowly
returning
• Infrastructure opportunities
• Adding skills
• The region remains
attractive
Qatar
Dubai
Oman
Kuwait /
India
Revenue by market
Bahrain
Abu Dhabi
Sharjah

25
Rest of the world
Europe
• Expanding capabilities in Scandinavia
• Ireland remains challenging
USA
• Cost consulting stable
• Oil & Gas steady
Asia Pacific
• Hong Kong opportunities especially in transport
• Mainland China performing in line with expectations
Future development
• Exceptional people and management
• Focussing on quality
• Addressing attractive markets
– Renewables
– Nuclear
– Mass transit
• Taking advantage of opportunities by adding
technical/niche skills in good markets
26

27
Conclusion
Results
Resilience
Growth
• Successful navigation of turbulent markets
• End market diversity
• Continuing investment in skills and capabilities
Confidence in Group’s position and strategy

WS Atkins plc
Interim results for the six months ended
30 September 2009
25 November 2009
Appendices
UK End Market analysis
Net funds reconciliation
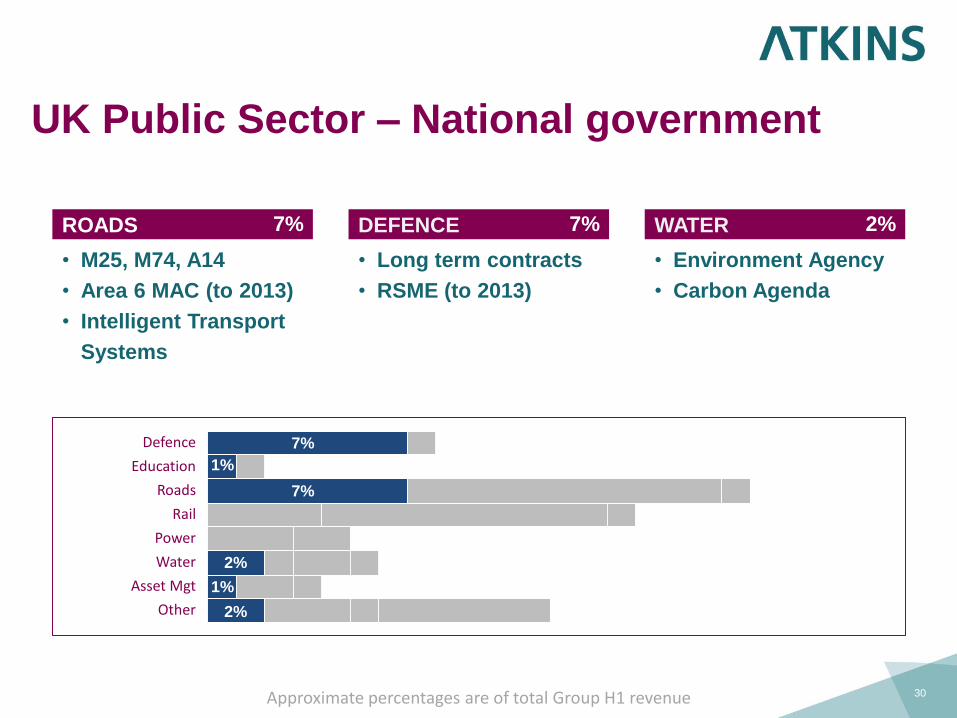
DEFENCE
UK Public Sector – National government
30
ROADS WATER
• M25, M74, A14
• Area 6 MAC (to 2013)
• Intelligent Transport
Systems
• Long term contracts
• RSME (to 2013)
• Environment Agency
• Carbon Agenda
7%7% 2%
Approximate percentages are of total Group H1 revenue
Roads
Rail
Power
Water
Defence
Education
Other
Asset Mgt
7%
7%
1%
1%
2%
2%
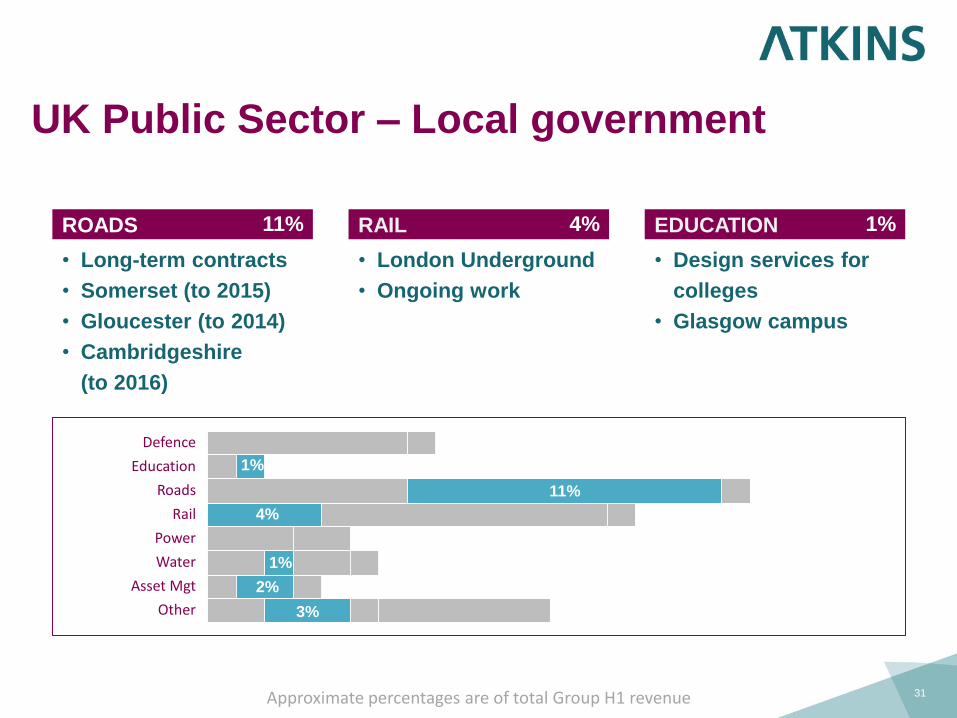
UK Public Sector – Local government
31
EDUCATION
• Design services for
colleges
• Glasgow campus
1%
Approximate percentages are of total Group H1 revenue
RAILROADS
• Long-term contracts
• Somerset (to 2015)
• Gloucester (to 2014)
• Cambridgeshire
(to 2016)
• London Underground
• Ongoing work
4%11%
Roads
Rail
Power
Water
Defence
Education
Other
Asset Mgt
4%
11%
1%
2%
1%
3%
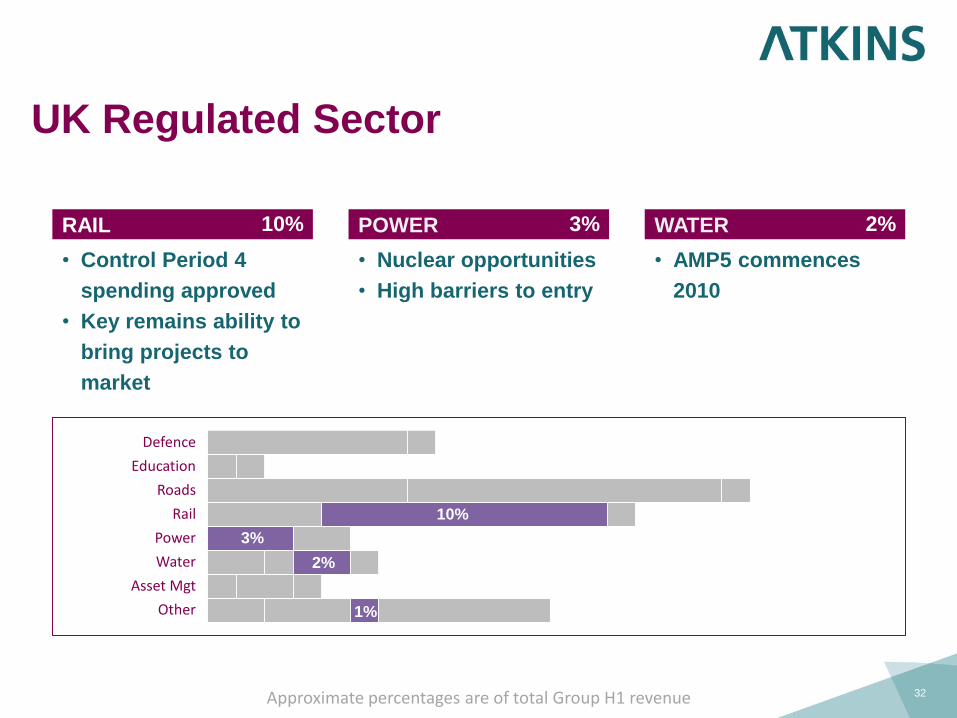
UK Regulated Sector
32
WATER
• AMP5 commences
2010
2%
Approximate percentages are of total Group H1 revenue
POWERRAIL
• Control Period 4
spending approved
• Key remains ability to
bring projects to
market
• Nuclear opportunities
• High barriers to entry
3%10%
Roads
Rail
Power
Water
Defence
Education
Other
Asset Mgt
10%
3%
2%
1%

UK Private Sector
33
OTHER
• Airbus programmes
in aerospace sector
• Cost management for
financial services /
pharma
6%
Approximate percentages are of total Group H1 revenue
ROADSPOWER
• Oil & gas portfolio of
clients and
continuing demand
• Technical support on
projects for private
sector clients
1%2%
Roads
Rail
Power
Water
Defence
Education
Other
Asset Mgt
1%
2%
1%
1%
1%
6%
1%

£m CashLoan notes
< 1yr
Loan notes
> 1yr
Financial
assets
Borrowings
< 1yr
Borrowings
> 1yr
Leases
< 1yr
Leases
> 1yrNet funds
Operating profit 51.1 51.1
Depreciation/amortisation 11.6 11.6
Working capital (11.1) (11.1)
Pension (16.3) (16.3)
Provisions / other 2.9 2.9
Cashflow from operating activities 38.2 38.2
Net interest 0.8 0.8
Tax (9.3) (9.3)
Net capital expenditure (3.5) (3.5)
26.2 26.2
Dividends (16.7) (16.7)
Net cash flow 9.5 9.5
Non-operating items Foreign Exchange (5.9) (13.1)
EBT share sales (7.2)
Financing - I Discount unwind - 0.2 (0.1) -
Transfer - 6.2 (6.2) (0.6) 0.6 (2.1) 2.1
New leases - (0.1)
Financing - II Investments (4.6) 4.6
Financial assets (8.4) 8.4 -
Borrowings - short term (0.4) 0.4
Leases : principal (2.9) 2.9
Movement (19.9) 6.2 (1.4) 8.4 (0.3) 0.6 0.7 2.1 (3.6)
Opening balance 209.7 - 12.9 28.7 (2.8) (0.6) (4.8) (8.9) 234.2
Closing balance 189.8 6.2 11.5 37.1 (3.1) - (4.1) (6.8) 230.6
Net funds reconciliation
35
Disclaimer
The information in this presentation pack which does not
purport to be comprehensive has been provided by Atkins,
and has not been independently verified. While this
information has been prepared in good faith, no representation
or warranty, express or implied, is or will be made and no
responsibility or liability is or will be accepted by Atkins, as to
or in relation to the accuracy or completeness of this
presentation pack or any other written or oral information
made available as part of the presentation and any such
liability is expressly disclaimed. Further, whilst Atkins may
subsequently update the information made available in this
presentation, we expressly disclaim any obligation to do so.