Embed Size (px)
Citation preview
WS Atkins plcPreliminary results for the year ended31 March 2011
16 June 2011

Keith Clarke Chief Executive
Good results in a transformational year, positioning the Group for growth
Continued management focus on quality and agility have delivered good results
Our strategy is working and the Group is well positioned for growth
3
Heath DrewettGroup finance director
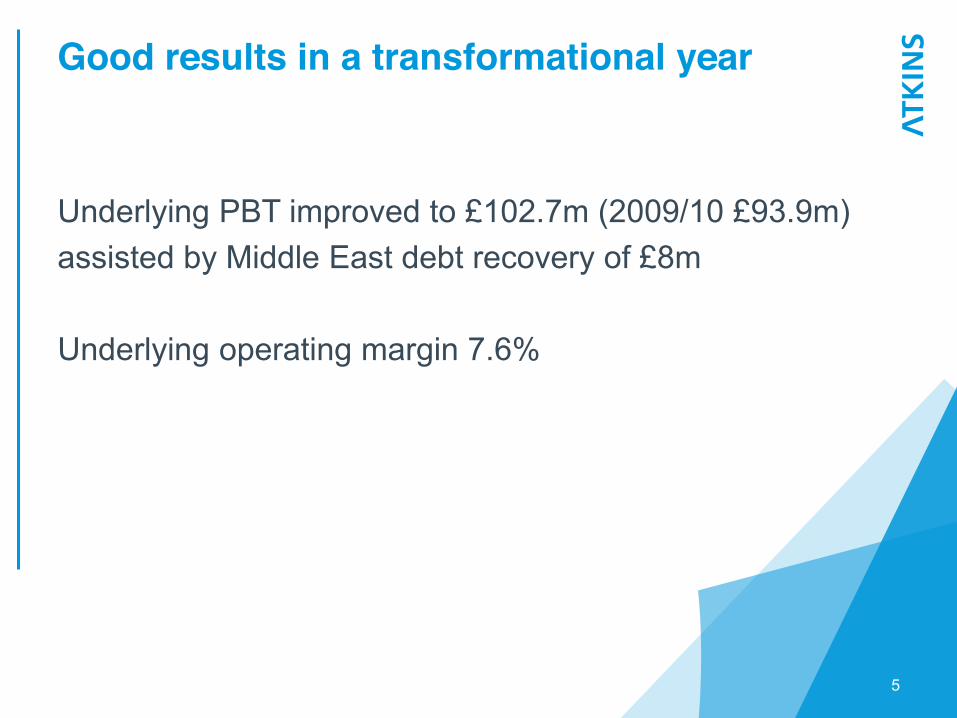
Good results in a transformational year
Underlying PBT improved to £102.7m (2009/10 £93.9m)assisted by Middle East debt recovery of £8m
Underlying operating margin 7.6%
5
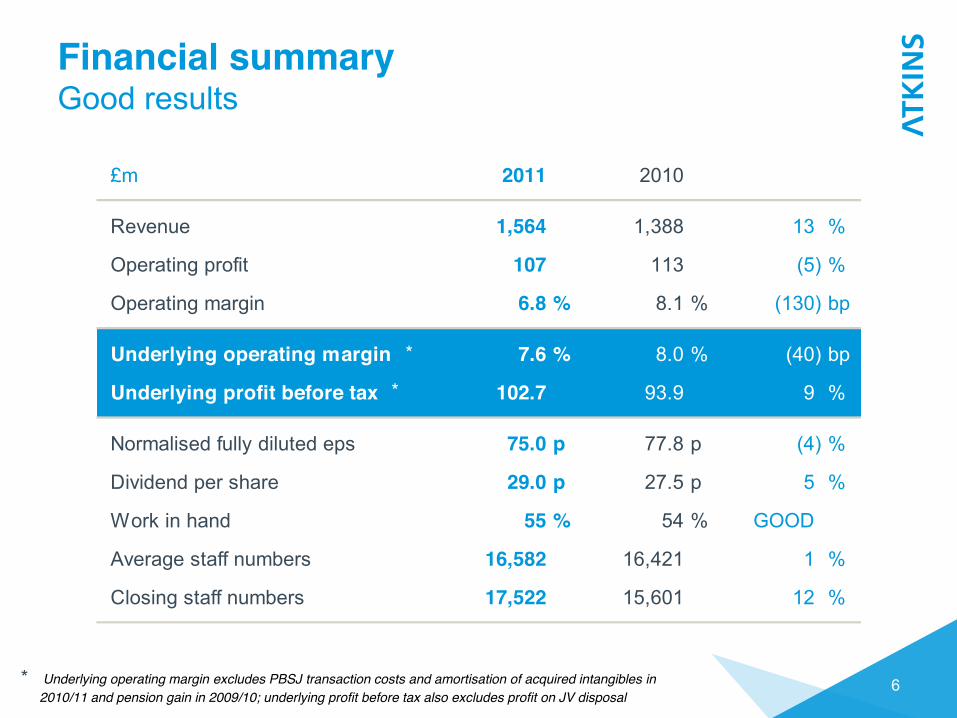
£m 2011 2010
Revenue 1,564 1,388 13 %
Operating profit 107 113 (5) %
Operating margin 6.8 % 8.1 % (130) bp
Underlying operating margin 7.6 % 8.0 % (40) bp
Underlying profit before tax 102.7 93.9 9 %
Normalised fully diluted eps 75.0 p 77.8 p (4) %
Dividend per share 29.0 p 27.5 p 5 %
Work in hand 55 % 54 % GOOD
Average staff numbers 16,582 16,421 1 %
Closing staff numbers 17,522 15,601 12 %
Financial summaryGood results
6
*
*
* Underlying operating margin excludes PBSJ transaction costs and amortisation of acquired intangibles in 2010/11 and pension gain in 2009/10; underlying profit before tax also excludes profit on JV disposal
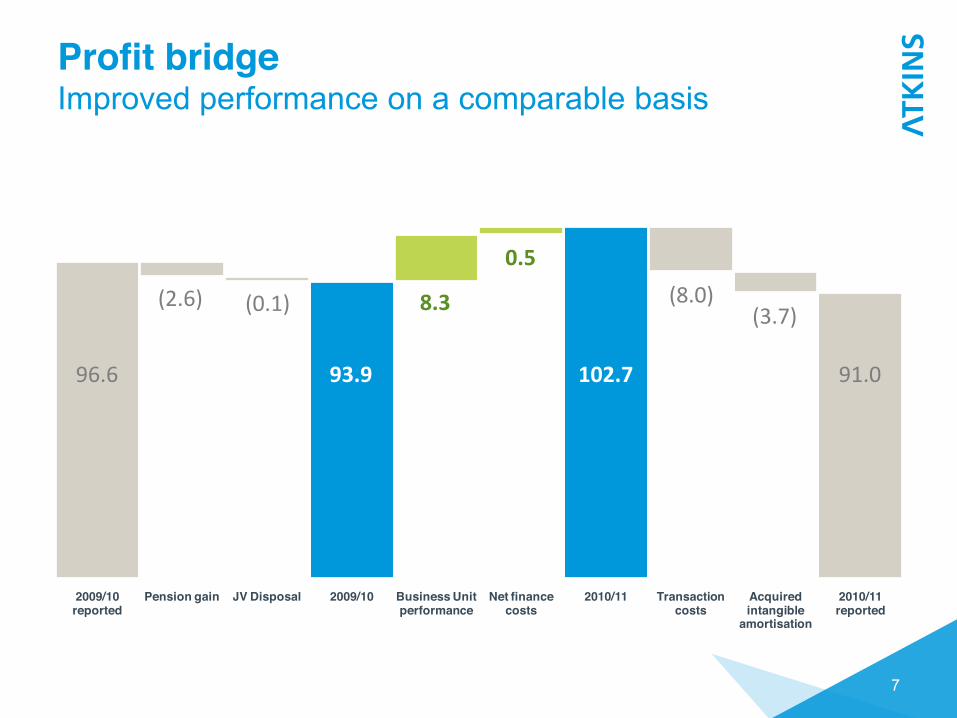
2009/10 reported
Pension gain JV Disposal 2009/10 Business Unit performance
Net finance costs
2010/11 Transaction costs
Acquired intangible
amortisation
2010/11 reported
Profit bridgeImproved performance on a comparable basis
7
96.6
(2.6) (0.1)
93.9
8.3
0.5
102.7
(8.0)(3.7)
91.0
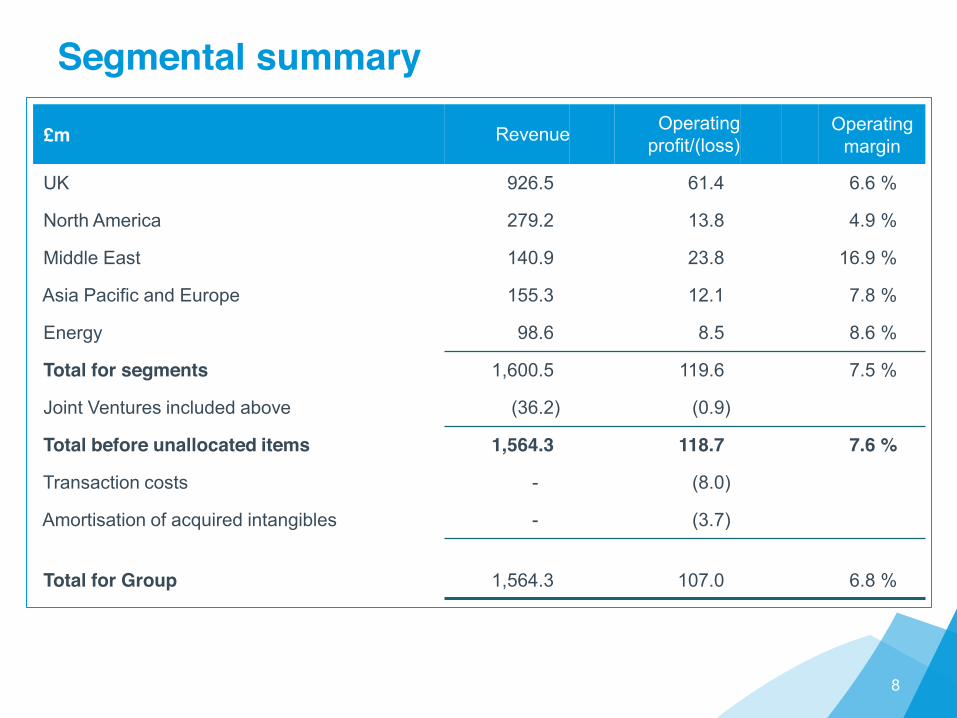
Segmental summary
8
£m Revenue Operating profit/(loss)
Operating margin
UK 926.5 61.4 6.6 %
North America 279.2 13.8 4.9 %
Middle East 140.9 23.8 16.9 %
Asia Pacific and Europe 155.3 12.1 7.8 %
Energy 98.6 8.5 8.6 %
Total for segments 1,600.5 119.6 7.5 %
Joint Ventures included above (36.2) (0.9)
Total before unallocated items 1,564.3 118.7 7.6 %
Transaction costs - (8.0)
Amortisation of acquired intangibles - (3.7)
Total for Group 1,564.3 107.0 6.8 %
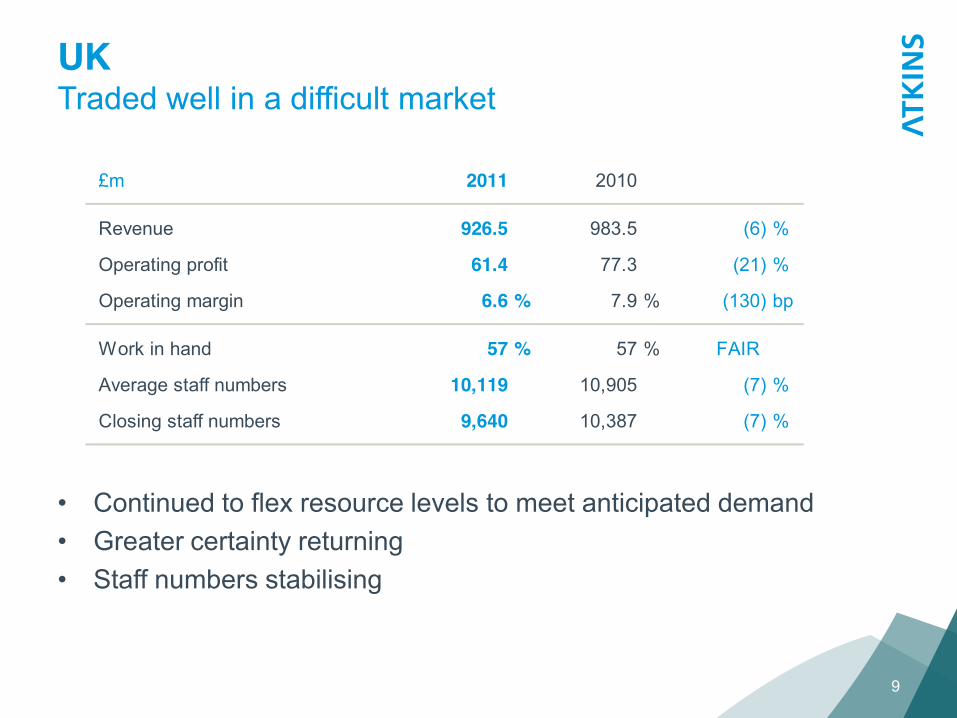
UKTraded well in a difficult market
Continued to flex resource levels to meet anticipated demandGreater certainty returningStaff numbers stabilising
9
£m 2011 2010
Revenue 926.5 983.5 (6) %
Operating profit 61.4 77.3 (21) %
Operating margin 6.6 % 7.9 % (130) bp
Work in hand 57 % 57 % FAIR
Average staff numbers 10,119 10,905 (7) %
Closing staff numbers 9,640 10,387 (7) %
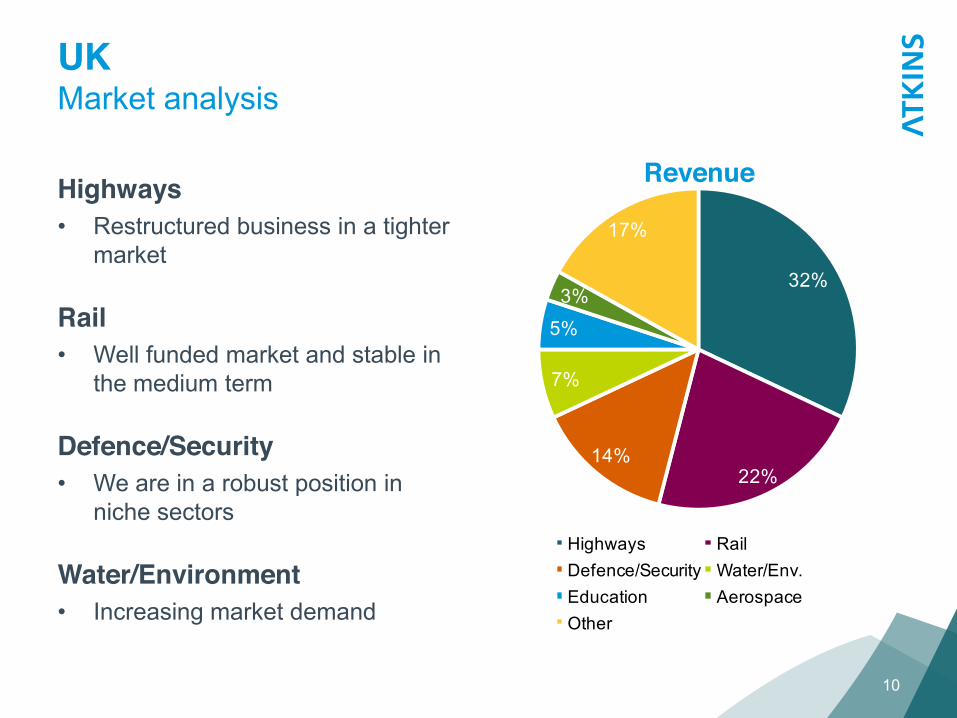
32%
22%14%
7%
5%3%
17%
Highways RailDefence/Security Water/Env.Education AerospaceOther
UKMarket analysis
HighwaysRestructured business in a tighter market
RailWell funded market and stable in the medium term
Defence/SecurityWe are in a robust position in niche sectors
Water/EnvironmentIncreasing market demand
10
Revenue
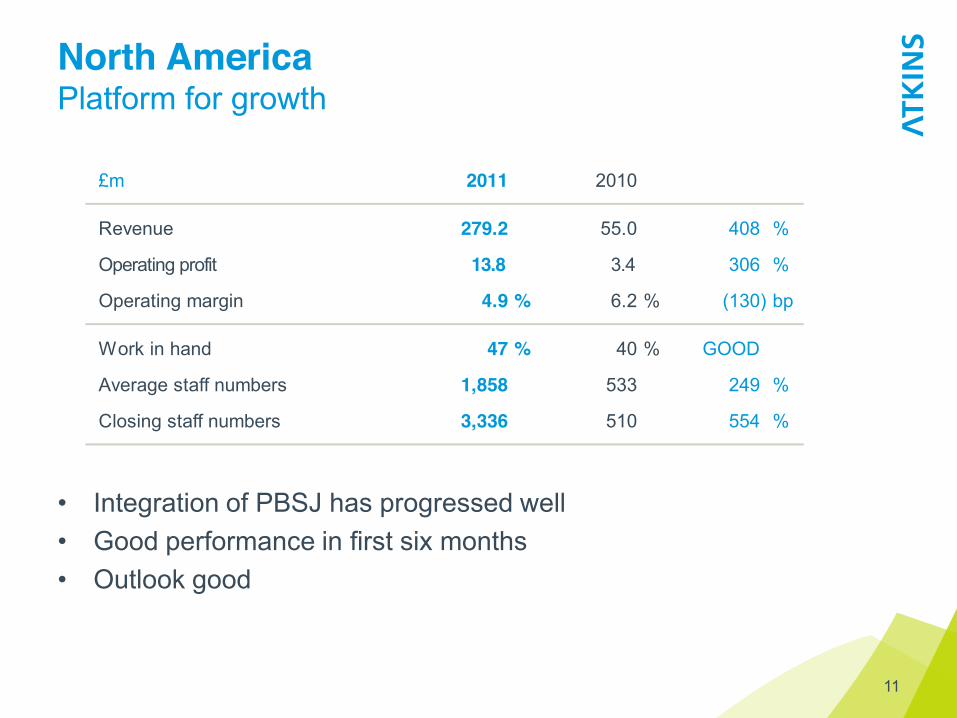
North AmericaPlatform for growth
Integration of PBSJ has progressed wellGood performance in first six monthsOutlook good
11
£m 2011 2010
Revenue 279.2 55.0 408 %
Operating profit 13.8 3.4 306 %
Operating margin 4.9 % 6.2 % (130) bp
Work in hand 47 % 40 % GOOD
Average staff numbers 1,858 533 249 %
Closing staff numbers 3,336 510 554 %
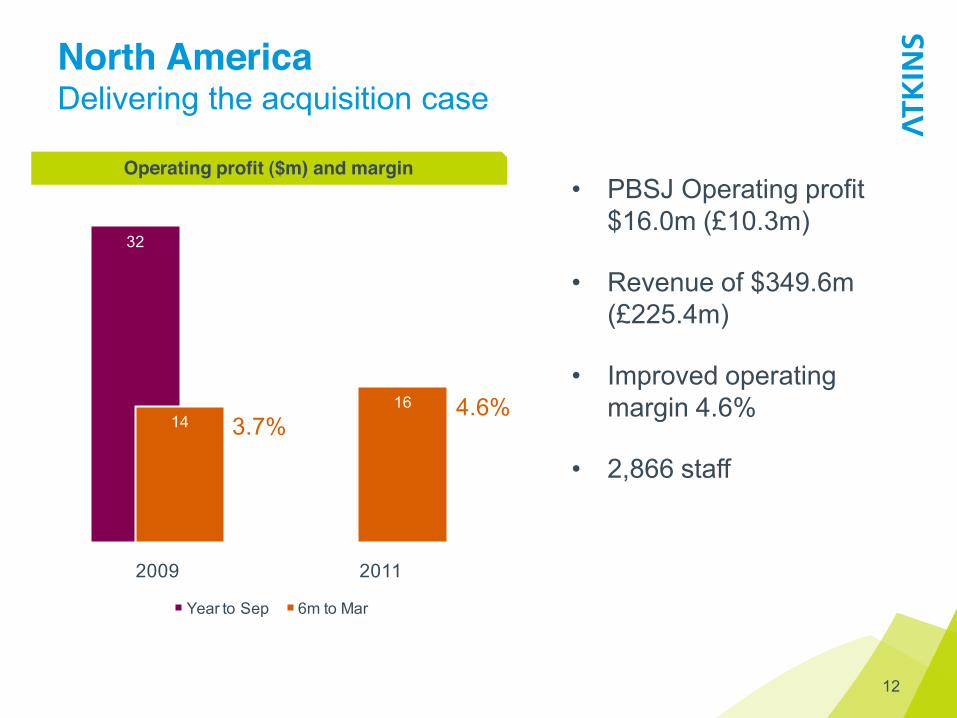
32
1416
2009 2011
Year to Sep 6m to Mar
Operating profit ($m) and margin
North AmericaDelivering the acquisition case
PBSJ Operating profit $16.0m (£10.3m)
Revenue of $349.6m (£225.4m)
Improved operating margin 4.6%
2,866 staff
12
3.7%4.6%
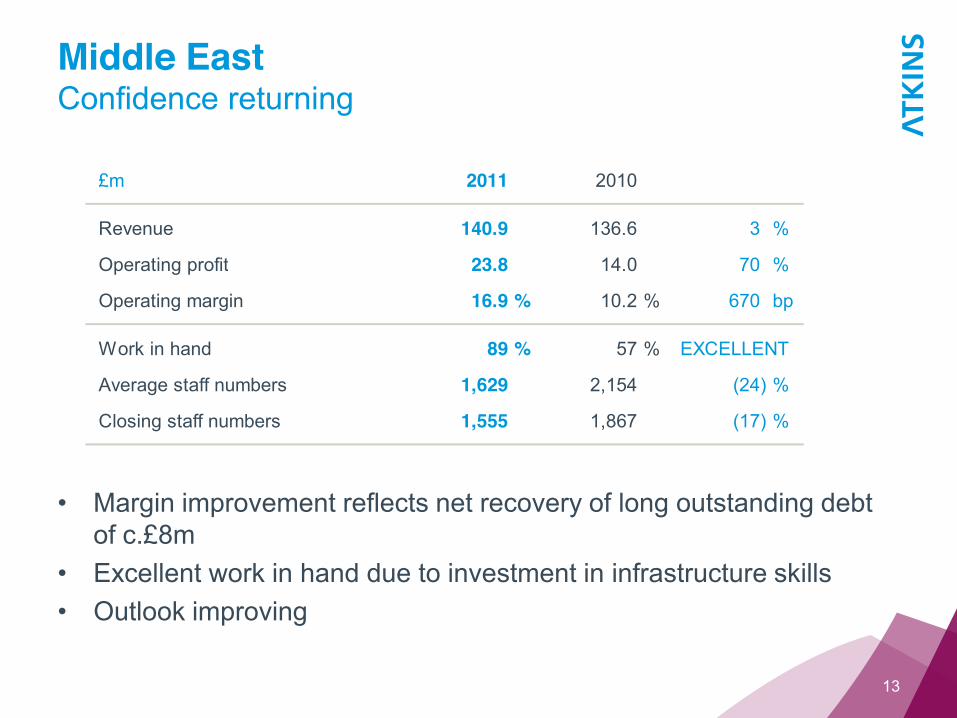
Middle EastConfidence returning
Margin improvement reflects net recovery of long outstanding debt of c.£8mExcellent work in hand due to investment in infrastructure skillsOutlook improving
13
£m 2011 2010
Revenue 140.9 136.6 3 %
Operating profit 23.8 14.0 70 %
Operating margin 16.9 % 10.2 % 670 bp
Work in hand 89 % 57 % EXCELLENT
Average staff numbers 1,629 2,154 (24) %
Closing staff numbers 1,555 1,867 (17) %
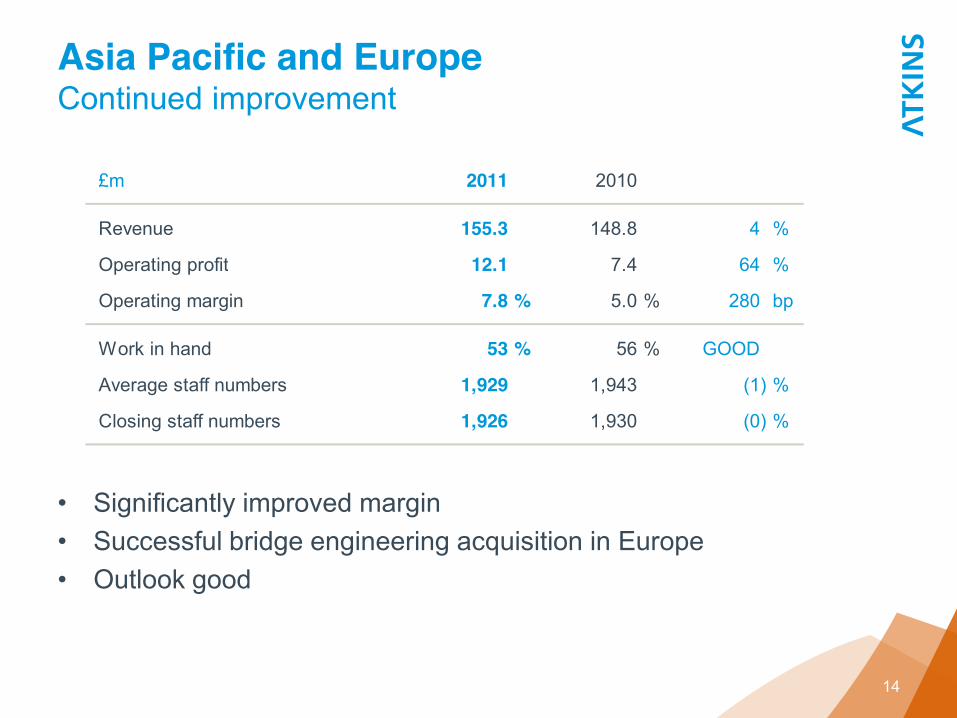
Asia Pacific and EuropeContinued improvement
Significantly improved marginSuccessful bridge engineering acquisition in EuropeOutlook good
14
£m 2011 2010
Revenue 155.3 148.8 4 %
Operating profit 12.1 7.4 64 %
Operating margin 7.8 % 5.0 % 280 bp
Work in hand 53 % 56 % GOOD
Average staff numbers 1,929 1,943 (1) %
Closing staff numbers 1,926 1,930 (0) %
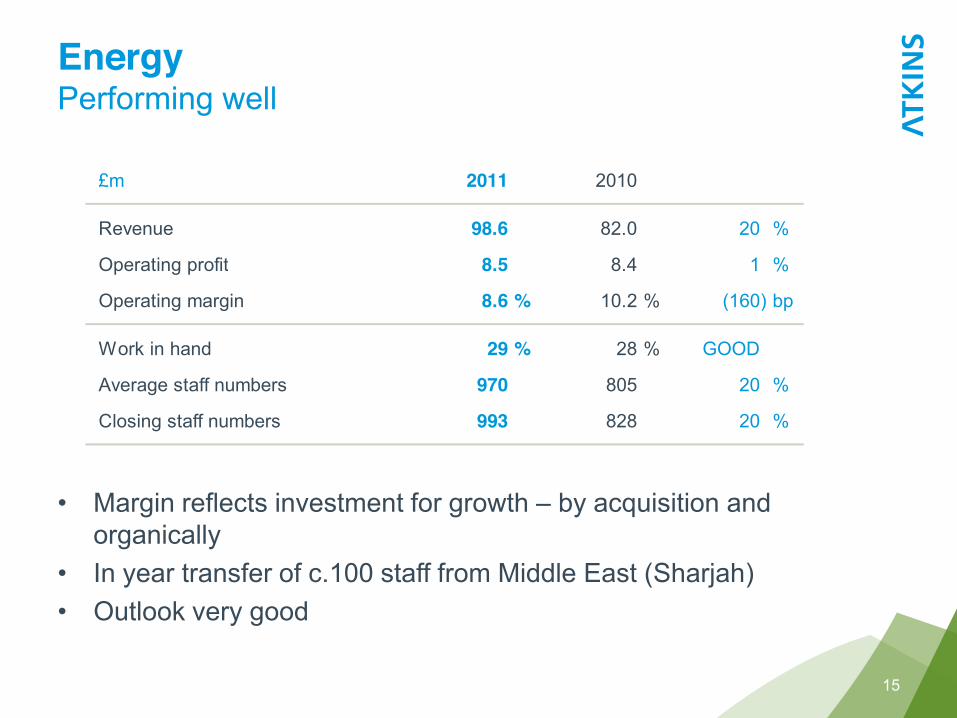
EnergyPerforming well
Margin reflects investment for growth by acquisition and organicallyIn year transfer of c.100 staff from Middle East (Sharjah) Outlook very good
15
£m 2011 2010
Revenue 98.6 82.0 20 %
Operating profit 8.5 8.4 1 %
Operating margin 8.6 % 10.2 % (160) bp
Work in hand 29 % 28 % GOOD
Average staff numbers 970 805 20 %
Closing staff numbers 993 828 20 %
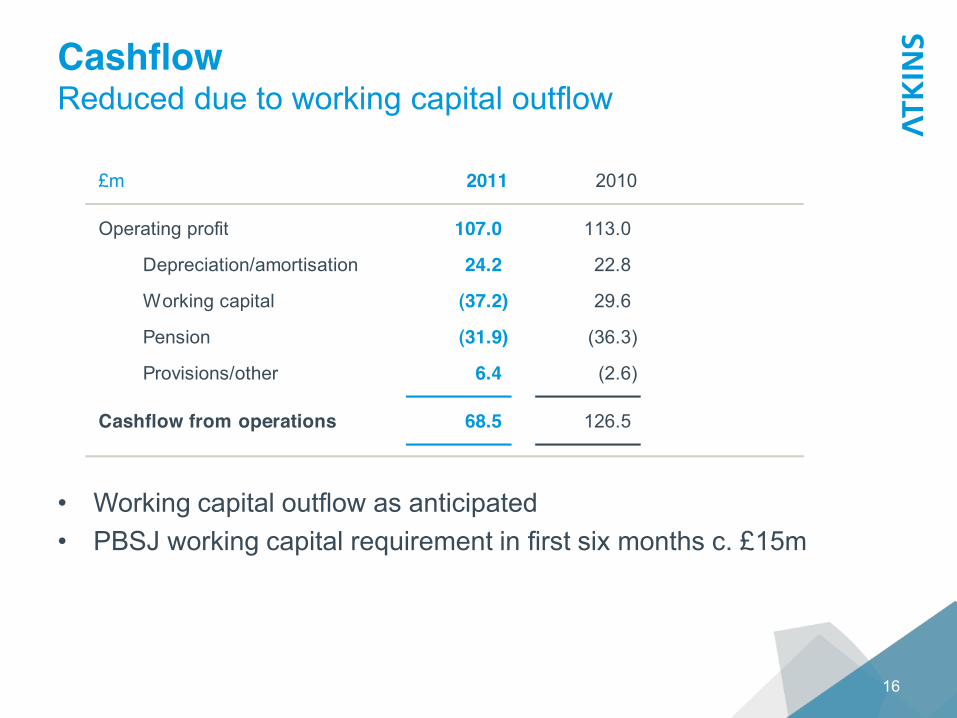
CashflowReduced due to working capital outflow
Working capital outflow as anticipatedPBSJ working capital requirement in first six months c. £15m
16
£m 2011 2010
Operating profit 107.0 113.0
Depreciation/amortisation 24.2 22.8
Working capital (37.2) 29.6
Pension (31.9) (36.3)
Provisions/other 6.4 (2.6)
Cashflow from operations 68.5 126.5
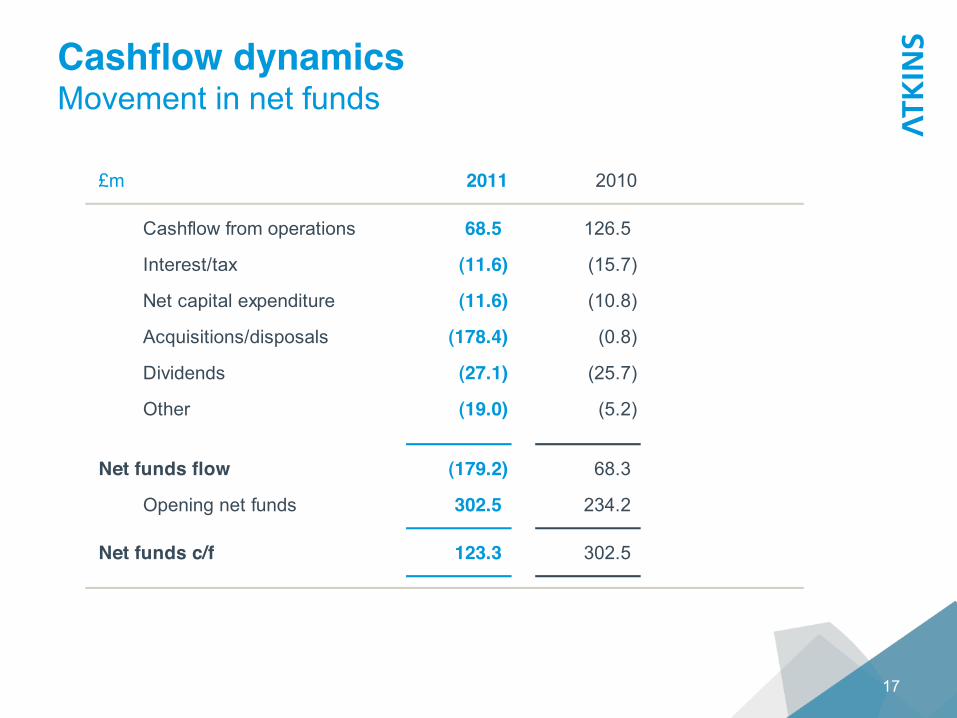
Cashflow dynamicsMovement in net funds
17
£m 2011 2010
Cashflow from operations 68.5 126.5
Interest/tax (11.6) (15.7)
Net capital expenditure (11.6) (10.8)
Acquisitions/disposals (178.4) (0.8)
Dividends (27.1) (25.7)
Other (19.0) (5.2)
Net funds flow (179.2) 68.3
Opening net funds 302.5 234.2
Net funds c/f 123.3 302.5
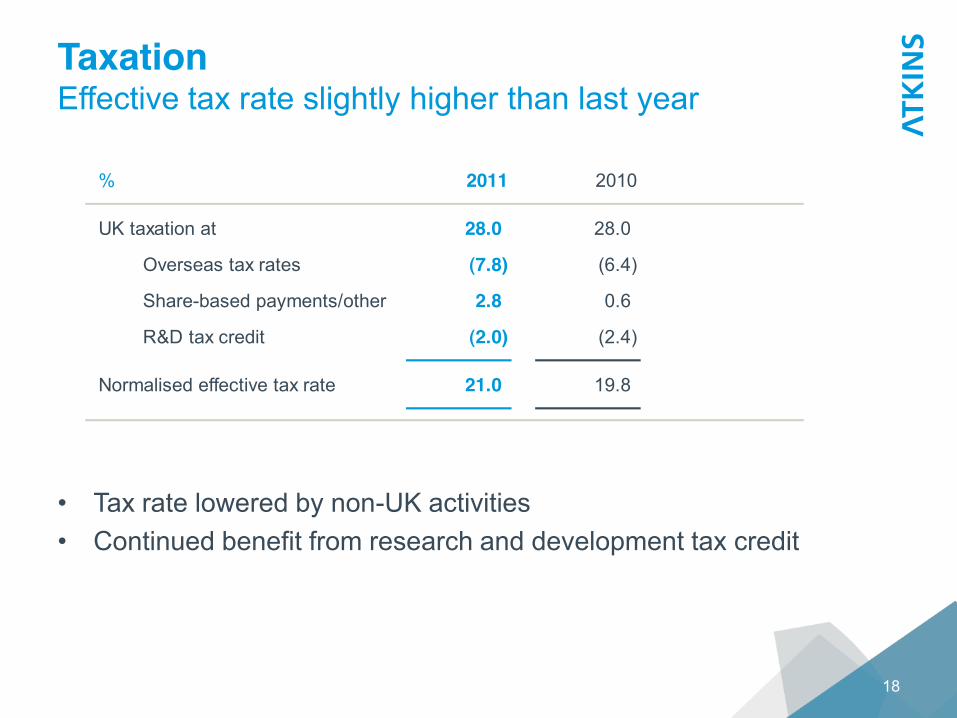
TaxationEffective tax rate slightly higher than last year
Tax rate lowered by non-UK activitiesContinued benefit from research and development tax credit
18
% 2011 2010
UK taxation at 28.0 28.0
Overseas tax rates (7.8) (6.4)
Share-based payments/other 2.8 0.6
R&D tax credit (2.0) (2.4)
Normalised effective tax rate 21.0 19.8
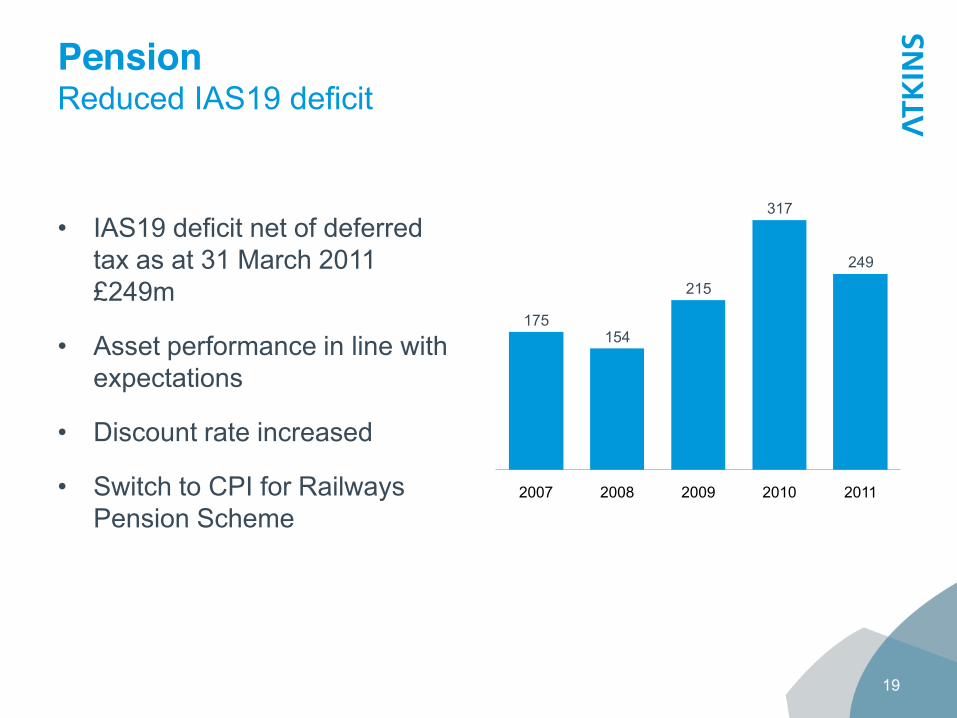
175154
215
317
249
2007 2008 2009 2010 2011
PensionReduced IAS19 deficit
IAS19 deficit net of deferred tax as at 31 March 2011 £249m
Asset performance in line with expectations
Discount rate increased
Switch to CPI for Railways Pension Scheme
19
IAS19 valuationActuarial valuation

PensionAgreement reached on Actuarial Valuation
Actuarial deficit as at 31 March 2010: £293m
Removing final salary link reduces deficit to £265m staff consultation commenced
Funding Plan agreed with the Trustee
£26m p.a. deficit funding for 2011/12 and 2012/13 with £32m p.a. for following 7 years
20
IAS19 valuationActuarial valuation
Good results in a transformational year
The Group is performing well
Transformational steps in key areas
21
Keith Clarke Chief Executive
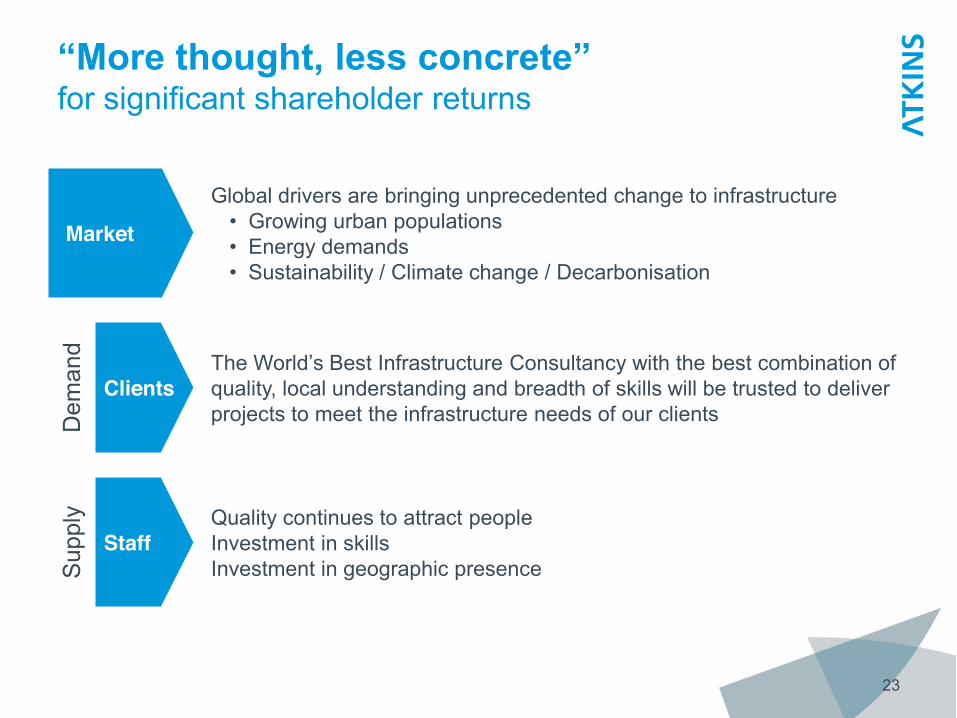
for significant shareholder returns
23
Market
Clients
Staff
Global drivers are bringing unprecedented change to infrastructureGrowing urban populationsEnergy demandsSustainability / Climate change / Decarbonisation
quality, local understanding and breadth of skills will be trusted to deliver projects to meet the infrastructure needs of our clients
Quality continues to attract peopleInvestment in skillsInvestment in geographic presence
Dem
and
Sup
ply
24
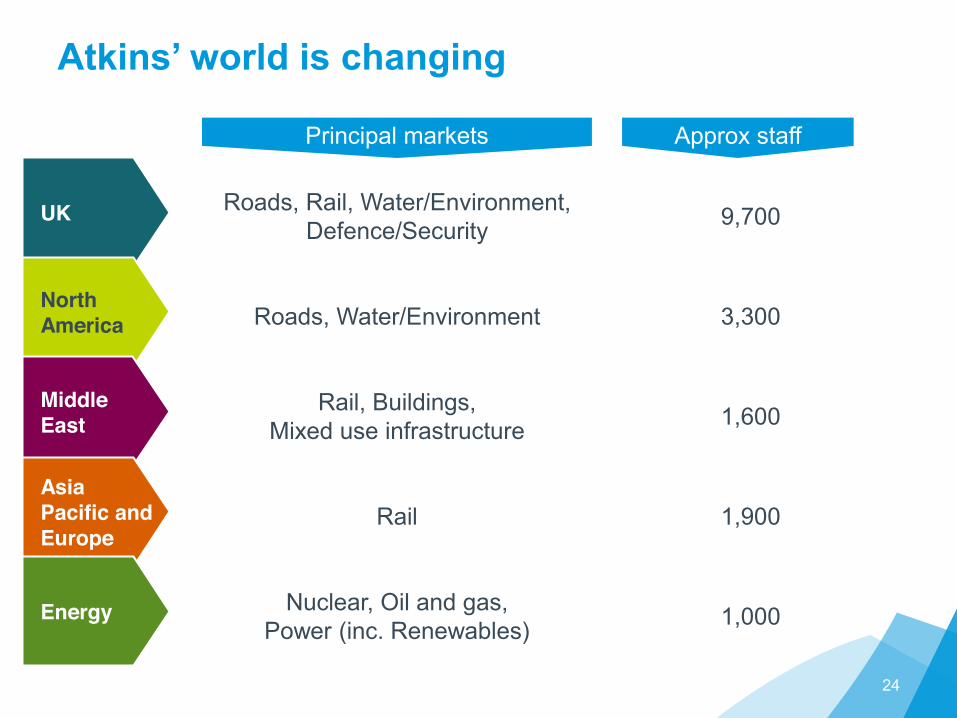
UK
NorthAmerica
MiddleEast
AsiaPacific andEurope
Energy
Principal markets Approx staff
Roads, Rail, Water/Environment, Defence/Security 9,700
Roads, Water/Environment 3,300
Rail, Buildings, Mixed use infrastructure 1,600
Rail 1,900
Nuclear, Oil and gas,Power (inc. Renewables) 1,000
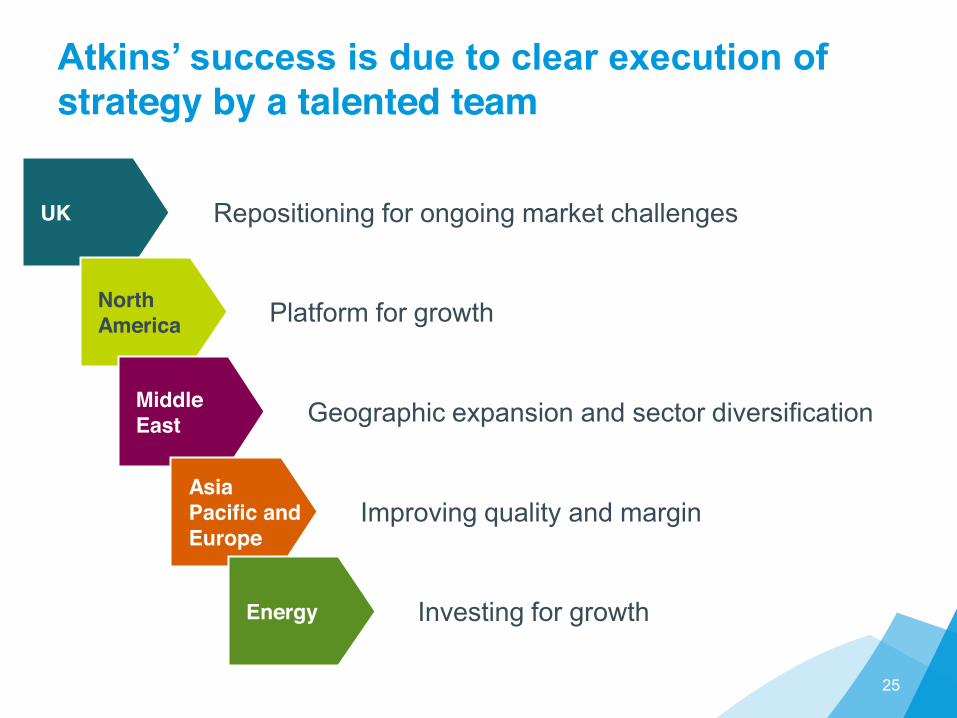
strategy by a talented team
25
UK
NorthAmerica
MiddleEast
AsiaPacific andEurope
Energy
Repositioning for ongoing market challenges
Platform for growth
Geographic expansion and sector diversification
Improving quality and margin
Investing for growth
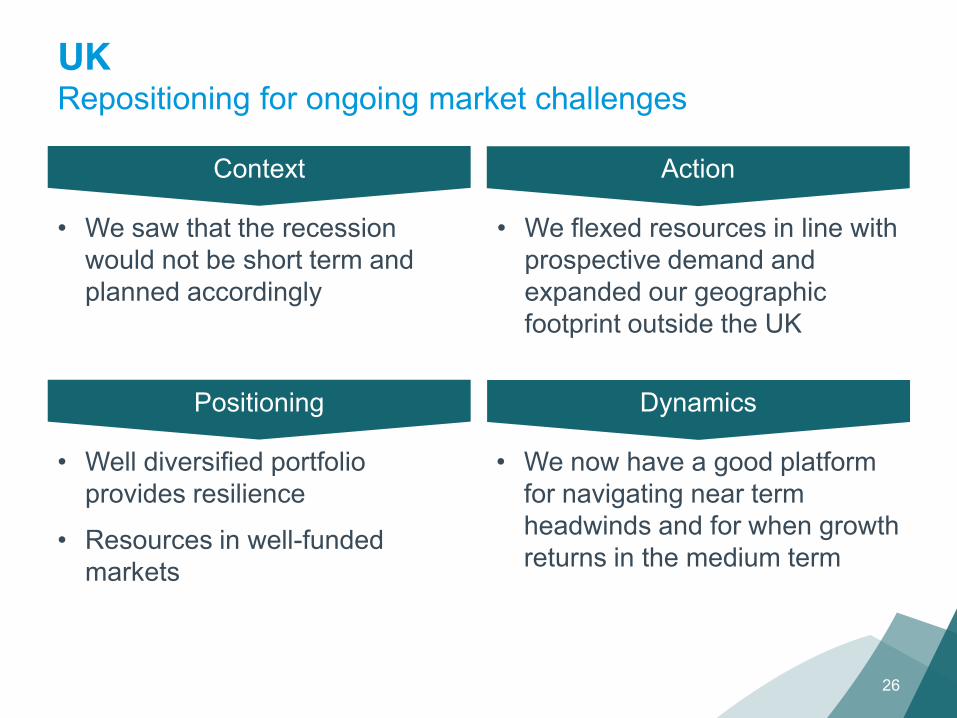
UKRepositioning for ongoing market challenges
We saw that the recession would not be short term and planned accordingly
Action
We flexed resources in line with prospective demand and expanded our geographic footprint outside the UK
26
Context
Well diversified portfolio provides resilience
Resources in well-funded markets
Positioning Dynamics
We now have a good platform for navigating near term headwinds and for when growth returns in the medium term
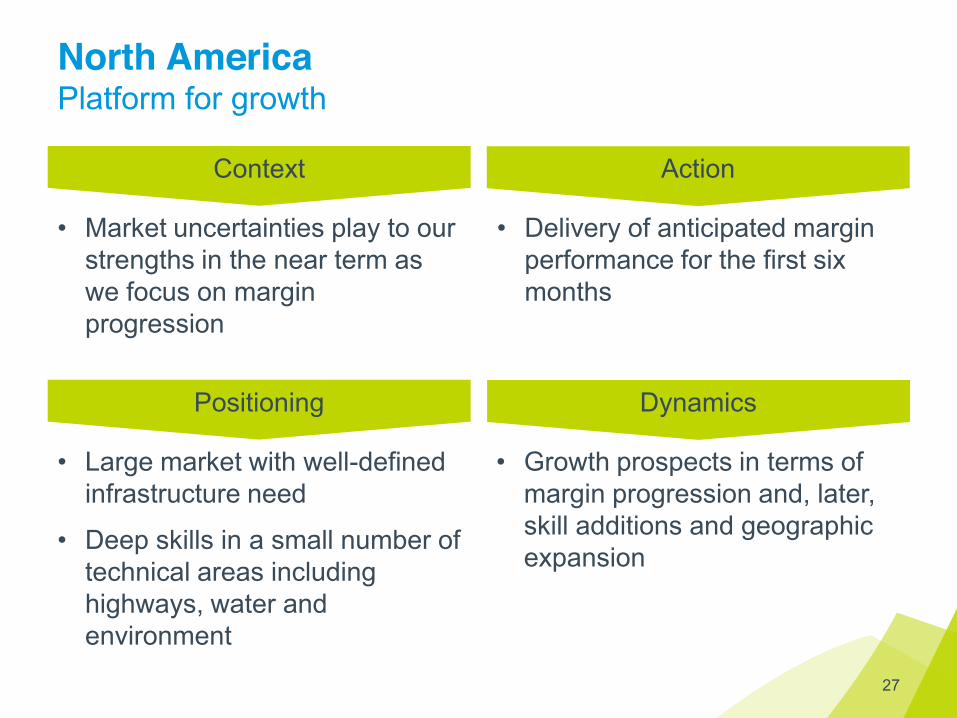
North AmericaPlatform for growth
Market uncertainties play to our strengths in the near term as we focus on margin progression
Action
Delivery of anticipated margin performance for the first six months
27
Context
Large market with well-defined infrastructure need
Deep skills in a small number of technical areas including highways, water and environment
Positioning Dynamics
Growth prospects in terms of margin progression and, later, skill additions and geographic expansion
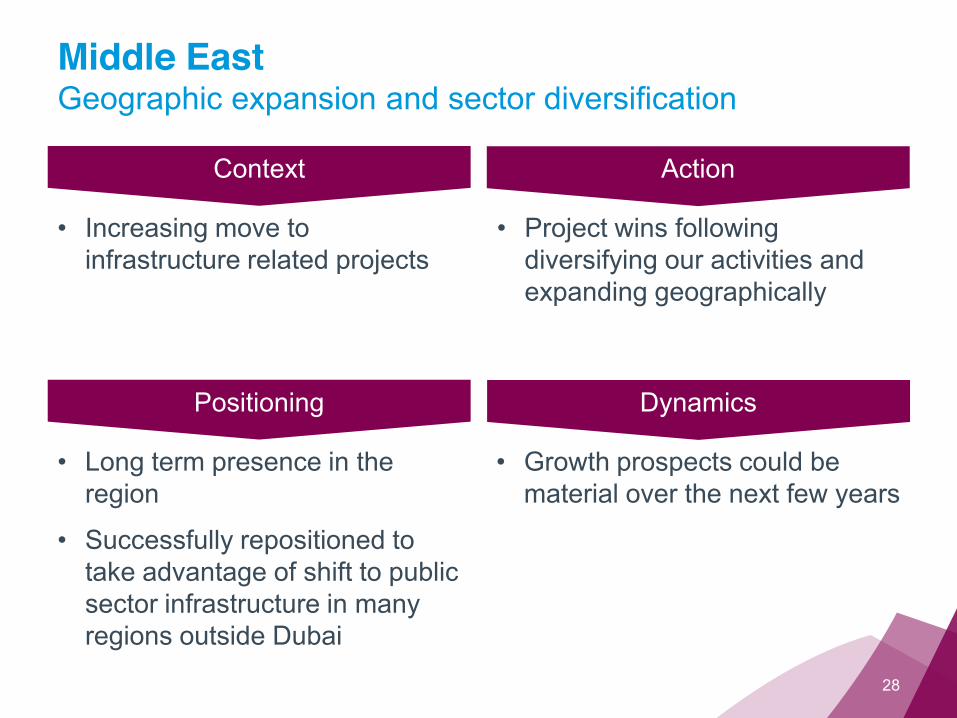
Middle EastGeographic expansion and sector diversification
Increasing move to infrastructure related projects
Action
Project wins following diversifying our activities and expanding geographically
28
Context
Long term presence in the region
Successfully repositioned to take advantage of shift to public sector infrastructure in many regions outside Dubai
Positioning Dynamics
Growth prospects could be material over the next few years
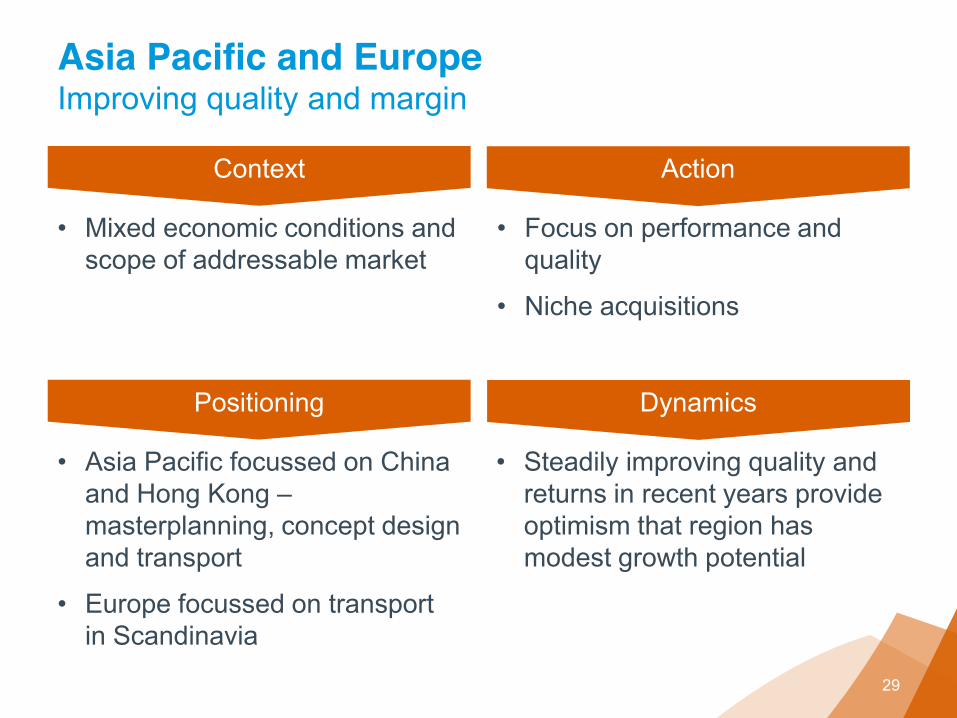
Asia Pacific and EuropeImproving quality and margin
Mixed economic conditions and scope of addressable market
Action
Focus on performance and quality
Niche acquisitions
29
Context
Asia Pacific focussed on China and Hong Kong masterplanning, concept design and transport
Europe focussed on transport in Scandinavia
Positioning Dynamics
Steadily improving quality and returns in recent years provide optimism that region has modest growth potential
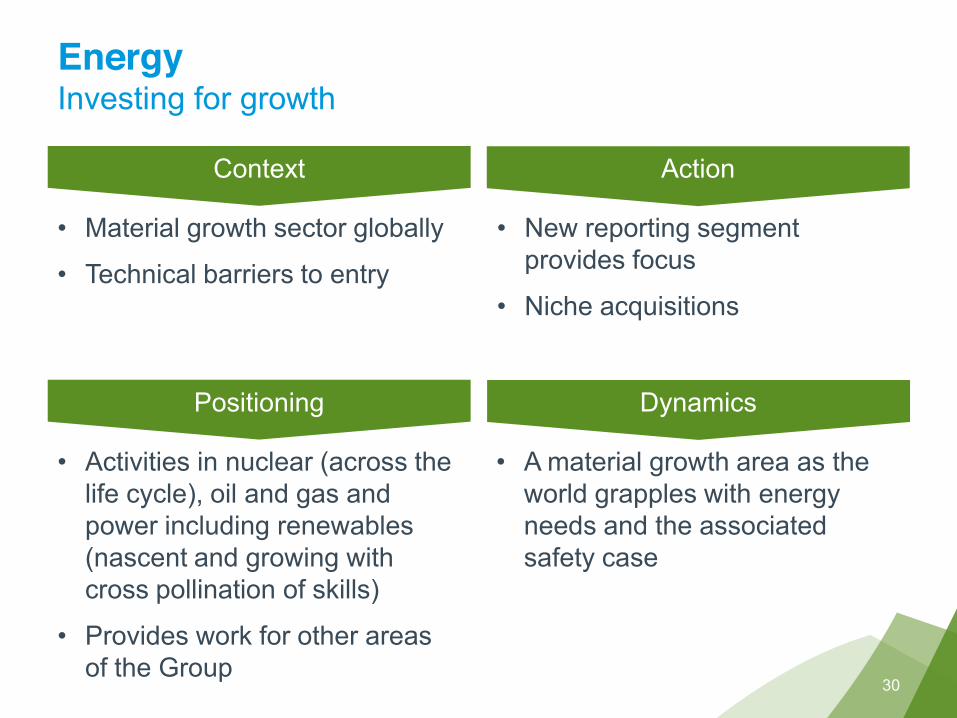
EnergyInvesting for growth
Material growth sector globally
Technical barriers to entry
Action
New reporting segment provides focus
Niche acquisitions
30
Context
Activities in nuclear (across the life cycle), oil and gas and power including renewables(nascent and growing with cross pollination of skills)
Provides work for other areas of the Group
Positioning Dynamics
A material growth area as the world grapples with energy needs and the associated safety case
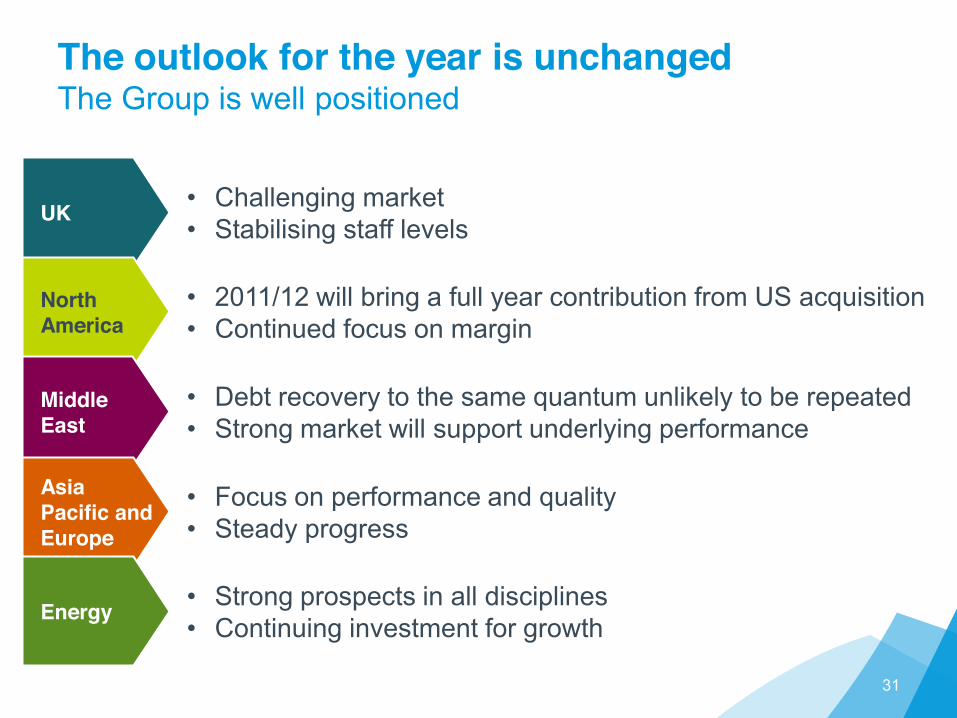
The outlook for the year is unchangedThe Group is well positioned
31
UK
NorthAmerica
MiddleEast
AsiaPacific andEurope
Energy
Challenging marketStabilising staff levels
2011/12 will bring a full year contribution from US acquisitionContinued focus on margin
Debt recovery to the same quantum unlikely to be repeatedStrong market will support underlying performance
Focus on performance and qualitySteady progress
Strong prospects in all disciplinesContinuing investment for growth
Good results in a transformational year, positioning the Group for growth
Continued management focus on quality and agility have delivered good results
Our strategy is working and the Group is well positioned for growth
The outlook for the current year is unchanged and in line with market expectations
32

WS Atkins plcPreliminary results for the year ended31 March 2011
16 June 2011
Appendices
1. Movement in net funds2. Comparative results tables
34
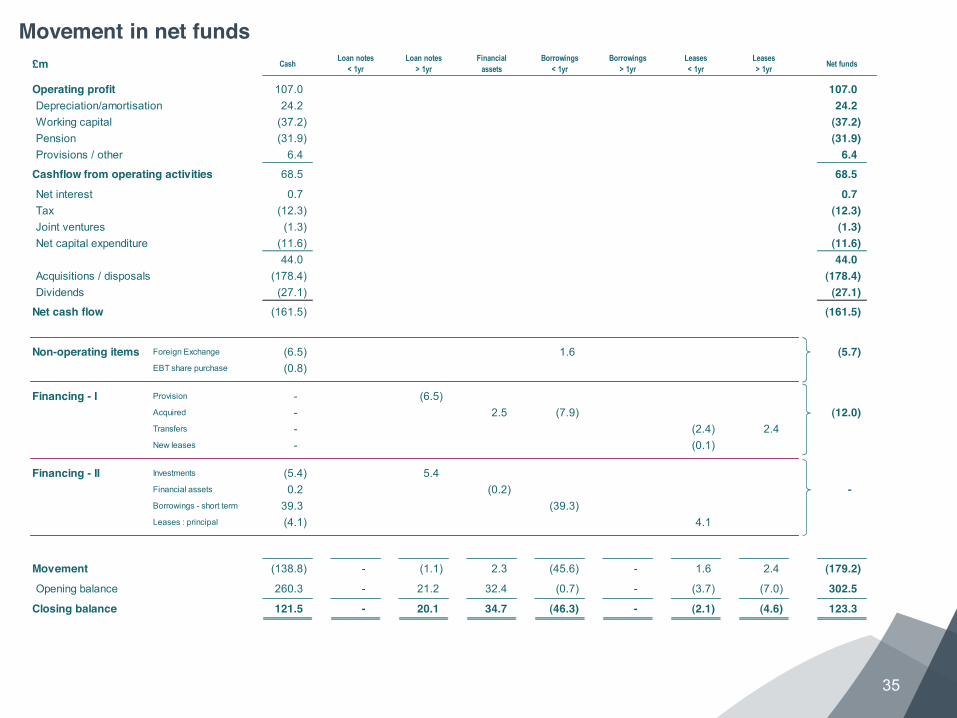
£m CashLoan notes
< 1yrLoan notes
> 1yrFinancial
assetsBorrowings
< 1yrBorrowings
> 1yrLeases< 1yr
Leases> 1yr
Net funds
Operating profit 107.0 107.0Depreciation/amortisation 24.2 24.2Working capital (37.2) (37.2)Pension (31.9) (31.9)Provisions / other 6.4 6.4
Cashflow from operating activities 68.5 68.5
Net interest 0.7 0.7Tax (12.3) (12.3)Joint ventures (1.3) (1.3)Net capital expenditure (11.6) (11.6)
44.0 44.0Acquisitions / disposals (178.4) (178.4)Dividends (27.1) (27.1)
Net cash flow (161.5) (161.5)
Non-operating items Foreign Exchange (6.5) 1.6 (5.7)EBT share purchase (0.8)
Financing - I Provision - (6.5)Acquired - 2.5 (7.9) (12.0)Transfers - (2.4) 2.4New leases - (0.1)
Financing - II Investments (5.4) 5.4Financial assets 0.2 (0.2) -Borrowings - short term 39.3 (39.3)Leases : principal (4.1) 4.1
Movement (138.8) - (1.1) 2.3 (45.6) - 1.6 2.4 (179.2)
Opening balance 260.3 - 21.2 32.4 (0.7) - (3.7) (7.0) 302.5
Closing balance 121.5 - 20.1 34.7 (46.3) - (2.1) (4.6) 123.3
Movement in net funds
35
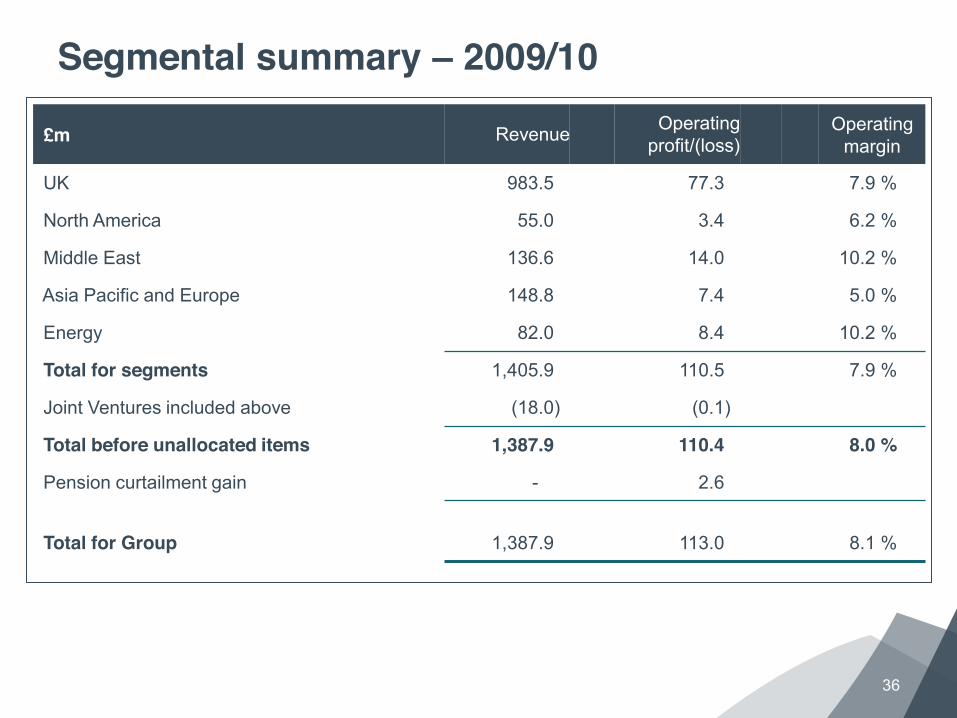
Segmental summary 2009/10
36
£m Revenue Operating profit/(loss)
Operating margin
UK 983.5 77.3 7.9 %
North America 55.0 3.4 6.2 %
Middle East 136.6 14.0 10.2 %
Asia Pacific and Europe 148.8 7.4 5.0 %
Energy 82.0 8.4 10.2 %
Total for segments 1,405.9 110.5 7.9 %
Joint Ventures included above (18.0) (0.1)
Total before unallocated items 1,387.9 110.4 8.0 %
Pension curtailment gain - 2.6
Total for Group 1,387.9 113.0 8.1 %
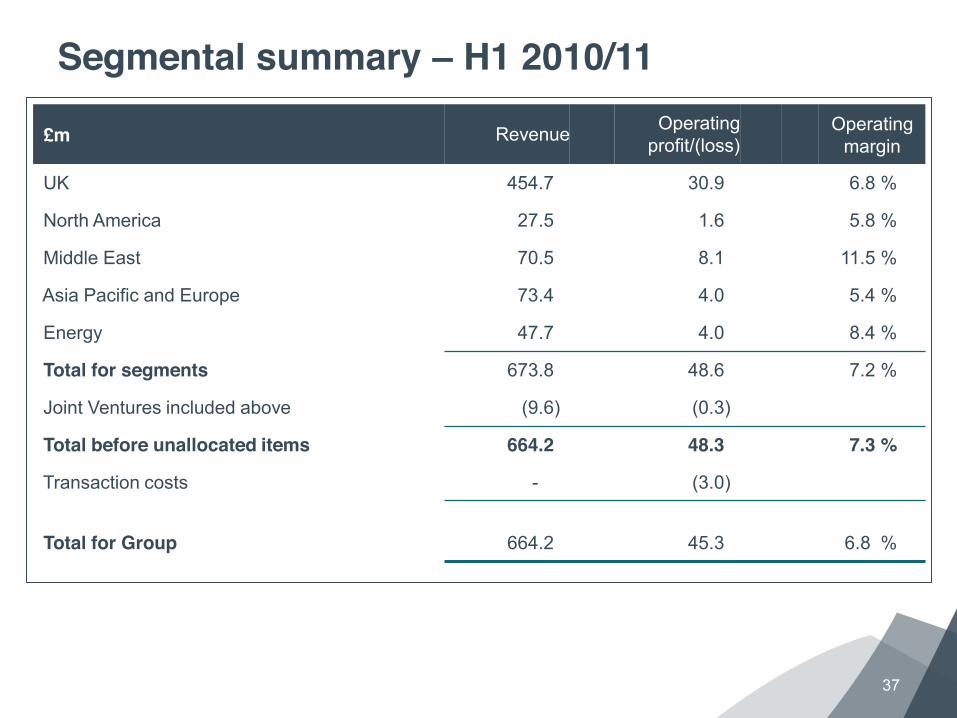
Segmental summary H1 2010/11
37
£m Revenue Operating profit/(loss)
Operating margin
UK 454.7 30.9 6.8 %
North America 27.5 1.6 5.8 %
Middle East 70.5 8.1 11.5 %
Asia Pacific and Europe 73.4 4.0 5.4 %
Energy 47.7 4.0 8.4 %
Total for segments 673.8 48.6 7.2 %
Joint Ventures included above (9.6) (0.3)
Total before unallocated items 664.2 48.3 7.3 %
Transaction costs - (3.0)
Total for Group 664.2 45.3 6.8 %
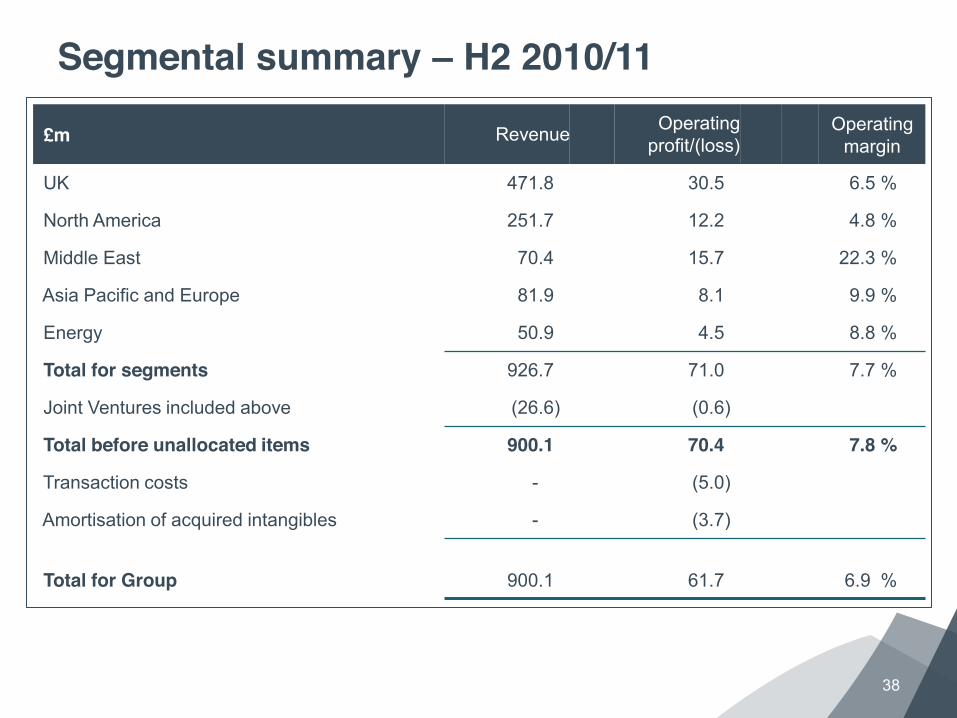
Segmental summary H2 2010/11
38
£m Revenue Operating profit/(loss)
Operating margin
UK 471.8 30.5 6.5 %
North America 251.7 12.2 4.8 %
Middle East 70.4 15.7 22.3 %
Asia Pacific and Europe 81.9 8.1 9.9 %
Energy 50.9 4.5 8.8 %
Total for segments 926.7 71.0 7.7 %
Joint Ventures included above (26.6) (0.6)
Total before unallocated items 900.1 70.4 7.8 %
Transaction costs - (5.0)
Amortisation of acquired intangibles - (3.7)
Total for Group 900.1 61.7 6.9 %
Disclaimer
The information in this presentation pack which does not purport to be comprehensive has been provided by Atkins, and has not been independently verified. While this information has been prepared in good faith, no representation or warranty, express or implied, is or will be made and no responsibility or liability is or will be accepted by Atkins, as to or in relation to the accuracy or completeness of this presentation pack or any other written or oral information made available as part of the presentation and any such liability is expressly disclaimed. Further, whilst Atkins may subsequently update the information made available in this presentation, we expressly disclaim any obligation to do so.
The presentation contains indications of likely future developments and other forward-looking statements that are subject to risk factors associated with, among other things, the economic and business circumstances occurring from time to time in the countries, sectors and business segments in which the Group operates. These and
prospects. Forward-looking statements involve risks, uncertainties and assumptions. They relate to events and/or depend on circumstances in the future which could cause actual results and outcomes to differ. No obligation is assumed to update any forward-looking statements, whether as a result of new information, future events or otherwise.
39