Embed Size (px)
Citation preview
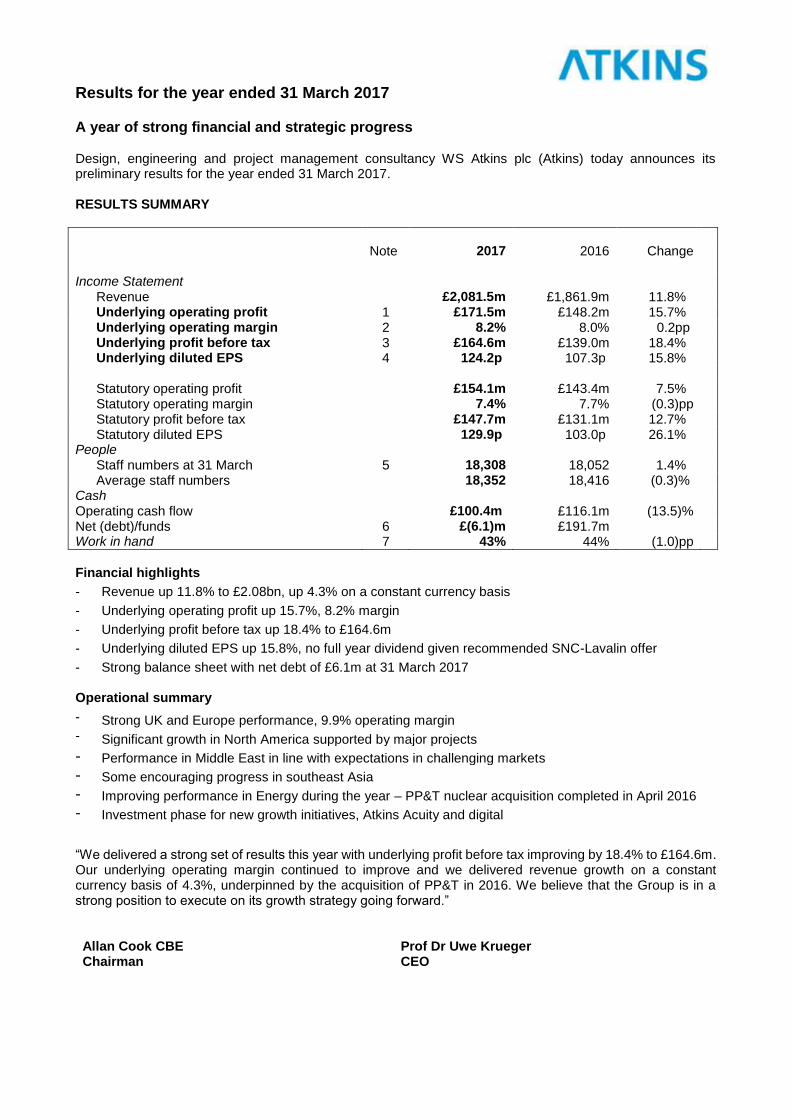
Results for the year ended 31 March 2017 A year of strong financial and strategic progress Design, engineering and project management consultancy WS Atkins plc (Atkins) today announces its preliminary results for the year ended 31 March 2017. RESULTS SUMMARY
Note
2017
2016
Change
Income Statement Revenue £2,081.5m £1,861.9m 11.8% Underlying operating profit 1 £171.5m £148.2m 15.7% Underlying operating margin 2 8.2% 8.0% 0.2pp Underlying profit before tax 3 £164.6m £139.0m 18.4% Underlying diluted EPS 4 124.2p 107.3p 15.8% Statutory operating profit £154.1m £143.4m 7.5% Statutory operating margin 7.4% 7.7% (0.3)pp Statutory profit before tax £147.7m £131.1m 12.7% Statutory diluted EPS 129.9p 103.0p 26.1% People Staff numbers at 31 March 5 18,308 18,052 1.4% Average staff numbers 18,352 18,416 (0.3)% Cash Operating cash flow £100.4m £116.1m (13.5)% Net (debt)/funds 6 £(6.1)m £191.7m Work in hand 7 43% 44% (1.0)pp
Financial highlights
- Revenue up 11.8% to £2.08bn, up 4.3% on a constant currency basis
- Underlying operating profit up 15.7%, 8.2% margin
- Underlying profit before tax up 18.4% to £164.6m
- Underlying diluted EPS up 15.8%, no full year dividend given recommended SNC-Lavalin offer
-
Strong balance sheet with net debt of £6.1m at 31 March 2017
Operational summary
- Strong UK and Europe performance, 9.9% operating margin - Significant growth in North America supported by major projects
- Performance in Middle East in line with expectations in challenging markets
- Some encouraging progress in southeast Asia
- Improving performance in Energy during the year – PP&T nuclear acquisition completed in April 2016
- Investment phase for new growth initiatives, Atkins Acuity and digital
“We delivered a strong set of results this year with underlying profit before tax improving by 18.4% to £164.6m. Our underlying operating margin continued to improve and we delivered revenue growth on a constant currency basis of 4.3%, underpinned by the acquisition of PP&T in 2016. We believe that the Group is in a strong position to execute on its growth strategy going forward.” Allan Cook CBE Chairman
Prof Dr Uwe Krueger CEO
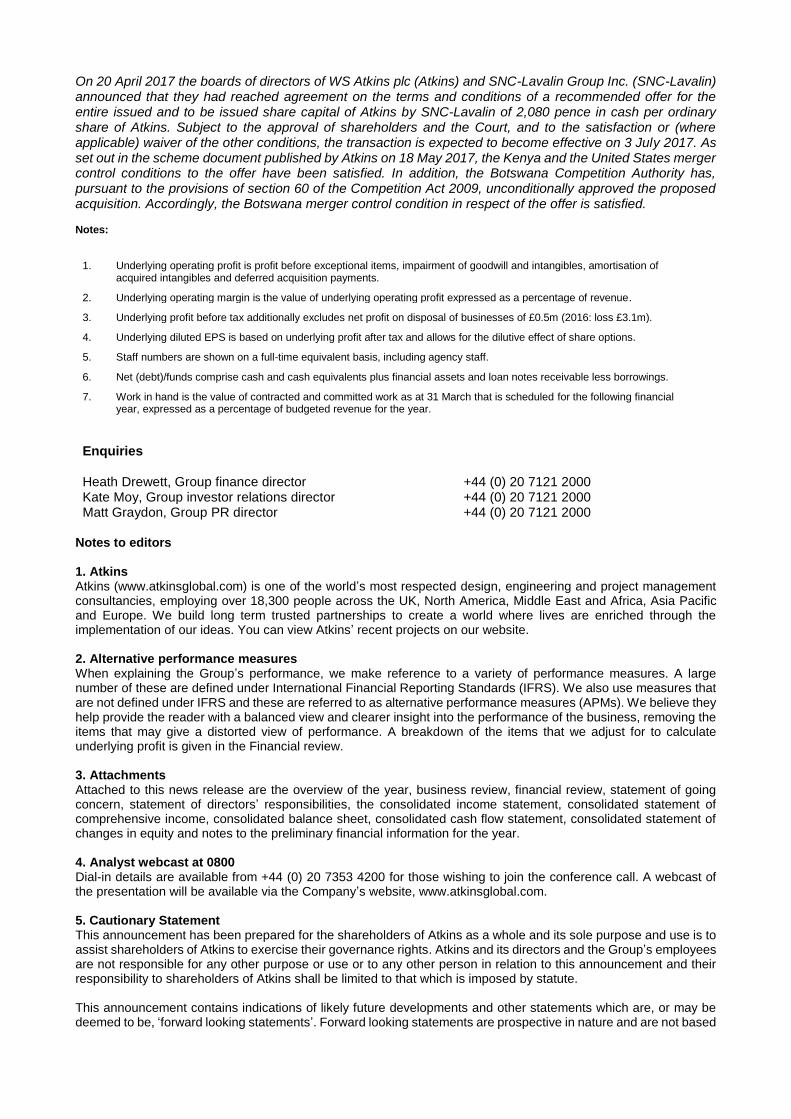
On 20 April 2017 the boards of directors of WS Atkins plc (Atkins) and SNC-Lavalin Group Inc. (SNC-Lavalin) announced that they had reached agreement on the terms and conditions of a recommended offer for the entire issued and to be issued share capital of Atkins by SNC-Lavalin of 2,080 pence in cash per ordinary share of Atkins. Subject to the approval of shareholders and the Court, and to the satisfaction or (where applicable) waiver of the other conditions, the transaction is expected to become effective on 3 July 2017. As set out in the scheme document published by Atkins on 18 May 2017, the Kenya and the United States merger control conditions to the offer have been satisfied. In addition, the Botswana Competition Authority has, pursuant to the provisions of section 60 of the Competition Act 2009, unconditionally approved the proposed acquisition. Accordingly, the Botswana merger control condition in respect of the offer is satisfied. Notes:
1. Underlying operating profit is profit before exceptional items, impairment of goodwill and intangibles, amortisation of acquired intangibles and deferred acquisition payments.
2. Underlying operating margin is the value of underlying operating profit expressed as a percentage of revenue.
3. Underlying profit before tax additionally excludes net profit on disposal of businesses of £0.5m (2016: loss £3.1m).
4. Underlying diluted EPS is based on underlying profit after tax and allows for the dilutive effect of share options.
5. Staff numbers are shown on a full-time equivalent basis, including agency staff.
6. Net (debt)/funds comprise cash and cash equivalents plus financial assets and loan notes receivable less borrowings.
7. Work in hand is the value of contracted and committed work as at 31 March that is scheduled for the following financial year, expressed as a percentage of budgeted revenue for the year.
Enquiries Heath Drewett, Group finance director +44 (0) 20 7121 2000 Kate Moy, Group investor relations director +44 (0) 20 7121 2000 Matt Graydon, Group PR director +44 (0) 20 7121 2000
Notes to editors 1. Atkins Atkins (www.atkinsglobal.com) is one of the world’s most respected design, engineering and project management consultancies, employing over 18,300 people across the UK, North America, Middle East and Africa, Asia Pacific and Europe. We build long term trusted partnerships to create a world where lives are enriched through the implementation of our ideas. You can view Atkins’ recent projects on our website. 2. Alternative performance measures When explaining the Group’s performance, we make reference to a variety of performance measures. A large number of these are defined under International Financial Reporting Standards (IFRS). We also use measures that are not defined under IFRS and these are referred to as alternative performance measures (APMs). We believe they help provide the reader with a balanced view and clearer insight into the performance of the business, removing the items that may give a distorted view of performance. A breakdown of the items that we adjust for to calculate underlying profit is given in the Financial review. 3. Attachments Attached to this news release are the overview of the year, business review, financial review, statement of going concern, statement of directors’ responsibilities, the consolidated income statement, consolidated statement of comprehensive income, consolidated balance sheet, consolidated cash flow statement, consolidated statement of changes in equity and notes to the preliminary financial information for the year. 4. Analyst webcast at 0800 Dial-in details are available from +44 (0) 20 7353 4200 for those wishing to join the conference call. A webcast of the presentation will be available via the Company’s website, www.atkinsglobal.com. 5. Cautionary Statement This announcement has been prepared for the shareholders of Atkins as a whole and its sole purpose and use is to assist shareholders of Atkins to exercise their governance rights. Atkins and its directors and the Group’s employees are not responsible for any other purpose or use or to any other person in relation to this announcement and their responsibility to shareholders of Atkins shall be limited to that which is imposed by statute. This announcement contains indications of likely future developments and other statements which are, or may be deemed to be, ‘forward looking statements’. Forward looking statements are prospective in nature and are not based

on historical or current facts, but rather on current expectations and projections of the management of Atkins about future events, and are therefore subject to risk factors associated with, among other things, the economic and business circumstances occurring from time to time in the countries, sectors and business segments in which the Group operates. These and other factors could adversely affect the Group’s results, strategy and prospects. Forward looking statements involve risks, uncertainties and assumptions. They relate to events and/or depend on circumstances in the future which could cause actual results and outcomes to differ materially from the future results expressed or implied by the forward-looking statements. You are cautioned not to place any reliance on these forward looking statements. No obligation is assumed to update or revise any forward looking statements, whether as a result of new information, future events or otherwise. Nothing in this announcement should be construed as a profit forecast. All persons, wherever located, should consult any additional disclosures that Atkins may make in any regulatory announcements or documents which it publishes. All persons, wherever located, should take note of these disclosures. The information in this announcement does not constitute an offer to sell or an invitation to buy shares in Atkins or an invitation or inducement to engage in any other investment activities. Past performance cannot be relied upon as a guide to future performance. 6. Publication on a website A copy of this announcement and the preliminary results video are available on Atkins’ website at www.investors.atkinsglobal.com/results-centre.
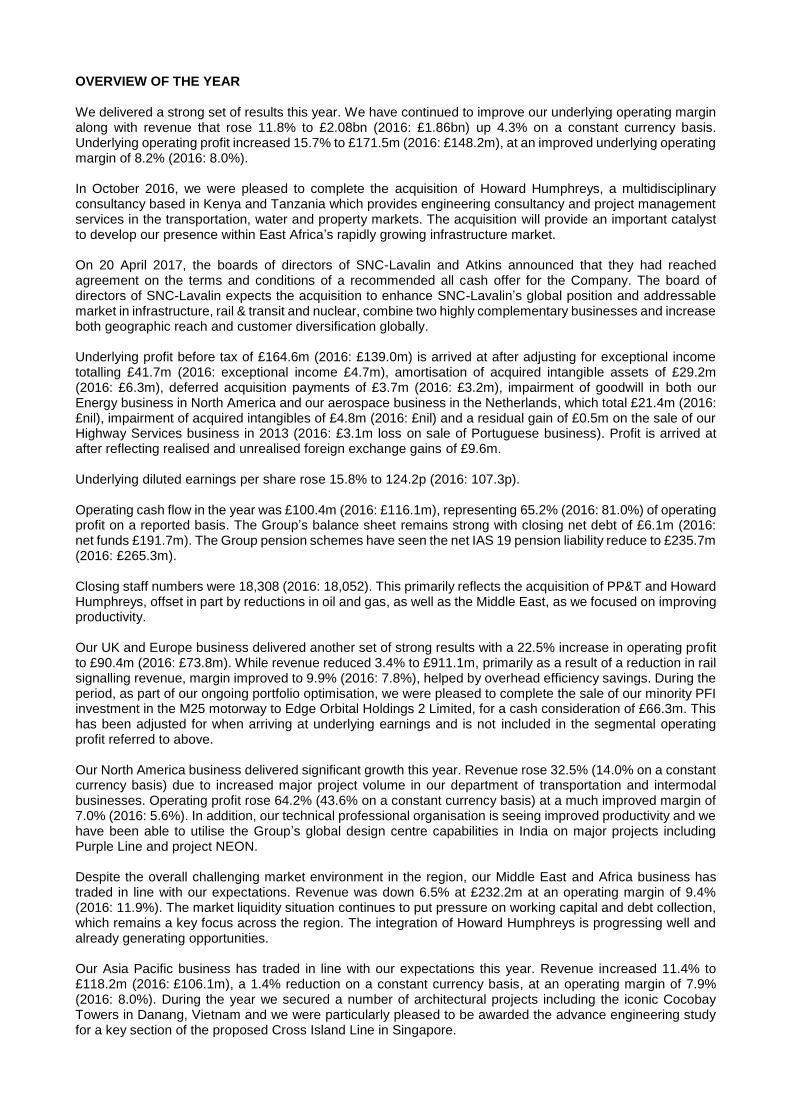
OVERVIEW OF THE YEAR We delivered a strong set of results this year. We have continued to improve our underlying operating margin along with revenue that rose 11.8% to £2.08bn (2016: £1.86bn) up 4.3% on a constant currency basis. Underlying operating profit increased 15.7% to £171.5m (2016: £148.2m), at an improved underlying operating margin of 8.2% (2016: 8.0%). In October 2016, we were pleased to complete the acquisition of Howard Humphreys, a multidisciplinary consultancy based in Kenya and Tanzania which provides engineering consultancy and project management services in the transportation, water and property markets. The acquisition will provide an important catalyst to develop our presence within East Africa’s rapidly growing infrastructure market. On 20 April 2017, the boards of directors of SNC-Lavalin and Atkins announced that they had reached agreement on the terms and conditions of a recommended all cash offer for the Company. The board of directors of SNC-Lavalin expects the acquisition to enhance SNC-Lavalin’s global position and addressable market in infrastructure, rail & transit and nuclear, combine two highly complementary businesses and increase both geographic reach and customer diversification globally. Underlying profit before tax of £164.6m (2016: £139.0m) is arrived at after adjusting for exceptional income totalling £41.7m (2016: exceptional income £4.7m), amortisation of acquired intangible assets of £29.2m (2016: £6.3m), deferred acquisition payments of £3.7m (2016: £3.2m), impairment of goodwill in both our Energy business in North America and our aerospace business in the Netherlands, which total £21.4m (2016: £nil), impairment of acquired intangibles of £4.8m (2016: £nil) and a residual gain of £0.5m on the sale of our Highway Services business in 2013 (2016: £3.1m loss on sale of Portuguese business). Profit is arrived at after reflecting realised and unrealised foreign exchange gains of £9.6m. Underlying diluted earnings per share rose 15.8% to 124.2p (2016: 107.3p). Operating cash flow in the year was £100.4m (2016: £116.1m), representing 65.2% (2016: 81.0%) of operating profit on a reported basis. The Group’s balance sheet remains strong with closing net debt of £6.1m (2016: net funds £191.7m). The Group pension schemes have seen the net IAS 19 pension liability reduce to £235.7m (2016: £265.3m). Closing staff numbers were 18,308 (2016: 18,052). This primarily reflects the acquisition of PP&T and Howard Humphreys, offset in part by reductions in oil and gas, as well as the Middle East, as we focused on improving productivity. Our UK and Europe business delivered another set of strong results with a 22.5% increase in operating profit to £90.4m (2016: £73.8m). While revenue reduced 3.4% to £911.1m, primarily as a result of a reduction in rail signalling revenue, margin improved to 9.9% (2016: 7.8%), helped by overhead efficiency savings. During the period, as part of our ongoing portfolio optimisation, we were pleased to complete the sale of our minority PFI investment in the M25 motorway to Edge Orbital Holdings 2 Limited, for a cash consideration of £66.3m. This has been adjusted for when arriving at underlying earnings and is not included in the segmental operating profit referred to above. Our North America business delivered significant growth this year. Revenue rose 32.5% (14.0% on a constant currency basis) due to increased major project volume in our department of transportation and intermodal businesses. Operating profit rose 64.2% (43.6% on a constant currency basis) at a much improved margin of 7.0% (2016: 5.6%). In addition, our technical professional organisation is seeing improved productivity and we have been able to utilise the Group’s global design centre capabilities in India on major projects including Purple Line and project NEON. Despite the overall challenging market environment in the region, our Middle East and Africa business has traded in line with our expectations. Revenue was down 6.5% at £232.2m at an operating margin of 9.4% (2016: 11.9%). The market liquidity situation continues to put pressure on working capital and debt collection, which remains a key focus across the region. The integration of Howard Humphreys is progressing well and already generating opportunities. Our Asia Pacific business has traded in line with our expectations this year. Revenue increased 11.4% to £118.2m (2016: £106.1m), a 1.4% reduction on a constant currency basis, at an operating margin of 7.9% (2016: 8.0%). During the year we secured a number of architectural projects including the iconic Cocobay Towers in Danang, Vietnam and we were particularly pleased to be awarded the advance engineering study for a key section of the proposed Cross Island Line in Singapore.

Market conditions for our Energy business improved in the second half, particularly in oil and gas. Nuclear performed well during the year and power and renewables remain in line with our expectations. The challenges in some oil and gas markets reduced in the second half as oil prices stabilised. Revenue and operating profit rose to £327.0m and £30.3m respectively (2016: £201.3m and £16.7m respectively), reflecting the acquisition of PP&T which completed in April 2016 and contributed revenue of £142.8m in the year. Our margin improved to 9.3% (2016: 8.3%). We are making headway into the Chinese renewables market with a recent appointment to design the offshore substation platform for the Binhai South Phase3 offshore windfarm in the Yellow Sea, our first offshore wind project in China. People We continue our work to attract more people into pursuing a career in the engineering sector. During the year, we welcomed over 300 new graduates across the Group and accelerated our apprentice programme by recruiting 60 apprentices within our UK business. We are a member of the ‘5% Club’, an industry-led campaign whose member organisations make a public commitment to have at least 5% of their UK workforce on formal graduate and apprenticeship schemes. Our current proportion is 11.9% (2016: 12.3%) of UK headcount. A more diverse and inclusive workforce is required to address the critical skills shortage in our industry and we are committed to building a more diverse and inclusive organisation globally. A women’s professional network is now well established in all our major office locations and we continue to roll out our flexible working practices across the Group. Dividend An interim dividend of 12.5p per share was paid on 6 January 2017 to all shareholders on the register on 25 November 2016. On 20 April 2017 the boards of directors of Atkins and SNC-Lavalin announced they had reached agreement on the terms and conditions of a recommended all cash offer for the entire issued and to be issued share capital of Atkins by SNC-Lavalin of 2,080 pence in cash per ordinary share of Atkins. The offer price has been agreed on the basis that no final dividend for the financial year ended 31 March 2017 will be paid by Atkins to its shareholders. If Atkins announces, declares, makes or pays any dividend or other distribution prior to the acquisition becoming effective, SNC-Lavalin reserves the right to reduce the offer price by an amount equal to the amount of such dividend or distribution. Outlook We are successfully delivering on our three strategic growth priorities. Despite an uncertain macroeconomic environment, our focused strategy and execution has supported total shareholder returns (TSR) of 144% over the five years to 31 March 2017. Our strategy to position the business in end-markets with favourable long-term trends, together with specific growth initiatives such as our Acuity advisory business, our expansion in nuclear engineering and our focus on digital and technology, position us well for future growth.
BUSINESS REVIEW Segmental performance
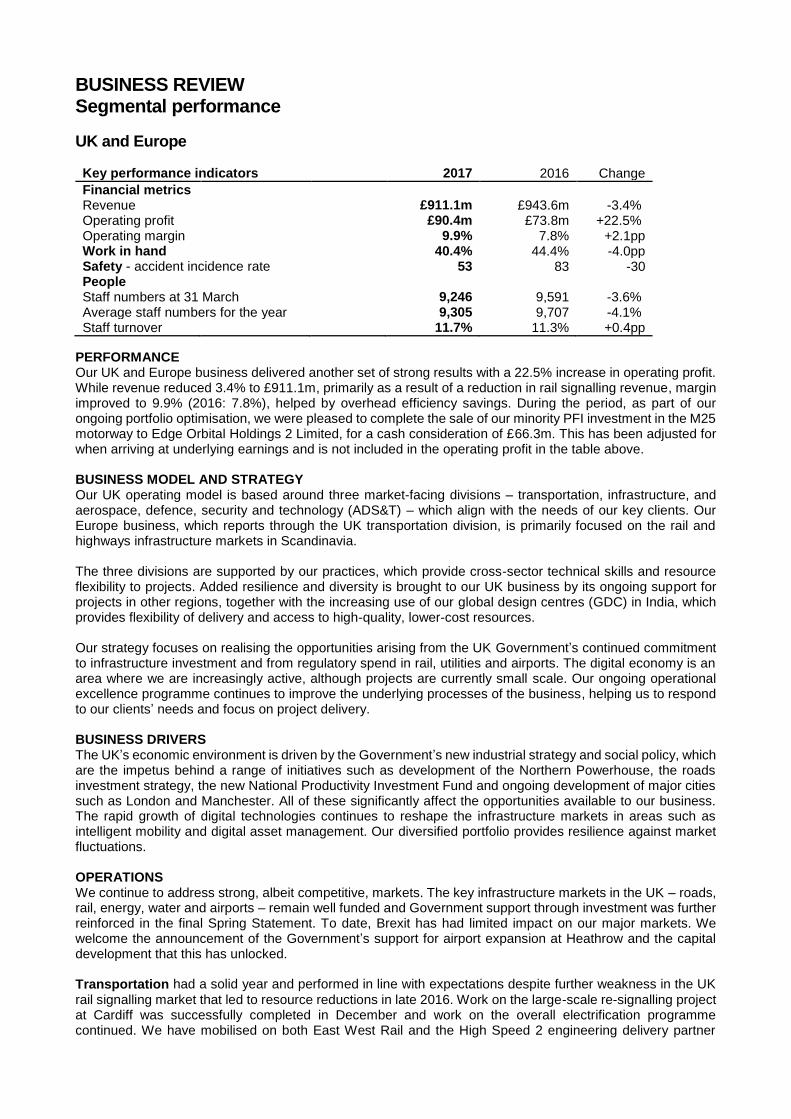
UK and Europe Key performance indicators 2017 2016 Change
Financial metrics Revenue £911.1m £943.6m -3.4% Operating profit £90.4m £73.8m +22.5% Operating margin 9.9% 7.8% +2.1pp Work in hand 40.4% 44.4% -4.0pp Safety - accident incidence rate 53 83 -30 People Staff numbers at 31 March 9,246 9,591 -3.6% Average staff numbers for the year 9,305 9,707 -4.1% Staff turnover 11.7% 11.3% +0.4pp
PERFORMANCE Our UK and Europe business delivered another set of strong results with a 22.5% increase in operating profit. While revenue reduced 3.4% to £911.1m, primarily as a result of a reduction in rail signalling revenue, margin improved to 9.9% (2016: 7.8%), helped by overhead efficiency savings. During the period, as part of our ongoing portfolio optimisation, we were pleased to complete the sale of our minority PFI investment in the M25 motorway to Edge Orbital Holdings 2 Limited, for a cash consideration of £66.3m. This has been adjusted for when arriving at underlying earnings and is not included in the operating profit in the table above. BUSINESS MODEL AND STRATEGY Our UK operating model is based around three market-facing divisions – transportation, infrastructure, and aerospace, defence, security and technology (ADS&T) – which align with the needs of our key clients. Our Europe business, which reports through the UK transportation division, is primarily focused on the rail and highways infrastructure markets in Scandinavia. The three divisions are supported by our practices, which provide cross-sector technical skills and resource flexibility to projects. Added resilience and diversity is brought to our UK business by its ongoing support for projects in other regions, together with the increasing use of our global design centres (GDC) in India, which provides flexibility of delivery and access to high-quality, lower-cost resources. Our strategy focuses on realising the opportunities arising from the UK Government’s continued commitment to infrastructure investment and from regulatory spend in rail, utilities and airports. The digital economy is an area where we are increasingly active, although projects are currently small scale. Our ongoing operational excellence programme continues to improve the underlying processes of the business, helping us to respond to our clients’ needs and focus on project delivery. BUSINESS DRIVERS The UK’s economic environment is driven by the Government’s new industrial strategy and social policy, which are the impetus behind a range of initiatives such as development of the Northern Powerhouse, the roads investment strategy, the new National Productivity Investment Fund and ongoing development of major cities such as London and Manchester. All of these significantly affect the opportunities available to our business. The rapid growth of digital technologies continues to reshape the infrastructure markets in areas such as intelligent mobility and digital asset management. Our diversified portfolio provides resilience against market fluctuations. OPERATIONS We continue to address strong, albeit competitive, markets. The key infrastructure markets in the UK – roads, rail, energy, water and airports – remain well funded and Government support through investment was further reinforced in the final Spring Statement. To date, Brexit has had limited impact on our major markets. We welcome the announcement of the Government’s support for airport expansion at Heathrow and the capital development that this has unlocked. Transportation had a solid year and performed in line with expectations despite further weakness in the UK
rail signalling market that led to resource reductions in late 2016. Work on the large-scale re-signalling project at Cardiff was successfully completed in December and work on the overall electrification programme continued. We have mobilised on both East West Rail and the High Speed 2 engineering delivery partner

contract, where our joint venture with CH2M is seeing good volumes. We are also leading on the business case development and preliminary design work for Crossrail 2 for Transport for London (TfL) and Network Rail respectively. In the second half, positions were re-secured on frameworks for TfL and Transport for Greater Manchester. Work on the A14 and smart motorways programme continues and several small wins on autonomous vehicle projects were also achieved. Infrastructure delivered a good performance in a competitive market. Our pipeline of work from water utility clients remains strong with our appointment to the Thames Water Professional Services Framework and a strengthened position in water consultancy services through other framework wins. Work on the Thames Tideway Tunnel is progressing well. We are developing a new digital solution for Thames Water to help it achieve significant operational savings. At Heathrow we secured a role, as part of an integrated team, to support planning and early design for the expansion programme. We have also won a contract for the design work on a major new college for Ealing and Hammersmith. ADS&T performed well this year. Its defence and security sectors enjoy strong markets with good wins in year
and a solid pipeline for both. However, the aerospace market remains challenging resulting in the decision to close our aerospace office in the Netherlands. This resulted in an impairment of goodwill of £2.9m, which does not form part of underlying earnings and therefore is not shown in the table above. Faithful+Gould had a good first half but began to see a slowdown in the UK market in the commercial property
sector in the South East in the second half. Although unsuccessful on the rebid of the SCAPE framework, we continue to deliver on our pipeline of work for the education sector, local government and in support of EDF on Hinkley Point C. We have been successful in a joint bid with the infrastructure division to deliver a large programme of school surveys. PEOPLE Closing staff numbers reduced to 9,246 (2016: 9,591) - UK: 8,465 (2016: 8,873), Europe: 781 (2016: 757). Staff turnover increased to 11.7% from 11.3%. In the UK, we continue to implement programmes to assist with the attraction, engagement and retention of talented people and are recognised by a number of independent organisations as a great place to work. We retained a place in The Sunday Times 30 Best Big Companies to Work For. The ongoing promotion of science, technology, engineering and mathematics (STEM) careers to young people continues to be a focus. Over 500 STEM ambassadors took part in more than 450 STEM activities with schools, colleges and community groups, engaging with thousands of students. During the year, over 300 people including 60 apprentices joined the UK business on formal education and development programmes. Focus on increasing the proportion of female employees continues and a range of flexible working options has been developed to help us both recruit and retain staff. We recruited 67 female graduates in the September 2016 intake, 26% of the total. In line with the rest of the Group, employee engagement is measured through our Viewpoint employee opinion survey. Across the region, our results in 2016 were down two points compared with the previous year, an understandable result given the continued reshaping of our UK business and the difficult conditions in aerospace and rail signalling. The result continued to outperform the global norm for the professional services sector. Following the survey, action plans have been developed to focus on recognition, wellbeing and career paths. SAFETY Workplace health, safety and wellbeing continue to be a high priority. In the UK the number of reportable accidents reduced to five while in Europe there were no reportable accidents during the year. RISKS SPECIFIC TO THE UK AND EUROPE Atkins’ corporate position on Brexit is fully aligned with that of the Institution of Civil Engineers and the CBI. We will continue to monitor developments closely following the triggering of Article 50 and seek to position ourselves to take advantage of the opportunities that emerge. Following the result of the recent UK election, infrastructure continues to have strong cross-party support and we anticipate that investment will remain a priority.

There is a risk in the medium to long term of a shortage of professional technical staff in our industry and our research has highlighted apprenticeships as one of the most effective ways to solve this. The majority of the Group’s post-employment benefit liability sits within the UK business and is comprised of defined benefit pension obligations, the largest of which is within the Atkins Pension Plan, which is closed to the future accrual of benefits (see note 14 for more details). The pension obligations are recognised as a risk due to their size and the fact that the ongoing liability is a function of a number of assumptions, not least the life expectancy of members. This risk is mitigated by ongoing cash contributions to the pension fund, which have been agreed recently with the pension trustee as part of the 2016 triennial valuation, along with measures to manage ongoing volatility.
North America
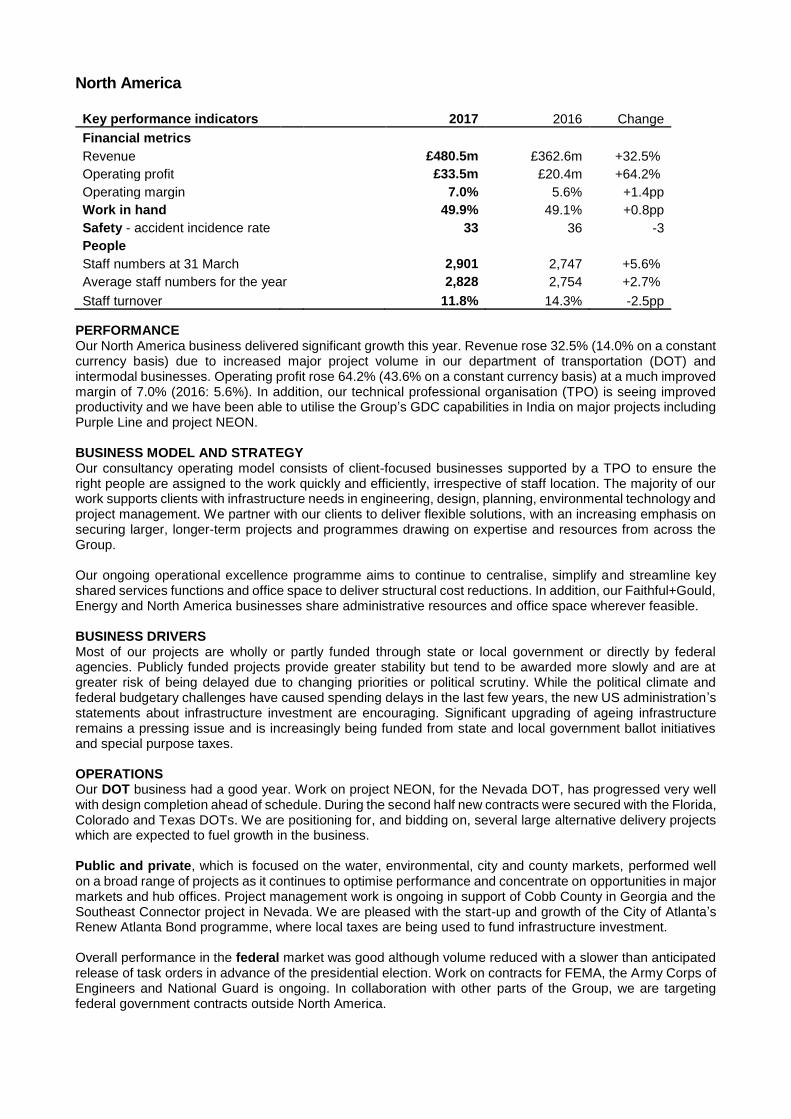
Key performance indicators 2017 2016 Change
Financial metrics Revenue £480.5m £362.6m +32.5%
Operating profit £33.5m £20.4m +64.2%
Operating margin 7.0% 5.6% +1.4pp
Work in hand 49.9% 49.1% +0.8pp
Safety - accident incidence rate 33 36 -3
People Staff numbers at 31 March 2,901 2,747 +5.6%
Average staff numbers for the year 2,828 2,754 +2.7%
Staff turnover 11.8% 14.3% -2.5pp
PERFORMANCE Our North America business delivered significant growth this year. Revenue rose 32.5% (14.0% on a constant currency basis) due to increased major project volume in our department of transportation (DOT) and intermodal businesses. Operating profit rose 64.2% (43.6% on a constant currency basis) at a much improved margin of 7.0% (2016: 5.6%). In addition, our technical professional organisation (TPO) is seeing improved productivity and we have been able to utilise the Group’s GDC capabilities in India on major projects including Purple Line and project NEON. BUSINESS MODEL AND STRATEGY Our consultancy operating model consists of client-focused businesses supported by a TPO to ensure the right people are assigned to the work quickly and efficiently, irrespective of staff location. The majority of our work supports clients with infrastructure needs in engineering, design, planning, environmental technology and project management. We partner with our clients to deliver flexible solutions, with an increasing emphasis on securing larger, longer-term projects and programmes drawing on expertise and resources from across the Group. Our ongoing operational excellence programme aims to continue to centralise, simplify and streamline key shared services functions and office space to deliver structural cost reductions. In addition, our Faithful+Gould, Energy and North America businesses share administrative resources and office space wherever feasible. BUSINESS DRIVERS Most of our projects are wholly or partly funded through state or local government or directly by federal agencies. Publicly funded projects provide greater stability but tend to be awarded more slowly and are at greater risk of being delayed due to changing priorities or political scrutiny. While the political climate and federal budgetary challenges have caused spending delays in the last few years, the new US administration’s statements about infrastructure investment are encouraging. Significant upgrading of ageing infrastructure remains a pressing issue and is increasingly being funded from state and local government ballot initiatives and special purpose taxes. OPERATIONS Our DOT business had a good year. Work on project NEON, for the Nevada DOT, has progressed very well with design completion ahead of schedule. During the second half new contracts were secured with the Florida, Colorado and Texas DOTs. We are positioning for, and bidding on, several large alternative delivery projects which are expected to fuel growth in the business. Public and private, which is focused on the water, environmental, city and county markets, performed well on a broad range of projects as it continues to optimise performance and concentrate on opportunities in major markets and hub offices. Project management work is ongoing in support of Cobb County in Georgia and the Southeast Connector project in Nevada. We are pleased with the start-up and growth of the City of Atlanta’s Renew Atlanta Bond programme, where local taxes are being used to fund infrastructure investment. Overall performance in the federal market was good although volume reduced with a slower than anticipated release of task orders in advance of the presidential election. Work on contracts for FEMA, the Army Corps of Engineers and National Guard is ongoing. In collaboration with other parts of the Group, we are targeting federal government contracts outside North America.
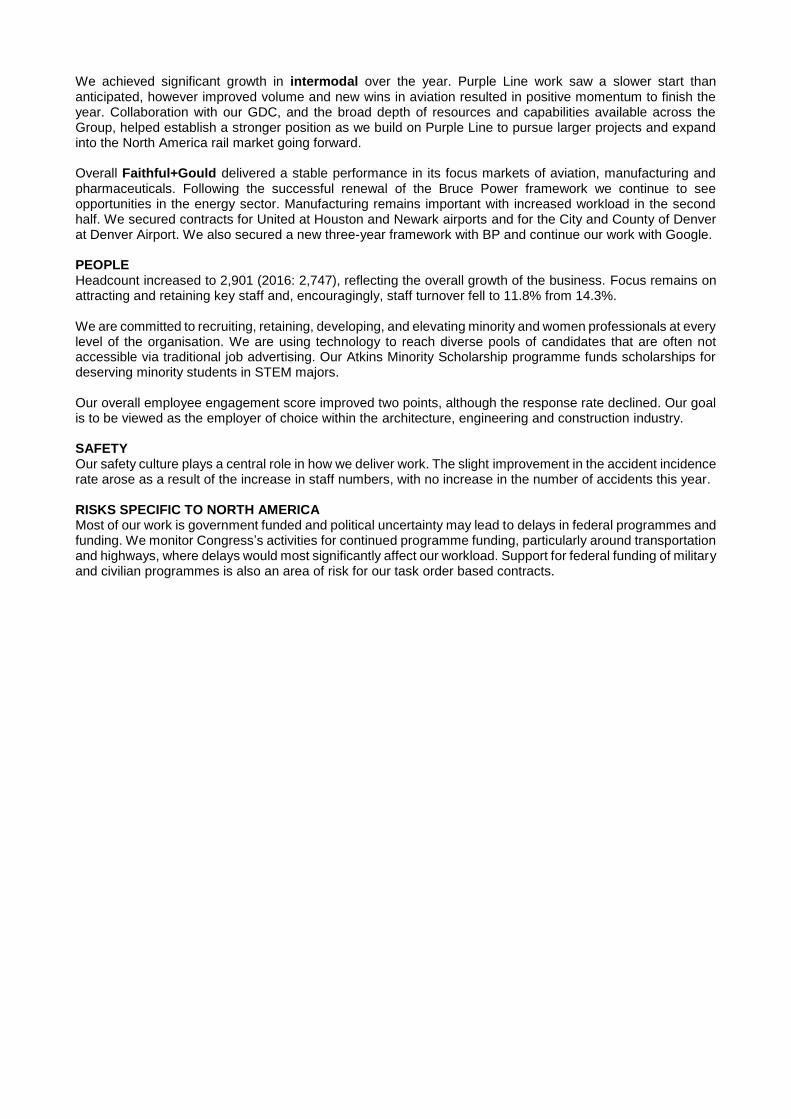
We achieved significant growth in intermodal over the year. Purple Line work saw a slower start than anticipated, however improved volume and new wins in aviation resulted in positive momentum to finish the year. Collaboration with our GDC, and the broad depth of resources and capabilities available across the Group, helped establish a stronger position as we build on Purple Line to pursue larger projects and expand into the North America rail market going forward. Overall Faithful+Gould delivered a stable performance in its focus markets of aviation, manufacturing and pharmaceuticals. Following the successful renewal of the Bruce Power framework we continue to see opportunities in the energy sector. Manufacturing remains important with increased workload in the second half. We secured contracts for United at Houston and Newark airports and for the City and County of Denver at Denver Airport. We also secured a new three-year framework with BP and continue our work with Google. PEOPLE Headcount increased to 2,901 (2016: 2,747), reflecting the overall growth of the business. Focus remains on attracting and retaining key staff and, encouragingly, staff turnover fell to 11.8% from 14.3%. We are committed to recruiting, retaining, developing, and elevating minority and women professionals at every level of the organisation. We are using technology to reach diverse pools of candidates that are often not accessible via traditional job advertising. Our Atkins Minority Scholarship programme funds scholarships for deserving minority students in STEM majors. Our overall employee engagement score improved two points, although the response rate declined. Our goal is to be viewed as the employer of choice within the architecture, engineering and construction industry. SAFETY Our safety culture plays a central role in how we deliver work. The slight improvement in the accident incidence rate arose as a result of the increase in staff numbers, with no increase in the number of accidents this year. RISKS SPECIFIC TO NORTH AMERICA Most of our work is government funded and political uncertainty may lead to delays in federal programmes and funding. We monitor Congress’s activities for continued programme funding, particularly around transportation and highways, where delays would most significantly affect our workload. Support for federal funding of military and civilian programmes is also an area of risk for our task order based contracts.

Middle East and Africa
Key performance indicators 2017 2016 Change
Financial metrics Revenue £232.2m £248.3m -6.5%
Operating profit £21.8m £29.5m -26.1%
Operating margin 9.4% 11.9% -2.5pp
Work in hand 51.0% 48.0% +3.0pp
Safety - accident incidence rate 40 39 +1
People Staff numbers at 31 March 2,469 2,459 +0.4%
Average staff numbers for the year 2,453 2,580 -4.9%
Staff turnover 10.5% 10.7% -0.2pp
PERFORMANCE Despite the overall challenging market environment in the region, our Middle East and Africa (MEA) business has traded in line with our expectations. Revenue was down 6.5% at £232.2m (20.8% reduction on a constant currency basis) at an operating margin of 9.4% (2016: 11.9%). The market liquidity situation continues to put pressure on working capital and debt collection, which remains a key focus across the region. BUSINESS MODEL AND STRATEGY Our business model is to maintain strong, local resources in our chosen markets complemented by the increasing use of our GDC. This provides agility and efficiency by maximising our ability to mobilise for major projects, while minimising exposure to individual market resource demands and constraints. We focus on transportation, infrastructure and property in the United Arab Emirates (UAE), the Kingdom of Saudi Arabia (KSA) and Qatar. Despite recent slowdowns, we believe the region continues to offer opportunities linked to the drive for economic diversification and the need to invest in social infrastructure. Our strategy is aimed at carefully selecting and securing critical, complex projects and programmes with established key clients who need a long-term partner. In addition, local resources support our Energy business in the region. BUSINESS DRIVERS The economic climate in the Middle East is primarily driven by the global oil price. This affects demand for our services since regional spending ultimately flows through to capital investment in infrastructure, transportation and property. The prolonged low oil price has caused client decision-making to slow, with increased uncertainty around the award of projects. We believe the longer term need to invest in strategically important infrastructure that supports economic growth and diversification will continue to drive demand for our services. However, short-term project timing, scale and phasing are increasingly subject to review. Africa is seeing major investment in transportation, infrastructure and energy, presenting strong demand for world-class multidisciplinary design and consultancy services. OPERATIONS Our business delivered a good performance overall this year with a much improved second half, further reinforcing our position among the Middle East’s leading design, engineering and project management consultancies. Delivery of design packages on major projects and programmes in rail across the region continued, including our design work on Doha Metro in Qatar. The majority of originally contracted work on the Riyadh Metro project in KSA has now been successfully completed. We were pleased to secure a number of strategic contracts in the property market at the end of the year, although some of these have been a little slow to be initiated by our clients. In KSA we are seeing some early signs of an improvement as the oil price has stabilised. Property sector activity in the UAE remains buoyant, driven by its hosting of Expo 2020, and the Dubai Opera was successfully opened in August 2016. Transport and infrastructure markets remain challenging, with a number of significant award delays.
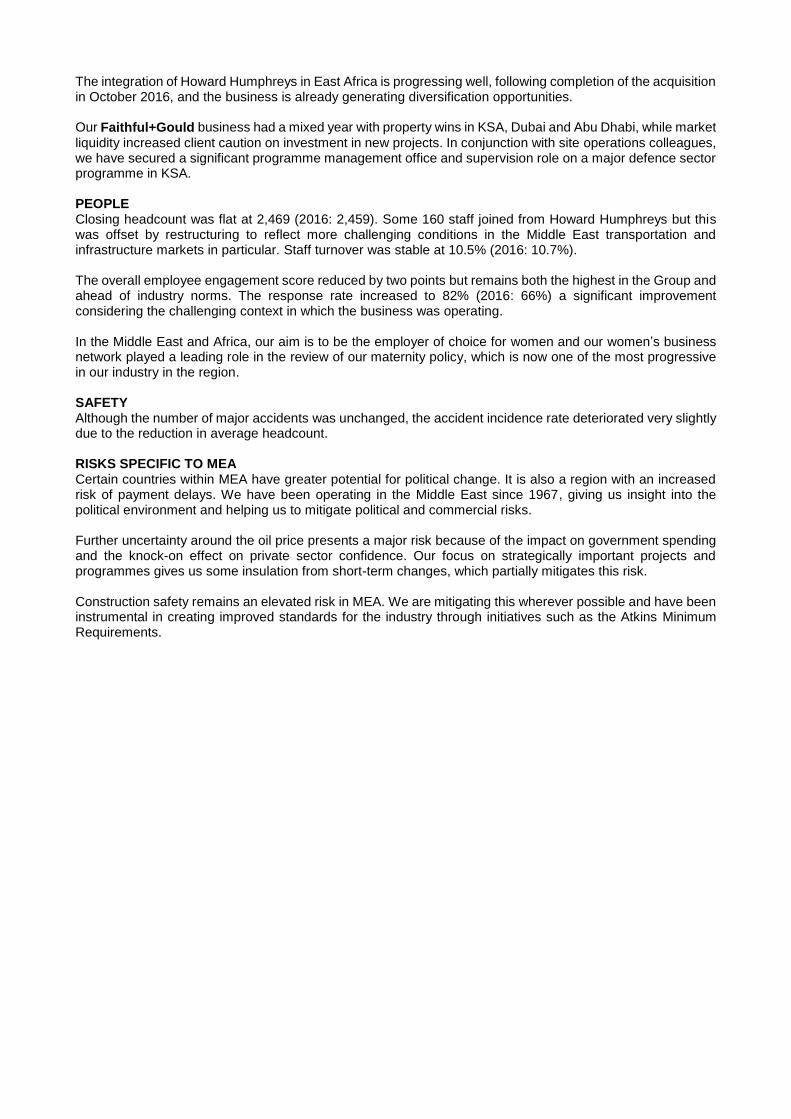
The integration of Howard Humphreys in East Africa is progressing well, following completion of the acquisition in October 2016, and the business is already generating diversification opportunities. Our Faithful+Gould business had a mixed year with property wins in KSA, Dubai and Abu Dhabi, while market
liquidity increased client caution on investment in new projects. In conjunction with site operations colleagues, we have secured a significant programme management office and supervision role on a major defence sector programme in KSA. PEOPLE Closing headcount was flat at 2,469 (2016: 2,459). Some 160 staff joined from Howard Humphreys but this was offset by restructuring to reflect more challenging conditions in the Middle East transportation and infrastructure markets in particular. Staff turnover was stable at 10.5% (2016: 10.7%). The overall employee engagement score reduced by two points but remains both the highest in the Group and ahead of industry norms. The response rate increased to 82% (2016: 66%) a significant improvement considering the challenging context in which the business was operating. In the Middle East and Africa, our aim is to be the employer of choice for women and our women’s business network played a leading role in the review of our maternity policy, which is now one of the most progressive in our industry in the region. SAFETY Although the number of major accidents was unchanged, the accident incidence rate deteriorated very slightly due to the reduction in average headcount. RISKS SPECIFIC TO MEA Certain countries within MEA have greater potential for political change. It is also a region with an increased risk of payment delays. We have been operating in the Middle East since 1967, giving us insight into the political environment and helping us to mitigate political and commercial risks. Further uncertainty around the oil price presents a major risk because of the impact on government spending and the knock-on effect on private sector confidence. Our focus on strategically important projects and programmes gives us some insulation from short-term changes, which partially mitigates this risk. Construction safety remains an elevated risk in MEA. We are mitigating this wherever possible and have been instrumental in creating improved standards for the industry through initiatives such as the Atkins Minimum Requirements.

Asia Pacific
Key performance indicators 2017 2016 Change
Financial metrics Revenue £118.2m £106.1m +11.4%
Operating profit £9.3m £8.5m +9.4%
Operating margin 7.9% 8.0% -0.1pp
Work in hand 47.6% 46.1% +1.5pp
Safety - accident incidence rate 86 209 -123
People Staff numbers at 31 March 1,275 1,354 -5.8%
Average staff numbers for the year 1,289 1,448 -11.0%
Staff turnover 18.6% 18.7% -0.1pp
PERFORMANCE Our Asia Pacific business has traded in line with our expectations this year. Revenue increased 11.4% to £118.2m (2016: £106.1m) (1.4% reduction on a constant currency basis) at an operating margin of 7.9% (2016: 8.0%). Our profitability and cash flow performance were again impacted by delays to the start of opportunities and cash receipts from some clients extending beyond agreed contract terms. BUSINESS MODEL AND STRATEGY We operate predominantly in Hong Kong and mainland China, supplemented by a network of offices across southeast Asia including Malaysia, Vietnam and Singapore, as well as India and Australia, offering our clients a range of services throughout the entire cycle of urban development. We work in partnership with chosen Chinese contractors on their domestic and international projects. Our strategy of geographic and market diversification continues, supported by our new Acuity advisory business. The focus is on urban planning, transport, infrastructure and property in the southeast Asian markets. Our multidisciplinary offering with Faithful+Gould provides a more integrated service for private sector clients in the region. In Hong Kong, we continue to expand our service offering and project portfolio in the infrastructure sector. In mainland China, property market conditions have led to the restructuring and right-sizing of our teams, but we see a more stable market looking forward. We will increasingly target state-owned enterprises and larger developers who have the financial capability to take major projects forward. BUSINESS DRIVERS Our growth potential in the region is underpinned by the scale of urbanisation driving both government spending and the rate of private sector investment. Outside Asia Pacific, good business opportunities exist for the Group as a whole as major Chinese companies invest in large scale infrastructure development projects outside their domestic market. OPERATIONS In Hong Kong, we secured additional design packages of work on the third runway at Hong Kong International Airport as we expanded our project portfolio. We remain cautious about the strength and sustainability of the recovery in the mainland China property market. Our overseas work with Chinese contractors continues with new project wins secured during the year in the Philippines, Africa and the Middle East in the property, transport and infrastructure sectors. We are also supporting Chinese developers in outbound investments in urban development. We have been appointed by CHEC Port City Colombo (Private) Limited to provide consultancy services in relation to the design of infrastructure and landscape works for the proposed Colombo Port City Development Project in Sri Lanka. The proposed city will be built on 269 hectares of reclaimed land and expects a future population of 250,000 people.
In southeast Asia, we secured a number of architectural project wins including the iconic Cocobay Towers in
Danang, Vietnam, consisting of twin towers rising to a height of approximately 200 metres. We worked with a major Malaysian industrial firm on a masterplan for a 348 hectare mixed-use, high-value manufacturing park, enabling it to move into new sectors and contribute to national industrial development. Our work to support Prasarana in a client advisory role on the delivery of its LRT3 light railway project in Malaysia continues. We are working with the Land Transport Authority (LTA) on the Jurong Regional Line in Singapore, a 20km new line that is expected to be completed by around 2025. We were particularly pleased to be awarded the advance engineering study for a key section of the proposed Cross Island Line in Singapore by the LTA. Our Faithful+Gould business had a mixed year. Activity in mainland China slowed in the first half, due to
reduced direct investment there by international clients. However, in the second half, we were pleased to be awarded a number of smaller retail, data centre, manufacturing and leisure contracts in China, Hong Kong and India and saw continued growth overall in the rest of Asia. PEOPLE Overall headcount in our Asia Pacific region decreased in the year to 1,275 (2016: 1,354) as we streamlined our businesses in mainland China and Hong Kong. Staff turnover has remained broadly unchanged at 18.6% (2016: 18.7%). The Asia Pacific Women’s Professional Network, which was launched last year, has gained momentum and is focusing on initiatives around facilitating the return to work and flexible working of staff, as well as enhanced maternity benefits. SAFETY The accident incidence rate has decreased significantly in Asia Pacific with only one reportable accident in the year. RISKS SPECIFIC TO ASIA PACIFIC Expanding our footprint across the region brings increased risks such as lack of commercial transparency, political instability and risks associated with operating within unfamiliar regulatory, tax and employment regimes. We undertake due diligence into both the market and specific clients, as well as using professional advisors to assist with legal and regulatory compliance.
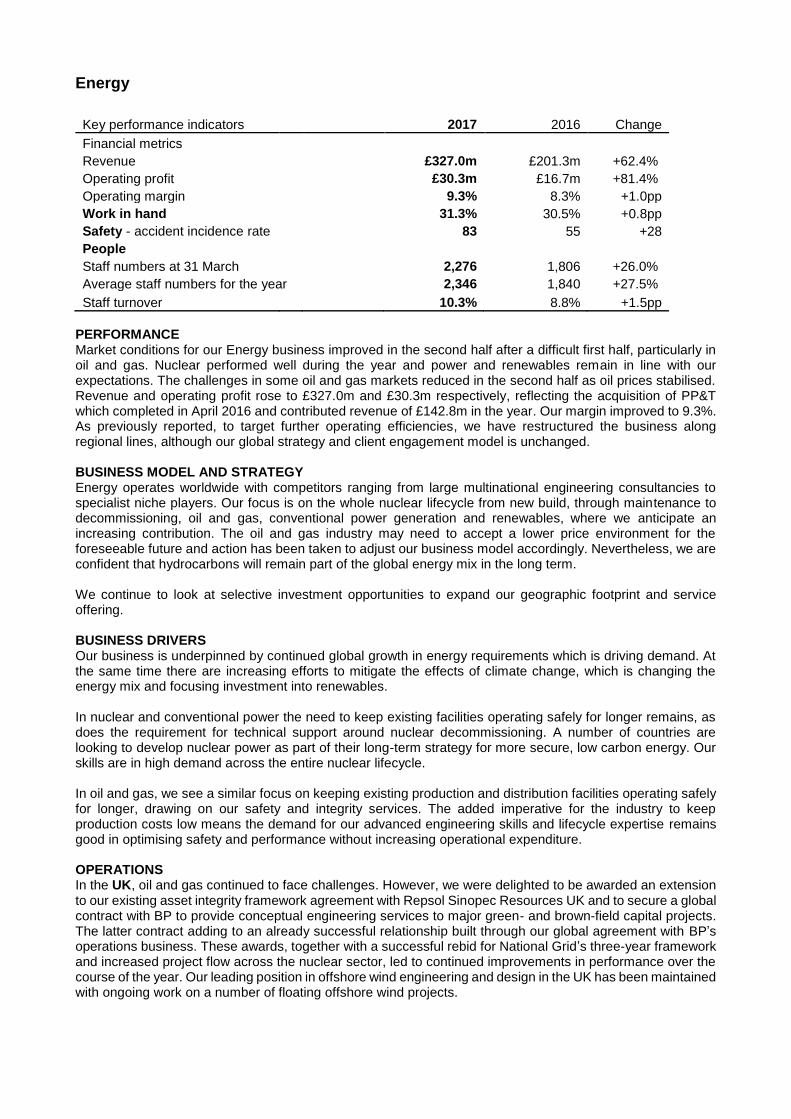
Energy
Key performance indicators 2017 2016 Change
Financial metrics Revenue £327.0m £201.3m +62.4%
Operating profit £30.3m £16.7m +81.4%
Operating margin 9.3% 8.3% +1.0pp
Work in hand 31.3% 30.5% +0.8pp
Safety - accident incidence rate 83 55 +28
People Staff numbers at 31 March 2,276 1,806 +26.0%
Average staff numbers for the year 2,346 1,840 +27.5%
Staff turnover 10.3% 8.8% +1.5pp
PERFORMANCE Market conditions for our Energy business improved in the second half after a difficult first half, particularly in oil and gas. Nuclear performed well during the year and power and renewables remain in line with our expectations. The challenges in some oil and gas markets reduced in the second half as oil prices stabilised. Revenue and operating profit rose to £327.0m and £30.3m respectively, reflecting the acquisition of PP&T which completed in April 2016 and contributed revenue of £142.8m in the year. Our margin improved to 9.3%. As previously reported, to target further operating efficiencies, we have restructured the business along regional lines, although our global strategy and client engagement model is unchanged. BUSINESS MODEL AND STRATEGY Energy operates worldwide with competitors ranging from large multinational engineering consultancies to specialist niche players. Our focus is on the whole nuclear lifecycle from new build, through maintenance to decommissioning, oil and gas, conventional power generation and renewables, where we anticipate an increasing contribution. The oil and gas industry may need to accept a lower price environment for the foreseeable future and action has been taken to adjust our business model accordingly. Nevertheless, we are confident that hydrocarbons will remain part of the global energy mix in the long term. We continue to look at selective investment opportunities to expand our geographic footprint and service offering. BUSINESS DRIVERS Our business is underpinned by continued global growth in energy requirements which is driving demand. At the same time there are increasing efforts to mitigate the effects of climate change, which is changing the energy mix and focusing investment into renewables. In nuclear and conventional power the need to keep existing facilities operating safely for longer remains, as does the requirement for technical support around nuclear decommissioning. A number of countries are looking to develop nuclear power as part of their long-term strategy for more secure, low carbon energy. Our skills are in high demand across the entire nuclear lifecycle. In oil and gas, we see a similar focus on keeping existing production and distribution facilities operating safely for longer, drawing on our safety and integrity services. The added imperative for the industry to keep production costs low means the demand for our advanced engineering skills and lifecycle expertise remains good in optimising safety and performance without increasing operational expenditure. OPERATIONS In the UK, oil and gas continued to face challenges. However, we were delighted to be awarded an extension to our existing asset integrity framework agreement with Repsol Sinopec Resources UK and to secure a global contract with BP to provide conceptual engineering services to major green- and brown-field capital projects. The latter contract adding to an already successful relationship built through our global agreement with BP’s operations business. These awards, together with a successful rebid for National Grid’s three-year framework and increased project flow across the nuclear sector, led to continued improvements in performance over the course of the year. Our leading position in offshore wind engineering and design in the UK has been maintained with ongoing work on a number of floating offshore wind projects.
In North America, the trading environment for our largely offshore-focused oil and gas businesses remained very challenging in the first half of the year resulting in the review and impairment of the carrying value of goodwill and acquired intangible assets in its oil and gas business by £23.3m. The US Tier 1 nuclear decommissioning market is developing well for us, following the acquisition of PP&T. In September 2016, we were delighted to win a contract to operate depleted uranium hexafluoride (DUF6) conversion over a five-year period at facilities in Kentucky and Ohio – our first major nuclear contract in North America since completing the acquisition of PP&T in April 2016. In the Middle East, nuclear continued to trade well, although there has been a slowdown in the pipeline of work for our power business and headcount has been reduced. Our oil and gas business performance, while starting to slow, remained good in the year and we continue to work with Abu Dhabi Marine Operating Company to help extend the life of Abu Dhabi’s oil and gas facilities. In the second half of the year, product sales to Asia associated with the treatment of decontaminated water at the Fukushima site have made good progress. We are making headway into the Chinese renewables market with a recent appointment by PowerChina Huadong Engineering Co. Ltd to design the offshore substation platform at State Power Investment Corporation’s 300MW Binhai SouthPhase3 offshore wind farm in the Yellow Sea. The contract win represents a landmark achievement as the first offshore wind project for Atkins in China. PEOPLE Headcount increased 26.0% to 2,276 (2016: 1,806). Some 600 colleagues joined from PP&T, although this was partially offset by rationalisation in our oil and gas business. Staff turnover has increased to 10.3% (2016: 8.8%). Career development for our mid-career staff continued to be an important focus via our Energising Your Career programme. This year we made particular efforts to ensure staff on the programme connected with a career mentor to help them progress with their plans. During the year we have increasingly focused on improving our provision for the apprentices who join the business, with the UK Apprenticeship Levy offering us an increased opportunity to take on and develop staff through apprenticeship programmes. We measure employee engagement through our Group wide Viewpoint employee opinion survey. Our overall engagement score for Energy reduced by two points this year, particularly reflecting lower job security following the headcount reductions during the year. However, it remains better than the benchmark for our industry sector. SAFETY During the year, there were two reportable accidents compared with one last year. RISKS SPECIFIC TO ENERGY Oil price volatility is a major risk for our Energy business. Mitigating action has been taken by reducing headcount and our overall cost base. We continue to address productivity and rebalance the business to meet demand. The safety, environmental and reputational consequences of an error in our work, given the high hazard nature of the facilities on which we work, is another significant risk. Our plans for growth are potentially affected by the availability of skills in the right locations. To help to mitigate this risk, we continue to invest in our in-house nuclear training academy that now provides externally recognised courses.
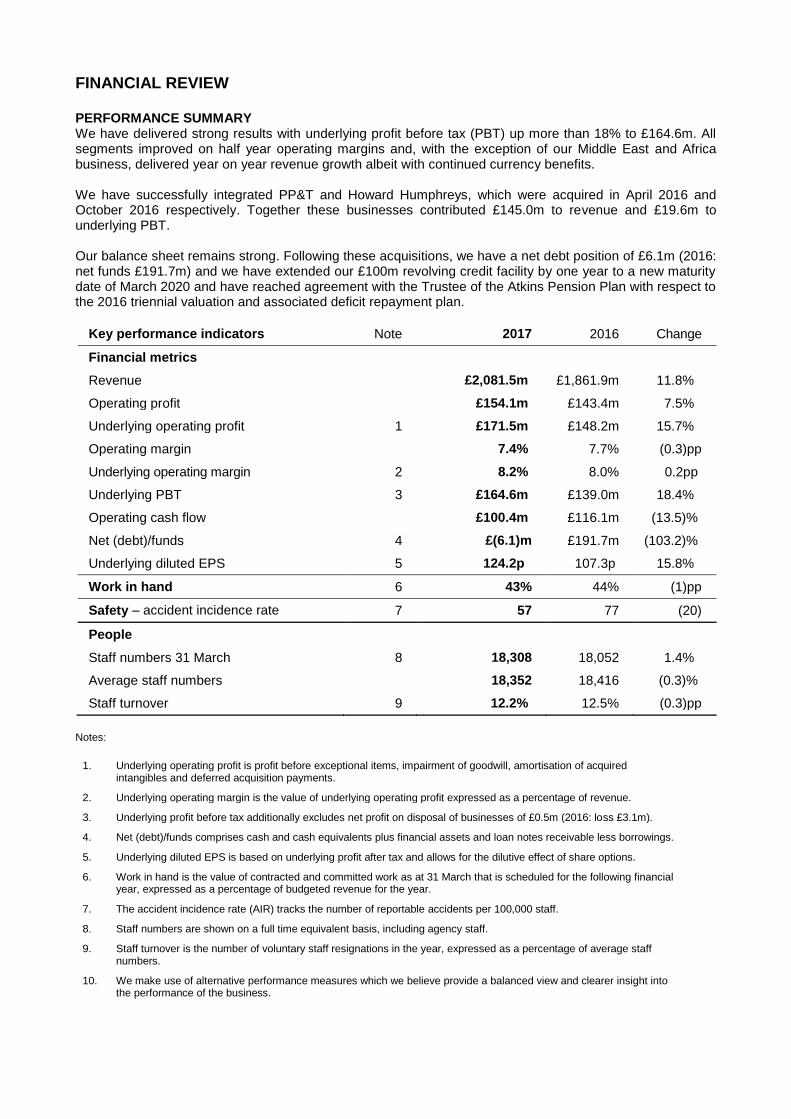
FINANCIAL REVIEW PERFORMANCE SUMMARY We have delivered strong results with underlying profit before tax (PBT) up more than 18% to £164.6m. All segments improved on half year operating margins and, with the exception of our Middle East and Africa business, delivered year on year revenue growth albeit with continued currency benefits. We have successfully integrated PP&T and Howard Humphreys, which were acquired in April 2016 and October 2016 respectively. Together these businesses contributed £145.0m to revenue and £19.6m to underlying PBT. Our balance sheet remains strong. Following these acquisitions, we have a net debt position of £6.1m (2016: net funds £191.7m) and we have extended our £100m revolving credit facility by one year to a new maturity date of March 2020 and have reached agreement with the Trustee of the Atkins Pension Plan with respect to the 2016 triennial valuation and associated deficit repayment plan.
Key performance indicators Note 2017 2016 Change
Financial metrics
Revenue £2,081.5m £1,861.9m 11.8%
Operating profit £154.1m £143.4m 7.5%
Underlying operating profit 1 £171.5m £148.2m 15.7%
Operating margin 7.4% 7.7% (0.3)pp
Underlying operating margin 2 8.2% 8.0% 0.2pp
Underlying PBT 3 £164.6m £139.0m 18.4%
Operating cash flow £100.4m £116.1m (13.5)%
Net (debt)/funds 4 £(6.1)m £191.7m (103.2)%
Underlying diluted EPS 5 124.2p 107.3p 15.8%
Work in hand 6 43% 44% (1)pp
Safety – accident incidence rate 7 57 77 (20)
People
Staff numbers 31 March 8 18,308 18,052 1.4%
Average staff numbers 18,352 18,416 (0.3)%
Staff turnover 9 12.2% 12.5% (0.3)pp
Notes:
1. Underlying operating profit is profit before exceptional items, impairment of goodwill, amortisation of acquired intangibles and deferred acquisition payments.
2. Underlying operating margin is the value of underlying operating profit expressed as a percentage of revenue.
3. Underlying profit before tax additionally excludes net profit on disposal of businesses of £0.5m (2016: loss £3.1m).
4. Net (debt)/funds comprises cash and cash equivalents plus financial assets and loan notes receivable less borrowings.
5. Underlying diluted EPS is based on underlying profit after tax and allows for the dilutive effect of share options.
6. Work in hand is the value of contracted and committed work as at 31 March that is scheduled for the following financial year, expressed as a percentage of budgeted revenue for the year.
7. The accident incidence rate (AIR) tracks the number of reportable accidents per 100,000 staff.
8. Staff numbers are shown on a full time equivalent basis, including agency staff.
9. Staff turnover is the number of voluntary staff resignations in the year, expressed as a percentage of average staff numbers.
10. We make use of alternative performance measures which we believe provide a balanced view and clearer insight into the performance of the business.
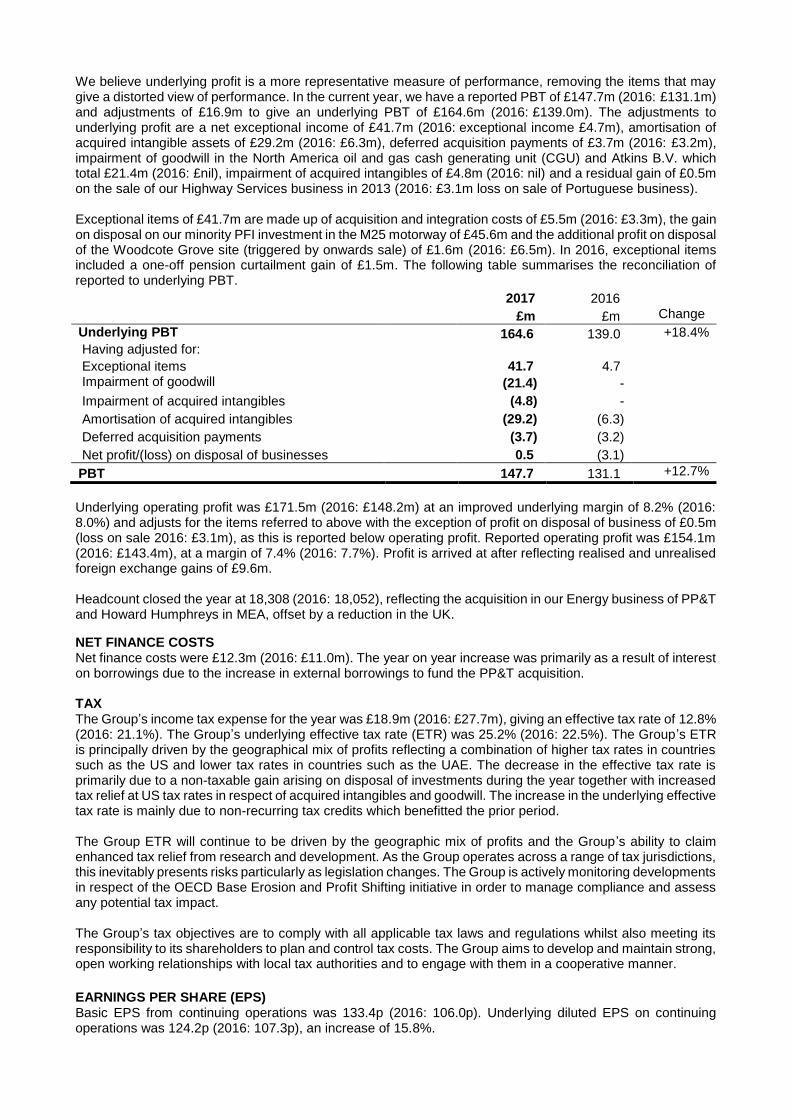
We believe underlying profit is a more representative measure of performance, removing the items that may give a distorted view of performance. In the current year, we have a reported PBT of £147.7m (2016: £131.1m) and adjustments of £16.9m to give an underlying PBT of £164.6m (2016: £139.0m). The adjustments to underlying profit are a net exceptional income of £41.7m (2016: exceptional income £4.7m), amortisation of acquired intangible assets of £29.2m (2016: £6.3m), deferred acquisition payments of £3.7m (2016: £3.2m), impairment of goodwill in the North America oil and gas cash generating unit (CGU) and Atkins B.V. which total £21.4m (2016: £nil), impairment of acquired intangibles of £4.8m (2016: nil) and a residual gain of £0.5m on the sale of our Highway Services business in 2013 (2016: £3.1m loss on sale of Portuguese business). Exceptional items of £41.7m are made up of acquisition and integration costs of £5.5m (2016: £3.3m), the gain on disposal on our minority PFI investment in the M25 motorway of £45.6m and the additional profit on disposal of the Woodcote Grove site (triggered by onwards sale) of £1.6m (2016: £6.5m). In 2016, exceptional items included a one-off pension curtailment gain of £1.5m. The following table summarises the reconciliation of reported to underlying PBT.
2017 2016
£m £m Change
Underlying PBT 164.6 139.0 +18.4%
Having adjusted for:
Exceptional items 41.7 4.7 Impairment of goodwill (21.4) -
Impairment of acquired intangibles (4.8) -
Amortisation of acquired intangibles (29.2) (6.3)
Deferred acquisition payments (3.7) (3.2)
Net profit/(loss) on disposal of businesses 0.5 (3.1)
PBT 147.7 131.1 +12.7%
Underlying operating profit was £171.5m (2016: £148.2m) at an improved underlying margin of 8.2% (2016: 8.0%) and adjusts for the items referred to above with the exception of profit on disposal of business of £0.5m (loss on sale 2016: £3.1m), as this is reported below operating profit. Reported operating profit was £154.1m (2016: £143.4m), at a margin of 7.4% (2016: 7.7%). Profit is arrived at after reflecting realised and unrealised foreign exchange gains of £9.6m. Headcount closed the year at 18,308 (2016: 18,052), reflecting the acquisition in our Energy business of PP&T and Howard Humphreys in MEA, offset by a reduction in the UK.
NET FINANCE COSTS Net finance costs were £12.3m (2016: £11.0m). The year on year increase was primarily as a result of interest on borrowings due to the increase in external borrowings to fund the PP&T acquisition. TAX The Group’s income tax expense for the year was £18.9m (2016: £27.7m), giving an effective tax rate of 12.8% (2016: 21.1%). The Group’s underlying effective tax rate (ETR) was 25.2% (2016: 22.5%). The Group’s ETR is principally driven by the geographical mix of profits reflecting a combination of higher tax rates in countries such as the US and lower tax rates in countries such as the UAE. The decrease in the effective tax rate is primarily due to a non-taxable gain arising on disposal of investments during the year together with increased tax relief at US tax rates in respect of acquired intangibles and goodwill. The increase in the underlying effective tax rate is mainly due to non-recurring tax credits which benefitted the prior period. The Group ETR will continue to be driven by the geographic mix of profits and the Group ’s ability to claim enhanced tax relief from research and development. As the Group operates across a range of tax jurisdictions, this inevitably presents risks particularly as legislation changes. The Group is actively monitoring developments in respect of the OECD Base Erosion and Profit Shifting initiative in order to manage compliance and assess any potential tax impact. The Group’s tax objectives are to comply with all applicable tax laws and regulations whilst also meeting its responsibility to its shareholders to plan and control tax costs. The Group aims to develop and maintain strong, open working relationships with local tax authorities and to engage with them in a cooperative manner.
EARNINGS PER SHARE (EPS) Basic EPS from continuing operations was 133.4p (2016: 106.0p). Underlying diluted EPS on continuing operations was 124.2p (2016: 107.3p), an increase of 15.8%.

PENSIONS Funding and charges We reported in early April 2017 that we had reached agreement with the Trustee of the Atkins Pension Plan with respect to the 2016 triennial valuation, with the associated repayment plan unchanged from the previous valuation exercise in 2013. The agreed funding deficit at 31 March 2016 is £318m (31 March 2013: £430m). The agreed deficit repayment plan will see the Group pay £34.5m in the financial year to 31 March 2018, with payments in the following years escalating at 2.5% per annum. The total charge to the Consolidated Income Statement in respect of defined benefit schemes was £10.5m (2016: £11.0m), comprising current service cost of £2.3m (2016: £2.6m), administrative expenses of £0.2m (2016: £0.2m), a net interest expense of £8.0m (2016: £9.7m) and a curtailment gain in the prior year of £1.5m in the Railways Pension Scheme. The charge relating to defined contribution schemes increased to £45.3m (2016: £43.3m). IAS 19 (revised 2011) – valuation and accounting treatment The Group determines pension scheme funding with reference to actuarial valuations, but for reporting purposes uses IAS 19 (revised 2011) under which the Group recognised a reduced net retirement benefit liability of £235.7m at 31 March 2017 (2016: £265.3m). CASH Net debt as at 31 March 2017 was £6.1m (2016: net funds £191.7m), made up as follows:
2017 2016
£m £m
Cash and cash equivalents 224.5 419.3 Loan notes receivable 0.9 20.1 Financial assets at fair value through profit or loss 31.6 32.9 Borrowings due no later than one year - (7.0)
Borrowings due later than one year (263.0) (273.5)
Finance leases (0.1) (0.1)
Net (debt)/funds (6.1) 191.7
The Group’s financial position remains strong. Operating cash flow in the year was £100.4m (2016: £116.1m), representing 65.2% (2016: 81.0%) of operating profit on a reported basis or free cash flow of 69.4% (2016: 93.5%), which includes net capital expenditure and excludes the cash impact of non underlying items and pension deficit contributions and is summarised below. The move to a net debt position reflects the acquisitions in year, partially offset by the sale of our minority PFI investment in the M25 motorway. Reconciliation of profit before interest and tax to operating cash flow
2017 2016 £m £m
Profit before interest and tax 160.0 142.1 Add: depreciation 19.7 18.2 Add: amortisation and impairment 58.9 11.9
EBITDA 238.6 172.2
Comprising: - Underlying EBITDA 200.1 173.8 - Exceptional items 41.7 4.7 - Deferred acquisition payments (3.7) (3.2) - Net profit/(loss) on disposal of businesses 0.5 (3.1)
238.6 172.2
Pensions deficit funding (33.6) (32.8) Movement in working capital (54.1) (26.5) Movement in non-current payables - 0.1 Movement in provisions 0.3 0.5 Income from other investments (0.6) (1.1) Profit on sale of investments (45.6) - Other non-cash items (4.6) 3.7
Operating cash flow 100.4 116.1
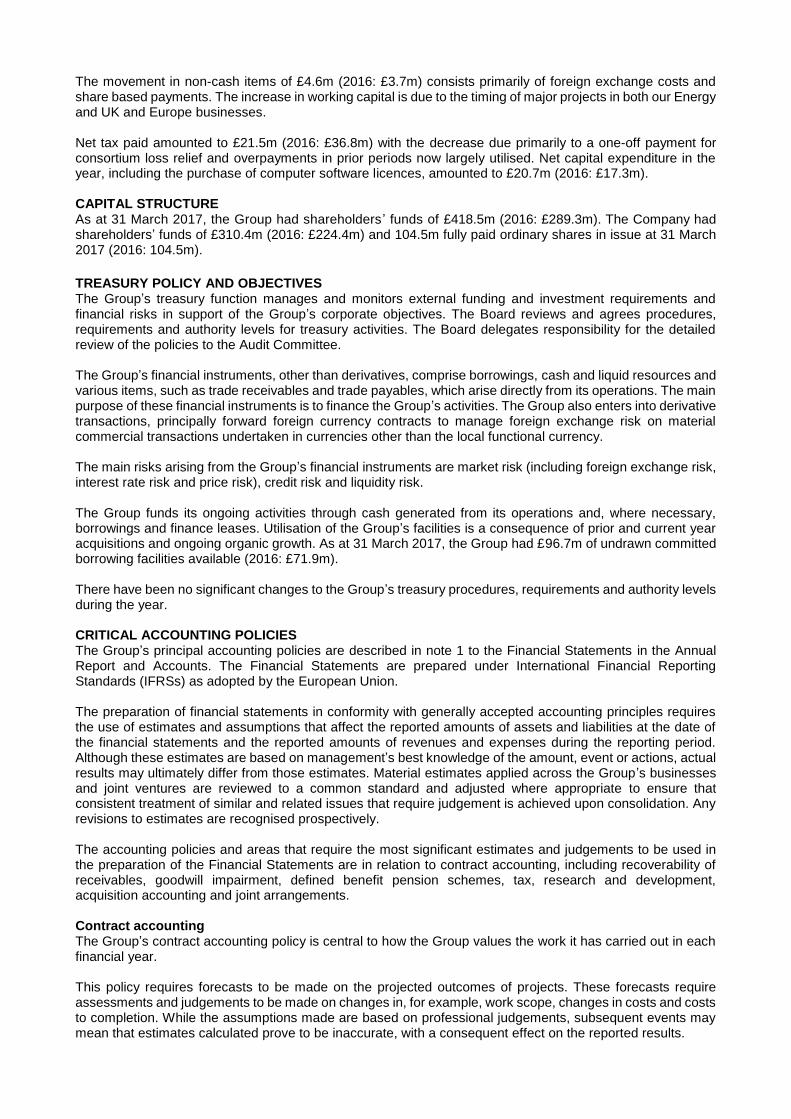
The movement in non-cash items of £4.6m (2016: £3.7m) consists primarily of foreign exchange costs and share based payments. The increase in working capital is due to the timing of major projects in both our Energy and UK and Europe businesses. Net tax paid amounted to £21.5m (2016: £36.8m) with the decrease due primarily to a one-off payment for consortium loss relief and overpayments in prior periods now largely utilised. Net capital expenditure in the year, including the purchase of computer software licences, amounted to £20.7m (2016: £17.3m). CAPITAL STRUCTURE As at 31 March 2017, the Group had shareholders ’ funds of £418.5m (2016: £289.3m). The Company had shareholders’ funds of £310.4m (2016: £224.4m) and 104.5m fully paid ordinary shares in issue at 31 March 2017 (2016: 104.5m).
TREASURY POLICY AND OBJECTIVES The Group’s treasury function manages and monitors external funding and investment requirements and financial risks in support of the Group’s corporate objectives. The Board reviews and agrees procedures, requirements and authority levels for treasury activities. The Board delegates responsibility for the detailed review of the policies to the Audit Committee. The Group’s financial instruments, other than derivatives, comprise borrowings, cash and liquid resources and various items, such as trade receivables and trade payables, which arise directly from its operations. The main purpose of these financial instruments is to finance the Group’s activities. The Group also enters into derivative transactions, principally forward foreign currency contracts to manage foreign exchange risk on material commercial transactions undertaken in currencies other than the local functional currency. The main risks arising from the Group’s financial instruments are market risk (including foreign exchange risk, interest rate risk and price risk), credit risk and liquidity risk. The Group funds its ongoing activities through cash generated from its operations and, where necessary, borrowings and finance leases. Utilisation of the Group’s facilities is a consequence of prior and current year acquisitions and ongoing organic growth. As at 31 March 2017, the Group had £96.7m of undrawn committed borrowing facilities available (2016: £71.9m). There have been no significant changes to the Group’s treasury procedures, requirements and authority levels during the year. CRITICAL ACCOUNTING POLICIES The Group’s principal accounting policies are described in note 1 to the Financial Statements in the Annual Report and Accounts. The Financial Statements are prepared under International Financial Reporting Standards (IFRSs) as adopted by the European Union. The preparation of financial statements in conformity with generally accepted accounting principles requires the use of estimates and assumptions that affect the reported amounts of assets and liabilities at the date of the financial statements and the reported amounts of revenues and expenses during the reporting period. Although these estimates are based on management’s best knowledge of the amount, event or actions, actual results may ultimately differ from those estimates. Material estimates applied across the Group’s businesses and joint ventures are reviewed to a common standard and adjusted where appropriate to ensure that consistent treatment of similar and related issues that require judgement is achieved upon consolidation. Any revisions to estimates are recognised prospectively. The accounting policies and areas that require the most significant estimates and judgements to be used in the preparation of the Financial Statements are in relation to contract accounting, including recoverability of receivables, goodwill impairment, defined benefit pension schemes, tax, research and development, acquisition accounting and joint arrangements. Contract accounting The Group’s contract accounting policy is central to how the Group values the work it has carried out in each financial year. This policy requires forecasts to be made on the projected outcomes of projects. These forecasts require assessments and judgements to be made on changes in, for example, work scope, changes in costs and costs to completion. While the assumptions made are based on professional judgements, subsequent events may mean that estimates calculated prove to be inaccurate, with a consequent effect on the reported results.

Goodwill impairment Goodwill is subject to impairment review both annually and when there are indications that the carrying value may not be recoverable. The carrying value of goodwill is compared to the recoverable amount, which is the higher of the value in use and fair value less costs to sell. For the purpose of impairment testing, goodwill acquired in a business combination is allocated to each of the cash-generating units (CGUs), or groups of CGUs, that is expected to benefit from the synergies of the combination. Each CGU or group of CGUs to which the goodwill is allocated represents the lowest level within the entity at which goodwill is monitored for internal management purposes. Determining whether goodwill is impaired requires an estimation of the value in use of CGUs to which the goodwill has been allocated. The value in use calculation requires an estimate to be made of the timing and amount of future cash flows expected to arise from the CGU and the application of a suitable discount rate to calculate the present value. The discount rates used are based on the Group’s weighted average cost of capital adjusted to reflect the specific economic environment of the relevant CGU. Defined benefit pension schemes Accounting for pensions involves judgement about uncertain events in the future such as inflation, salary levels at retirement, longevity rates, rates of return on plan assets and discount rates. Assumptions in respect of pensions and post-employment benefits are set after consultation with independent qualified actuaries. Management believes the assumptions are appropriate. However, a change in the assumptions used would have an impact on the Group’s results and net assets. Any differences between the assumptions and the actual outcome will affect results in future years. An estimate of the sensitivity to changes in key assumptions is disclosed in note 14. Tax The Group is subject to tax in a number of jurisdictions and judgement is required in determining the Group wide provision for income taxes. The Group provides for potential liabilities in respect of uncertain tax positions where additional tax may become payable in future periods and such provisions are based on management’s assessment of exposures. Deferred tax is accounted for on temporary differences using the liability method, with deferred tax liabilities being provided for in full and deferred tax assets being recognised only to the extent that it is probable that future taxable profits will be available against which the temporary differences can be utilised. Research and development (R&D) All R&D expenditure is written off to the Consolidated Income Statement as incurred. In the UK, the Group adopted the R&D expenditure credit regime with effect from 1 April 2013. These credits have characteristics more akin to government grants than income taxes and therefore are offset against the relevant expenditure in the income statement rather than via the tax charge. The credits are recognised to the extent that there is reasonable assurance that they will be received, albeit that the claim process takes place sometime after the original expenditure was incurred. Joint arrangements The Group applies IFRS 11 to all joint arrangements. Under IFRS 11 a joint arrangement is an arrangement over which two or more parties have joint control. Joint control is the contractually agreed sharing of control of an arrangement, which exists only when decisions about the relevant activities require the unanimous consent of the parties sharing control. The Group classifies its interests in joint arrangements as either joint ventures or joint operations. The Group holds 50% of the voting rights in some of its joint arrangements. However, the Group has joint control over these arrangements as under the respective contractual agreements unanimous consent is required from all parties to the agreements for all relevant activities. These joint arrangements are not structured through separate legal entities and the terms of the arrangements provide the Group and the other parties to the arrangements with the rights to the assets and obligations for the liabilities, or other facts and circumstances indicate this is the case. Therefore, these arrangements are classified as joint operations of the Group.

Acquisition accounting The Group applies the acquisition method to account for business combinations. The cost of an acquisition is measured as the fair value of the assets, equity instruments issued and liabilities incurred or assumed at the date of exchange. Identifiable assets acquired and liabilities and contingent liabilities assumed in a business combination are measured initially at their fair values at the acquisition date irrespective of any non-controlling interest. Acquisition-related costs are expensed as incurred. Any contingent consideration is recognised at fair value at the acquisition date. The excess of the consideration transferred over the fair value of the identifiable net assets acquired is recorded as goodwill. Goodwill is reviewed on finalisation of fair values and any adjustments required to the accounting are recorded within 12 months of the acquisition date. GOING CONCERN The directors are required to consider the appropriateness of the going concern assertion in the preparation of the Group’s financial information for the year ended 31 March 2017. The Group meets its day-to-day working capital requirements through cash generated from operations and the use of its banking facilities. The Group has delivered good results and progressed its strategic objectives, not least through the acquisition of PP&T and Howard Humphreys. Following these acquisitions it has net borrowings at 31 March 2017 of £6.1m. The Group had cash and cash equivalents of £224.5m and access to undrawn committed borrowing facilities of £96.7m at 31 March 2017. On 30 January 2016 the Group amended and extended its five year revolving credit facility (RCF). This £200m facility matures on 30 January 2021. On 11 March 2016 the Group signed a new RCF of £100m, with a maturity of three years. On 23 February 2017, the Group exercised an option to extend the facility by an additional year. This £100m facility now matures on 11 March 2020. The total letters of credit in issue under the committed facilities at 31 March 2017 was £0.2m (31 March 2016: £0.2m). The Group has a good level of work in hand at 31 March 2017 representing 43% of forecast revenue for the year (2016: 44%). After making enquiries and having considered the Group’s results, the strength of its balance sheet and near-term outlook, the directors have a reasonable expectation that the Group has adequate resources to continue in operational existence for the foreseeable future. It is therefore deemed appropriate to continue to apply the going concern principle in the preparation of its consolidated financial information for the year ended 31 March 2017.
STATEMENT OF DIRECTORS’ RESPONSIBILITIES The directors are responsible for preparing the Annual Report, the Remuneration report and the Financial Statements in accordance with applicable law and regulations. Detailed below are statements made by the directors in relation to their responsibilities, disclosure of information to the Company’s independent auditor and going concern.
Company law requires the directors to prepare financial statements for each financial year. Under that law, the directors have prepared the Group and Company Financial Statements in accordance with International Financial Reporting Standards as adopted by the European Union. Under company law the directors must not approve the Financial Statements unless they are satisfied that they give a true and fair view of the state of affairs of the Company and the Group and of the profit or loss of the Company and Group for that period. In preparing these Financial Statements, the directors are required to:
- select suitable accounting policies and then apply them consistently - make judgements and accounting estimates that are reasonable and prudent - state whether applicable IFRSs as adopted by the EU have been followed, subject to any material
departures disclosed and explained in the Financial Statements - prepare the Financial Statements on the going concern basis unless it is inappropriate to presume that
the Company and the Group will continue in business
The directors are responsible for:
- keeping adequate accounting records that are sufficient to show and explain the Company’s transactions and disclose with reasonable accuracy at any time the financial position of the Company and the Group and enable them to ensure that the Financial Statements and the Remuneration report comply with the Act and, as regards the Group Financial Statements, Article 4 of the International Accounting Standard Regulation
- safeguarding the assets of the Company and the Group and hence for taking reasonable steps for the prevention and detection of fraud and other irregularities
- the maintenance and integrity of the corporate and financial information included on the Company’s website. Legislation in the UK governing the preparation and dissemination of financial statements may differ from legislation in other jurisdictions
The directors consider that the Annual Report, taken as a whole, is fair, balanced and understandable and provides the information necessary for shareholders to assess the Group’s position and performance, business model and strategy.
Each of the directors, confirms that, to the best of their knowledge:
- the Group Financial Statements, which have been prepared in accordance with IFRSs as adopted by the EU, give a true and fair view of the assets, liabilities, financial position and profit of the Group
- the Directors’ report contained in the Annual Report includes a fair review of the development and performance of the business and the position of the Group, together with a description of the principal risks and uncertainties that it faces.
Going concern The directors have a reasonable expectation that the Company and the Group have adequate resources to continue in operational existence for the foreseeable future and therefore continue to adopt the going concern basis in preparing the Financial Statements.
Disclosure of audit information Each of the directors, whose names and functions are listed in the Annual Report, confirms that, to the best of his/her knowledge no relevant audit information of which the Company’s independent auditor is unaware and that he or she has taken all reasonable steps that he or she ought to have taken as a director in order to make himself or herself aware of any relevant audit information and to ensure that the Company’s independent auditor is aware of that information.
Approved by the Board and signed on its behalf by
Richard Webster Company secretary 14 June 2017
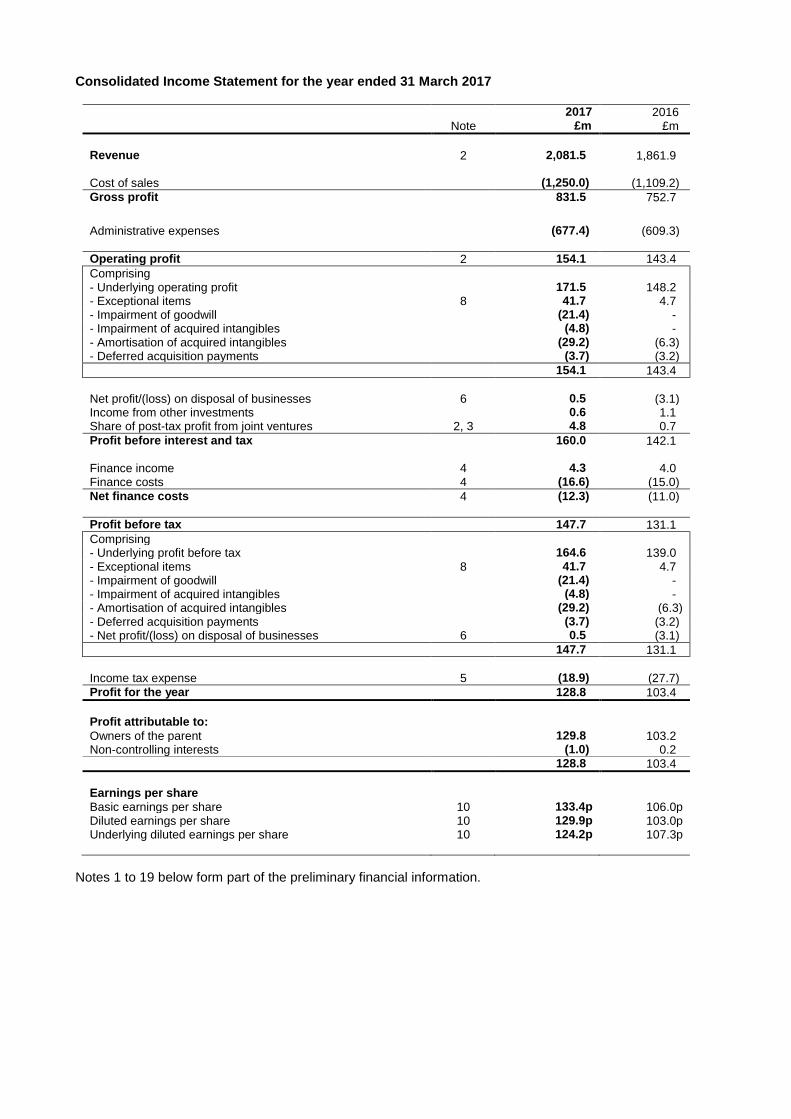
Consolidated Income Statement for the year ended 31 March 2017
2017 2016 Note £m £m
Revenue 2 2,081.5 1,861.9 Cost of sales (1,250.0) (1,109.2)
Gross profit 831.5 752.7
Administrative expenses (677.4) (609.3)
Operating profit 2 154.1 143.4
Comprising - Underlying operating profit 171.5 148.2 - Exceptional items 8 41.7 4.7 - Impairment of goodwill (21.4) - - Impairment of acquired intangibles (4.8) - - Amortisation of acquired intangibles (29.2) (6.3) - Deferred acquisition payments (3.7) (3.2)
154.1 143.4
Net profit/(loss) on disposal of businesses 6 0.5 (3.1) Income from other investments 0.6 1.1 Share of post-tax profit from joint ventures 2, 3 4.8 0.7
Profit before interest and tax 160.0 142.1 Finance income 4 4.3 4.0 Finance costs 4 (16.6) (15.0)
Net finance costs 4 (12.3) (11.0)
Profit before tax 147.7 131.1
Comprising - Underlying profit before tax 164.6 139.0 - Exceptional items 8 41.7 4.7 - Impairment of goodwill (21.4) - - Impairment of acquired intangibles (4.8) - - Amortisation of acquired intangibles (29.2) (6.3) - Deferred acquisition payments (3.7) (3.2) - Net profit/(loss) on disposal of businesses 6 0.5 (3.1)
147.7 131.1
Income tax expense 5 (18.9) (27.7)
Profit for the year 128.8 103.4
Profit attributable to: Owners of the parent 129.8 103.2 Non-controlling interests (1.0) 0.2 128.8 103.4
Earnings per share Basic earnings per share 10 133.4p 106.0p Diluted earnings per share 10 129.9p 103.0p Underlying diluted earnings per share 10 124.2p 107.3p
Notes 1 to 19 below form part of the preliminary financial information.
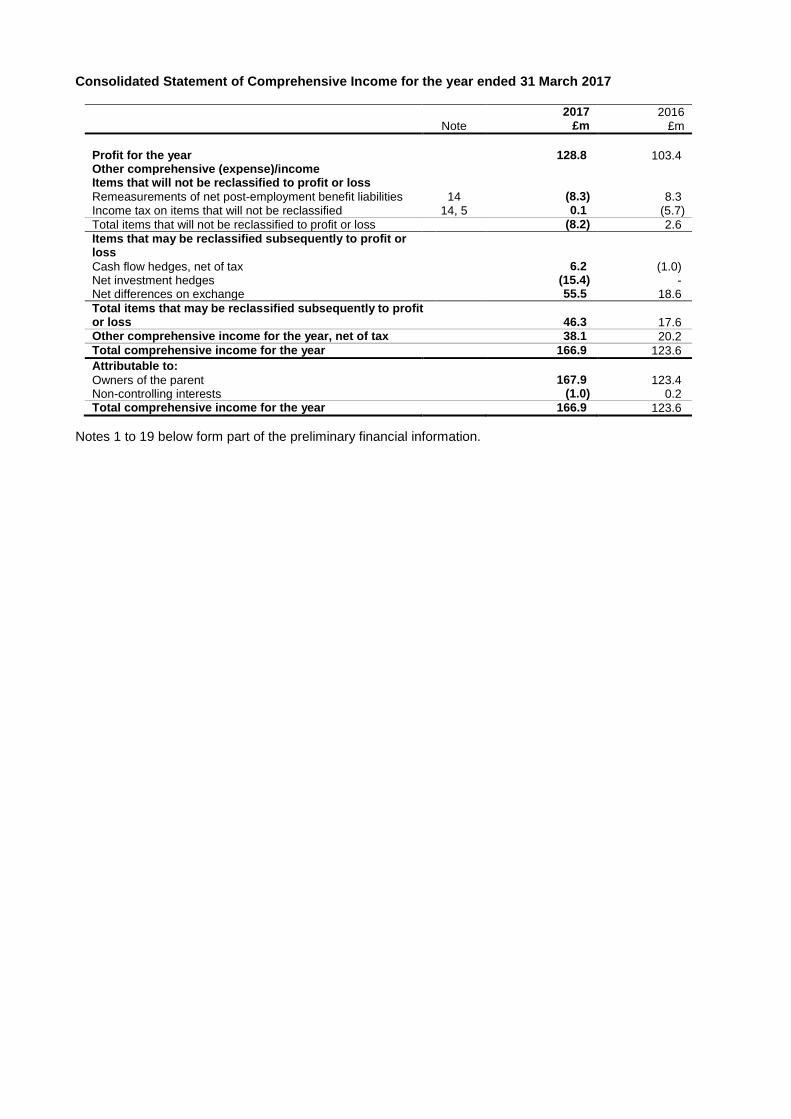
Consolidated Statement of Comprehensive Income for the year ended 31 March 2017
2017 2016 Note £m £m
Profit for the year 128.8 103.4 Other comprehensive (expense)/income Items that will not be reclassified to profit or loss Remeasurements of net post-employment benefit liabilities 14 (8.3) 8.3 Income tax on items that will not be reclassified 14, 5 0.1 (5.7)
Total items that will not be reclassified to profit or loss (8.2) 2.6
Items that may be reclassified subsequently to profit or loss Cash flow hedges, net of tax 6.2 (1.0) Net investment hedges (15.4) - Net differences on exchange 55.5 18.6
Total items that may be reclassified subsequently to profit or loss 46.3 17.6 Other comprehensive income for the year, net of tax 38.1 20.2 Total comprehensive income for the year 166.9 123.6
Attributable to: Owners of the parent 167.9 123.4 Non-controlling interests (1.0) 0.2 Total comprehensive income for the year 166.9 123.6
Notes 1 to 19 below form part of the preliminary financial information.

Consolidated Balance Sheet as at 31 March 2017
2017 2016 Note £m £m
Assets Non-current assets Goodwill 11 380.8 253.2 Other intangible assets 12 186.8 46.8 Property, plant and equipment 55.4 51.9 Investments in joint ventures 3 12.9 4.3 Deferred income tax assets 58.4 66.5 Derivative financial instruments 8.0 2.0 Other receivables 3.1 29.1 Post-employment benefit assets 14 15.8 -
721.2 453.8
Current assets Trade and other receivables 589.8 480.0 Financial assets at fair value through profit or loss 31.6 32.9 Cash and cash equivalents 224.5 419.3 Derivative financial instruments 5.7 1.3
851.6 933.5
Liabilities Current liabilities Borrowings 13 (0.1) (7.0) Trade and other payables (533.1) (483.0) Derivative financial instruments (0.8) (0.5) Current income tax liabilities (46.0) (28.3) Provisions for other liabilities and charges (1.3) (1.1)
(581.3) (519.9)
Net current assets 270.3 413.6
Non-current liabilities Borrowings 13 (263.0) (273.6) Provisions for other liabilities and charges (2.9) (2.8) Post-employment benefit liabilities 14 (274.9) (285.8) Derivative financial instruments (0.7) (1.0) Deferred income tax liabilities (27.1) (11.7) Other non-current liabilities (4.4) (3.2)
(573.0) (578.1)
Net assets 418.5 289.3
Capital and reserves Ordinary shares 15 0.5 0.5 Share premium account 62.4 62.4 Merger reserve 8.9 8.9 Retained earnings 347.6 217.2
Equity attributable to owners of the parent 419.4 289.0
Non-controlling interests (0.9) 0.3
Total equity 418.5 289.3
Notes 1 to 19 below form part of the preliminary financial information.

Consolidated Statement of Cash Flows for the year ended 31 March 2017
2017 2016 Note £m £m
Cash flows from operating activities Cash generated from operations 16 100.4 116.1 Interest received 2.8 3.6 Interest paid (7.0) (3.9) Income tax paid (21.5) (36.8)
Net cash generated from operating activities 74.7 79.0
Cash flows from investing activities Acquisitions of subsidiaries - consideration (235.3) - - cash acquired 0.3 - Deferred consideration received on sale of Woodcote Grove 7.5 - Investment in joint ventures (3.7) - Repayment of joint venture loans - 1.6 Purchases of property, plant and equipment (19.0) (16.8) Proceeds from disposals of property, plant and equipment 0.2 2.5 Proceeds from disposals of assets 47.1 - Dividends received from other investments 0.6 1.1 Net disposal proceeds from financial assets 2.3 0.5 Purchases of intangible assets (1.9) (3.0)
Net cash used in investing activities (201.9) (14.1)
Cash flows from financing activities Proceeds from new loans 0.2 - Proceeds of new bank loans - 164.7 Repayment of bank loans (55.4) - Redemption of loan notes receivable 19.7 0.1 Finance lease principal payments - (0.1) Purchase of own shares by employee benefit trusts (8.3) (13.0) Equity dividends paid to shareholders 9 (39.2) (36.2)
Net cash (used in)/generated from financing activities (83.0) 115.5
Net (decrease)/increase in cash and cash equivalents (210.2) 180.4
Cash and cash equivalents at beginning of year 419.3 235.4 Exchange movements 15.4 3.5
Cash and cash equivalents at end of year 17 224.5 419.3
Notes 1 to 19 below form part of the preliminary financial information.

Consolidated Statement of Changes in Equity for the year ended 31 March 2017
Attributable to owners of the parent
Share Non-
Ordinary premium Merger Retained controlling Total
Shares account reserve earnings interests Equity
£m £m £m £m £m £m
Balance at 1 April 2015 0.5 62.4 8.9 133.0 0.2 205.0 Profit for the year - - - 103.2 0.2 103.4
Remeasurements of net post-employment benefit liabilities - - - 8.3 - 8.3 Income tax on items that will not be reclassified - - - (5.7) - (5.7) Cash flow hedges - - - (1.0) - (1.0) Net differences on exchange - - - 18.6 - 18.6
Other comprehensive income for the year - - - 20.2 - 20.2 Total comprehensive income for the year - - - 123.4 0.2 123.6 Dividends provided for or paid - - - (36.2) (0.1) (36.3) Share-based payments - - - 9.4 - 9.4 Tax credit relating to share-based payments - - - 0.6 - 0.6 Employee benefit trusts - - - (13.0) - (13.0) Total contributions by and distributions to owners of the parent, recognised directly in equity - - - (39.2) (0.1) (39.3)
Balance at 31 March 2016 0.5 62.4 8.9 217.2 0.3 289.3 Profit/(loss) for the year - - - 129.8 (1.0) 128.8
Remeasurements of net post-employment benefit liabilities - - - (8.3) - (8.3)
Income tax on items that will not be reclassified - - - 0.1 - 0.1
Cash flow hedges, net of tax - - - 6.2 - 6.2
Net investment hedges (15.4) (15.4)
Net differences on exchange - - - 55.5 - 55.5
Other comprehensive income for the year - - - 38.1 - 38.1
Total comprehensive income for the year - - - 167.9 (1.0) 166.9
Dividends paid - - - (39.2) - (39.2)
Share-based payments - - - 9.3 - 9.3
Tax credit relating to share-based payments - - - 0.6 - 0.6
Employee benefit trusts - - - (8.2) - (8.2)
Total contributions by and distributions to owners of the parent, recognised directly in equity - - - (37.5) - (37.5)
Acquisition of non-controlling interest 0.1 0.1
Derecognition of non-controlling interest (0.3) (0.3)
Balance at 31 March 2017 0.5 62.4 8.9 347.6 (0.9) 418.5
The merger reserve relates to the issue of shares in respect of previous acquisitions.
Notes 1 to 19 below form part of the preliminary financial information.
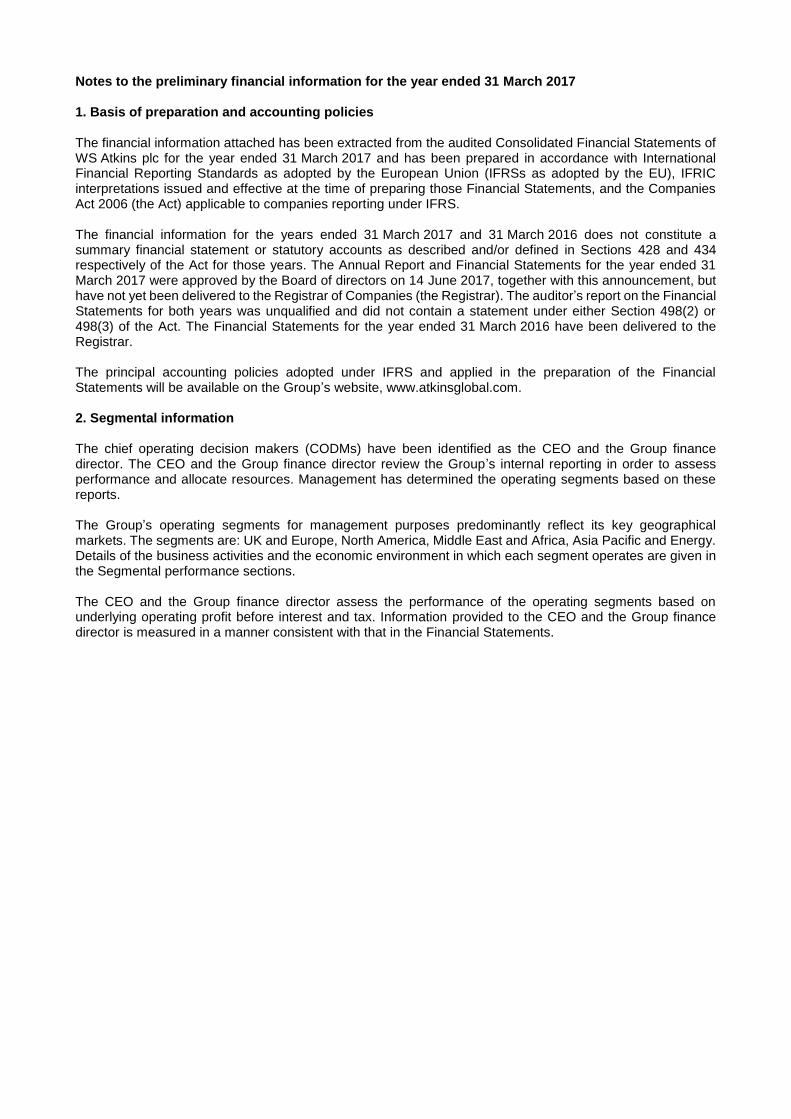
Notes to the preliminary financial information for the year ended 31 March 2017 1. Basis of preparation and accounting policies The financial information attached has been extracted from the audited Consolidated Financial Statements of WS Atkins plc for the year ended 31 March 2017 and has been prepared in accordance with International Financial Reporting Standards as adopted by the European Union (IFRSs as adopted by the EU), IFRIC interpretations issued and effective at the time of preparing those Financial Statements, and the Companies Act 2006 (the Act) applicable to companies reporting under IFRS. The financial information for the years ended 31 March 2017 and 31 March 2016 does not constitute a summary financial statement or statutory accounts as described and/or defined in Sections 428 and 434 respectively of the Act for those years. The Annual Report and Financial Statements for the year ended 31 March 2017 were approved by the Board of directors on 14 June 2017, together with this announcement, but have not yet been delivered to the Registrar of Companies (the Registrar). The auditor’s report on the Financial Statements for both years was unqualified and did not contain a statement under either Section 498(2) or 498(3) of the Act. The Financial Statements for the year ended 31 March 2016 have been delivered to the Registrar. The principal accounting policies adopted under IFRS and applied in the preparation of the Financial Statements will be available on the Group’s website, www.atkinsglobal.com. 2. Segmental information The chief operating decision makers (CODMs) have been identified as the CEO and the Group finance director. The CEO and the Group finance director review the Group’s internal reporting in order to assess performance and allocate resources. Management has determined the operating segments based on these reports. The Group’s operating segments for management purposes predominantly reflect its key geographical markets. The segments are: UK and Europe, North America, Middle East and Africa, Asia Pacific and Energy. Details of the business activities and the economic environment in which each segment operates are given in the Segmental performance sections. The CEO and the Group finance director assess the performance of the operating segments based on underlying operating profit before interest and tax. Information provided to the CEO and the Group finance director is measured in a manner consistent with that in the Financial Statements.

a) Group business segments Revenue and results
Share of
post-tax (loss)/
Inter profit
External segment Operating Operating from joint revenue trade Revenue profit/(loss) margin ventures 2017 £m £m £m £m % £m
UK and Europe 898.7 12.4 911.1 90.4 9.9 (0.1)
North America 478.7 1.8 480.5 33.5 7.0 -
Middle East and Africa 240.6 (8.4) 232.2 21.8 9.4 -
Asia Pacific 115.7 2.5 118.2 9.3 7.9 -
Energy 333.4 (6.4) 327.0 30.3 9.3 4.9
Total for segments 2,067.1 1.9 2,069.0 185.3 9.0 4.8
Group items:
Joint ventures - - - (8.2) -
Investment in Acuity 14.4 (1.9) 12.5 (5.6) -
Unallocated central items - - - (17.4) -
Total for Group 2,081.5 - 2,081.5 154.1 7.4 4.8
Share of post-tax Inter profit External segment Operating Operating from joint revenue trade Revenue profit/(loss) margin ventures 2016 £m £m £m £m % £m
UK and Europe 906.9 36.7 943.6 73.8 7.8 0.3 North America 362.0 0.6 362.6 20.4 5.6 - Middle East 285.0 (36.7) 248.3 29.5 11.9 - Asia Pacific 94.6 11.5 106.1 8.5 8.0 - Energy 213.4 (12.1) 201.3 16.7 8.3 0.4
Total for segments 1,861.9 - 1,861.9 148.9 8.0 0.7
Group items: Joint ventures - - - (0.7) - Unallocated central items - - - (4.8) -
Total for Group 1,861.9 - 1,861.9 143.4 7.7 0.7
Unallocated central items reported in the year ended 31 March 2017 comprise: £29.2m of intangible asset amortisation relating to the acquisitions of The PBSJ Corporation (PBSJ), Confluence Project Management Pte. Ltd (Confluence), Nuclear Safety Associates, Inc. (NSA), Houston Offshore Engineering, LLC (HOE), Terramar AS (Terramar), the projects, products and technology (PP&T) segment of EnergySolutions and Howard Humphreys (East Africa) Limited (Howard Humphreys) (see note 7); impairment of goodwill and intangible assets of HOE of £23.3m (see notes 11 and 12); £2.9m impairment of goodwill for the European aerospace business (see note 11); £5.1m of external costs in relation to the acquisition of PP&T (see note 8); £3.7m of deferred payment arising on the acquisition of HOE; external fees of £0.4m in relation to the recommended offer for the Company by SNC-Lavalin (see note 8); £1.6m additional profit on the disposal of part of the Group’s freehold property at Woodcote Grove (see note 8) and £45.6m gain on disposal of the minority PFI investment in the UK’s M25 motorway (see note 8). Acuity, our new advisory business, was launched during the financial year. We have not included it as a separate segment to maintain clarity of the existing segments and until such time as its results become more material to the Group. Unallocated central items reported in the year ended 31 March 2016 comprise: £6.3m of intangible asset amortisation relating to the acquisitions of PBSJ, Confluence, NSA, HOE and Terramar; £3.3m of external fees in relation to the acquisition of PP&T; £3.2m of deferred payment arising on the acquisition of HOE; £1.5m pension curtailment gain and £6.5m gain on disposal of part of the Group’s freehold property at Woodcote Grove.
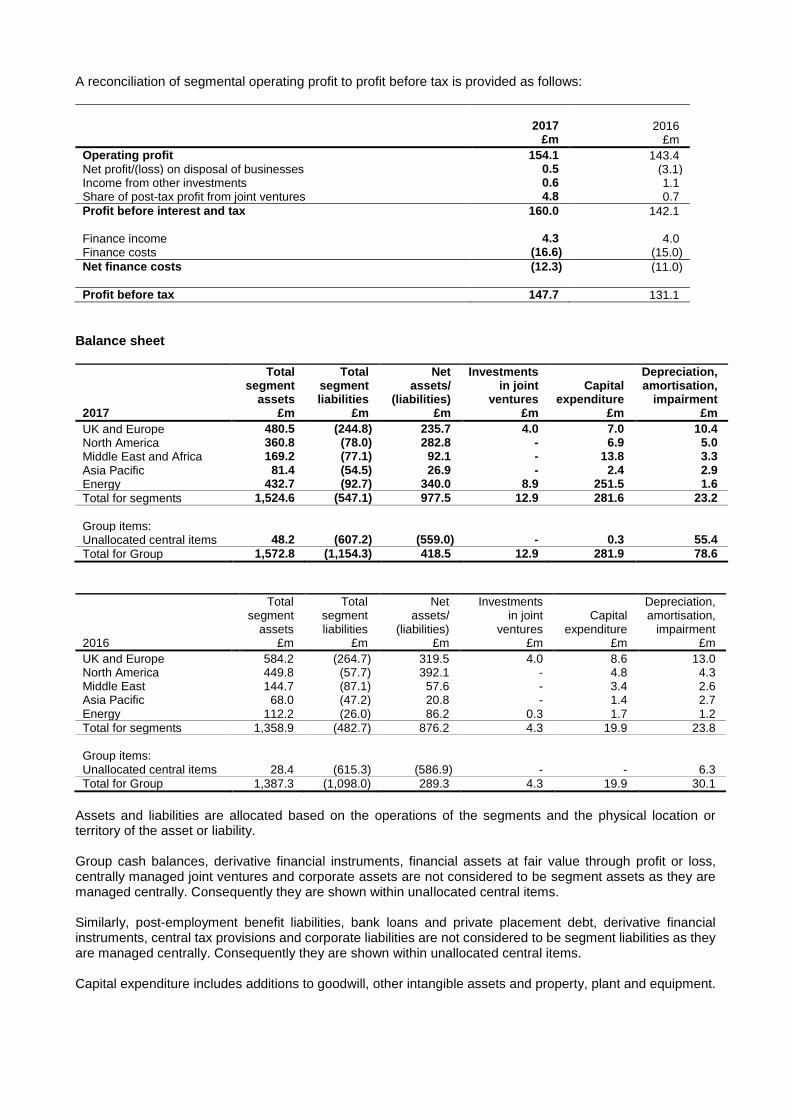
A reconciliation of segmental operating profit to profit before tax is provided as follows:
2017 2016 £m £m
Operating profit 154.1 143.4 Net profit/(loss) on disposal of businesses 0.5 (3.1) Income from other investments 0.6 1.1 Share of post-tax profit from joint ventures 4.8 0.7
Profit before interest and tax 160.0 142.1 Finance income 4.3 4.0 Finance costs (16.6) (15.0)
Net finance costs (12.3) (11.0)
Profit before tax 147.7 131.1
Balance sheet
Total Total Net Investments Depreciation,
segment segment assets/ in joint Capital amortisation, assets liabilities (liabilities) ventures expenditure impairment 2017 £m £m £m £m £m £m
UK and Europe 480.5 (244.8) 235.7 4.0 7.0 10.4
North America 360.8 (78.0) 282.8 - 6.9 5.0
Middle East and Africa 169.2 (77.1) 92.1 - 13.8 3.3
Asia Pacific 81.4 (54.5) 26.9 - 2.4 2.9
Energy 432.7 (92.7) 340.0 8.9 251.5 1.6
Total for segments 1,524.6 (547.1) 977.5 12.9 281.6 23.2
Group items:
Unallocated central items 48.2 (607.2) (559.0) - 0.3 55.4
Total for Group 1,572.8 (1,154.3) 418.5 12.9 281.9 78.6
Total Total Net Investments Depreciation, segment segment assets/ in joint Capital amortisation, assets liabilities (liabilities) ventures expenditure impairment 2016 £m £m £m £m £m £m
UK and Europe 584.2 (264.7) 319.5 4.0 8.6 13.0 North America 449.8 (57.7) 392.1 - 4.8 4.3 Middle East 144.7 (87.1) 57.6 - 3.4 2.6 Asia Pacific 68.0 (47.2) 20.8 - 1.4 2.7 Energy 112.2 (26.0) 86.2 0.3 1.7 1.2
Total for segments 1,358.9 (482.7) 876.2 4.3 19.9 23.8
Group items: Unallocated central items 28.4 (615.3) (586.9) - - 6.3
Total for Group 1,387.3 (1,098.0) 289.3 4.3 19.9 30.1
Assets and liabilities are allocated based on the operations of the segments and the physical location or territory of the asset or liability. Group cash balances, derivative financial instruments, financial assets at fair value through profit or loss, centrally managed joint ventures and corporate assets are not considered to be segment assets as they are managed centrally. Consequently they are shown within unallocated central items. Similarly, post-employment benefit liabilities, bank loans and private placement debt, derivative financial instruments, central tax provisions and corporate liabilities are not considered to be segment liabilities as they are managed centrally. Consequently they are shown within unallocated central items. Capital expenditure includes additions to goodwill, other intangible assets and property, plant and equipment.

b) Group geographical segments External revenue is measured by location of operation. There was no material difference between geographic revenue by location of operation and by location of customer. The Group considers the UK to be its country of domicile. Outside the UK, only the Group’s business in the United States (US) contributes more than 10% of the Group’s revenue or non-current assets.
Revenue Non-current assets
2017 2016 2017 2016 £m £m £m £m
UK 927.0 960.9 97.0 100.7 US 636.7 398.6 498.3 237.5 Other 517.8 502.4 59.5 47.1
Total for Group 2,081.5 1,861.9 654.8 385.3
Non-current assets exclude deferred tax assets and derivative financial instruments. c) Major customers In the year ended 31 March 2017, revenue from the UK Government represented approximately £217.5m (2016: £200.3m) of the Group’s total revenue and is included within the UK and Europe and Energy segments. 3. Joint ventures Aggregate financial information for all individually immaterial joint ventures.
2017 2016
Income Statement – continuing operations £m £m
Share of post-tax profit from joint ventures 4.8 0.7
2017 2016
Balance Sheet £m £m
Investments in joint ventures 12.9 4.3
The Group’s joint ventures are detailed in the Consolidated Financial Statements. 4. Net finance costs
2017 2016 £m £m
Interest payable on borrowings 6.8 3.2 Unwind of discount on contingent and deferred consideration 0.1 0.4 Unwinding of discount on vacant property - 0.1 Net finance costs on net post-employment benefit liabilities (note 14)
9.1
10.6
Other finance costs 0.6 0.7
Finance costs 16.6 15.0
Interest receivable on short term deposits (0.4) (0.8) Interest income on financial assets at fair value through profit or loss (0.8) (0.3) Unwinding of discount on deferred consideration (0.9) (0.3) Interest receivable on loan notes (2.1) (2.4) Other finance income (0.1) (0.2)
Finance income (4.3) (4.0)
Net finance costs 12.3 11.0
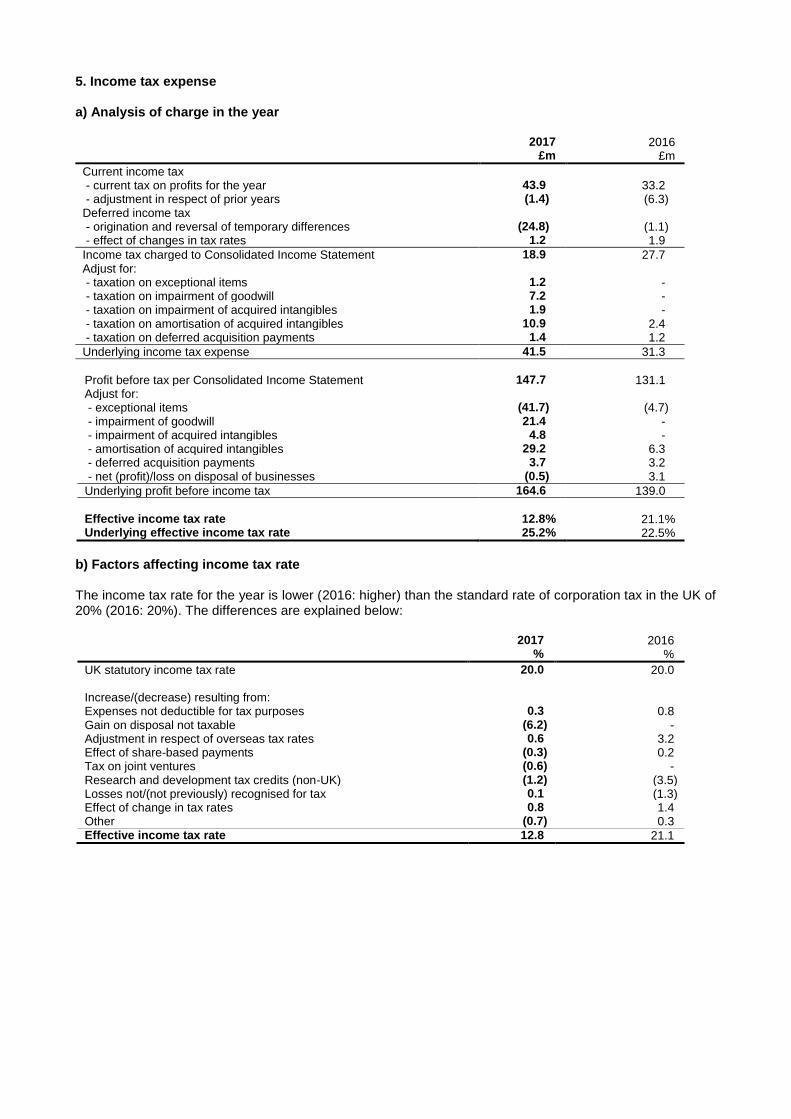
5. Income tax expense a) Analysis of charge in the year
2017 2016 £m £m
Current income tax - current tax on profits for the year 43.9 33.2 - adjustment in respect of prior years (1.4) (6.3) Deferred income tax - origination and reversal of temporary differences (24.8) (1.1) - effect of changes in tax rates 1.2 1.9
Income tax charged to Consolidated Income Statement 18.9 27.7 Adjust for: - taxation on exceptional items 1.2 - - taxation on impairment of goodwill 7.2 - - taxation on impairment of acquired intangibles 1.9 - - taxation on amortisation of acquired intangibles 10.9 2.4 - taxation on deferred acquisition payments 1.4 1.2
Underlying income tax expense 41.5 31.3
Profit before tax per Consolidated Income Statement 147.7 131.1 Adjust for: - exceptional items (41.7) (4.7) - impairment of goodwill 21.4 - - impairment of acquired intangibles 4.8 - - amortisation of acquired intangibles 29.2 6.3 - deferred acquisition payments 3.7 3.2 - net (profit)/loss on disposal of businesses (0.5) 3.1
Underlying profit before income tax 164.6 139.0
Effective income tax rate 12.8% 21.1% Underlying effective income tax rate 25.2% 22.5%
b) Factors affecting income tax rate The income tax rate for the year is lower (2016: higher) than the standard rate of corporation tax in the UK of 20% (2016: 20%). The differences are explained below:
2017 2016 % %
UK statutory income tax rate 20.0 20.0 Increase/(decrease) resulting from: Expenses not deductible for tax purposes 0.3 0.8 Gain on disposal not taxable (6.2) - Adjustment in respect of overseas tax rates 0.6 3.2 Effect of share-based payments (0.3) 0.2 Tax on joint ventures (0.6) - Research and development tax credits (non-UK) (1.2) (3.5) Losses not/(not previously) recognised for tax 0.1 (1.3) Effect of change in tax rates 0.8 1.4 Other (0.7) 0.3 Effective income tax rate 12.8 21.1
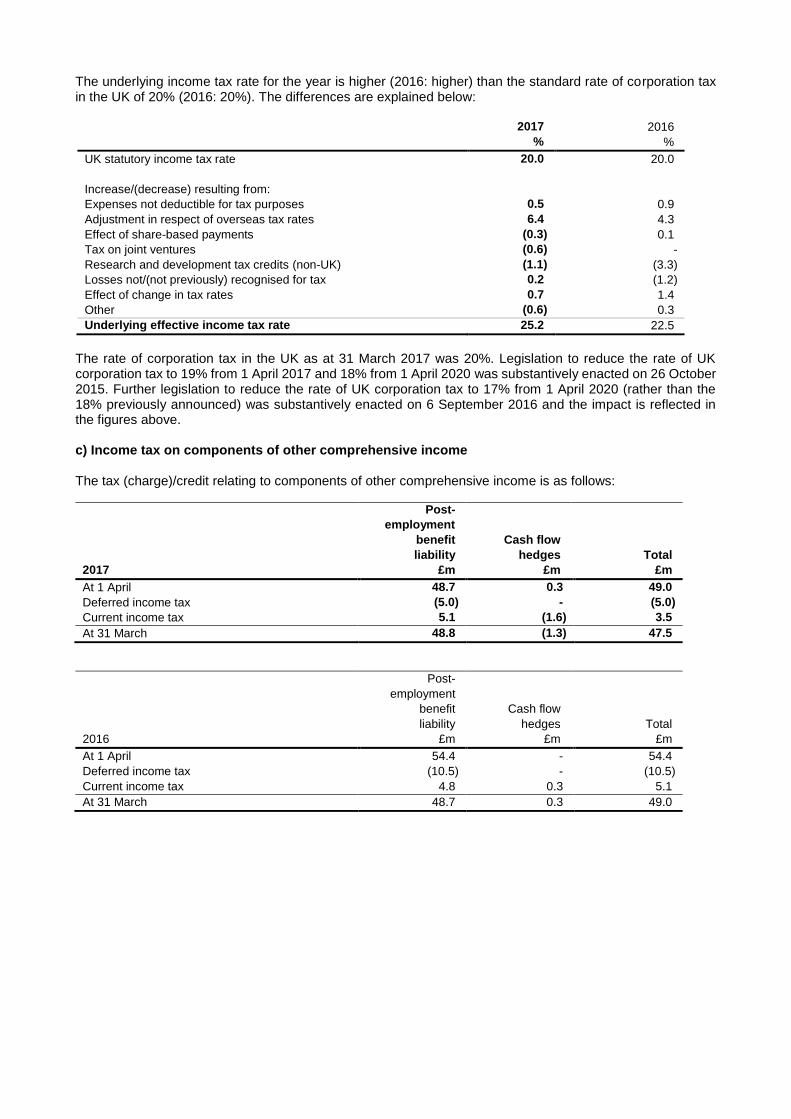
The underlying income tax rate for the year is higher (2016: higher) than the standard rate of corporation tax in the UK of 20% (2016: 20%). The differences are explained below:
2017 2016
% %
UK statutory income tax rate 20.0 20.0
Increase/(decrease) resulting from:
Expenses not deductible for tax purposes 0.5 0.9
Adjustment in respect of overseas tax rates 6.4 4.3
Effect of share-based payments (0.3) 0.1
Tax on joint ventures (0.6) -
Research and development tax credits (non-UK) (1.1) (3.3)
Losses not/(not previously) recognised for tax 0.2 (1.2)
Effect of change in tax rates 0.7 1.4
Other (0.6) 0.3
Underlying effective income tax rate 25.2 22.5
The rate of corporation tax in the UK as at 31 March 2017 was 20%. Legislation to reduce the rate of UK corporation tax to 19% from 1 April 2017 and 18% from 1 April 2020 was substantively enacted on 26 October 2015. Further legislation to reduce the rate of UK corporation tax to 17% from 1 April 2020 (rather than the 18% previously announced) was substantively enacted on 6 September 2016 and the impact is reflected in the figures above. c) Income tax on components of other comprehensive income The tax (charge)/credit relating to components of other comprehensive income is as follows:
Post-
employment
benefit Cash flow
liability hedges Total
2017 £m £m £m
At 1 April 48.7 0.3 49.0
Deferred income tax (5.0) - (5.0)
Current income tax 5.1 (1.6) 3.5
At 31 March 48.8 (1.3) 47.5
Post-
employment
benefit Cash flow
liability hedges Total
2016 £m £m £m
At 1 April 54.4 - 54.4
Deferred income tax (10.5) - (10.5)
Current income tax 4.8 0.3 5.1
At 31 March 48.7 0.3 49.0
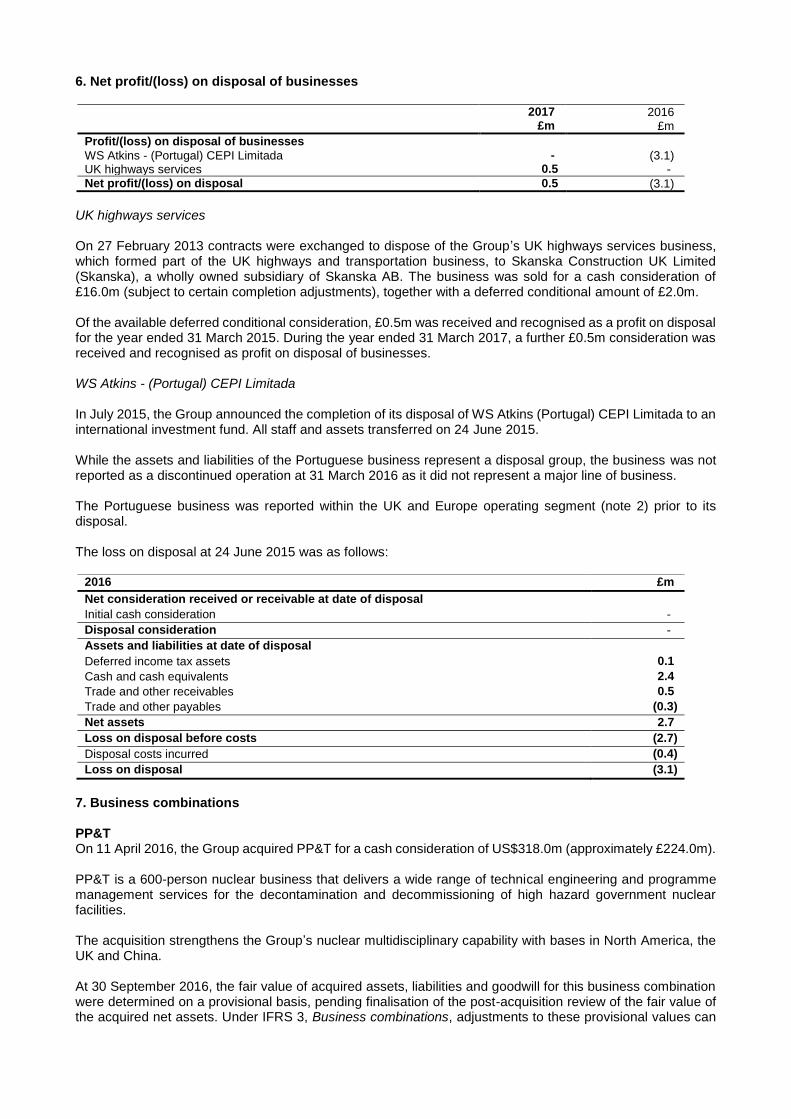
6. Net profit/(loss) on disposal of businesses
2017 2016 £m £m
Profit/(loss) on disposal of businesses WS Atkins - (Portugal) CEPI Limitada - (3.1) UK highways services 0.5 -
Net profit/(loss) on disposal 0.5 (3.1)
UK highways services On 27 February 2013 contracts were exchanged to dispose of the Group’s UK highways services business, which formed part of the UK highways and transportation business, to Skanska Construction UK Limited (Skanska), a wholly owned subsidiary of Skanska AB. The business was sold for a cash consideration of £16.0m (subject to certain completion adjustments), together with a deferred conditional amount of £2.0m. Of the available deferred conditional consideration, £0.5m was received and recognised as a profit on disposal for the year ended 31 March 2015. During the year ended 31 March 2017, a further £0.5m consideration was received and recognised as profit on disposal of businesses. WS Atkins - (Portugal) CEPI Limitada In July 2015, the Group announced the completion of its disposal of WS Atkins (Portugal) CEPI Limitada to an international investment fund. All staff and assets transferred on 24 June 2015. While the assets and liabilities of the Portuguese business represent a disposal group, the business was not reported as a discontinued operation at 31 March 2016 as it did not represent a major line of business. The Portuguese business was reported within the UK and Europe operating segment (note 2) prior to its disposal. The loss on disposal at 24 June 2015 was as follows:
2016 £m
Net consideration received or receivable at date of disposal
Initial cash consideration -
Disposal consideration -
Assets and liabilities at date of disposal
Deferred income tax assets 0.1
Cash and cash equivalents 2.4
Trade and other receivables 0.5
Trade and other payables (0.3)
Net assets 2.7
Loss on disposal before costs (2.7)
Disposal costs incurred (0.4)
Loss on disposal (3.1)
7. Business combinations PP&T On 11 April 2016, the Group acquired PP&T for a cash consideration of US$318.0m (approximately £224.0m). PP&T is a 600-person nuclear business that delivers a wide range of technical engineering and programme management services for the decontamination and decommissioning of high hazard government nuclear facilities. The acquisition strengthens the Group’s nuclear multidisciplinary capability with bases in North America, the UK and China. At 30 September 2016, the fair value of acquired assets, liabilities and goodwill for this business combination were determined on a provisional basis, pending finalisation of the post-acquisition review of the fair value of the acquired net assets. Under IFRS 3, Business combinations, adjustments to these provisional values can

be made within one year of the date of acquisition relating to facts and circumstances that existed at the acquisition date. The following table summarises the consideration paid for PP&T and the fair value of assets acquired and liabilities assumed at the acquisition date: Consideration at 11 April 2016
US$m £m
Initial cash consideration 318.0 224.0
Completion working capital adjustment 1.5 1.1
Total consideration 319.5 225.1
Fair value amounts recognised at the acquisition date for each major class of assets and liabilities assumed are as follows:
US$m £m
Acquired customer relationships (included in Intangible assets) 157.5 110.9
Intellectual property (included in Intangible assets) 54.8 38.6
Net retirement benefit assets 17.0 12.0
Deferred tax asset 7.6 5.4
Investments in joint ventures 4.7 3.3
Property, plant and equipment 0.6 0.4
Trade and other receivables 35.9 25.3
Deferred income tax liabilities on acquired Intangible assets (60.4) (42.6)
Trade and other payables (41.5) (29.1)
Total identifiable net assets 176.2 124.2
Goodwill 143.3 100.9
Total consideration 319.5 225.1
As at 31 March 2017, acquisition-related costs of £5.1m were charged to administrative expenses in the Consolidated Income Statement. The fair value of trade and other receivables is £25.3m and includes trade receivables of £13.8m. The gross contractual amount for trade receivables due is £15.7m, £1.9m of which is expected to be uncollectable. The revenue and underlying profit before tax included in the Group Consolidated Statement of Comprehensive Income since 11 April 2016 contributed by PP&T were £142.8m and £20.4m respectively. Had PP&T been consolidated from 1 April 2016, the Group’s Consolidated Income Statement for the year ended 31 March 2017 would show revenue of £2,085.0m and profit before tax of £164.9m. Howard Humphreys On 3 October 2016, the Group acquired Howard Humphreys for a cash consideration of 1,364m Kenyan shillings subject to working capital adjustments. Howard Humphreys is a multidisciplinary consultancy based in Kenya and Tanzania, which employs around 200 people. At 31 March 2017, the fair value of acquired assets, liabilities and goodwill for this business combination were determined on a provisional basis, pending finalisation of the post-acquisition review of the fair value of the acquired net assets. Under IFRS 3, Business combinations, adjustments to these provisional values can be made within one year of the date of acquisition relating to facts and circumstances that existed at the acquisition date. The following table summarises the consideration paid for Howard Humphreys and the fair value of assets acquired and liabilities assumed at the acquisition date:

Consideration at 3 October 2016
KESm £m
Initial cash consideration 1,364.0 10.4
Completion working capital adjustment (35.9) (0.2)
Total consideration 1,328.1 10.2
Fair value amounts recognised at the acquisition date for each major class of assets and liabilities assumed are as follows:
KESm £m
Acquired customer relationships (included in Intangible assets) 267.7 2.1
Intellectual property (included in Intangible assets) 17.3 0.1
Deferred tax asset 24.9 0.2
Trade and other receivables 364.3 2.8
Cash 37.4 0.3
Trade and other payables (306.3) (2.3)
Income tax liabilities (40.7) (0.3)
Deferred tax liabilities on acquired Intangible assets (87.3) (0.7)
Total identifiable net assets 277.3 2.2
Goodwill 1,050.8 8.0
Total consideration 1,328.1 10.2
The fair value of trade and other receivables is £2.8m and includes trade receivables of £1.3m. The gross contractual amount for trade receivables due is £1.6m, £0.3m of which is expected to be uncollectable. The revenue and underlying loss before tax included in the Group Consolidated Statement of Comprehensive Income since 3 October 2016 contributed by Howard Humphreys were £2.2m and £0.8m respectively. Had Howard Humphreys been consolidated from 1 April 2016, the Group’s Consolidated Income Statement for the year ended 31 March 2017 would show revenue of £2,084.5m and profit before tax of £165.4m. 8. Exceptional items Exceptional items are disclosed separately on the face of the Consolidated Income Statement and in the notes to the Financial Statements where it is necessary to do so to provide further understanding of the financial performance of the Group. They are items of income or expense that have been shown separately due to the significance of their nature or amount. An analysis of the amounts presented as exceptional items in these Financial Statements is given below:
2017 2016 £m £m
Profit on disposal of property 1.6 6.5 Profit on disposal of minority PFI investment in the UK’s M25 motorway 45.6 -
External fees in relation to acquisition of PP&T (5.1) (3.3) External costs in relation to the recommended offer for the Company by SNC-Lavalin
(0.4) -
Curtailment gain relating to one-off pension events - 1.5
41.7 4.7
The exceptional items above are included within administrative expenses in the Group’s Consolidated Income Statement. The sale of part of the Group’s Woodcote Grove property in Epsom completed on 30 September 2015 and resulted in a pre and post-tax profit on disposal of £6.5m being recognised at 31 March 2016. There was no tax on the profit on disposal as the taxable gain will be reduced to nil by indexation allowance. In December 2016, the purchaser of Woodcote Grove sold on the development, triggering an additional taxable profit of £1.6m net of stamp duty and legal fees. The disposal of the investment in Connect Plus (M25) Holdings Ltd and Connect Plus (M25) Intermediate Ltd occurred in December 2016. The cash consideration received was £66.3m and a profit on disposal of £45.6m was recognised, net of legal fees. No tax arises on the gain due to a specific UK exemption. In November 2015, the Group signed an agreement to acquire PP&T, an international nuclear engineering services business headquartered in North America. The transaction completed on 11 April 2016. Consistent
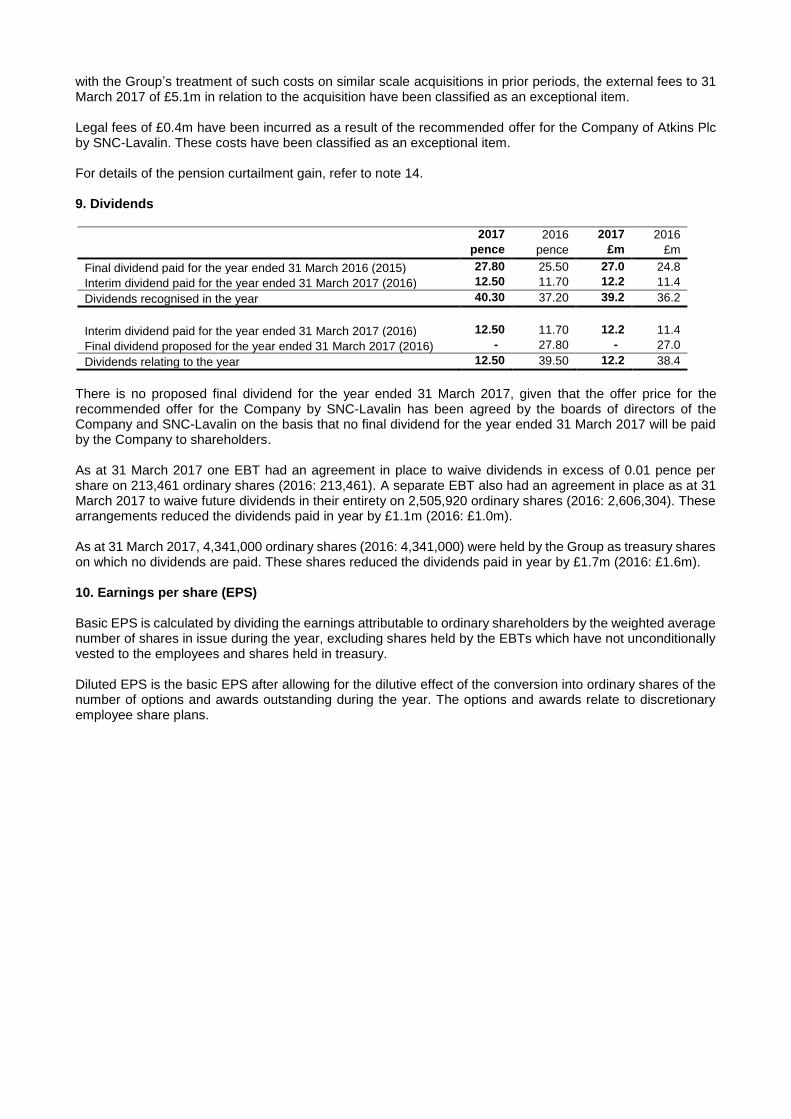
with the Group’s treatment of such costs on similar scale acquisitions in prior periods, the external fees to 31 March 2017 of £5.1m in relation to the acquisition have been classified as an exceptional item. Legal fees of £0.4m have been incurred as a result of the recommended offer for the Company of Atkins Plc by SNC-Lavalin. These costs have been classified as an exceptional item. For details of the pension curtailment gain, refer to note 14. 9. Dividends
2017 2016 2017 2016
pence pence £m £m
Final dividend paid for the year ended 31 March 2016 (2015) 27.80 25.50 27.0 24.8
Interim dividend paid for the year ended 31 March 2017 (2016) 12.50 11.70 12.2 11.4
Dividends recognised in the year 40.30 37.20 39.2 36.2
Interim dividend paid for the year ended 31 March 2017 (2016) 12.50 11.70 12.2 11.4
Final dividend proposed for the year ended 31 March 2017 (2016) - 27.80 - 27.0
Dividends relating to the year 12.50 39.50 12.2 38.4
There is no proposed final dividend for the year ended 31 March 2017, given that the offer price for the recommended offer for the Company by SNC-Lavalin has been agreed by the boards of directors of the Company and SNC-Lavalin on the basis that no final dividend for the year ended 31 March 2017 will be paid by the Company to shareholders. As at 31 March 2017 one EBT had an agreement in place to waive dividends in excess of 0.01 pence per share on 213,461 ordinary shares (2016: 213,461). A separate EBT also had an agreement in place as at 31 March 2017 to waive future dividends in their entirety on 2,505,920 ordinary shares (2016: 2,606,304). These arrangements reduced the dividends paid in year by £1.1m (2016: £1.0m). As at 31 March 2017, 4,341,000 ordinary shares (2016: 4,341,000) were held by the Group as treasury shares on which no dividends are paid. These shares reduced the dividends paid in year by £1.7m (2016: £1.6m). 10. Earnings per share (EPS) Basic EPS is calculated by dividing the earnings attributable to ordinary shareholders by the weighted average number of shares in issue during the year, excluding shares held by the EBTs which have not unconditionally vested to the employees and shares held in treasury. Diluted EPS is the basic EPS after allowing for the dilutive effect of the conversion into ordinary shares of the number of options and awards outstanding during the year. The options and awards relate to discretionary employee share plans.
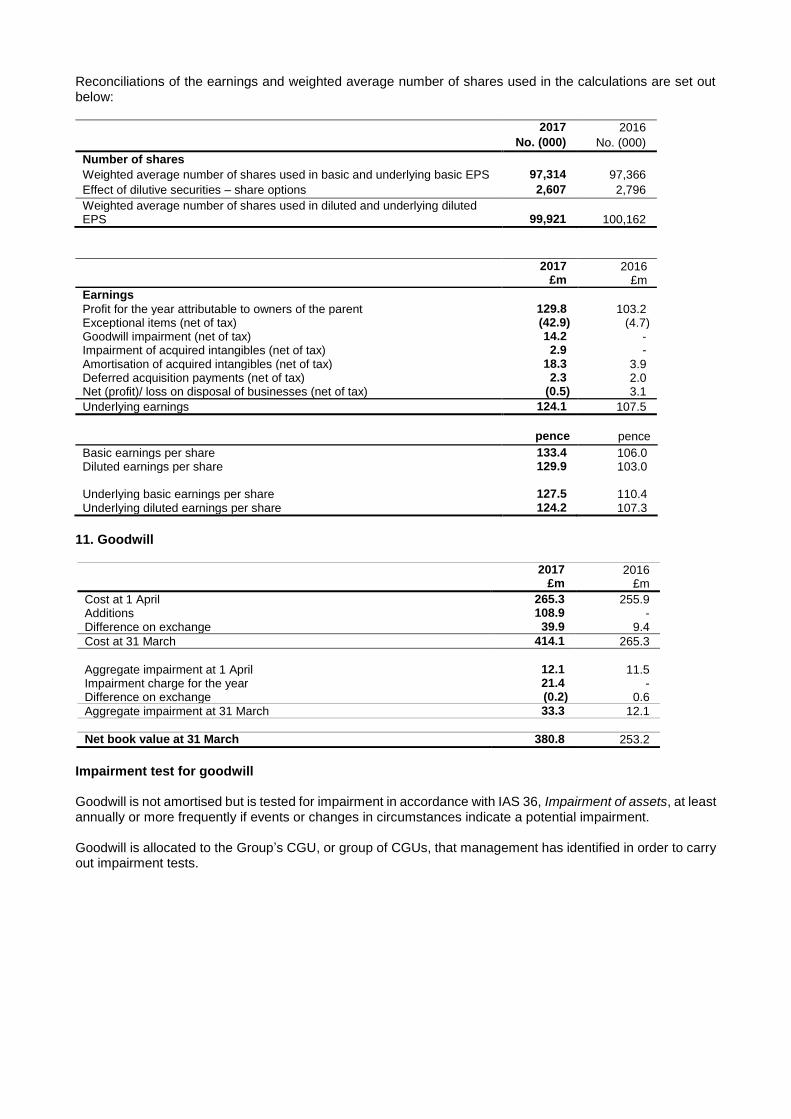
Reconciliations of the earnings and weighted average number of shares used in the calculations are set out below:
2017 2016
No. (000) No. (000)
Number of shares
Weighted average number of shares used in basic and underlying basic EPS 97,314 97,366
Effect of dilutive securities – share options 2,607 2,796
Weighted average number of shares used in diluted and underlying diluted EPS 99,921 100,162
2017 2016 £m £m
Earnings Profit for the year attributable to owners of the parent 129.8 103.2 Exceptional items (net of tax) (42.9) (4.7) Goodwill impairment (net of tax) 14.2 - Impairment of acquired intangibles (net of tax) 2.9 -
Amortisation of acquired intangibles (net of tax) 18.3 3.9 Deferred acquisition payments (net of tax) 2.3 2.0 Net (profit)/ loss on disposal of businesses (net of tax) (0.5) 3.1
Underlying earnings 124.1 107.5
pence pence
Basic earnings per share 133.4 106.0 Diluted earnings per share 129.9 103.0 Underlying basic earnings per share 127.5 110.4 Underlying diluted earnings per share 124.2 107.3
11. Goodwill
2017 2016 £m £m
Cost at 1 April 265.3 255.9 Additions 108.9 - Difference on exchange 39.9 9.4
Cost at 31 March 414.1 265.3
Aggregate impairment at 1 April 12.1 11.5 Impairment charge for the year 21.4 - Difference on exchange (0.2) 0.6
Aggregate impairment at 31 March 33.3 12.1
Net book value at 31 March 380.8 253.2
Impairment test for goodwill Goodwill is not amortised but is tested for impairment in accordance with IAS 36, Impairment of assets, at least annually or more frequently if events or changes in circumstances indicate a potential impairment. Goodwill is allocated to the Group’s CGU, or group of CGUs, that management has identified in order to carry out impairment tests.
The following is a summary of goodwill allocation by CGU or group of CGUs, summarised at the operating segment level:
2017 2016
£m £m
UK and Europe 48.7 49.7
North America 171.9 151.5
Middle East and Africa 8.2 -
Asia Pacific 6.6 5.9
Energy 145.4 46.1
Total 380.8 253.2
The impairment test involves comparing the carrying value of the CGU, or group of CGUs, to which goodwill has been allocated to their recoverable amount. The recoverable amount is based on the higher of fair value less costs to sell and value-in-use. An impairment loss is recognised immediately when the carrying value of those assets exceeds their recoverable amount. Cash generating units Following the reorganisation of our global Energy business into five regional divisions, which took effect on 1 August 2016, the CGUs for the purpose of testing goodwill allocated to the Energy operating segment have changed. In accordance with IAS 36, this reorganisation requires a reallocation of goodwill previously allocated to the CGUs of the former reporting structure. There were no changes to the goodwill allocation at the operating segment level. Recoverable amount Fair value less costs to sell is the best estimate of the amount obtainable from the sale of a CGU, or group of CGUs, in an arm’s-length transaction between knowledgeable, willing parties, less the costs of disposal. Value-in-use is the present value of the future cash flows expected to be derived from the CGU, or group of CGUs. Fair value is assessed from an external perspective and value-in-use from a Group internal perspective. Both are determined using a business valuation model, taking into account planned future cash flows. If available, third-party valuations are taken as a basis for determining fair value. Value in use calculations Methodology The internal value-in-use calculations use cash flow projections based on the following financial year’s budget approved by the Board, which is based on past performance and management’s expectations of market developments, and the Group’s formal five-year plan. The key assumptions in both the budget and the five-year plan relate to revenue and profit margins. Revenue is based on management’s knowledge of actual results from prior years, along with the existing committed and contracted workload, as well as management’s future expectations of the level of work available within the market. Profit margins are based on current margins being achieved in conjunction with economic conditions in the market or country of operation. The cash flow projections from the budget are extrapolated for the next four years using an estimated growth rate and projected margin for all CGUs, or groups of CGUs, except for the North America operating segment and the two businesses operating in the Americas that are part of the Energy operating segment. The Group’s formal five-year plan is used for these parts of the business as it provides a better indication of their future performance. The growth rates used to extrapolate the budgets are between 1.8% to 2.9% and are based on the economic environment for the country or region in which the CGU operates. As required by IAS 36, cash flows beyond the five-year period are extrapolated based on the long-term average growth rate for the primary country or region in which the CGU operates of between 1.7% and 3.1%. The growth rates are derived from the International Monetary Fund’s World Economic Outlook published gross domestic product (GDP) growth rates. Projected margins reflect the historical and budgeted performance of the CGU or the Group’s formal five-year plan margin expectations. The projections do not include the impact of future restructuring projects to which the Group is not yet committed.
The cash flows have been discounted using the CGU’s specific pre-tax discount rates of between 10.6% and 15.1%. The discount rates have been calculated using the capital asset pricing model to determine the cost of equity and are adjusted for risks specific to the CGU. The discount rates are revised annually using updated market information. Assumptions The growth rate and discount rate assumptions used for the internal value in use calculations are as follows:
2017 2016
Five-year growth rate 1.8%- 2.9% 1.9%- 3.0% Post five-year growth rate 1.7%- 3.1% 1.8%- 3.2% Pre-tax discount rate 10.6%- 15.1% 8.9%- 13.1%
Impairment loss
North America oil and gas CGU As a result of the reorganisation of our global Energy business, the carrying amount of goodwill in the North America oil and gas CGU that arose from the acquisition of the oil and gas offshore engineering business, HOE, was reviewed during the year and, as a consequence, has been fully impaired resulting in a loss of £18.5m. This impairment charge relates solely to the goodwill and has been recognised in the Consolidated Income Statement within administrative expenses as an unallocated central item. The carrying amount of goodwill in this CGU at 31 March 2017 is £nil. In addition, £4.8m of intangible assets were impaired as part of the same exercise, being the residual impairment required to bring the carrying amount of the CGU to its recoverable amount. This amount has been recognised in the Consolidated Income Statement within administrative expenses as an unallocated central item. At the year end, the recoverable amount of the Group’s North America oil and gas CGU was determined using an internal value-in-use calculation, a key input to which is the Group’s formal five-year plan which covers the period to 2022. The other assumptions used for this value-in-use calculation are the long-term growth rate and the discount rate as follows:
2017 2016
Post five-year growth rate 1.8% 1.8%
Pre-tax discount rate 14.6% 10.7%
Sensitivity analysis has been performed on the key assumptions used in the value-in-use calculations. The two assumptions to which the value-in-use calculations are most sensitive are projected profit margin and the discount rate. Specific sensitivity analysis with regard to these assumptions shows that, with respect to the profit margin it would need to fall by 70 basis points before the carrying value of the CGU would exceed its recoverable amount, and similarly the pre-tax discount rate would need to increase from 14.6% to 16.8%. Goodwill has been fully impaired, so any further impairment would be to the carrying value of the intangible assets. European aerospace Following the decision in March 2017 to close Atkins B.V. (our aerospace consultancy based in the Netherlands) and, eventually, to liquidate the company, the carrying amount of goodwill arising on the acquisition of the company in 2007 was identified as being directly attributable to the operation. As a consequence, the net book value of the remaining goodwill has been fully impaired resulting in a loss of £2.9m. This impairment charge has been recognised in the Consolidated Income Statement within administrative expenses as an unallocated central item. There is no significant risk of the carrying value of the CGU, to which this goodwill has been allocated, exceeding its recoverable amount.

Sensitivity analysis
The groups of CGUs for which the carrying amount of goodwill is deemed significant, in comparison with the Group’s total carrying amount of goodwill are the North America group of CGUs and the Americas nuclear group of CGUs that is part of the Energy operating segment. North America group of CGUs Goodwill of £171.9m (2016: £151.5m) allocated to the North America operating segment includes £162.9m of goodwill arising on the acquisition of PBSJ. The recoverable amount of this group of CGUs has been determined using an internal value-in-use calculation, key inputs to which are the Group’s 2017/18 budget and the formal five-year plan for the North America segment, which covers the period to March 2022. The other assumptions used for this value-in-use calculation are the long-term growth rate and the discount rate as follows:
2017 2016
Post five-year growth rate 1.7% 2.0%
Pre-tax discount rate 14.4% 12.2%
Given the materiality of goodwill allocated to the North America group of CGUs, sensitivity analysis has been performed on the key assumptions used in the value-in-use calculations. The two assumptions to which these value-in-use calculations are most sensitive are projected profit margin and the discount rate. Specific sensitivity analysis with regard to these assumptions shows that, with respect to the profit margin, it would need to fall by 210 basis points before any impairment would be triggered, and similarly the pre-tax discount rate would need to increase from 14.4% to 18.9%. The Americas nuclear group of CGUs Goodwill of £145.4m (2016: £46.1m) allocated to the Energy operating segment includes £114.0m of goodwill arising on the acquisition of the PP&T business in North America that is allocated to the Americas nuclear group of CGUs. The recoverable amount of this group of CGUs has been determined using an internal value-in-use calculation, key inputs to which are the Group’s 2017/18 budget and the formal five-year plan for the Americas nuclear business, which covers the period to March 2022. The other assumptions used for this value-in-use calculation are the long-term growth rate and the discount rate as follows:
2017
Post five-year growth rate 1.8%
Pre-tax discount rate 14.5%
Given the materiality of goodwill allocated to the Americas nuclear group of CGUs, sensitivity analysis has been performed on the key assumptions used in the value-in-use calculations. The two assumptions to which these value-in-use calculations are most sensitive are projected profit margin and the discount rate. Specific sensitivity analysis with regard to these assumptions shows that, with respect to the profit margin, it would need to fall by 80 basis points before any impairment would be triggered, and similarly the pre-tax discount rate would need to increase from 14.5% to 15.4%. For the CGUs other than those disclosed above, management has considered the level of headroom resulting from the impairment tests. Where appropriate, further sensitivity analysis has been performed by changing the base case assumptions applicable to each CGU. The analysis has indicated that no reasonably possible change in any individual key assumption would cause the carrying amount of any CGU to exceed its recoverable amount. As at 31 March 2017 and 2016, based on these valuations, the recoverable value of the remaining goodwill in these other CGUs required no impairment.
12. Other intangible assets
Acquired customer
relationships
Corporate information
systems
Trade names and trademarks
Software licences
Total Net book value £m £m £m £m £m
At 31 March 2017 149.7 - 32.7 4.4 186.8
At 31 March 2016 36.2 - 5.0 5.6 46.8
The Group acquired £149.5m of intangible assets through the acquisition of PP&T (£38.6m in respect of intellectual property and £110.9m in respect of customer relationships and backlog orders). The Group acquired £2.2m of intangible assets through the acquisition of Howard Humphreys (£0.1m in respect of tradenames and £2.1m in respect of customer relationships and backlog orders). Included in the amortisation charge for the year ended 31 March 2017 is £29.2m in respect of acquired intangibles. The amortisation charge for the year is £32.7m (2016: £11.9m) and is included in administrative expenses in the Consolidated Income Statement. The impairment charge for the period of £4.8m (2016: £nil) is included in the administrative expenses in the Consolidated Income Statement and arises from the impairment review of the North America oil and gas CGU. 13. Borrowings
2017 2016 £m £m
Current Bank loans - 7.0 Finance leases 0.1 -
0.1 7.0
Non-current Bank loans 203.1 220.9 Private placement debt 59.7 52.6 Other borrowings 0.2 - Finance leases - 0.1
263.0 273.6
Total 263.1 280.6
The directors consider that the carrying amounts of borrowings and the private placement debt approximate their fair value. Movements in borrowings are analysed as follows:
Year to Year to 31 March 2017 31 March 2016 £m £m
At beginning of period 280.6 111.3 Loan draw down - 164.1 Repayment of borrowings (55.4) - Proceeds from new loans 0.2 - Difference on exchange 37.7 5.2
At end of period 263.1 280.6
The Group has the following undrawn committed borrowing facilities available at 31 March expiring as follows:
2017 2016 £m £m
Later than two years and no later than five years 96.7 71.9
All of the Group’s undrawn committed borrowing facilities are subject to fixed rates of interest.
On 30 January 2016 the Group amended and extended its five year revolving credit facility (RCF). This £200m facility matures on 30 January 2021. On 11 March 2016 the Group signed a new RCF of £100m, with a maturity of three years. On 23 February 2017, the Group exercised an option to extend the facility by an additional year. This £100m facility now matures on 11 March 2020. The total letters of credit in issue under the committed facilities at 31 March 2017 was £0.2m (31 March 2016: £0.2m). The £100m facility has the following lenders: Bank of America Merrill Lynch International Limited, Barclays Bank plc, HSBC Bank plc and National Westminster Bank plc. The £200m facility additionally has the following lenders: The National Bank of Abu Dhabi PJSC London Branch, Abbey National Treasury Services plc and United Overseas Bank Limited London Branch. The Group’s borrowing facilities include a number of undertakings and financial covenants. Compliance with these covenants is monitored. As at 31 March 2017, and since, there have been no breaches (2016: none). In the financial year ended 31 March 2013, the Group raised $75m through the successful execution of its debut issue in the US private placement market. The proceeds were used to repay drawn funds under the Group’s existing banking facilities. The private placement is due for repayment on 31 May 2019 and carries a nominal interest rate of 4.38%. 14. Post-employment benefit liabilities The Group’s post-employment benefit liabilities are analysed below:
2017 2016
£m £m
Net retirement benefit liabilities (251.5) (265.3)
Other post-employment benefit liabilities (23.4) (20.5)
(274.9) (285.8)
Net retirement benefit assets 15.8 -
(259.1) (285.8)
(a) Net retirement benefit liabilities The Group, through trustees, operates a number of defined benefit and defined contribution pension schemes. Defined contribution schemes are those where the Group’s obligation is limited to the amount that it contributes to the scheme and the scheme members bear the investment and actuarial risks. Defined benefit schemes are schemes other than defined contribution schemes where the Group’s obligation is to provide specified benefits on retirement. The two main defined benefit schemes are the Atkins Pension Plan (the APP) and the Railways Pension Scheme (RPS), both of which are funded final salary schemes. The assets of both schemes are held in separate trustee-administered funds. Other pension schemes include the Atkins McCarthy Pension Plan in the Republic of Ireland, which is a final salary funded defined benefit scheme, Terramar AS Pension Plan in Norway, and a range of defined contribution schemes or equivalent. As part of the acquisition on 11 April 2016 (refer note 7), the Group took over the EnergySolutions Section of the Magnox Group of the Electricity Supply Pension Scheme (ESPS), a funded final salary scheme. At 31 March 2017 this scheme reported net retirement benefit assets of £15.8m. As part of the PP&T acquisition (refer note 7), one of the UK companies purchased had a defined benefit scheme, the GPS Energy Solutions Section of the Combined Nuclear Pension Plan (CNPP), for which all future funding costs, and other such liabilities, were agreed to be borne by the seller. The Group is fully indemnified against any future costs of the scheme, and indeed the seller assumed a further obligation to terminate the scheme at its own cost, through a buy-out or otherwise. Additionally, the Group has no right to any accounting surpluses that may arise in respect of CNPP. The assets and liabilities of the scheme have been included in the consolidated results for the Group, however, the net IAS 19 asset has been written down to £nil. To date, the scheme remains open and the seller continues its responsibility to fulfil any future funding requirements. The schemes operate under trust law and are managed and administered by trustees on behalf of the members in accordance with the terms of the trust deed and rules and relevant legislation. Defined benefit contributions
are determined in consultation with the trustees, after taking actuarial advice. The trustees are responsible for establishing the investment strategy and ensuring that there are sufficient assets to meet the cost of current and future benefits. The APP is closed to the future accrual of benefit; all defined benefit members of the APP were transferred to a defined contribution section for future service where it was clear they did not benefit from a statutory or contractual right to a final salary pension. The RPS recognised a curtailment gain in the year ended 31 March 2016. The curtailment gain arose for members moving from the uncapped salary category or retail price index (RPI) capped salary category to the consumer price index (CPI) capped category. The reduction in the past service liability for this curtailment is £1.5m and this has been recognised as a curtailment gain in the year ended 31 March 2016. The RPS invests in a range of pooled investment funds intended to generate a combination of capital growth and income and as determined by the trustee, taking account of the characteristics of the obligations and the trustee’s attitude to risk. The majority of the RPS’s assets that are intended to generate additional returns, over the rate at which the obligations are expected to grow, are invested in a single pooled ‘growth’ fund. This fund is invested in a wide range of asset classes and the fund manager RPMI has the discretion to vary the asset allocation to reflect its views on the relative attractiveness of different asset classes at any time. The remaining assets in the RPS are principally fixed and index-linked bonds. The triennial funding valuation as at 31 December 2016 is currently underwary. The assets of the ESPS are held in a separate trustee-administered fund. Under the ESPS, employees are entitled to annual pensions on retirement at normal retirement age of one-eightieth of final pensionable salary for each year of service, plus a cash lump sum of three-eightieths of final pensionable salary for each year of service. Benefits are also payable on death and following other events such as withdrawing from active service. No other post-employment benefits are provided to these employees. The Atkins McCarthy Pension Plan was closed to future accrual of benefits for members who do not benefit from a statutory or contractual right to a final salary pension on 31 March 2009. These members transferred to the Personal Retirement Savings Accounts - Ireland (PRSA - Irish Life) scheme with effect from 1 April 2009. The Terramar AS Pension Plan was closed to new entrants on 1 January 2009. It is a funded pension scheme and is managed by DNB (Norway’s largest financial services group). In order to obtain full pension entitlements, the scheme participants are required to complete 30 years of pensionable service prior to them obtaining the right to a life-long retirement pension corresponding to the difference between 66% of the employee’s salary at retirement and estimated benefits from the Norwegian National Insurance Scheme. Economic and actuarial assumptions comply with prevailing technical recommendations in Norway. The defined benefit sections of all pension schemes are mostly closed to new entrants, who are offered membership of the defined contribution section.
The main assumptions used for the IAS 19 valuation of the retirement benefit liabilities for the APP and the RPS and the ESPS are listed in the table below:
2017 2016
Price inflation
RPI 3.10% 2.90%
CPI 2.10% 1.90%
Rate of increase of pensions in payment
Limited Price Indexation (RPI-based) 2.90% 2.80%
Limited Price Indexation (CPI-based) 2.20% 2.00%
Limited Price Indexation to 2.5% 2.50% 2.50%
Fixed 5.00% 5.00%
Rate of increase in salaries
Atkins Pension Plan and ESPS 3.10% 4.40%
Railways Pension Scheme (uncapped) 3.85% 5.15%
Railways Pension Scheme (RPI capped) 3.10% 2.90%
Railways Pension Scheme (CPI capped) 2.10% 1.90%
Rate of increase for deferred pensioners
Atkins Pension Plan and ESPS 3.10% 2.90%
Railways Pension Scheme 2.10% 1.90%
Discount rate 2.50% 3.50%
Longevity at age 65 for current pensioners
Men (Atkins Pension Plan and Railways Pension Scheme) 23.6 years 24.3 years
Women (Atkins Pension Plan and Railways Pension Scheme) 25.2 years 26.2 years
Men (ESPS) 23.8 years n/a
Women (ESPS) 25.1 years n/a
Longevity at age 65 for future pensioners (current age 45)
Men (Atkins Pension Plan and Railways Pension Scheme) 25.4 years 26.6 years
Women (Atkins Pension Plan and Railways Pension Scheme) 27.1 years 28.5 years
Men (ESPS) 25.5 years n/a
Women (ESPS) 27.0 years n/a
The actuarial tables used to calculate the IAS 19 retirement benefit liabilities for the Plan at 31 March 2017 were the ‘SAPS’ (Self-Administered Pension Schemes) S2 tables and a scaling factor of 0.85/0.90 for males/females respectively. Future improvements are based on Continuous Mortality Investigation (CMI 2015) improvements with a 1.25% per annum improvement trend, based on year-of-use application. The RPS results have been adjusted on an approximate basis to be based on the same mortality tables. For the ESPS the actuarial tables used were the ‘SAPS’ (Self-Administered Pension Schemes) S1 Light table. Future improvements have been updated on an approximate basis to be CMI 2015 improvements with a 1.25 per annum improvement trend, based on year of use application. At 31 March 2016, the actuarial tables used to calculate the retirement benefit liabilities for the Plan were the "SAPS" (Self-Administered Pension Schemes) S1 tables with medium cohort improvements from 2002 up to 2009 and a scaling factor of 0.85/0.90 for males/females respectively. Future improvements were based on Continuous Mortality Investigation (CMI) improvements with a 1.5% per annum improvement trend, based on year of use application. The Group considered moving to CMI 2016 with a 1.25% trend, but decided to align into the recently undertaken 2016 triennial valuation and use CMI 2015 for the year ended 31 March 2017. Had CMI 2016 been used, this would have reduced the liabilities of the APP as at 31 March 2017 by around £40m.
The components of the pension cost are as follows:
2017 £m
2016 £m
Cost of sales Current service cost 2.3 2.6 Administrative expenses 0.2 0.2 Curtailment gain - (1.5)
Total charge 2.5 1.3
Net interest expense 8.0 9.7
Total charge to Income Statement for defined benefit schemes 10.5 11.0
Charge for defined contribution schemes 45.3 43.3
Total charge to Income Statement 55.8 54.3
Statement of Comprehensive Income Gain/(loss) on pension scheme assets 275.2 (9.6) Changes in assumptions (283.5) 17.9
Remeasurements (loss)/ gain recognised in other comprehensive income (8.3) 8.3 Net deferred and income tax credited(charged) to equity 0.1 (5.7)
Remeasurements (loss)/ gain (net of deferred tax) (8.2) 2.6
2017 £m
2016 £m
Defined benefit obligation (2,175.4) (1,821.9) Fair value of plan assets 1,939.7 1,556.6
Net retirement benefit liabilities (235.7) (265.3)
Under the APP there are net retirement benefit liabilities of £163.5m (2016: £194.1m). Under the RPS there are net retirement benefit liabilities of £82.9m (2016: £64.2m). Under the EnergySolutions Section of Magnox Group of the ESPS there are net retirement benefit assets of £15.8m. Under other defined benefit schemes there are net retirement benefit liabilities of £5.1m (2016: £7.0m). Movements in the net retirement benefit liabilities are as follows:
2017 £m
2016 £m
At beginning of year (265.3) (298.4) Business acquired 12.0 - Service cost (2.3) (2.6) Administrative expenses (0.2) (0.2) Net finance costs (8.0) (9.7) Curtailment gain - 1.5 Employer Contributions 37.0 36.3 Remeasurements (loss)/gain recognised in other comprehensive income (8.3) 8.3 Difference on exchange (0.6) (0.5)
At end of year (235.7) (265.3)
The Group completed its last triennial valuation of the APP as at 31 March 2016. The valuation of the APP showed a funding deficit of £318m. The Group agreed to continue into the previously agreed repayment plan from the 2013 triennial valuation that ends in March 2025. Under this repayment plan a payment of £34.5m will be made for the year ending 31 March 2018 and future payments will continue to escalate by 2.5% per annum. The Atkins section of the RPS had a funding shortfall of £23m following the 2013 actuarial valuation. The schedule of contributions allows for additional percentages of pensionable salaries to be paid in order to eliminate this shortfall by 30 June 2030. The 2016 actuarial valuation is in progress and may result in a revised

timetable and/or revised percentages of pensionable salaries. It is not expected that any revisions will be material. Under the wording of the current IFRIC 14, the Group has an unconditional right of refund of any remaining surplus on a winding up of the APP once all the interests of the members have been satisfied in accordance with the scheme rules. The International Accounting Standards Board published its exposure draft of amendments to IFRIC 14 IAS 19 – The Limit on a Defined Benefit Asset, Minimum Funding Requirements and their Interaction, which proposes additional clarity on the role of trustees’ rights in an assessment of the recoverability of a surplus in an employee pension fund. If the exposure draft is issued in its current format and the sponsoring company was required to allow for a restriction on its assets in respect of a non-refundable surplus, the impact of this at 31 March 2017, based on the discount rate of 2.5%, would be an increase in the APP’s net liability of around £140m. The nature of the funding regime in the UK creates uncertainty around the size and timing of cash that the sponsoring company will be required to pay to the pension schemes. The Group expects employer contributions to be paid during the financial year to 31 March 2018 to be around £37.6m, of which £34.5m is in relation to the funding of the actuarial deficit. £2.2m of this £37.6m is in relation to employer contributions for the RPS and the remainder of the balance relates to employer contributions for all the other defined benefit schemes of the Group. Employee contributions paid are expected to be around £1.2m. Expected benefit payments made directly by the Group to pensioners in the financial year to 31 March 2018 are £nil. The approximate effect on the liabilities from changes in the main assumptions used to value the liabilities are as follows:
Change in Effect on plan liabilities
assumption Atkins Pension Railways Pension
Plan Scheme
Discount rate increase/decrease 0.5% decrease/increase 9.5% decrease/increase 8.0% Inflation increase/decrease 0.5% increase/decrease 4.5% increase/decrease 8.0% Real rate of increase in salaries increase/decrease 0.5% increase/decrease 0.0% increase/decrease 1.0% Longevity increase 1 year increase 4.0% increase 3.0%
The above sensitivity analyses are based on a change in an assumption while holding all other assumptions constant. In practice, this is unlikely to occur, and changes in some of the assumptions may be correlated. When calculating the sensitivity of the defined benefit obligation to significant actuarial assumptions the same method (present value of the defined benefit obligation calculated with the projected unit credit method at the end of the reporting period) has been applied as when calculating the pension liability recognised within the Consolidated Balance Sheet. The methods and types of assumptions used in preparing the sensitivity analysis did not change compared to the previous period. The effect of the change in inflation on liabilities assumes a corresponding change in salary increases and inflation-related pension increases. (b) Other post-employment benefit liabilities The Group operates unfunded schemes within certain of its non-UK businesses, including gratuity schemes, Key Employee Supplemental Option Plans (KESOP) and post-retirement medical benefit schemes. Members of the gratuity schemes are entitled to receive a cash gratuity on leaving the business which is dependent on their length of employment and final salary. Valuation of the gratuity obligation is carried out in line with the principles of IAS 19, Employee benefits. The Group operates a KESOP providing some key officers and employees in its North American business (the business) with post-retirement benefits, known as the Supplemental Income Program (SIP). The SIP is an unfunded plan that provides participants with retirement income for a specified period of between 5 and 15 years upon retirement, death or disability. The plan fixes a minimum level for retirement benefits to be paid to participants based on the participant’s position in the business, their age and length of service at retirement. Additionally, certain executive agreements have been amended to provide post-retirement medical benefits to
those employees and their spouses, at a level substantially similar to those medical and hospitalisation benefits paid and provided to senior executives currently employed by the business. The insurance benefits will be provided without any further or additional services from the employee to the business and they will be paid for and provided for as long as the employee and their spouse shall live.
2017 2016
£m £m
Other post-employment obligations at beginning of year 20.5 18.2
Current service cost and other comprehensive income 4.6 4.2
Interest cost 1.1 0.9
Benefit payments (5.6) (3.7)
Difference on exchange 2.8 0.9
Other post-employment obligations at end of year 23.4 20.5
15. Ordinary shares
2017 £m
2016 £m
Issued, allotted and fully paid ordinary shares of 0.5p each At 1 April and at 31 March 0.5 0.5
At the 2016 Annual General Meeting (AGM), shareholder authority was obtained for the Company to purchase up to a maximum of 10,011,000 of its own ordinary shares (representing approximately 10% of the issued share capital of the Company on 15 June 2016) This authority will expire at the forthcoming AGM and, if the offer from SNC-Lavalin to acquire the Company is not approved by shareholders, or has not been completed by 19 September 2017, the Company will seek approval for an equivalent authority at this year’s AGM. Shares in the Company may also be purchased by Atkins’ EBTs. As at the date of this report there were 4,341,000 ordinary shares of 0.5p each (nominal value £21,705) held as treasury shares. No shares were purchased during the year ended 31 March 2017 (2016: nil). The 4,341,000 treasury shares, which represent approximately 4.2% of the total (2016: 4.2%) of the called-up share capital as at the date of this report, have not been cancelled and represent a deduction from shareholders ’ equity. 16. Cash generated from continuing operations
2017 2016
£m £m
Operating profit for the year 154.1 143.4
Other non-cash costs - 0.1
Depreciation charges 19.7 18.2
Impairment of acquired intangibles 4.8 -
Impairment of goodwill 21.4 -
Deferred acquisition payments 3.7 3.2
Amortisation of intangible assets 32.7 11.9
Share-based payment charge 9.3 9.4
Pensions curtailment gain - (1.5)
Profit on sale of property, plant and equipment (1.4) (6.7)
Profit on sale of minority PFI Investment in the UK’s M25 motorway (45.6) -
Foreign exchange gains (7.2) -
Movement in provisions 0.3 0.5
Movement in trade and other receivables (42.8) (16.7)
Movement in payables (15.0) (13.0)
Movement in non-current payables - 0.1
Pension deficit funding (33.6) (32.8)
Cash generated from continuing operations 100.4 116.1

17. Analysis of net funds
1 April 2016
£m
Cash flow £m
Other non-cash changes
£m
Exchange movement
£m
31 March 2017
£m
Cash and cash equivalents 419.3 (210.2) - 15.4 224.5
Loan notes receivable 20.1 (19.7) 0.4 0.1 0.9
Financial assets at fair value through profit or loss 32.9 (2.3) 0.6 0.4 31.6
Borrowings due no later than one year (7.0) - 7.0 - -
Borrowings due later than one year (273.5) 55.4 (7.2) (37.7) (263.0)
Finance leases (0.1) - - - (0.1)
Net funds 191.7 (176.8) 0.8 (21.8) (6.1)
Included within loan notes receivable is £0.5m (2016: £0.4m) relating to amounts from joint venture entities receivable within less than 12 months. 18. Related party transactions Details of the directors’ shareholdings, share options and remuneration are given in the Remuneration report and form part of the Group’s Annual Report. Transactions with the retirement benefit schemes are shown in note 14. Details of the Company’s subsidiaries and joint ventures form part of the Financial Statements. Provision of goods and services to and purchases of goods and services from related parties were made at the rates charged to external customers. The amounts outstanding are unsecured and will be settled in cash. No guarantees have been given or received. No provision has been made for doubtful debts in respect of amounts owed by related parties and £nil charged to income and expense (2016: £nil). a) Group sales and purchases of goods and services
2017 2016
£m £m
Sales of goods and services to joint ventures 46.5 42.5
Purchases of goods and services from joint ventures - -
b) Group year end balances arising from sales/purchases of goods and services to/from joint ventures and loans provided to joint ventures
2017 2016
£m £m
Receivables from joint ventures 10.6 1.7
Receivables from joint ventures are shown net of contract-related provisions of £nil (2016: £nil).
2017 2016
£m £m
Payables to joint ventures - -
c) Group year end balances arising from loans provided to other related parties
2017 2016
£m £m
Receivables from related parties - 19.7

d) Company sales/purchases of goods and services to/from subsidiaries The Company did not sell any goods or services to subsidiaries during the year (2016: £nil). The Company did not purchase any goods or services from its subsidiaries during the year (2016: £nil). e) Company year end balances with subsidiaries
2017 2016
£m £m
Receivables from subsidiaries 371.3 339.2
Payables to subsidiaries 21.2 51.9
Receivables from subsidiaries are shown net of impairment of £0.5m (2016: £0.5m). f) Key management compensation Key management comprises the executive and non-executive directors, and certain senior managers who are members of the senior leadership team (SLT).
2017 2016
£m £m
Short term employee benefits 7.3 6.3
Post-employment benefits 0.1 0.1
Share-based payments 2.4 1.5
9.8 7.9
The deferred share award element of any bonus paid to key management is not included in the salaries and other short term employment benefits number as it is included in the share-based payment charge in subsequent years. 19. Events occurring after the reporting period Recommended offer for the Company by SNC-Lavalin On 20 April 2017, the boards of SNC-Lavalin and WS Atkins plc announced that they had agreed the terms of a recommended all cash offer for the entire issued and to be issued share capital of Atkins by SNC-Lavalin at a price of 2,080 pence per Atkins share. The Board believes that the terms of the offer are in the best interests of shareholders taken as a whole and unanimously recommends that shareholders vote or procure votes in favour of the scheme at the Court meeting and the special resolution relating to the acquisition to be proposed at the general meeting, which will both be held on 26 June 2017. Subject to the approval of Atkins shareholders and the Court, and to the satisfaction or (where applicable) waiver of the other conditions, the scheme is expected to become effective on 3 July 2017. General Information WS Atkins plc is a public limited company incorporated and domiciled in England with company number 1885586. The Company is listed on the London Stock Exchange. Copies of this preliminary financial information are available from the registered office: Woodcote Grove, Ashley Road, Epsom, Surrey, KT18 5BW, England and may be viewed on the Atkins website www.atkinsglobal.com.