Embed Size (px)
Citation preview

Nowadays animal experiments are widely used to develop new medicines and to test the safety of other products. Some people argue that these experiments should be banned because it is morally wrong to cause animals to suffer, while others are in favour of them because of their benefits to humanity.Discuss both views and give your own opinion.
It is true that medicines and other products are routinely tested on animals before they are cleared for human use. While I tend towards the viewpoint that animal testing is morally wrong, I would have to support a limited amount of animal experimentation for the development of medicines.
On the one hand, there are clear ethical arguments against animal experimentation. To use a common example of this practice, laboratory mice may be given an illness so that the effectiveness of a new drug can be measured. Opponents of such research argue that humans have no right to subject animals to this kind of trauma, and that the lives of all creatures should be respected. They believe that the benefits to humans do not justify the suffering caused, and that scientists should use alternative methods of research.
On the other hand, reliable alternatives to animal experimentation may not always be available. Supporters of the use of animals in medical research believe that a certain amount of suffering on the part of mice or rats can be justified if human lives are saved. They argue that opponents of such research might feel differently if a member of their own families needed a medical treatment that had been developed through the use of animal experimentation. Personally, I agree with the banning of animal testing for non-medical products, but I feel that it may be a necessary evil where new drugs and medical procedures are concerned.
In conclusion, it seems to me that it would be wrong to ban testing on animals for vital medical research until equally effective alternatives have been developed.
IELTS Writing Task 1: full essay
The graph below shows the average number of UK commuters travelling each day by car, bus or train between 1970 and 2030.
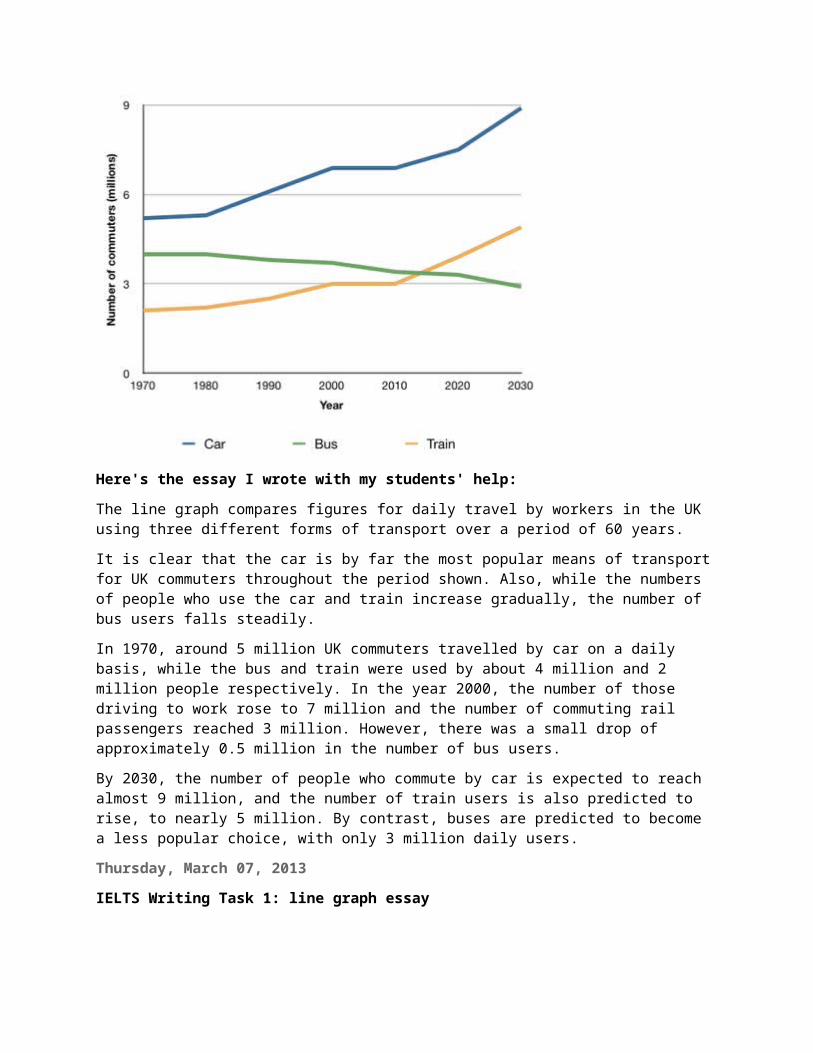
Here's the essay I wrote with my students' help:
The line graph compares figures for daily travel by workers in the UK using three different forms of transport over a period of 60 years.
It is clear that the car is by far the most popular means of transport for UK commuters throughout the period shown. Also, while the numbers of people who use the car and train increase gradually, the number of bus users falls steadily.
In 1970, around 5 million UK commuters travelled by car on a daily basis, while the bus and train were used by about 4 million and 2 million people respectively. In the year 2000, the number of those driving to work rose to 7 million and the number of commuting rail passengers reached 3 million. However, there was a small drop of approximately 0.5 million in the number of bus users.
By 2030, the number of people who commute by car is expected to reach almost 9 million, and the number of train users is also predicted to rise, to nearly 5 million. By contrast, buses are predicted to become a less popular choice, with only 3 million daily users.
Thursday, March 07, 2013
IELTS Writing Task 1: line graph essay
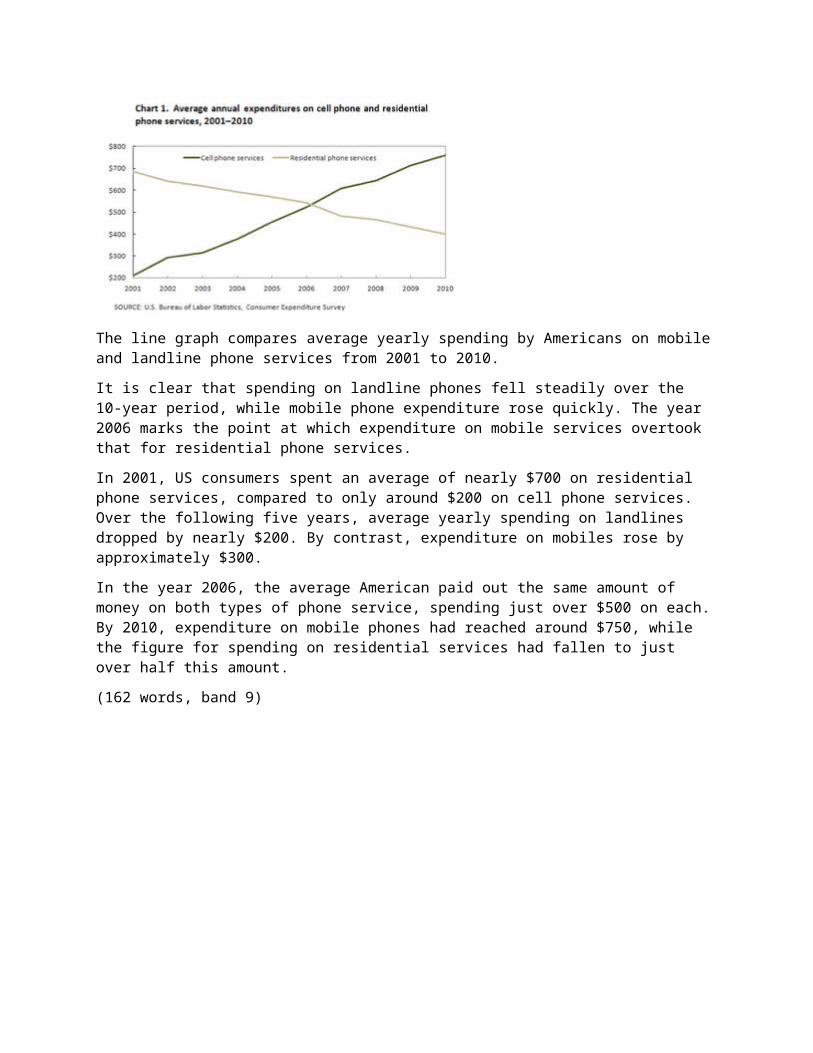
The line graph compares average yearly spending by Americans on mobile and landline phone services from 2001 to 2010.
It is clear that spending on landline phones fell steadily over the 10-year period, while mobile phone expenditure rose quickly. The year 2006 marks the point at which expenditure on mobile services overtook that for residential phone services.
In 2001, US consumers spent an average of nearly $700 on residential phone services, compared to only around $200 on cell phone services. Over the following five years, average yearly spending on landlines dropped by nearly $200. By contrast, expenditure on mobiles rose by approximately $300.
In the year 2006, the average American paid out the same amount of money on both types of phone service, spending just over $500 on each. By 2010, expenditure on mobile phones had reached around $750, while the figure for spending on residential services had fallen to just over half this amount.
(162 words, band 9)

The diagram illustrates the various stages in the life of a honey bee. We can see that the complete life cycle lasts between 34 and 36 days. It is also noticeable that there are five main stages in the development of the honey bee, from egg to mature adult insect.
The life cycle of the honey bee begins when the female adult lays an egg; the female typically lays one or two eggs every 3 days. Between 9 and 10 days later, each egg hatches and the immature insect, or nymph, appears.
During the third stage of the life cycle, the nymph grows in size and sheds its skin three times. This moulting first takes place 5 days after the egg hatches, then 7 days later, and again another 9 days later. After a total of 30 to 31 days from the start of the cycle, the young adult honey bee emerges from its final moulting stage, and in the space of only 4 days it reaches full maturity.
(169 words, band 9)

The pie charts compare the expenditure of a school in the UK in three different years over a 20-year period.
It is clear that teachers’ salaries made up the largest proportion of the school’s spending in all three years (1981, 1991 and 2001). By contrast, insurance was the smallest cost in each year.
In 1981, 40% of the school’s budget went on teachers’ salaries. This figure rose to 50% in 1991, but fell again by 5% in 2001. The proportion of spending on other workers’ wages fell steadily over the 20-year period, from 28% of the budget in 1981 to only 15% in 2001.
Expenditure on insurance stood at only 2% of the total in 1981, but reached 8% in 2001. Finally, the percentages for resources and furniture/equipment fluctuated. The figure for resources was highest in 1991, at 20%, and the proportion of spending on furniture and equipment reached its peak in 2001, at 23%.

The map shows the growth of a village called Chorleywood between 1868 and 1994.
It is clear that the village grew as the transport infrastructure was improved. Four periods of development are shown on the map, and each of the populated areas is near to the main roads, the railway or the motorway.
From 1868 to 1883, Chorleywood covered a small area next to one of the main roads. Chorleywood Park and Golf Course is now located next to this original village area. The village grew along the main road to the south between 1883 and 1922, and in 1909 a railway line was built crossing this area from west to east. Chorleywood station is in this part of the village.
The expansion of Chorleywood continued to the east and west alongside the railway line until 1970. At that time, a motorway was built to the east of the village, and from 1970 to 1994, further development of the village took place around motorway intersections with the railway and one of the main roads.
IELTS Writing Task 1: full essay
The essay below is 151 words long. I've tried to make it as simple as possible, but it's still good enough to get a band 9.
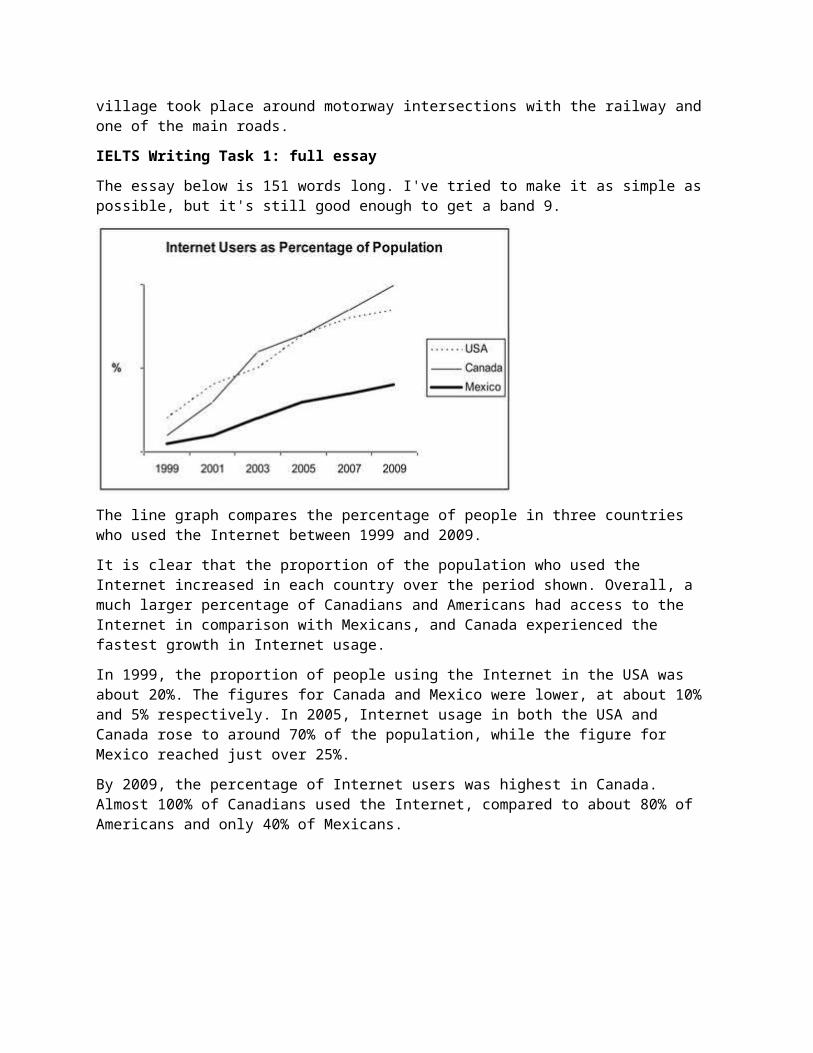
The line graph compares the percentage of people in three countries who used the Internet between 1999 and 2009.
It is clear that the proportion of the population who used the Internet increased in each country over the period shown. Overall, a much larger percentage of Canadians and Americans had access to the Internet in comparison with Mexicans, and Canada experienced the fastest growth in Internet usage.
In 1999, the proportion of people using the Internet in the USA was about 20%. The figures for Canada and Mexico were lower, at about 10% and 5% respectively. In 2005, Internet usage in both the USA and Canada rose to around 70% of the population, while the figure for Mexico reached just over 25%.
By 2009, the percentage of Internet users was highest in Canada. Almost 100% of Canadians used the Internet, compared to about 80% of Americans and only 40% of Mexicans.
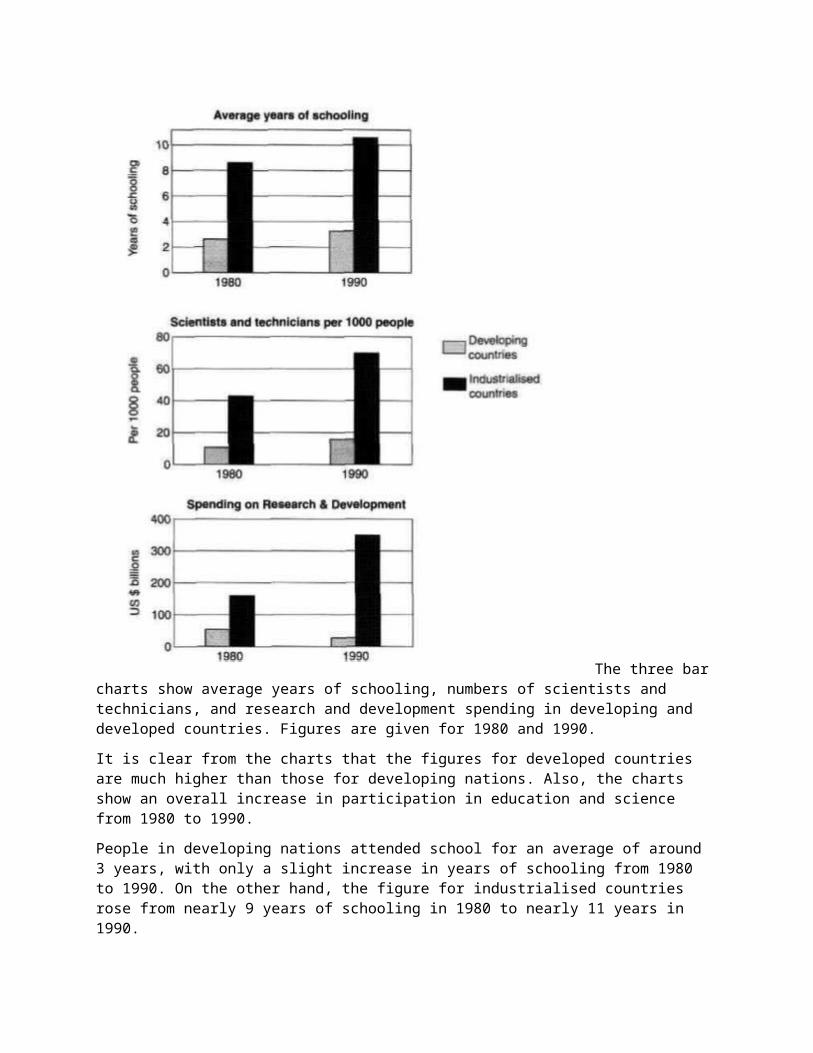
The three bar charts show average years of schooling, numbers of scientists and technicians, and research and development spending in developing and developed countries. Figures are given for 1980 and 1990.
It is clear from the charts that the figures for developed countries are much higher than those for developing nations. Also, the charts show an overall increase in participation in education and science from 1980 to 1990.
People in developing nations attended school for an average of around 3 years, with only a slight increase in years of schooling from 1980 to 1990. On the other hand, the figure for industrialised countries rose from nearly 9 years of schooling in 1980 to nearly 11 years in 1990.
From 1980 to 1990, the number of scientists and technicians in industrialised countries almost doubled to about 70 per 1000 people. Spending on research and development also saw rapid growth in these countries, reaching $350 billion in 1990. By contrast, the number of science workers in developing countries remained below 20 per 1000 people, and research spending fell from about $50 billion to only $25 billion.

The table below gives information about the underground railway systems in six cities.
Full essay (band 9):
The table shows data about the underground rail networks in six major cities.
The table compares the six networks in terms of their age, size and the number of people who use them each year. It is clear that the three oldest underground systems are larger and serve significantly more passengers than the newer systems.
The London underground is the oldest system, having opened in 1863. It is also the largest system, with 394 kilometres of route. The second largest system, in Paris, is only about half the size of the London underground, with 199 kilometres of route. However, it serves more people per year. While only third in terms of size, the Tokyo system is easily the most used, with 1927 million passengers per year.
Of the three newer networks, the Washington DC underground is the most extensive, with 126 kilometres of route, compared to only 11 kilometres and 28 kilometres for the Kyoto and Los Angeles systems. The Los Angeles network is the newest, having opened in 2001, while the Kyoto network is the smallest and serves only 45 million passengers per year.
(185 words)
Here is my full essay for a question about 4 pie charts.
Cambridge IELTS book 7, page 101:
The pie charts compare the amount of electricity produced using five different sources of fuel in two countries over two separate years.
Total electricity production increased dramatically from 1980 to 2000 in both Australia and France. While the totals for both countries were similar, there were big differences in the fuel sources used.
Coal was used to produce 50 of the total 100 units of electricity in Australia in 1980, rising to 130 out of 170 units in 2000. By contrast, nuclear power became the most important fuel source in France in 2000, producing almost 75% of the country’s electricity.

Australia depended on hydro power for just under 25% of its electricity in both years, but the amount of electricity produced using this type of power fell from 5 to only 2 units in France. Oil, on the other hand, remained a relatively important fuel source in France, but its use declined in Australia. Both countries relied on natural gas for electricity production significantly more in 1980 than in 2000.
(170 words)
Read my full essay for the chart below. How have I organised the information? What language have I used to explain changes and to make comparisons?
Full essay (159 words):
The chart gives information about UK immigration, emigration and net migration between 1999 and 2008.
Both immigration and emigration rates rose over the period shown, but the figures for immigration were significantly higher. Net migration peaked in 2004 and 2007.
In 1999, over 450,000 people came to live in the UK, while the number of people who emigrated stood at just under 300,000. The figure for net migration was around 160,000, and it remained at a similar level until 2003. From 1999 to 2004, the immigration rate rose by nearly 150,000 people, but there was a much smaller rise in emigration. Net migration peaked at almost 250,000 people in 2004.
After 2004, the rate of immigration remained high, but the number of people emigrating fluctuated. Emigration fell suddenly in 2007, before peaking at about 420,000 people in 2008. As a result, the net migration figure rose to around 240,000 in 2007, but fell back to around 160,000 in 2008.
The first picture shows the layout of an art gallery, and the second shows some proposed changes to the gallery space.
It is clear that significant changes will be made in terms of the use of floor space in the gallery. There will be a completely new entrance and more space for exhibitions.
At present, visitors enter the gallery through doors which lead into a lobby. However, the plan is to move the entrance to the Parkinson Court side of the building, and visitors will walk straight into the exhibition area. In place of the lobby and office areas, which are shown on the existing plan, the new gallery plan shows an education area and a small storage area.
The permanent exhibition space in the redeveloped gallery will be about twice as large as it is now because it will occupy the area that is now used for temporary exhibitions. There will also be a new room for special exhibitions. This room is shown in red on the existing plan and is not currently part of the gallery.
(178 words, band 9)
The diagram below shows the water cycle, which is the continuous movement of water on, above and below the surface of the Earth.

The picture illustrates the way in which water passes from ocean to air to land during the natural process known as the water cycle.
Three main stages are shown on the diagram. Ocean water evaporates, falls as rain, and eventually runs back into the oceans again.
Beginning at the evaporation stage, we can see that 80% of water vapour in the air comes from the oceans. Heat from the sun causes water to evaporate, and water vapour condenses to form clouds. At the second stage, labelled ‘precipitation’ on the diagram, water falls as rain or snow.
At the third stage in the cycle, rainwater may take various paths. Some of it may fall into lakes or return to the oceans via ‘surface runoff’. Otherwise, rainwater may filter through the ground, reaching the impervious layer of the earth. Salt water intrusion is shown to take place just before groundwater passes into the oceans to complete the cycle.
(156 words, band 9)

The diagrams show how house designs differ according to climate.
The most noticeable difference between houses designed for cool and warm climates is in the shape of the roof. The designs also differ with regard to the windows and the use of insulation.
We can see that the cool climate house has a high-angled roof, which allows sunlight to enter through the window. By contrast, the roof of the warm climate house has a peak in the middle and roof overhangs to shade the windows. Insulation and thermal building materials are used in cool climates to reduce heat loss, whereas insulation and reflective materials are used to keep the heat out in warm climates.
Finally, the cool climate house has one window which faces the direction of the sun, while the warm climate house has windows on two sides which are shaded from the sun. By opening the two windows at night, the house designed for warm climates can be ventilated.
(162 words, band 9)

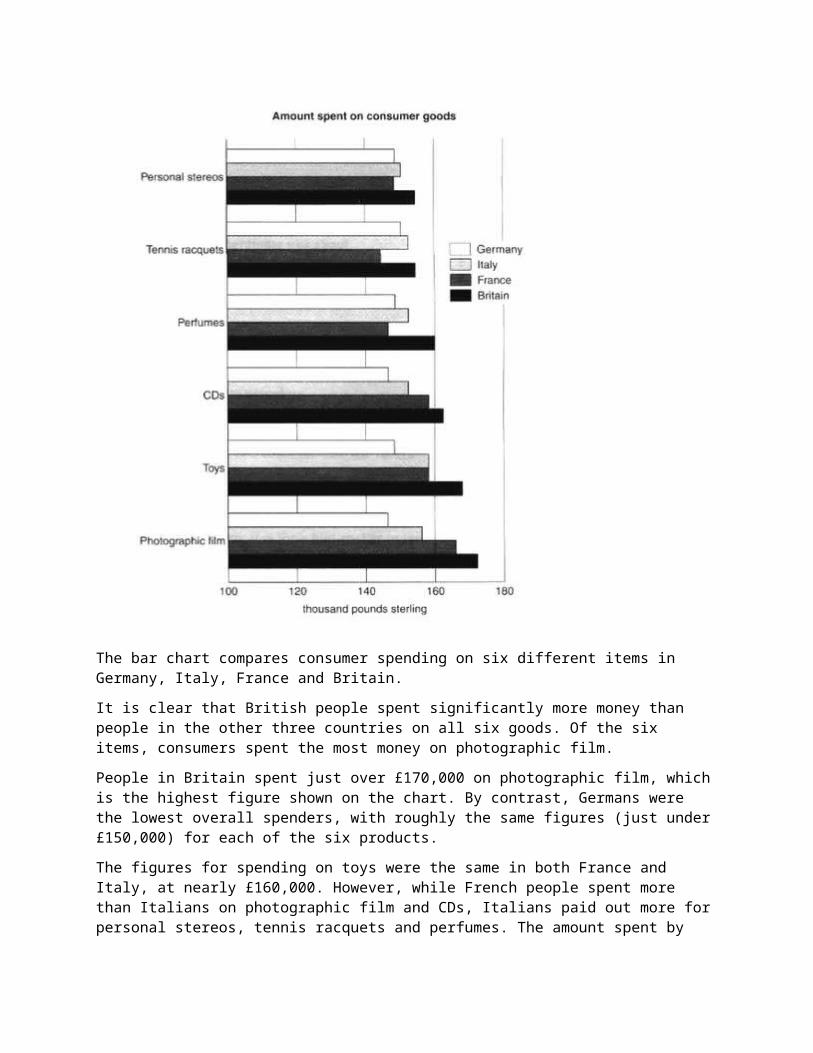
The bar chart compares consumer spending on six different items in Germany, Italy, France and Britain.
It is clear that British people spent significantly more money than people in the other three countries on all six goods. Of the six items, consumers spent the most money on photographic film.
People in Britain spent just over £170,000 on photographic film, which is the highest figure shown on the chart. By contrast, Germans were the lowest overall spenders, with roughly the same figures (just under £150,000) for each of the six products.
The figures for spending on toys were the same in both France and Italy, at nearly £160,000. However, while French people spent more than Italians on photographic film and CDs, Italians paid out more for personal stereos, tennis racquets and perfumes. The amount spent by French people on tennis racquets, around £145,000, is the lowest figure shown on the chart.
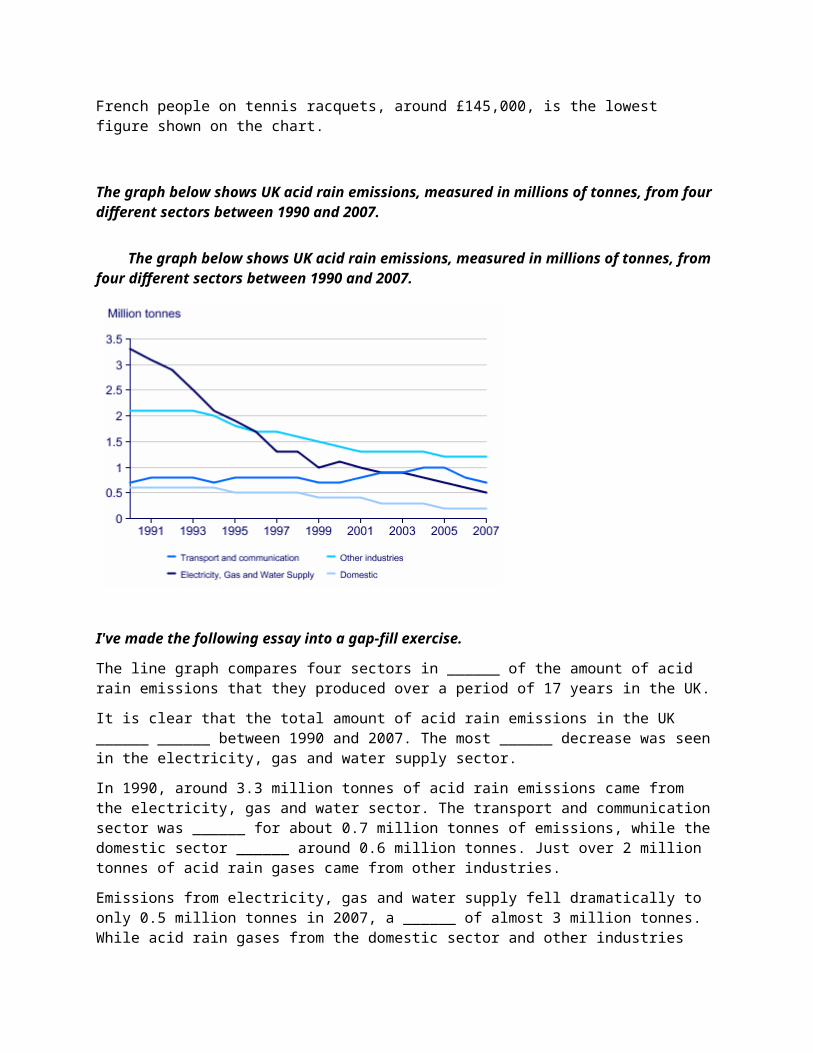
The graph below shows UK acid rain emissions, measured in millions of tonnes, from four different sectors between 1990 and 2007.
The graph below shows UK acid rain emissions, measured in millions of tonnes, from four different sectors between 1990 and 2007.
I've made the following essay into a gap-fill exercise.
The line graph compares four sectors in ______ of the amount of acid rain emissions that they produced over a period of 17 years in the UK.
It is clear that the total amount of acid rain emissions in the UK ______ ______ between 1990 and 2007. The most ______ decrease was seen in the electricity, gas and water supply sector.
In 1990, around 3.3 million tonnes of acid rain emissions came from the electricity, gas and water sector. The transport and communication sector was ______ for about 0.7 million tonnes of emissions, while the domestic sector ______ around 0.6 million tonnes. Just over 2 million tonnes of acid rain gases came from other industries.
Emissions from electricity, gas and water supply fell dramatically to only 0.5 million tonnes in 2007, a ______ of almost 3 million tonnes. While acid rain gases from the domestic sector and other industries fell gradually, the transport sector ______ a small increase in emissions, ______ a peak of 1 million tonnes in 2005.
Fill the gaps using these words:produced, reaching, fell, responsible, saw, considerably, terms, drop, dramatic
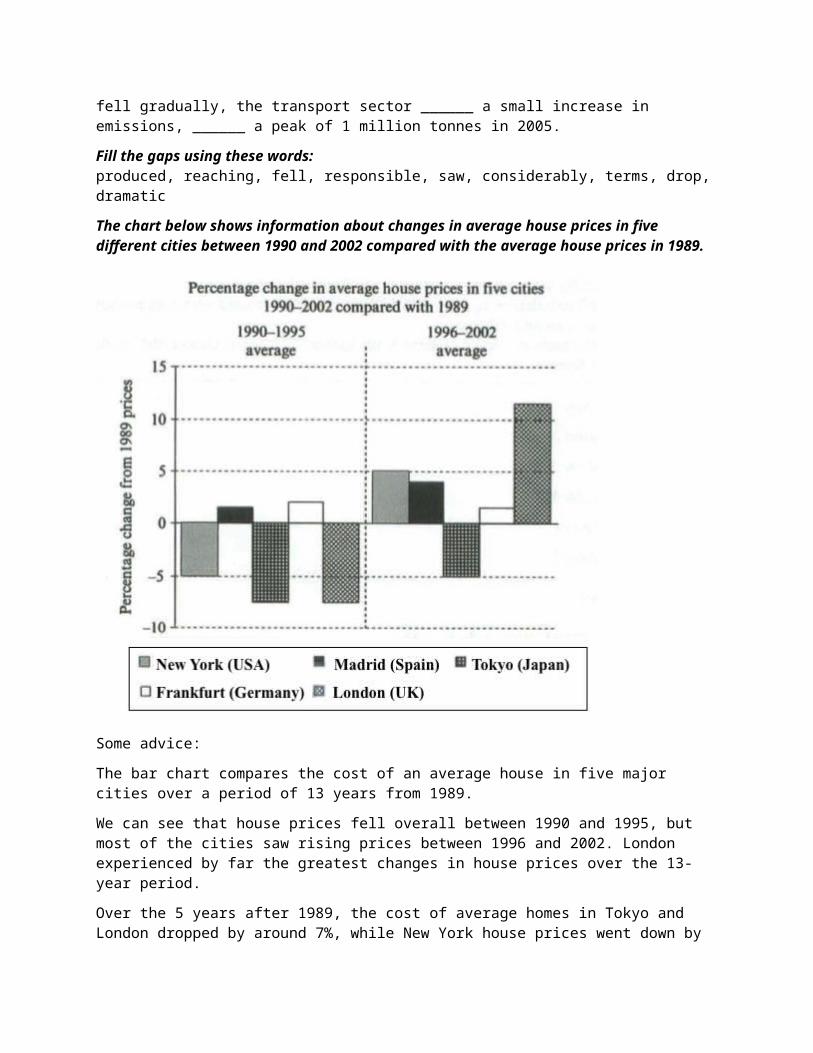
The chart below shows information about changes in average house prices in five different cities between 1990 and 2002 compared with the average house prices in 1989.
Some advice:
The bar chart compares the cost of an average house in five major cities over a period of 13 years from 1989.
We can see that house prices fell overall between 1990 and 1995, but most of the cities saw rising prices between 1996 and 2002. London experienced by far the greatest changes in house prices over the 13-year period.
Over the 5 years after 1989, the cost of average homes in Tokyo and London dropped by around 7%, while New York house prices went down by 5%. By contrast, prices rose by approximately 2% in both Madrid and Frankfurt.
Between 1996 and 2002, London house prices jumped to around 12% above the 1989 average. Homebuyers in New York also had to pay significantly more, with prices rising to 5% above the 1989 average, but homes in Tokyo remained cheaper than they were in 1989. The cost of an average home in Madrid rose by a further 2%, while prices in Frankfurt remained stable.
(165 words)
The table below shows the proportion of different categories of families living in poverty in Australia in 1999.
The table gives information about poverty rates among six types of household in Australia in the year 1999.
It is noticeable that levels of poverty were higher for single people than for couples, and people with children were more likely to be poor than those without. Poverty rates were considerably lower among elderly people.
Overall, 11% of Australians, or 1,837,000 people, were living in poverty in 1999. Aged people were the least likely to be poor, with poverty levels of 6% and 4% for single aged people and aged couples respectively.
Just over one fifth of single parents were living in poverty, whereas only 12% of parents living with a partner were classed as poor. The same pattern can be seen for people with no children: while 19% of single people in this group were living below the poverty line, the figure for couples was much lower, at only 7%.
(150 words, band 9)

The bar chart compares consumer spending on six different items in Germany, Italy, France and Britain.
It is clear that British people spent significantly more money than people in the other three countries on all six goods. Of the six items, consumers spent the most money on photographic film.
People in Britain spent just over £170,000 on photographic film, which is the highest figure shown on the chart. By contrast, Germans were the lowest overall spenders, with roughly the same figures (just under £150,000) for each of the six products.
The figures for spending on toys were the same in both France and Italy, at nearly £160,000. However, while French people spent more than Italians on photographic film and CDs, Italians paid out more for personal stereos, tennis racquets and perfumes. The amount spent by French people on tennis racquets, around £145,000, is the lowest figure shown on the chart.
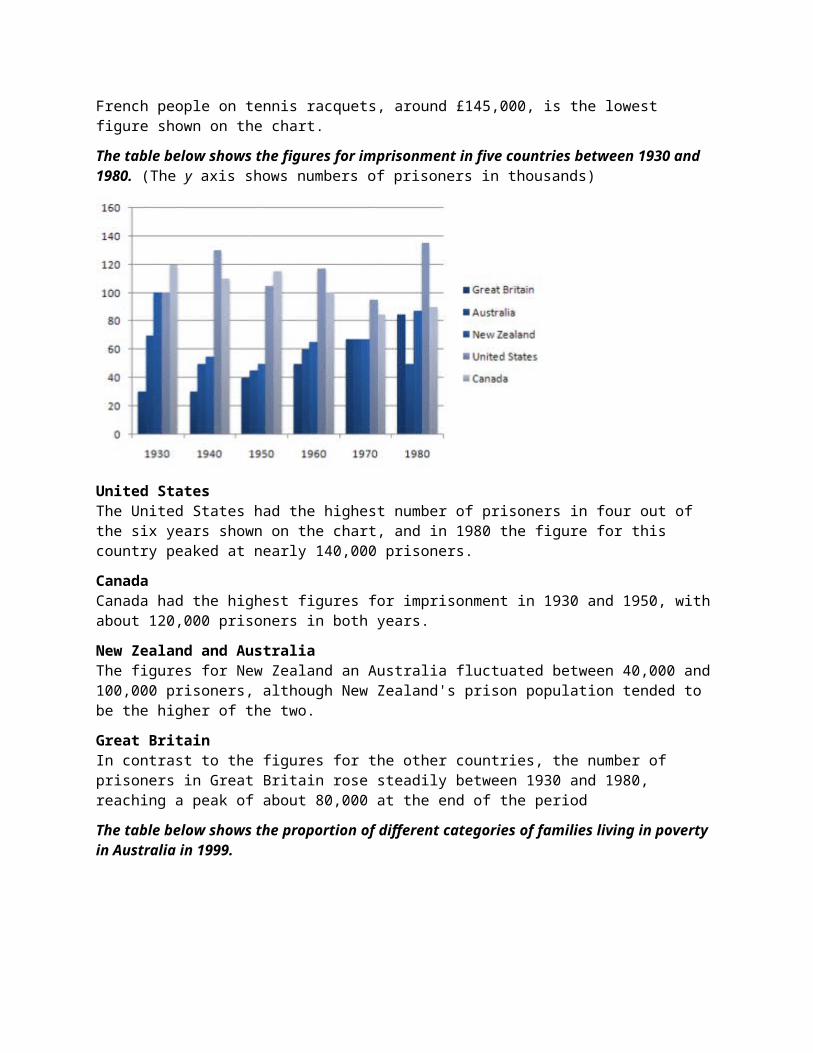
The table below shows the figures for imprisonment in five countries between 1930 and 1980. (The y axis shows numbers of prisoners in thousands)

United StatesThe United States had the highest number of prisoners in four out of the six years shown on the chart, and in 1980 the figure for this country peaked at nearly 140,000 prisoners.
CanadaCanada had the highest figures for imprisonment in 1930 and 1950, with about 120,000 prisoners in both years.
New Zealand and AustraliaThe figures for New Zealand an Australia fluctuated between 40,000 and 100,000 prisoners, although New Zealand's prison population tended to be the higher of the two.
Great BritainIn contrast to the figures for the other countries, the number of prisoners in Great Britain rose steadily between 1930 and 1980, reaching a peak of about 80,000 at the end of the period
The table below shows the proportion of different categories of families living in poverty in Australia in 1999.
The table gives information about poverty rates among six types of household in Australia in the year 1999.
It is noticeable that levels of poverty were higher for single people than for couples, and people with children were more likely to be poor than those without. Poverty rates were considerably lower among elderly people.
Overall, 11% of Australians, or 1,837,000 people, were living in poverty in 1999. Aged people were the least likely to be poor, with poverty levels of 6% and 4% for single aged people and aged couples respectively.
Just over one fifth of single parents were living in poverty, whereas only 12% of parents living with a partner were classed as poor. The same pattern can be seen for people with no children: while 19% of single people in this group were living below the poverty line, the figure for couples was much lower, at only 7%.
(150 words, band 9)
he map below is of the town of Garlsdon. A new supermarket (S) is planned for the town. The map shows two possible sites for the supermarket.
The map shows two potential locations (S1 and S2) for a new supermarket in a town called Garlsdon.

The main difference between the two sites is that S1 is outside the town, whereas S2 is in the town centre. The sites can also be compared in terms of access by road or rail, and their positions relative to three smaller towns.
Looking at the information in more detail, S1 is in the countryside to the north west of Garlsdon, but it is close to the residential area of the town. S2 is also close to the housing area, which surrounds the town centre.
There are main roads from Hindon, Bransdon and Cransdon to Garlsdon town centre, but this is a no traffic zone, so there would be no access to S2 by car. By contrast, S1 lies on the main road to Hindon, but it would be more difficult to reach from Bransdon and Cransdon. Both supermarket sites are close to the railway that runs through Garlsdon from Hindon to Cransdon.
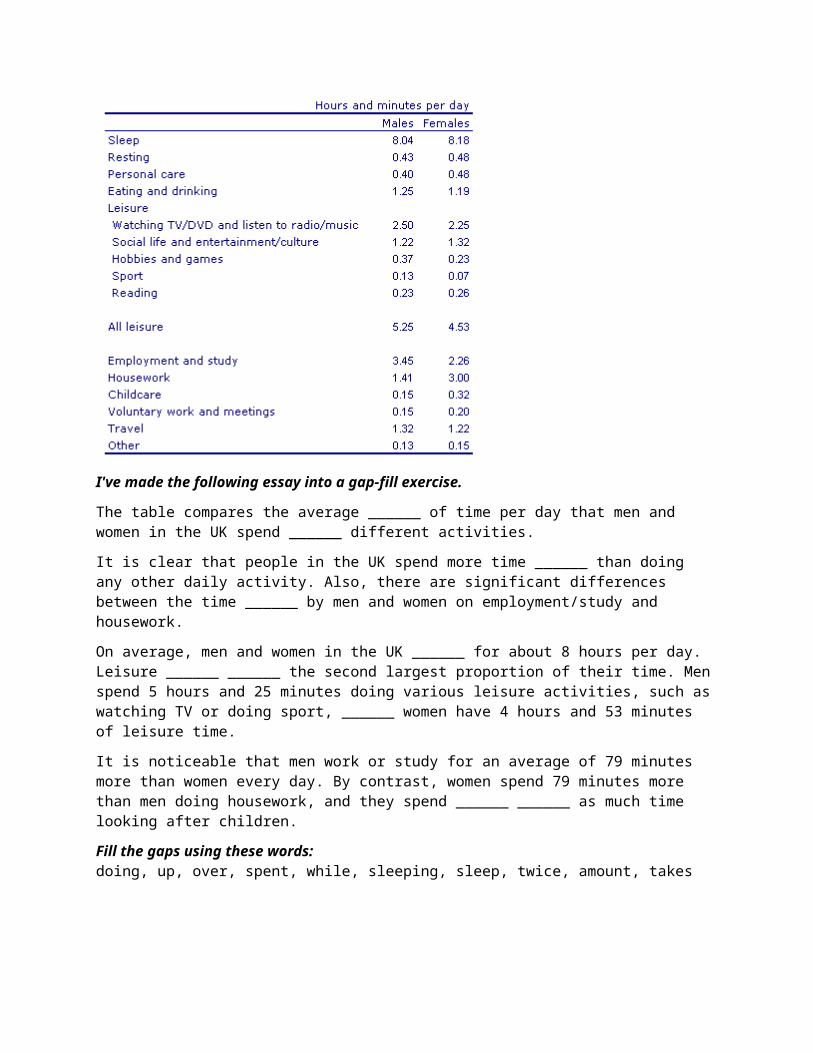
The chart below shows average hours and minutes spent by UK males and females on different daily activities.
I've made the following essay into a gap-fill exercise.
The table compares the average ______ of time per day that men and women in the UK spend ______ different activities.
It is clear that people in the UK spend more time ______ than doing any other daily activity. Also, there are significant differences between the time ______ by men and women on employment/study and housework.
On average, men and women in the UK ______ for about 8 hours per day. Leisure ______ ______ the second largest proportion of their time. Men spend 5 hours and 25 minutes doing various leisure

activities, such as watching TV or doing sport, ______ women have 4 hours and 53 minutes of leisure time.
It is noticeable that men work or study for an average of 79 minutes more than women every day. By contrast, women spend 79 minutes more than men doing housework, and they spend ______ ______ as much time looking after children.
Fill the gaps using these words:doing, up, over, spent, while, sleeping, sleep, twice, amount, takes
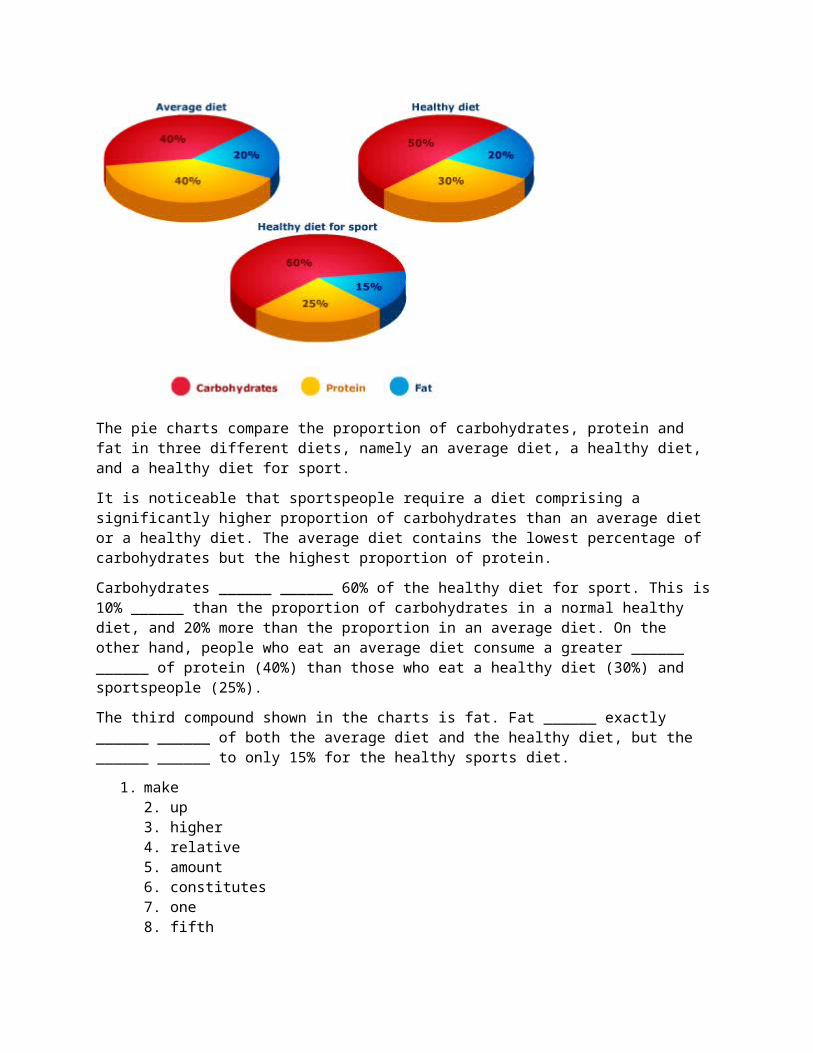
The pie charts compare the proportion of carbohydrates, protein and fat in three different diets, namely an average diet, a healthy diet, and a healthy diet for sport.
It is noticeable that sportspeople require a diet comprising a significantly higher proportion of carbohydrates than an average diet or a healthy diet. The average diet contains the lowest percentage of carbohydrates but the highest proportion of protein.
Carbohydrates ______ ______ 60% of the healthy diet for sport. This is 10% ______ than the proportion of carbohydrates in a normal healthy diet, and 20% more than the proportion in an average diet. On the other hand, people who eat an average diet consume a greater ______ ______ of protein (40%) than those who eat a healthy diet (30%) and sportspeople (25%).
The third compound shown in the charts is fat. Fat ______ exactly ______ ______ of both the average diet and the healthy diet, but the ______ ______ to only 15% for the healthy sports diet.
1. make2. up3. higher4. relative5. amount6. constitutes7. one
8. fifth9. figure10. Drops
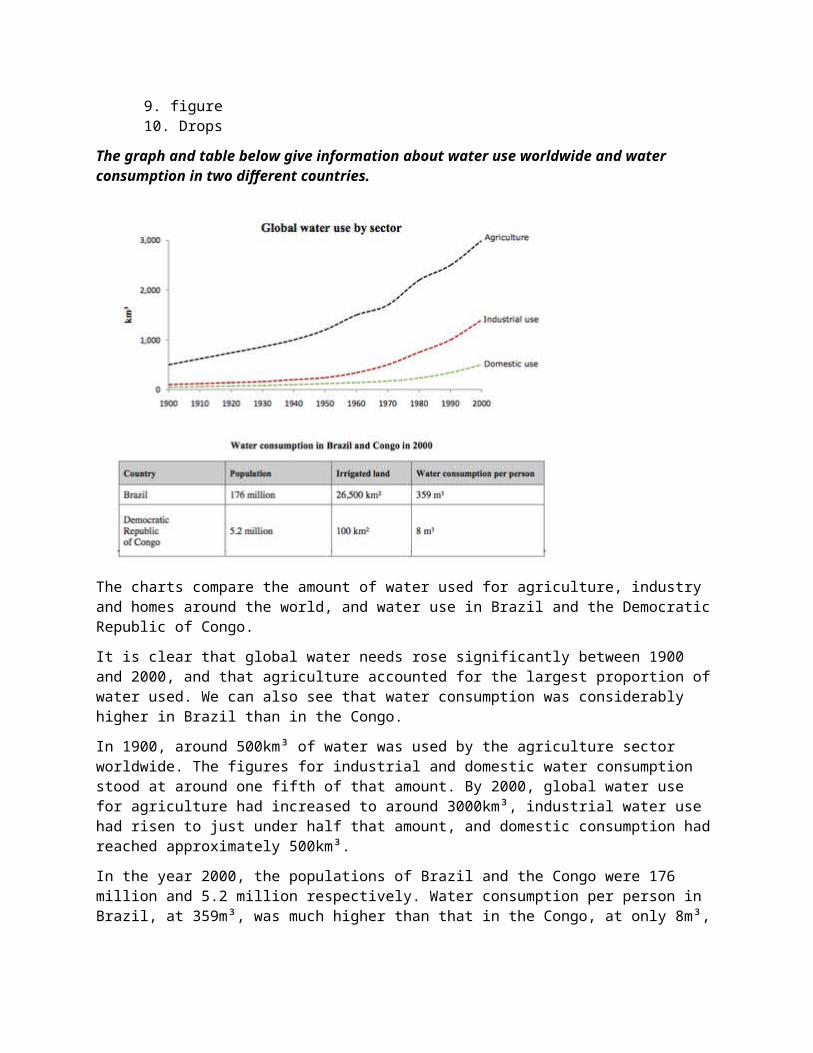
The graph and table below give information about water use worldwide and water consumption in two different countries.
The charts compare the amount of water used for agriculture, industry and homes around the world, and water use in Brazil and the Democratic Republic of Congo.
It is clear that global water needs rose significantly between 1900 and 2000, and that agriculture accounted for the largest proportion of water used. We can also see that water consumption was considerably higher in Brazil than in the Congo.
In 1900, around 500km³ of water was used by the agriculture sector worldwide. The figures for industrial and domestic water consumption stood at around one fifth of that amount. By 2000, global water use for agriculture had increased to around 3000km³, industrial water use had risen to just under half that amount, and domestic consumption had reached approximately 500km³.
In the year 2000, the populations of Brazil and the Congo were 176 million and 5.2 million respectively. Water consumption per person in Brazil, at 359m³, was much higher than that in the Congo, at only 8m³, and this could be explained by the fact that Brazil had 265 times more irrigated land.
(184 words, band 9)
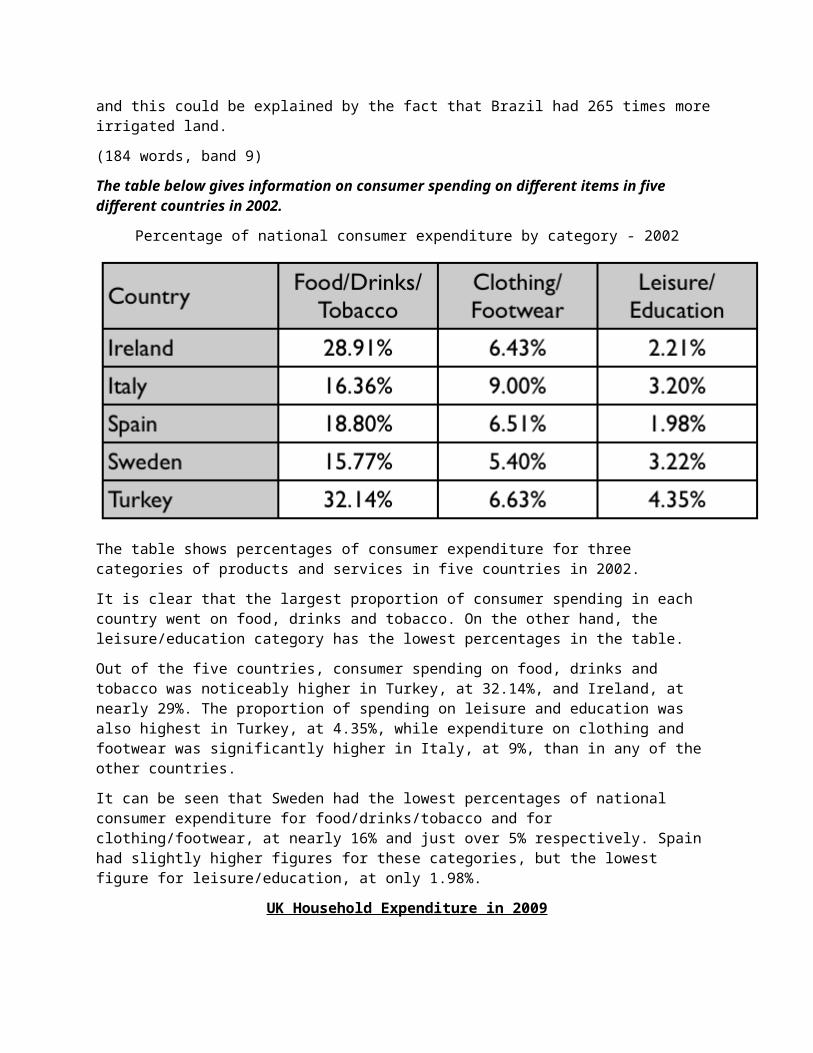
The table below gives information on consumer spending on different items in five different countries in 2002.
Percentage of national consumer expenditure by category - 2002
The table shows percentages of consumer expenditure for three categories of products and services in five countries in 2002.
It is clear that the largest proportion of consumer spending in each country went on food, drinks and tobacco. On the other hand, the leisure/education category has the lowest percentages in the table.
Out of the five countries, consumer spending on food, drinks and tobacco was noticeably higher in Turkey, at 32.14%, and Ireland, at nearly 29%. The proportion of spending on leisure and education was also highest in Turkey, at 4.35%, while expenditure on clothing and footwear was significantly higher in Italy, at 9%, than in any of the other countries.
It can be seen that Sweden had the lowest percentages of national consumer expenditure for food/drinks/tobacco and for clothing/footwear, at nearly 16% and just over 5% respectively. Spain had slightly higher figures for these categories, but the lowest figure for leisure/education, at only 1.98%.
UK Household Expenditure in 2009
Household ______ ______ highest in the transport category, ______ £63 a week. This included £21.10 per week ______ purchase of vehicles, £31.80 on the operation of personal transport (such as petrol, diesel, repairs and servicing) and £10.50 on transport services such as rail, tube and bus fares.
Food and non-alcoholic drink purchases ______ £51 to weekly household expenditure - £13.10 of which ______ ______ on meat and fish, £3.70 on fresh vegetables, and £3.00 on fresh fruit. Non-alcoholic drinks ______ ______ £4.00 ______ weekly expenditure, and £2.10 per week was spent on chocolate and confectionery.
Fill the gaps with the following words:
spent, spending, for, on, at, of, accounted, contributed, was (x2)
spending wasatoncontributedwas spent
accounted forof
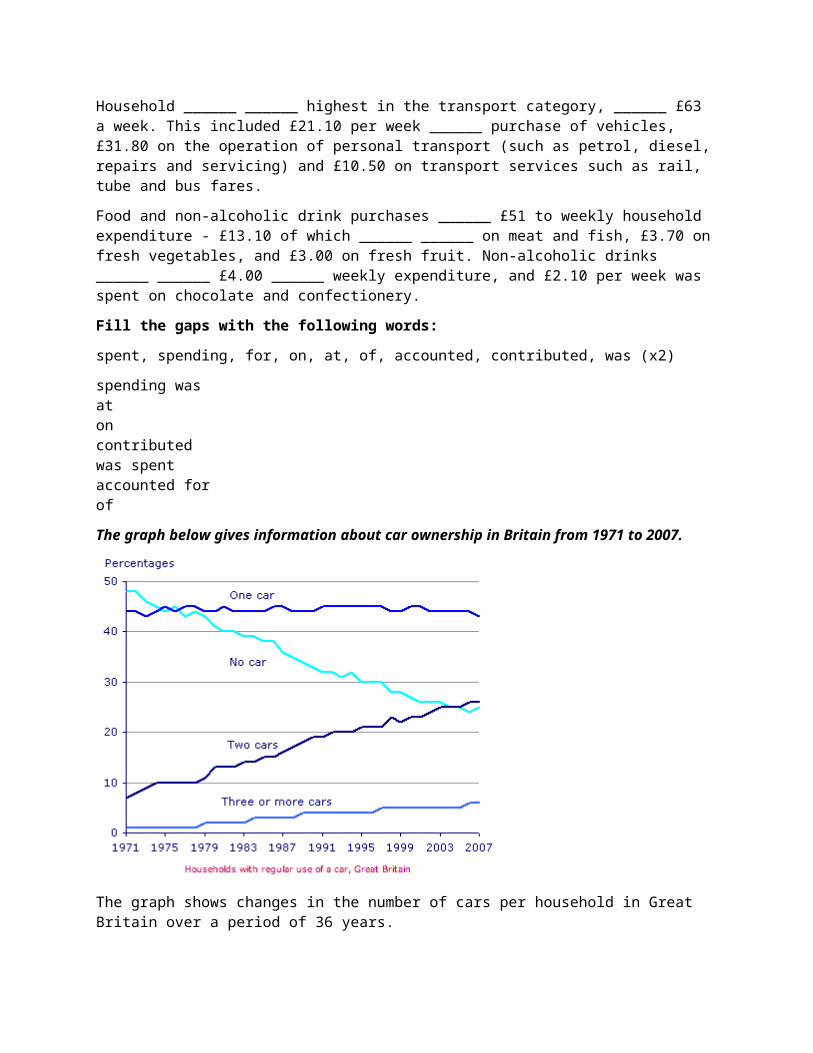
The graph below gives information about car ownership in Britain from 1971 to 2007.
The graph shows changes in the number of cars per household in Great Britain over a period of 36 years.
Overall, car ownership in Britain increased between 1971 and 2007. In particular, the number of households with two cars rose, while the number of households without a car fell.
In 1971, almost half of all British households did not have regular use of a car. Around 44% of households had one car, but only about 7% had two cars. It was uncommon for families to own three or more cars, with around 2% of households falling into this category.
The one-car household was the most common type from the late 1970’s onwards, although there was little change in the figures for this category. The biggest change was seen in the proportion of households without a car, which fell steadily over the 36-year period to around 25% in 2007. In contrast, the proportion of two-car families rose steadily, reaching about 26% in 2007, and the proportion of households with more than two cars rose by around 5%.
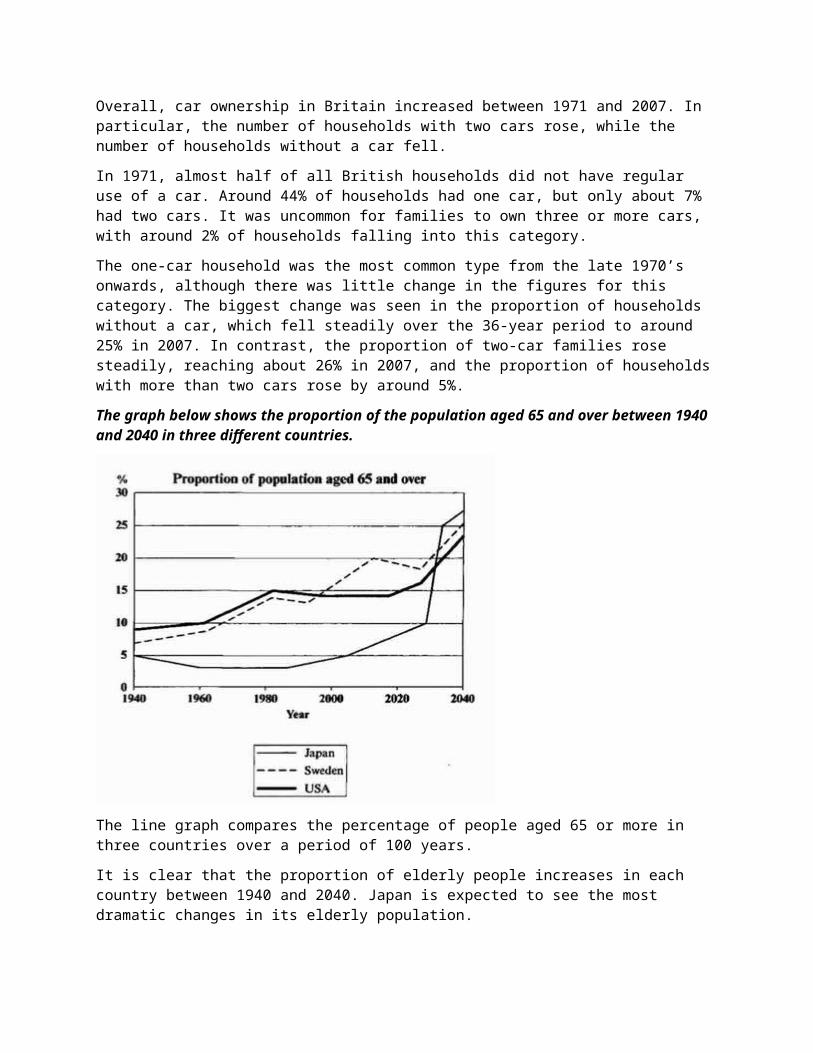
The graph below shows the proportion of the population aged 65 and over between 1940 and 2040 in three different countries.
The line graph compares the percentage of people aged 65 or more in three countries over a period of 100 years.
It is clear that the proportion of elderly people increases in each country between 1940 and 2040. Japan is expected to see the most dramatic changes in its elderly population.
In 1940, around 9% of Americans were aged 65 or over, compared to about 7% of Swedish people and 5% of Japanese people. The proportions of elderly people in the USA and Sweden rose gradually over the next 50 years, reaching just under 15% in 1990. By contrast, the figures for Japan remained below 5% until the early 2000s.
Looking into the future, a sudden increase in the percentage of elderly people is predicted for Japan, with a jump of over 15% in just 10 years from 2030 to 2040. By 2040, it is thought that around 27% of the Japanese population will be 65 years old or more, while the figures for Sweden and the USA will be slightly lower, at about 25% and 23% respectively.
(178 words, band 9)
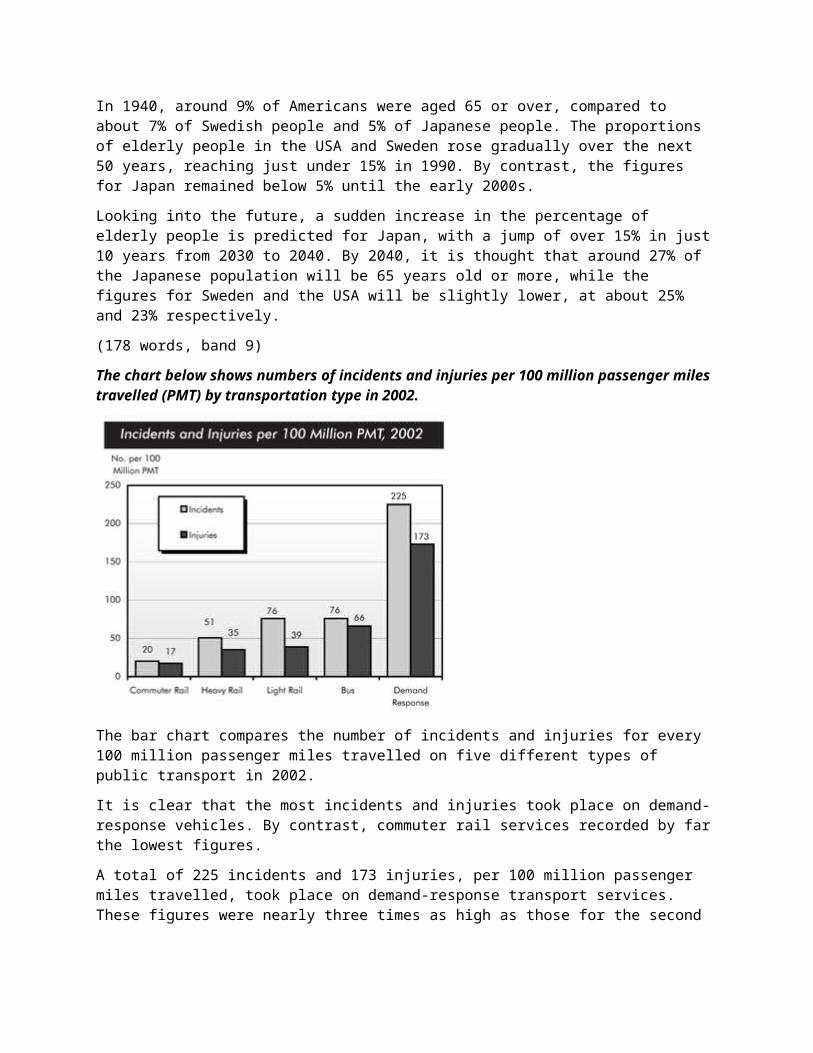
The chart below shows numbers of incidents and injuries per 100 million passenger miles travelled (PMT) by transportation type in 2002.
The bar chart compares the number of incidents and injuries for every 100 million passenger miles travelled on five different types of public transport in 2002.
It is clear that the most incidents and injuries took place on demand-response vehicles. By contrast, commuter rail services recorded by far the lowest figures.
A total of 225 incidents and 173 injuries, per 100 million passenger miles travelled, took place on demand-response transport services. These figures were nearly three times as high as those for the second highest category, bus services. There were 76 incidents and 66 people were injured on buses.
Rail services experienced fewer problems. The number of incidents on light rail trains equalled the figure recorded for buses, but there were significantly fewer injuries, at only 39. Heavy rail services saw lower numbers of such events than light rail services, but commuter rail passengers were even less likely to experience problems. In fact, only 20 incidents and 17 injuries occurred on commuter trains.
(165 words, band 9)
Note:Don't worry about the repetition of "incidents and injuries" in this essay. There are no perfect synonyms for these words, although I managed to use "problems" and "such events" later in the essay. The most important thing is to describe the data clearly and make some good comparisons.
Here are some simple changes you can make:
graph = line graph
chart = bar chart
diagram = figure
shows = illustrates (or 'compares' if the graph is comparing)
proportion = percentage
information = data
the number of = the figure for
the proportion of = the figure for
people in the USA = Americans
from 1999 to 2009 = between 1999 and 2009
from 1999 to 2009 = over a period of 10 years
how to produce = the process of producing
in three countries = in the UK, France and Spain (i.e. name the countries)
Tip:"The figure for / figures for" is a great phrase that not many people use (e.g. the graph shows figures for unemployment in three countries).
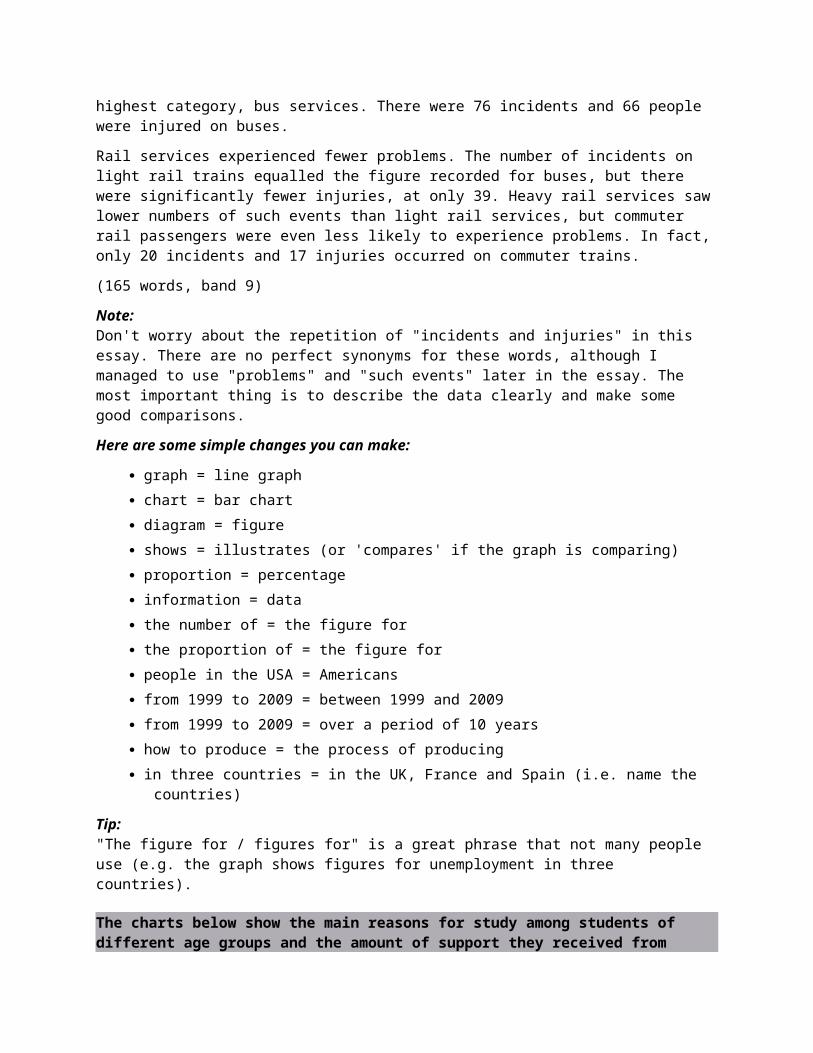
The charts below show the main reasons for study among students of different age groups and the amount of support they received from employers.
Summarise the information by selecting and reporting the main features, and make comparisons where relevant.
You should write at least 150 words.
You should spend about 20 minutes on this task.
model answer:
The first graph shows that there is a gradual decrease in study for career reasons with age. Nearly 80% of students under 26 years, study for their career. This percentage gradually declines by 10-20% every decade. Only 40% of 40-49yr olds and 18% of over 49yr olds studing for career reasons in late adulthood.
Conversely, the first graph also shows that study stemming from interest increases with age. There are only 10% of under 26yr olds studing out of interest. The percentage increases slowly till the beginning of the fourth decade, and increases dramatically in late adulthood. Nearly same number of 40-49yr olds study for career and interest. However 70% of over 49yr olds study for interest in comparison to 18% studing for career reasons in that age group.
The second graph shows that employer support is maximum (approximately 60%) for the under 26yr students. It drops rapidly to 32% up to the third decade of life, and then increses in late adulthood up to about 44%. It is unclear whether employer support is only for career-focused study, but the highest level is for those students who mainly study for career purposes.
This is an answer written by a candidate who achieved a Band 8 score. Here is the examiner's comment:
This answer summarises the key features of both charts and integrates them well. Clear trends are identified and supported with appropriately-selected figures. The answer could only be improved by adding an introduction to the general topic of the charts.
The information is well organised, with a clearly-signalled progression. Linking words are used accurately and precisely, although there is occasional omission. Paragraphing is used well initially, but lapses in the later section.
A very good range of vocabulary is used to convey the information concisely and accurately with only occasional inappropriacy. Words are used precisely and there are no errors in spelling or word form.
A wide range of structures is used and most sentences in this answer are accurate. Errors are rare and do not affect communication in this answer.
The bar charts compare students of different ages in terms of why they are studying and whether they are supported by an employer.
It is clear that the proportion of students who study for career purposes is far higher among the younger age groups, while the oldest students are more likely to study for interest. Employer support is more commonly given to younger students.
Around 80% of students aged under 26 study to further their careers, whereas only 10% study purely out of interest. The gap between these two proportions narrows as students get older, and the figures for those in their forties are the same, at about 40%. Students aged over 49 overwhelmingly study for interest (70%) rather than for professional reasons (less than 20%).
Just over 60% of students aged under 26 are supported by their employers. By contrast, the 30-39 age group is the most self-sufficient, with only 30% being given time off and help with fees. The figures rise slightly for students in their forties and for those aged 50 or more.
(178 words, band 9)
The climograph below shows average monthly temperatures and rainfall in the city of Kolkata.
The chart compares average figures for temperature and precipitation over the course of a calendar year in Kolkata.
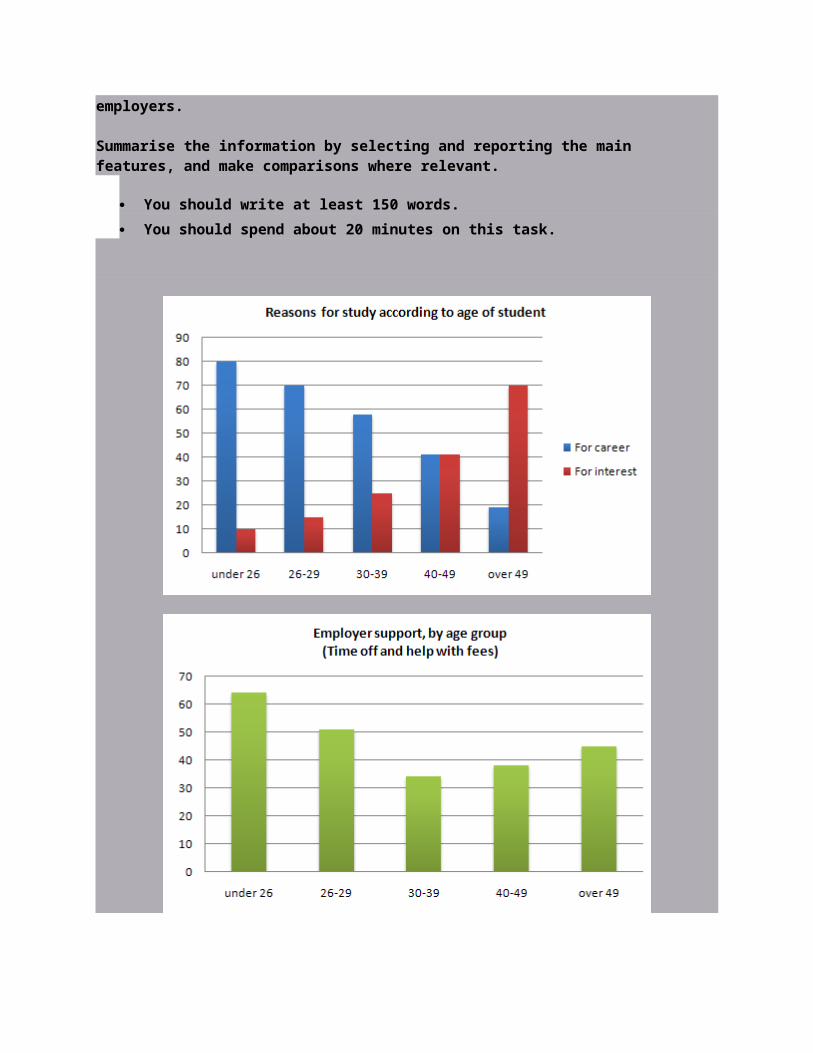
It is noticeable that monthly figures for precipitation in Kolkata vary considerably, whereas monthly temperatures remain relatively stable. Rainfall is highest from July to August, while temperatures are highest in April and May.
Between the months of January and May, average temperatures in Kolkata rise from their lowest point at around 20°C to a peak of just over 30°C. Average rainfall in the city also rises over the same period, from approximately 20mm of rain in January to 100mm in May.
While temperatures stay roughly the same for the next four months, the amount of rainfall more than doubles between May and June. Figures for precipitation remain above 250mm from June to September, peaking at around 330mm in July. The final three months of the year see a dramatic fall in precipitation, to a low of about 10mm in December, and a steady drop in temperatures back to the January average.
(173 words, band 9)
The bar chart below is taken from the UK national statistics website that I mentioned in last week's lesson.
Average weekly household expenditure, by region, 2007-09
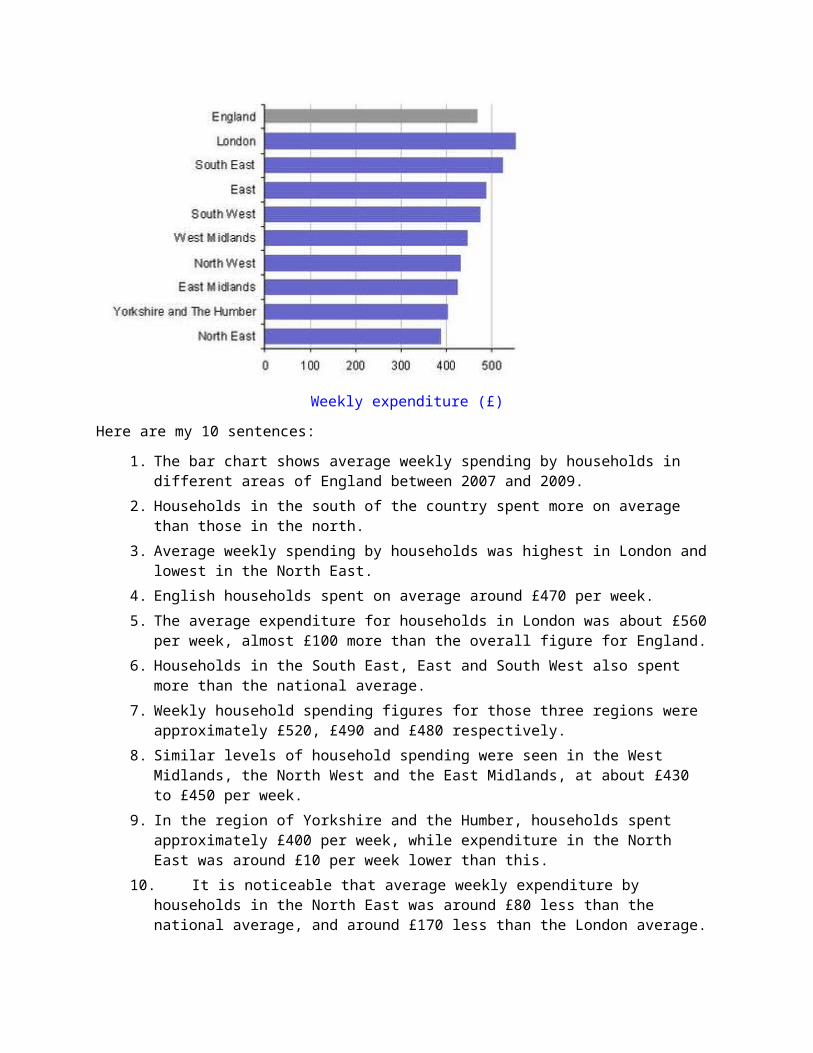
Weekly expenditure (£)
Here are my 10 sentences:
1. The bar chart shows average weekly spending by households in different areas of England between 2007 and 2009.
2. Households in the south of the country spent more on average than those in the north.
3. Average weekly spending by households was highest in London and lowest in the North East.
4. English households spent on average around £470 per week.
5. The average expenditure for households in London was about £560 per week, almost £100 more than the overall figure for England.
6. Households in the South East, East and South West also spent more than the national average.

7. Weekly household spending figures for those three regions were approximately £520, £490 and £480 respectively.
8. Similar levels of household spending were seen in the West Midlands, the North West and the East Midlands, at about £430 to £450 per week.
9. In the region of Yorkshire and the Humber, households spent approximately £400 per week, while expenditure in the North East was around £10 per week lower than this.
10. It is noticeable that average weekly expenditure by households in the North East was around £80 less than the national average, and around £170 less than the London average.
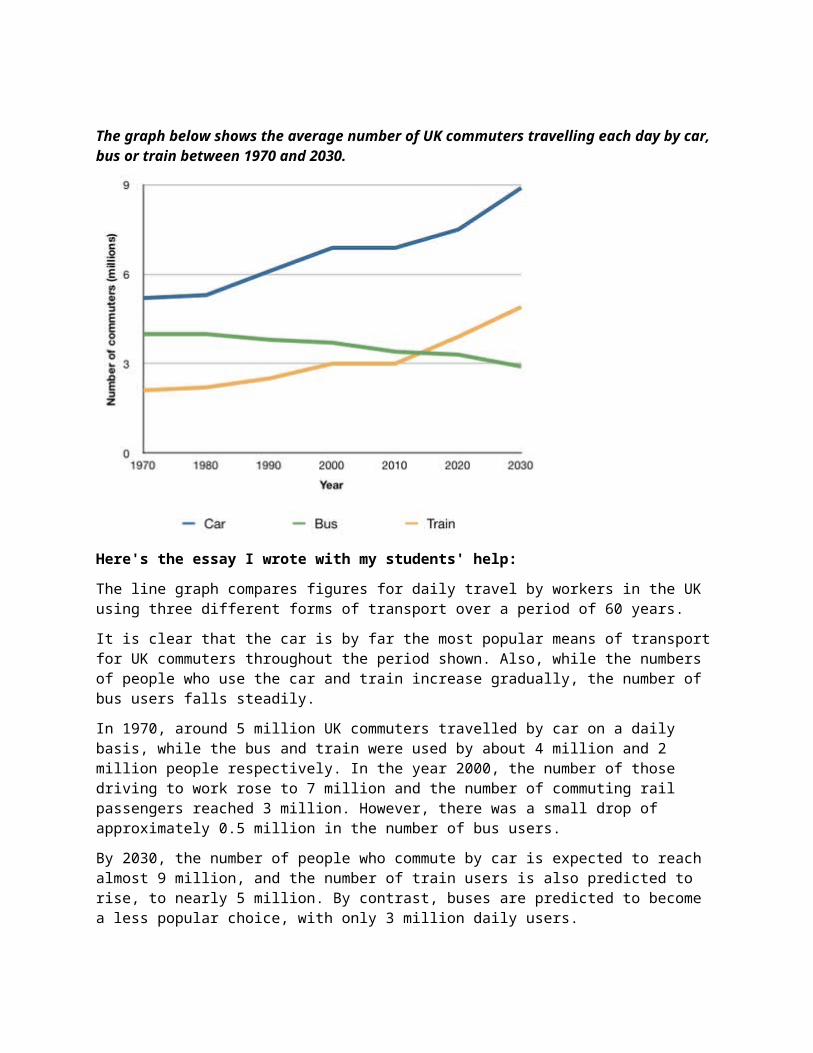
The graph below shows the average number of UK commuters travelling each day by car, bus or train between 1970 and 2030.
Here's the essay I wrote with my students' help:
The line graph compares figures for daily travel by workers in the UK using three different forms of transport over a period of 60 years.
It is clear that the car is by far the most popular means of transport for UK commuters throughout the period shown. Also, while the numbers of people who use the car and train increase gradually, the number of bus users falls steadily.
In 1970, around 5 million UK commuters travelled by car on a daily basis, while the bus and train were used by about 4 million and 2 million people respectively. In the year 2000, the number of those driving to work rose to 7 million and the number of commuting rail passengers reached 3 million. However, there was a small drop of approximately 0.5 million in the number of bus users.
By 2030, the number of people who commute by car is expected to reach almost 9 million, and the number of train users is also predicted to rise, to nearly 5 million. By contrast, buses are predicted to become a less popular choice, with only 3 million daily users.
The pie charts compare the expenditure of a school in the UK in three different years over a 20-year period.
It is clear that teachers’ salaries made up the largest proportion of the school’s spending in all three years (1981, 1991 and 2001). By contrast, insurance was the smallest cost in each year.
In 1981, 40% of the school’s budget went on teachers’ salaries. This figure rose to 50% in 1991, but fell again by 5% in 2001. The proportion of spending on other workers’ wages fell steadily over the 20-year period, from 28% of the budget in 1981 to only 15% in 2001.
Expenditure on insurance stood at only 2% of the total in 1981, but reached 8% in 2001. Finally, the percentages for resources and furniture/equipment fluctuated. The figure for resources was highest in 1991, at 20%, and the proportion of spending on furniture and equipment reached its peak in 2001, at 23%.
(158 words, band 9
IELTS Writing Task 1: line graph essay
Here's my full essay using last week's ideas:
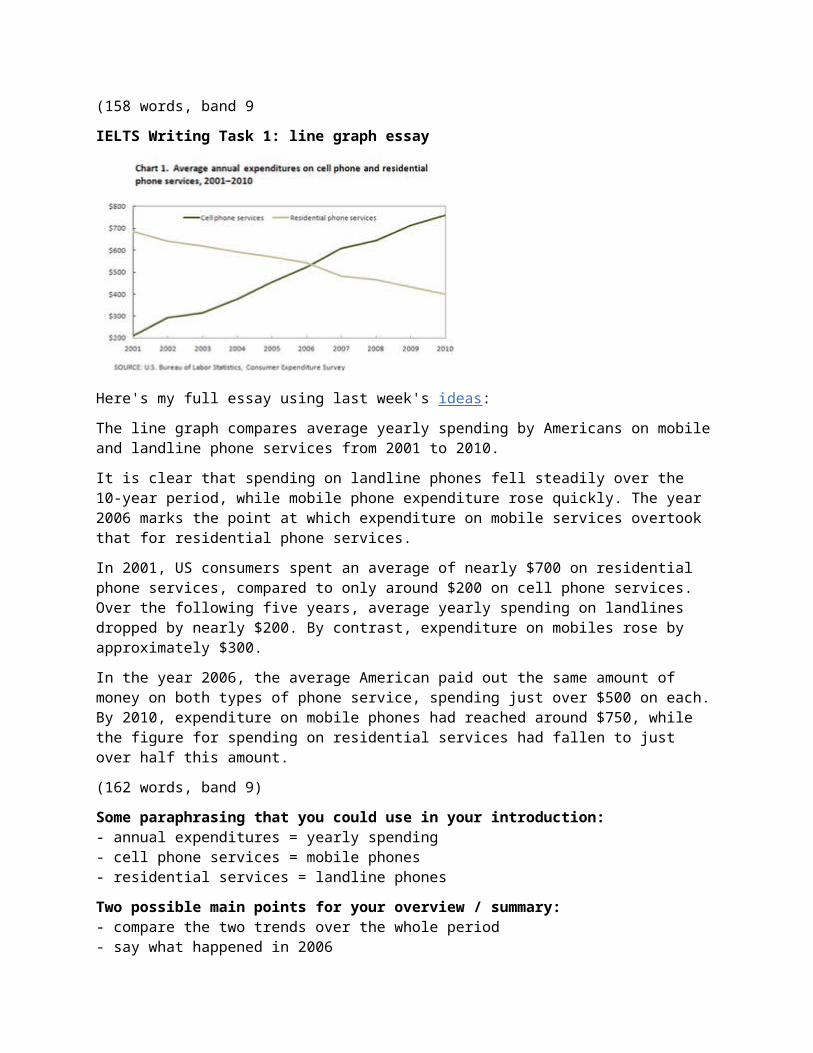
The line graph compares average yearly spending by Americans on mobile and landline phone services from 2001 to 2010.
It is clear that spending on landline phones fell steadily over the 10-year period, while mobile phone expenditure rose quickly. The year 2006 marks the point at which expenditure on mobile services overtook that for residential phone services.
In 2001, US consumers spent an average of nearly $700 on residential phone services, compared to only around $200 on cell phone services. Over the following five years, average yearly spending on landlines dropped by nearly $200. By contrast, expenditure on mobiles rose by approximately $300.
In the year 2006, the average American paid out the same amount of money on both types of phone service, spending just over $500 on each. By 2010, expenditure on mobile phones had reached around $750, while the figure for spending on residential services had fallen to just over half this amount.
(162 words, band 9)
Some paraphrasing that you could use in your introduction:- annual expenditures = yearly spending- cell phone services = mobile phones- residential services = landline phones
Two possible main points for your overview / summary:- compare the two trends over the whole period- say what happened in 2006
Select key details:- compare the figures for 2001- describe the changes in expenditure over the following 5 years- give the figures for 2006 (where the two lines meet)- finish with a comparison of spending in 2010
In the developed world, average life expectancy is increasing. What problems will this cause for individuals and society? Suggest some measures that could be taken to reduce the impact of ageing populations.
It is true that people in industrialised nations can expect to live longer than ever before. Although there will undoubtedly be some negative consequences of this trend, societies can take steps to mitigate these potential problems.
As people live longer and the populations of developed countries grow older, several related problems can be anticipated. The main issue is that there will obviously be more people of retirement age who will be eligible to receive a pension. The proportion of younger, working adults will be smaller, and governments will therefore receive less money in taxes in relation to the size of the population. In other words, an ageing population will mean a greater tax burden for working adults. Further pressures will include a rise in the demand for healthcare, and the fact young adults will increasingly have to look after their elderly relatives.
There are several actions that governments could take to solve the problems described above. Firstly, a simple solution would be to increase the retirement age for working adults, perhaps from 65 to 70. Nowadays, people of this age tend to be healthy enough to continue a productive working life. A second measure would be for governments to encourage immigration in order to increase the number of working adults who pay taxes. Finally, money from national budgets will need to be taken from other areas and spent on vital healthcare, accommodation and transport facilities for the rising numbers of older citizens.
In conclusion, various measures can be taken to tackle the problems that are certain to arise as the populations of countries grow older.
(265 words, band 9)
Some people regard video games as harmless fun, or even as a useful educational tool. Others, however, believe that videos games are having an adverse effect on the people who play them. In your opinion, do the drawbacks of video games outweigh the benefits?
Many people, and children in particular, enjoy playing computer games. While I accept that these games can sometimes have a positive effect on the user, I believe that they are more likely to have a harmful impact.
On the one hand, video games can be both entertaining and educational. Users, or gamers, are transported into virtual worlds which are often more exciting and engaging than real-life pastimes. From an educational perspective, these games encourage imagination and creativity, as well as concentration, logical thinking and problem solving, all of which are useful skills outside the gaming context. Furthermore, it has been shown that computer simulation games can improve users’ motor skills and help to prepare them for real-world tasks, such as flying a plane.
However, I would argue that these benefits are outweighed by the drawbacks. Gaming can be highly addictive because users are constantly given scores, new targets and frequent rewards to keep them playing. Many children now spend hours each day trying to progress through the levels of a game or to get a higher score than their friends. This type of addiction can have effects ranging from lack of sleep to problems at school, when homework is sacrificed for a few more hours on the computer or console. The
rise in obesity in recent years has also been linked in part to the sedentary lifestyle and lack of exercise that often accompany gaming addiction.
In conclusion, it seems to me that the potential dangers of video games are more significant than the possible benefits.
There are many different types of music in the world today. Why do we need music? Is the traditional music of a country more important than the international music that is heard everywhere nowadays?
It is true that a rich variety of musical styles can be found around the world. Music is a vital part of all human cultures for a range of reasons, and I would argue that traditional music is more important than modern, international music.
Music is something that accompanies all of us throughout our lives. As children, we are taught songs by our parents and teachers as a means of learning language, or simply as a form of enjoyment. Children delight in singing with others, and it would appear that the act of singing in a group creates a connection between participants, regardless of their age. Later in life, people’s musical preferences develop, and we come to see our favourite songs as part of our life stories. Music both expresses and arouses emotions in a way that words alone cannot. In short, it is difficult to imagine life without it.
In my opinion, traditional music should be valued over the international music that has become so popular. International pop music is often catchy and fun, but it is essentially a commercial product that is marketed and sold by business people. Traditional music, by contrast, expresses the culture, customs and history of a country. Traditional styles, such as ...(example)..., connect us to the past and form part of our cultural identity. It would be a real pity if pop music became so predominant that these national styles disappeared.
In conclusion, music is a necessary part of human existence, and I believe that traditional music should be given more importance than international music.
Some people think that all teenagers should be required to do unpaid work in their free time to help the local community. They believe this would benefit both the individual teenager and society as a whole.Do you agree or disagree?
Many young people work on a volunteer basis, and this can only be beneficial for both the individual and society as a whole. However, I do not agree that we should therefore force all teenagers to do unpaid work.
Most young people are already under enough pressure with their studies, without being given the added responsibility of working in their spare time. School is just as demanding as a full-time job, and teachers expect their students to do homework and exam revision on top of attending lessons every day. When young people do have some free time, we should encourage them to enjoy it with their friends or to spend it doing sports and other leisure activities. They have many years of work ahead of them when they finish their studies.
At the same time, I do not believe that society has anything to gain from obliging young people to do unpaid work. In fact, I would argue that it goes against the values of a free and fair society to force a group of people to do something against their will. Doing this can only lead to resentment amongst young people, who would feel that they were being used, and parents, who would not want to be told how to raise their children. Currently, nobody is forced to volunteer, and this is surely the best system.

In conclusion, teenagers may choose to work for free and help others, but in my opinion we should not make this compulsory.
Some people believe that hobbies need to be difficult to be enjoyable.To what extent do you agree or disagree?
Some hobbies are relatively easy, while others present more of a challenge. Personally, I believe that both types of hobby can be fun, and I therefore disagree with the statement that hobbies need to be difficult in order to be enjoyable.
On the one hand, many people enjoy easy hobbies. One example of an activity that is easy for most people is swimming. This hobby requires very little equipment, it is simple to learn, and it is inexpensive. I remember learning to swim at my local swimming pool when I was a child, and it never felt like a demanding or challenging experience. Another hobby that I find easy and fun is photography. In my opinion, anyone can take interesting pictures without knowing too much about the technicalities of operating a camera. Despite being straightforward, taking photos is a satisfying activity.
On the other hand, difficult hobbies can sometimes be more exciting. If an activity is more challenging, we might feel a greater sense of satisfaction when we manage to do it successfully. For example, film editing is a hobby that requires a high level of knowledge and expertise. In my case, it took me around two years before I became competent at this activity, but now I enjoy it much more than I did when I started. I believe that many hobbies give us more pleasure when we reach a higher level of performance because the results are better and the feeling of achievement is greater.
In conclusion, simple hobbies can be fun and relaxing, but difficult hobbies can be equally pleasurable for different reasons.
Nowadays the way many people interact with each other has changed because of technology.In what ways has technology affected the types of relationships that people make? Has this been a positive or negative development?
It is true that new technologies have had an influence on communication between people. Technology has affected relationships in various ways, and in my opinion there are both positive and negative effects.
Technology has had an impact on relationships in business, education and social life. Firstly, telephones and the Internet allow business people in different countries to interact without ever meeting each other. Secondly, services like Skype create new possibilities for relationships between students and teachers. For example, a student can now take video lessons with a teacher in a different city or country. Finally, many people use social networks, like Facebook, to make new friends and find people who share common interests, and they interact through their computers rather than face to face.
On the one hand, these developments can be extremely positive. Cooperation between people in different countries was much more difficult when communication was limited to written letters or telegrams. Nowadays, interactions by email, phone or video are almost as good as face-to-face meetings, and many of us benefit from these interactions, either in work or social contexts. On the other hand, the availability of new communication technologies can also have the result of isolating people and discouraging real interaction. For example, many young people choose to make friends online rather than mixing with their peers in the real world, and these ‘virtual’ relationships are a poor substitute for real friendships.
In conclusion, technology has certainly revolutionised communication between people, but not all of the outcomes of this revolution have been positive.
Advantages / disadvantages of books:
The main advantage of books is that they are usually considered to be reliable sources of information. People tend to refer to books when they want to research a subject in depth, and for this reason they continue to play an important role in education. On the other hand, books quickly go out of date, and therefore they are not the best medium for communicating news stories.
Advantages / disadvantages of radio:
Radio is a much more effective medium than books for the communication of up-to-date information. We can listen to news broadcasts about events as they happen, and a key benefit of radio is that we can listen to it while doing other activities, such as driving or working. The main drawback of radio, when compared to books or television, is that there is no visual element; we cannot see what the broadcaster is describing.
Advantages / disadvantages of TV, and my opinion:
In my opinion, television is the most effective of these three media because it brings us closer to reality than a book or radio programme ever can. For example, we can watch events as they take place on the other side of the world, or we can see the body language of a politician who is being interviewed. The disadvantages of television are that programmes tend to be short and interrupted by advertisements, meaning that information is presented in limited depth.
Many people decide on a career path early in their lives and keep to it. This, they argue, leads to a more satisfying working life.To what extent do you agree with this view?What other things can people do in order to have a satisfying working life?
It is true that some people know from an early age what career they want to pursue, and they are happy to spend the rest of their lives in the same profession. While I accept that this may suit many people, I believe that others enjoy changing careers or seeking job satisfaction in different ways.
On the one hand, having a defined career path can certainly lead to a satisfying working life. Many people decide as young children what they want to do as adults, and it gives them a great sense of satisfaction to work towards their goals and gradually achieve them. For example, many children dream of becoming doctors, but to realise this ambition they need to gain the relevant qualifications and undertake years of training. In my experience, very few people who have qualified as doctors choose to change career because they find their work so rewarding, and because they have invested so much time and effort to reach their goal.
On the other hand, people find happiness in their working lives in different ways. Firstly, not everyone dreams of doing a particular job, and it can be equally rewarding to try a variety of professions; starting out on a completely new career path can be a reinvigorating experience. Secondly, some people see their jobs as simply a means of earning money, and they are happy if their salary is high enough to allow them to enjoy life outside work. Finally, job satisfaction is often the result of working conditions, rather than the career itself. For example, a positive working atmosphere, enthusiastic colleagues, and an inspirational boss can make working life much more satisfying, regardless of the profession.
We cannot help everyone in the world that needs help, so we should only be concerned with our own communities and countries.To what extent do you agree or disagree with this statement?
Some people believe that we should not help people in other countries as long as there are problems in our own society. I disagree with this view because I believe that we should try to help as many people as possible.
On the one hand, I accept that it is important to help our neighbours and fellow citizens. In most communities there are people who are impoverished or disadvantaged in some way. It is possible to find homeless people, for example, in even the wealthiest of cities, and for those who are concerned about this problem, there are usually opportunities to volunteer time or give money to support these people. In the UK, people can help in a variety of ways, from donating clothing to serving free food in a soup kitchen. As the problems are on our doorstep, and there are obvious ways to help, I can understand why some people feel that we should prioritise local charity.
At the same time, I believe that we have an obligation to help those who live beyond our national borders. In some countries the problems that people face are much more serious than those in our own communities, and it is often even easier to help. For example, when children are dying from curable diseases in African countries, governments and individuals in richer countries can save lives simply by paying for vaccines that already exist. A small donation to an international charity might have a much greater impact than helping in our local area.
In conclusion, it is true that we cannot help everyone, but in my opinion national boundaries should not stop us from helping those who are in need.
(280 words, band 9)
In recent years, there has been growing interest in the relationship between equality and personal achievement. Some people believe that individuals can achieve more in egalitarian societies. Others believe that high levels of personal achievement are possible only if individuals are free to succeed or fail according to their individual merits.What is your view of the relationship between equality and personal success?
In my opinion, an egalitarian society is one in which everyone has the same rights and the same opportunities. I completely agree that people can achieve more in this kind of society.
Education is an important factor with regard to personal success in life. I believe that all children should have access to free schooling, and higher education should be either free or affordable for all those who chose to pursue a university degree. In a society without free schooling or affordable higher education, only children and young adults from wealthier families would have access to the best learning opportunities, and they would therefore be better prepared for the job market. This kind of inequality would ensure the success of some but harm the prospects of others.
I would argue that equal rights and opportunities are not in conflict with people’s freedom to succeed or fail. In other words, equality does not mean that people lose their motivation to succeed, or that they are not allowed to fail. On the contrary, I believe that most people would feel more motivated to work hard and reach their potential if they thought that they lived in a fair society. Those who did not make the same effort would know that they had wasted their opportunity. Inequality, on the other hand, would be more
likely to demotivate people because they would know that the odds of success were stacked in favour of those from privileged backgrounds.
In conclusion, it seems to me that there is a positive relationship between equality and personal success.
(260 words)
Childhood obesity is becoming a serious problem in many countries. Explain the main causes and effects of this problem, and suggest some possible solutions.
Children's health are increasingly deteriorating by fatness throughout the world, even condition is pretty alarming among the world's most affluent western countries.There are a number of reason causing this problem and each problem needs to be dealt in a particular way.
It is likely that one of the most prominent cause giving rise to this problem is the major change in our lifestyle due to remarkable advancement and shophistication in technology, which has considerable impact on our daily life and health.These advancement comes at a cast with the adverse impact on our health due to lack of physical activity and laziness in office and home.At office most of the poeple suffering from this illness spend many hours sitting in front of the computer without any physical activity.Not only this even at home most of us spend time watching TV and taking rest at their bedroom.Even children nowadays give preference to playing computer game or chatting on internet with their friends rather than playing out door sports.In addition to that the quality of foods which we consumes every day made the matters worse.These foods , which are easily available ,oftenly contains ingredients that are high in calorie ,cholestral and fat , while at the same time lack necessary vitamin , mineral and protien and these factors are taking a toll on our health.
Moreover , these significant changes has begun showing up adverse effect on our health.Children from many country are suffering from obesity , fatness and fatness related diseases such as heart disease , cancel and sugar.As a result it is imperating that we should fight collectively hand in hand against this huge problem before it poses a threat to our health system.
In my opinion, teachers, parent and goverment as a whole should take this issue as a matter of urgency and take necessary step to over come at every stages.For instance parents are expected to keep an eye on thier children's eating habit and make sure they take healthy food while reducing the quanity of luring junk food.Government can contribute by puting a ban on unhealthy items specialy prepared keeping in mind to children.
To conclude, although many countries are now a days falling prey to unhealthy diet but we can fight and defeat this menace with strong will power and taking some preventive actions as described above.
Sample 2:
Childhood obesity is a one of most pressing cause of concern in today's world .This leading tendency is caused by several factors such as ingestion of huge proportion of fast foods,and people are enjoying sedentary life style.Proper management of obesity in children is likely to be lessen the difficulties in childhood obesity.
Firstly,it seems to be more difficult to address leading factors of obesity trends in children due to the sophisticated lifestyles of people nowadays.Availability of junk foods in food stores and restaurants and even in school cafeterias give rise to this burning problem.These fast foods are rich in high calories,trans -
fats,high levels of sugar which contributes to the heart diseases,Diabetes mellites .joint disorders and mental illnesses such as depression .The Instant food culture has deteriorated children's healthiness owing to the lack of sound nutrients which helps to fight diseases.What is more,playing computer games and watching television longer hours end up with childhood obesity due to the physical inactivity which leads to detrimental effects to the health.Nevertheless,less performances of outdoor activities that support to burn extra calories are trapped by entertainment of media and social networking sites
Secondly,it is the foremost duty and responsibility of parents,guardians,teachers and state to protect children from the relentless ad creep for instant foods by implementing possible actions.By removing fast food recipies from the schools menus and banning junk food restaurents from local areas near to schools are wise suggestions should be performed.Close observation and proper guidance of children make easy to approach the situation.Introducing nutritional foods for educational stream and strengthen the domestic use of proper foods make a green light for the right path.
It is obvious that there are several factors causing obesity in children and there are possible actions which can make this bad consequence pretty comfort.
Sample 3:
There are a number of reasons that led to an increase in the number of obese children; however, some solutions are possible to rectify the ever growing problem as will be explained below.In recent years concerns have been arisen over the diet of younger children. On a day to day basis children are flooded with products containing significant quantities of sugar, preservatives and artificial additives. The intake of such foods and the subsequent behavior is becoming increasingly apparent. Moreover, as the nature of play has significantly changed; with outdoor activities replaced by screen-time indoors, more young people are forsaking traditional activities such as bike riding or simply running outside, for indoor activities such as computer games and television programs. Undeniably, poor diet and lack of daily exercise are the main causes of childhood obesity.The effects of such behaviors can be disastrous. Obesity leads to a higher risk of diseases such as diabetes, heart disease and cancer. As a result, these children will put a significant strain on hospitals and the rest of society in the future.However, there are a number of possible solutions to this problem. Parents, teachers as well as government should be held responsible for the well-being of the younger generation. Parents should perhaps watch their children’s diet more closely and restrict the amount of time children spend in front of TV. Schools should encourage children to take regular exercise and put more of an emphasis on the quality of food served within school lunchrooms. Governments could also help decrease the number of obese children by limiting junk food advertisements.To conclude, admittedly, obesity among young children is a growing problem; however, by engaging parents, schools and government in these issues, solutions are possible.
Sample 4:
It is true that obesity among children is growing in an alarming rate every year around the globe. It is not only the responsibilty of the parents to control the diet of their kids but also schools and the government are accountable to prevent and reduce the number of obese children.This essay will discuss the causes and effects of overweight in young people and some solutions to deter it.
There are several causes of obesity in children. Firstly, lack of control in eating junk food like humburgers and fries which contains lots of fats and salt.Secondly, inadequate exercise. Children are expected to be active in their age. However, they would rather stay at home and play video games. Thirdly, lack of discipline from parents. There are some occasions that their own parents encourage the convenience of eating food from fast food chains instead of cooking home-cooked meals.
Meanwhile, the effects of obesity in young ones cannot be ignored. Some people say that it could lead to overweight which can be a subject of ridicule at school. Others may argue that it could lead to different diseases like diabetes and heart problems later on. Another problem posed by being overweight is that it can increase the admission rates in the hospital in the future.
There are effective solutions to combat obesity. One is to make schools, governments and parents to become accountable in hindering children's being overweight. Another solution to the problem of obesity is to help children choose foods that are healthy and emphasized the importance of eating fruits and vegetables over junk foods. Finally, when at home parents should set limits in playing computer games. Therefore, kids will be encouraged to do outdoor activities and spend more time with their friends playing physical sports.
In conclusion, although the problem of obesity among children is undeniably alarming, there are stil effective ways to combat these like healthy eating of fruits and vegetables, playing outdoor activities and, setting limits in playing video games.
Sample 5:
In many advanced countries, such as Australia, USA and United Kingdom, obesity in children has become a serious issue. There are many factors which cause this problem, and it will have a serious effect on the children, therefore some actions must be taken to resolve the problem.
Parents today prefer to serve instant food rather than preparing the traditional one for their children, since they are busy with their career. These kind of food are not healthy and they contain lot of fats and hormones. Another important matter is that children these day are lack of exercises. They prefer to watch the cartoon programs on televisions today or play the attractive video games. As a result, many children are overweight in their early age, and it increases the risk of some serious diseases, such as cholesterol, diabetes and heart attack.
There are some solutions to solve the problem and it should be directly implemented. Firstly, parents must prepare healthier meals for their children. They must spend more times for shopping in the traditional market to get fresh foods rather than to purchase frozen foods. Secondly, they should encourage their children to do some outdoor physical exercises, such as walking in the park or playing football in the field. Thirdly, parents must limit the time for watching TV programs or playing the console game. For instance, the children are only allowed to play during the weekends only. Lastly, schools should have some campaigns about the negative effects of obesity in order for the student to get gain a better understanding of it.
To conclude, children who suffered overweight problem are increasing these days and some actions must be taken by parents and school in order to solve this serious matter.
Universities should accept equal numbers of male and female students in every subject. To what extent do you agree or disagree?
In my opinion, men and women should have the same educational opportunities. However, I do not agree with the idea of accepting equal proportions of each gender in every university subject.
Having the same number of men and women on all degree courses is simply unrealistic. Student numbers on any course depend on the applications that the institution receives. If a university decided to fill courses with equal numbers of males and females, it would need enough applicants of each gender. In reality, many courses are more popular with one gender than the other, and it would not be practical to aim for equal proportions. For example, nursing courses tend to attract more female applicants, and it would be difficult to fill these courses if fifty per cent of the places needed to go to males.
Apart from the practical concerns expressed above, I also believe that it would be unfair to base admission to university courses on gender. Universities should continue to select the best candidates for each course according to their qualifications. In this way, both men and women have the same opportunities, and applicants know that they will be successful if they work hard to achieve good grades at school. If a female student is the best candidate for a place on a course, it would be wrong to reject her in favour of a male student with lower grades or fewer qualifications.
In conclusion, the selection of university students should be based on merit, and it would be both impractical and unfair to change to a selection procedure based on gender.
Some people think that museums should be enjoyable places to entertain people, while others believe that the purpose of museums is to educate.Discuss both views and give you own opinion.
People have different views about the role and function of museums. In my opinion, museums can and should be both entertaining and educational.
On the one hand, it can be argued that the main role of a museum is to entertain. Museums are tourist attractions, and their aim is to exhibit a collection of interesting objects that many people will want to see. The average visitor may become bored if he or she has to read or listen to too much educational content, so museums often put more of an emphasis on enjoyment rather than learning. This type of museum is designed to be visually spectacular, and may have interactive activities or even games as part of its exhibitions.
On the other hand, some people argue that museums should focus on education. The aim of any exhibition should be to teach visitors something that they did not previously know. Usually this means that the history behind the museum’s exhibits needs to be explained, and this can be done in various ways. Some museums employ professional guides to talk to their visitors, while other museums offer headsets so that visitors can listen to detailed commentary about the exhibition. In this way, museums can play an important role in teaching people about history, culture, science and many other aspects of life.
In conclusion, it seems to me that a good museum should be able to offer an interesting, enjoyable and educational experience so that people can have fun and learn something at the same time.
(253 words, band 9)
Some people believe that studying at university or college is the best route to a successful career, while others believe that it is better to get a job straight after school.Discuss both views and give your opinion.
When they finish school, teenagers face the dilemma of whether to get a job or continue their education. While there are some benefits to getting a job straight after school, I would argue that it is better to go to college or university.
The option to start work straight after school is attractive for several reasons. Many young people want to start earning money as soon as possible. In this way, they can become independent, and they will be able to afford their own house or start a family. In terms of their career, young people who decide to find work, rather than continue their studies, may progress more quickly. They will have the chance to gain real experience and learn practical skills related to their chosen profession. This may lead to promotions and a successful career.
On the other hand, I believe that it is more beneficial for students to continue their studies. Firstly, academic qualifications are required in many professions. For example, it is impossible to become a doctor, teacher or lawyer without having the relevant degree. As a result, university graduates have access to more and better job opportunities, and they tend to earn higher salaries than those with fewer qualifications. Secondly, the job market is becoming increasingly competitive, and sometimes there are hundreds of applicants for one position in a company. Young people who do not have qualifications from a university or college will not be able to compete.
For the reasons mentioned above, it seems to me that students are more likely to be successful in their careers if they continue their studies beyond school level.
(271 words, band 9)