Embed Size (px)
DESCRIPTION
The content for this excerpt was taken directly from the IDC Market Analysis Report, Worldwide Mobile Worker Population 2009-2013 Forecast, by Stephen D Drake, Justin Jaffe, and Raymond Boggs (Doc # 221309). All or part of the following sections is included in this excerpt: IDC Opinion, In This Study, Situation Overview, Future Outlook, Essential Guidance, Learn More, and Synopsis.
Citation preview
Filing Information: June 2010, IDC #221309E
: Excerpt
E X C E R P T
W o r l d w i d e M o b i l e W o r k e r P o p u l a t i o n 2 0 0 9 - 2 0 1 3 F o r e c a s t
Stephen D. Drake Justin Jaffe
Raymond Boggs
I N T H I S E X C E R P T
The content for this excerpt was taken directly from the IDC Market Analysis Report,
Worldwide Mobile Worker Population 2009-2013 Forecast, by Stephen D Drake,
Justin Jaffe, and Raymond Boggs (Doc # 221309). All or part of the following
sections is included in this excerpt: IDC Opinion, In This Study, Situation Overview,
Future Outlook, Essential Guidance, Learn More, and Synopsis.
I D C O P I N I O N
The worldwide mobile worker population is set to increase from 919.4 million in 2008,
accounting for 29% of the worldwide workforce, to 1.19 billion in 2013, accounting for
34.9% of the workforce. Key highlights across the regions include:
The United States has the highest percentage of mobile workers in its workforce,
with 72.2% of the workforce mobile in 2008. This will grow to 75.5% by the end of
the forecast period to 119.7 million mobile workers. The United States will remain
the most highly concentrated market for mobile workers with three-quarters of the
workforce being mobile by 2013.
Asia/Pacific (excluding Japan) represents the largest total number of mobile
workers throughout the forecast, with 546.4 million mobile workers in 2008 and
734.5 million in 2013.
Western Europe's mobile workforce, at 96.5 million for 2008, accounts for roughly
half of its total workforce. The mobile worker population in this region will
experience healthy growth of 6% compound annual growth rate (CAGR) to reach
129.5 million mobile workers for 2013.
Japan will grow by a CAGR of 3.3% to reach a mobile worker penetration rate of
74.5% of its workforce being mobile by 2013, for a total of 49.3 million mobile
workers.
The rest of the world (ROW) includes Central and Eastern Europe, Middle East,
and Africa (CEMA), Latin America, and Canada. It has the lowest penetration of
mobile workers at 13.5% for 2008, but still represents a significant opportunity at
125.7 million mobile workers. It will grow at a CAGR of 4% to reach 153.2 million
mobile workers by 2013.
Glo
bal
Hea
dq
uar
ters
: 5 S
pee
n S
tree
t F
ram
ingh
am, M
A 0
170
1 U
SA
P.5
08.
872
.82
00
F
.508
.93
5.4
01
5
ww
w.id
c.co
m
2 #221309E ©2010 IDC
I N T H I S S T U D Y
M e t h o d o l o g y
The forecast information and analysis in this study was prepared by IDC using a
multifaceted approach. Information sources used to develop this forecast include the
U.S. Census Bureau, the Bureau of Labor Statistics, and other similar government
statistics for other regions and countries, as well as primary and secondary
resources. Primary sources include surveys of vendors and mobile users, and
secondary sources consist of publicly accessible information and in-depth meetings
and discussions with vendors. This study also incorporates surveys and forecasts
published in related programs.
The survey results regarding telecommuters, home-based businesses, and work
extenders are drawn from IDC's ongoing home office research. The principal source
of information is IDC's 2009 Work-at-Home Survey. This national survey of 758 U.S.
households was conducted by telephone to track the extent at which people are
working at home and the nature of their jobs, as well as home office household use of
advanced technology products and services. Respondents were identified using
random-digit dialing of residential telephone exchanges. The survey provides
statistical accuracy to ±3.6% at the 95% confidence level.
D e f i n i t i o n s
IDC segments the mobile worker population into three core categories: office-based
mobile workers, non-office-based mobile workers, and home-based mobile workers.
Within each of these categories, IDC further segments the mobile workers (see
Figure 1). The sections that follow provide definitions for each category and
subcategory of mobile worker.
©2010 IDC #221309E 3
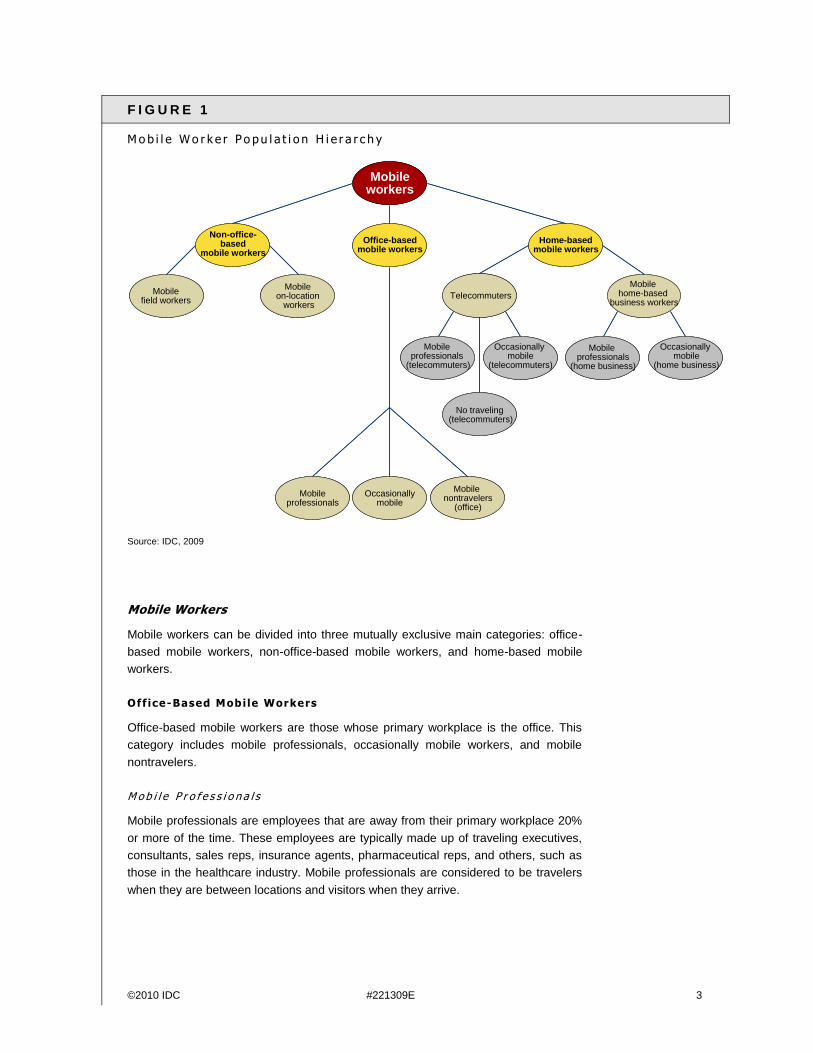
F I G U R E 1
M o b i l e W o r k e r P o pu l a t i o n H i e r a r c h y
Source: IDC, 2009
Mobile Workers
Mobile workers can be divided into three mutually exclusive main categories: office-
based mobile workers, non-office-based mobile workers, and home-based mobile
workers.
Off ice-Based Mobile Workers
Office-based mobile workers are those whose primary workplace is the office. This
category includes mobile professionals, occasionally mobile workers, and mobile
nontravelers.
M o b i l e P r o f e s s i o n a l s
Mobile professionals are employees that are away from their primary workplace 20%
or more of the time. These employees are typically made up of traveling executives,
consultants, sales reps, insurance agents, pharmaceutical reps, and others, such as
those in the healthcare industry. Mobile professionals are considered to be travelers
when they are between locations and visitors when they arrive.
Mobileworkers
Non-office-based
mobile workers
Home-basedmobile workers
Office-basedmobile workers
Mobile on-location
workers
Mobilefield workers
Mobile home-based
business workersTelecommuters
Mobile professionals
(telecommuters)
Occasionally mobile
(telecommuters)
No traveling (telecommuters)
Occasionally mobile
(home business)
Mobile professionals
(home business)
Mobileprofessionals
Occasionallymobile
Mobile nontravelers
(office)
4 #221309E ©2010 IDC
O c c a s i o n a l l y M o b i l e
Previously known as the mobile migration opportunity, occasionally mobile workers
are those who may be involved in some mobile activity outside of their primary
workplace but do not fit the criteria of mobile professionals who are away from their
office at least 20% of the time. These employees may only be mobile a few times a
year or less than 20% of their workdays per month.
M o b i l e N o n t r a v e l e r
Mobile nontravelers are those workers who are mobile within the office or campus
environment but do not travel outside of the office or campus. An example would be
IT professionals who travel within buildings and campuses to assist in administration
of networks and PCs but are not considered to be mobile professionals or
occasionally mobile workers as defined because their mobility pattern remains within
the office or campus environs.
Non-Off ice-Based Mobile Workers
Non-office-based mobile workers are those workers who are mobile but are not in an
office environment. The two types of mobile non-office-based workers include mobile
field workers and mobile on-location workers.
M o b i l e F i e l d W o r k e r s
Formerly known as mobile data collectors, mobile field workers are typically field
service employees from various vertical industries who collect data. Increasingly,
these employees are delivering enhanced services beyond data collection (such as
sales functions) to better serve clients' needs and provide an upsell opportunity for
the company.
Workers move from location to location and include those in typically service-oriented
fields such as transportation, package delivery, trucking, route accounting, utilities,
HVAC, construction management, and warehousing logistics. What makes mobile
field workers unique is their pattern of mobility. The locations to which they travel may
be part of a regularly traveled route or may vary from day to day. For example, a
driver for a package delivery service may drive the same route every day.
Conversely, a field service employee's route may be determined at the beginning of
each day based on a list of scheduled service calls or may change throughout the day
as service calls are received. Mobile field workers often, but not always, operate a
company vehicle as part of their job.
M o b i l e O n - L o c a t i o n W o r k e r s
Mobile on-location workers are those employees that work at a specific location but
outside of an office environment. Unlike mobile field workers, these employees are
typically mobile only within a specific area, as they are on location at their primary
workplace. Mobile on-location workers may work indoors (e.g., in a restaurant or
warehouse), outdoors (e.g., at a construction site), or in mixed environments.
Examples include warehouse workers, hospitality workers, and rental car employees
assisting customers who are picking up and dropping off vehicles. Some may operate
specialty equipment (e.g., forklifts and construction equipment) as part of their job.
©2010 IDC #221309E 5
Home-Based Mobi le Workers
Home-based mobile workers are those mobile and remote workers who use their
home as a workplace all or part of the time. This category includes telecommuters
and mobile home-based business workers.
T e l e c o m m u t e r s
Telecommuters are corporate employees who work at home during normal business
hours. The threshold for telecommuters is three days a month or more, though some
telecommuters may spend no time in traditional offices. (In effect, they are
telecommuting full time.) These workers may have an informal arrangement between
the employee and the supervisor, or the work arrangement can be more formalized
with a written policy and enrollment.
Telecommuters consist of the following:
Mobile professionals (telecommuters): This segment consists of those
telecommuters who also travel away from their homes or corporate offices at
least 20% of the time. This definition is consistent with office-based mobile
professionals, with the only distinction being that these employees work out of
their homes three days a month or more. An example would be regional
salespeople who, because of their territory (e.g., the northeastern United States)
may report to corporate offices but, because of logistics, work out of their homes
and travel within their regional sales territories, visiting clients and prospects.
Occasionally mobile (telecommuters): This segment consists of
telecommuters who may be involved in some mobile activity outside of their
primary workplace but do not fit the criteria of mobile professionals who are away
from their offices at least 20% of the time. These employees may be mobile only
infrequently. This definition is consistent with that of office-based occasional
mobile workers, with the only distinction being that these employees are
telecommuters. An example here would be the worker who telecommutes
occasionally for business or personal reasons and has a tendency to travel
occasionally to clients or other offices.
Nontraveling telecommuter: Nontraveling telecommuters are workers who are
considered to be mobile by virtue of being telecommuters but do not travel away
from the home or the corporate office. An example would be a finance
department employee who telecommutes a particular number of days because of
personal or professional reasons and only works from home or the main office
and does not travel for business purposes.
M o b i l e H o m e - B a s e d B u s i n e s s W o r k e r s
Mobile home-based business workers consist of those home-based, income-
generating business owners who are the following:
Mobile professionals (home business): Mobile professional (home business)
workers are those home-based business owners and employees whose primary
workplace is a home and who are away from their primary workplace at least
20% of the time.
6 #221309E ©2010 IDC
Occasionally mobile (home business): Occasionally mobile (home business)
workers are those home-based business owners and employees whose primary
workplace is a home and who are away from their workplace less than 20% of
the time. They may only be mobile a few times a year.
Other Types of Mobile Wor kers
IDC identifies a number of additional categories of mobile workers that are essentially
an overlay of the categories defined previously. IDC does not quantify these
categories separately but uses them largely to further qualify and detail the core
mobile workers.
T r a v e l e r s
Travelers are mobile professionals or occasionally mobile workers, home and office
based. They are defined as travelers at the specific time when they are in transit in a
plane, train, airport, train station, and so forth. Travelers are on their way to their final
destination, which may be a hotel, conference center, client site, or satellite office or
are on the return journey. Travelers differ from commuters; commuters are en route to
the office, but travelers are on their way to or from a visitor site.
V i s i t o r s
Visitors are travelers who have reached their destination, which may be a hotel,
conference center, client site, or satellite office. At the point at which mobile workers
become visitors, they have reached a certain level of "fixed" mobility in so much as
they are mobile because they are away from the office, but unlike travelers, they are
much less transient.
C o m m u t e r s
IDC recognizes that the majority of the U.S. workforce commutes to some extent from
where they live to where their workplace is located and back home (exceptions
include full-time telecommuters and home-based business owners). IDC is interested
in those commuters who are leveraging some mobile device technology on their way
to work or returning. Like the traveler, the commuter is very transient in nature, but
unlike the traveler, who may spend a day or more traveling and is typically in different
locations, the knowledge-working commuter has a much shorter traveling time (from
minutes to several hours) and is typically traveling the same route each day. The
means of traveling is often very similar (e.g., takes the subway to work every day) and
typically very limited (e.g., car, subway, or bus).
C o r r i d o r C r u i s e r s
Corridor cruisers include those office-based employees that travel within the office or
campus area. Corridor cruisers include mobile nontravelers as well as a percentage
of office-based mobile professional and occasionally mobile workers, who may exhibit
this work pattern at certain times.
W o r k E x t e n d e r s
This segment includes corporate workers who take work home from traditional jobs
after normal business hours. Although they work in the evening or on weekends,
©2010 IDC #221309E 7
corporate after-hours employees are not compensated separately. Their reward
would likely come through raises and promotions associated with greater productivity.
Geographic Definitions
IDC includes five regions in this study: the United States, Western Europe,
Asia/Pacific (excluding Japan), Japan, and ROW.
Countries in the Western Europe forecast include Austria, Belgium, Denmark,
Finland, France, Germany, Greece, Ireland, Italy, Netherlands, Norway, Portugal,
Spain, Sweden, Switzerland, and the United Kingdom.
Countries in Asia/Pacific (excluding Japan) include Australia, China, Hong Kong,
India, Indonesia, Korea, Malaysia, New Zealand, Philippines, Singapore, Taiwan,
Thailand, Vietnam, and the rest of Asia/Pacific (ROAP).
The ROW region includes Canada; Central and Eastern Europe, the Middle East, and
Africa (CEMA); and Latin America.
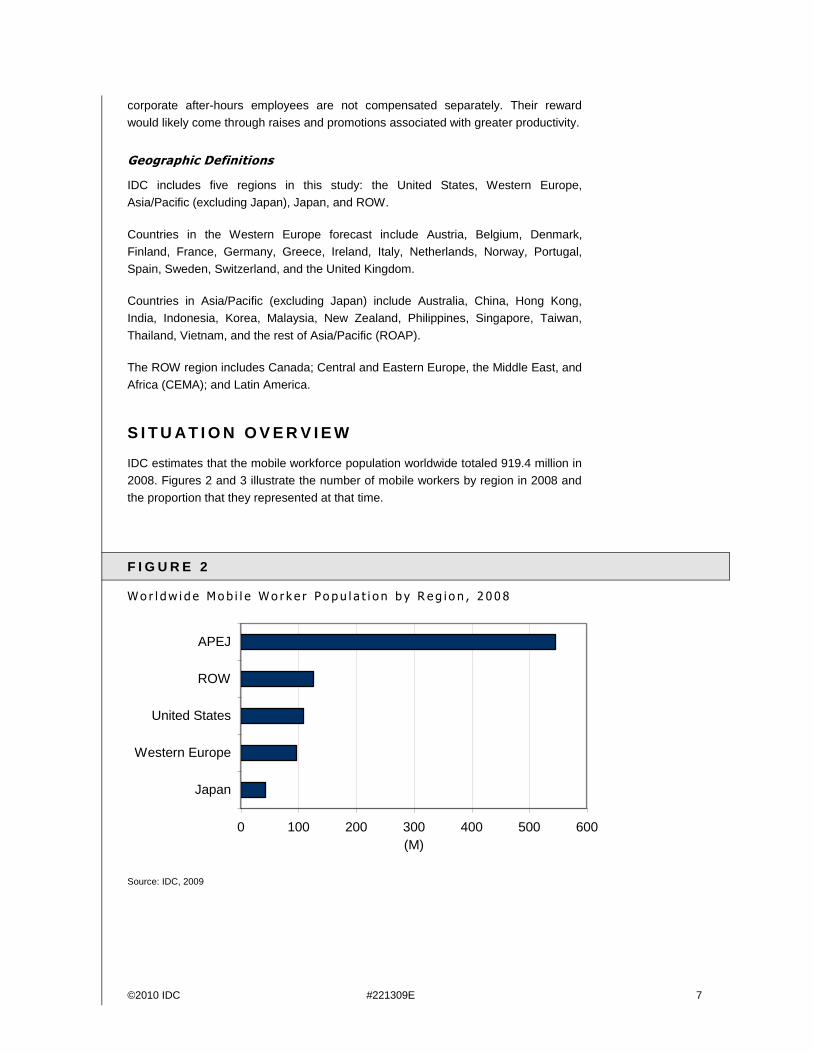
S I T U AT I O N O V E R V I E W
IDC estimates that the mobile workforce population worldwide totaled 919.4 million in
2008. Figures 2 and 3 illustrate the number of mobile workers by region in 2008 and
the proportion that they represented at that time.
F I G U R E 2
W o r l dw i d e M o b i l e W o r k e r P o p u l a t i o n b y R e g i o n , 2 0 0 8
Source: IDC, 2009
0 100 200 300 400 500 600
Japan
Western Europe
United States
ROW
APEJ
(M)
8 #221309E ©2010 IDC
F I G U R E 3
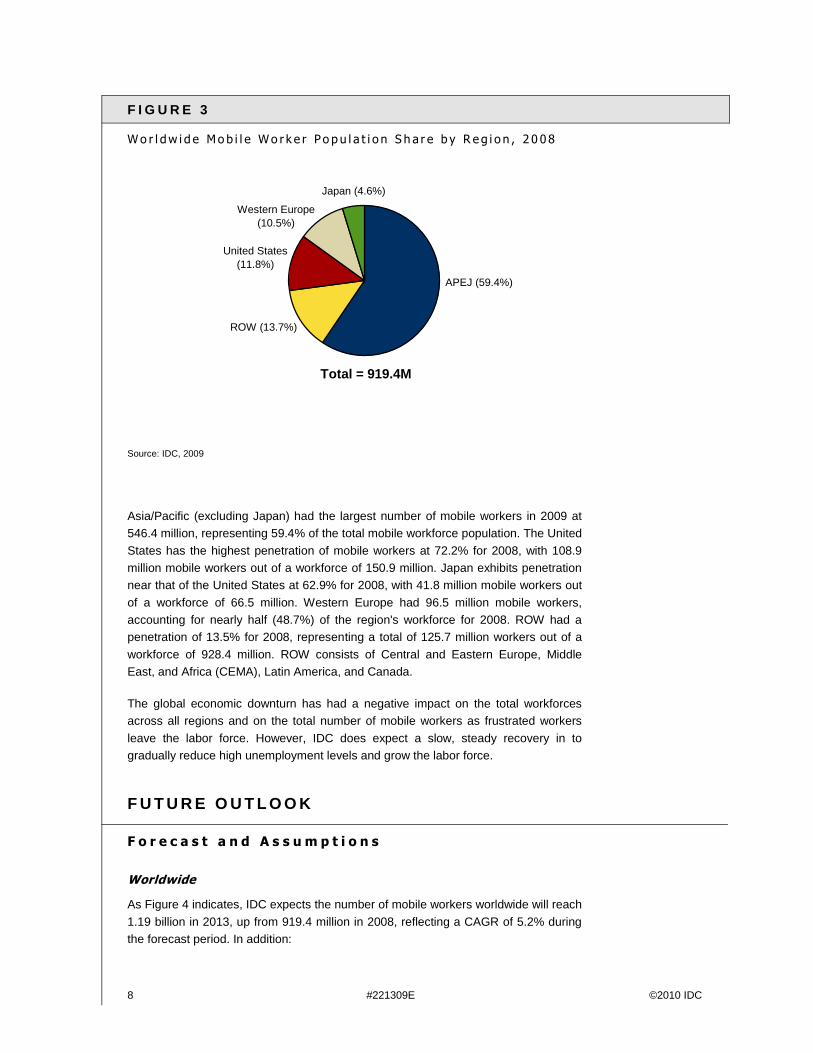
W o r l dw i d e M o b i l e W o r k e r P o p u l a t i o n S h a r e b y R e g i o n , 2 0 0 8
Source: IDC, 2009
Asia/Pacific (excluding Japan) had the largest number of mobile workers in 2009 at
546.4 million, representing 59.4% of the total mobile workforce population. The United
States has the highest penetration of mobile workers at 72.2% for 2008, with 108.9
million mobile workers out of a workforce of 150.9 million. Japan exhibits penetration
near that of the United States at 62.9% for 2008, with 41.8 million mobile workers out
of a workforce of 66.5 million. Western Europe had 96.5 million mobile workers,
accounting for nearly half (48.7%) of the region's workforce for 2008. ROW had a
penetration of 13.5% for 2008, representing a total of 125.7 million workers out of a
workforce of 928.4 million. ROW consists of Central and Eastern Europe, Middle
East, and Africa (CEMA), Latin America, and Canada.
The global economic downturn has had a negative impact on the total workforces
across all regions and on the total number of mobile workers as frustrated workers
leave the labor force. However, IDC does expect a slow, steady recovery in to
gradually reduce high unemployment levels and grow the labor force.
F U T U R E O U T L O O K
F o r e c a s t a n d A s s u m p t i o n s
Worldwide
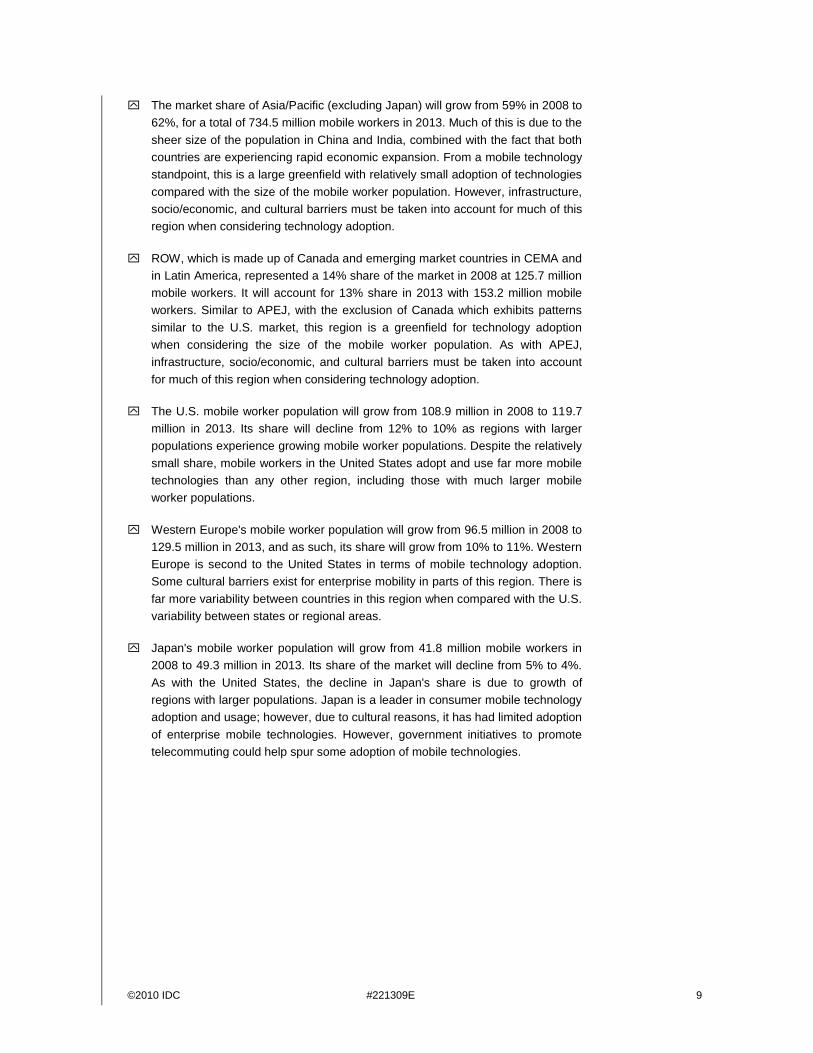
As Figure 4 indicates, IDC expects the number of mobile workers worldwide will reach
1.19 billion in 2013, up from 919.4 million in 2008, reflecting a CAGR of 5.2% during
the forecast period. In addition:
Japan (4.6%)
Western Europe
(10.5%)
United States
(11.8%)
ROW (13.7%)
APEJ (59.4%)
Total = 919.4M
©2010 IDC #221309E 9
The market share of Asia/Pacific (excluding Japan) will grow from 59% in 2008 to
62%, for a total of 734.5 million mobile workers in 2013. Much of this is due to the
sheer size of the population in China and India, combined with the fact that both
countries are experiencing rapid economic expansion. From a mobile technology
standpoint, this is a large greenfield with relatively small adoption of technologies
compared with the size of the mobile worker population. However, infrastructure,
socio/economic, and cultural barriers must be taken into account for much of this
region when considering technology adoption.
ROW, which is made up of Canada and emerging market countries in CEMA and
in Latin America, represented a 14% share of the market in 2008 at 125.7 million
mobile workers. It will account for 13% share in 2013 with 153.2 million mobile
workers. Similar to APEJ, with the exclusion of Canada which exhibits patterns
similar to the U.S. market, this region is a greenfield for technology adoption
when considering the size of the mobile worker population. As with APEJ,
infrastructure, socio/economic, and cultural barriers must be taken into account
for much of this region when considering technology adoption.
The U.S. mobile worker population will grow from 108.9 million in 2008 to 119.7
million in 2013. Its share will decline from 12% to 10% as regions with larger
populations experience growing mobile worker populations. Despite the relatively
small share, mobile workers in the United States adopt and use far more mobile
technologies than any other region, including those with much larger mobile
worker populations.
Western Europe's mobile worker population will grow from 96.5 million in 2008 to
129.5 million in 2013, and as such, its share will grow from 10% to 11%. Western
Europe is second to the United States in terms of mobile technology adoption.
Some cultural barriers exist for enterprise mobility in parts of this region. There is
far more variability between countries in this region when compared with the U.S.
variability between states or regional areas.
Japan's mobile worker population will grow from 41.8 million mobile workers in
2008 to 49.3 million in 2013. Its share of the market will decline from 5% to 4%.
As with the United States, the decline in Japan's share is due to growth of
regions with larger populations. Japan is a leader in consumer mobile technology
adoption and usage; however, due to cultural reasons, it has had limited adoption
of enterprise mobile technologies. However, government initiatives to promote
telecommuting could help spur some adoption of mobile technologies.
10 #221309E ©2010 IDC
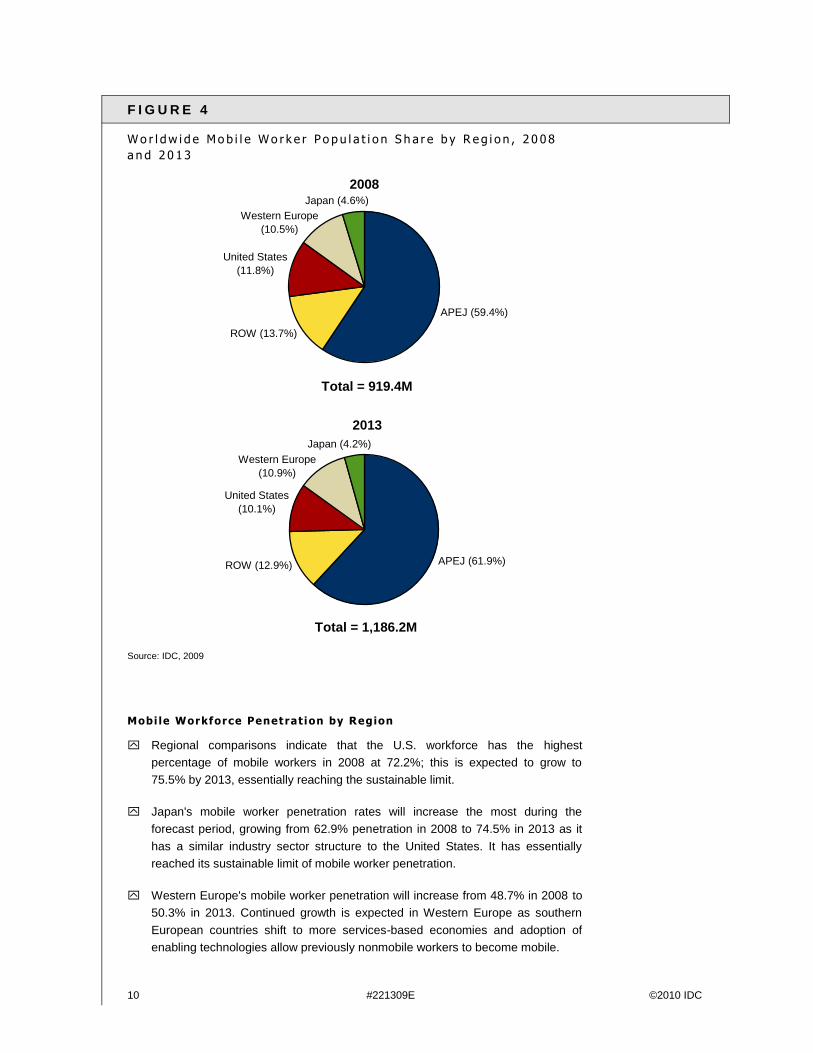
F I G U R E 4
W o r l dw i d e M o b i l e W o r k e r P o p u l a t i o n S h a r e b y R e g i o n , 2 0 0 8
a n d 2 0 1 3
Source: IDC, 2009
Mobi le Workforce Penetrat ion by Region
Regional comparisons indicate that the U.S. workforce has the highest
percentage of mobile workers in 2008 at 72.2%; this is expected to grow to
75.5% by 2013, essentially reaching the sustainable limit.
Japan's mobile worker penetration rates will increase the most during the
forecast period, growing from 62.9% penetration in 2008 to 74.5% in 2013 as it
has a similar industry sector structure to the United States. It has essentially
reached its sustainable limit of mobile worker penetration.
Western Europe's mobile worker penetration will increase from 48.7% in 2008 to
50.3% in 2013. Continued growth is expected in Western Europe as southern
European countries shift to more services-based economies and adoption of
enabling technologies allow previously nonmobile workers to become mobile.
2008Japan (4.6%)
Western Europe
(10.5%)
United States
(11.8%)
ROW (13.7%)
APEJ (59.4%)
Total = 919.4M
2013
Japan (4.2%)
Western Europe
(10.9%)
United States
(10.1%)
ROW (12.9%) APEJ (61.9%)
Total = 1,186.2M
©2010 IDC #221309E 11
The penetration of mobile workers in Asia/Pacific (excluding Japan) will grow
from 30.2% in 2008 to 37.4% in 2013. The relatively low penetration compared
with some other regions is offset by the sheer size of the workforce and the size
of the mobile workforce. A good deal of growth potential still exists, though
structural barriers do exist.
The mobile worker penetration for ROW was 13.5% in 2008, and it will grow to
15.4% in 2013. As with APEJ, the low percentage is nullified by the large relative
size of the workforce. A good deal of growth potential still exists, though
structural barriers do exist.
M a r k e t C o n t e x t
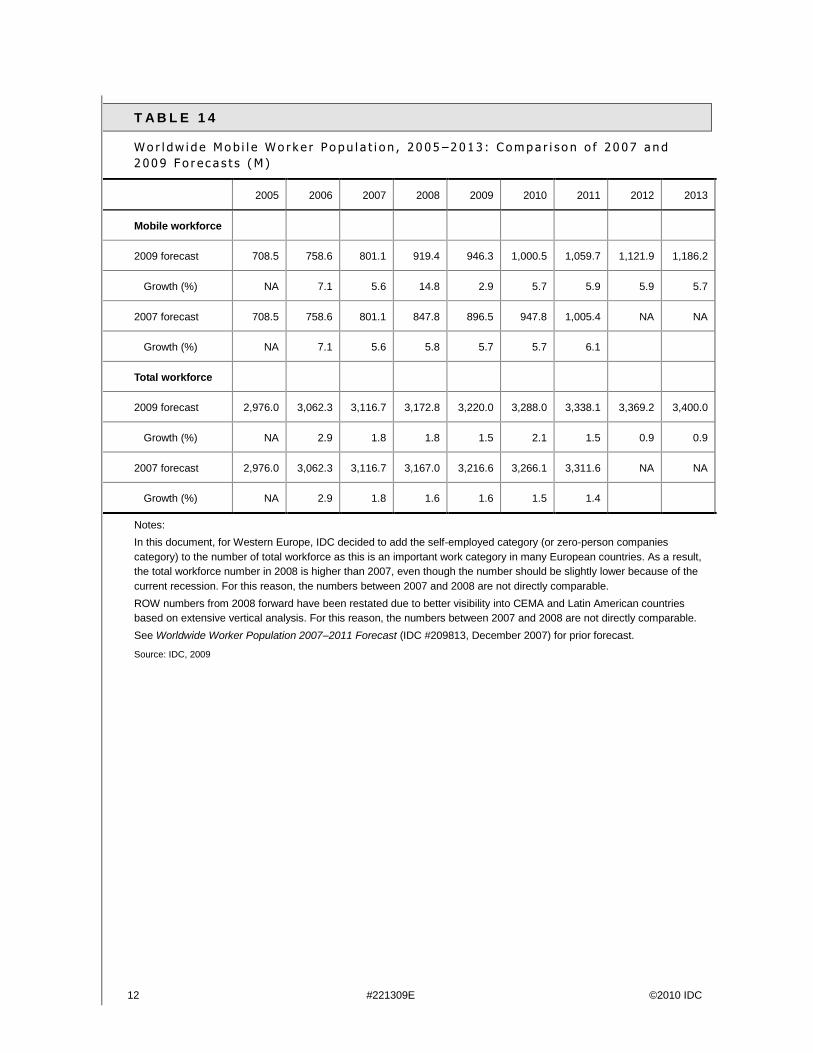
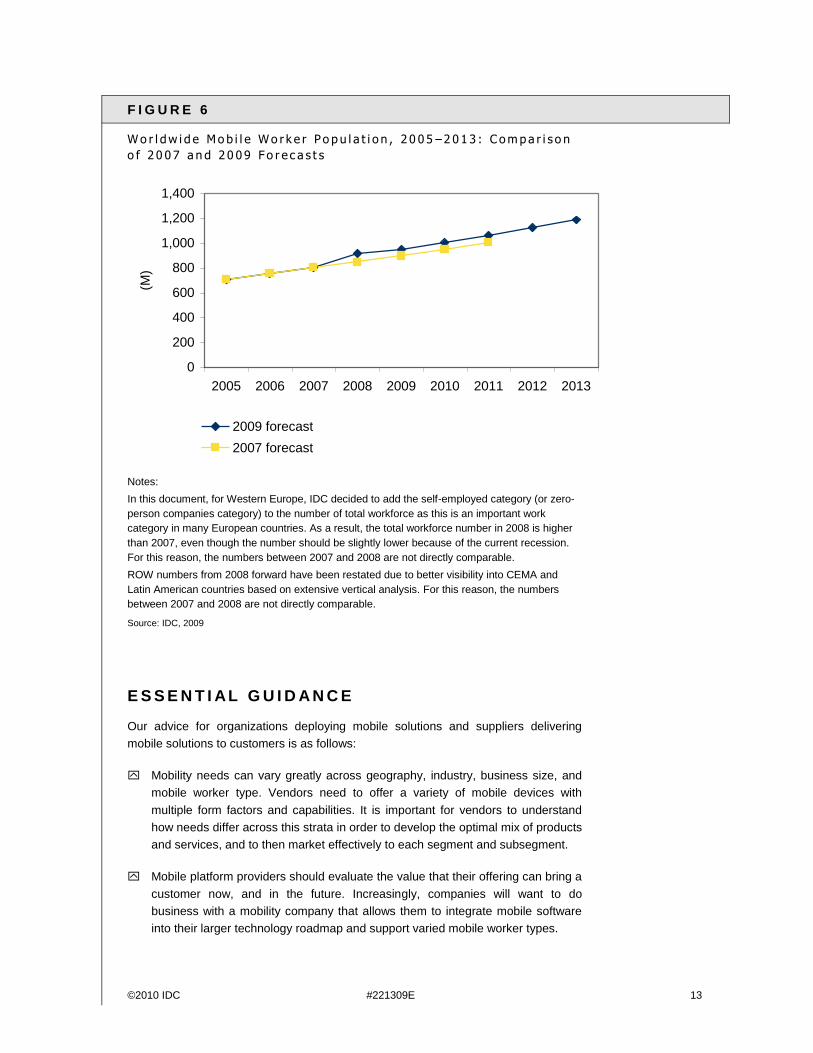
Table 14 provides a comparison of our 2007 (see Worldwide Mobile Worker
Population 2007–2011 Forecast, IDC #209813, December 2007) and 2009 forecasts.
This is further illustrated in Figure 6. The current forecast is revised slightly upward
due to a change in counting for Western Europe to include "zero person companies,"
with only a principal owner and no employees, and due to better visibility into ROW,
particularly certain countries in CEMA and Latin America. Furthermore, the pace of
innovation, increasing demands for business response time, and a growing
acceptance of businesses to incorporate mobility all act as drivers for mobility in the
workplace. However, barriers to the adoption of mobility/remote work into businesses
still exists. Barriers include cultural resistance, the cost-prohibitive nature of wireless
solutions, security risks, and global macroeconomic risks. Furthermore, the global
economic crisis has had a negative impact on the overall global workforce and on the
mobile workforce as well.
12 #221309E ©2010 IDC
T A B L E 1 4
W o r l dw i d e M o b i l e W o r k e r P o p u l a t i o n , 2 0 0 5 –2 0 1 3 : C o m p a r i s o n o f 2 0 0 7 a n d
2 0 0 9 F o r e c a s t s ( M )
2005 2006 2007 2008 2009 2010 2011 2012 2013
Mobile workforce
2009 forecast 708.5 758.6 801.1 919.4 946.3 1,000.5 1,059.7 1,121.9 1,186.2
Growth (%) NA 7.1 5.6 14.8 2.9 5.7 5.9 5.9 5.7
2007 forecast 708.5 758.6 801.1 847.8 896.5 947.8 1,005.4 NA NA
Growth (%) NA 7.1 5.6 5.8 5.7 5.7 6.1
Total workforce
2009 forecast 2,976.0 3,062.3 3,116.7 3,172.8 3,220.0 3,288.0 3,338.1 3,369.2 3,400.0
Growth (%) NA 2.9 1.8 1.8 1.5 2.1 1.5 0.9 0.9
2007 forecast 2,976.0 3,062.3 3,116.7 3,167.0 3,216.6 3,266.1 3,311.6 NA NA
Growth (%) NA 2.9 1.8 1.6 1.6 1.5 1.4
Notes:
In this document, for Western Europe, IDC decided to add the self-employed category (or zero-person companies
category) to the number of total workforce as this is an important work category in many European countries. As a result,
the total workforce number in 2008 is higher than 2007, even though the number should be slightly lower because of the
current recession. For this reason, the numbers between 2007 and 2008 are not directly comparable.
ROW numbers from 2008 forward have been restated due to better visibility into CEMA and Latin American countries
based on extensive vertical analysis. For this reason, the numbers between 2007 and 2008 are not directly comparable.
See Worldwide Worker Population 2007–2011 Forecast (IDC #209813, December 2007) for prior forecast.
Source: IDC, 2009
©2010 IDC #221309E 13
F I G U R E 6
W o r l dw i d e M o b i l e W o r k e r P o p u l a t i o n , 2 0 0 5 –2 0 1 3 : C o m p a r i s o n
o f 2 0 0 7 a n d 2 0 0 9 F o r e c a s t s
Notes:
In this document, for Western Europe, IDC decided to add the self-employed category (or zero-
person companies category) to the number of total workforce as this is an important work
category in many European countries. As a result, the total workforce number in 2008 is higher
than 2007, even though the number should be slightly lower because of the current recession.
For this reason, the numbers between 2007 and 2008 are not directly comparable.
ROW numbers from 2008 forward have been restated due to better visibility into CEMA and
Latin American countries based on extensive vertical analysis. For this reason, the numbers
between 2007 and 2008 are not directly comparable.
Source: IDC, 2009
E S S E N T I AL G U I D A N C E
Our advice for organizations deploying mobile solutions and suppliers delivering
mobile solutions to customers is as follows:
Mobility needs can vary greatly across geography, industry, business size, and
mobile worker type. Vendors need to offer a variety of mobile devices with
multiple form factors and capabilities. It is important for vendors to understand
how needs differ across this strata in order to develop the optimal mix of products
and services, and to then market effectively to each segment and subsegment.
Mobile platform providers should evaluate the value that their offering can bring a
customer now, and in the future. Increasingly, companies will want to do
business with a mobility company that allows them to integrate mobile software
into their larger technology roadmap and support varied mobile worker types.
0
200
400
600
800
1,000
1,200
1,400
2005 2006 2007 2008 2009 2010 2011 2012 2013
(M)
2009 forecast
2007 forecast
14 #221309E ©2010 IDC
Resistance to working remotely can come from employees with concerns over
the boundaries of their personal time being compromised. It can also come from
employers concerned over employee abuses of working remotely in the form of
personal calls from the corporate mobile phone or reduced productivity combined
with less time in the office. Provided that clear expectations and a "contract"
between employer and employee is set, these concerns can be overcome and
abuses from either side can be mitigated.
Although mobility deployments can bring a number of benefits to a company, it
also needs to be aware of the risks inherent in allowing sensitive data to sit on
small devices that can be easily lost. Developing a plan around managing and
securing devices should be part of a larger mobility deployment.
Mobile solutions must align with the long-term mobility strategies of enterprises,
and allow for easy migration to new mobile platforms as well as support for
multiple platforms and form factors.
L E AR N M O R E
R e l a t e d R e s e a r c h
Worldwide Remote Access Software Services 2009–2013 Forecast (IDC
#221095, December 2009)
Worldwide Clientless Remote Support Software 2009–2013 Forecast and
Analysis (IDC #220601, December 2009)
Enterprise Mobility in the Cloud (IDC #220192, October 2009)
The State of Mobile Enterprise Software in 2009: An IDC Survey of Applications
and Platforms — Decisions and Deployments (IDC #219600, August 2009)
Worldwide Mobile Middleware 2009–2013 Forecast and 2008 Vendor Shares
(IDC #219186, July 2009)
Worldwide Mobile Device Management Enterprise 2009–2013 Forecast and
2008 Vendor Shares (IDC #218680, June 2009)
S y n o p s i s
This IDC study provides a worldwide five-year mobile worker population forecast
through 2013 and analysis across three major worker categories and 13
subcategories in five regions: the United States, Western Europe, Asia/Pacific
(excluding Japan), Japan, and the rest of the world (ROW).
"As mobility continues to play a key role in enabling companies to achieve greater
productivity worldwide, IDC expects the global mobile worker population to increase
from 919.4 million in 2008 to more than 1.19 billion in 2013, representing nearly 35%
of the worldwide workforce," said Sean Ryan, research analyst for IDC's Mobile
Enterprise group.
©2010 IDC #221309E 15
C o p y r i g h t N o t i c e
This IDC research document was published as part of an IDC continuous intelligence
service, providing written research, analyst interactions, telebriefings, and
conferences. Visit www.idc.com to learn more about IDC subscription and consulting
services. To view a list of IDC offices worldwide, visit www.idc.com/offices. Please
contact the IDC Hotline at 800.343.4952, ext. 7988 (or +1.508.988.7988) or
[email protected] for information on applying the price of this document toward the
purchase of an IDC service or for information on additional copies or Web rights.
Copyright 2010 IDC. Reproduction is forbidden unless authorized. All rights reserved.