Embed Size (px)
Citation preview
© Renub Research Page 1 of 21
Influenza Vaccines Market & Forecast -
Worldwide Analysis
Renub Researchwww.renub.com
Published: November, 2014Copyright © 2014 Renub Research – All Rights Reserved
United States…Japan…China…IndiaBrazil…Netherlands…Germany…FranceItaly…Spain…Denmark…Sweden…PortugalLuxembourg…Lithuania…United KingdomPoland…Norway…Romania…EstoniaFinland…Hungary…Ireland…IcelandLatvia…Malta…Slovakia…SloveniaNew Zealand…Australia
© Renub Research Page 2 of 21
Influenza Vaccines Market Analysis
The Influenza vaccines market represent an attractive market characterize by sturdy growth
prospects. Increasing awareness, growing vaccination coverage in the emerging countries,
rising government support for immunization against Seasonal Influenza and increased focus on
the production of treatments for vulnerable populations by introducing new vaccines and
vaccines with a better route of administration are the main drivers to galvanized Influenza
vaccines market.
Seasonal Influenza vaccines market has Billions US$ market in 2013. Seasonal Influenza
vaccines market is expected to grow with double digit percentage from 2013 to 2019. On the
other hand, H1N1 Influenza vaccines market has seen tremendous growth during 2009 and 2010
primarily driven by the global spread of H1N1 Influenza virus. However, strong demand of
Influenza vaccines contracted in 2011 by more than 50% due to waning threat of swine flu
epidemic.
United States remains the largest market for Seasonal Influenza vaccines. Japan and emerging
countries like China, India and Brazil is likely to drive Influenza vaccines markets in the next 5
to 6 years. Netherlands and United Kingdom have achieved greater vaccinations coverage.
In the major Seasonal Influenza vaccines sales segment, Fluzone (Sanofi Pasteur) has the
highest sales figures and likely to maintain leadership position in the Seasonal Influenza
vaccines market.
Renub Research study titled “Influenza Vaccines Market & Forecast - Worldwide
Analysis” provides a comprehensive assessment of the fast-evolving, high-growth of World
Influenza Vaccines Landscape. This 179 page report with 140 Figures and 7 Tables examines
the following segments for Influenza Vaccines Market
Worldwide Influenza vaccines market (2009 - 2019)
Worldwide Seasonal Influenza vaccines market has been covered from (2009 – 2019)
© Renub Research Page 3 of 21
Worldwide Swine Flu (H1N1) Influenza vaccines market has been covered from (2009 –
2011)
Worldwide number of persons being vaccinated with Seasonal Influenza vaccines (2009 -
2019)
Top 30 countries number of persons being vaccinated with Seasonal Influenza vaccines
(2009 - 2019)
Top 30 countries Seasonal Influenza vaccines market (2008 – 2019)
Top Brands Seasonal Influenza vaccines (Fluarix/Flulaval, Afluria/Fluvax,
FluMist/Fluenz, Influvac, Fluvirin / Flucelvax, Fluzone) Sales Performance & Forecast
Top Merger & Acquisition deals in Influenza Vaccines Market
Key drivers of growth in the Worldwide Influenza Vaccines Market
Key challenges faces by Influenza Vaccines Market All the 30 Countries Studied in the Report are as Follows
1. United States
2. Japan
3. China
4. India
5. Brazil
6. Netherlands
7. Germany
8. France
9. Italy
10. Spain
11. Denmark
12. Sweden
13. Portugal
14. Luxembourg
15. Lithuania
16. United Kingdom
17. Poland
18. Norway
19. Romania
20. Estonia
21. Finland
22. Hungary
23. Ireland
24. Iceland
25. Latvia
26. Malta
27. Slovakia
28. Slovenia
29. Australia
30. New Zealand
© Renub Research Page 4 of 21
Top 6 Seasonal Influenza Vaccines Sales Performance Studied in the Report are as Follows
1. Fluarix / Flulaval
2. Afluria/Fluvax
3. FluMist/Fluenz
4. Influvac
5. Fluvirin / Flucelvax
6. Fluzone
Data Sources
This report is built using data and information sourced from proprietary databases, primary and
secondary research and in-house analysis by Renub Research team of industry experts. Primary
sources include industry surveys and telephone interviews with industry experts.
Secondary sources information and data has been collected from various printable and non-
printable sources like search engines, News websites, Government Websites, Trade Journals,
White papers, Government Agencies, Magazines, Newspapers, Trade associations, Books,
Industry Portals, Industry Associations and access to more than 500 paid databases.
© Renub Research Page 5 of 21
About Us
RReennuubb RReesseeaarrcchh is a leading Market Research and Information Analysis Company with
centers at Noida India and Roswell USA. We have long-term experience especially in
international Business-to-Business Researches, Surveys, Business and Consulting. Throughout
the years we have acquired expertise in most market sectors, including Information Technology
(IT), Telecoms, Life Sciences, Medical & Pharmaceuticals, Financial Services (Banking,
Insurance, Reinsurance, M&A, etc.), Energy, Chemicals, Automotive, Retail, FMCG, Consumer
Goods, Logistics, Governmental, Social, and Others.
Our core team is comprised of an experienced people holding graduate, post graduate and
Ph.D. degrees in Finance, Marketing, Human Resource, Bio-Technology, Medicine, Information
Technology, Environmental Science and many more. Our research help make the business
decisions: on strategy, organization, operations, technology, mergers & acquisitions etc. We
support many blue chip companies by providing them findings and perspectives across a wide
range of markets. Our research reports offer a blend of information insight, analysis and
forecasting that is essential in today’s ultra-competitive markets.
For more information on us or to view any of our sample work you can mail
us at [email protected]
© Renub Research Page 6 of 21
Published
By
RReennuubb RReesseeaarrcchh
1st Floor,
C-86, Sector–10
Noida – 201301
Phone: +91-120-421-9822, 254-5750 (India)
+1-678-302-0700 (USA)
Fax : +91-120-424-9780
Email: [email protected]
www.renub.com
© Influenza Vaccines Market & Forecast – Worldwide Analysis
Renub Research, 2014
Edition 1.0
All rights reserved. This publication is protected
by copyright. No part of it may be reproduced, stored
in a retrieval system or transmitted, in any form or by
any means, electronic mechanical, photocopying,
recording or otherwise without the prior written
permission of the publishers
© Renub Research Page 7 of 21
Table of Contents
1. Executive Summary
2. Worldwide Influenza Vaccines Market & Forecast
2.1 Worldwide – Number of Persons Being Vaccinated with Seasonal Influenza Vaccines
2.2 Merger and Acquisition in Influenza Vaccines Market
3. Worldwide – Seasonal Influenza Vaccines Market & Forecast
4. Worldwide – Swine Flu (H1N1) Influenza Vaccines Market
5. Worldwide Influenza Vaccines Market Share & Forecast
5.1 Segment wise – Influenza Vaccines Market Share & Forecast
5.2 Countries wise – Percentage of Persons Being Vaccinated with Seasonal Influenza Vaccines
Share & Forecast
5.3 Countries wise – Seasonal Influenza Vaccines Market Share & Forecast
6. Geographical Segmentation – Seasonal Influenza Vaccines Market & Vaccination Coverage
(2008 – 2019)
6.1 United States
6.1.1 United States – Number of Persons Being Vaccinated with Seasonal Influenza Vaccines
6.1.2 United States – Seasonal Influenza Vaccines Market & Forecast
6.2 Japan
6.2.1 Japan – Number of Persons Being Vaccinated with Seasonal Influenza Vaccines
6.2.2 Japan – Seasonal Influenza Vaccines Market & Forecast
6.3 China
6.3.1 China – Number of Persons Being Vaccinated with Seasonal Influenza Vaccines
6.3.2 China – Seasonal Influenza Vaccines Market & Forecast
6.4 India
6.4.1 India – Number of Persons Being Vaccinated with Seasonal Influenza Vaccines
6.4.2 India – Seasonal Influenza Vaccines Market & Forecast
6.5 Brazil
6.5.1 Brazil – Number of Persons Being Vaccinated with Seasonal Influenza Vaccines
6.5.2 Brazil – Seasonal Influenza Vaccines Market & Forecast
6.6 Netherlands
© Renub Research Page 8 of 21
6.6.1 Netherlands – Number of Persons Being Vaccinated with Seasonal Influenza Vaccines
6.6.2 Netherlands – Seasonal Influenza Vaccines Market & Forecast
6.7 Germany
6.7.1 Germany – Number of Persons Being Vaccinated with Seasonal Influenza Vaccines
6.7.2 Germany – Seasonal Influenza Vaccines Market & Forecast
6.8 France
6.8.1 France – Number of Persons Being Vaccinated with Seasonal Influenza Vaccines
6.8.2 France – Seasonal Influenza Vaccines Market & Forecast
6.9 Italy
6.9.1 Italy – Number of Persons Being Vaccinated with Seasonal Influenza Vaccines
6.9.2 Italy – Seasonal Influenza Vaccines Market & Forecast
6.10 Spain
6.10.1 Spain – Number of Persons Being Vaccinated with Seasonal Influenza Vaccines
6.10.2 Spain – Seasonal Influenza Vaccines Market & Forecast
6.11 Denmark
6.11.1 Denmark – Number of Persons Being Vaccinated with Seasonal Influenza Vaccines
6.11.2 Denmark – Seasonal Influenza Vaccines Market & Forecast
6.12 Sweden
6.12.1 Sweden – Number of Persons Being Vaccinated with Seasonal Influenza Vaccines
6.12.2 Sweden – Seasonal Influenza Vaccines Market & Forecast
6.13 Portugal
6.13.1 Portugal – Number of Persons Being Vaccinated with Seasonal Influenza Vaccines
6.13.2 Portugal – Seasonal Influenza Vaccines Market & Forecast
6.14 Luxembourg
6.14.1 Luxembourg – Number of Persons Being Vaccinated with Seasonal Influenza Vaccines
6.14.2 Luxembourg – Seasonal Influenza Vaccines Market & Forecast
6.15 Lithuania
6.15.1 Lithuania – Number of Persons Being Vaccinated with Seasonal Influenza Vaccines
6.15.2 Lithuania – Seasonal Influenza Vaccines Market & Forecast
6.16 United Kingdom
6.16.1 United Kingdom – Number of Persons Being Vaccinated with Seasonal Influenza Vaccines
6.16.2 United Kingdom – Seasonal Influenza Vaccines Market & Forecast
6.17 Poland
6.17.1 Poland – Number of Persons Being Vaccinated with Seasonal Influenza Vaccines
© Renub Research Page 9 of 21
6.17.2 Poland – Seasonal Influenza Vaccines Market & Forecast
6.18 Norway
6.18.1 Norway – Number of Persons Being Vaccinated with Seasonal Influenza Vaccines
6.18.2 Norway – Seasonal Influenza Vaccines Market & Forecast
6.19 Romania
6.19.1 Romania – Number of Persons Being Vaccinated with Seasonal Influenza Vaccines
6.19.2 Romania – Seasonal Influenza Vaccines Market & Forecast
6.20 Estonia
6.20.1 Estonia – Number of Persons Being Vaccinated with Seasonal Influenza Vaccines
6.20.2 Estonia – Seasonal Influenza Vaccines Market & Forecast
6.21 Finland
6.21.1 Finland – Number of Persons Being Vaccinated with Seasonal Influenza Vaccines
6.21.2 Finland – Seasonal Influenza Vaccines Market & Forecast
6.22 Hungary
6.22.1 Hungary – Number of Persons Being Vaccinated with Seasonal Influenza Vaccines
6.22.2 Hungary – Seasonal Influenza Vaccines Market & Forecast
6.23 Ireland
6.23.1 Ireland – Number of Persons Being Vaccinated with Seasonal Influenza Vaccines
6.23.2 Ireland – Seasonal Influenza Vaccines Market & Forecast
6.24 Iceland
6.24.1 Iceland – Number of Persons Being Vaccinated with Seasonal Influenza Vaccines
6.24.2 Iceland – Seasonal Influenza Vaccines Market & Forecast
6.25 Latvia
6.25.1 Latvia – Number of Persons Being Vaccinated with Seasonal Influenza Vaccines
6.25.2 Latvia – Seasonal Influenza Vaccines Market & Forecast
6.26 Malta
6.26.1 Malta – Number of Persons Being Vaccinated with Seasonal Influenza Vaccines
6.26.2 Malta – Seasonal Influenza Vaccines Market & Forecast
6.27 Slovakia
6.27.1 Slovakia – Number of Persons Being Vaccinated with Seasonal Influenza Vaccines
6.27.2 Slovakia – Seasonal Influenza Vaccines Market & Forecast
6.28 Slovenia
6.28.1 Slovenia – Number of Persons Being Vaccinated with Seasonal Influenza Vaccines
6.28.2 Slovenia – Seasonal Influenza Vaccines Market & Forecast
© Renub Research Page 10 of 21
6.29 Australia
6.29.1 Australia – Number of Persons Being Vaccinated with Seasonal Influenza Vaccines
6.29.2 Australia – Seasonal Influenza Vaccines Market & Forecast
6.30 New Zealand
6.30.1 New Zealand – Number of Persons Being Vaccinated with Seasonal Influenza Vaccines
6.30.2 New Zealand – Seasonal Influenza Vaccines Market & Forecast
7. Worldwide – Seasonal Influenza Vaccine Brand Sales & Forecast
7.1 Fluarix / Flulaval – Sales Performance & Forecast
7.2 Afluria/Fluvax – Sales Performance & Forecast
7.3 FluMist/Fluenz – Sales Performance & Forecast
7.4 Influvac (Now Acquired by Abbott) – Sales Performance & Forecast
7.5 Fluvirin / Flucelvax – Sales Performance & Forecast
7.6 Fluzone – Sales Performance & Forecast
8. Growth Drivers in the Influenza Vaccines Market
8.1 Transforming Vaccine Technologies
8.2 Continuous Focus on Effective Communication Strategies
8.3 Vaccines most Cost Effective Means of Disease Prevention
8.4 Scientific & Technological Breakthroughs
8.5 Promote Education, Training, & Information exchange on Seasonal Influenza & Vaccination in
European Countries
9. Challenges for Influenza Vaccine Market
9.1 Obstacle to Best Possible use of Licensed Vaccines
9.1.1 Economic Obstacles
9.1.2 Technical Obstacles
9.1.3 Cultural Obstacles
9.2 Difficulty of Influenza Vaccine Development & Approval System
9.2.1 General Technical Barriers
9.2.2 Economic Barriers
9.2.3 Legal Barriers
9.2.4 Regulatory Barriers
9.3 Reducing the Timeline for Vaccine Development
© Renub Research Page 11 of 21
9.4 Problem Faced by Healthcare Workers in Immunization
© Renub Research Page 12 of 21
List of Figures
Figure 2-1: Worldwide – Influenza Vaccines Market (Million US$), 2009 – 2013
Figure 2-2: Worldwide – Forecast for Influenza Vaccines Market (Million US$), 2014 – 2019
Figure 2-3: Worldwide – Number of Persons Being Vaccinated with Seasonal Influenza Vaccines (Million),
2009 – 2013
Figure 2-4: Worldwide – Forecast for Number of Persons Being Vaccinated with Seasonal Influenza
Vaccines (Million), 2014 – 2019
Figure 3-1: Worldwide – Seasonal Influenza Vaccines Market (Million US$), 2009 – 2013
Figure 3-2: Worldwide – Forecast for Seasonal Influenza Vaccines Market (Million US$), 2014 – 2019
Figure 4-1: Worldwide – Swine Flu (H1N1) Influenza Vaccines Market (Million US$), 2009 – 2011
Figure 5-1: Segment wise – Influenza Vaccines Market Share (Percent), 2009 – 2013
Figure 5-2: Segment wise – Forecast for Influenza Vaccines Market Share (Percent), 2014 – 2019
Figure 6-1: United States – Number of Persons Being Vaccinated with Seasonal Influenza Vaccines
(Thousand), 2009 – 2013
Figure 6-2: United States – Forecast for Number of Persons Being Vaccinated with Seasonal Influenza
Vaccines (Thousand), 2014 – 2019
Figure 6-3: United States – Seasonal Influenza Vaccines Market (Million US$), 2009 – 2013
Figure 6-4: United States – Forecast for Seasonal Influenza Vaccines Market (Million US$), 2014 – 2019
Figure 6-5: Japan – Number of Persons Being Vaccinated with Seasonal Influenza Vaccines (Thousand),
2008 – 2013
Figure 6-6: Japan – Forecast for Number of Persons Being Vaccinated with Seasonal Influenza Vaccines
(Thousand), 2014 – 2019
Figure 6-7: Japan – Seasonal Influenza Vaccines Market (Million US$), 2008 – 2013
Figure 6-8: Japan – Forecast for Seasonal Influenza Vaccines Market (Million US$), 2014 – 2019
Figure 6-9: China – Number of Persons Being Vaccinated with Seasonal Influenza Vaccines (Thousand),
2008–2013
Figure 6-10: China – Forecast for Number of Persons Being Vaccinated with Seasonal Influenza Vaccines
(Thousand), 2014 – 2019
Figure 6-11: China – Seasonal Influenza Vaccines Market (Million US$), 2008 – 2013
Figure 6-12: China – Forecast for Seasonal Influenza Vaccines Market (Million US$), 2014 – 2019
Figure 6-13: India – Number of Persons Being Vaccinated with Seasonal Influenza Vaccines (Thousand),
2008 – 2013
Figure 6-14: India – Forecast for Number of Persons Being Vaccinated with Seasonal Influenza Vaccines
(Thousand), 2014 – 2019
Figure 6-15: India – Seasonal Influenza Vaccines Market (Million US$), 2008 – 2013
Figure 6-16: India – Forecast for Seasonal Influenza Vaccines Market (Million US$), 2014 – 2019
© Renub Research Page 13 of 21
Figure 6-17: Brazil – Number of Persons Being Vaccinated with Seasonal Influenza Vaccines (Thousand),
2008 – 2013
Figure 6-18: Brazil – Forecast for Number of Persons Being Vaccinated with Seasonal Influenza Vaccines
(Thousand), 2014 – 2019
Figure 6-19: Brazil – Seasonal Influenza Vaccines Market (Million US$), 2008 – 2013
Figure 6-20: Brazil – Forecast for Seasonal Influenza Vaccines Market (Million US$), 2014 – 2019
Figure 6-21: Netherlands – Number of Persons Being Vaccinated with Seasonal Influenza Vaccines
(Thousand), 2008 – 2013
Figure 6-22: Netherlands – Forecast for Number of Persons Being Vaccinated with Seasonal Influenza
Vaccines (Thousand), 2014 – 2019
Figure 6-23: Netherlands – Seasonal Influenza Vaccines Market (Million US$), 2008 – 2013
Figure 6-24: Netherlands – Forecast for Seasonal Influenza Vaccines Market (Million US$), 2014 – 2019
Figure 6-25: Germany – Number of Persons Being Vaccinated with Seasonal Influenza Vaccines
(Thousand), 2008 – 2013
Figure 6-26: Germany – Forecast for Number of Persons Being Vaccinated with Seasonal Influenza
Vaccines (Thousand), 2014 – 2019
Figure 6-27: Germany – Seasonal Influenza Vaccines Market (Million US$), 2008 – 2013
Figure 6-28: Germany – Forecast for Seasonal Influenza Vaccines Market (Million US$), 2014 – 2019
Figure 6-29: France – Number of Persons Being Vaccinated with Seasonal Influenza Vaccines
(Thousand), 2008 – 2013
Figure 6-30: France – Forecast for Number of Persons Being Vaccinated with Seasonal Influenza Vaccines
(Thousand), 2014 – 2019
Figure 6-31: France – Seasonal Influenza Vaccines Market (Million US$), 2008 – 2013
Figure 6-32: France – Forecast for Seasonal Influenza Vaccines Market (Million US$), 2014 – 2019
Figure 6-33: Italy – Number of Persons Being Vaccinated with Seasonal Influenza Vaccines (Thousand),
2008 – 2013
Figure 6-34: Italy – Forecast for Number of Persons Being Vaccinated with Seasonal Influenza Vaccines
(Thousand), 2014 – 2019
Figure 6-35: Italy – Seasonal Influenza Vaccines Market (Million US$), 2008 – 2013
Figure 6-36: Italy – Forecast for Seasonal Influenza Vaccines Market (Million US$), 2014 – 2019
Figure 6-37: Spain – Number of Persons Being Vaccinated with Seasonal Influenza Vaccines (Thousand),
2008 – 2013
Figure 6-38: Spain – Forecast for Number of Persons Being Vaccinated with Seasonal Influenza Vaccines
(Thousand), 2014 – 2019
Figure 6-39: Spain – Seasonal Influenza Vaccines Market (Million US$), 2008 – 2013
Figure 6-40: Spain – Forecast for Seasonal Influenza Vaccines Market (Million US$), 2014 – 2019
© Renub Research Page 14 of 21
Figure 6-41: Denmark – Number of Persons Being Vaccinated with Seasonal Influenza Vaccines
(Thousand), 2008 – 2013
Figure 6-42: Denmark – Forecast for Number of Persons Being Vaccinated with Seasonal Influenza
Vaccines (Thousand), 2014 – 2019
Figure 6-43: Denmark – Seasonal Influenza Vaccines Market (Million US$), 2008 – 2013
Figure 6-44: Denmark – Forecast for Seasonal Influenza Vaccines Market (Million US$), 2014 – 2019
Figure 6-45: Sweden – Number of Persons Being Vaccinated with Seasonal Influenza Vaccines
(Thousand), 2008 – 2013
Figure 6-46: Sweden – Forecast for Number of Persons Being Vaccinated with Seasonal Influenza
Vaccines (Thousand), 2014 – 2019
Figure 6-47: Sweden – Seasonal Influenza Vaccines Market (Million US$), 2008 – 2013
Figure 6-48: Sweden – Forecast for Seasonal Influenza Vaccines Market (Million US$), 2014 – 2019
Figure 6-49: Portugal – Number of Persons Being Vaccinated with Seasonal Influenza Vaccines
(Thousand), 2008 – 2013
Figure 6-50: Portugal – Forecast for Number of Persons Being Vaccinated with Seasonal Influenza
Vaccines (Thousand), 2014 – 2019
Figure 6-51: Portugal – Seasonal Influenza Vaccines Market (Million US$), 2008 – 2013
Figure 6-52: Portugal – Forecast for Seasonal Influenza Vaccines Market (Million US$), 2014 – 2019
Figure 6-53: Luxembourg – Number of Persons Being Vaccinated with Seasonal Influenza Vaccines
(Thousand), 2008 – 2013
Figure 6-54: Luxembourg – Forecast for Number of Persons Being Vaccinated with Seasonal Influenza
Vaccines (Thousand), 2014 – 2019
Figure 6-55: Luxembourg – Seasonal Influenza Vaccines Market (Million US$), 2008 – 2013
Figure 6-56: Luxembourg – Forecast for Seasonal Influenza Vaccines Market (Million US$), 2014 – 2019
Figure 6-57: Lithuania – Number of Persons Being Vaccinated with Seasonal Influenza Vaccines
(Thousand), 2008 – 2013
Figure 6-58: Lithuania – Forecast for Number of Persons Being Vaccinated with Seasonal Influenza
Vaccines (Thousand), 2014 – 2019
Figure 6-59: Lithuania – Seasonal Influenza Vaccines Market (Million US$), 2008 – 2013
Figure 6-60: Lithuania – Forecast for Seasonal Influenza Vaccines Market (Million US$), 2014 – 2019
Figure 6-61: United Kingdom – Number of Persons Being Vaccinated with Seasonal Influenza Vaccines
(Thousand), 2008 – 2013
Figure 6-62: United Kingdom – Forecast for Number of Persons Being Vaccinated with Seasonal Influenza
Vaccines (Thousand), 2014 – 2019
Figure 6-63: United Kingdom – Seasonal Influenza Vaccines Market (Million US$), 2008 – 2013
Figure 6-64: United Kingdom – Forecast for Seasonal Influenza Vaccines Market (Million US$), 2014 –
2019
© Renub Research Page 15 of 21
Figure 6-65: Poland – Number of Persons Being Vaccinated with Seasonal Influenza Vaccines
(Thousand), 2008 – 2013
Figure 6-66: Poland – Forecast for Number of Persons Being Vaccinated with Seasonal Influenza Vaccines
(Thousand), 2014 – 2019
Figure 6-67: Poland – Seasonal Influenza Vaccines Market (Million US$), 2008 – 2013
Figure 6-68: Poland – Forecast for Seasonal Influenza Vaccines Market (Million US$), 2014 – 2019
Figure 6-69: Norway – Number of Persons Being Vaccinated with Seasonal Influenza Vaccines
(Thousand), 2008 – 2013
Figure 6-70: Norway – Forecast for Number of Persons Being Vaccinated with Seasonal Influenza
Vaccines (Thousand), 2014 – 2019
Figure 6-71: Norway – Seasonal Influenza Vaccines Market (Million US$), 2008 – 2013
Figure 6-72: Norway – Forecast for Seasonal Influenza Vaccines Market (Million US$), 2014 – 2019
Figure 6-73: Romania – Number of Persons Being Vaccinated with Seasonal Influenza Vaccines
(Thousand), 2008 – 2013
Figure 6-74: Romania – Forecast for Number of Persons Being Vaccinated with Seasonal Influenza
Vaccines (Thousand), 2014 – 2019
Figure 6-75: Romania – Seasonal Influenza Vaccines Market (Million US$), 2008 – 2013
Figure 6-76: Romania – Forecast for Seasonal Influenza Vaccines Market (Million US$), 2014 – 2019
Figure 6-77: Estonia – Number of Persons Being Vaccinated with Seasonal Influenza Vaccines
(Thousand), 2008 – 2013
Figure 6-78: Estonia – Forecast for Number of Persons Being Vaccinated with Seasonal Influenza
Vaccines (Thousand), 2014 – 2019
Figure 6-79: Estonia – Seasonal Influenza Vaccines Market (Million US$), 2008 – 2013
Figure 6-80: Estonia – Forecast for Seasonal Influenza Vaccines Market (Million US$), 2014 – 2019
Figure 6-81: Finland – Number of Persons Being Vaccinated with Seasonal Influenza Vaccines
(Thousand), 2008 – 2013
Figure 6-82: Finland – Forecast for Number of Persons Being Vaccinated with Seasonal Influenza
Vaccines (Thousand), 2014 – 2019
Figure 6-83: Finland – Seasonal Influenza Vaccines Market (Million US$), 2008 – 2013
Figure 6-84: Finland – Forecast for Seasonal Influenza Vaccines Market (Million US$), 2014 – 2019
Figure 6-85: Hungary – Number of Persons Being Vaccinated with Seasonal Influenza Vaccines
(Thousand), 2008 – 2013
Figure 6-86: Hungary – Forecast for Number of Persons Being Vaccinated with Seasonal Influenza
Vaccines (Thousand), 2014 – 2019
Figure 6-87: Hungary – Seasonal Influenza Vaccines Market (Million US$), 2008 – 2013
Figure 6-88: Hungary – Forecast for Seasonal Influenza Vaccines Market (Million US$), 2014 – 2019
© Renub Research Page 16 of 21
Figure 6-89: Ireland – Number of Persons Being Vaccinated with Seasonal Influenza Vaccines (Thousand),
2008–2013
Figure 6-90: Ireland – Forecast for Number of Persons Being Vaccinated with Seasonal Influenza Vaccines
(Thousand), 2014 – 2019
Figure 6-91: Ireland – Seasonal Influenza Vaccines Market (Million US$), 2008 – 2013
Figure 6-92: Ireland – Forecast for Seasonal Influenza Vaccines Market (Million US$), 2014 – 2019
Figure 6-93: Iceland – Number of Persons Being Vaccinated with Seasonal Influenza Vaccines
(Thousand), 2008 – 2013
Figure 6-94: Iceland – Forecast for Number of Persons Being Vaccinated with Seasonal Influenza
Vaccines (Thousand), 2014 – 2019
Figure 6-95: Iceland – Seasonal Influenza Vaccines Market (Million US$), 2008 – 2013
Figure 6-96: Iceland – Forecast for Seasonal Influenza Vaccines Market (Million US$), 2014 – 2019
Figure 6-97: Latvia – Number of Persons Being Vaccinated with Seasonal Influenza Vaccines (Thousand),
2008 – 2013
Figure 6-98: Latvia – Forecast for Number of Persons Being Vaccinated with Seasonal Influenza Vaccines
(Thousand), 2014 – 2019
Figure 6-99: Latvia – Seasonal Influenza Vaccines Market (Million US$), 2008 – 2013
Figure 6-100: Latvia – Forecast for Seasonal Influenza Vaccines Market (Million US$), 2014 – 2019
Figure 6-101: Malta – Number of Persons Being Vaccinated with Seasonal Influenza Vaccines (Thousand),
2008 – 2013
Figure 6-102: Malta – Forecast for Number of Persons Being Vaccinated with Seasonal Influenza Vaccines
(Thousand), 2014 – 2019
Figure 6-103: Malta – Seasonal Influenza Vaccines Market (Million US$), 2008 – 2013
Figure 6-104: Malta – Forecast for Seasonal Influenza Vaccines Market (Million US$), 2014 – 2019
Figure 6-105: Slovakia – Number of Persons Being Vaccinated with Seasonal Influenza Vaccines
(Thousand), 2008 – 2013
Figure 6-106: Slovakia – Forecast for Number of Persons Being Vaccinated with Seasonal Influenza
Vaccines (Thousand), 2014 – 2019
Figure 6-107: Slovakia – Seasonal Influenza Vaccines Market (Million US$), 2008 – 2013
Figure 6-108: Slovakia – Forecast for Seasonal Influenza Vaccines Market (Million US$), 2014 – 2019
Figure 6-109: Slovenia – Number of Persons Being Vaccinated with Seasonal Influenza Vaccines
(Thousand), 2008 – 2013
Figure 6-110: Slovenia – Forecast for Number of Persons Being Vaccinated with Seasonal Influenza
Vaccines (Thousand), 2014 – 2019
Figure 6-111: Slovenia – Seasonal Influenza Vaccines Market (Million US$), 2008 – 2013
Figure 6-112: Slovenia – Forecast for Seasonal Influenza Vaccines Market (Million US$), 2014 – 2019
© Renub Research Page 17 of 21
Figure 6-113: Australia – Number of Persons Being Vaccinated with Seasonal Influenza Vaccines
(Thousand), 2008 – 2013
Figure 6-114: Australia – Forecast for Number of Persons Being Vaccinated with Seasonal Influenza
Vaccines (Thousand), 2014 – 2019
Figure 6-115: Australia – Seasonal Influenza Vaccines Market (Million US$), 2008 – 2013
Figure 6-116: Australia – Forecast for Seasonal Influenza Vaccines Market (Million US$), 2014 – 2019
Figure 6-117: New Zealand – Number of Persons Being Vaccinated with Seasonal Influenza Vaccines
(Thousand), 2008 – 2013
Figure 6-118: New Zealand – Forecast for Number of Persons Being Vaccinated with Seasonal Influenza
Vaccines (Thousand), 2014 – 2019
Figure 6-119: New Zealand – Seasonal Influenza Vaccines Market (Million US$), 2008 – 2013
Figure 6-120: New Zealand – Forecast for Seasonal Influenza Vaccines Market (Million US$), 2014 – 2019
Figure 7-1: Worldwide – Fluarix / Flulaval Seasonal Influenza Vaccine Sales (Million US$), 2007 – 2013
Figure 7-2: Worldwide – Forecast for Fluarix / Flulaval Seasonal Influenza Vaccine Sales (Million US$),
2014 – 2019
Figure 7-3: Worldwide – Afluria/Fluvax Seasonal Influenza Vaccine Sales (Million US$), 2010 – 2013
Figure 7-4: Worldwide – Forecast for Afluria/Fluvax Seasonal Influenza Vaccine Sales (Million US$), 2014
– 2019
Figure 7-5: Worldwide – Flumist/ Fluenz Seasonal Infuenza Vaccine Sales (Million US$), 2009 – 2013
Figure 7-6: Worldwide – Forecast for Flumist/Fluenz Seasonal Influenza Vaccine Sales (Million US$), 2014
– 2019
Figure 7-7: Worldwide – Influvac Seasonal Infuenza Vaccine Sales (Million US$), 2007 – 2009
Figure 7-8: Worldwide – Fluvirin/Flucelvax Seasonal Infuenza Vaccine Sales (Million US$), 2010 – 2013
Figure 7-9: Worldwide – Forecast for Fluvirin/Flucelvax Seasonal Infuenza Vaccine Sales (Million US$),
2014 – 2019
Figure 7-10: Worldwide – Fluzone Seasonal Infuenza Vaccine Sales (Million US$), 2009 – 2013
Figure 7-11: Worldwide – Forecast for Fluzone Seasonal Infuenza Vaccine Sales (Million US$), 2014 –
2019
© Renub Research Page 18 of 21
List of Tables
Table 2-1: Worldwide – Merger and Acquisition in Influenza Vaccines Market (Million US$), 2005 – 2011
Table 5-1: Countries wise – Percentage of Persons Being Vaccinated with Seasonal Influenza Vaccines
Share (Percent), 2009 – 2013
Table 5-2: Countries wise – Forecast for Percentage of Persons Being Vaccinated with Seasonal Influenza
Vaccines Share (Percent), 2014 – 2019
Table 5-3: Countries wise – Seasonal Influenza Vaccines Market Share (Percent), 2009 – 2013
Table 5-4: Countries wise – Forecast for Seasonal Influenza Vaccines Market Share (Percent), 2014 –
2019
Table 8-1: Improvement Strategies or Requirements – the Joint Commission and the Project’s
Collaborating Organizations
Table 8-2: Initiatives Taken in Communication, Education, Training & Information Exchange Related to
Seasonal Influenza in European Countries, 2009
© Renub Research Page 19 of 21
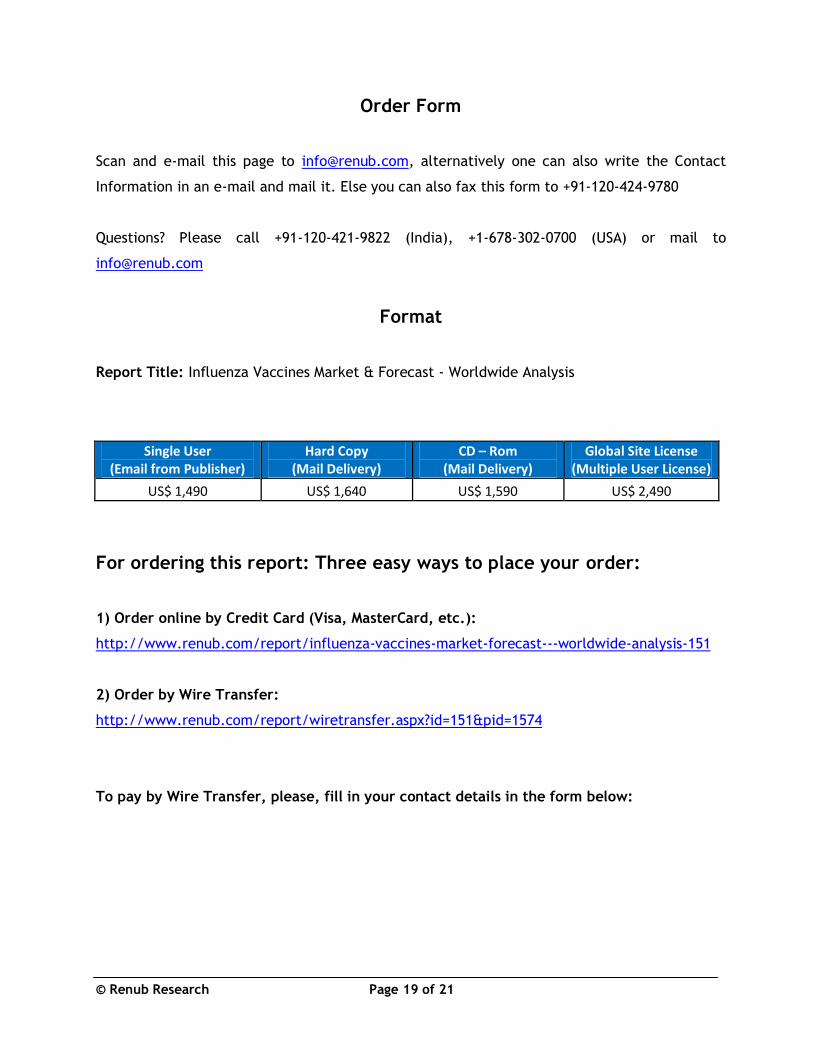
Order Form
Scan and e-mail this page to [email protected], alternatively one can also write the Contact
Information in an e-mail and mail it. Else you can also fax this form to +91-120-424-9780
Questions? Please call +91-120-421-9822 (India), +1-678-302-0700 (USA) or mail to
Format
Report Title: Influenza Vaccines Market & Forecast - Worldwide Analysis
Single User (Email from Publisher)
Hard Copy (Mail Delivery)
CD – Rom (Mail Delivery)
Global Site License (Multiple User License)
US$ 1,490 US$ 1,640 US$ 1,590 US$ 2,490
For ordering this report: Three easy ways to place your order:
1) Order online by Credit Card (Visa, MasterCard, etc.):
http://www.renub.com/report/influenza-vaccines-market-forecast---worldwide-analysis-151
2) Order by Wire Transfer:
http://www.renub.com/report/wiretransfer.aspx?id=151&pid=1574
To pay by Wire Transfer, please, fill in your contact details in the form below:
© Renub Research Page 20 of 21
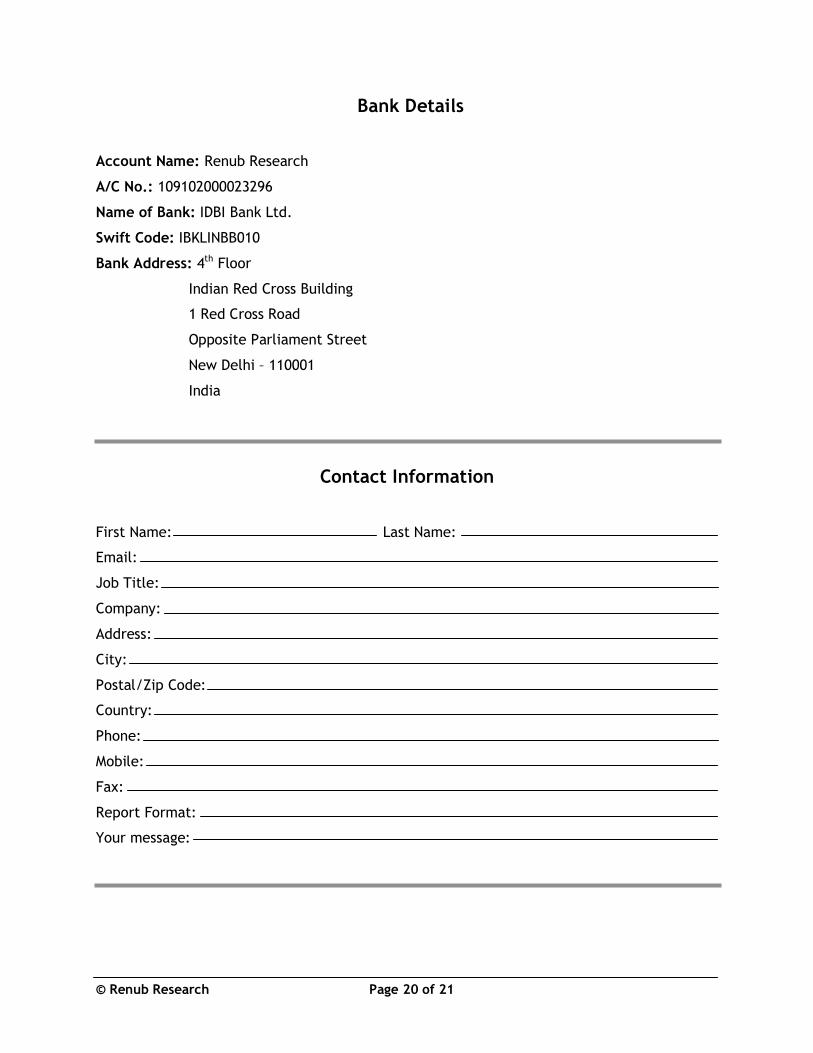
Bank Details
Account Name: Renub Research
A/C No.: 109102000023296
Name of Bank: IDBI Bank Ltd.
Swift Code: IBKLINBB010
Bank Address: 4th Floor
Indian Red Cross Building
1 Red Cross Road
Opposite Parliament Street
New Delhi – 110001
India
Contact Information
First Name: Last Name:
Email:
Job Title:
Company:
Address:
City:
Postal/Zip Code:
Country:
Phone:
Mobile:
Fax:
Report Format:
Your message:
© Renub Research Page 21 of 21
3) Order by Check
Please post the check accompanied by this form, to:
Company Address: Renub Research
1st Floor
C-86, Sector -10
Noida - 201301
Uttar Pradesh
India
Phone: +91-120-421-9822, 424-9780
For free Sample copy report or to view any of our sample work please contact us at
[email protected] or call +91-120-421-9822 (India), +1-678-302-0700 (USA)
Follow Us
Facebook: http://www.facebook.com/pages/Renub-Research/233380966701090
LinkedIn: http://www.linkedin.com/company/renub-research
Twitter: http://twitter.com/RenubResearch