Embed Size (px)
Citation preview
i
The candidate confirms that the work submitted is their own and the appropriate credit has been given
where reference has been made to the work of others.
I understand that failure to attribute material which is obtained from another source may be
considered as plagiarism.
(Signature of student) _______________________________
WorldMapper of Languages on the Web
Fabien Hall
Computing for Business (Industrial)
2008/2009

ii
Summary
Understanding language distribution across the world is integral to the linguistics research area
(Wolfgang & Cermáková, 2007). Due to the lack of available data for all languages, it can be
incredibly difficult to get accurate data on the number of language speakers across the world. As a
result, many languages are not fully understood in terms of how widely used they are over the world.
This project demonstrates how data mining tools and techniques can be used to overcome this issue
by acquiring data from search engines to represent the distribution of world language. The creation of
an application to automatically retrieve this data will be build to speed up the process. The finding
from research into data mining and data extraction concluded that the Cross Industry Standard Process
for Data Modelling (CRISP-DM) methodology will be used throughout the project.
The data collected will represent the total number of websites returned from search engines on the
web. This data will then be altered and manipulated to create high quality datasets suitable for the
creation of visualisation images to show the distribution of languages over the world.
These images have then been evaluated and commented upon by linguists from different specialist
journals across the world.

iii
Acknowledgements
Firstly, I would like to thank my project supervisor, Eric Atwell, for his continued support and
guidance throughout the project. I would also like to thank Ken Brodlie, my project assessor, for his
useful feedback provided in the Mid-Project report which helped to steer the project.
Finally, I would like to thank the WorldMapper team for their contribution and cooperation towards
the creation of the project, without them, this project would not have been possible.

iv
Table of Contents
1 Introduction ........................................................................................................................................... 1
1.1 Problem statement ........................................................................................................................... 1
1.2 Main Aim ......................................................................................................................................... 2
1.3 Main Deliverable ............................................................................................................................. 2
1.4 Minimum Requirements ................................................................................................................... 2
2 Project Management .............................................................................................................................. 4
2.1 Project Schedule .............................................................................................................................. 4
2.2 People Management ........................................................................................................................ 4
2.3 Methodologies ................................................................................................................................. 4
3 Background Research and Analysis ...................................................................................................... 7
3.1 WorldMapper .................................................................................................................................. 7
3.2 Language distribution ...................................................................................................................... 8
3.3 Data Mining and Extraction ............................................................................................................. 9
3.4 Review of existing applications ........................................................................................................ 9
3.5 Review of Search Engine API capability ......................................................................................... 11
3.6 Programming Technologies ........................................................................................................... 12
3.7 Language Selection ........................................................................................................................ 13
3.8 Evaluation of Background Reading ................................................................................................ 13
4 Data Phase ............................................................................................................................................ 14
4.1 Data Understanding ...................................................................................................................... 14
4.2 Data Preparation ........................................................................................................................... 25
5 Presentation Phase ............................................................................................................................... 33
5.1 Modelling ...................................................................................................................................... 33
6 Evaluation ............................................................................................................................................ 37
6.1 Testing .......................................................................................................................................... 37
6.2 Requirements Evaluation ............................................................................................................... 37
6.3 WorldMapper Cartograms Evaluation ........................................................................................... 39
6.4 WorldMapper Review .................................................................................................................... 40
6.5 Map Comparisons.......................................................................................................................... 41
6.6 Potential User Evaluation .............................................................................................................. 44
6.7 HitsRetriever ................................................................................................................................. 47
6.8 Project Management ...................................................................................................................... 47
7 Conclusions .......................................................................................................................................... 49
7.1 Possible Enhancements and Project Ideas ...................................................................................... 49
7.2 Academic Journal .......................................................................................................................... 50

v
8 References ............................................................................................................................................ 51
Appendix A: Project Reflection ................................................................................................................... 55
Appendix B: Project Schedule...................................................................................................................... 57
Appendix C: Methodologies ......................................................................................................................... 58
Appendix D: English Total ........................................................................................................................... 59
Appendix E: English Domain Percent ......................................................................................................... 60
Appendix F: English Speakers ..................................................................................................................... 61
Appendix G: French Total ........................................................................................................................... 62
Appendix H: French Domain Percent .......................................................................................................... 63
Appendix I: French Speakers ....................................................................................................................... 64
Appendix J: Arabic Total ............................................................................................................................. 65
Appendix K: Arabic Domain Percent .......................................................................................................... 66
Appendix L: Arabic Speakers ...................................................................................................................... 67
Appendix M: Hungarian Total..................................................................................................................... 68
Appendix N: Hungarian Domain Percent .................................................................................................... 69
Appendix O: Hungarian Speakers ............................................................................................................... 70
Appendix P: Web Domain Total .................................................................................................................. 71
Appendix Q: UK English.............................................................................................................................. 72
Appendix R: US English ............................................................................................................................... 73
Appendix S1: WorldMapper English ........................................................................................................... 74
Appendix S2: WorldMapper French ........................................................................................................... 74
Appendix S3: WorldMapper Arabic ............................................................................................................ 75
Appendix S4: WorldMapper Hungarian ..................................................................................................... 75
Appendix T: WorldMapper Review Document ........................................................................................... 76
Appendix U: Linguistics Experts Contact Details ....................................................................................... 77
Appendix V: Evaluation Request Document ............................................................................................... 78
Appendix W: HitsRetriever User Manual ................................................................................................... 80

1
1 Introduction
In this section we discuss the project background, key aims and objectives as well as the minimum
and extended objectives.
1.1 Problem statement
Showing the distribution of language speakers throughout the world has already been highlighted as
an incredibly difficult task to complete due to difficulties in obtaining up to date reliable data for all
countries in the world (Katzner, 2002). There are many sources which have tried to illustrate these
distributions (Gordon, 2004, Snow et al 1998) however typically these attempts are incomplete and
only cover data for larger countries with data for smaller countries as well as African counties being
unavailable. Language distribution is an area which interests many linguistic professionals however is
also an area which remains a mystery for many of the world languages.
WorldMapper is a project set up in a bid to use visualisation tools to show the distribution of
numerous topics such as world population to fuel consumption.
Cartograms are a form of image visualisation which has become increasingly popular over the past
decade. A cartogram map displays the distortion of regions such as countries or provinces depending
upon variable attributes (Gastner et all, 2006). WorldMapper is an organisation which was founded
with the intention of supplying cartogram maps displaying an enormous variation of data ranging
from Hospital Beds to data on Working Tractors across the globe. Currently, the WorldMapper
project has nearly six hundred maps which can be accessed and downloaded from their website.
The WorldMapper team recently decided that it would be in the interest of the progression of the
website to create maps displaying the distribution of languages across the world. According to Mason
(2008, p.142) ―the past twenty or so years the use of computers in linguistics has changes from simply
being a glorified typewriter for writing up articles to an essential research tool‖. It is for similar
reasons why this project idea originated.
It is the shared view of many professionals operating within the web sector, that the data found on the
web can be used to great effect. Baroni and Bernardini (2003) state that there is no doubt that the
WWW is a mine of language data of unprecedented richness and ease of access.
Having undertaken modules on Knowledge Management in my final year, as well as various
programming modules in my first year, this project has high relevance to my degree program. Many
of the topics covered from these modules have been used throughout this project.

2
1.2 Main Aim
The project will incorporate the development of an application with the capability of retrieving data
from web data providers to illustrate the distribution of languages across the world.
The data being collected is the total number of websites retrieved after each successful search of a
web data provider. This data will then be used as a representation of the distribution of each
language.
1.3 Main Deliverable
The projects deliverables are a web mined data set suitable for the production of cartograms produced
by WorldMapper to display the distribution of up to four languages across the world.
The languages being studied are French, English, Arabic and Hungarian.
1.4 Minimum Requirements
The minimum requirements for this project, as discussed and finalized with my project supervisor are:
1. Use data mining techniques to gather data suitable for creating WorldMapper cartograms
showing the use of languages throughout the world for at least four different languages.
2. Review of techniques and frameworks used for data mining on at least two different web data
providers.
3. Review of the potential uses and users of the WorldMapper images.
These objectives have been referred to constantly throughout the project to ensure the project
objectives were met. When refereeing to web data providers, this tends to mean web search
engines.
1.4.1 Possible Extensions to minimum requirements
The following list includes details on possible extensions to the minimum requirements displayed
above. These extensions were put together at the start of this project and have been included in the
mid project report.
1. Additional maps for different languages.
2. Contrast maps with the images which will be produced by the WorldMapper team.
3. The use of other visualisation tools to display the same data sets in a different manor to
increase its value and data understanding.

3
1.4.2 Minimum requirements adjustments
Half way through the project, alterations were made to the first additional requirement. Reflecting on
comments received from the Mid-Project report as well as the outcome from discussion with atwell,
the decision to plot additional distributions was taken rather than plotting additional languages.
As there are so many different languages throughout the world, mapping additional languages would
not have made a huge impact and it was also not a challenging task or imaginative task. As a result,
the decision to use potentially display other distributions was taken as a replacement for other
languages.

4
2 Project Management
In this section, we discuss the procedures and methods use throughout the project to ensure the project
is delivered successful with minimal delays. We finish by evaluating tools and methodologies and
then conclude which is the chosen methodology to be used throughout the project.
2.1 Project Schedule
Full lists of key tasks as well as their predicted time frames can be found in Appendix B. Key
milestones have also been included within this schedule.
Due to having three more modules in the first semester, the project schedule has taken this into
consideration and this is why a lot of the key actions have taken place in the second half of the project
duration. The project will also run through the semester one examination period. The effects of this
have been considered and mapped on the schedule.
No revisions were made to this project schedule throughout the project. Careful background reading
and analysis ensured all tasks were clearly identified from the start enabling a clear schedule to be
constructed.
2.2 People Management
As constant communication with third parties (primarily WorldMapper) was required throughout the
project, a systematic approach had been adopted at the start of the project to reduce the risk of delays.
This approach ensured that sufficient time was provided to the third party to ensure responses were
received before the required date. It had been discussed with WorldMapper that their full support and
cooperation will be provided throughout the project.
2.3 Methodologies
As the nature of this project is data mining and application building, there are a number of
methodologies which could have been used throughout the project. The methodologies which were
researched and their conclusions can be found below.
2.3.1 CRISP-DM
CRISP-DM, standing for Cross-Industry Standard Process for Data Mining is a methodology which is
typically used throughout data mining projects. The CRISP-DM methodology clearly sets out six
different phases which run as a lifecycle representing the flow which typical data mining project
follow starting from business understanding to deployment of the end product (Wirth & Hipp, 2000).
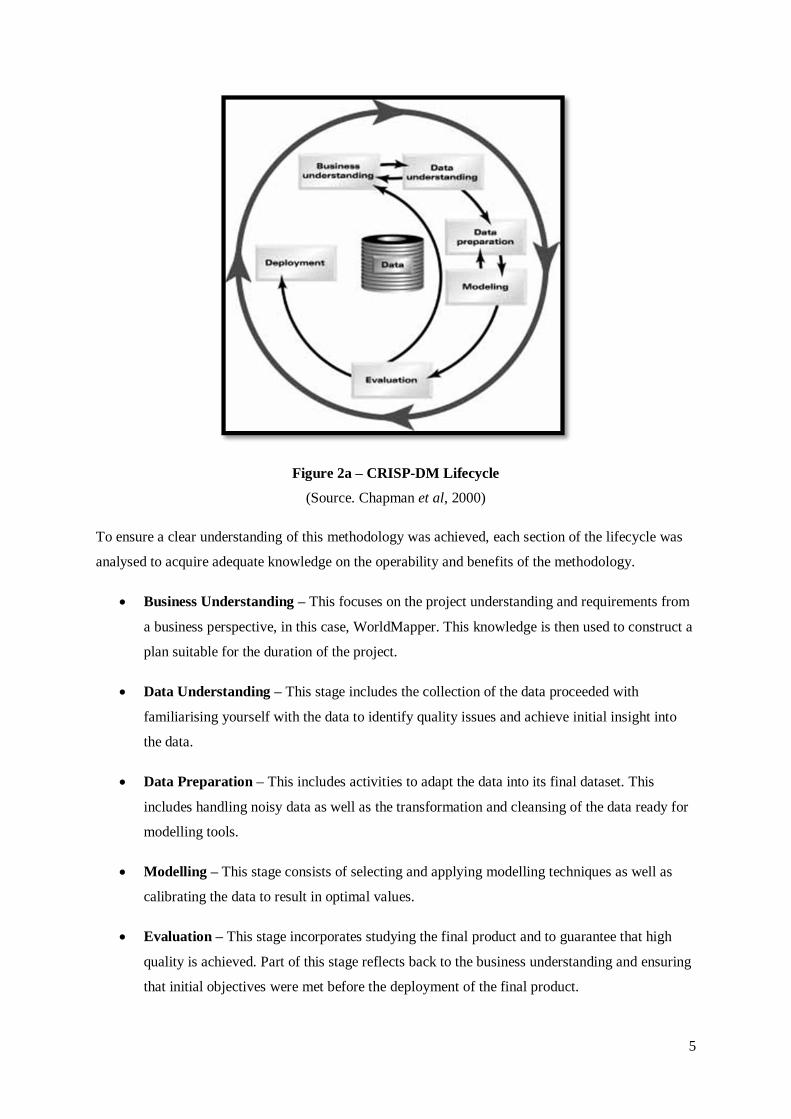
Figure 2a below shows the typically
5
Figure 2a – CRISP-DM Lifecycle
(Source. Chapman et al, 2000)
To ensure a clear understanding of this methodology was achieved, each section of the lifecycle was
analysed to acquire adequate knowledge on the operability and benefits of the methodology.
Business Understanding – This focuses on the project understanding and requirements from
a business perspective, in this case, WorldMapper. This knowledge is then used to construct a
plan suitable for the duration of the project.
Data Understanding – This stage includes the collection of the data proceeded with
familiarising yourself with the data to identify quality issues and achieve initial insight into
the data.
Data Preparation – This includes activities to adapt the data into its final dataset. This
includes handling noisy data as well as the transformation and cleansing of the data ready for
modelling tools.
Modelling – This stage consists of selecting and applying modelling techniques as well as
calibrating the data to result in optimal values.
Evaluation – This stage incorporates studying the final product and to guarantee that high
quality is achieved. Part of this stage reflects back to the business understanding and ensuring
that initial objectives were met before the deployment of the final product.

6
This methodology has substantial benefits for all types of users varying from beginners to data mining
experts due to its ability to bring vast benefits to the user in its professionalism and approach (Shearer,
2000). The methodologies flexibility is one of its key strengths, enabling it to be adapted for a large
variety of projects. (Chapman et al, 2000). These benefits had been experienced at first hand having
used this methodology as part of a coursework on the database and principles module during my third
year of study.
2.3.2 Waterfall Model
The waterfall model (see Appendix C) concentrates on the life cycle of a typical application building
process looking at issues such as requirements gathering to system design as well as deployment of
the system. This model was chose to be looked at as knowledge had been obtained on its uses and
benefits during my first year of study. Ritter (2001) argues that the model is restrictive and inflexible
as well as limiting due to its strict documentation requirements.
As the nature of my project is more focused on data mining and obtaining an accurate data set, the
emphasis on systems development is a low priority. As a result, although this methodology has its
benefits, they are not suited and in sync with the projects aims and objectives.
2.3.3 Spiral Model
The final methodology which was examined was the Spiral Model (see Appendix C). This model,
similar to the waterfall mode, looks at the aspect of application building over its life cycle. The
benefits of this cycle over the Waterfall model are down to its increased flexibility during the
application building stage.
2.3.4 Conclusion
To conclude, the CRISP-DM methodology was most suited to this project due to its relevance to data
mining. As the success of this project depends on the quality of data gathered, it is important to use a
relevant methodology so that concentration does drift towards concentrating too much on the creation
of an application capable of retrieving web hits automatically. As a result, the CRISP-DM
methodology was selected as the primary methodology of choice with the spiral model being used as
a reference whilst conducting the building of the final application.

7
3 Background Research and Analysis
In this section we discuss the background reading which was undertaken throughout the project.
Whilst working on a data mining project of this scale, it is an important that one becomes familiar
with the domains which were being covered to ensure the project sticks to its objectives. These
domains include language distribution, technology reviews and data mining as a whole.
3.1 WorldMapper
Having had no knowledge of the WorldMapper project before the start of this project, it was
important to familiarise myself with their work to ensure that my project adhered to their standards.
WorldMapper originated as project run and sponsored by the University of Sheffield with the
intention of producing cartograms displaying various distributions such as total population and world
fuel consumption.
Cartograms are maps in which the size of a geographical areas or regions is distorted depending on
the data being fed into the image (Gastner & Newman, 2004). In the case of the WorldMapper
software, 200 countries are represented on an image which displays a map of the globe. Each region
or entity is then distorted to give the user a clear visual image of the topic being displayed. The image
below a cartogram of the world’s population:
Figure 1: WorldMapper cartogram of world population
(Source. WorldMapper 2009)
Currently, the project has nearly six hundred maps however language distribution is an area which has
yet to be covered. Although the WorldMapper team will be producing their own maps using official
figures from various sources, the team are anxious to have maps created in what could be stated as an

8
unorthodox method compared to its conventional method of using official documents and sources.
This is due to the difficulty obtaining accurate linguistics data on a wide scale as previously discussed.
Creating my own maps included the process of completing a WorldMapper template in .csv (comma
separated values) which had been supplied by the WorldMapper team. The template, which can be
edited in any spreadsheet program, contains two hundred rows representing the two hundred countries
which are distorted in the cartogram. It was discussed and agreed at the start of the project that the
WorldMapper team would do all they could to produce maps as quickly as possible to remove the
threat of delays.
3.2 Language distribution
There are many sources which have in the past tried to use census data to show the distribution of
languages across the world however many of these attempts far from complete and out of data date
due to the difficulty of this task.
From conducting a comprehensive search of literature and information on the distribution of the
languages, numerous sources containing language distribution figures were found however there were
two which were regarded by specialists to be the finest examples were Ethnologue (Gordon, 2005)
and The Encyclopaedia of bilingualism and bilingual education (Snow et al, 1998).
3.2.1 Ethnologue
Ethnologue is a Bibliography which produces comprehensive references to data on all known
languages in the World. The book in total references over 1300 different sources and relies strongly
on the contribution of linguistic specialists and researches to keep the data as up to date as possible
(Ethnologue, 2009). Ethnologue, which is available either online or in paper format, uses these
various sources to approximate the total users of each of these languages in as many countries
possible depending upon if the data is available or previously gathered (Gordon. 2005).
John Pritchard, the contact used throughout the project from the WorldMapper team, had planned to
use Ethnologue to produce his maps. Due to the lack of a complete set of data from this source,
WorldMapper were interested to get maps produced using data taken from the internet, this is how
this project originated. As it was known that Hungarian was one of the languages which would be
mapped, Ethnologue (Gordon, 2005) was consulted to check available data for this language. The
outcome was that data for only seven different countries was present. When contrasting this to the
WorldMapper template which requires figures for 200 countries, it became clear how difficult it can
be to acquire a complete set of data. The Ethnologue site states that it is perhaps the most highly
regarded source of information on world languages although having reviewing its data for numerous
languages, it is apparent that there are numerous gaps in the data which again shows the difficulty of

9
this research area. It was clear to see that obtaining data for all 200 countries without using internet
search figures was a difficult task, which makes this project all the more interesting as a result.
3.2.2 The Encyclopaedia of bilingualism and bilingual education
The second source which was evaluated was ―The Encyclopaedia of bilingualism and bilingual
education‖ (Snow et al, 1998). From conducting searches similar to those taken in Ethnologue
(Gordon, 2005), it became apparent that the data provided from this source was more substantial than
Ethnologue however it was far from complete. With the Encyclopaedia now being over 10 years old,
it can be argued that the data is out of date.
To conclude the review of these two sources, it is clear that there is a distinctive difficulty in
understanding the spread of languages over world.
As WorldMapper would be creating their own maps using these sources, it was deduced that this point
that the use of their maps would be used as part of the projects evaluation process.
3.3 Data Mining and Extraction
Data extraction typically includes the process of retrieving data out of an unstructured source, like the
web (Elmasri & Navathe, 2003). The process of data mining (knowledge discovery) is the process of
extracting useful data out of large data sources (Poncelet et al, 2007, Bramer, 1999). As this project
looks at the extraction of data provided by web data providers, the use of both these techniques was
required.
The key lessons learnt from reviewing sources on these topics repeatedly emphasise the importance of
careful planning to ensure data of the highest quality is retrieved. Making this point relevant to the
project would mean careful planning would be required on the selection of search terms to ensure data
of highest quality is collected.
3.4 Review of existing applications
Having acquired knowledge on the surrounding project environments, one the first steps towards
obtaining a data set was the review of existing applications. Existing solutions were reviewed with the
intent of discovering if any current application was capable of conducting the tasks required for this
project.
There are many open source applications available which are used for the extraction of web data and
web corpus however no such program exists for recording the total count of web searches retrieved
from web search provides. Hunston (2002) describes the process of web corpus building as the
process of gathering data from a collection of texts to then be further analysed for data trends.

10
It was known from the start that finding an existing application which carries out the tasks required
for this project was unlikely. There are however numerous applications which are used as web corpus
building application. Due to the nature of these programs interacting with web data provides, they
have been reviewed to check if any of the functionality could be used or edited to suit the needs of
this project.
3.4.1 BootCat
BootCat is an open source corpus building application which has been built using Perl (Baroni &
Ueyama, 2004). From initial reviews of this application, it quickly became apparent that the usability
of the application was indented for the highly skilled programmer. From reading further into the
applications capabilities (Sharoff, 2006), it was deduced that the program had no functionality which
could have been used or altered for the benefit of this project.
3.4.2 JBootCat
JBootCat, standing for Java BootCat, is an alteration of the original BootCat program including major
alterations such as the introduction of a graphical user interface and increased support and
documentation. As the BootCat applications capabilities were similar to what was desired for this
project, the decision to look into the alterations of JBootCat was taken to see if any changes which
had been made included the ability to pull raw data from search results.
Unfortunately, the programs alterations were made with the intention of making the current processes
easier rather than adding additional functionality (Roberts, 2006).
3.4.3 Conclusions of existing applications review
To conclude, unfortunately, none of these existing applications had the capability of being altered
towards the requirements of this project. All programs looked at were built with the intention of
processing data as a result of one search term rather than numerous, which was far from what was
required from the final application.
Mason (2008) argues that the benefits from creating your own application when wanting to extract
linguistics data greatly outweigh the benefits experienced from using existing applications due to the
capability of making a system tailor made to your needs and therefore increasing the quality of data
being extracted.
Due to the lack of capabilities from existing applications coupled with the advantages of making a
tailor made application, the decision to create an application from scratch was decided.

11
3.5 Review of Search Engine API capability
The second requirement of the project states that the review of techniques for data mining on two web
data providers is required. A study of the capabilities on both the Google and Yahoo search engine
was conducted. Yahoo and Google were selected as they are the main two search engines used by the
majority of web users across the world (Brin, 1998).
The findings from the review of existing applications concluded that there was no current application
capable of extracting the type of data which was required for this project.
Before looking at creating an application an application, knowledge of the tools which would be used
was required to know what the capabilities of each data provider would be to check if an application
could be build to query each web data provider. We will start off by looking at the Google search
engine.
3.5.1 Google
Interaction with a web data provider requires interacting with an application programming interface
(API). An API is a set of methods and functions which can be called to then give access to features of
another program, in this case, the search engine (Keith & Schincariol, 2006).
Put simply, this is a layer which sits on top of the search engine which is used to communicate with
the user.
The result of exchanged emails with Nick Efford, a senior programmer from the School of Computing
- University of Leeds, meant knowledge had been acquired that using the Yahoo search API would be
easier due to the significant lack of restrictions which were present from the Google API.
From thorough research into Google search API from the Google website (Google, 2009), it had been
discovered that the original Google API had been discontinued and replaced by their AJAX API.
AJAX can be defined as the collection of several technologies working together to provide a powerful
way of working (Garrett, 2005).
Documentation extracted from the Google website (Google, 2009) states that ―The AJAX Search API
is the easiest way to incorporate a Google search box on your site.‖
From reading extended documentation on the API, it was understood that the Google AJAX API was
build for the intention of interaction through a website rather than a standalone application. Interacting
with the Google API required registering for a key. The process or registering for a key required
providing details to a working website relevant to the purposes in which the key would be used for.
The original Google Search API had the capability of communicating with the API through

12
standalone applications without the need for a website however the replacement AJAX service
demanded a website was used.
Due to this being outside the scope of the project, attention was shifted toward the review of the
Yahoo Search API.
3.5.2 Yahoo
From researching the documentation on the Yahoo Search API found on their Developers Network
(Yahoo, 2009a), the discovery of the Software Development Kit (SDK) had been made. The SDK is a
toolkit created by Yahoo for the distribution to users wishing to interact with their API.
Similar to Google, a key was required to ensure communication between the user and the Search API.
Unlike Google, no website was required to sign up for a key. The terms and conditions clearly stated
that the use of the search API was for standalone applications rather than the use of web tools. Further
research into the API’s capabilities led to the conclusion that interacting and creating an application to
communicate with this API was an achievable target.
Having obtained a key and downloaded the SDK, a decision was required into which programming
language to use as the choice of languages from the list below was available.
ColdFusion C#
Flash/Flex (ActionScript)
Java JavaScript
Lua
Perl
PHP Python
Ruby
VB.NET
Widgets (JavaScript + XML)
With having such a large selection, the decision to review a couple languages was taken to ensure the
most appropriate language was selected. The findings and conclusions from this review can be found
in the next section.
3.6 Programming Technologies
3.6.1 Python
The decision to look into using Python had been made purely down to the fact that previous
experience had been gained with using the language when it comes to application building. The
Python programming language, created by Guido van Rossum in 1991 (Dawson, 2003), is known for

13
its readability as well as its minimalistic style whilst still having an extensive class library. Chun
(2001) claims that Python is a fitting programming language for people of all abilities.
3.6.2 Java
Java is an object oriented programming language which has strong capabilities with interacting with
web applications (Wu, 2006) as well as being typically the most used programming language by
academics and students due to its strong infrastructure and capabilities (Shelly et al, 1998).
Due to capabilities of both programming languages being suitable for the task as hard, the decision to
use Python was made due to the following two reasons. The first reason being because of its
suitability for beginners. Having had little experience with programming as a result of my degree
programme (Computing for Business), my knowledge and experience of programming was limited.
The second reason is due to having been exposed to Python the most out of the two languages.
3.7 Language Selection
The first minimum requirement of this project states that at least four languages need to be mapped. It
was concluded from meetings with Eric Atwell that selecting a variety of different languages from
widely used to highly localised would produce the most interesting maps. From consulting the
numerous sources (Gordon, 2004, Snow et al, 1998, Katzner, 2002, Lyovin, 1997) French, English,
Arabic and Hungarian were selected as the four languages to be studied.
3.8 Evaluation of Background Reading
As part of the Business and Data Understanding sections of the CRISP-DM methodology, it is
important to gain knowledge of the environment in which the project operates in.
Acquiring an in depth knowledge into the domains identified above enabled the project to move on to
the development of an application and the creation of datasets.

14
4 Data Phase
4.1 Data Understanding
Whilst obtaining knowledge through background reading on the project and its surrounding topics, it
was discussed with Eric Atwell that conducting manual searches of the Google and Yahoo search
engine would be a good initial step to catch any issues which are associated with undergoing a task of
this nature. This was carried out by searching each search engine manually and then recording the
total number of websites retrieved after each search. The intent of this testing phase was to highlight
key issues so that they could be combated at an early stage to reduce the risk of hitting a large
obstacle further down the line. The data collected from these tests were used to produce the first set of
WorldMapper images which can be found later in this chapter.
Before conducting these tests, there were many tasks which needed to be completed, the first of these
being obtaining each top level domain (TLD) code (e.g. .uk) for the two hundred countries plotted by
the WorldMapper application.
TLD’s are a means of branding websites in order to work out their location. Nearly every country in
the World who has internet capabilities has a TLD allocated specifically for their country (Steinberg
& McDowell, 2003).
Information on each countries web domain was taken from IANA (2009) and then recorded into a
spreadsheet. IANA represents the control of each TLD throughout the world.
Having obtained the domain codes, steps had to be taken to get a further understanding of how to
interact with the search browser using advanced search shortcuts to allow searches to be conducted in
each of the two hundred web domains. From consulting publications on advanced searching
techniques for both Google and Yahoo (Blachman & Peek, 2008, Yahoo, 2009b), an initial search
query had been drafted:
“avoir” site:.domain
French was the language of choice for this test phase with the search term ―avoir‖ being selected due
to personal knowledge of the French language. ―avoir‖ is a commonly used French word which is
only found in the French language. The term “domain” is replaced by the TLD for each country.
After having conducted the searches on both web data providers, the data was filtered into the
WorldMapper template to get the set of maps created. These images can be found below in Figure 4a
and 4b:

15
Figure 4a – WorldMapper cartogram of the distribution of the French language - Google
Figure 4b – WorldMapper cartogram of the distribution of the French language - Yahoo
It is clear from contrasting these two maps that a strong correlation was present. An issue which was
immediately brought to my attention was with the large yellow country located in the bottom right of
the map. This country was identified as New Caledonia. New Caledonia is owned by France
(Ekstrom, 2000) and is therefore distorted at the same rate as France. Due to France receiving a large
number of hits due to the French language being searched, this justified which this country had been
enlarged by so much.

16
Throughout and after the testing period, many serious issues arose which hindered the production of
the data sets. The first group of issues which were recorded was the problem with unexpected
domains receiving exceptionally large numbers of web hits. These issues became apparent after
having studied the original data sets by using simple sorting techniques.
The TLD’s for countries such as Tuvalu and Niue have recently become highly appealing to
businesses to host their website within these countries. The top level domain (TLD) for Tuvalu is .tv
which has become increasingly popular with many television stations not only because of its name but
also because of the availability in getting a desired web name due to the majority of web addresses
from the .com domain already being taken (Drezner, 2001). Niue’s TLD is .nu which stands for
―now‖ in Swedish and other Scandinavian languages (Drezner, 2001). The revenue which Niue
gained through selling their web domain to multinational organisations meant that Niue had become
the first country to provide internet access freely to all of its residents in history (Drezner, 2001).
It is not only the .tv and .nu domains which were a problem; there were also issues with the following
countries:
Tonga (.to)
Turkmenistan (.tm)
Fed States of Micronesia (.fm)
Samoa (.ws)
Tuvalu (.tv)
Niue (.nu)
Sticking to the structure identified by the CRISP-DM methodology, all issues discovered from the
testing phase are discussed in further detail within the Data Preparation section.
It was noted during the testing phase that using a one word search term technique was not recalling
website purely in the French language. Many of the websites which were retrieved were language
teaching websites in English or websites proving translations for the word ―avoir‖. As a result, the
decision to use two search terms from this point onwards was taken. The selection of these search
terms can be found in section 4.1.5.
The other serious issue which came out of these testing phase was the issue with the TLD for the
United States ―.us‖. The problem is that this domain is relatively small compared to the country’s
population. Having looked further into this issue, it did not take long to realise that the reason for this

17
was due to heavy restrictions that used to be in place on the .us domain restricting citizens to only
create websites under the .us domain on the third level or above (Hodgson, 2002)
A third level or above web domain restricts users to using the domain tag after following sub
domains (Baeza-Yates, 2007). An example would be the following website address:
www.websitename.state.va.us. The domains used after websitename are called sub-domains and this
is how the .us domain was structured. It required each website to follow these codes of practice as a
means of further identifying the location of each website. As a result of these restrictions, the majority
of websites which were set up in the United States were registered under the .com domain as this
allowed the user to create shorter and more memorable websites. The restrictions on the .us domain
have now been lifted however due to the trend in using the .com domain throughout the United States;
the .us domain is still struggling to take off (Hodgson, 2002).
Having discovered this problem, it was vital to formulate a plan of action to combat this to ensure that
the United States was properly represented in the final data set once the final application had been
created. In reference to the CRISP-DM methodology, this stage would be classified as data
preparation.
Before we can start looking at tools and methods use to purify the data, the creation of an application
capable of collecting this data is required as the time taken to gather these data sets manually is too
time consuming and not practical. The time taken to gather the data manually took over an hour per
dataset. As identified from the background reading, the creation of this application was only possible
on Yahoo due to restraints restricting the use of the Google search engine.
4.1.1 Yahoo Search API
As the initial tests had identified, the turnaround time for creating each data set took a considerable
amount of time. Although the data set could have been collected without the use of an automated
system, the practicality and speed benefits strongly outweigh the benefits of not creating such
application. For the sake of application identification, the final system will be referred to as
―HitRetriever‖ from now on.
4.1.2 System Requirements
Before having started the creation and development of the HitRetriever application, its basic
functionality was mapped out through meetings with Eric Atwell to enable the system to hit the
targets set out and to stay in sync with the project aims and the business understanding, as stated in
the projects introduction section. The following requirements for the desired end product were as
follows:

18
1. Ability to retrieve hit results for all two hundred domains represented in the cartogram
mapping system
2. Quick turnaround time collecting total hits
3. Ability to store all hits in a flat file database in a format suitable ready to be imported into the
WorldMapper cartogram template.
Due to the potential of running data extraction for multiple languages or other topics, the importance
of being able to do this at a large scale was paramount. Although the requirements of this project is to
only look at the distributions for four languages, the staff at WorldMapper were keen on getting a
system which could be used after the project deadline to produce further maps if desired.
4.1.3 Basic functionality
It had been discovered from my background reading that the creation of HitRetriever would be
conducted using the Yahoo Software Development Kit (SDK) (Yahoo, 2009). This kit contains
capabilities for numerous programming languages to be used. The programming language review
deduced that the Python programming language would be used with Java being used as a replacement
if difficulties with using Python were experienced.
As Python is a class orientated program, installation of the Yahoo SKD was required on each machine
the SKD was used on. Documentation on the SKD states that the system works on both Windows on
Linux systems. This claim was authenticated throughout the building of the application as multiple
operating systems were used.
Having installed the SKD, a considerable time was spent studying the imported classes from the
toolkit to gain insight on how the program operates. The SKD contained a couple examples
applications which could be run however all these did where recall web addresses dependant on the
search term being used.
The search API works by interacting and extracting data from a XML documents which are created
by Yahoo after each search. The example applications provide a link to an example XML document
which is used. From scanning this page, it was quickly noted that the top of the page displays a short
summary, as can be found below:
<ResultSet xsi:schemaLocation="urn:yahoo:srch
http://api.search.yahoo.com/WebSearchService/V1/WebSearchResponse.xsd" type="web"
totalResultsAvailable="310000000" totalResultsReturned="2" firstResultPosition="1"
moreSearch="/WebSearchService/V1/webSearch?query=madonna&appid=YahooDemo®ion=us"
>

19
The key section of this summary was the ―totalResultsAvailable” attribute, highlighted in bold above.
This led to the assumption that if search API is capable of storing this information it must therefore is
be able to recall it upon demand, the issue was working out a method in doing so.
Having distinguished the API’s capabilities, efforts were spent on initiating communications with the
API. The _init_ file, which is a constructor module within Python, typically used to initiate objects
(Chun, 2001), contained comments on simple search techniques where the application queries the API
with a specific keyword. These examples were used to build a starting foundation for the program,
although its functionality was far from the desired end product as set out from the applications
minimum requirements; it was still a good starting point.
from yahoo.search.web import WebSearch
app_id = "YahooAPIKey"
srch = WebSearch(app_id)
srch.query = "Leif Hedstrom"
print "Searched for ", srch.query
To honour the terms and conditions of the search API, the API key which has been allocated to my
name will not be displayed throughout this project write up.
The code above, whilst run in a terminal, only displayed that a search had gone through and printed
what had been searched. At this point, the realisation that the ―srch.query‖ attribute was used to query
the search engine was discovered. On a trial and error basis, alterations to the search term was applied
to guarantee that using the advanced shortcuts such as site:, as used within the testing phase, was
allowed through the API. Conducting the same search which was used for the manual search went
through without any errors.
The top line of the code imports the WebSearch module from yahoo.search.web. Comments found
within this class contained details on the srch.parse_results()attribute as well as a web address
containing details of a full list of results which can be recalled from the search API (Yahoo, 2009)
The srch.parse_results attribute is used to gather all data related to the results of each search.
Information from the web address provided a substantial list of all attributes which can be called using
this function, one of those being total_results_available. It was then a question of incorporating this
attribute into the program to retrieve this number. The srch.parse_results was a means of collecting
all the data from the search, it just required further commands to extract what was needed from this
data file. Allocating srch.parse_results to an attribute allowed the search results to be stored and then
called at a later time. After painstaking experimentation, the following lines of code were used to
extract the data containing the total number of available web sites:

20
res = srch.parse_results()
print >> res.total_results_available
Running the HitRetriever with these lines of code now printed out the total number of hits retrieved
by Yahoo, in this case, the figure was 12,700. After checking this by conducting the same search
through the Yahoo website, this figure was validated to be correct. Having achieved minimal basic
functionality from my program, attention was shifted towards the applications first requirement, to
retrieve the data for all two hundred countries on the list.
4.1.4 Meeting Application Requirements
In this section, we examine how the system was altered to suit the minimum requirements of the
application as discussed with Eric Atwell. The first task was to get the application to process and
recall web page hit counts for all two hundred countries. As the TLD’s for each country had already
been gathered during the testing phase, simple formatting techniques were used to get the TLD’s into
an attribute within the HitsRetriever ready to be used within a for loop. As the same search was being
conducted over all two hundred domains, the only item which needed to be changed in the query
structure was the web domain. Thinking about this situation as if the search was being conducted from
the website makes this process easier to understand. Whilst interacting with the website, the search
term would look like this:
“avoir” site:.uk
Having stored the entire set of TLD’s within a string, a method of altering the search term to search
two hundred times with a different TLD in each search was required. The use of an interpolation
operator, which converts Python objects into a string through the %s command (Lutz, 2006), was
required to enable the search term to incorporate all the domains through a for loop. This was
achieved through the following line of code:
srch.query = '"centre" +"colour" site:.%s' % domain
After each search was conducted, a test of printing each result was implemented to ensure full
operability. During these tests, potential damaging errors occurred causing the program to crash
before all the searches had been conducted. This error was caused by the Yahoo servers timing out.
Having contact the developer of the Python module for the Yahoo SKD, Lief Hedstrom, I was
informed that the servers on the Yahoo side were constantly being queried from multiple users all
over the world which caused the server to lag and it was this which was causing the program to crash.
The servers where throwing a SearchError which is an error class build by the SKD. The way to
eradicate the issue would be through the use of Error catching however due to limited experience in

21
dealing in such a task, further consolation on python literature was necessary (Chun, 2001, Lutz,
2006).
Due to the error being thrown being part of the Yahoo API rather than a general error, a
comprehensive analysis of the API was required to first find the error class and then distinguish a way
in which it can be caught and solved. This proved to be a highly time consuming process.
Originally, this issue was overcome by catching the error and instructing the program to start again
from the first search term however this method caused substantial time delays. Realising this did not
hit the requirements of the system; alterations were then made to resume the program after waiting ten
seconds to give the servers a chance to recover. Adding the time delay required importing the time
class from the core Python library (Chun, 2001). Applying this to the program required a thorough
revamp to the layout and design format of the program. Having redesigned the structure of the
application, I was able to catch a further error which was caught at a later date. The second error
which was caught was a more typical URLError. This error, thrown by python, typically occurs when
a connection between two servers goes dead (Lutz, 2006). Similar to the previous error, the program
was instructed to wait for ten seconds before resuming from the last successful search.
The following code shows the for loop used including the error handling:
for domain in domains:
srch.query = '"Search 1" +"Search 2" site:.%s' % domain
while True:
try:
res = srch.parse_results()
except SearchError:
time.sleep(10)
print "Timed out, Search Error continuing in 10 seconds"
except URLError:
time.sleep(10)
print "Timed out, URL Error, continuing in 10 seconds"
else:

22
break
The program was build to include comments when errors were caught to inform the user of the why
the program had been delayed. These messages can be seen through the print attributes in the code
above.
With these procedures in place, the HitsRetriever was capable of collecting figures for all 2two
hundred searches in less than two minutes, compared to the turnaround time experienced from the
manual search, this was a considerable improvement.
At this stage, the HitRetriever had already hit two out of the three requirements set out in section
4.1.2. The final requirement was to adapt the program to print all hits retrieved into a document to
increase the practicality of the program as well as the turnaround time in getting maps produced.
The open() function was used to create .txt file for all the hits to be stored. As the countries were
arranged in order how they appear on the WorldMapper software template, the text file could then be
quickly opened and then the contents copied straight into the template. From consulting the Python
programming literature (Dawson, 2003), the following lines of code were inserted into the for loop.
f = open('FileName.txt', 'w')
print >> f, res.total_results_available
After some minor tweaks to improve the applications efficiency, full functionality of the application
had been achieved and was in full working order. This was concluded after having conducted
numerous tests on the application.
4.1.5 Selecting appropriate search terms
The CRISP-DM methodology states that the data understanding stage of the cycle includes the
collection of the data. Before the data could be collected, appropriate search terms for each language
had to be selected.
As identified from for the issues arising from the testing phase, the decision to use two search terms
was taken. Ensuring the right search terms were selected was an integral part of the project which had
enormous influence on the quality of data being extracted. It was important to select a combination of
words which could only be found in the language being searched to avoid the risk of gathering noisy
data.
Due to having knowledge of both the English and French language, selecting two key words for these
languages was relatively easy. It was vital to ensure that the search terms used were common and
contained in the majority of websites of each language. As a means of checking whether the search

23
terms were popular, searches were conducted on Yahoo and the words with the highest counts were
selected. For English, the words ―with‖ and ―that‖ were chosen. For French, ―avec‖ and ―que‖
standing for with and that in English, were used. The use of the site Wiktionary (2009) was used as a
means of ensuring both search terms are only found in the language being distributed. Wiktionary is a
powerful website which provides details on different words as well as highlighting which other
language the word is used it.
The searches were structured to ensure that both search terms had to be included on a webpage for it
to be recalled by the search engine. This method proved far more efficient than using simply one
search term.
Selecting appropriate search terms for the Arabic and Hungarian language was more challenging due
to having no experience in either language. Advice on the search terms for the Arabic language was
taken from Arabic speaking research students specialising in natural language processing from within
the University of Leeds. After numerous email exchanges, it was concluded that the combination of
the words ―كن ك― standing for 'but' and ‖ل that' in English were the best two word' ‖ذل
combinations. Again, these words were run through Wiktionary (2009) to check for exclusivity to the
Arabic language.
For Hungarian, words were chosen through the use of language translators as well as studying
literature on the Hungarian language (Rounds, 2001). As the word ―that‖ had been used consistently
for the other three languages, this trend was kept resulting in the choice of the search term ―azt‖ being
used. The Hungarian equivalent for ―with‖, retrieved a small amount of websites and therefore did fit
the criteria for the search term. As a result, the word ―nem‖, meaning no, was selected as the second
key word.
The figures which were being recorded represented a count of websites known to be in a particular
language however it does not represent the total number of websites in each language due to the way
the searches were structured. For instance for French, the hits count recalls all websites which contain
the words ―que” and ―avec” somewhere on the page. This is the closest we could get to obtaining the
total number of websites in each language. From here onwards, referring to the total number of
websites in each language will represent the data collected from these methods.
4.1.6 Creating final datasets
Having selected the final search terms, it was a simple task of filtering these into the program and
running it for each language. The HitsRetriever managed to gather these data sets with ease with no
new errors occurring.

24
After the data sets had been created, attention was shifted towards the data preparation phase of the
CRISP-DM methodology. This phase included altering the data to remove any noise to ensure
cartograms of the highest possible value were created.

25
4.2 Data Preparation
Having identified and collected the data sets which will be used to as a base to create the final maps,
efforts were required on getting the data into a form suitable to show a detailed distribution of each
language. The process of getting the best out of the data was difficult and required a lot of trial and
error to overcome many boundaries which will be discussed below.
One of the key finding from reviewing the literature on the TLD for the United States was that
businesses and citizens resorted to using the .com domain as replacement due to the restrictions on
their national domain. Altering the data for the United States was required to make it in sync with all
the other countries. It was a logical process to look further into the .com domain to see if it could have
been used as a rough representation of the total websites in the United States. Searching the .com
domain for the search term ―Avoir‖ on the Yahoo search engine retrieved 188 million search hits
whilst the .fr domain only contained 115 million hits. It was clear from looking at these figures that
the .com domain would not be an accurate representation of the total number of websites within the
United States. Unfortunately, there is no current data on the geographical distribution of the .com
domain which means taking a percentage of this figure would be too inaccurate for this study.
Boldi et al (2009), who conducted thorough searches of the domains throughout Africa, states that
searching each country by its TLD and excluding the .com and .net domains yields strong benefits as
it gives a proper representation of actual web users rather than the commercial influence from
offshore organisations. As this project looks at obtaining accurate data on the total speakers of each
language, the views put forward in Boldi et al (2009) led to searching for alternative options.
The next possible solution which was looked at was the use of the advanced search options available
from interacting with the search engines through their website. Advanced search options are a feature
which is present on both the Yahoo and Google search engine. Both sites allow the user to apply
additional filters onto a search including the option to select to find webpage’s found in a specific
language. The documentation on these advanced search features were very basic and gave no
indication as to how these figures have been calculated. It can be assumed they do not want to leek
this information as it could give their competitors a vital clue into how their search engine works.
Unfortunately, similar to the previous example, the results were too high and were not in scale with
the results gathered from searching TLD’s.
The figures extracted from Yahoo using this technique recalled 65 million web hits within the United
States while France received 115 million hits using the traditional method of searching its TLD. From
Census data from the US (2000), states that only 1.7 million people in the US speak the French
language at home, compared to France which has over fifty million French language speakers (Snow
et al, 1998).

26
The final method which was tested was the take the original number from the .us TLD, and alter it to
represent the country as a whole. From endless trial and error, the following method was adopted.
As the idea behind this alteration was to get an idea of how many sites should actually be present in
the .us domain, the key was to find a method in which the number can be changed to represent the
country. The first step was to get an idea of how many websites there should be under the .us domain.
This figure was calculated using the total number of web users within each country. Having realised
that the WorldMapper have an internet user map on their front page, it was an easy process of
obtaining this data. Having acquired his data, a contrast was made between the United Kingdom (UK)
and the United States (US). The US has approximately 222 million web users which when divided by
the UK figure of 44 million gave;
221,819,000 / 43,823,600 = 5.06
From obtaining this figure, we are then able to calculate the total number of websites which should be
present in the .us domain by multiplying the total number of websites found in the UK.
Obtaining the total number of websites within each web domain was conducted using the final
application which is discussed in section 4.2.1.
Data extracted from Yahoo states that the UK has 2.5 billion websites compared to the US which only
has 705 million.
2,500,000,000 x 5.06 = 12,654,083,644
This figure represents the total number of websites which should be in the .us domain on the
assumption that the US has the same number of websites per person as the UK. The final step in this
process was to the divide this figure by the actual number of sites in the US, 705 million, to get the
number which represents what the US website count needs to be multiplied by to get an accurate
representation for the US as a whole. The final figure is 17.95.
All figures which come from the .us domain will be multiplied by this figure to ensure the US is
mapped as accurately as possible. This method was validated by using data on the English language
(Gordon 2005, Snow et al, 1998). Multiplying the US by this figure proved to be accurate according
to official sources.
This method had full backing and support from WorldMapper as this was the closest we could get to
acquiring accurate data on the US.
The other main concern with the quality of data was with the countries that had what can be described
as attractive web domains. These countries have been listed in the section 4.1. As with the US, it was

27
required that the figures extracted from these countries be altered to ensure the highest quality of data
is produced. From obtaining the total population counts of all two hundred countries (WorldMapper,
2009), a correlation between these countries was quickly identified. The populations of these
countries were all minute compared to the population of the world. On average, the population of each
country was just under 100,000.
It was also concluded that none of these countries spoke any of the four languages which were being
mapped from consulting the sources studied from the background research and analysis section (Snow
et al). Having spoken with WorldMapper about this issue, the decision to change the figure for all of
these countries to zero was taken.
Having acquired the data into the desired form, the process of getting the data into different forms was
vital to ensure that countries with limited web connectivity were not ignored. The reason for making
these alterations is due to some countries not being properly represented due lack of internet users.
For example, many African countries such as Morocco and Algeria are strong users of the French
language (Gordon, 2007), however due to their lack of internet capabilities; the data recorded from
their TLD was low and did not fully represent the number of speakers within the country. For the sake
of removing these issues, alterations had to be applied by manipulating the data on the country’s
population.
An example of why these alterations to the data were required can be taken from the language
speakers of Madagascar. According to the Gordon (2005), Madagascar is a francophone country with
French being spoken by the majority of educated individuals. Madagascar, however, has only got
110,000 web users in comparison to its population of 16.9 million. As a result, the number of websites
within its TLD is very small in comparison to its population. Using the hits data alone would mean
countries like Madagascar would be ignored.
All alterations were made using simple calculations in a spreadsheet application and all outcomes
were thoroughly analysed and discussed with both Eric Atwell and WorldMapper to ensure the
highest quality dataset was created. The following section reviews the techniques throughout this data
preparation stage.
4.2.1 Domain Percentage Maps
In a bid to remove the issue with the US as well as countries with limited internet access, the idea to
work out the total number of websites in each domain compared to websites believed to be in each
language was used. This originally consisted of obtaining total website counts for each domain.
HitsRetriever was used to retrieve these figures by simply using the following search for each domain:
“site:.uk”

28
Obtaining this figure enabled the data to be manipulated to see what proportions of all sites are within
a certain language within each country. For instance, if there were ten websites in the .uk domain
with seven of them believed to be in English, we could conclude that seventy percent of the .uk
domain contains websites in English. Using this method removes the issue of low webpage counts as
it’s only the proportion of websites which is being looked at. The following equation was used to
calculate these figures.
(Number of language websites in domain / Total websites in domain) * 100
Running this method through the data sets provided some interesting results. The top 5 countries for
the English language were:
1. Uganda – 59%
2. Papua New Guinea – 58%
3. Liberia – 57%
4. South Africa – 50%
5. Kenya – 48%
Although initially these results seemed surprising, it was soon clarified that these countries were
heavy users of the English language with minor influences from other languages (Snow et al, 1998). It
must be remembered that the figures collected do not represent the total number of websites in each
language; they merely are a count of websites which contain the two key words identified in section
4.1.5. Table 4a below shows the top 5 countries for all four languages.
Table 4a – Domain Percentage Results
Language English French Hungarian Arabic
1 Uganda Burkina Faso Hungary Saudi Arabia
2 Papua New
Guinea
Central African
Republic Morocco Iraq
3 Liberia Equatorial Guinea Romania
Syrian Arab
Republic
4 South Africa Mali Slovakia
Gaza Strip &
West Bank
5 Kenya France
Serbia &
Montenegro Qatar
Having made these alterations to the four languages, the data was exported to the WorldMapper
template ready to be sent off to be mapped. These maps will be referred to as the ―Domain
Percentage‖ maps.

29
4.2.2 Speakers Maps
Due to the domain percentage maps not illustrating the numbers of speakers for each language, the
decision to manipulate the data further to give the user an idea of actual speakers was taken.
The way this was originally done was by multiplying the data used for the domain percentage maps
by the count of internet users. While at the time this sounded like a logical idea, the data which was
produced proved to be noisy and again carried the issue of not distributing the countries with poor
internet facilities such as Cambodia and Mali whose internet users make up less than one percent of
the country’s total population.
Due to these findings, the decision to use the population counts as a means of manipulating the data
was taken. The data used for the domain percentage maps was multiplied by each country’s
population.
Using this method enabled us to show the data in the respect of total speakers rather than first
language speakers. From initial reviews of the data, positive results were extracted. The top five
countries for the French language were:
1. France
2. Morocco
3. Burkina Faso
4. Algeria
5. Mali
Interestingly, in third, Burkina Faso was listed. This was a country which I had little knowledge of.
Research into the language usage from Burkina Faso (Gordon, 2005) showed that countries primary
language was French with very limited influence from other languages. With a population of 12
million, it is not surprising that this country ranked so high.
After validating the results for all language, the decision to use the data in this form was taken as a
means of showing the total use of each language across the world rather than simply showing first
language users. Using this method successfully removed the surrounding issue with countries with
limited internet facilities as well as the issue surrounding the United States. Table 4b below shows the
figures recorded for all four languages.

30
Table 4b – Speakers Results
Language English French Hungarian Arabic
1 India France Hungary Saudi Arabia
2 Pakistan Morocco Morocco Iraq
3 United States Burkina Faso Romania Egypt
4 Nigeria Algeria Slovakia Syrian Arab Republic
5 Philippines Mali Serbia & Montenegro Islamic Republic of Iran
The data created for these cartograms will be referred to as the ―Speakers‖ maps.
4.2.3 Total Language Users
The final data set which was created was the total language user’s maps. The data provided for these
maps was the original data showing the count of websites within each TLD. Alterations to the United
States as previously discussed were applied to the data. All countries with popular TLDs had their
figure set to zero, as also previously discussed. Using the data in this form was the original purpose of
this project. The other maps had been produced as a means of showing the distribution of each
language in a different format to combat issues such as poor internet capabilities. Table 4c below
displays the top 5 countries for each language:
Table 5c – Total Language Users Results
Language English French Hungarian Arabic
1 United States France Hungary Saudi Arabia
2 United Kingdom Canada Romania United States
3 Australia Belgium Slovakia Islamic Republic of Iran
4 Canada Switzerland Germany United Arab Emirates
5 Germany Germany Brazil Kuwait
4.2.4 Additional Requirements
Reflecting on comments on the Additional requirements received from the Mid-Project report, the
decision to create additional maps showing different distributions was taken rather than mapping
additional languages. It was concluded that using the HitsRetriever to show other distributions would
be a more challenging task whilst also demonstrating the capabilities of the program to gather data for
other areas of research.

31
4.2.4.1 Total Websites
As the data on total number of websites within each web domain had been gathered for the use of the
domain percentage maps, this data was formatted and put into a WorldMapper template ready for a
cartogram image to be created.
To make the map more interesting, the data has been left in its natural form with data representing the
United States as well countries with popular web domains being left in their natural state to show a
perfect distribution of websites including all anomalies. The top 5 countries which had the largest
number of websites are displayed below in order:
1. Japan
2. Germany
3. China
4. United Kingdom
5. Russian Federation
4.2.4.2 UK and US English
The second set of additional maps which were created was the distribution of the comparisons
between the use of UK English and US English throughout the world. Having undergone a
coursework on this topic during the Technologies for Knowledge Management module, knowledge on
this distribution as well as the differences between the languages had already been acquired.
The differences between the two alterations of the language were mapped by conducting searches of
common English words which had slight spelling alterations between the UK and US. From
consulting different sources (Huddlestone 2002, Beare 1997) it was decided that the following word
alterations would be used:
Centre / Center
Colour / Color
Following similar methods used in the Speakers maps, the hits recalled from each search were divided
by the total number of websites in each web domain and then multiplied by the total number of web
users within each country. Table 4d below summaries the data manipulated in its final format:

32
Table 4d – UK English and US English Results
Language UK English US English
1 United Kingdom United States
2 India India
3 Canada China
4 Australia Philippines
5 Malaysia Germany
Mapping additional distributions such as the total number of websites in each domain and the
differences between UK and US English demonstrates the ability the HitsRetriever has to collect data
for other distributions.
Having collected and formed all the final data sets, as part of the data preparation stage of the CRISP-
DM methodology, it was time to move onto the next stage which is the modelling phase. The
modelling phase includes the production on the final product using data collected from the data
preparation phase. The next section will explain the steps taken to get the cartograms produced.

33
5 Presentation Phase
5.1 Modelling
As this project was intended for the production of WorldMapper images, it was the WorldMapper
visualisation tool which was used to display the data however alternative visualisation techniques and
applications have also been reviewed within this section.
5.1.1 WorldMapper
Throughout the project, all data collected had been formatted and collected with the WorldMapper
application and template in mind. This meant that adapting the final data sets into a form suitable for
the visualisation application was a simple process. To acquire the images, templates containing the
final datasets were sent off the John Pritchard from WorldMapper. The maps were them emailed to
me when they were complete. It had been discussed at the start of the project that WorldMapper
would give their full commitment throughout this project in getting cartograms produced as quickly as
possible.
The maps produced by WorldMapper and can be found in the appendix chapter under the following
structure:
Cartogram Name Location
English Total Appendix D
English Domain Percent Appendix E
English Speakers Appendix F
French Total Appendix G
French Domain Percent Appendix H
French Speakers Appendix I
Arabic Total Appendix J
Arabic Domain Percent Appendix K
Arabic Speakers Appendix L
Hungarian Total Appendix M
Hungarian Domain
Percent Appendix N
Hungarian Speakers Appendix O
Web Domain Total Appendix P
UK English Appendix Q
US English Appendix R
The evaluation of these cartograms occurs in the evaluation phase of this report.

34
In a bid to visualise the data in a different format to reduce the risk of failure to get the WorldMapper
images produced on time, other visualisation tools were looked at. GapMinder, which was brought to
my attention by Ken Brodlie, the project assessor, is the first tool which was looked at.
5.1.2 GapMinder
GapMinder is a visualisation tool capable of displaying data in a scatter graph style format with the
ability to enable the user to interact with the graph by editing the graphs parameters and altering the
axis’s (GapMinder, 2009). To be granted access to the full system, an application had to be submitted
stating your intentions of use with the program as well as your area of study. Whilst waiting for a
response to my application, there was a free version available on iGoogle called Motion Chart which
could be explored. Following the instructions on the Motion Chart website, a data file using the
existing data collected for the WorldMapper images was able to be quickly produced and fed into the
visualisation tool. Figure 5a below provides a view of the Motion Chart displaying the use of the
French language across the world:
Figure 5a – Motion Chart – French Language Distribution
The data on the x axis is plotted using the countries Internet User count with the y axis containing the
website counts taken from the French Total map. To get the full potential of the system, it requires the
user to be able to interact with the data or to have the data shown as a moving image, hence its name,

35
MotionChart. For illustration purposes, this image has been taken with Canada having been selected
to show the data which is then displayed when interacting with the chart. Clicking on each data point
displays numerical details of each point.
Unfortunately, having sent numerous follow up emails to my initial application, no return email was
ever received resulting in the use of full program not being an option. Due to Motion Chart being on
iGoogle, this chart could only be accessed by the Google account holder and therefore would be
impossible to send this to other users such as academics and linguists.
5.1.3 Alternative Cartogram Applications
A study of existing cartogram applications took place to check if creating my own maps was an
achievable option.
The FAQ section of the WorldMapper website (WorldMapper, 2009b) contains web addresses to
applications which allow the user to attempt to plot their own maps.
The source code which is used to produce WorldMapper images is provided by Mark Newman on his
website. Before any program could be tested it was necessary to download Vmap level 0 which is a
1GB file including a clear map of the world. Having had no experience in this field before, contact
had been made with Mark Newman requesting for some guidance in producing my own maps using
his source code. Mark had strongly advised me that undergoing the creation of a cartogram with no
prior knowledge of the application is a very challenging and time consuming task which required
advanced programming skills. Mark recommended sticking with getting the WorldMapper images
created for me by the WorldMapper team.
Eager to attempt producing my own maps, I downloaded a java based version of Newman’s code
called Scape Toad. In order to get the program to work, a layer containing a plot of the world was
required. Obtaining this from WorldMapper was not an available option due to copy write and size
issues. This meant that the use of the Vmap level 0 file was required. Having spent numerous days
trying to understand the map and how I could get it into the right format into the program, I realised
that this task was too time consuming for the benefits which would have been received. Due to
looking at other applications being an additional requirement, it was important that these tasks did not
jeopardise the delivery of the minimum requirements as well as causing delays to the project as a
whole.
5.1.4 Conclusion of modelling techniques
To conclude, the additional modelling techniques looked at all had their own unique benefits however
complications described above meant the full functionality of each program was not explored fully.
Ideally, having had more time, the production of my own cartogram images would have been an

36
interesting addition to the project however the effort required to undergo such a task was too large for
this project.
GapMinder is an incredibly powerful tool enabling data to be shown in an innovative manor however
due to application requiring the user to be at a computer to view it properly, it is not in a suitable form
which could be used by linguistics journals.
37
6 Evaluation
Due to the variety of processes which have taken place throughout the project, there are a number of
methods which are used in this evaluation process. A reflection of the project requirements will be
used as a means of evaluating the final product. The cartogram images which have been created will
then be thoroughly examined and evaluated in comparison with the cartograms created using official
sources by WorldMapper. Finally, views of linguistics experts and the WorldMapper team will be
used to evaluate the maps as well as the methods and techniques used to produce and alter the data for
the maps.
6.1 Testing
The testing phase which took place at the start of the project was an integral part to the project’s
success. Many of the lessons learnt which came out of this testing phase contributed greatly towards
creating a data set of the highest quality. Without the use of this testing process, the quality of the
final product would have been greatly affected.
As a result, the testing phase was a huge success which set the foundations for the project.
6.2 Requirements Evaluation
This stage of the Evaluation will look at the minimum requirements of the project as a means of
judging whether the problem has been solved. The first minimum requirement was:
1. Use data mining techniques to gather data suitable for creating WorldMapper cartograms
showing the use of languages throughout the world for at least four different languages.
Data mining techniques which had been researched at the start of the project have been used
throughout the project to ensure a high quality dataset is gathered from web data providers. The
CRISP-DM methodology has been used throughout to ensure the project sticks to its objectives as
well as sticking to the project schedule (see Appendix B). This requirement has been successfully met
due to the creation of multiple WorldMapper images being created in the English, Arabic, Hungarian
and French languages.
Data mining techniques were also applied throughout creation of the HitsRetriever application which
was build specifically for this project.
The second minimum requirement was:
2. Review of techniques and frameworks used for data mining on at least two different web data
providers.

38
A review of the Google and Yahoo search API’s capabilities was conducted at the start of the project.
It was concluded at an early stage that using the Google AJAX API was not going to be an option for
this project due to the lack of a personal website as well as other issues discussed in section 3.5.1.
The review of the Yahoo Search API concluded that it had the capabilities of allowing an application
to be build to automatically to retrieve and store the data required to produce cartogram images.
Continual reviews of the Yahoo Search API were undertaken throughout the data understanding
phase. Acquiring advanced knowledge of how the API worked was required to enable an application
to be built.
The final minimum which was set out was:
3. Review of the potential uses and users of the WorldMapper images.
The review of potential users as well as feedback received is discussed further on in this chapter.
Linguistic experts from across the world had been contacted to acquire their opinions on the maps as
well checking if there would be a potential use for the maps within their area of study. This
requirement was put in as a means of ensuring solid evaluation of the end maps took place.
The next set of requirements which will be looked at are the additional and optional requirements set
out at the start of the project.
1. Additional maps for different languages.
As previously discussed, the decision to gather data for different types of maps rather than other
languages was taken. Creating maps for an additional language does not have as much of an impact as
displaying new distributions as this is a better means of showing the potential and capabilities of the
HitsRetriever. The decision to create data for other distributions was also influenced on comments
received from the Mid-Project report.
This altered additional requirement has been met through the means of the production of the UK and
US English maps as well as the total websites in each domain map. We are currently in an email
exchange with an English journal discussing the potential uses of these UK and US English maps.
The second additional required was:
2. WorldMapper images created using different data to check comparisons between the two sets.
During the early stages of the project, I was informed that WorldMapper would be creating their own
maps using official sources such as census data and language journals. Rather than creating my own

39
using similar sources, these maps have been reviewed and used to compare the key differences
between the two sets of maps as part of the evaluation process.
The final additional requirement was:
3. The use of other visualisation tools to display the same data sets in a different manor to increase its value and data understanding.
The study of other visualisation tools took place during the presentation phase. Many of the
applications studied had high potential to show the data in a different manor however due to
complications experienced, no additional visualisations were created due to the constraints discussed
in section 5.1.
6.3 WorldMapper Cartograms Evaluation
Upon receiving the maps back from WorldMapper, evaluation of these maps took place as a means of
validating my results. Each language will be evaluated individually throughout this section to ensure a
careful evaluation process is applied.
Before looking at each language, the three types of language maps will be looked at individually to
demonstrate and evaluate what they are showing. The first we will look at is the Total map.
6.3.1 Total Hits
The Total Hits map series is a solid means of showing the distribution of first language speakers
across the world over the internet. One of the key finding of this project is that using data from the
internet will only show the spread of each language over the internet rather getting an understanding
of total number of speakers for each language. The figures collected merely represent website counts
and cannot be used to represent the exact numbers of speakers within each country. The purpose of
this project is to use data mining techniques to show the distribution of each language rather than
create numbers stating how many speakers there are of each language. Overall, I was extremely
pleased with the outcome of this series of maps as the outcomes which can be found in the appendix
represent what a user would expect from each language. For example, looking at Appendix D, it is
clear to see the United States, The United Kingdom and Australia are the main users of the English
language. These results tie in closely with official data provided from Ethnologue (Gordon, 2005).
Although there is the issue with countries with limited internet capabilities not being mapped, these
issues are also present when using journals and census data as it can be difficult to acquire language
data for the poorer countries in the world.

40
6.3.2 Domain Percent
The Domain Percent map set is an interesting way of representing each country by removing the issue
of poor internet capabilities. I believe that this series of maps is an innovative way of highlighting
countries which are strong uses of each language regardless of the country’s total number of websites
or population. From reviewing the Domain Percent maps, it is clear that displaying the data in this
format removes the issue of African countries not being mapped. There are many countries like
Morocco who are strong users of French language who have not been mapped on the Total Hits (see
Appendix G) map due to their poor web facilities. As you can see from looking at the Domain Percent
map for French (see Appendix H), these Francophone African nations have been made clearly visible.
6.3.3 Speakers
The final sets of maps are the ―Speakers‖ maps. These maps are a great way of illustrating the
distribution of each language taking population counts into perspective. From looking at Appendix D,
the Total Hits map for English , you will notice that India is relatively small compared to other
countries however when contrasting this to the speakers map (see Appendix F) , India has been
increased dramatically representing the English speakers throughout the country. The use of English
within India has been growing rapidly due to the rise in demand for IT skills from Indian graduates
(Overby, 2003).
Overall, the outcomes of these maps are strong, enabling the user to get clear understanding of where
each language is spoken the most.
6.4 WorldMapper Review
John Pritchard from WorldMapper kindly put together a document summarising his thoughts on the
maps which I had produced. This document can be found in Appendix T.
Generally, the thoughts which I have expressed on the three sets of maps are similar to those of John
Pritchard. John’s notes on the Total Hits maps are mainly aimed towards the issue of the countries
who are not technologically advanced as well as his concern over the English language due to it being
primarily an international language. Due to complex nature of these issues, it was difficult to combat
them in the best way possible however I believe the steps which were taken to combated these issues
was the best that could have been done using this type of data. This view is shared by John and
expressed through his opening statement ―Congratulations on developing your method and software
for obtaining this data, I think you’ve come a long way for an undergraduate project‖.
The second map which John commented on was the Domain Percent set. The comments on this map
are more towards the finding of the cartograms and what they are showing. As previously discussed,
structuring the data in this way allows the user to view the distribution of languages in a way that has

41
never been plotted before. John had commented on the issue of the data used for the English language
being relatively low compared to his expectations. He does however understand that the data only
represents the count of websites which contain the two key search terms used for each language. It is
important that the data sets which have been used to create these maps are ignored and that the
visualisation displayed through the cartogram maps are the key focus point. This is due to the
numbers used not actually representing anything apart from proportions of websites.
John’s comments on the ―Speakers‖ maps are very positive branding the methods used as a ―useful
means of estimating the number of speakers for each language‖. As John has been working on
producing maps displaying first language speakers, many of his comments concentrate on the issue of
the English language and its difficulty to map it efficiently. Due to the presence of the English
language over the world, many organisations publish their websites in English or have a translated
equivalent. As a result, using the web to show the distribution of the English language was the hardest
language to plot out of the four covered. It must be remembered however that using the maps in their
current form is still highly valuable to linguists as it enables them to view what the use of English is
over the internet rather than its general use. With the internet becoming a dominant part of people
lives, these relationships need to be understood to ensure a thorough understanding of each language
is obtained.
6.5 Map Comparisons
As previously mentioned, WorldMapper have been actively creating their own maps using a range of
resources. As part of my evaluation, I will be looking at the differences between the two sets of maps
to see what correlation, if any, exists. As the Total Hits map is the closest to showing first language
speakers of each language, these maps will be used to make the comparisons with the WorldMapper
images. The first comparison which we will look at is with the English Language.
The cartogram images from WorldMapper were supplied to me in a very small resolution. As a result,
the four maps have been distributed between Appendix S from S1 to S4.
6.5.1 English
Appendix S1 contains the map created by WorldMapper. While contrasting this with the English
Total Hits map in Appendix D, it is clear to see the strong correlation between the two maps. The size
of America compared to the rest of the world in both maps is very similar showing that the method
used to enhance the size of the US was successful. Interestingly, other European countries have not
been enlarged in the WorldMapper image as much as they have in my images. Due to English being
one of the most spoken languages in the world, this comes as a surprise to me.

42
As well as this, India, China and Japan are also hardly noticeable within the WorldMapper image.
Data taken from ―The future of English?‖ (Graddol, 1997) states that India has only around three
hundred thousand first language speakers however the census data for India states that there are a total
of ninety million speakers of the English language within their country(Census of India, 2001).
Although WorldMapper are using data on mother tongue languages spoken at home, this seems like a
rather large figure to be missing out of the English language map. Appendix F clearly demonstrates
how widely spoken English is within India based on web data.
6.5.2 French
Appendix S2 shows the WorldMapper image of the French language with Appendix G showing the
French Total Hits cartogram. Again, similar to comparisons made with the English language, there are
some strong correlations between the two maps. Interestingly, the maps produced by WorldMapper
has Morocco enlarged a lot more than the data which I had collected. From looking at the web user
count data provided by WorldMapper, I quickly noticed that Morocco only have 20% of its
population using the web compared to Canada who have 77% of its population on the web. As
previously discussed, the issue with African countries is something which has been tackled through
the Domain Percent and Speakers maps. Looking at these two maps for the French language, it is
clear to see that many of the African countries are enlarged greatly due to their close relation with the
French language (Snow et al 1998).
Apart from the differences with Morocco, the rest of the maps are practically identical which again
goes to show that the use of data extraction from the internet is of great quality and high potential.
6.5.3 Arabic
These two maps have the weakest correlation out all the languages studied. The WorldMapper
cartogram enlarges the African countries a lot more than the cartogram which I put together. Again,
this could be due to the lack of internet facilities within these countries. Whilst looking at the Arabic
Speakers map, a stronger correlation can be spotted due to the measures taken to enlarge those
countries. The other major difference between the two maps is with the United States and the United
Kingdom. These two countries have been greatly enlarged on my map. This could be down to many
reasons. One of those being that the data used by WorldMapper is out of data or missing for these two
countries or it could be down to the fact that Arabic is becoming a more widely used language with
businesses producing websites with the capability of translating the page into Arabic.
As you can see, from looking at these images, it is easy to start spotting trends within the data which
can be looked at and examined further by experts.

43
6.5.4 Hungarian
The Hungarian Total Hits map again contained strong correlation with the WorldMapper maps. The
major difference between the two maps is the fact that Hungary in the map which I produced (see
Appendix M), takes up a larger area than it does in the WorldMapper image (see Appendix S4). All
the other countries surrounding Hungary from the WorldMapper image are shown in my map
however they are less visible due to size of Hungary being so large. Interestingly, the UK has been
enlarged slightly in both maps.
Spotting correlations like this displays the value of using cartograms to show language distribution as
it enables the user to spot anomalies within the data which can lead to the discover of new language
distribution trends. For instance, the rise in the use of Hungarian within the United Kingdom could be
an area which could be looked at over the next ten years.
6.5.5 Conclusion
To conclude, it is clear that the correlation between the two sets of maps is incredibly strong
considering that the data for each set of maps has come from two very different sources. From making
these comparisons it was noticeable to see that using the internet to show language distribution is a
reliable source and matches what is shown from official sources in the majority of cases.
What must be remembered is that the data used for the WorldMapper maps are out of data as well as
being far from complete. Using data mining techniques provides up to date data which enables the
ability to start looking at data trends over time if the same data retrieval techniques are utilised. This is
not possible with the census data as it is only collected every ten years by only a proportion of the
world’s countries.
One of the key finding from this evaluation process was the need to compare all three language maps
at once to ensure a solid understanding of each language distribution is achieved. Simply looking at
the Total Hits map does provide the user with a clear image as to where each language is spoken the
most however when using this map as well as the Domain Percentage map or the Speakers map, the
user is able to identify other countries which are also strong users of the language, even if they have a
relatively small populations.
If a user was only capable of looking the Total Hits map, which is the only type of map created by
WorldMapper, they user would struggle to get an indication of the use of the language over the world
as the map is only showing first language speakers. Using the Domain Percent and Speakers maps
allow the user to see where language is used the most. A lot of the countries highlighted through this
technique are not visible through the Total Hits map.

44
After validating the value of the maps, it was then time to get them sent off to the linguistics experts
for their views and comments as part of the final evaluation process for the maps.
6.6 Potential User Evaluation
Obtaining validation on the quality and value of the maps enabled the final stage of the project to go
ahead. This stage consisted in contacting numerous linguistics experts from across the world who
specialise in the languages which have been mapped throughout this project. Receiving reviews on the
maps from these experts is the most thorough way of assessing the final product.
The contact details for the linguistics expects was taken from multiple searches of the internet as well
as consulting the list of journals provided from Technologies for Knowledge Management
coursework on data mining. A simple framework was used to ensure the right people were being
targeted.
All searches included the language of study as well as entering +journal to the end of the search. The
framework which I used ensured looking at the scope and aim of each journal to ensure that these
maps would be of use to their area of study. The reason for this was because I did not want to send
maps to people who did not have an interest with the distribution of a language. For instance, some
journals looked purely at the origins of each language rather than how widely used it is in the present
day.
Appendix U contains the full list of names collected from using the framework stated above. In total,
the contact details for twenty people were recorded.
Before contacting these individuals, it was important to structure a plan of action to ensure the
maximum numbers of replies were received. It was concluded from talks between Eric Atwell and I
that the best way of tackling this would be to get Eric to send the emails on my behalf. The reason for
this was because we believed the chances of the emails being read were greater if the email was
coming from a Senior Lecturer rather than an undergraduate student.
The emails were structured in the follow way. Each email would contain an attachment which had a
summary of the project as well as copies of the maps and the methods used to get the maps created. A
template of this attachment can be found in Appendix V. Eric would then send this attachment to the
people identified earlier with a short paragraph describing why he was contacting them as well
pointing them towards the attachment.
The following replies were received:

45
6.6.1 Professor David Denison – President - International Society for the Linguistics of
English
Generally, the comments received from Professor Denison are very positive. The first line of the
email states ―They look fascinating. Thanks very much for drawing my attention to them‖ suggests
this. It was highly motivating having read this to see that academics and linguistics experts were
finding my area of study interesting as up this point, no feedback had been gathered apart from my
own opinions.
The intension of obtaining feedback from experts was more to get their views on the maps rather than
request them to include the maps in the next issue of their journal. Getting the suggestion from
Professor Denison that there could be a possible use for the cartograms on the International Society
for the Linguistics of English (ISLE) website was a fantastic outcome.
Bas Aarts, the editor of this website, was then contact as a follow up to this email.
6.6.2 Professor Bas Aarts
The email from Aarts was short however again very promising and full of opportunities to use this
work in the future. Professor Aarts stated that he also finds the maps to be very interesting however he
believed that the World English’s journal would be more appropriate for this type of research.
The email concludes by suggesting that perhaps Atwell and Aarts could speak further about this area
of research at the International Computer Archive of Modern and Medieval English (ICAME) coming
up this year.
Although no immediate action were taken from this email exchange, a positive can be taken out of
this exchange as there will be further talks taking place to see where and how these images can be
used.
Similar to the first email, this was very promising news to hear that the hard work put into producing
these cartograms is being valued by experts.
6.6.3 Professor Martin Kayman - European Journal of English Studies (EJES)
Although Kayman believed the project was ―most enterprising‖, he concludes there was no sufficient
place within the EJES in which the cartograms could be used within their current form.
The email goes on to state that for this research to be used, it would have to be produced at an
―international standard‖.
Recent talks between Eric Atwell and John Pritchard from WorldMapper have suggested the
possibility of using the finding from this project as a basis for producing an international standard

46
academic paper. Having identified the need for this research to be produced to a more academic level,
it again illustrates the quality and value of this research and suggests methods in how it can be further
developed
This discovery of the need for a more academic standard journal on his research area was back up by
the email response received from Nick Hewitt
6.6.4 Professor Nicholas Hewitt - General Editor - French Cultural Studies
Professor Hewitt’s email states that the French Cultural Studies Journal only considers academic
articles over five thousand words in length.
It is clear that to get these maps used within the linguistics environment, they would have to be
presented in a more professional format.
6.6.5 Doctor Kees Versteegh - Encyclopaedia of Arabic Language and Linguistics
The final email response received was by Doctor Versteegh from the Encyclopaedia of Arabic
Language and Linguistics.
Versteegh acknowledges that understanding the spread of the Arabic language is vital to Arabic
linguistics.
The Encyclopaedia of Arabic Language and Linguistics comes in 4 volumes with the final volume
having recently been published. Doctor Verteegh does however suggest that the cartograms could be
used as part of the website which is being maintained by Dr. Rudolf. No response has yet been
received by Dr. Rudolf however as discussed with Atwell, I am prepared to contribute to this project
as much as possible after the project deadline to ensure these maps are used to their highest potential.
6.6.6 Potential User Evaluation
One of the main concerns before receiving the feedback from the experts was that the methods used to
collect the data would be questioned. No comments on how the maps were formed had been shared by
any of the six people who responded. This can be taken as a huge success showing that the time and
effort spent on the data understanding and preparation phases resulted in the creation of a high quality
dataset.
The comments received from the experts are all similar in particular ways. The majority of responses
agree that the area of study is very interesting and that the maps could be of great use to them
ensuring that the maps were presented in an appropriate manor.
This was a highly positive means of evaluating the project. Knowing that a demand exists for maps
produced using data mining techniques can be used to conclude that the project has been successful.
47
A look into possible further work which can be conducted as a result of the findings of this project can
be found in chapter 7, the conclusions.
6.7 HitsRetriever
The final application, HitsRetriever, proved to be a very powerful tool towards the end of the project.
Without the use of this automated tool, the quality of the final datasets would have been affected
greatly. Being able to produce data for numerous searches in such a short turnaround time was a huge
achievement which enabled for many searches to take place to ensure the highest quality data could
be collected.
All requirements which had been set for the application (see section 4.1.2) were successfully met.
6.8 Project Management
The careful planning of the project management phase enabled the project to stick to its milestones
and time frames identified within the project schedule. All time scales identified throughout the
schedule were stuck to with no areas of the project over running. Time delays had been experienced
throughout the creation of the HitsRetriever however these delays had been expected and were
accounted for within the project schedule.
The project schedule was arguably brief. Having included additional details on sub tasks within the
schedule would have enabled better time management throughout the project.
Ideally, more time should have been allocated to the evaluation of the cartograms as the time allocated
from the original schedule provided to be too brief as a lot of the conversations being held with
linguistics are still ongoing.
6.8.1 Methodologies
As discussed within the Project Management section, CRISP-DM was selected as the key
methodology of choice throughout the project. CRISP-DM had an influential role in the delivery of
the project. The clear structure identified from its stages not only helped with processing a high
quality data set, it also provided a framework in which this report was written in.
The key lesson learnt from the methodology was to ensure that each stage was successfully
understood before moving onto the next one. For instance, having spent a considerable time on the
understanding the data, it allowed me to form a thorough knowledge of the data I was working with
which led to an increase in the quality of data for the final data sets. If attention to detail was lacking
at this stage, a lot of the issues which arose from the testing phase could have been missed resulting in
noisy data and a drop in quality shown through the cartograms.

48
The use of the CRISP-DM methodology also contributed greatly the creation of the HitsRetriever.
Following a systematic approach enabled the application to be built efficiently whilst avoiding the
threat of hitting possible errors. This happened due to having built up knowledge of the data which I
was working with.
Overall, I believe this project has been a huge success with all objectives set out from the start being
hit.

49
7 Conclusions
In this section we look at the project as a whole to identify achievements as well as identifying
possible enhancements and further work which could be taken to progress the findings of this project.
The aim of this project was the collect high quality data sets for the production of cartogram images
showing the distribution of world languages. The languages which were studied were France, English,
Arabic and Hungarian. These requirements have been successfully achieved and displayed throughout
the project report.
The mapping of the distribution of the four languages has been achieved through the creation of three
different maps illustrating the distribution in numerous ways.
Although the production of these datasets was the key deliverable for the project, the key findings of
the project is that the use of data from web data providers can be used and accurate means of
displaying the distribution of languages across the world ensuring the methods used throughout this
project are used.
The comments received from experts amplify this as well as the comparisons taken with the
WorldMapper images.
7.1 Possible Enhancements and Project Ideas
There are numerous ways in which this project could be enhanced. These enhancements, as well as
some project ideas have been discussed the sections below.
7.1.1 HitsRetriever
Currently, the HitsRetriever requires some programming skills to use it as there is no interface to the
program. Editing the search terms and documents in which the results are stored requires the user edit
the python code to suit their needs.
A possible project idea could be to create an interface level on top of this so that users could interact
with the system regardless of their programming abilities. This interface would allow for search terms
to be easily entered to the program as well as selecting which domains are searched. On top of this,
some sort of measure could be used to alter the search results of the .us domain automatically to
increase turnaround time. This program could also be adapted to use on other search engines.
Appendix W contains a user manual created for future users of the HitsRetriever.

50
7.1.2 Further Maps
The creation of further maps could also be a possible enhancement which could be undertaken.
WorldMapper have produced language distribution maps for as many languages possible, it would be
interesting to get all of these maps produced using web data to contrast all languages.
There is also the ability to map languages which have limited to no data on its distribution due to the
remoteness of the language.
This type of research would be very effective whilst looking at the distribution of languages over a
given period of time. For instance, collecting this data perhaps every 6 months for the next ten years
and then contrasting the findings would be a fantastic way to show how each language is spreading
and evolving over the web. This could be an exercise which linguistics experts could undergo. As a
result, I have produced a simple user manual for anyone wanting to use this software in the future.
This manual can be found in Appendix W.
Recently, the Dharug language has been revived throughout some schools in Australia (Mercer,
2009). Linguistics studying this language could use the HitsRetriever to monitor the increasing spread
of this language over the internet.
The HitsRetriever has already shown its capabilities of producing maps for different distributions.
Further collaboration with WorldMapper could see to the production of further maps.
As is it clear to see, there are numerous ways in which this area of research could be further adapted
after this project has been completed.
7.2 Academic Journal
The final way in which this project could be enhanced is through the production of an academic
journal building upon the findings of this report. As identified from the evaluation of responses
received from linguistics experts, there is a demand for this research area to be turned into an
international standard academic journal. Currently, the maps are only supported with a brief
description of how they were made which is restricting these uses with the linguistics environment.
As previously mentioned, Eric Atwell and John Pritchard from WorldMapper have already discussed
the creation of such a journal. I sincerely hope this goes ahead as it clear that the demand for such a
publication is desired.

51
8 References
BAEZA-YATES. R. 2006. Characterization of National Web Domains [online].[Accessed 22nd Jan
2009]. Available from World Wide Web:
<http://www.chato.cl/papers/baeza_05_characterization_national_web_domains_countries.pdf>
BARONI. M and M. UEYAMA. 2004. Retrieving Japanese specialized terms and corpora from the
World Wide Web [online].[Accessed 24th Nov 2008]. Available from World Wide Web:
<http://sslmit.unibo.it/~baroni/publications/konvens2004/jpbootKONV.pdf >
BARONI. M and S. BERNARDINI. The BootCaT Toolkit - Simple Utilities for Bootstrapping
Corpora and Terms from the Web [online].[ Accessed 1st Dec 2008]. Available from World Wide
Web: <http://www.pnas.org/content/101/20/7499.full.pdf+html>
BEARE, K. 2008. Differences Between American and British English [online].[Accessed 23rd Feb
2009]. Available from World Wide Web: <http://esl.about.com/library/weekly/aa110698.htm>
BLACHMAN. N and J. PEEK. 2009. Google Search Operators - Google Guide [online].[Accessed
16th Nov 2008]. Available from World Wide Web:
<http://www.googleguide.com/advanced_operators.html>
BOLDI. P., B. CODENOTTI, M. SANTINI and S. VIGNA. 2009. Structural Properties of the African
Web [online].[Accessed 10th Dec 2008]. Available from World Wide Web:
<http://www2002.org/CDROM/poster/164/>
BRAMER, M.A. 1999. Knowledge Discovery and Data Mining. Short Run Press: England
BRIN. S. and L. PAGE. 2009. The Anatomy of a Large-Scale Hypertextual Web Search Engine
[online].[Accessed 2nd Dec 2008]. Available from World Wide Web:
<http://www.iicm.tugraz.at/thesis/cguetl_diss/literatur/Kapitel07/References/Brin_et_al._1998/TheAn
atomyofGoogle.html>
CENSUS OF INDIA. 2001. Census of India - Statement 1[online].[Accessed 29th May 2009].
Available from World Wide Web:
<http://www.censusindia.gov.in/Census_Data_2001/Census_Data_Online/Language/Statement1.htm>
CHAPMAN, P., J. CLINTON, R. KERBER, T, KHABAZA, T. REINARTZ, C. SHEARER and R.
WIRTH. 2000. CRISP-DM step-by-step data mining guide [online].[Accessed 12th Nov 2008].
Available from World Wide Web: <http://www.crisp-dm.org/CRISPWP-0800.pdf>
CHUN, J. 2001. Core Python Programming. Prentice Hall PTR: Upper Saddle River
DAWSON, M. 2003. Python Programming for the absolute beginner. Premier Press: Boston
52
DREZNER. D.W. 2001. Sovereignty for Sale - Why it’s never been more profitable to be a nation-
state than in today’s non-nation-state world. [online].[Accessed 21st Dec 2008]. Available from
World Wide Web: <http://www.foreignpolicy.com/Ning/archive/archive/126/drezne.pdf >
EKSTROM. J.M.M. 2000. The humid forests of New Caledonia: biological research and conservation
recommendations for the vertebrate fauna of Grande Terre. CSB Conservation: London
ELMASRI. R and S.B. NAVATHE. 2003. Fundamentals of Database Systems. Fourth Edition.
Pearson: International
ETHNOLOGUE. 2009. Introduction to the SIL Bibliography [online].[Accessed 19th Nov 2008].
Available from World Wide Web: <http://www.ethnologue.com/biblio_docs/biblio_intro.asp#intro>
GANSTER, M.T. and M.E.J. NEWMAN. 2004. Diffusion-based method for producing density
equalizing maps [online].[ Accessed 26th Nov 2008]. Available from World Wide Web:
<http://www.pnas.org/content/101/20/7499.full.pdf+html>
GAPMINDER. 2009. FAQ – Gapminder.org [online].[Accessed 29th Feb 2009]. Available from
World Wide Web: <http://www.gapminder.org/faq_frequently_asked_questions>
GARRETT. J.J. 2005. Ajax: A New Approach to Web Applications [online].[Accessed 7th Dec
2008]. Available from World Wide Web:
<http://www.robertspahr.com/courses/cwd/ajax_web_applications.pdf>
GASTNER, M.T., C.R SHALIZI and M.E.J Newman. 2006. Maps and cartograms of the 2004 US
presidential election results [online].[Accessed 23rd Nov 2008]. Available from World Wide Web:
<http://www.pnas.org/content/101/20/7499.full.pdf+html>
GOOGLE. 2009. Google AJAX Search API - Google Code [online].[Accessed 13th Dec 2008].
Available from World Wide Web: <http://code.google.com/apis/ajaxsearch/>
GORDON, R.G. 2005. Ethnologue: Languages of the World, 15th edition. SIL International:
GRADDOL. D. 1997. The future of English? [online].[Accessed 13th May 2009]. Available from
World Wide Web: <http://www.britishcouncil.org/learning-elt-future.pdf >
HODGSON. L. 2002. .US Domain Names - Born in the USA [online].[Accessed 21st Dec 2008].
Available from World Wide Web: <http://www.sitepoint.com/article/us-domain-names-born-usa/>
HUDDLESTONE, R and G. PULLUM. 2002. The Cambridge Grammar of the English Language.
[online].[Accessed 27th Feb 2009]. Available from World Wide Web:
<http://catdir.loc.gov/catdir/samples/cam033/2001025630.pdf>

53
HUNSTON. S. 2002. Corpora in applied linguistics. Cambridge University Press: Cambridge
IANA. 2009. IANA — Root Zone Database [online].[Accessed 17th Dec 2008]. Available from
World Wide Web: <http://www.iana.org/domains/root/db/>
KATZNER, K. 2002. The Languages of the World. Routledge: London and New York
KEITH. M. and M. SCHINCARIOL. 2006. Pro EJB 3: Java persistence API. Apress: Calif
LUTZ, M. 2006. Programming Python. O’Reilly: Farnham
MASON. O. 2008. Developing Software for Corpus Research [online].[ Accessed 31st Nov 2008].
Available from World Wide Web:
<http://dialnet.unirioja.es/servlet/fichero_articulo?codigo=2729166&orden=0>
MERCER. P. 2009. Lost Aboriginal language revived [online].[Accessed 18th May 2009]. Available
from World Wide Web: <http://news.bbc.co.uk/1/hi/world/asia-pacific/7992565.stm>
OVERBY. S. 2003. The Hidden Costs of Offshore Outsourcing [online].[Accessed 23rd May 2009].
Available from World Wide Web: <http://www.ibmemployee.com/PDFs/CIO_Hidden_Costs.pdf >
PONCELET. P., F. MASSEQLIA and M. TEISSEIRE. 2007. Data Mining Patterns: New Methods
and Applications. Information Science: London
RITTER, D. 2001. LabVIEW GUI: Essential Techniques. McGraw-Hill Professional.
ROBERTS. A. 2006. Andrew Roberts - Software – JbootCat [online].[Accessed 14th Dec 2008].
Available from World Wide Web: <http://www.andy-roberts.net/software/jbootcat/#docs>
ROUNDS. C. 2001. Hungarian: an essential grammar. Routledge: London
SHAROFF. S. 2006. Creating General-Purpose Corpora Using Automated Search Engine Queries.
[online].[Accessed 25th Nov 2008]. Available from World Wide Web:
<http://wackybook.sslmit.unibo.it/pdfs/sharoff.pdf>
SHEARER, C. 2000. The CRISP-DM Model: The New Blueprint for Data Mining [online].[Accessed
12th Nov 2008]. Available from World Wide Web: <http://www.crisp-dm.org/News/86605.pdf>
SHELLY. G.B., T.J CASHMAN and J.L. STARKS. 2001. Java programming : complete concepts
and techniques. Course Technology: Boston / London
SNOW. C., C. BAKER and S. JONES. 1998. The Encyclopaedia of bilingualism and bilingual
education. Multilingual Matters Ltd: London

54
STEINBERG. P.E and S.D. MCDOWELL. 2003. Mutiny on the bandwidth: the semiotics of
statehood in the internet domain name registries of Pitcairn Island and Niue [online].[Accessed 17th
Dec 2008]. Available from World Wide Web: <http://mailer.fsu.edu/~psteinbe/garnet-
psteinbe/nms.pdf>
U.S CENSUS BUREAU. 2000. Language Use and English-Speaking Ability: 2000
[online].[Accessed 17th Dec 2008]. Available from World Wide Web:
<http://www.census.gov/prod/2003pubs/c2kbr-29.pdf>
WIKITONARY. 2009. Witionary. [online].[Accessed 29th Jan 2009]. Available from World Wide
Web: < http://www.wiktionary.org/>
WIRTH, R and J. HIPP. 2000. CRISP-DM: Towards a Standard Process Model for Data Mining
[online]. [Accessed 2nd December 2008]. Available from: <http://sunwww.informatik.unituebingen.
de/forschung/papers/padd00.pdf>
WOLFGANG, T. and A. CERMÁKOVÁ. 2002. Corpus linguistics: a short introduction. Continuum:
London
WORLDMAPPER. 2009. WorldMapper: The world as you've never seen it before [online].[Accessed
12th Nov 2008]. Available from World Wide Web:
<http://www.worldmapper.org/display.php?selected=2>
WORLDMAPPER. 2009b. Worldmapper: The world as you've never seen it before.
[online].[Accessed 14th Dec 2008]. Available from World Wide Web:
<http://www.worldmapper.org/faq.html>
WU, C. 2006. An Introduction to Object-Oriented Programming with Java. McGraw-Hill: New York
YAHOO. 2009a. Yahoo! Search Web Services – YND [online].[Accessed 7th Dec 2008]. Available
from World Wide Web: <http://developer.yahoo.com/search/>
YAHOO. 2009b. Search Tips [online].[Accessed 16th Dec 2008]. Available from World Wide Web:
<http://help.yahoo.com/l/us/yahoo/search/basics/basics-04.html>

55
Appendix A: Project Reflection
Due to being a Computing for Business student, the choice of possible projects to undergo from the
start were limited due to the large number of project suggestions requiring many of the programming
modules as pre requisites which I did not have. As a result, I was worried that this lack in
programming ability would hinder my ability to succeed in this final year project. Having been
informed of this project idea whilst attending the Technologies for Knowledge Management module
taught by Eric Atwell, I quickly realised that this project was highly suited to my abilities as well as
my degree program.
The level of programming required throughout the project was challenging and required a lot of late
nights to get the HitsRetriever fully functional. Had this project required any more programming, I
believe it would have been a struggle to complete the project as my abilities were pushed to the limit.
Having spent a year out working as a Project Manager for BT, I was used to working closely with
third party clients. This experience helped greatly when it came to co-ordinating with the
WorldMapper team. I believe all dealings with third parties were conducted which a professional
attitude which led to a strong relationship being formed between myself, Eric Atwell and
WorldMapper. It is important to understand that dealing with third parties can sometimes be a time
consuming process as typically they are busy on their own projects and are unable to provide you with
one hundred percent commitment to your project. My suggestion to other final year students would be
to allow for enough time for individuals to reply to your emails. This approach could have been
adopted better within the evaluation of my project. The emails sent to the linguistics experts were sent
out between two to three weeks before the project deadline. Ideally, reflection on lessons learnt, these
would have been sent out earlier to allow for more replies to be received as well as responses to be
sent to receive further thoughts from those interested in using the maps. Although I had six responses,
I am sure responses will be received after the completion date for this project. The knowledge that
plenty of time should be given when waiting for a response is something which I have learnt from and
something which will help me drastically within a business environment.
The key problems which occurred throughout the project were with the weighting on my semesters,
the Google API tool and the difficulties with certain web domains. The majority of my third year
modules were taken in the first semester. The reason for this was due to lack of flexibility in choice as
my prerequisites only allowed me to study Information systems (IS) and Databases (DB) modules,
which were primarily during the first semester. Selecting modules which I was not comfortable with
would have been the only way to have overcome this issue. Having spoken with other students, many
believe that having less modules in the second semester is the optimal way to tackle a final year
project. Although it gives you a lot of time to concentrate efforts on the project without having to
juggle other modules, it still reduces the time frame in which you can work within. My advice to

56
future students would be to get as much done in the early stages as possible ensuring sufficient time is
allocated towards the evaluation of the project.
Looking back, I believe the project schedule could have been more detailed containing a breakdown
of each task rather than scheduling each topic as a whole. As a result, the schedule did not allow me to
use it to its full potential; it was primarily used to ensure I kept on track in regards to time allocation.
A Mind Map was produced after the creation of the schedule which contained a breakdown of all
tasks which needed to be completed. Ideally, this would have been included into the schedule
however due to the weighting of semesters, I did not have the insight at the time to realise what tasks
were required to be taken over the projects duration. I would advise any future students to finalise a
table of content as soon as possible as this greatly helps with the structure and delivery of the project.
Also, the uses of mind mapping applications are highly suited to these types of project. Having
mapped everything down, I was able to ensure all tasks were completed as well as then using it as a
guide to writing up the final report. The use of mind mapping application has been a valuable tool to
me and is again something I would recommend future student. There are many free applications
available from the web as well as being available from an ISS computer station.
A lesson learnt in regards to topics covered from this project is with sticking tightly to the chosen
methodology. If undergoing a data miming or data extraction project, it is vital to fully understand the
business requirements as well as gaining a thorough insight into the data which is being collected. It is
important that the data which is being studied is fully understood before moving to the next stage of
extracting it and using it within modelling techniques. A slow methodical approach is key to the
success of the project of this nature.
One of the mains lessons learnt is persistence and motivation. At times, I was deeply concerned that I
was going to be unable to put together the HitsRetriever. Persistence and constant attention to the
development of this application resulted in success. I have learnt that if my put my mind to something,
and really give it everything I have, I can achieve it. This project has helped me realise this.
To conclude, I am incredibly pleased with my final product, their findings and the write up for the
project. With the project hitting its minimum and additional requirements, I believe the project was a
huge success. The highlight of the project was the evaluation of the final maps. Having spent the past
six months working on this project, it was highly motivating to discover that linguists were interested
in my maps and findings and would like to know more about them. I felt that this was the perfect
conclusion which complements the levels of hard work which was spent in delivering this project.

57
Appendix B: Project Schedule

58
Appendix C: Methodologies
Waterfall Model
Spiral Model

59
Appendix D: English Total

60
Appendix E: English Domain Percent

61
Appendix F: English Speakers

62
Appendix G: French Total

63
Appendix H: French Domain Percent

64
Appendix I: French Speakers

65
Appendix J: Arabic Total

66
Appendix K: Arabic Domain Percent

67
Appendix L: Arabic Speakers

68
Appendix M: Hungarian Total
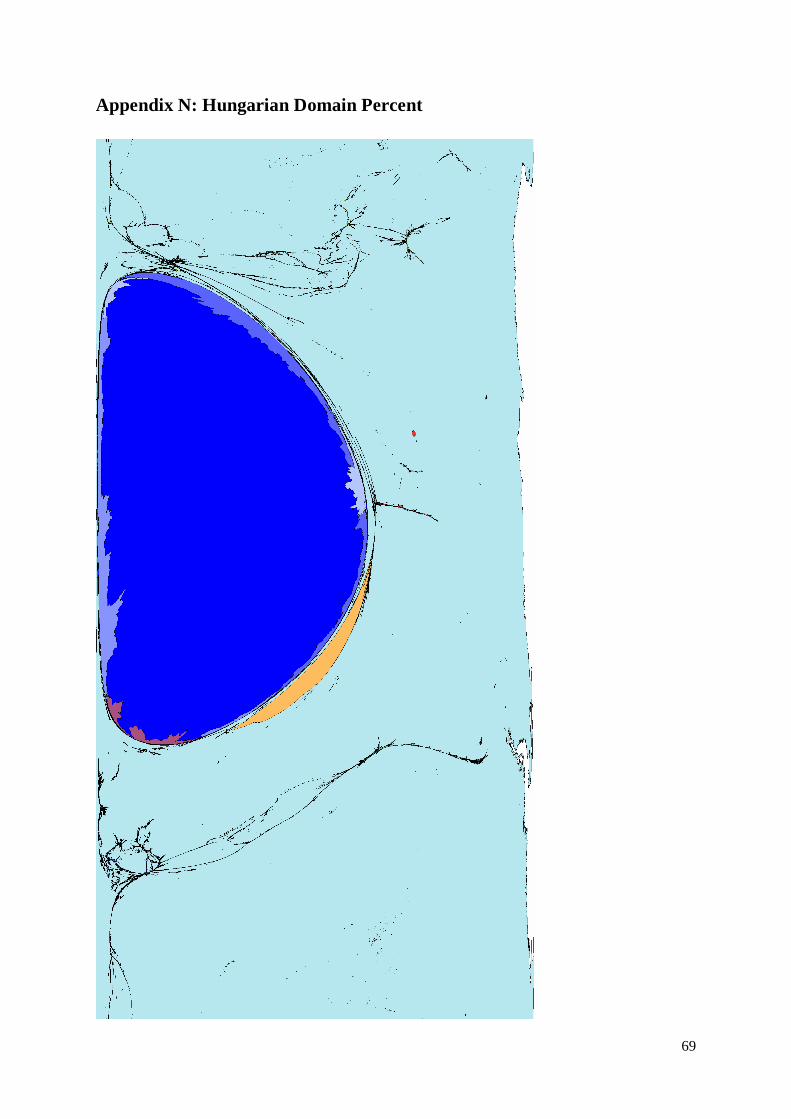
69
Appendix N: Hungarian Domain Percent

70
Appendix O: Hungarian Speakers

71
Appendix P: Web Domain Total

72
Appendix Q: UK English
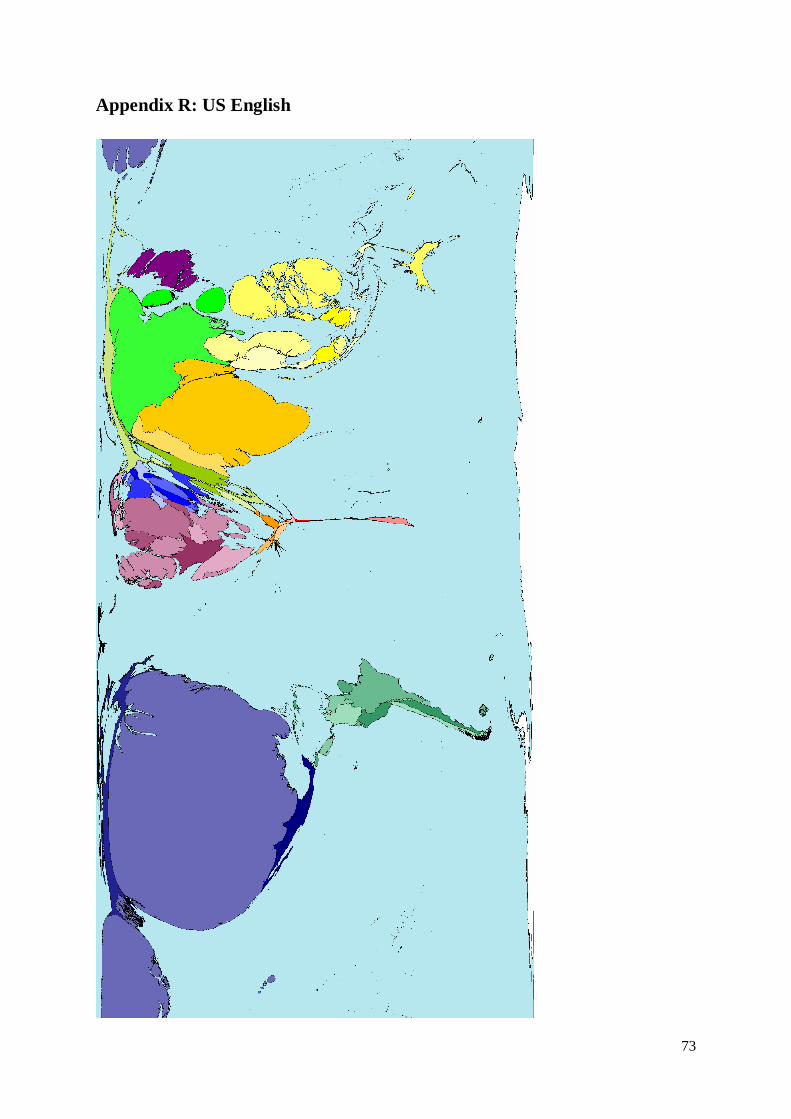
73
Appendix R: US English

74
Appendix S1: WorldMapper English
Appendix S2: WorldMapper French

75
Appendix S3: WorldMapper Arabic
Appendix S4: WorldMapper Hungarian

76
Appendix T: WorldMapper Review Document
Fabien
Congratulations on developing your method and software for obtaining this data, I think you’ve come a long
way for an undergraduate project.
Website Total measure
As well as language use within a country, this measure will also be influenced by the prevalence of computers.
English is a special case, as the primary international language, so in technologically advanced countries, many
websites will contain English even though it is a language spoken at home by only an elite few.
Domain Percentage measure
This measure illustrates even more the use of English as a language of the educated even where it is not spoken
much as a first language at home. The use of a percentage in these maps has its drawbacks; the map becomes
dependent on what we define as a country.
For French and Arabic, this type of map effectively highlights the countries well the language is well used. A
problem with WorldMapper maps generally, when just one or two places have much higher values than
elsewhere, such as the Hungarian map, is that it relies upon the viewer to recognise the shape of the country, as
spatial location becomes somewhat lost.
I am slightly surprised that some of the percentage figures for countries where the language is the mother tongue
of the vast majority of the population are so low (e.g. English in UK 39%, French in France 28%.) I understand
that the method uses some common words in the languages rather than being able to capture every website in a
language, but I would still expect these to be higher. Assuming though that this issue affects the measure equally
in each country, the map should be unaffected by this.
Number of Speakers measure
This is a useful measure and goes some way towards an estimate of the number of speakers, allowing for the
issue mentioned above.
Again, with English being the official language in many countries where it isn't spoken at home a lot, the
English data overestimates the number of speakers in, say, India, and would hence presumably under-estimate
every other language – at least when compared to data of first-language speakers. There is a similar influence of
French as a language of the educated in northern Africa; if French is used by the educated, and for international
communication, a disproportionate percentage of websites are in French, and then that is scaled up by large
populations, most of whom wouldn’t speak it at home, and the number of French speakers is hence possibly
overestimated.
John Pritchard, April 2009

77
Appendix U: Linguistics Experts Contact Details
Arabic
Name Journal Email
Alex Metcalfe Journal Of Arabic And Islamic Studies [email protected]
Mohammad T.
Alhawary Journal of Arabic Linguistics Tradition [email protected]
!Multiple Editors!
Encyclopedia of Arabic Language and
Linguistics
Kees Versteegh [email protected]
Mushira Eid [email protected]
French
Name Journal Email
Kamal Salhi International Journal of Francophone Studies [email protected]
Nick Hewitt French Cultural Studies [email protected]
!Multiple Editors! Journal of French Language Studies
Florence Myles [email protected]
Nigel Armstrong [email protected]
English
Name Journal Email
!Multiple Editors! International Journal of English Studies
Pascual Cantos
Gómez [email protected]
Moisés Almela
Sánchez [email protected]
Raquel Criado
Sánchez [email protected]
!Multiple Editors!
The European Journal of English
Studies
Martin A. Kayman [email protected]
Angela Locatelli [email protected]
Ansgar Nünning
giessen.de
!Multiple Editors! English Language and Linguistics
Bas Aarts [email protected]
David Denison [email protected]
Hungarian
Name Journal Email
!Multiple Editors!
Journal of The Society of Hungarian
Linguistics
NO NAME [email protected]
DEZSŐ JUHÁSZ [email protected]
!Multiple Editors! Hungarian Studies Association
Katalin Fabian [email protected]
Susan Glanz [email protected]

78
Appendix V: Evaluation Request Document
Mapping global language distribution using the Internet
Dear Sir/Madam
I am a fourth year student studying the degree Computing for Business at the University of Leeds
working on my final year project which I believe will be of interest to your area of study. The aims and objectives of my project are to collect data from the internet to get a representation of the
distribution of the INSERT language throughout the world in 200 different countries.
The data will be displayed through a visualisation tool which creates a cartogram. A cartogram is an
image which distorts a map of the world depending on the data being used.
Each map represents data for exactly 200 countries across the world and scales them larger or smaller depending on the data provided. The maps are created by the WorldMapper project team who I have
been working closely with over the past 6 months. More information and further maps can be found
on their website, http://www.worldmapper.com.
I have created maps to show the distribution of the INSERT language across the world from data
obtained from the internet. I have used a program which queries the Yahoo search engine with common words from the INSERT language and then records the number of hits retrieved within each
web domain. These figures are then altered and represented within the two map images attached in the
email.
The first map found below attempts to show the global distribution of first language speakers of the
INSERT language. There are no readily available exact figures for speakers in each country, so
instead I have approximated this by counting the total number of web-pages in a country, and the proportion of these which are in the INSERT language. I assume that this proportion gives an estimate
of the proportion of the population which speak or use the INSERT language.
The second map attached below is a global map of the use of the INSERT language throughout cyberspace. These figures have taken each country’s population into account as well as the total
websites found within each web domain. In theory this shows countries where INSERT is a common
language.

79
As you can see from looking at these images, many of the countries which you would expect to have
large numbers of INSERT speakers have been dramatically increased which enables the user to get a
clear image of the distribution of the INSERT Language.
It is incredibly difficult to obtain accurate data on total language speakers from all countries in the
world and this is why highly regarded sources such as Ethnologue[1] have plenty gaps in their data, as
well as being out of date. As a result, it makes this study increasingly interesting as we are able to show the distribution of the INSERT language based on the most up to date data available.
Hopefully these maps can be of some use to you and I would greatly appreciate some feedback on your thoughts and opinions.
I must submit my Final Year Project report on April 29th so I will be very grateful if you could share your comments on these images before then; either to me via email to [email protected] or to my
project supervisor, Dr Eric Atwell, School of Computing, 0113-343530 or [email protected].
These images are available in higher resolution upon request.
Kind regards,
Fabien Hall,
University of Leeds
[1] Ethnologue – Languages of the World. This is a series of books created with the intent of collecting and displaying data on the
distribution of very language throughout the world.

80
Appendix W: HitsRetriever User Manual
Getting Started
Currently, running the HitsRetriever requires the installation of the Yahoo Software Development Kit
(SKD). You can get this from. http://developer.yahoo.com/download/.
You will also need to register for your own API key from the following link
http://developer.yahoo.com/wsregapp/. Acquiring a key requires registering with Yahoo.
Installing the SKD.
The installation of the SKD is a simple process. Using any terminal or equivalent, navigate to the
directory where the SDK has been unzipped. Whilst in the Python folder (yws-2.12\Python\pYsearch-
3.1) type the following commands into the terminal:
python setup.py build
python setup.py install
This will install the SDK to your machine.
Editing the HitsRetriever.
Open the HitsRetriever using any application capable of understanding Python. There are a couple of
lines of code which will need to be changed.
On line 7, insert your Yahoo API where the INSERTKEY is written.
Line 9 contains the name of the flat file which is created to store the results. Where it says
CHANGEME, insert your own filename of choice.
The final step is to edit the search terms. On line 28, the following line of code can be found:
srch.query = '"SEARCH1" +"SEARCH2" site:.%s' % domain
Replace SEARCH1 + 2 with the choice of words you would like to search.
Running the Program.
The final step is to run the program. Save the Python file to a new name ensuring .py is written on the
end. Now simply run this python file from a terminal or through windows cmd. You should notice hits
being recorded on the screen in front of you. When the search is finished, the terminal will print
―Search Finished‖

81
When this has been written, the flat file containing all the results will be created. This file can be
found in the same directory in which you ran the program from. The results are in .txt format and can
be read by any text editing software application.
The results are sorted automatically into the order they need to be to go into the WorldMapper
template. To get the results to the WorldMapper template, simply copy all the results from the .txt file
and paste them into column D of the template. After saving the template in a .csv format, the template
is ready to be sent off ready for images to be created.
Tips
To ensure data of the highest quality is gathered, careful planning of the two search terms used is
required. It is important to choice common words which are likely to be found together on a webpage
are selected.
Contact
Feel free to contact me at: [email protected] is you experience any difficulties.
Fabien J Hall.