Embed Size (px)
Citation preview
A4liddle East Pefor n d cE1 Ct>sive~andlc 6vtowtl inV the-J\ov±k Africa A\Aiddle-east
Wkcd l AF1as ta ppeAedWorkin0 Paper iVA tteA 1 990s?Serpies
NoJ0 . 25
3ujy 2002
Tke WoAdl Bk by
P-OdACed by ke- D i pCIk Das Apta,Office of tke*
>1ikef Ccovnoznv str-kie-f~~ GC1miteVI VA f e-v e IIe
i t a ncl4 Fa;ies c
Arabic avwcl F=rencl
Pub
lic D
iscl
osur
e A
utho
rized
Pub
lic D
iscl
osur
e A
utho
rized
Pub
lic D
iscl
osur
e A
utho
rized
Pub
lic D
iscl
osur
e A
utho
rized


Reform and Elusive Growth in the Middle-East ---What Has Happened in the 1990s?
By
Dipak Dasgupta, Jennifer Keller and T.G. Srinivasan
Social and Economic Development GroupMiddle East and North Africa Region
July 2002
Discussion papers are not ftiinial: i aons of the World Bank. They irepresent preliminary and often unpolishedresults of country analysis andl eOearch C-@rculation is intended to encourage discussion and comments; citation and theuse of the paper should take-account of its probvisional character. The findings and conclusions of the paper are entirelythose of the author and should not be attributed to the World Bank, its affiliated organizations, or to members of itsBoard of Executive Directors or the countries they represent.


Table of Contents
Reform and Elusive Growth in the Middle-East -What Has Happened in the 1990s?
Summary
A. Introduction ...................................B. Oil Prices and Growth in the MNA Region .................................. 3C. Measuring Reform Effort in MNA ............................... 6
Framework .............................. 6* Progress of Structural Reform in MNA .............................. 8* Positive Signs ............................... 14
D. Sources of Growth in MNA .................... 16* What characteristics define strong performance in productivity growth? .................. 23
E. Conclusion .................................................................. 24
Charts
Chart 1: Real Oil Price (1990 $/bbl), 1976-2000 .4Chart 2: Real Oil Price and MNA Growth, 1976-99 .5Chart 3: Real Oil Price and GCC Growth, 1976-99 .5Chart 4: The Correlation of Oil Prices and GDP growth in non-GCC Oil Producers, 1976-99
(Algeria, Iran) .6Chart 5: Oil Prices and Non-GCC Diversified Economist Growth, 1976-99 .6Chart 6: Composite Structural Reform Index in Developing Regions .................................................. 9Chart 7: Comparison Trade Policy Indicator Among Developing Regions .......................................... 9Chart 8: Highest Marginal Tax Rate on Individuals Among Developing Regions ............................ 10Chart 9: Highest Marginal Corporate Rate on Individuals Among Developing Regions ................... 10Chart 10: Privatization Proceeds Among Developing Regions .. 11................................... 1Chart 11: Real Exchange Rate Over-Valuation in Developing Regions . .11............................ 1Chart 12: Change in Composite Reform Index .................................................................. 12Chart 13: Pace of Reforms and Per-capita GDP Growth .................................................................. 14Chart 14: Composite Index of Economic Stabilization by Regions . .................................................... 15Chart 15: Credit Rating Improves with Structural Reforms for MNA . ............................................... 16
Tables
Table 1: Pace of Structural Reforms in Developing Countries ............................................................ 13Table 2: GDP per capita growth over the 1980s and 1990s, MNA Region ......................................... 17Table 3: Regional TFP Growth, by decade .................................................................. 1 8Table 4: GDP per capita growth and growth of accumulation and productivity by region
1960-1990 .................................................................. 20Table 5. Change in MENA's growth and TFP growth between 1980s and 1990s (%) ....................... 21
Bibliography .................................................................. 25Annex 1. Data sources for Construction of Structural Reform Index ................................................. 27Annex 2. Measuring Factor Accumulation and TFP growth contributions to Aggregate Growth ...... 28Annex 3. Emerging economies in terms of improved productivity growth Performance, 1960-1999.30


dIjJ1I -AI .fl Lhul43t j.Cy 1 'L A ; _ ,
A1 ws UA s9S wJ*1 JtAJy JJ't zjy1 4Jn9 cj~ oRA .ma @ zAU > ,
~Aj l aU;.L oljl ZY A PJ 411 ~ ayl zaI jA - *LS alJj iI S y:A.l,sa l tl.ill jsil1 sil ;! l t=L l Ysall 1,1J )
~~~~~-4OAv Y- 241-1 j4 Li" o^ll lelil SI*Wj i?>ip; JI c-Ul , > LL 6UL ej sj;*JUA1~
4.12uJ AcL. A S, 49 WU
_L= Lay Ly_*1 Ie ^ 1cS)sJ iil DJ 11D .
¾yaL 41~ WŽiL.4 ^ USJ - N . il 't^ Q fl~Iut i sI; .rl @
9 'U 4Jj v 1 L Us UZl ; 9 101 D1 Sjl IA~~~~~L -- . . W A ylUj 11 ,91aL 19 fLJ @ =ffi _ . ,,l
-^~~~~~~~~~~~~~~~~~~~~_A Y.3L)+. SII .6L!tU l .R ,}. Y ll1W5jJ &1*SLL


Risum6
Pour les decideurs, il est tres important de realiser une croissance economiqueplus rapide. L'un des postulats fondamentaux de la reforme est qu'elle devrait favorisercette croissance plus rapide. En raison de la baisse importante des cours petroliersinternationaux au milieu des annees 80, la majorite des pays de la Region MENA ontconnu un ralentissement marque de la croissance et/ou des crises macro-economiques.Cette situation a impose une reforme relativement etendue et des efforts derestructuration (mais A des degres divers) pour ramener la stabilite macro-economique etdiversifier les economies loin des produits petroliers et visant une croissance induite parle secteur prive. Et pourtant, pour de nombreux observateurs dans la region et en dehorsde la region, les resultats en termes de croissance acceleree dans la region semblentevasifs.
Le document examine la relation reelle, si elle existe, entre la reforme et lacroissance dans la Region Moyen-Orient et Afrique du Nord (MENA), en particulier aucours des annees 90, en la comparant A la performance d'autres regions et pays endeveloppement. Les resultats de la croissance des pays MENA examines dans cedocument donnent a entendre que les reformes dans cette Region ressemblent fort A unetache A moitie termin6e. II est clair que les reformes ont commence, mais la majorite despays de la Region MENA sont des reformateurs lents et qui continuent A etre en retardpar rapport aux resultats d'autres pays et d'autres regions. L'effet des reformes estdifficile A distinguer mais il peut au moins avoir contribue a inverser les pertesimportantes de productivite de facteur des annees 70 et 80. Mais la reponse del'investissement prive se fait attendre et il est prioritaire d'en comprendre les raisons - etil faudra que les reformes requises aillent au-dela de la premiere etape des reformesstructurelles dans ces pays. Enfin, des ameliorations soutenus des resultats de laproductivite seront critiques et semblent etre lies, A premiere vue, a la reussite d'unediversification rapide de l'activite economique sur les annees, des echanges de biens et deservices et A l'eloignement de la dependance excessive des ressources et des produitscomme le petrole (qui donne lieu a une volatilite elevee et une faible productivite).

Abstract
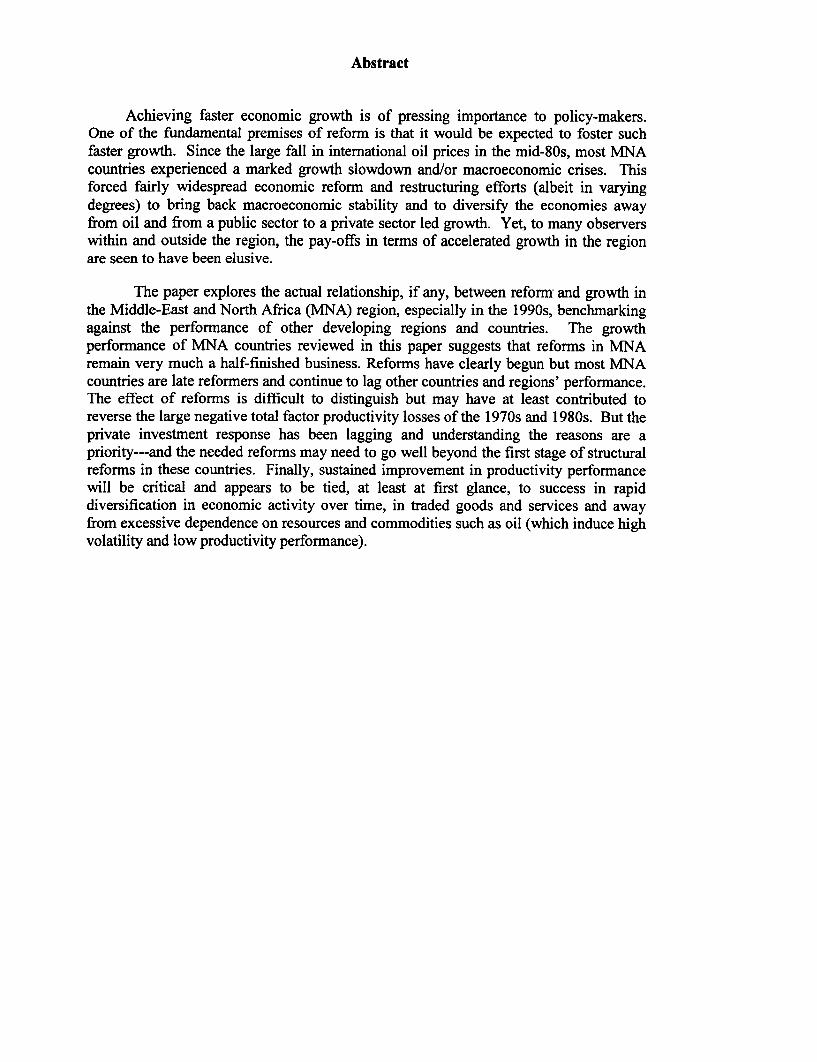
Achieving faster economic growth is of pressing importance to policy-makers.One of the fundamental premises of reform is that it would be expected to foster suchfaster growth. Since the large fall in international oil prices in the mid-80s, most MNAcountries experienced a marked growth slowdown and/or macroeconomic crises. Thisforced fairly widespread economic reform and restructuring efforts (albeit in varyingdegrees) to bring back macroeconomic stability and to diversify the economies awayfrom oil and from a public sector to a private sector led growth. Yet, to many observerswithin and outside the region, the pay-offs in terms of accelerated growth in the regionare seen to have been elusive.
The paper explores the actual relationship, if any, between reform and growth inthe Middle-East and North Africa (NNA) region, especially in the 1990s, benchmarkingagainst the performance of other developing regions and countries. The growthperformance of MNA countries reviewed in this paper suggests that reforms in MNAremain very much a half-finished business. Reforms have clearly begun but most NMNAcountries are late reformers and continue to lag other countries and regions' performance.The effect of reforms is difficult to distinguish but may have at least contributed toreverse the large negative total factor productivity losses of the 1970s and 1980s. But theprivate investment response has been lagging and understanding the reasons are apriority---and the needed reforms may need to go well beyond the first stage of structuralreforms in these countries. Finally, sustained improvement in productivity performancewill be critical and appears to be tied, at least at first glance, to success in rapiddiversification in economic activity over time, in traded goods and services and awayfrom excessive dependence on resources and commodities such as oil (which induce highvolatility and low productivity performance).

I

A. Introduction
Achieving faster economic growth is of pressing importance to policy-makers.One of the fundamental premises of reform is that it would be expected to foster suchfaster growth. The "Washington consensus" of the early 1990s had advocated a certaincore set of reforms as essential in a rapidly globalizing world---minimum standards ofmacroeconomic stability, and structural reforms in openness and the investmentenvironment. But questions have started to be asked by the late 1990s whether thesewere having their intended effects. Despite apparent reforms---albeit not to the sameextent in all countries and areas---actual growth performance in many developingcountries and regions has often been disappointing. MNA countries are no different intheir experience with reform and growth in the 1 990s.
Reform and its link to economic growth is also politically and socially centralissue. It is especially critical in the MNA region because of the unemployment problem.At least some part of the critical pressure on governments (other than the decline in oilprices and macroeconomic crises) arises from the unemployment situation as the laborforce grew by about 2.8 percent a year, about the highest rate in the world while jobopportunities have been lagging. While rapid labor force growth can be a "demographicgift" in the right circumstances, it can also create enormous social pressures if actual jobopportunities for this are not generated. Formal unemployment rates in the region(outside of the Gulf Cooperation Council or GCC countries), now average close to 25% -- the second highest in the world2. In some countries - Algeria, Iran, Syria, Libya,Yemen -- as much as one-third of the labor force is unemployed. Even the GCCeconomies, with comparatively low unemployment rates averaging about 5%, have begunto experience growing unemployment among their national populations. The absence ofgrowth and rapidly rising unemployment also coincided with falling real wages in theregion---as is to be expected. Consequently, the crisis of growth in the MNA regionsince the 1980s has translated into an "unemployment crisis", which could spill over intoa larger poverty crisis (which the region has so far managed to avoid in most placesbecause of the presence of formal and informal and implicit or explicit social safety nets).The biggest impact of unemployment is also often on young first-time job-seekers, and apotentially socially explosive situation. Unemployment rates for those under 25 areabout twice as high as national averages, as in Algeria and Tunisia, and_as high as twoand a half times to three higher in Lebanon and Iran. This same age group is also bettereducated. Rising education and unemployment are potentially powerful pressures forchange and reforms.
In the above context, the main question that is explored in this paper is tounderstand the actual relationship, if any, between reform and growth in the Middle-Eastand North Africa (MNA) region, especially in the 1990s, benchmarked against theperformance of other developing regions and countries. Since the large fall ininternational oil prices in the mid-80s, most MNA countries experienced a markedgrowth slowdown and/or macroeconomic crises. This forced fairly widespread economicreform and restructuring efforts (albeit in varying degrees) to bring back macroeconomic
2 Unemployment in Sub-Saharan Africa is estimated to be about 25%, but definitional differences makecomparisons of unemployment rates across countries difficult.

stability and to diversify the economies away from oil and from a public sector to aprivate sector led growth.
Yet, to many observers within and outside the region, the pay-offs in terms ofaccelerated growth in the region are seen to have been elusive. Regional GDP growthaveraged 3.2% a year over the l990s3, higher than in the 1980s (2.7% a year), but not therebound one might have wanted or expected following a decade of stagnation. On a percapita basis, economic growth averaged less than 1% a year. Outside the Gulfeconomies, growth has been somewhat healthier, averaging 3.5% per year, but remainsweak on a per capita basis. Were the reforms inadequate? Were they directed at thewrong areas? Or did the reforms miss out some other vital ingredients---such asgovernance, market institutions, end of conflict and favorable geography---for fastergrowth to happen? This paper attempts to provide a preliminary first evaluation of thesebroad questions.
The structure and principal conclusions of this paper are the following:
As a first step in understanding factors affecting growth outcomes, section Bexamines the relationship between oil prices and aggregate growth. A trend decline(and high volatility) in international oil prices, which persisted throughout the 1990s,was a major exogenous factor dampening growth outcomes in all MNA economies.Countries were forced to adjust to a sizeable real income decline (mainly by reducedpublic spending). While the negative income effects dominate, some positive effectsof substitution to non-oil activities might also however be expected with lower oilprices (and reduced Dutch-disease). In the major oil-producing countries (GCC, hran,Algeria, Syria), the negative income effects clearly dominated aggregate growthoutcomes, as might be expected both because of the very large weight of oil andslower reform. In the more diversified and earlier reform economies (Egypt, Jordan,Morocco), however, there was evidence to suggest a distinct break in the relationshipof aggregate growth with oil prices and therefore relative success in diversification(the aim of the reform efforts).
Section C then measures actual reform effort and its intensity in the diversified MNAeconomies. A variety of indicators are used that attempt to be closer to the choice ofpolicies and instruments (rather than outcomes that are often wrongly used to measurepolicy effort). The reform effort is also benchmarked against a large number ofcountries in all other regions. The conclusions are nuanced. MNA countries haveindeed undertaken sizeable reform effort, but the main area of progress is inmacroeconomic stability (expenditure reduction, lower inflation) rather than in corestructural reform. In structural reform (trade policy, private investment environment),MNA countries are a late-comer, with significant reform only happening from themid-1990s onwards. At the same time, other competitors and comparators globallyhave been moving faster and/or catching-up, especially in middle-income LatinAmerica, Europe and East Asia. All of the countries we would classify as diversifiedeconomies (Morocco, Egypt, Tunisia and Jordan) are rated in the paper as slow orgradual reformers. Nevertheless, institutional investor surveys are responding andbeginning to positively re-evaluate reform intensity and effort in MNA countries.
3 Weighted (by population) growth and per capita growth rates for Algeria, Egypt, Iran, Jordan, Morocco,Syria, Tunisia, Yemen, Bahrain, Oman, and Saudi Arabia.
- 2 -
Section D then turns to a detailed discussion of the sources of growth in the MNAregion, from an accounting perspective, and focuses on both trends in factoraccumulation and total factor productivity, and their qualitative relationship to theextent of reform undertaken. Four main conclusions emerge. First, while reform hashad a growth pay-off for some countries, for the region as a whole, per capita GDPgrowth remains anemic, increasing by an average of only 0.3 percentage points peryear. Second, this growth stagnation occurs despite a significant increase in virtuallyall of the MENA region in total factor productivity growth. For the region as awhole, total factor productivity growth increased by an average of 1.3 percentagepoints per year, from an average of-1.3 % per year in the 1980s (linked to massiveand inefficient public and private investments of the oil-boom years) to 0 percent peryear in the 1990s. Structural reform has probably contributed to reversing thisnegative factor productivity in the region. In 8 out of 10 countries in the region, TFPperformance improved. Third, the principal reason that growth has remained stagnantis the collapse in factor accumulation, especially physical capital, within most ofMNA. In only two countries in the region has factor accumulation increased from the1980s to 1990s. Public investment has certainly fallen, much as to be expected withthe fiscal adjustment. But equally, private investment has not taken up the slack norresponded aggressively to the reform. In the 1990s, investment has declineddramatically, and without exception across the region. Fourth, preliminary evidenceusing cross-country regression panel data including the MNA countries seem tosuggest that the macroeconomic reform effort has had the greater positive (andsignificant) association with the improvement in aggregate growth and in total factorproductivity. The structural reform index shows no significant or discernible impactso far. However, this work needs to be extended and examined much more carefully,before any definite conclusions can be drawn. Finally, countries which rank high onan index of sustained total factor productivity growth appears to be those that aresuccessful in rapid diversification, openness, and macroeconomic stability, whilecountries at the bottom tend to be those which are relatively heavily reliant onresources and relatively undiversified and subject to larger macroeconomic volatility
For structural reform to have an effect, the private investment response and itsredirection to the traded goods sector is essential. For that to happen, questions remain asto some other critical factors that we do not understand well-factors affecting thecritical private investment response, the export diversification response, and geography(regional conflict and peace) factor---as to why faster growth continues to elude somemost countries in MNA. This should now form the main agenda of research questions onthe growth question in the MNA region, as indeed in most other middle-income countriesaround the world facing slow growth despite reform.
B. Oil Prices and Growth in the MNA Region
Oil has an usual degree of importance in the MNA countries. Three differenttypologies can be constructed. The first is the core set of OPEC oil producers, mostly theGCC countries4 , whose economies are dominated by oil and whose objective function isarguably to maximize long-run oil prices and rents in global energy markets (including
4 Bahrain, Kuwait, Oman, Qatar, Saudi Arabia, and UAE.
-3 -

its relative stability). The second are larger and more populous OPEC oil exporters (Iran,Algeria, Syria, Iraq), whose economies are also dominated by oil, but whose objectivefunctions are more diverse (in raising and diversifying their economies away from oil).The third is the set of diversified economies, whose oil exporting sectors are eitherrelatively small or non-existent, but which are still relatively reliant on oil markets eitherdirectly as exporters or indirectly for regional export markets for traded goods or labor(workers remittances) and capital inflows from richer regional oil exporting countries--Egypt, Morocco, Jordan, Yemen, and Lebanon.
Real oil prices (1990 dollars per barrel), as shown below in Chart 1, collapsedafter 1985 and reached a low in the late 1980s, before recovering modestly in theaftermath of the 1990 Gulf War. Following that, oil prices again fell steadily duringmuch of the 1990s, reaching a low in 1999 (of less than $10 a barrel). Only since theclosing months of 1999 have oil prices recovered sharply, to close to $30 per barrel.Much of the period under examination has therefore been one of a dramatic fall in oilprices in real terms.
Chart 1. Real Oil Price (1990 $Ibbi), 1976-2000
50.045 040.035.030.025.020.015.0.10.0-50
co £0 0 N t SD 0 0 N1- 1- £0 0 £0 £0 0 0 e £0 0 0am c0 0 0 0 0 0 0 0 0 £
|Real COil Price|
Source: World Bank.
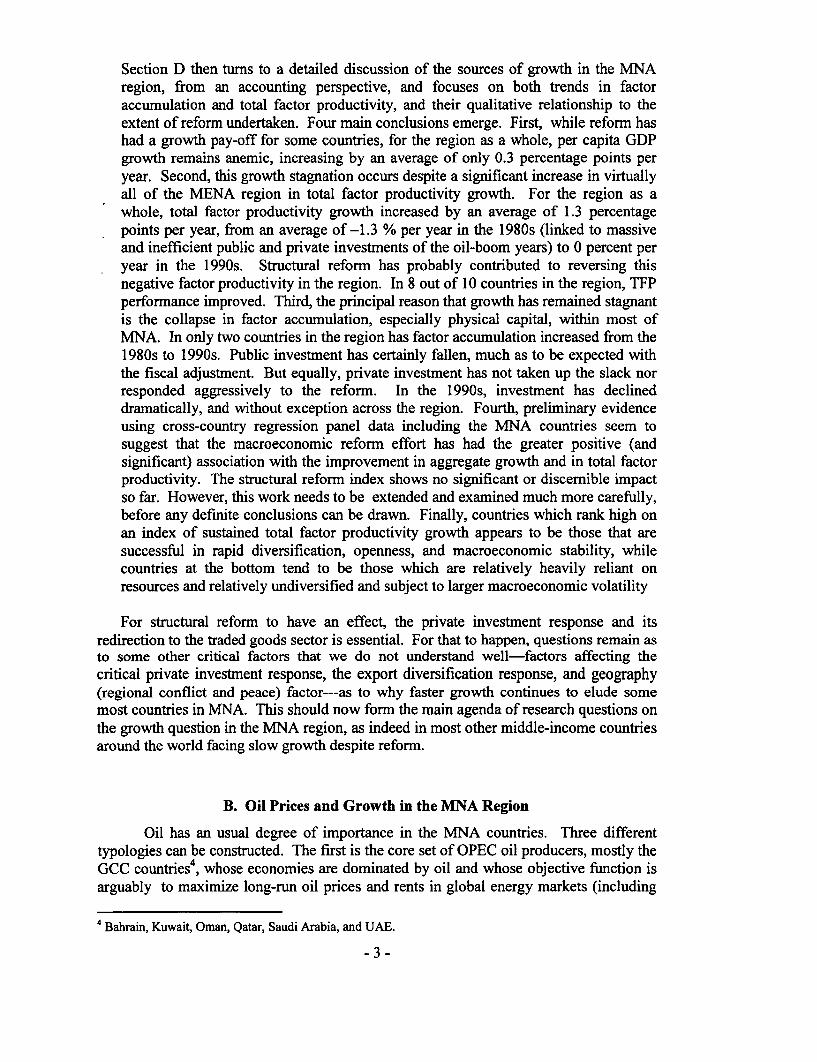
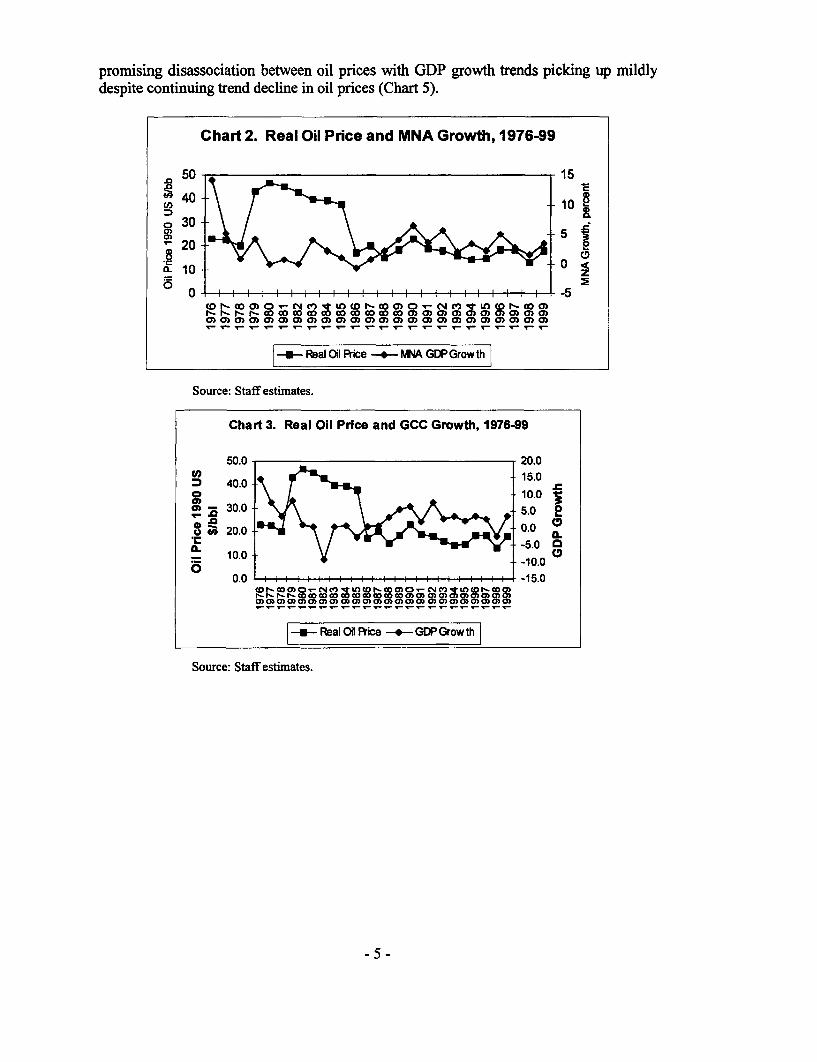
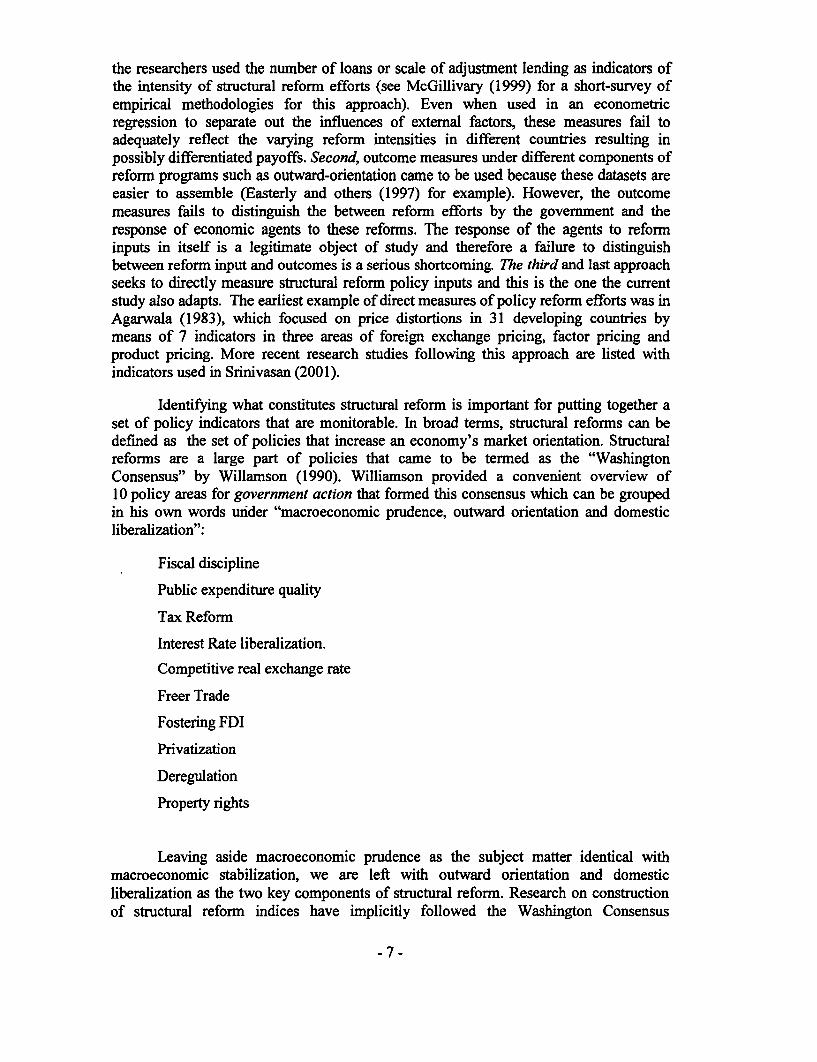
What has been the relationship of such trends in oil prices with regional GDPgrowth, and as differentiated by the three different typologies of countries describedearlier? For the region as a whole, the relationship is mixed, as shown in below Chart 2.More precisely, during the 1970s till 1988 or a period of heavily oil-cartelized world,there is evidently a counter-cyclical relationship---rising oil prices matched by fallingGDP growth and vice-versa. But since late 1980s, that relationship broke down and wesee a shift to a close positive relationship. But how far is this aggregate picture differentbetween the three types of MNA countries? Three conclusions are possible. First, GCCoil producers continue to show a counter-cyclical GDP growth relationship with oil pricesbetween 1976-88---as would be expected as longer-term cartel producers restrict oilsupplies (lowering GDP growth) to raise prices and vice-versa---but when the cartel ispressured beyond a point, they reverse, as evident since 1988 (Chart 3). Second, for non-GCC oil exporters, there is a clear close positive relationship between oil prices and GDPgrowth throughout, as higher oil prices permit faster growth and vice-versa (and somefree-riding on cartel behavior, Chart 4). Third, for the diversified economies, falling oilprices caused collapsing GDP growth till the late 1980s, but since then, the trend is a
-4 -
promising disassociation between oil prices with GDP growth trends picking up mildlydespite continuing trend decline in oil prices (Chart 5).
Chart 2. Real Oil Price and MNA Growth, 1976-99
50 -5
t40 10
a30
20~~~~~~~~~~~~~~~*& 10
a> o0 0 0 0 o- 0 0 a5 0 0 0 0 0 0 0 0 0) 0 0 0) 0)
- Real Oil rice - hiA GDPGrowth
Source: Staff estimates.
Chart 3. Real Oil Price and GCC Growth, 1976-99
50.0 20.0<°n>830°0 - 15.0D 40.0._ 10.0 I l l l l l l l l l l l l l l l l l l l l l l -10.0
30.0 5.0 2o t 20.0 0.0
-5.0
- 0.0 -10.0*6_________________________
N-r0)0)0W W X 0)0 0coo)0))00CD 0
| Real 0 Price - GDPGrowth
Source: Staff estimates.
-5-
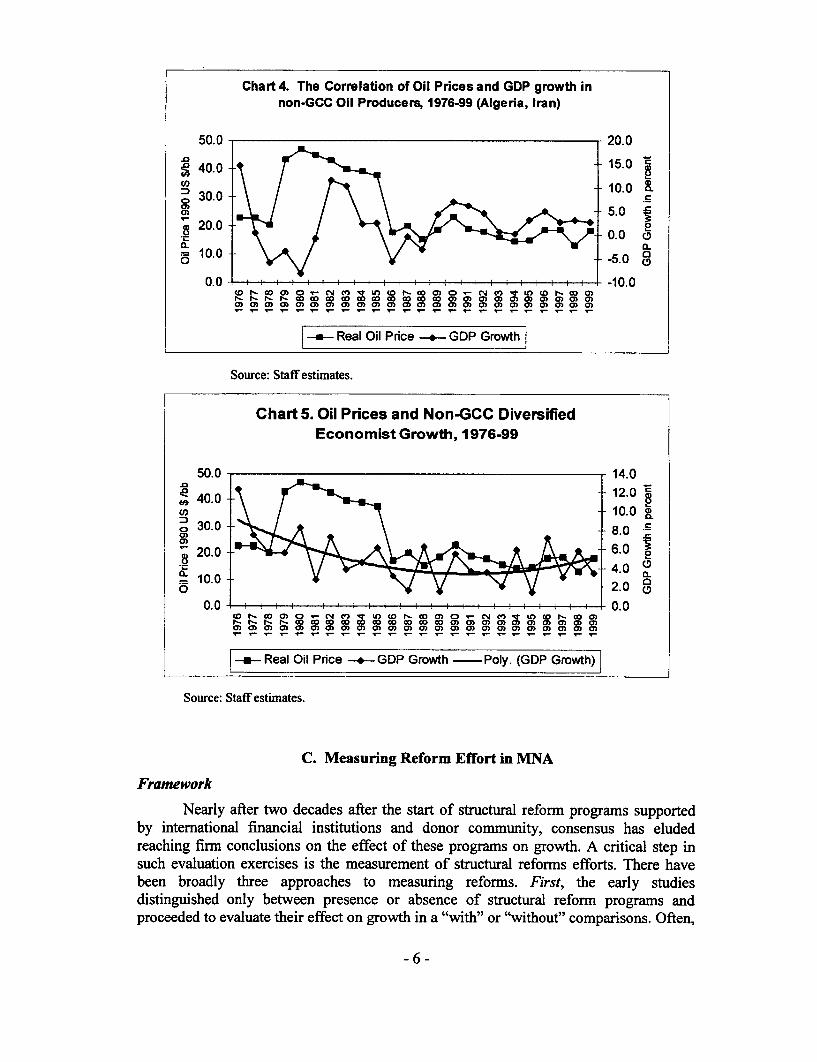
Chart 4. The Correlation of Oil Prices and GDP growth innon-GCC Oil Producers, 1976-99 (Algeria, Iran)
50.0 - 20.0
; 40.0 15.0
10.0 a0130.0
5.0
0.0 -10.010. -5.0 NXtu o wo ) Ds00
LD CX -a)a)O~~NCLO C (D- Co C)a)00 0 0 0ax amaxala) a) a) a) a a) C)a) cn o> a) a) am a)a) a) a a)a)o a) ox a) a) o a) a) 0) a al a) a)a)O
- Real Oil Price + GDP Growth|
Source: Staff estimates.
Chart 5. Oil Prices and Non-GCC DiversifiedEconomist Growth, 1976-99
50.0 14.0.0~ ~ ~~~~~~~~0
40.0 1.
30.0 0.0
(20.0 6.0 4.0 00.~~~~~~~~~~~~~~~~~~~~~~~~~~~0
=10.0 0 ~~~~~~~~~~~~~~~~2.0 ~
t-t'Dto D 0 D 0 00 CD C0 0 0 am )a)a) a) as a) a) aW 0) a) a) a) ) a) a) a a oa a) a) a) a) a) a) ) a) a) a) a) a)
- Real Oil Price - GDP Growth - Poly. (GDP Growth)
Source: Staff estimates.
C. Measuring Reform Effort in MNA
Framework
Nearly after two decades after the start of structural reform programs supportedby international financial institutions and donor community, consensus has eludedreaching firm conclusions on the effect of these programs on growth. A critical step insuch evaluation exercises is the measurement of structural reforms efforts. There havebeen broadly three approaches to measuring reforms. First, the early studiesdistinguished only between presence or absence of structural reform programs andproceeded to evaluate their effect on growth in a "with" or "without" comparisons. Often,
- 6 -
the researchers used the number of loans or scale of adjustment lending as indicators ofthe intensity of structural reform efforts (see McGillivary (1999) for a short-survey ofempirical methodologies for this approach). Even when used in an econometricregression to separate out the influences of external factors, these measures fail toadequately reflect the varying reform intensities in different countries resulting inpossibly differentiated payoffs. Second, outcome measures under different components ofreform programs such as outward-orientation came to be used because these datasets areeasier to assemble (Easterly and others (1997) for example). However, the outcomemeasures fails to distinguish the between reform efforts by the government and theresponse of economic agents to these reforms. The response of the agents to reforminputs in itself is a legitimate object of study and therefore a failure to distinguishbetween reform input and outcomes is a serious shortcoming. The third and last approachseeks to directly measure structural reform policy inputs and this is the one the currentstudy also adapts. The earliest example of direct measures of policy reform efforts was inAgarwala (1983), which focused on price distortions in 31 developing countries bymeans of 7 indicators in three areas of foreign exchange pricing, factor pricing andproduct pricing. More recent research studies following this approach are listed withindicators used in Srinivasan (2001).
Identifying what constitutes structural reform is important for putting together aset of policy indicators that are monitorable. In broad terms, structural reforms can bedefined as the set of policies that increase an economy's market orientation. Structuralreforms are a large part of policies that came to be termed as the "WashingtonConsensus" by Willamson (1990). Williamson provided a convenient overview of10 policy areas for government action that formed this consensus which can be groupedin his own words under "macroeconomic prudence, outward orientation and domesticliberalization":
Fiscal discipline
Public expenditure quality
Tax Reform
Interest Rate liberalization.
Competitive real exchange rate
Freer Trade
Fostering FDI
Privatization
Deregulation
Property rights
Leaving aside macroeconomic prudence as the subject matter identical withmacroeconomic stabilization, we are left with outward orientation and domesticliberalization as the two key components of structural reform. Research on constructionof structural reform indices have implicitly followed the Washington Consensus
- 7 -
typology, but emphasized in greater detail particular sub-components and differentweights to derive a composite indicator based on the developing country region underinvestigation. For example, Lora (1977) and Morley et al (1999) in their work on LatinAmerica emphasize financial indicators, Dicks-Mireaux and others (1997) and Bonagliaand others (2000) in their work on SSA, or, Martha de Melo and others (1996) ontransition countries, stress on public enterprise reform, price controls and stateintervention in marketing, and on European transition countries). For the current study inits initial phase, we have identified 4 components (Trade Policy, Tax Policy, RealExchange Rate Over-valuation, and, Privatization)---see Srinivasan (2001) for moredetails. We opted for a parsimonious set of components because we wanted to quicklyassemble indicators for as many countries as possible with a view to compare NINAcountries with all other developing countries.
Progress of Structural Reform in MNA
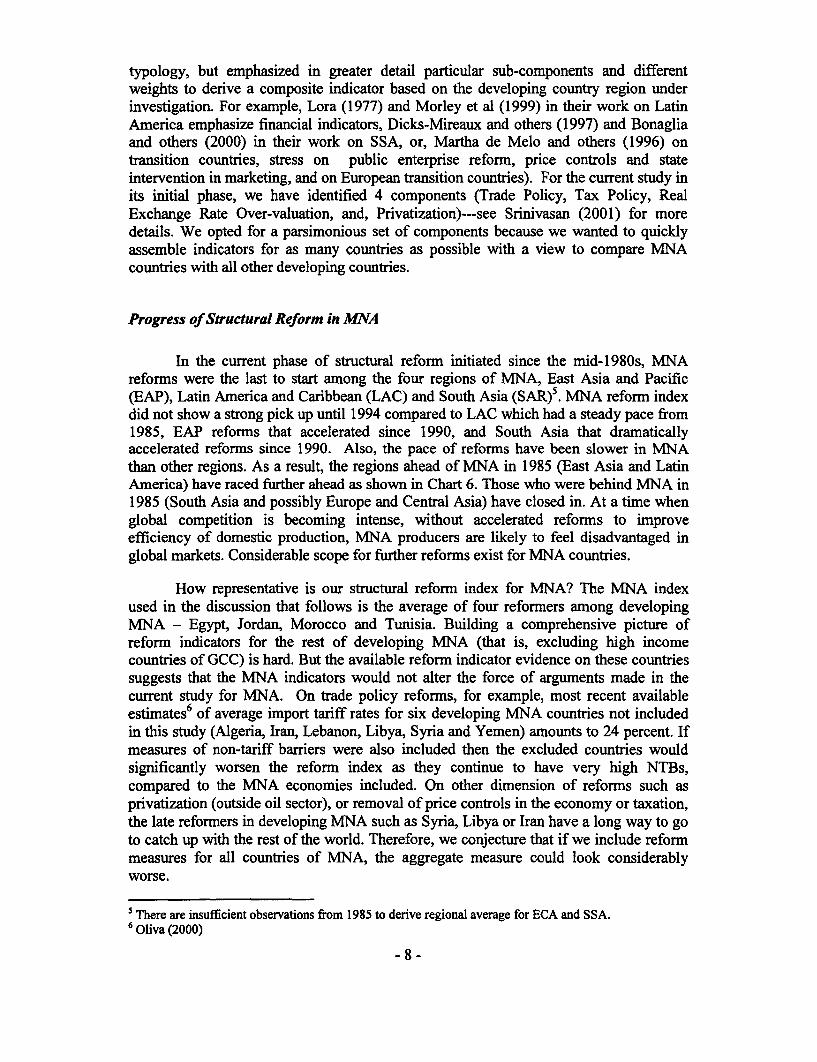
In the current phase of structural reform initiated since the mid-1980s, MNAreforms were the last to start among the four regions of MNA, East Asia and Pacific(EAP), Latin America and Caribbean (LAC) and South Asia (SAR)5 . MNA reform indexdid not show a strong pick up until 1994 compared to LAC which had a steady pace from1985, EAP reforms that accelerated since 1990, and South Asia that dramaticallyaccelerated reforms since 1990. Also, the pace of reforms have been slower in MNAthan other regions. As a result, the regions ahead of MNA in 1985 (East Asia and LatinAmerica) have raced further ahead as shown in Chart 6. Those who were behind MNA in1985 (South Asia and possibly Europe and Central Asia) have closed in. At a time whenglobal competition is becoming intense, without accelerated reforms to improveefficiency of domestic production, MNA producers are likely to feel disadvantaged inglobal markets. Considerable scope for further reforms exist for MNA countries.
How representative is our structural reform index for MNA? The MNA indexused in the discussion that follows is the average of four reformers among developingMNA - Egypt, Jordan, Morocco and Tunisia. Building a comprehensive picture ofreform indicators for the rest of developing MNA (that is, excluding high incomecountries of GCC) is hard. But the available reform indicator evidence on these countriessuggests that the MNA indicators would not alter the force of arguments made in thecurrent study for MNA. On trade policy reforms, for example, most recent availableestimates6 of average import tariff rates for six developing MNA countries not includedin this study (Algeria, Iran, Lebanon, Libya, Syria and Yemen) amounts to 24 percent. Ifmeasures of non-tariff barriers were also included then the excluded countries wouldsignificantly worsen the reform index as they continue to have very high NTBs,compared to the MNA economies included. On other dimension of reforms such asprivatization (outside oil sector), or removal of price controls in the economy or taxation,the late reformers in developing MNA such as Syria, Libya or Iran have a long way to goto catch up with the rest of the world. Therefore, we conjecture that if we include reformmeasures for all countries of NIA, the aggregate measure could look considerablyworse.
5 There are insufficient observations from 1985 to derive regional average for ECA and SSA.6 Oliva (2000)
-8-
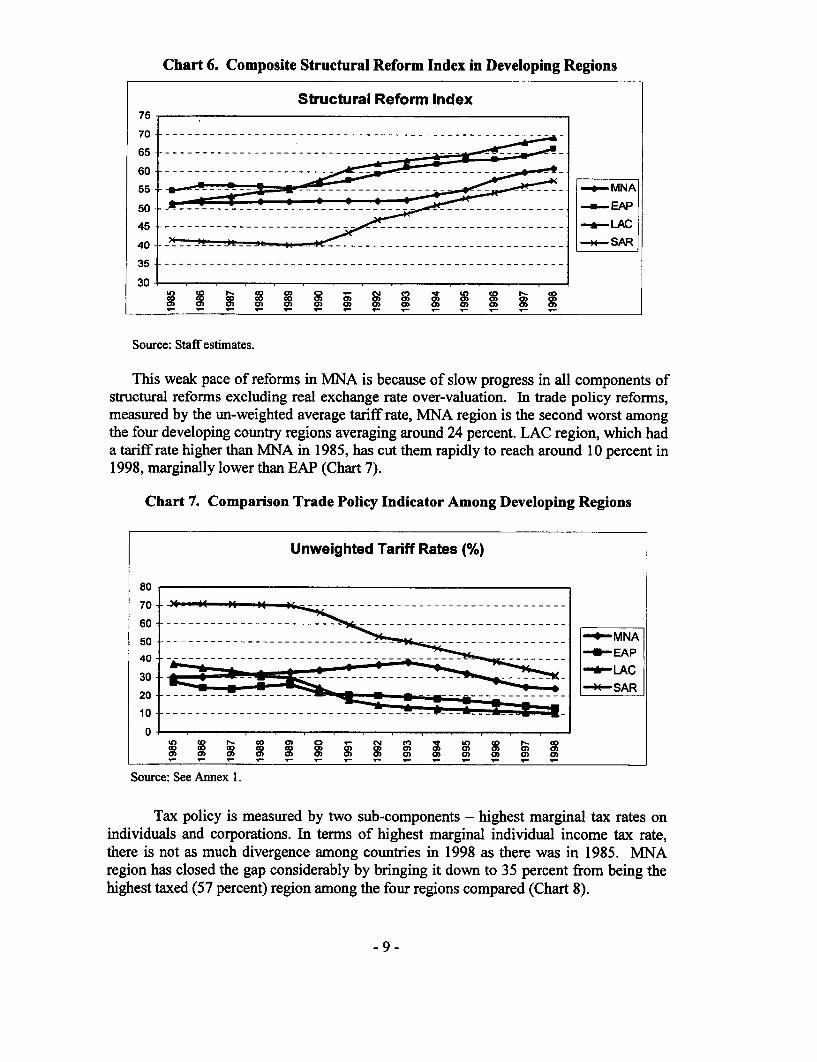
Chart 6. Composite Structural Reform Index in Developing Regions
Structural Reform Index75
7 0 -- - - - - - - - - - - - - - - - - - - - - - - - - - - - - - - - - - - - - - - - - - - - - - -
6 5 -- - - - - - - - - - - - - - - -- - - - - - - - - - - - - -
55 _------ -- _---- MNA
50 _7 -- - - -- - - - -- - - -- - - -_ ___ ___ ____ __ EAP
45 -- - - - - - - - - - - - - - - - - - - - - - - - - - - - - - - - - - - - - - - - - - - -_ LA C
40 _-- - ----- ------- --------- ------ -- - -- SA R
3 5 -- - - - - - - - - - - - - - - - - - - - - - - - - - - - - - - - - - - - - - - - - - - - - - - -
300 8 X 8 X 0 0 0 0 0 0 0
0)0 0) 0) 0 0 0) 0 0 0 0 0
Source: Staff estimates.
This weak pace of reforms in MNA is because of slow progress in all components ofstructural reforms excluding real exchange rate over-valuation. In trade policy reforms,measured by the un-weighted average tariff rate, MNA region is the second worst amongthe four developing country regions averaging around 24 percent. LAC region, which hada tariff rate higher than MNA in 1985, has cut them rapidly to reach around 10 percent in1998, marginally lower than EAP (Chart 7).
Chart 7. Comparison Trade Policy Indicator Among Developing Regions
Unweighted Tariff Rates (%)
80
7 0 - - - - - - - - - - - - - - - -
60 -- -- -- -- -- -- - - - - -------- ---------- - -- -- -- -- -- -- -- ---
40 ------------- ---- _--- _-_-_-_-_-_ _ =M N A40 --- ----- ----- ------ ----- -- --- ---- -- U '- E A P
30, . -, -KLAC
3020 --- - - - - -- - - - _-* SAR _______ ___
O------------ --
n CD 1- CO 0c 0 _ tN to I- coo co 0c co co 0) 0 0 0 ) 0 ) 0)
0) 0) 0) a) a) 0 ) 0) a) 0) 0) a) a 0)
Source: See Annex 1.
Tax policy is measured by two sub-components - highest marginal tax rates onindividuals and corporations. In terms of highest marginal individual income tax rate,there is not as much divergence among countries in 1998 as there was in 1985. MNAregion has closed the gap considerably by bringing it down to 35 percent from being thehighest taxed (57 percent) region among the four regions compared (Chart 8).
-9-
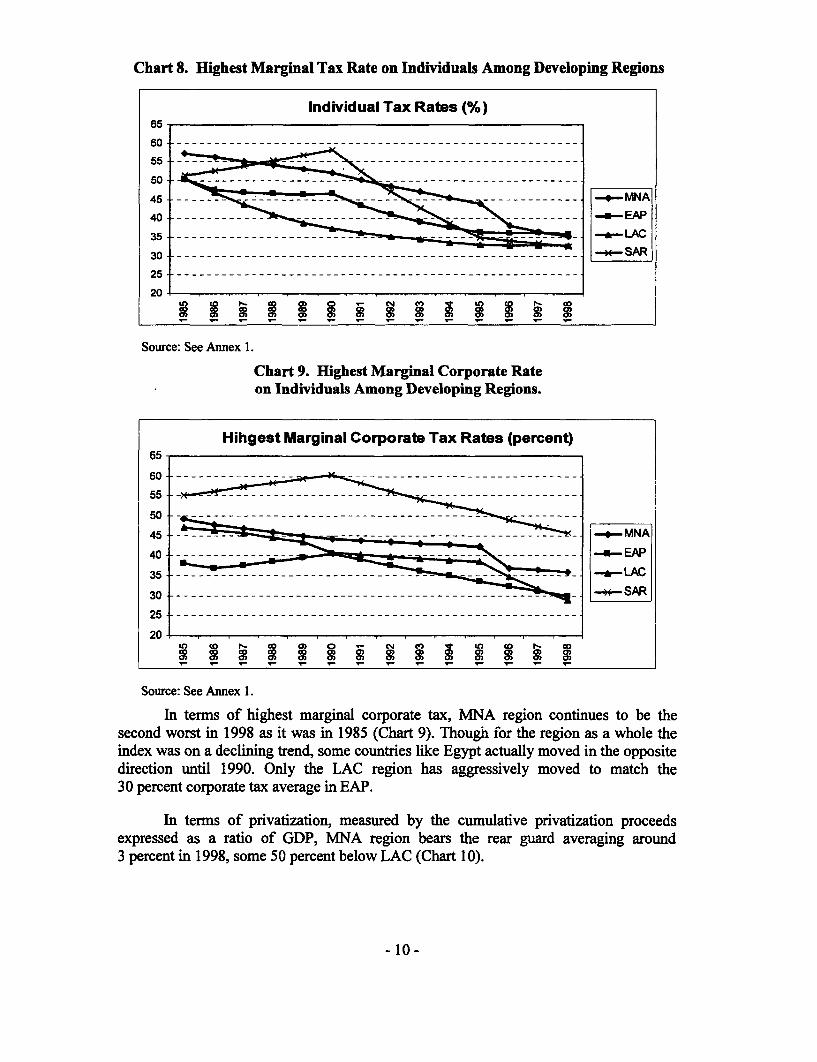
Chart 8. Highest Marginal Tax Rate on Individuals Among Developing Regions
Individual Tax Rates (%)65
55 0
45-- - - - -- - -- - - --o MNA
40 - -- - - ---- --w-EAP
35 -- - - - - - - - - _" * LAC
25 __----
20 .
Source: See Annex 1.
Chart 9. Highest Marginal Corporate Rateon Individuals Among Developing Regions.
Hihgest Marginal Corporate Tax Rates (percent)65
55--- - - - -
50 --- - - -
45 ---- MNA
40 ---------- LAC
35 -- - - - - -- - - - - - _-- -LASC30 - - - - - - - - -- - - - - - - - - - - - - - - - - - - - - - -S A R
20
co r- s 2 0 0 04 co 0 co 0 0_20 co 0 0 CD CD 0 0CD 0 0
Source: See Annex 1.
In terms of highest marginal corporate tax, MNA region continues to be thesecond worst in 1998 as it was in 1985 (Chart 9). Though for the region as a whole theindex was on a declining trend, some countries like Egypt actually moved in the oppositedirection until 1990. Only the LAC region has aggressively moved to match the30 percent corporate tax average in EAP.
In terms of privatization, measured by the cumulative privatization proceedsexpressed as a ratio of GDP, MNA region bears the rear guard averaging around3 percent in 1998, some 50 percent below LAC (Chart 10).
- 10-
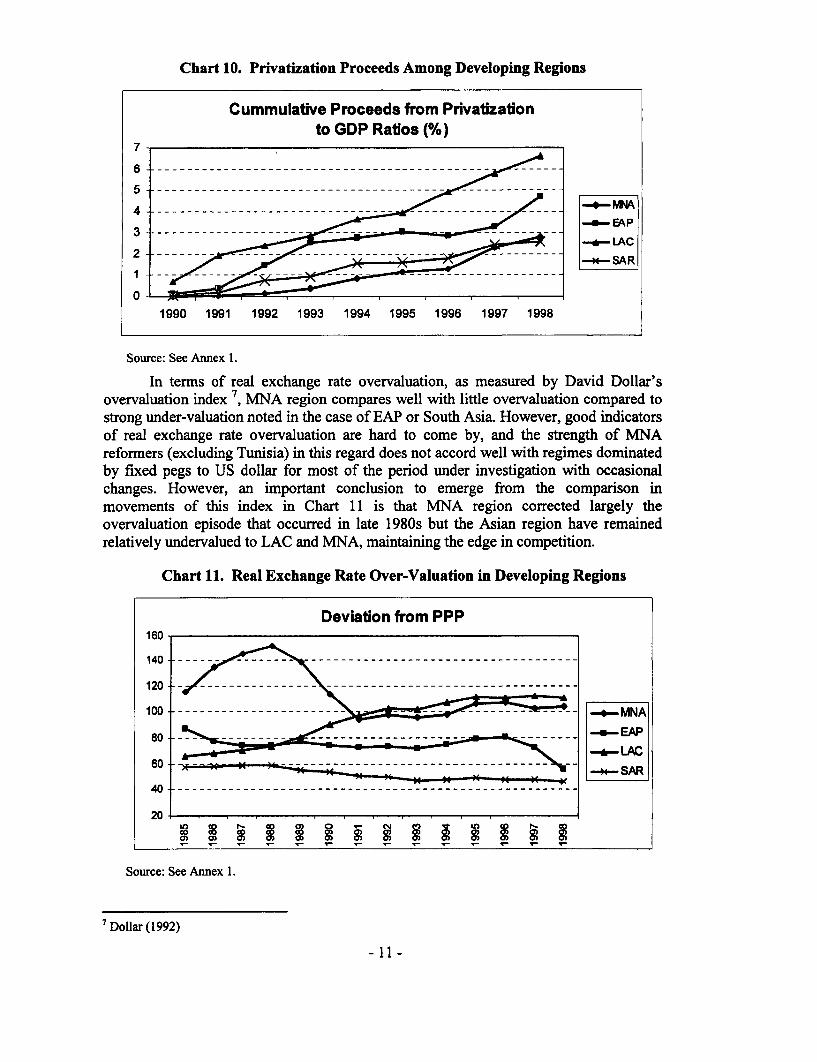
Chart 10. Privatization Proceeds Among Developing Regions
Cummulative Proceeds from Privatizationto GDP Ratios (%)
7
4 iA
3 ~ ~ ~ ~ ~ ~ ~ ~ ~ ~~~~~~~~i-EAPLAC
2 -~~~~~~~~~~~~~~~~-*4-SAR
0v - I I I I .-.- I
1990 1991 1992 1993 1994 1995 1996 1997 1998
Source: See Annex 1.
In terms of real exchange rate overvaluation, as measured by David Dollar'sovervaluation index 7, MNA region compares well with little overvaluation compared tostrong under-valuation noted in the case of EAP or South Asia. However, good indicatorsof real exchange rate overvaluation are hard to come by, and the strength of MNAreformers (excluding Tunisia) in this regard does not accord well with regimes dominatedby fixed pegs to US dollar for most of the period under investigation with occasionalchanges. However, an important conclusion to emerge from the comparison inmovements of this index in Chart 11 is that MvNA region corrected largely theovervaluation episode that occurred in late 1980s but the Asian region have remainedrelatively undervalued to LAC and MNA, maintaining the edge in competition.
Chart 11. Real Exchange Rate Over-Valuation in Developing Regions
Deviation from PPP160
1 20 - - - - - - - - - - - - - - - - - - - -
100 --- -- -- --- -- -- _ M NA
80 LAC60 --=- SAR
20
0a0)0_ 0 0) 0 0 a) 0 _ 0) 0 0
Source: See Annex 1.
Dollar (1992)
-11-
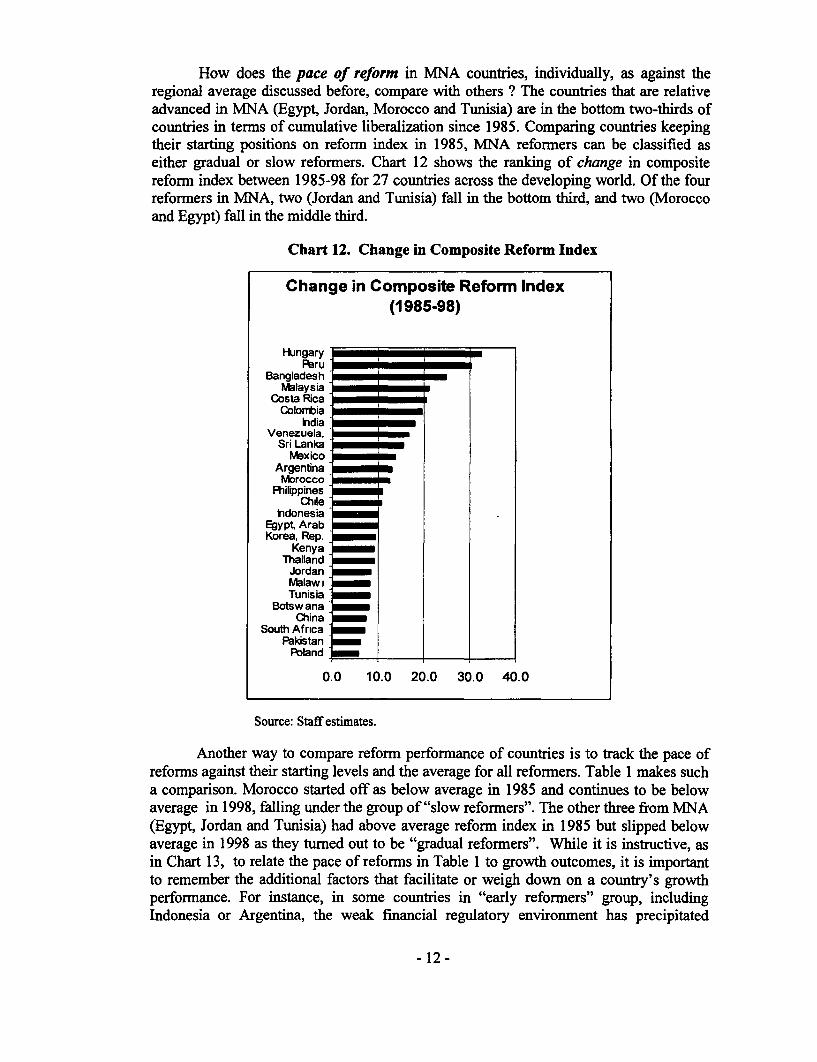
How does the pace of reform in MNA countries, individually, as against theregional average discussed before, compare with others ? The countries that are relativeadvanced in MNA (Egypt, Jordan, Morocco and Tunisia) are in the bottom two-thirds ofcountries in terms of cumulative liberalization since 1985. Comparing countries keepingtheir starting positions on reform index in 1985, MNA reformers can be classified aseither gradual or slow reformers. Chart 12 shows the ranking of change in compositereform index between 1985-98 for 27 countries across the developing world. Of the fourreformers in MNA, two (Jordan and Tunisia) fall in the bottom third, and two (Moroccoand Egypt) fall in the middle third.
Chart 12. Change in Composite Reform Index
Change in Composite Reform Index(1985-98)
Hukngary iPeru
BangladeshMalaysia
Costa RicaColonbia
IndiaVenezuela,
Sri LankaMexico
ArgentinaNbrocco
ChileIndonesia
Egypt ArabKorea, Rep.
KenyaThailand
JordanNblaw XTunisia
Botsw anaChina
South AfricaPaklstan
Pbland
0.0 10.0 20.0 30.0 40.0
Source: Staff estimates.
Another way to compare reform performance of countries is to track the pace ofreforms against their starting levels and the average for all reformers. Table 1 makes sucha comparison. Morocco started off as below average in 1985 and continues to be belowaverage in 1998, falling under the group of "slow reformers". The other three from MNA(Egypt, Jordan and Tunisia) had above average reform index in 1985 but slipped belowaverage in 1998 as they turned out to be "gradual reformers". While it is instructive, asin Chart 13, to relate the pace of reforms in Table 1 to growth outcomes, it is importantto remember the additional factors that facilitate or weigh down on a country's growthperformance. For instance, in some countries in "early reformers" group, includingIndonesia or Argentina, the weak financial regulatory environment has precipitated
- 12-
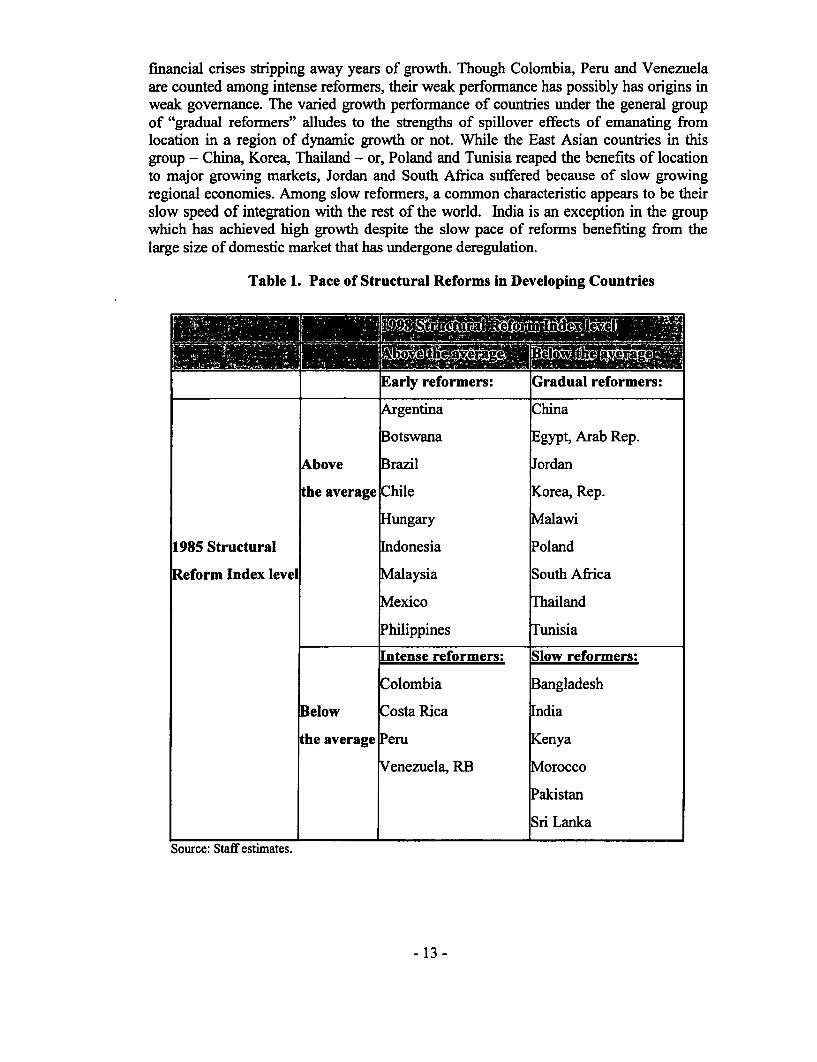
financial crises stripping away years of growth. Though Colombia, Peru and Venezuelaare counted among intense reformers, their weak performance has possibly has origins inweak governance. The varied growth performance of countries under the general groupof "gradual reformers" alludes to the strengths of spillover effects of emanating fromlocation in a region of dynamic growth or not. While the East Asian countries in thisgroup - China, Korea, Thailand - or, Poland and Tunisia reaped the benefits of locationto major growing markets, Jordan and South Africa suffered because of slow growingregional economies. Among slow reformers, a common characteristic appears to be theirslow speed of integration with the rest of the world. India is an exception in the groupwhich has achieved high growth despite the slow pace of reforms benefiting from thelarge size of domestic market that has undergone deregulation.
Table 1. Pace of Structural Reforms in Developing Countries
Early reformers: Gradual reformers:
Argentina China
Botswana Egypt, Arab Rep.
Above razil ordan
he average Chile orea, Rep.
Hungary Malawi
1985 Structural Indonesia oland
Reform Index level Malaysia South Africa
Mexico I'hailand
Philippines Tunisia
Intense reformers: Slow reformers:
Colombia angladesh
Below Costa Rica dia
he average Peru enya
Venezuela, RB orocco
Pakistan
Sri Lanka
Source: Staff estimates.
- 13 -

Contrasting the pace of reforms with the realization of real per-capita GDP growth rates(Chart 13), we see a pattern that higher growth perforrnance has largely concentrated ingradual and early reformers.
Chart 13. Pace of Reforms and Per-capita GDP Growth
Reforms and Per-capita GDP Growth
90
Intensive HungaryReformers Ea rly
85 - F<eforrn-ers-
80 - Malaysia
X Peru Brazi
75 -i Argentina
- 70 ~~~~~~~~Me)dco_ !!70 - Coofb uippmnenezuela * Indonesia
65 Costa Rica * nad65~~~~~~~~~~r -SLank b .Ko1 South Afri;ca
60 ...'slow U an~~Ref ~~ Keny * Tunisia Gradual
5Egypt Reformers55 - Bangladesh __ _ _ _ _ _ __ _ _ _ _ _
IndiaPakistan *
50 - I30 35 40 45 50 55 60 65
1985 Structural R form Index
Source: Staff estimates based on own computations and World Bank Databases.Note: The size of bubbles are scaled proportionately to per-capita GDP growth rate, China has the largestbubble corresponding to its 8.2 percent growth rate. Jordan and South Africa have negative growth rateshown in inverse color. South African bubble is visible whereas Jordan's is hidden behind China's.
Positive Signs
Though the preceding analysis of MNA reform performance may sound gloomy,there are two positive signs that auger well for strengthening reforms and raising growthin MNA. First, MNA countries (the four reformers) have done very well in terms ofeconomic stabilization, a pre-requisite for reforms and a key component of WashingtonConsensus. MNA Reformers have risen to the top of the league countries in EconomicStabilization by lowering inflation, ending black market in exchange rates and narrowingcurrent account deficits. Chart 14 shows that MNA region has maintained its good recordof economic stabilization and has managed to move to the top among regions marginallyedging past East Asia. The composite index of economic stabilization is built using fourcomponents with equal weights:
- 14-

Fiscal balance as a ratio of GDP excluding foreign grants.
Current account balance as a ratio of GDP excluding foreign grants.
Inflation, as measured by consumer price index.
Black market premium on exchange rate.
The methodology and data sources are described in Srinivasan (2001).
Chart 14. Composite Index of Economic Stabilization by Regions
Comnposite Index of Economic Stablization80
EAP AFR M4A75
70
65
60 ---
55- LAC50 -l_ *SAR
45 EnA
40 -e c C - c cD - cI 0 L oD (0 0- c j
co co co co co cD CD C On cD CD C CD!!, a, om a, a , a , a, a , a , a
Source: Staff estimates.Note: LAC: Latin America and Caribbean; MNA: Middle East and North Africa; EAP: East Asia andPacific; AFR: Sub-Saharan Africa; ECA: Europe and Central Asia; SAR: South Asia.
The second positive sign is that investor evaluation of MNA region is respondingfavorably to the improvements in structural reforms. As shown in Chart 15, theinstitutional investor credit rating average for MNA countries (the same four reformingcountries as used in the construction of structural reform index) improved in keeping withthe acceleration of reforms since 1994.
- 15 -

Chart 15. Credit Rating Improves with Structural Reforms for MNA
Structural Reform Index and Institutional Investor Credit Rating for M NA
65 Reform ers
60 -
55 Structual Feform hIdex
50
45-
40
35 -3nstitutional Investor Cedit Rating
25
20 -
-J co to 01 !2 ; -. O" 9 9 'O
Source: Staff estimates based on institutional investor credit rating published twice a year in InstitutionalInvestor magazine.
D. Sources of Growth in MNA
As indicated above, over the past decade, the MNA region took a number of stepsto overcome the macroeconomic imbalances and structural impediments that prevailedthroughout the 1980s. Starting in the late 1980s, several countries in the region -
Morocco and Tunisia, and soon after, Jordan, embarked on far-reaching programs ofmacroeconomic stabilization and policy reform. By the 1990s, nearly all of the non-GCCcountries in the region followed suit, as did several of the Gulf economies. While therehas been considerable variance among economies in terms of both the speed and depth ofthese reforms, the overall change in policy throughout the region would seem to be asignificant step forward in creating an environment in which the private sector couldemerge and become an engine for higher and sustainable growth. The question remains,what has the more than decade-long process of macroeconomic and structural reformachieved?
A cursory examination of growth rates in the region over the last decade wouldappear to yield disappointing results. GDP growth over the region averaged only 3.2% ayear over the 1990s , higher than in the 1980s (2.7% a year), but not the rebound onewould have desired following a decade of stagnation. Still, the turnaround in growthoutcomes on a per capita basis is significant from a negative -0.7 percent a year to apositive 1 percent in the 1990s.
8 Weighted (by population) growth and per capita growth rates for Algeria, Egypt, Iran, Jordan, Morocco,Syria, Tunisia, Yemen, Bahrain, Oman, and Saudi Arabia.
- 16-
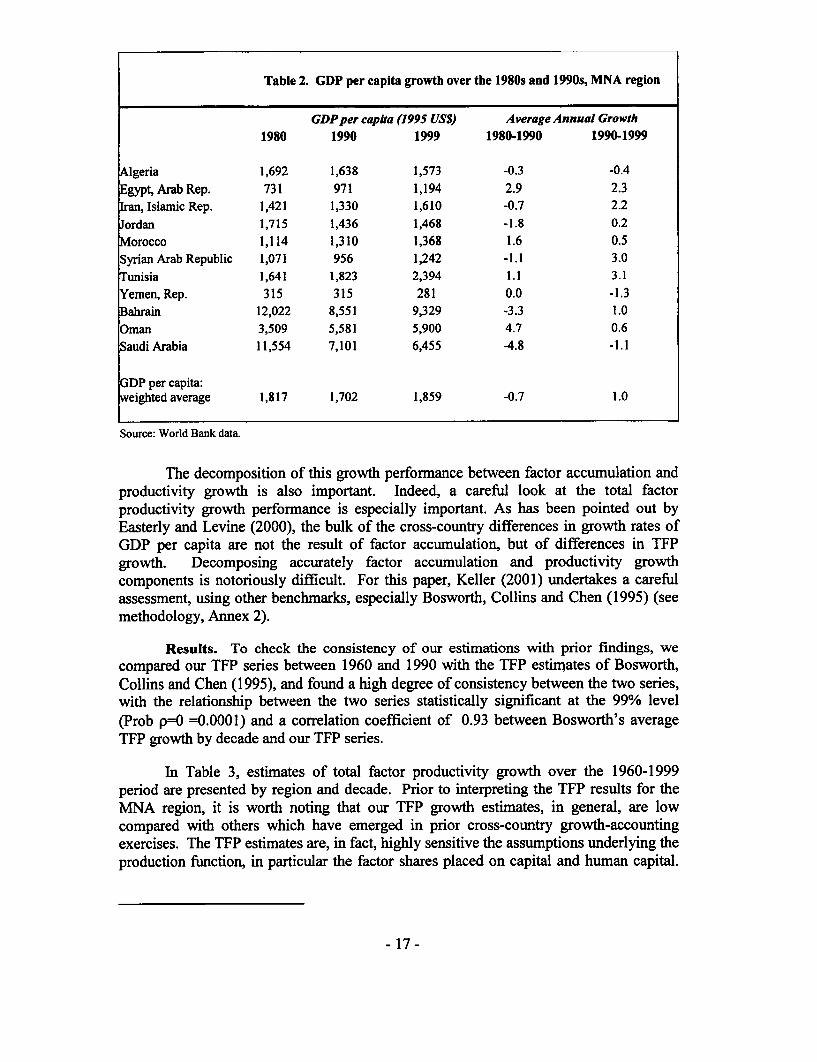
Table 2. GDP per capita growth over the 1980s and 1990s, MNA region
GDPper capita (1995 US$) Average Annual Growth1980 1990 1999 1980-1990 1990-1999
Algeria 1,692 1,638 1,573 -0.3 -0.4
Egypt,ArabRep. 731 971 1,194 2.9 2.3Ian, Islamic Rep. 1,421 1,330 1,610 -0.7 2.2Jordan 1,715 1,436 1,468 -1.8 0.2Morocco 1,114 1,310 1,368 1.6 0.5
Syrian Arab Republic 1,071 956 1,242 -1.1 3.0Tunisia 1,641 1,823 2,394 1.1 3.1Yemen, Rep. 315 315 281 0.0 -1.3Bahrain 12,022 8,551 9,329 -3.3 1.0Oman 3,509 5,581 5,900 4.7 0.6
Saudi Arabia 11,554 7,101 6,455 -4.8 -1.1
GDP per capita:weighted average 1,817 1,702 1,859 -0.7 1.0
Source: World Bank data
The decomposition of this growth performance between factor accumulation andproductivity growth is also important. Indeed, a careful look at the total factorproductivity growth performance is especially important. As has been pointed out byEasterly and Levine (2000), the bulk of the cross-country differences in growth rates ofGDP per capita are not the result of factor accumulation, but of differences in TFPgrowth. Decomposing accurately factor accumulation and productivity growthcomponents is notoriously difficult. For this paper, Keller (2001) undertakes a carefulassessment, using other benchmarks, especially Bosworth, Collins and Chen (1995) (seemethodology, Annex 2).
Results. To check the consistency of our estimations with prior findings, wecompared our TFP series between 1960 and 1990 with the TFP estimates of Bosworth,Collins and Chen (1995), and found a high degree of consistency between the two series,with the relationship between the two series statistically significant at the 99% level(Prob p=O =0.0001) and a correlation coefficient of 0.93 between Bosworth's averageTFP growth by decade and our TFP series.
In Table 3, estimates of total factor productivity growth over the 1960-1999period are presented by region and decade. Prior to interpreting the TFP results for theMNA region, it is worth noting that our TFP growth estimates, in general, are lowcompared with others which have emerged in prior cross-country growth-accountingexercises. The TFP estimates are, in fact, highly sensitive the assumptions underlying theproduction function, in particular the factor shares placed on capital and human capital.
- 17-
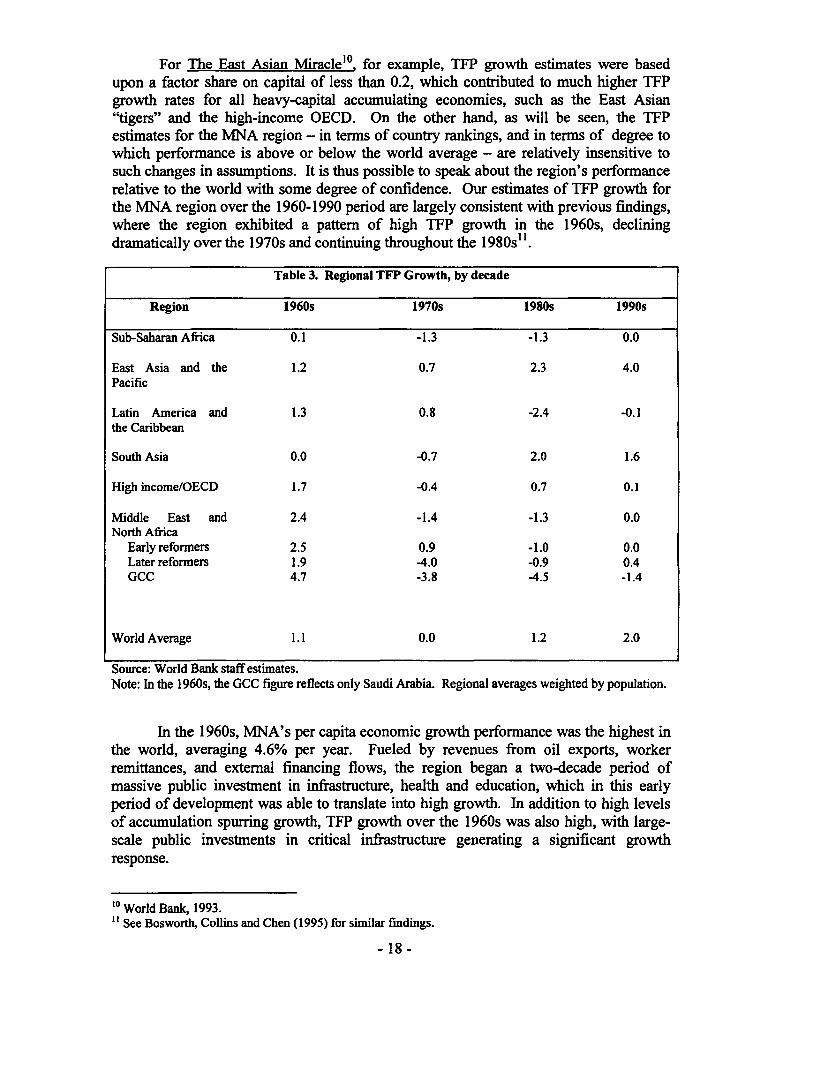
For The East Asian Miraclel for example, TFP growth estimates were basedupon a factor share on capital of less than 0.2, which contributed to much higher TFPgrowth rates for all heavy-capital accumulating economies, such as the East Asian"tigers" and the high-income OECD. On the other hand, as will be seen, the TFPestimates for the MNA region - in terms of country rankings, and in terms of degree towhich performance is above or below the world average - are relatively insensitive tosuch changes in assumptions. It is thus possible to speak about the region's performancerelative to the world with some degree of confidence. Our estimates of TFP growth forthe MNA region over the 1960-1990 period are largely consistent with previous findings,where the region exhibited a pattern of high TFP growth in the 1960s, decliningdramatically over the 1970s and continuing throughout the 1980s".
Table 3. Regional TFP Growth, by decade
Region 1960s 1970s 1980s 1990s
Sub-Saharan Africa 0.1 -1.3 -1.3 0.0
East Asia and the 1.2 0.7 2.3 4.0Pacific
Latin America and 1.3 0.8 -2.4 -0.1the Caribbean
South Asia 0.0 -0.7 2.0 1.6
High income/OECD 1.7 -0.4 0.7 0.1
Middle East and 2.4 -1.4 -1.3 0.0North Africa
Early reformers 2.5 0.9 -1.0 0.0Later reformers 1.9 -4.0 -0.9 0.4GCC 4.7 -3.8 -4.5 -1.4
World Average 1.1 0.0 1.2 2.0
Source: World Bank staff estimates.Note: In the 1 960s, the GCC figure reflects only Saudi Arabia. Regional averages weighted by population.
In the 1960s, MNA's per capita economic growth performance was the highest inthe world, averaging 4.6% per year. Fueled by revenues from oil exports, workerremittances, and external financing flows, the region began a two-decade period ofmassive public investment in infrastructure, health and education, which in this earlyperiod of development was able to translate into high growth. In addition to high levelsof accumulation spuning growth, TFP growth over the 1960s was also high, with large-scale public investments in critical infrastructure generating a significant growthresponse.
'° World Bank, 1993."See Bosworth, Collins and Chen (1995) for similar findings.
- 18-

In the 1970s, going by growth figures alone, MENA was still in the middle of agrowth "heyday", with GDP growth averaging 5.7 percent a year. But the underlyingconditions spurring growth in the 1970s represent a serious and negative departure fromthe previous decade of high growth and productivity. To begin, the 1970s were markedby an increase in the rate of physical capital accumulation per laborer of more than 60%,and an almost doubling of the rate of human capital accumulation per laborer. Over the1970s, the MENA region realized the highest rates of growth of both physical capital perlaborer and human capital per laborer. Despite this immense increase in accumulation,on a per laborer basis, growth actually declined, on average by close to 2% a year. Thus,the 1970s represented two large and yet conflicting growth dynamics for the region,where investments were being undertaken in record levels (all things equal, increasingthe region's growth potential) at the same time that these investments were havingincreasingly poor payoffs, in terms of growth.
But by the 1980s, as international oil prices slumped in the wake of globaloverproduction, these economic gains became unsustainable and the region's countrieswitnessed slow or even negative per laborer growth rates. With eroding macroeconomicbalances and growing debt burdens, and despite both heavy external assistance (whichpermitted spending for several more years), investments declined dramatically, with therate of growth of the physical capital stock per laborer cut by almost three quarters fromthe prior decade.
This decline in accumulation was almost without exception, with every country inthe region but Kuwait experiencing a dramatic decline in accumulation between the1970s and 1980s, and almost every economy experiencing a likewise decline in TFP.Only Iran and Oman saw actual improvements in total factor productivity between the1970s and 1980s. Negative productivity growth was most prevalent in the oil-producingeconomies of the region - both within the GCC economies as well as Algeria. Becauseour TFP estimates are a reflection of factor efficiency, the degree to which capital isunderutilized will be heavily reflected in the ensuing TFP growth measurements. Thisfeature is of particular importance for these economies, since as oil prices collapsed in the1980s, there was a significant effort on the part of oil-producers to prop up oil prices byholding down production. Nevertheless, even in the non-oil producing economies, therewere widespread declines in productivity for almost every country. With both massivedeclines in accumulation and corresponding declines in TFP for most countries, theMENA region experienced a collapse of economic growth per laborer.
- 19-
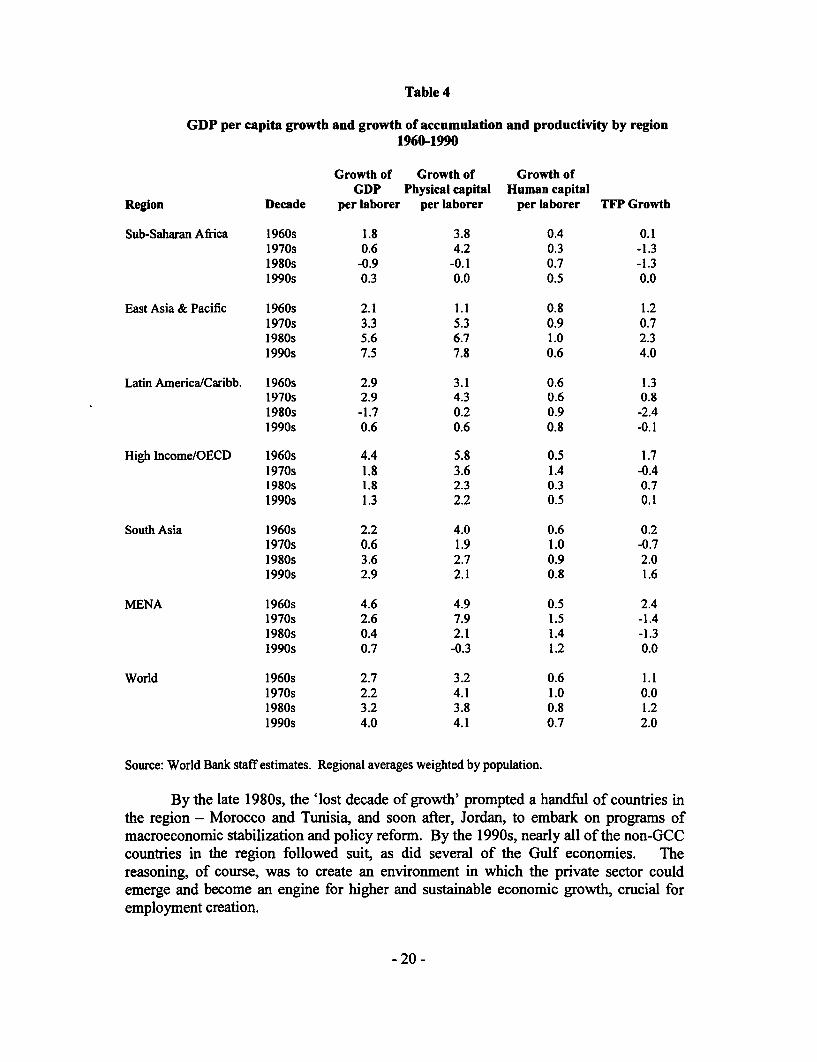
Table 4
GDP per capita growth and growth of accumulation and productivity by region1960-1990
Growth of Growth of Growth ofGDP Physical capital Human capital
Region Decade per laborer per laborer per laborer TFP Growth
Sub-Saharan Africa 1960s 1.8 3.8 0.4 0.11970s 0.6 4.2 0.3 -1.31980s -0.9 -0.1 0.7 -1.31990s 0.3 0.0 0.5 0.0
East Asia & Pacific 1960s 2.1 1.1 0.8 1.21970s 3.3 5.3 0.9 0.71980s 5.6 6.7 1.0 2.31990s 7.5 7.8 0.6 4.0
Latin America/Caribb. 1960s 2.9 3.1 0.6 1.31970s 2.9 4.3 0.6 0.81980s -1.7 0.2 0.9 -2.41990s 0.6 0.6 0.8 -0.1
High Income/OECD 1960s 4.4 5.8 0.5 1.71970s 1.8 3.6 1.4 -0.41980s 1.8 2.3 0.3 0.71990s 1.3 2.2 0.5 0.1
South Asia 1960s 2.2 4.0 0.6 0.21970s 0.6 1.9 1.0 -0.71980s 3.6 2.7 0.9 2.01990s 2.9 2.1 0.8 1.6
MENA 1960s 4.6 4.9 0.5 2.41970s 2.6 7.9 1.5 -1.41980s 0.4 2.1 1.4 -1.31990s 0.7 -0.3 1.2 0.0
World 1960s 2.7 3.2 0.6 1.11970s 2.2 4.1 1.0 0.01980s 3.2 3.8 0.8 1.21990s 4.0 4.1 0.7 2.0
Source: World Bank staff estimates. Regional averages weighted by population.
By the late 1980s, the 'lost decade of growth' prompted a handful of countries inthe region - Morocco and Tunisia, and soon after, Jordan, to embark on programs ofmacroeconomic stabilization and policy reform. By the 1990s, nearly all of the non-GCCcountries in the region followed suit, as did several of the Gulf economies. Thereasoning, of course, was to create an environment in which the private sector couldemerge and become an engine for higher and sustainable economic growth, crucial foremployment creation.
- 20 -
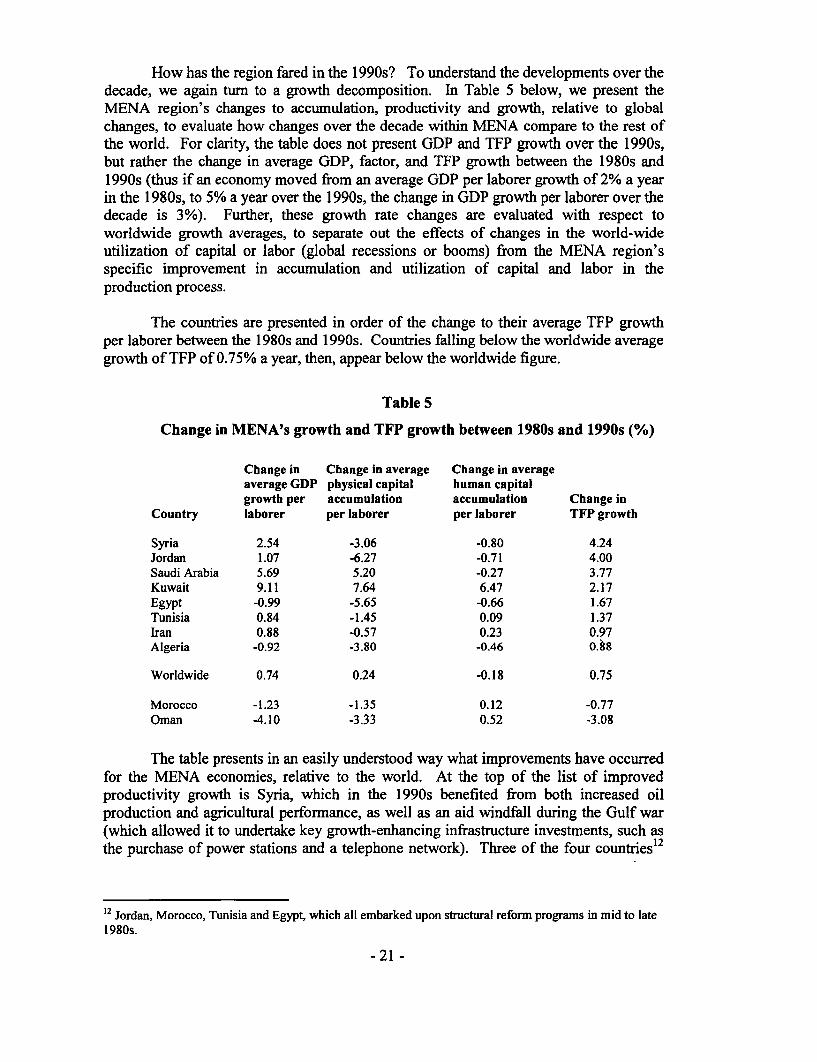
How has the region fared in the 1 990s? To understand the developments over thedecade, we again turn to a growth decomposition. In Table 5 below, we present theMENA region's changes to accumulation, productivity and growth, relative to globalchanges, to evaluate how changes over the decade within MENA compare to the rest ofthe world. For clarity, the table does not present GDP and TFP growth over the 1990s,but rather the change in average GDP, factor, and TFP growth between the 1980s and1 990s (thus if an economy moved from an average GDP per laborer growth of 2% a yearin the 1980s, to 5% a year over the 1990s, the change in GDP growth per laborer over thedecade is 3%). Further, these growth rate changes are evaluated with respect toworldwide growth averages, to separate out the effects of changes in the world-wideutilization of capital or labor (global recessions or booms) from the MENA region'sspecific improvement in accumulation and utilization of capital and labor in theproduction process.
The countries are presented in order of the change to their average TFP growthper laborer between the 1980s and 1990s. Countries falling below the worldwide averagegrowth of TFP of 0.75% a year, then, appear below the worldwide figure.
Table 5
Change in MENA's growth and TFP growth between 1980s and 1990s (%)
Change in Change in average Change in averageaverage GDP physical capital human capitalgrowth per accumulation accumulation Change in
Country laborer per laborer per laborer TFP growth
Syria 2.54 -3.06 -0.80 4.24Jordan 1.07 -6.27 -0.71 4.00Saudi Arabia 5.69 5.20 -0.27 3.77Kuwait 9.11 7.64 6.47 2.17Egypt -0.99 -5.65 -0.66 1.67Tunisia 0.84 -1.45 0.09 1.37Iran 0.88 -0.57 0.23 0.97Algeria -0.92 -3.80 -0.46 0.98
Worldwide 0.74 0.24 -0.18 0.75
Morocco -1.23 -1.35 0.12 -0.77Oman -4.10 -3.33 0.52 -3.08
The table presents in an easily understood way what improvements have occurredfor the MENA economies, relative to the world. At the top of the list of improvedproductivity growth is Syria, which in the 1990s benefited from both increased oilproduction and agricultural performance, as well as an aid windfall during the Gulf war(which allowed it to undertake key growth-enhancing infrastructure investments, such asthe purchase of power stations and a telephone network). Three of the four countries' 2
12 Jordan, Morocco, Tunisia and Egypt, which all embarked upon structural reform programs in mid to late1980s.
- 21 -

we would term the 'early reformers' (Jordan, Tunisia and Egypt) also experienced betterthan average increases in average TFP growth between the 1980s and 1990s.
Overall, TFP growth in the region actually improved in all but 2 economies(Morocco and Oman), and on a relative basis, TFP performance improved relative to therest of the world in 8 out of the 10 countries in the sample.
At the same time, however, due to large declines in accumulation within most ofMENA (larger than average global changes to the growth in factor accumulation), thechange in relative GDP growth (to the world) has not reflected the large improvements infactor allocation and efficiency (Jordan, Egypt and Tunisia, for example).
It is difficult to definitively interpret the substantial declines in accumulationthroughout the 1990s. Public sector investments have certainly dropped off. So, in themidst of an overall factor accumulation deterioration, it could be that private sector factoraccumulation is actually improving. More likely, however, is that while productivity andfactor allocation efficiency has improved significantly over the 1990s, it has failed togenerate a comparable private sector investment response. Country studies on theprivate investment response in Jordan, Egypt and Morocco, for example, suggest weakrecovery in private investment. Yet there are also signs in some countries, such asJordan, that private investmnent is shifting slowly towards traded goods sectors and awayfrom non-traded areas such as construction, which augurs better for the future.
Nevertheless, most country evidence seems to suggest that the private sectorinvestment response has been slow. It is beyond the scope of this paper to adequatelyanalyze why the reform process, which has clearly produced an impact on the region'sproductivity, has failed to generate a private-sector investment response in the external-oriented sectors. However, the literature on growth modeling is paying increasing focusto the role of institutions on growth' 3 . Institutional factors -- such as the degree ofregulation, red tape, and corruption of the government - have become ever morerecognized as critical factors that can either fasten or stand in the way of sustainedeconomic growth. Surveys of existing enterprises and potential investors consistentlyrank the three elements of institutional capability -- red tape, judiciary system efficiency,and corruption -- as among the major factors determining the attractiveness of developingeconomies for new private investment14 .
To accurately diagnose the continuing fall in MNA's factor accumulation would,to start, require a detailed analysis of the changes to both public and private investments,information which is generally lacking in the region. On the other hand, getting a graspon the specifics behind the investment collapse within MNA might be invaluable inenabling the comprehensive macroeconomic and structural reform agenda the region hasundertaken to generate a more dynamic growth response.
Did the reforms as measured by our indices have any statistically significanteffects on the changes in growth performance and in TFP observed over the period in
13 See Hall and Jones (1998), Mauro (1995), for example.14 See for example the Private Sector Assessments conducted by the World Bank for more than 40 developing
economies.
- 22 -
MNA? Cross-country panel regression analysis has been initiated to attempt to answerthis question, but is not yet robust enough to derive anything meaningful other than somevery preliminary and qualitative remarks at this time. The very preliminary data andresults seem to suggest some significant positive association between observed growthand TFP changes across all countries and in MNA with macroeconomic stability index,but not necessarily with the structural reform index.
What characteristics define strong performance in productivity growth?
Finally, inherent in our TFP calculation exercise is the belief that higherproductivity growth, if it is sustained, can generate a corresponding private sectorinvestment response that together form the engine for rapid growth. But realizing higherrates of total factor productivity growth for consistent periods of time has been elusive fora majority of the world's economies. Looking at TFP growth rates across countries,relative to world averages, reveals a startling degree of variation across time. Countriesthat had the highest TFP growth rates over one decade fall close to the bottom the nextdecade. Thus, trying to discern commonalities among countries who are "on top" nowmay be quite misleading.
As an exercise, we looked at TFP growth rates across countries over the four-decade period for which we have information, in an effort to discern what may be somecommon features among the world's emerging economies, in terms of sustained betterTFP performance. However, to create a topology of "better performers" requires somesubjective ordering of the importance of certain TFP features over others. For example,constructing a composite TFP score as the simple average of TFP growth (relative to theworld) for the 1960s through the 1990s implicitly weights a good (or poor) performance35 years ago the same as today. For that matter, averaging a poor performance and goodperformance under equivalent weights implicitly means valuing a boom and a bust inproductivity equally.
Therefore, in deriving a composite performance index on productivity, certaincharacteristics may be important. We have constructed such an index to rank countrieswith two basic features which, in our mind, are important in talking about the world'semerging economies in terms of TFP growth. Firstly, we are primarily interested in thepresent. At the same time, because productivity fluctuates from decade to decade(sometimes, simply the result of good weather or production windfalls), it would beimprudent to look strictly at the 1 990s to determine the recent better performers. Thus, inderiving a composite index of TFP growth, we have placed increased emphasis on thepresent, but we have not altogether overlooked the past, with each decade's TFPperformance carrying twice the weight of the previous decade.
Secondly, we are interested in economies in which productivity growth has beenimproving. Thus, a decline in productivity growth from one decade to the next carries apenalty, signaling a deterioration of productivity (even if productivity growth remainsabove world averages). Thus, in our composite index, we have additionally penalizedTFP growth deteriorations, again with increasing weight for on the present, bysubtracting half of any decline in TFP growth (if indeed there was a decline) as a share ofthe average worldwide declines.
- 23 -

The construction of this composite index permits a very qualitative assessment ofthe overall performance of economies in productivity growth over the past four decadesand in distinguishing certain characteristics of laggards and leaders. Annex 3 providessuch a composite index of countries which have done very well(the top runners) andthose who are at the bottom. While this needs much more careful testing certainqualitative remarks about distinguishing features may be possible:
The first is the diversity of economies in the top third. Among the top 31 performersas measured over the last 40 years, five are from East Asia and the Pacific, elevenfrom high income or OECD economies, four from Latin America and the Caribbean,four from South Asia, five from South Africa, one from Europe and Central Asia, andone from the Middle East and North Africa - namely, Tunisia. Sustained strongproductivity performance is not the preserve of any one region or income group.
The second is the suggestion of the importance of macroeconomic stability, exportgrowth and diversification in economic activity from traditional to new sectors overtime, and concurrently, the critical importance therefore of a strong privateinvestment response (new investment in new and diversified sectors). Most countriesin the top third are anecdotally those who have diversified their economies over timeaway from a few major sectors. This includes China, Ireland and Mauritius in thetop three for example. And only Tunisia, for example, makes the list of the top thirdof countries.
The third is the relative prevalence of commodity or resource dependence among thebottom third--- all the oil economies are there, and those that are less diversified andwith greater volatility and macroeconomic instability.
E. Conclusion
The growth performance of MNA countries reviewed in this paper suggests thatreforms in MNA remain very much a half-finished business. Reforms have clearly begunbut most MNA countries are late reformers and continue to lag other countries andregions' performance. The effect of reforms is difficult to distinguish but may have atleast contributed to reverse the large negative total factor productivity losses of the 1970sand 1980s. But the private investment response has been lagging and understanding thereasons are a priority---and the needed reforms may need to go well beyond the first stageof structural reforms in these countries. Finally, sustained improvement in productivityperformance will be critical and appears to be tied, at least at first glance, to success inrapid diversification in economic activity over time, in traded goods and services andaway from excessive dependence on resources and commodities such as oil (whichinduce high volatility and low productivity performance). All of these conclusions in thepaper nevertheless represent work in progress and need much more careful testing andanalyses for the future.
-24 -

Bibliography
Agarwala, Ramgopal. 1983. Price Distortions and Growth in Developing Countries.World Bank Staff Working Papers, Number 575, World Bank.
Barro, Robert J. and Jong-Wha Lee. 2000. "International Data on EducationalAttainment: Updates and Implications"; CID Working paper No. 42; Center forInternational Development at Harvard University.
Bonaglia, Federico, Andrea Goldstein, and Christine Richaud. 2000. "Mesuring Reform."in Jorge Braga de Macedo, and Omar Kabbaj. Reform and Growth in Africa. Paris:OECD.
Bosworth, Barry, Susan M Collins, and Yu-chin Chen. 1995. Accounting forDifferences in Economic Growth. Paper for conference on "Structural AdjustmentPolicies in the 1990s: Experience and Prospects", organized by the Institute ofDeveloping Economies, Tokyo, Japan.
David Dollar, 1992, Outward-oriented Developing Economies Really Do Grow MoreRapidly: Evidence for 95 LDCs, 1976-85, Economic Development and Cultural Change,1992, pages 524-544.
De Melo, Martha, Cevdet Denizer, and Alan Gelb. 1996. From Plan to Market. PolicyResearch Working Paper, 1564. Washington, D.C.: World Bank.
Dicks-Mireaux, Louis, Jean Le Dem, Steven Phillips, and Kalpana Kochhar. 1999. "ThePolicy Record." in Hugh Bredenkamp, and Susan Schadler. Economic Adjustment andReform in Low-Income Countries. Washington, D.C.: International Monetary Fund.
European Bank for Reconstruction and Development, 1999. Transition Report.
Easterly, William, and Ross Levine. 2001. "It's Not Factor Accumulation: StylizedFacts and Growth Models." World Bank Economic Review 15, n2, pages 177-219.
Easterly, William, Norman Loayza, and Peter Montiel. 1997. "Has Latin America's Post-reform Growth Been Disappointing?" Journal of International Economics 43: 287-311.
Hall, Robert E. and Charles I. Jones. May 1998. "Why Do Some Countries Produce SoMuch More Output per Worker than Others?" National Bureau of Economic ResearchWorking Paper 6564.
Islam, Nazrul. 1999. "International Comparison of Total Factor Productivity: AReview." Review of Income and Wealth v45 n4.
Keller, Jennifer (2001). Sources of Growth in MNA, unpublished, MNSED, World Bank.Lora, Eduardo. 1997. "A Decade of Structural Reforms in Latin America: What HasBeen Reformed and How to Measure It." Inter-American Development Bank Office ofthe Chief Economist Working Paper Green Series #348.
- 25 -
Mauro, Paolo. 1995. "Corruption and Growth" Quarterly Journal of Economics v 10 n3.
McGillivray, Mark. 1999. "Assessing the Impact of Economic LiberalizationProgrammes: A Survey of Empirical Methodologies." in Mark McGillivray, and OliverMorrissey. Evaluating Economic Liberalization. London: Macmillan Press Ltd.
Morley, Samuel A., Robert Machado, and Stefano Pettinato. 1999. Indexes of StructuralReform in Latin America. Santiago: United Nations, Economic Commission for LatinAmerica and the Caribbean.
Nehru, Vikram Ashok Dhareshwar. 1993. "A New Database on Physical Capital Stock:Sources, Methodology and Results". Revista de Analisis Economico 8 (1): 37-59.
Ng, Francis, and Alexander Yeats. 1998. "Good Governance and Trade Policy."Development Research Group, World Bank.
Oliva, Maria-Angels. 2000. "Estimation of Trade Protection in Middle East and NorthAfrican Countries", IMF Working Papers, WP/00/27.
Srinivasan T.G. (2001) Measuring Reform Efforts in MNA, unpublished, MNSED,World Bank.
Williamson, John. 1990. "What Washington Means by Policy Reform." in LatinAmerican Adjustment: How Much Has Happened? Washington, D.C.: Institute forInternational Economics
- 26 -

Annex 1. Data sources for Construction of Structural Reform Index
1. The data for privatization receipts are taken from World Development Indicators.
2. The data for Tariff are also taken from i) Trade Policy Review (WTO) for various yearsand countries, ii) Trade Policy Reform in Developing Countries since 1985 (WorldBank Discussion Paper No.267), iii) Jordan: Policies and Prospects for Small andMedium Scale Manufacturing Industries (World Bank Publication Report No. 6848-jo)and iii) Jordan: Strategyfor Adjustment and Growth (IMF, Occasional Paper No. 136)
3. For individual and corporate taxes, i)Price Water House Coopers, Coopers & LybrandGlobal Tax Network and ii). International Tax Summaries, Deloitte Touche TohmatsuInternational, Syria are supplementary used.
4. The data for real exchange rate deviation from PPP are originally from David Dollar,used in "Outward-oriented Developing Economies Really Do Grow More Rapidly:Evidence from 95 LDBs, 1976-1985: Economic Development and Cultural Change,1992, extended to 1999 by research staff and downloaded fromhttp://www.worldbank.org/research/growth/GDNdata.htm#l).
Methodology:
1. Structural Reform Index (SRI) consists of.five sub-indices, i.e., simple mean tariff rates,cumulated privatization receipts to GDP ratios, highest marginal corporate tax rates,highest marginal individual tax rates and real exchange rate deviation from PPP. Thecomposite index is build by assigning weights, one forth, one forth, one eighth, oneeighth and one forth, respectively.
2. For exchange rates deviation from PPP, any differences from 100 is treated as equalwhether positive or negative.
3. All the data are normalized by the formula as below:
Xij=(W-Vjt)/(W-B)
Where W: Worst value of all the years and all the countries,Vjt: Value of country j in year t,B: Best value of all the countries and all the years;Xjt: Normalized Value j for year t.
The best and worst benchmarks for the raw indicators before normalization are shown in thetable below:
l_____ BEST WORSTIT Bahrain 0.0 Thailand 85.0CT Nicaragua 0.0 Iran 75.0TAR Bulgaria 1.5 Bangladesh 106.6PRV Hungary 26.9 Multiple Countries 0.0PPP ECA 4 countries 0.0 Nicaragua 5426.6
IT. Highest marginal income tax rate on individuals.CT: Highest marginal income tax rate on corporations.TAR: Average un-weighted tariff rate on imports.PRV: Cumulative privatization proceeds as a ratio of GDP.PPP: Deviations from PPP exchange rate.
- 27 -
Annex 2. Measuring Factor Accumulation and TFP growth contributions toAggregate Growth
TFP growth estimates were made utilizing panel data of capital stock accumulation,human capital stock accumulation, and GDP growth from 1960-1999. Estimates of the physicalcapital stock for a sample of 83 economies from 1960 to 1990 come from Nehru and Dhareshwar(199315), which was created by a perpetual inventory method from investment rates from 1950forward, with initial assumptions about the capital/output ratio, and assuming a common fixedannual geometric depreciation rate of 0.04. These capital stock data were extended to 1999 usingthe growth rates of constant price local currency investment from the World Bank's WorldDevelopment Indicators database' 6, and applying similar assumptions on the depreciation rate.Capital stock estimates for another 12 economies, including 4 economies in the MNA region ofparticular interest to us, were created according to a similar methodology, using investment ratesfrom 1960 forward. Since we will estimate GDP growth using a panel regression approach over10 year periods, the sample was restricted to those economies in which the capital stock could beestimated for the full 1960-1999 period, both to maintain a balanced panel, and reducing theimportance of the assumption about the initial stock in the period of analysis of particularimportance to us, the 1990s.
Real GDP in constant local currency also come from World Bank data. The humancapital-augmented labor stock was estimated, using both labor force estimates as reported by theInternational Labor Organization, from the World Bank database, and estimates of theeducational attainment of the adult population from Barro and Lee'7. The functional form ofhuman capital augmented labor has been assumed as:
H = L e (r*S)
where L is the labor force and S is the average years of schooling of the adult population, and r isthe rate of return to schooling. According to international evidence, a reasonable approximationof that rate of return is 10%, which we have assumed for the purposes of our analysis.
TFP growth was calculated over ten-year periods from 1960-1999, rather than on anannual basis, to minimize the error that is inherent in current capital stock measurements.National accounts would attribute any investment expenditures made over the year, even the lastday of the year, to that year's capital stock. However, it is unlikely that that investmentexpenditure would contribute to economic growth immediately, but rather would only create thepotential to contribute to growth into the future. To reduce this lag-effect that physical capitalexhibits, we calculated TFP growth based on ten-year averages. We allowed for slight variationinto the years included for Kuwait, in order to minimize the very large impact that came from theGulf war. In Kuwait, we removed the years 1989-1992 from the analysis. This decision wasmade not to mine the data in any fashion, but only to better serve our purpose of evaluating thecountry's growth, accumulation, and productivity.
'5 Nehru, Vikram Ashok Dhareshwar. 1993. A New Database on Physical Capital Stock: Sources, Methodology andResults. Revista de Analisis Economico 8 (1): 37-5916 In the case of MNA economies, where there were inconsistencies, the World Bank MNA regional databaseinvestment series was preferred." "Intemational Data on Educational Attainment: Updates and Implications"; CID Working paper No. 42;Center for International Development at Harvard University; April 2000.'8 Nehru, Vikram Ashok Dhareshwar. 1993. A New Database on Physical Capital Stock: Sources, Methodology andResults. Revista de Analisis Econom*co 8 (1) * 37-59.19 In the case of MNA economies, where there were inconsistencies, the World Bank MNA regional databaseinvestmnent series was preferred.20 "Intemational Data on Educational Attainment: Updates and Implications"; CID Working paper No. 42;Center for Intemational Development at Harvard University; April 2000.
- 28 -

Production was assumed to follow a Cobb-Douglas specification with constant returns toscale between physical and human-capital-augmented labor:
Y, = A (t) *
where Y is output, A is an index of total factor productivity, and K and H are the stocks ofphysical and human-augmented labor, respectively.- Dividing both sides by the work force,taking logs, and first-differencing, growth of output per worker can be related as follows:
In (y;/yj],,) = a In (k,/k,., + (1-a) In (,/h,)d + In (A, / A.,)
To determine the coefficients on capital and human-capital augmented labor, a and (1 -a),the average annual rate of GDP per capita growth over the decade was regressed on averagegrowth of physical capital per worker and human-capital per worker with a least squares trendover the entire period of availability (1960-1999).
From our estimation, the elasticity of output of physical capital was estimated to be 0.49,somewhat higher than the average estimated coefficient from previous research, but within therange of accepted parameters. This may be due to the inclusion of several more developingcountries than in the original Nehru-Dhareshwar physical capital stock dataset, made possibleusing World Bank data. At the same time, our purpose here is not to break new ground inmeasuring TFP, but to evaluate the region's performance in factor allocati6o and efficiency.Thus, we have calculated the TFP using three distinct calculation of factor shares -- ak=0.3 ,ak=0.4, and ak=0.5, to check the sensitivity of the region's growth performance to theassumptions made on the output elasticities. The resulting sets of TFP growth estim ations for thefull sample of countries are presented in Annex 3. Within the text of the paper, TFP calculationsare based on elasticity of capital assumption of 0.4 across countries.
- 29 -

Annex 3. Emerging economies in terms of improved productivity growthPerformance, 1960-1999
REGION COUNTRY 1960s 1970s 1980s 1990s Score*
1 -East Asia and the Pacific China 1.38 0.77 3.01 5.34 3.90-2 High Incomnr-OECD Irelanid .1.69 1.13 1.08 -3.61 2.533 Sub-Saharan Africa Mauritious 0.27- 1.10 3.79 1.61 1.954 Eampe and Central Asia Cyprus 4.45 0.87 1.87 1.53 1.665 South Asia India 0.11- -.0.77 2.14 1.73 1.356 East Asia and the Pacific Singapore -0.22 0.04 088 1.79 1.197 LatinAmericaandtheCanbbean Chile 1.40 -020 -0.16 2.04 1.168 Sub-Saharan Africa Botswana 1.80 4.59 2.61 -0.35 0.959 South Asia Bangladesh 0.87 -1.09 1.85 1.12 0.9110 Sub-Saharan Africa Malawi -0.73 0.02 0.07 1.77 0.911-1 High Income / OECD Denmark 0.74 -0.47 0.51 1.32 0.8512 High Incotmn / OECD Austraha 1.10 0.05 0.07 1.27 0.8313 High Income I OECD Fmland 1.66 0.57 0.12 0.95 0.7714 High Incomm / OECD Norway 0:96 1.01 -1.66 2.12 0.7615 Middle East and North Africa Tunisia 1.43 1.45 -036 1.02 07616 South Asia Sri Lanka 1.36 -0.26 -0.32 1.21 0.6617 Sub-Saharan Africa Mali 0.36 1.89 -0.57 1.04 0.6618 Latm America and the Canbbean Argentma 0.83 -0.53 -2.66 3.07 0.6319 High Income I OECD Israel 3.05 0.49 0.65 0.36 0.6020 South Asia Pakistan -0.11 0.20 1.16 0.56 0.5921 Latm Amenca and the Canbbean Uruguay -0.22. -0.72 -0.32 1.47 0.5722 Latin Amenca and the Canbbean Bolivia 1.82 0.25 -1 43 1.58 0.5423 East Asia andthe Pacific Korea 1.09 -0.96 2.21 '.18 0.4824 High Income / OECD Belglum 2.04 1.40 0.61 0.06 0.4525 High Inconm / OECD United States 0.74 -1.33 1.05 0.74 0.4526 Sub-Saharan Africa Mozambique 116 -3.82 -1.35 3.09 0.4327 High Ificome I OECD Nethierlands 0.00 0.01 -0.59 1.06 0.4328 High Incomr / OECD Iceland 0.56 1.86: -0.73 0.57 0.3729 East.Asia and the Pacific Papau New Ginea -0.59 -1.53 -1.52 2.22 0.3630 East Asia and the Pacific Thailand 1.53- 0.47 2.30 -0.33 0.3631 High Income I OECD United Kimgdom 0.45 -0.17 0.78 0.29 0.3532 Sub-Saharan Afnca Tanzania 2.98 -0.36 -0.06 0.44 0.3433 East Asia and the Pacific Malaysia 021 056 0.02 0.44 0.3334 High Income / OECD Austria 2.20 0.77 0.49 -0.05 0.2635 Sub-Saharan Afrca Uganda 0.03 -10.19 2.23 3.90 0.2436 EastAsiaandthePacific Mynaniar 0.01 1.78 -194 1.37 02237 Sub-Saharan Africa Senegal 0.41 -1.21 0.68 0.37 0.1638 High Incorm / OECD Italy 2.42 1.38 0 35 -0.24 0.1539 Latin Amenca and the Canbbean Costa Rica 0.89 -1.06 -1.44 1 37 0 1540 Middle East and North Afnca Egypt 1.78 1.34 -1.23 0.45 0.1541 Latin Amenca and the Canbbean Dominican Repubhc 0.53 020 -2.64 2.02 0.1442 High Income / OECD Portugal 2.66 0.01 0.31 -0.04 0 1143 High Inconm / OECD Greece 3.27 041 -079 0.07 0.0244 High Income I OECD Spain 2.52 -0 37 0.51 -0.18 -0.0345 Middle East and North Africa Syna 0 26 1.92 -2.76 1.48 -0.0546 Sub-Saharan Affica Chana -2.52 -200 -0.29 1.17 -0.06
- 30 -

REGION COUNTRY 1960s 1970s 1980s 1990s Score *
47 High Income / OEMD France 1.75 -009 0.69 -0.31 -0 07
48 Latm Anenca and the Caribbean Guatemala 1 40 0.89 -1.62 0.46 -0.09
49 Sub-Saharan Africa Kenya 1 50 3.22 1 10 -0.98 -0 15
50 High Incore / OECD Canada 1.85 -0.24 -047 -0.14 -0.22
51 Europe and Central Asia Turkey 2.01 0.53 1 41 -0.84 -0.24
52 Sub-Saharan Afnca Zimbabwe 3.35 -0.91 -0.95 -004 -0.37
53 High Incomr / OECD New Zealand 0.53 -1.45 -0.54 0.07 -0.40
54 Latin America and the Caribbean Guyana 092 -1.39 -445 2.78 -0.49
55 Europe and Central Asia Hungary 001 0.82 0.31 -0.81 -0.60
56 Latin America and the Canbbean Panama 2.01 -0.60 -3 38 1 28 -061
57 Middle East and North Afnca Oman ... -4.21 2.60 -0.48 -0 62
58 High Income / OECD Sweden 1.57 -1.21 0.47 -064 -0 66
59 LatinAmencaandtheCanbbean Brazil 1.46 263 -239 -0.18 -070
60 High Income / OECD Japan 3.64 -0.33 1 02 -1.19 -0.72
61 Latin America and the Canbbean Barbados -116 0.72 -1.46 -0.26 -0 81
62 Middle East and North Africa Jordan ... 2.30 -3.45 0.55 -0.83
.63 ,East Aia.and the Pacific, . -6'9 -F Q.97' `7149, - '0.0V .C
64. Latin Anzrka.and the Cibbean . Salav'idor. ,. .32 1 i-2. 4.' 0.50 -i., -0.90
'65 Sub-Saharan,Afica' - -, 3sqt3o '.16 e-0526 .'-105 . 3
66 Middle'East and North Africa Morocco -. ,,4.59 '.--0.36 -,0.44 .-12&"' -. 104,
67M Middleit and Noth Africa Iran , '2.39. -4.68' -2.12 1.2 , 05.1.68 Latin Aneric6 and the Caribbean Golonibia .22' 0J63 ' 86 '' 22-10
69 Sub-SabaranAfraca 'Cote:D'Ivoire 3.0 -.N .'`0.85 ' -2.52 -0.1i -I 241
70 'Sub-Saharan A-fica Niger t1.71 . .-2.88 . -2.43 ' 0.5,6 "1X27
71 Sub-Sihaxan Afric' Eihiopia - 038 012' 312 001- .13172, Latin Amrica and tbe-Canbbean ''Pe . 1,22' .-0.95 -- 356- 022-, 1373
73 latin America and the Cribbeai Ecuador .' 0.78, 35 1 -'3 60 .- 3774 High-Income/OEWD Switzerland 028 172 Z-006 . '-11 37
75 Ats'tAsinand1hePffic '' -I ndon'si. 0P46A- -0Q56 0-046 1461' -146.76 Latin Am'erca'and.th-e,Caribean Me.co -:,.42 0 314 `-0 48 ' -54!
77 EistAsia ad thiePacific , ' Ph,iliipines, 5 003 -226 -081 15578 rb-S8harAfiicea , - Zambia -'036 13 -027 -1.39- .4
79 Sub-Sahara Africa ,- CaneroorL -1.06 2:81"' -288 - -0.80 1463
80 Sub-Saharan Af .-ca Togo 0 ' -043 .36, 20 048 164'.81 Iatin Ameica an'd the Caribbean H6nduras . "' 062 069--202 -0123 -16782 Sub-SaharankAfica South Africa 147 001 r 243 -1,10 1.7483 Latm Amernca aind the Canbbeui Paraguay 0.50 1.56 -239: -1.48 -1.04
84 Sub-Saharan A frica ' Nigefia -1.39 -2 54 _1L95 I -1.01 -2.16
85 Nliddle East and North Afirica Algeria 1.44 --0-42 -2.6 - -2.46'
86 Latin Amenca and the Caribbean N,!earagua 1.11 -4.03 4-66 -062 -3.17
87 Latin Anrenca and the Caribbean 'Trinidad and Tobago 1 02 -0 14 -5.74 -1.08 4-322
88 Latin America and the Canbbean Janmica 1 62 -4.07 0Q17 -2.82' -3,30
89 Latin America and Lhe Caribbean Haiti r -1.20 0.29 -4.10 41.88 -3.32
.90 Sub-Saharan Afrca - Rwanda -1.03 013 -4.47 '',87>. - '347
91 Latm Arnerica and the Cartbbean -e~k6wniela 1.95 -4.12 -1:69 j-245i ..3.6f
92 Middle East and Norib Africa , 'SaudLArabia 4.69 -3.45 -5.1A -1.33 . -3.69
93 NMddle East and North Alfrica Kuwait __ _ ___ -5.35 -5.34 -3 17 -5 56
Score determined as follows:(rtfp60s*1 + rtfp7Os*2 + rtfp8Os*4 + rtfp9Os*8)/15 - .5(rdec7Os*2 + rdec8Os*4 + rdec90s*8)/14,where rtfpxx=tfp growth relative to world average for the decade and rdecxx= decline in tfp growth from previousdecade, if there was a decline (otherwise, rdecxx takes a value of 0)
- 31 -

I

MENA Working Paper Series
No. I Has Labor Migration Promoted Economic Integration in the Middle East?June 1992. Nemat Shafik; The World Bank and Georgetown University.
No. 2 The Welfare Effects of Oil Booms in a Prototypical Small Gulf State.September 1992. AhmedAl-Mutuwa, United Arab Emirates University andJohn T. Cuddington, Georgetown University.
No. 3 Economic and Social Development in the Middle East and North Africa.October 1992. Ishac Diwan and Lyn Squire, The World Bank.
No. 4 The Link Between Trade Liberalization and Multi-Factor Productivity:The Case of Morocco. February 1993. Mona Haddad, The World Bank.
No. 5 Labor Markets in the Middle East and North Africa. February 1993.Christopher A. Pissarides, The London School of Economics and PoliticalScience.
No. 6 International Competitiveness of the Private Industry and the Constraintsto its Development: The Case of Morocco. June 1993. HamidAlavi,The World Bank/
No. 7 An Extended RMSM-X Model for Egypt: Quantifications of Market-OrientedReforms. September 1993. Karsten Nimb Pedersen, The World Bank/
No. 8 A Report on the Egyptian Tax System. October 1993.Mark Gersovitz, Roger H. Gordon and Joel Slemrod, The World Bank.
No. 9 Economic Development and Cooperation in the Middle East and NorthAfrica. November 1993. Ishac Diwan and Lyn Squire, The World Bank/
No. 10 External Finance in the Middle East: Trends and Prospects. December 1993.Ishac Diwan, John Underwood and Lyn Squire, The World Bank.
No. 11 Tax Incidence on Agriculture in Morocco (1985-1989). April 1994.Jean-Paul Azam, CERDI, University ofAuvergne, Clermont-Ferrand (France),et CSAE, Oxford (U.K).
No. 12 The Demographic Dimensions of Poverty in Jordan. August 1994.Chantal Worzala, The World Bank
No. 13 Fertility and Family Planning in Iran. November 1994. Rodolfo A. Bulatao andGail Richardson, The World Bank.
No. 14 Investment Efficiency, Human Capital & Migration A Productivity Analysisof the Jordanian Economy. May 1995. Gaston Gelos, Yale University,Department of Economics.
No. 15 Tax Effects on Investment in Morocco. August 1995.David Sewell, Thomas Tsiopoulos and Jack Mintz, The World Bank.
No. 16 Reconstruction in Lebanon: Challenges for Macroeconomic Management.April 1999. Daniela Gressani and John Page, The World Bank
No. 17 Towards a Virtuous Circle: A Nutrition Review of the Middle East andNorth Africa. August 1999. Regional HNP Knowledge Management, The WorldBank
No. 18 Has Education Had a Growth Payoff in the MENA Region? December 1999.Lant Pritchett, The World Bank
No. 19 Rationalizing Public Sector Employment in the MENA Region.December 2000. Elizabeth Ruppert Bulmer. The World Bank
No. 20 Achieving Faster Economic Growth in Tunisia. March 2001.Auguste T Kouam., The World Bank
No. 21 Trade Options for the Palestinian Economy: Some Orders of Magnitude.March 2001. Claus Astrup and Sebastien Dessus. The World Bank.
No. 22 Human Capital and Growth: The Recovered Role of Educational Systems.April 2001. Sebastien Dessus. The World Bank.
No. 23 Governance And The Business Environment In West Bank/GazaMay 2001. David Sewell. The World Bank.
No. 24 The Impact of Future Labor Policy Options on the Palestinian Labor MarketJune 2001. Elizabeth Ruppert Bulmer, The World Bank.