Embed Size (px)
Citation preview

Document of
The World Bank
FOR OFFICIAL USE ONLY t tA
Report No. 3340b-EC
STAFF APPRAISAL REPORT
ECUADOR
INECEL POWER TRANSMISSION PROJECT
June 23, 1981
Projects DepartmentLatin America and the Caribbean Regional Office
This document has a restricted distribution and may be used by recipients only in the performance oftheir official duties. Its contents may not otherwise be disclosed without World Bank authorization.
Pub
lic D
iscl
osur
e A
utho
rized
Pub
lic D
iscl
osur
e A
utho
rized
Pub
lic D
iscl
osur
e A
utho
rized
Pub
lic D
iscl
osur
e A
utho
rized
Pub
lic D
iscl
osur
e A
utho
rized
Pub
lic D
iscl
osur
e A
utho
rized
Pub
lic D
iscl
osur
e A
utho
rized
Pub
lic D
iscl
osur
e A
utho
rized

CURRENCY EQUIVALENTS
Currency unit Sucre (S/.)SI. 1.00 = 100 centavos = US$0.04S/. 1,000,000 = US$40,000US$1.00 = SI. 25.00 1/US$1,000,000 = SI. 25,000,000 1/US$ mill 1 = SI. 0.0250 1/
ACRONYMS
CENAFE Centro Nacional Franco-EcuatorianoCEPE Corporacion Estatal Petrolera EcuatorianaCONADE Consejo Nacional de DesarrolloEEQ Empresa Electrica de Quito S.A.EMELEC Empresa Electrica del Ecuador Inc.FONAPRE = Fondo Nacional de PreinversionIDB Inter-American Development BankIECO International Engineering Co. - U.S.A.INE Instituto Nacional de EnergiaINECEL Instituto Ecuatoriano de ElectrificacionMRNE Ministerio de Recursos Naturales y EnergeticosOLADE Organizacion Latinoamericana de EnergiaSNI Sistema Nacional Interconectado
ABBREVIATIONS, UNITS AND MEASURES
kcal kilocalorie (1,000 calories = 1.163 kWh)kW kilowattMw megawatt (1,000 kW)kWh kilowatt hourGWh gigawatt hour (1,000,000 kWh)kV kilovolt (1,000 volts)MVA megavolt-ampere (1,000 kVA)km2 kilometer (0.6214 mile)km square kilometer (0.386 sq. mi)ha hectare (0.01 km = 2.471 7acres)TOE = ton of oil equivalent (10 kcal)
FISCAL YEAR
INECEL's fiscal year ends December 31
1/ Commercial exchange rate as of March 31, 1981, which was used to computecurrency equivalents in this report.

FOR OFFICIAL USE ONLY
ECUADOR
STAFF APPRAISAL REPORT
INECEL Power Transmission Project
Table of ContentsPage No.
1. THE ENERGY SECTOR
Energy Resources ...................................... 1Energy Demand and Supply .............................. 1Hydroelectric Resources ............................... 2Hydrocarbons and other Fossil Fuels ................... 2Non-Conventional Sources of Energy .................... 3Energy Sector Organization ............................ 3Fuel Prices .......... ................................. 4Power Sector Organization ............................. 4Power Sector Regulation ............................... 5Existing Facilities ................................... 5Bank Group Participation in the Power Sector .... ...... 6Electricity Tariffs .................................... 6Marginal Cost Studies ................................. 8Constraints on Sector Development ..................... 8
2. THE BORROWER
Organization and Management ........................... 9Supervision of Electric Power Companies .... ........... 9Staffing ............ .................................. 10Training .............................................. 11Procurement .......... ................................. 11Accounting ........... ................................. 12Auditing ............ .................................. 13Insurance ........... .................................. 13Dam Safety ........... ................................. 14
3. THE POWER MARKET
The Present Power Market .............................. 14The Future Power Market ............................... 15Energy and Capacity Balances .......................... 17Distribution Losses ................................... 17
This report is based on the findings of an appraisal mission which visitedEcuador during November 1980. The mission comprised Messrs. Jorge Larrieu andRicardo Halperin. The report also draws on the findings of a sector mission(composed of Ms. Ursula Weimper and Messrs. Larrieu and Halperin) whichvisited Ecuador in July 1980.
This documnent has a restricted distribution and ray be used by recipients only in the Performance ofJtheir official duties. Its contents may not otherwise be disclosed without World Bank authorization,

TABLE OF CONTENTS (Continued)
Page No.
4. PROGRAM AND PROJECT
Background ............................................ 18Construction Program .................................. 18Generation Expansion Program .......................... 19Transmission Expansion Program ........................ 20Subtransmission and Distribution Expansion Programs ... 20Sector Investment Requirements ........................ 21The Project ........................................... 21Project Cost Estimates ................................ 22Project Financing Scheme .............................. 24Engineering and Consultants' Services .... ............. 24Procurement and Disbursements ......................... 25Project Execution ..................................... 25Environmental Aspects ................................. 26Project Risks ......................................... 26
5. FINANCE
Introduction .......................................... 26Financial History ..................................... 27Tariffs and Rate of Return ............................ 28Consolidated Investment and Financing Plan .... ........ 29Future Finances ....................................... 31Financial and Performance Indicators .... .............. 32
6. ECONOMIC ANALYSIS
Least-Cost Solution ................................... 32Return on Investment ................................... 33Sensitivity Analyses .................................. 34
7. SUMMARY OF PROPOSED AGREEMENTS AND RECOMMENDATIONS .... 35

TABLE OF CONTENTS (Continued)
LIST OF ANNEXESPage No.
Annex 1 Power Sector Organization
Table 1.1 INECEL's Participation in the Capitalof the Electric Power Companies ............... - 38
Annex 2 Organization
h Table 2.1 INECEL's Organization Chart .39
Annex 3 The Power Market
Table 3.1 National and SNI Energy Forecast (GWh) 40Table 3.2 National and SNI Demand Forecast (MW) 41Table 3.3 SNI 1980-1990 Power Balance (MW) .42Table 3.4 SNI 1980-1990 Energy Balance (GWh)-Average Year 43Table 3.5 SNI 1980-1990 Energy Balance (GWh)-Dry Year 44Table 3.6 1978 Gross Generation/Purchases,
Sales and Losses (GWh) .45
Annex 4 Program and Project
Attachment 4.1 Ongoing and Future Development Projects .46Table 4.1 Ecuador's Installed Capacity (MW) .47Attachment 4.2 Main Characteristics of Future Power Plants 48Attachment 4.3 Single Line Diagram .51Table 4.2 1980-1985 Investment Program .52Table 4.3 Summary of Project Cost Estimates .53Table 4.4 Estimated Loan Disbursement Schedule .54Attachment 4.4 Project Implementation Schedule .55Table 4.5 Performance Indicators ..... .................. 56
Annex 5 Finance
Table 5.1 Consolidated Income Statements, 1978-1985 .... 57Table 5.2 Consolidated Balance Sheet, 1978-1985 .... .... 58Table 5.3 Consolidated Sources and Applications of
Funds Statements, 1980-1985 .... ............ 60Table 5.4 Construction Program, 1980-1985 .... .......... 61Table 5.5 Schedule of Existing and Proposed Long Term Debt 62Table 5.6 Forecast Long Term Loan Disbursement Schedule 63Table 5.7 Forecast Long Term Debt Amortization Schedule 64Table 5.8 Financial Indicators .65
Annex 6 Economic Analysis
Table 6.1 Least Cost Solution .66Table 6.2 Cost/Benefit Streams and Rate of Return
on Investment .67Table 6.3 Return on Investment-Sensitivity .68
Annex 7 Selected Documents and Data Available in the Project File 69
MAP

- A

1. THE ENERGY SECTOR
Energy Resources
1.01 Ecuador has large reserves of hydrocarbons, significant hydro-electric resources and potential geothermal reservoirs. Hydrocarbons andhydroelectric energy are currently commercially exploited, while forestsand vegetable wastes (charcoal and sugarcane bagasse) are the main non-commercial sources of energy.
Energy Demand and Supply
1.02 Total output of primary energy has been adequate to meet domesticrequirements and has provided ample exportable surpluses of crude oil. Thetable below illustrates the 1978 structure of primary energy output.
Supply TOE x 10 1/
Primary energy output 10,752.3Imports 152.7Decrease in stocks 199.4
Total Supply 11,104.4
Demand
Exports 7,514.8Internal energy consumption:
- Petroleum and derivatives 2,162.5- Natural gas 2/ 31.6- Vegetable fuels (firewood,
sugarcane, bagasse) 693.9- Hydroelectricity 54.4 2,942.4
Own consumption and transformation losses 647.2
Total demand 11,104.4
The National Energy Institute (INE) is currently preparing Energy BalanceForecasts, including actual figures for 1979 and 1980.
Source: Mission estimates.
1/ TOE = ton of oil equivalent.
2/ Includes only the amount of liquified petroleum gas (LPG) produced fromnatural gas.
- 2 -
1.03 Between 1969 and 1978, commercial energy consumption 1/increasedat an average annual rate of about 11%, from 872,000 TOE in 1969 to 2,220,000TOE in 1978 and yearly energy consumption per capita doubled, from 0.15 TOEin 1969 to 0.29 TOE in 1978. In 1978, commercial energy consumption by sectorswas as follows: transportation and fishing, about 60%; commerce and households,23%; and industry, about 17%. About 97% of the total final commercial consump-tion was from hydrocarbon derivatives and 3% from hydroelectricity.
Hydroelectric Resources
1.04 The hydroelectric potential is estimated to be 22,000 MW, mainlycontained in the Pastaza, Santiago and Napo basins. If fully developed, thefirm energy would be about 90,000 GWh/year (which if thermally generated wouldrequire more than 150 million barrels of oil per year). It is presently esti-mated that about 12,000 MW could be economically developed (based on prevailinginternational fuel prices). At present, only about 2% of this potential hasbeen realized. The 1980-84 Development Plan has set as an objective theintensified development of hydroelectric resources, and by 1985 it is estimatedthat 72% of electricity requirements will be provided by this source, ascompared with about 25% at present.
Hydrocarbons and other Fossil Fuels
1.05 Sedimentary basins extend over an area of 17 million ha. In theseventies only limited new reserves were found, and the level of provenreserves decreased from about 1.6 billion barrels in 1972 to about 1.0 billionbarrels in 1980. Addition to proven reserves thus is of the highest priority.The national development plan forecasts a 730-million-barrel increase inreserves over the 1980-84 period, 570 million from secondary recovery and160 million from new fields. Current oil production amounts to about 220,000barrels/day, which covers all of the country's requirements, estimated atabout 75,000 barrels/day, and leaves a substantial balance for export.
1.06 Associated natural gas at the different oil fields is not availablefor power generation purposes. Currently, some gas is reinjected into thereservoirs to maintain field production conditions and the remainder is flared.By 1982, the gas now flared is to be processed at a new liquefaction plant(under construction at Shushufindi) and will be used for domestic consumptionat major centers. The Corporacion Estatal Petrolera Ecuatoriana (CEPE) ispresently evaluating the off-shore reserves at the gulf of Guayaquil. Con-siderable amounts of natural gas are expected to be available from this site.The Master Plan Studies (para. 3.04) will look into the use of gas forelectricity generation purposes.
1/ Includes only final consumption of petroleum and hydroelectricity.

- 3-
Non-Conventional Sources of Energy
1.07 Ecuador has favorable prospects for geothermal development. Super-ficial prospection surveys have detected geothermal activities in Tungurahua,Pichincha and Azuay. The Ecuadorean Electrification Institute (INECEL),the Borrower of the proposed loan, has undertaken the responsibility forevaluating the geothermal potential and in the first stage, presently inexecution, has received technical assistance from the Latin American EnergyOrganization (OLADE). A preliminary report, which includes the results ofthese prospects, is currently under preparation.
1.08 In rural areas, fuel-wood is an important source of energy.The country has important forestry resources, mainly in the Amazonas regionand in the province of Esmeraldas. However, the lack of a reforestationpolicy and the indiscriminate use of wood for industrial and energy purposeshas reduced considerably the forest area, and rural areas are facingshortages of fuel-wood. The National Energy Institute (INE) is attempting toaddress the problem through the development of improved wood-fueled cookingstoves.
1.09 The possible use of solar energy, windpower, and other non-conventional sources is being studied by INE. In addition, OLADE is promotingthe construction of biodigestors, in which animal and vegetable waste isconverted into methane. A demonstration plant has been built jointly with theProvincial Council of Pichincha and OLADE is also providing technical assis-tance to other provinces for similar purposes.
Energy Sector Organization
1.10 National economic planning is performed by the National DevelopmentCouncil (CONADE), which has prepared a National Development Plan for 1980-84.This plan, mandatory for public sector institutions, is intended to help ensurethe coherence in investment programs in all areas of the economy. It is to bereviewed each year.
1.11 The Ministry of Natural and Energy Resources (MRNE) is the executingand controlling agency for national energy policy. Under its jurisdictionare INECEL, CEPE (a public sector corporation through which the Governmentparticipates in the petroleum industry 1/), and INE, a research institutecreated in 1978 which is presently assessing Ecuador's energy resources,developing energy balances, and evaluating alternative energy technologies.
1.12 The present organization is satisfactory and results in a reasonablelevel of decentralization of decision making, while also generally ensuring thecoordination of the policies implemented by the respective executing agencies.However, there are some problems. MRNE is relatively poorly staffed and hasexperienced high personnel turnover, and CEPE has faced both organizational
1/ Several foreign oil companies also operate in Ecuador, in exploration,production and refining. The Government has recently developed newcontractual formulas which are expected to attract increased foreignparticipation in exploration activities.

- 4 -
strains as well as conflicts of authority with MRNE and of coordinationwith other agencies. This situation has been improving recently, and theproblems discussed are not expected to affect the proposed project.
Fuel Prices
1.13 Until early 1981, the prices of petroleum products in Ecuador wereamong the lowest in the world. In 1980 the implicit subsidy to consumers,given by the difference between internal and world market prices, representedan amount estimated to be close to 8% of GDP.
1.14 In the 1980-84 National Development Plan, the Government explicitlystated that it would adjust the prices of hydrocarbons, and some increases(for jet fuel and for fuel oil for ships) were approved in early 1980.Subsequently, a new "high test" gasoline was introduced at a price ofUS$0.73 per gallon (regular gasoline was then selling at US$0.19 per gallon)and in early 1981 the price of all petroleum products was increased, in somecases, such as regular gasoline, by over 200%. Present retail prices approxi-mately average 55%-60% of the wholesale prices in the Caribbean.
1.15 The retail prices of fuels used for electricity generation (mainlyBunker C and diesel) had in 1980 been at level which was 13% to 16% of theworld market, and this represented a hidden subsidy to power consumers thatexceeded US$100 million a year (roughly equivalent to the value of sectorbillings). These prices have now also been increased, and currently repre-sent 36% to 42% of prevailing world market levels. Agreement was reachedthat these prices will be periodically increased so that in 1984 theyrepresent not less than 50% of the world level then prevailing.
1.16 At present the prices for fuels used for electricity generation aresufficiently high to ensure that there is no waste, and that hydro generationis fully utilized while auto-generation is discouraged.
Power Sector Organization
1.17 Ecuador's 1961 Electricity Law establishes that the Government,through INECEL, has the monopoly on electricity generation, transmission anddistribution, but is empowered to authorize private operations. At presentthere is only one privately owned company: the Electric Company of Ecuador,Inc. (EMELEC), which operates in Guayaquil under a municipal concession.The contract expires in 1985, after which time the municipality of Guayaquilmay -- by first giving appropriate advance notice -- purchase at a fair
price the company's facilities. The other 14 power companies are organizedas private corporations, with INECEL as the largest shareholder and thebalance of shares owned mainly by the local municipalities. In a few cases,there are also individual private shareholders, who own very small participa-tions. Thus, whether in use of its regulatory powers (para. 1.19) or as amajority stockholder, INECEL has the ability to substantially control theactivities of all the power companies in the country. Annex 1, Table 1.1,shows INECEL's participation in the capital of each power company. In additionto these companies, INECEL also directly operates two small power systems and42 municipalities operate small local power installations.

- 5 -
1.18 The organization described above represents a considerable improve-ment over that which prevailed in 1961, when more than 100 companies werein operation. INECEL plans to continue the process of merging and consoli-dating the local power systems, by forming regional companies. This develop-ment is highly desirable as most of the power companies presently face signifi-cant diseconomies of scale. INECEL's present goal is to consolidate allelectric services now being provided by the 14 power companies it controls in10 regional companies. At negotiations, agreement was reached that this willbe done by December 31, 1984.
Power Sector Regulation
1.19 The Ministry of Natural and Energy Resources is responsible for theformulation of national electrification policy, while INECEL is responsiblefor power sector regulation and supervision. All power companies are requiredto submit their capital budgets to INECEL, inform INECEL about external bor-rowing plans, allow INECEL to inspect their facilities and audit theirrecords, and abide by the regulations INECEL's Board approves. INECEL'sregulatory performance is discussed in paragraphs 2.04 through 2.06.
Existing Facilities
1.20 Ecuador's installed power generating capacity (December 1979) isabout 924 MW, of which 700 MW, or 76% of the total, is thermal capacity; thebalance is hydroelectric. About 520 MW, or 56% of the total installedcapacity, are currently interconnected through the 230 kV Quito-Guayaquiltransmission line and the 69/34.5/22 kV Quito-Latacunga-Riobamba-Ambatosubtransmission network. Present public service supply (through INECEL, itssubsidiaries, EMELEC and municipalities), accounts for about 84% of totalpower supply. Private generation (self-producers, mostly industrial andagricultural undertakings) accounts for the remaining 16% (about 153 MWcapacity, of which 141 MW are diesel generators and 12 MW are hydroelectricplants). A summary description of these installations is shown in thefollowing table (see also Annex 4, Table 4.1).
Internal Oil-firedCombustion Steam Plant Hydro TotalGas
Turbines Diesel
Public Service 173.8 249.4 136.0 212.5 771.7
Self-Producers - 140.6 - 12.1 152.7
Total Ecuador 173.8 390.0 136.0 224.6 924.4

- 6 -
Bank Group Participation in the Power Sector
1.21 The Electric Company of Quito (EEQ) has been the main recipientof Bank Group funds within Ecuador's power sector. The first two Bank opera-tions (in 1956 and 1957) helped to finance the 40-MW Cumbaya hydroelectricproject, several diesel plants, and extensions of the distribution systems(these works were completed by the end of 1961 and have been operating satis-factorily).
1.22 IDA Credit 286-EC for US$6.8 million was approved in 1972 andcovered part of the foreign exchange costs of the 30-MW Nayon hydroplant,*an 18-MW diesel power station, transmission lines, and rural electrification.The PPAR (No. 3003, issued in May 1980) concluded that:
(a) the physical objectives of the project were met, albeit withdelays and cost overruns;
(b) progress towards the institutional objectives of the projectwas disappointing;
(c) most of the covenants related to the financial aspects of theinstitution were not met; and
(d) lack of cooperation adversely affected the effectiveness of IDAsupervision efforts, which, however, would also have required morefrequent field supervision than actually took place.
These lessons were kept in mind when outlining the conditions for the proposedproject, even though the proposed borrower is a different entity.
1.23 The only other financing provided by the Bank to the sector has beenthrough Loan S-006-EC to FONAPRE, for the Master Plan studies and thefeasibility study of the Paute-Mazar hydro-development which are currentlyunder way (para. 4.01).
Electricity Tariffs
1.24 The regulations governing electricity tariffs were approved bydecree in 1975 and are based on sound financial criteria. Essentially, theygive INECEL the power to set tariffs at a level that allows electric powercompanies to recover costs and make a reasonable profit, so that they mayenjoy a satisfactory financial situation and provide service efficiently.
1.25 To achieve this objective, the regulations authorize electricpower companies to achieve a rate of return of 8.5% on a rate base definedas the replacement cost, net of depreciation, of fixed assets in operationplus estimated working capital needs. Annual rate of return surpluses (ordeficits) over the 8.5% figure are to be registered in a stabilization accountand if surpluses or deficits occur in three consecutive years, tariffs shouldbe revised.

- 7 -
1.26 The regulations also establish a system of tariff adjustments dueto cost variations. Automatic adjustments are made when unit labor costs,unit electricity purchase costs, or unit fuel costs vary between 5% and 10%over the level used to determine the existing tariff levels. When the unitcosts mentioned above vary by more than 10%, adjustment must be approved byINECEL's Board.
1.27 For political reasons, the regulations were never implemented,which accounts for the financial difficulties faced by the sector (paragraphs5.01 to 5.04). None of the electric power companies revalued its assets inthe manner prescribed, nor were tariffs periodically adjusted in the mannerrequired to achieve the 8.5% rate of return. In this respect, it should benoted that INECEL's Board is controlled by the Government. Subsequent tothe fuel price increases implemented in early 1981 (para. 1.13), INECEL'sBoard approved a policy of monthly tariff increases averaging 3%. Atnegotiations, agreement was reached that these increases will remain inforce until the agreed rate of return targets are achieved. Failure toimplement these increases as agreed would be an event of default. Beforethe loan is declared effective, the Bank will seek confirmation that INECELis fulfilling its tariff increase commitments.
1.28 The tariff levels and tariff structures of the 15 companies inthe sector vary considerably. In 1979, the average sector tariff was US$mills 44/kWh; however, four systems (including the large EMELEC system and theLatacunga system, directly operated by INECEL) had average tariffs belowUS$ mills 40/kWh and, in one of these (Riobamba), the average tariff wasUS$ mills 28/kWh. In contrast, six systems had average tariffs exceedingUS$ mills 56/k.wh. The national development plan for 1980-84 sets as a policygoal the attainment of a uniform tariff structure for the national interconnectedsystem, and the 1980 tariff structure changes (para. 1.30) are a modest stepin this direction.
1.29 It should be noted that, with the present sector organization, theachievement of a national tariff structure will be a difficult goal to reach.This is because the cost structures of the different power companies differconsiderably; while some companies like EEQ and EMELEC operate in predominantlyurban areas, where population is heavily concentrated and industry has asignificant weight, others operate over larger territories, where popula-tion is dispersed, average income is low, and industrial demand is not signifi-cant. Thus, a mechanism would be required to transfer funds between companiesso as to allow them all to meet financing requirements and rate of returntargets. At negotiations, agreement was reached with INECEL that it willsubmit to the Bank, not later than September 30, 1981, a specific proposal(including main operational characteristics and target dates for implementation)for implementing this mechanism; discuss it with the Bank, and put it intooperation.

-8-
1.30 The tariff structure prevailing through 1979 encouraged electricityuse by establishing an inverse relationship between demand level and unitprices. In 1980 this was changed and, for the residential sector, thereare now lower rates for demands below 70 kWh per month and higher (constant)rates when consumption exceeds this figure. Furthermore, rates forresidential demands of 70 kWh per month or less are to remain unchanged fora period of three years, as part of the Government's incomes policy. In viewof its social objectives, this is justified; however, both the cut-off levelof 70 kWh and the rate level should be reviewed when tariff structures arerevised (para. 1.32). For commercial and industrial users, the rate structurestill favors the larger consumers. This, too, should be reviewed once themarginal cost studies are completed.
1.31 The above analysis and the financing problems faced by the powersector (discussed in Chapter 5) indicate that strong action in the tarifffield is required. Such action involves: (a) significantly increasingaverage tariff levels (para. 5.03), (b) further changing tariff structuresso as to bring them in line with true economic costs (para. 1.32), and(c) reducing the present tariff disparities between the various electricpower companies (paragraphs 1.28 and 1.29).
Marginal Cost Studies
1.32 As part of the Master Plan studies, INECEL's consultants' willprepare an analysis of the marginal cost of electricity generation. Atnegotiations, agreement was reached that INECEL would furnish to the Bank,no later than October 31, 1982, the results of the study, together withINECEL's own comments and proposals for a comprehensive marginal cost study,which will enable it to revise its structure of retail rates for the saleof electricity and would provide grounds for a review of the financial rateof return requirement, if and when future projects are brought for Bankconsideration.
Constraints on Sector Development
1.33 The Government has set ambitious goals for the power sector, aimingto substantially replace thermal generation and simultaneously significantlyincrease access to service. These goals are reflected in the 1982-85 consoli-dated investment program for INECEL and its subsidiaries (para. 5.13), whichresults in total financing requirements of about US$1.8 billion. The success-ful implementation of this program requires a major funding effort, whichincludes tariff increases, large amounts of Government equity contributionsand sizeable external borrowings. Failure to perform as required in any ofthese areas will, in all likelihood, result in program implementation delays.In view of the political difficulties associated with increasing tariffs andof the budgetary problems faced by the Government, the risk of such delaysshould not be underestimated.
1.34 While, as indicated above, the financial issues are presently themost serious ones faced by the sector, other matters of pressing concern arethe continuance of fuel subsidies, which distort resource allocation inducingexcessive consumption and waste, and the relatively weak control hithertoexercised by INECEL over the activities of the other power companies, which;s evidenced in poor coordination and in inefficiency. The remedies for theseissues involve, in the last instance, difficult political decisions, and, tortho extent that these are not implemented, present problems will continue.

1.35 To minimize the above risks, the Government and the Bank have been
engaged in a prolonged dialogue, which resulted in the implementation of
some significant measures (paragraphs 1.14 and 1.27) thus minimizing the
difficulties of meeting the loan covenants, once the loan becomes effective.
2. THE BORROWER
Organization and Management
2.01 The Borrower of the proposed loan would be INECEL, an autonomous
entity of the Government of Ecuador. INECEL was founded in 1961 and is
responsible for assessing national power resources, planning power sector
expansion, constructing and operating generation and transmission facilities,
supervising the other companies in the power sector, and approving tariffs
for the sale of electricity. INECEL also owns a major participation in 14 of
Ecuador's 15 electric public utilities and directly operates two small local
systems.
2.02 INECEL is governed by a Board of Directors presided by the Minister
of Natural Resources and Energy. Other board members are the Minister of
Finance, the Minister of Industry, the representative of the President of
CONADE, the Chief of the Joint Command of the Armed Forces, and one represen-
tative from each of the following: the other power companies, the Association
of Electrical Engineers, and the power sector workers. Responsibility for day
to day operations is delegated to the General Manager, who is assisted by six
operating managers.
2.03 INECEL's organization chart is shown in Annex 2, Table 2.1. Although
the organization structure is basically reasonable, INECEL faces management
problems. Some of these are caused by lack of qualified staff, notably in
finance, others by inadequate coordination between the various departments,
which operate with a considerable degree of autonomy. Furthermore, the number
of operating and staff units directly reporting to the General Manager is
high, probably placing excessive demands on his time and on his ability to
supervise them adequately. To address these problems, and also to assistINECEL in the upgrading of its information systems, evaluation of data process-
ing requirements and conciliation of budgetary and accounting data, the
proposed loan would finance consultant services for an organization study andformulation of a program of institutional improvements. Draft terms of
reference for this study have already been agreed upon. At negotiations,
agreement was reached with INECEL that it will engage the consultants no later
than December 31, 1981, will discuss the recommendations of the study with the
Bank, and will implement such recommendations as have been mutually agreed upon.
Supervision of Electric Power Companies
2.04 Through its Marketing and Distribution Department, INECEL supervises
the operations of the electric power companies. The Department's main func-
tions involve setting up standards for works and supervising the technical
aspects of the companies' operations and maintenance as well as their manag-
erial performance. These activities require seeing that norms instituted by
INECEL are properly applied and that the work of INECEL's representatives at
the subsidiaries' Boards of Directors is properly coordinated.

- 10 -
2.05 Though the Electricity Law vests sector regulatory powers in INECEL(para. 1.19), in practice INECEL's subsidiaries have tended to operate with alarge degree of autonomy. Furthermore, despite the fact that INECEL holds thevoting power majority in each of the subsidiaries' Boards, it has seldom madeits presence felt; on the other hand, the minority Board members, whichrepresent the municipalities in which the subsidiaries operate, have carried adisproportionate weight in decision making, often introducing political con-siderations. This may help to explain some of the management problems whichmany of these subsidiaries face and which INECEL has had limited success insolving.
2.06 Currently, INECEL's management is striving to shape up its super-visory role. New staff have been appointed to key positions, meetings havebeen held with the subsidiaries' managers, and minimum periodic informationrequirements have been set up. The organizational and institutional improve-ments study included in the proposed project, would also look into INECEL'ssupervisory performance and provide recommendations for its improvement.However, since this study will require a long time to complete 1/, at nego-tiations agreement was reached with INECEL that it would submit to the Bank,an interim program--to be implemented at the earliest and monitored duringproject supervision--which would include the upgrading of periodic reportingby the subsidiaries, mechanisms for more frequent contact between INECEL'smanagement and those of its subsidiaries, closer evaluation and control ofthe subsidiaries' capital budgets, and assignment of increased responsi-bilities to INECEL's directors at the subsidaries' boards. That a satis-factory program had been submitted would be a condition of loan effectiveness.
Staffing
2.07 At present, INECEL employs about 2,400 people, 500 of whom haveprofessional degrees (nearly 400 of these are engineers, mainly civil andelectrical engineers) and has forecast that it will employ about 3,500people by 1985, which implies an annual growth rate of 8%. INECEL's subsid-iaries employ an additional 3,700 people, and this number would increase atapproximately the same rate as INECEL's own staff. It would presently appearthat, both in INECEL and in the subsidiaries, there are areas that are over-staffed. For this reason, the performance indicators which were agreed uponat negotiations, reflect a slower pace of growth in employment than INECEL'spresent forecasts. Furthermore, it has been agreed with INECEL that theorganizational and institutional improvements study will address this issue andidentify the specific areas that have an excess of personnel so that correctiveaction may be taken.
2.08 The salaries of INECEL's administrative staff are tied to thepublic administration structure. Workers are affiliated with several craftunions, each of which bargains separately, and the labor contracts usually run
1/ The first phase of the consultants' work would comprise an evaluationof INECEL's policy making role and control activities and informationflows from the subsidiaries. This phase would take about 18 months tobe completed.

- 11 -
for about two years. Labor relations are generally good and labor disputesnot frequent. Salary levels, supplemented by abundant fringe benefits, areadequate and generally competitive with those offered by the private sector.Salary increases are a function of merit and of seniority.
Training
2.09 INECEL has established an important and active Training Departmentwhich has, over the past seven years, developed a good, if somewhat central-ized, training system. Training services (oriented mainly to technicians andworkers in the operational and maintenance areas of the utilities) are avail-able to, and are widely used by, the staff of INECEL and of its subsidiaries.The training system is based upon sound principles and benefits from executivemanagement commitment and support. The following features of the system areindicative of the manner in which training services have been developed andare now being routinely provided.
(a) INECEL operates a well established residential training center(French-Ecuatorian National Center, CENAFE, with a present capa-city of 100 trainees), with competent staff and adequate facilities;
(b) an annual policy statement on workforce and training is updatedand circulated each year;
(c) regular workforce planning and forecasting for the complete sectoris undertaken as a corporate management exercise; and
(d) an annual program is issued to all regional utilities, detailingthe training programs to be offered at CENAFE and approved programsof education and training available in Ecuador and externally (forwhich grants are available).
2.10 The successful implementation of the sector development programand of the managerial and administrative reforms expected to be proposed bythe organization and institutional improvements study will require an intensivetraining effort, which should also include management training. To thisend, INECEL and the Bank have agreed to include as part of the proposedproject a training component, which would comprise an in-depth evaluation ofINECEL's training programs (to be carried out by external consultants whosequalifications and terms of reference are satisfactory to the Bank); specifictraining programs recommended by the consultants and agreed to by INECEL andthe Bank; and training equipment. The draft terms of reference for theseconsultants have already been agreed with the Bank. At negotiations agreementwas reached that these consultants will be hired no later than December 31,1981.
Procurement
2.11 INECEL's procurement procedures are governed by a national procure-ment law. The law's provisions have been found to be, by and large, reasonablethough restrictive interpretations sometimes cause excessive delays. To preventproblems in this area, agreement on the contents of the bidding documents forthe purchase of equipment and materials for the project has already been reached

- 12 -
and the draft documents have been submitted for review by the Bank, andfound satisfactory. During negotiations it was also agreed that theGovernment of Ecuador will take such actions as may be required to expediteprocurement authorizations and clearances as to avoid implementation delays.
Accounting
2.12 The quality of INECEL's financial statements is extremely poor be-cause of the lack of importance hitherto attached to such information,department head changes, old fashioned recording systems and absence ofcompetent staff. Contributing factors too, have been the insufficient attentiongiven to internal auditing and the delays of the Contraloria General's externalauditing interventions, which have limited their usefulness. INECEL is tryingto address this issue, and in 1980 it engaged additional qualified staff for itsinternal auditing unit, which is progressively increasing the scope of thework it carries out. The training programs proposed (para. 2.10) are expectedto address the needs of the internal auditing unit.
2.13 The main problems of INECEL's accounting systems and policies are:
(a) INECEL does not prepare consolidated financial statements, eventhough its participation in each of the subsidiaries' capital stockranges from 54% to 99%. This participation is shown as an invest-ments, at historic cost. Profits (or losses) earned by the subsid-iaries are not recognized, unless collected through dividends; and
(b) Fixed assets are shown at cost, despite legal provisions whichrequire their annual revaluation.
Other problems arise from the poor quality of some of the figures and fromthe excessive time taken to produce reports.
2.14 To address these problems, at negotiations agreement was reachedwith INECEL that it will:
(a) implement measures so that it may submit fully consolidatedfinancial statements for 1983, and on interim consolidationtargets for 1981 and 1982;
(b) revalue its fixed assets annually, and engage qualified experts, notlater than December 31, 1981, on terms of reference acceptable to theBank, to design recording systems such that future fixed asset inven-tories would be up to date and to fully inventory its fixed assetsand assess their replacement value, and (promptly upon the receipt ofthe valuation report) to reflect such valuation in its records andfinancial statements; and
(c) reflect a provisional revaluation 1/ of fixed assets in operationon the basis of inflation indices in the 1980 financial statements.
1/ Until replacement values have been assessed and agreed with the Bank.

- 13 -
2.15 Since the consolidation of financial statements requires thatINECEL's subsidiaries submit in time financial statements of satisfactoryquality (which at present most cannot do), at negotiations agreement wasreached with INECEL that it will furnish to the Bank its programs to achievethis goal in each subsidiary, as per an agreed schedule. The programs shouldidentify the accounting problems faced by each subsidiary, and should proposespecific measures to address them. Furthermore, since the asset valuationproblem (para. 2.13) is also applicable to INECEL's subsidiaries, atnegotiations agreement was reached that INECEL will cause each of its sub-sidiaries to revalue its fixed assets in the same manner as INECEL, per anagreed timetable, and would assist them and supervise them in this exercise.
2.16 The organization and institutional improvements study is to alsoaddress the operating problems of the accounting area, particularly dataprocessing and staffing.
Auditing
2.17 INECEL's financial statements are presently audited by theContraloria General de la Nacion, a specialized government agency. Due to theContraloria's lack of staff, the issuance of the audited statements has beenfrequently, and seriously, delayed. For instance, the 1978 and 1979 auditedstatements only became available in January 1981. Furthermore, the scope ofthe audit does not meet Bank requirements. It has therefore been agreed withINECEL that it will engage private external auditors. At negotiations, itwas also agreed that calls for bids would have been issued, and bids evaluated,as a condition of loan effectiveness and that actual engagement would takeplace not later than March 31, 1982.
2.18 INECEL's subsidiaries are organized as private corporations. Onlyone, EEQ, has private external auditors. The others are supposed to beaudited by the Contraloria, but this only happens in a limited number ofcases. Since, as indicated earlier, most of the subsidiaries have significantproblem's in their accounting systems, it is imperative that a major improvementeffort be made, if consolidated financial statements are to be produced.Thus, in addition to the measures listed in para. 2.15, at negotiations it wasagreed that INECEL will cause each of its subsidiaries to engage independentexternal auditors, by agreed dates.
Insurance
2.19 INECEL follows the practice of externally insuring its assets againstmajor risks, such as fire, explosion, hurricanes, tornadoes and flooding.As far as feasible, the insurance policies are based on estimated replacementvalues. These practices are acceptable and consistent with Bank requirements.At negotiations, agreement was reached to include the standard insurance clausein the loan agreement for the proposed project. Over the past 12 months,INECEL has set up an insurance division and this is already resulting insubstantial economies in insurance costs, which previously were too high.
- 14 -
Dam Safety
2.20 INECEL is currently completing construction of the Paute-Amaluzadam (one of the highest arch dams in the world). The successful operation ofthe facilities included in the proposed Bank project would be closely linkedto the adequate operation of the Paute hydroelectric development (para 4.07and Annex 4, Attachment 4.2). It has therefore been agreed with INECEL thatthe Paute-Amaluza dam will be monitored and inspected at least once a yearby qualified and experienced experts and that a copy of the inspection reportwould be submited to the Bank.
3. THE POWER MARKET
The Present Power Market
3.01 During the period 1970-78 Ecuador substantially improvedits electrification level as shown by the indicators below:
Year Capacity installed/ Consumption/ Electrificationinhabitant inhabitant Rate (%)
1970 51 watts 155 kWh/year 281975 74 watts 266 kWh/year 321978 122 watts 333 kWh/year 38
Despite this favorable trend, per capita installed capacity, energy consumptionand access to electricity are among the lowest in South America. 1/
3.02 Ecuador's electric public utilities (INECEL, its subsidiaries,EMELEC, and 42 small municipal systems) currently supply electricity to about622,000 customers, representing about 3,200,000 inhabitants. In 1978, totalelectricity sales amounted to 2,182 GWh, of which about 43% were sold to theGuayaquil area by EMELEC and about 29% to the Quito area by Empresa Electricade Quito, while INECEL's other subsidiaries and municipalities accounted forthe remaining 26.5% and 1.5% respectively.
3.03 Total electricity sales in Ecuador have increased steadily at anaverage annual rate of over 13%, from 791 GWh in 1970 to 2,182 GWh in 1978 (seeAnnex 3, Table 3.1). Simultaneously, maximum demand has increased from 224 MWin 1970 to 565 MW in 1978 (see Annex 3, Table 3.2), at an annual average rateof about 12%. Ecuador's 1978 total electricity generation and sales were asfollows:
1/ Consumption per capita and electrification rates of some other SouthAmerican countries are respectively: krgertina, 1,236 kWh and 800%; Brazii,912 kWh and 62%; Chile, 927 kWh and 87%; Colombia, 621 kWh and 62%; Peru,523 kWh and 35%; and Uruguay, 1087 kWh and 80%.

- 15 -
Category C%n 7 of Total Generation
Residential 792 30.7Commercial 300 11.7Industrial 864 33.6Public Lighting and Others 226 8.8
Total Sales 2,182 84.8
Transmission and Distri-bution Losses 392 15.2
Total C-eneration 2,574 100.0
The Future Power Market
3.04 INFCFL, with the assistance of consultants (Lahmayer - Germany and-idroservice - Brazil), is currently preparing the National ElectrificationMaster Plan Studies, with Bank financing through Loan S-006-EC (para. 1.23).One of the main objectives of these studies has been the assessment of thefuture power market. The load forecast recently completed was developedafter an evaluation of alternative projection methodologies: extrapolationof historical consumption trends, correlation with macro-economic indicatorsand regionalized and national forecasts by sectors. Based on a detailedanalysis of the results obtained by using these different methods, INECEL, inconsultation with the Bank, decided to adopt the national load forecast bysectors.
3.05 Ecuador's total electric energy requirements, including transmissionand distribution losses, are expected to increase from 2,574 GCh in 1978 to5,600 GWh in 1985 at an average annual growth rate of about 11.7%. 1/ Maximumdemand is expected to increase from 565 MW in 1978 to 1,232 MW in 1985 at anaverage annual growth rate of about 11%. The generation system load factor(non-coincidental peak demand) is expected to improve from 50.5% in 1978 to51.87 in 1985. Details of the energy and power demand forecasts are given inAnnex 3, Tables 3.1 and 3.2.
1/ This growth is in line with Ecuador's economic projections, as out-lined in a Bank's country study of July 1979 (Ecuador: DevelopmentProblems and Prospects), and with the macroeconomic forecasts containedin the national five year development plan.

- 16 -
3.06 Specific components of projected 1985 aggregate demand and loadgrowth rates are as follows:
Category GWh 1978-85 Growth Rate (%)
Domestic 1,757 12.1Commercial 691 8.6Industrial 2,071 13.3Public Lighting and Others 403 8.6
Total Sales 4,922 12.3
Transmission and Distri-bution Losses 677 8.1
Total Generation 5,599 11.7
3.07 The structure of electricity consumption is not expected to changeconsiderably during the period 1978-85; the share of industrial consumptionis expected to increase from 34% in 1978 to 37% in 1985, and losses and powerstation use are expected to decrease by 3% from 15% in 1978 to 12% in 1985.It is reasonable to expect such reduction in energy losses and power stationuse as: (i) the bulk of the energy will be transferred through- high voltagelines (230 kV and 138 kV); (ii) existing subtransmission and distributionsystems are expected to be improved; (iii) INECEL and its subsidiaries areexpected to improve the existing methods of energy monitoring and theftcontrol (para. 3.11); (iv) power station use at thermal plants (which accountsfor the bulk of this item) is expected to be reduced substantially, as theNational Interconnected System's thermal generation requirements will decreaseonce the Paute hydro-development becomes operational (para. 4.07). Theremaining categories are expected to remain basically unchanged. The followingtable illustrates the structure of electricity consumption by categories:
Category % of Total Generation1978 1985
Residential 30.8 31.4Commercial 11.7 12.3Industrial 33.5 37.0Public Lighting and Others 8.8 7.2Losses and Power Station Use 15.2 12.1
Total 100.0 100.0
3.08 The analysis carried-out by INECEL and its consultants to determinethe sales forecast was comprehensive, and reflects well substantiated trends.The results were reviewed by the Bank and found adequate. The forecastsare consistent with: (i) the probable effect on the consumption pattern
- 17 -
of the proposed tariff increases (para. 5.03); (ii) the considerablereduction of electricity generation by auto-producers due to the increaseof internal fuel prices (para. 1.15); and (iii) the expected increase inthe numbers of consumers.
Energy and Capacity Balances
3.09 Based on the market requirements, existing power availability,and the future power development program, system simulation studies wereconducted for yearly power and energy allocations during dry (critical) andaverage precipitation year conditions. Results of these simulations are shownin Annex 3, Tables 3.3, 3.4 and 3.5.
3.10 The simulation studies were used to: (a) determine the commissioningdates of new power plant additions (a new power plant was added to the systemwhen a deficit in peaking capability and/or energy supply occurred; each powerplant was pre-selected based on optimization studies, and the generationprogram was determined using economic criteria and international fuel prices);(b) evaluate probable yearly generation from individual power plants; and(c) derive adequate margins of generation reserves (varying from 20% in 1983to 5% in 1986, according to system operational characteristics). The selected(least-cost) 1980-1995 expansion program consists only of hydroelectric powerschemes. The analysis carried out to define the energy and power balances wascomprehensive and based on adequate hypotheses; the premises, assumptions andresults of these studies are satisfactory.
Distribution Losses
3.11 In 1978, INECEL's subsidiaries' distribution losses (including theftand unaccounted) amounted to nearly 200 GWh, representing about 15% of theutilities' gross generation plus energy purchases. Some subsidiaries havereached unacceptable loss levels (up to 35% in the case of the Latacungaand Azogues utilities), mainly due to inadequacies of their distributionsystems and deficiencies of their recording methods. Information on losses bycompany is given in Annex 3,Table 3.6. During negotiations agreement wasreached with INECEL that it will: (a) engage consultants no later thanDecember 31, 1981 (under terms of reference acceptable to the Bank) to carryout a study to improve the overall efficiency of the subsidiaries' distributionsystems (including review and standardization of current distribution planning,construction and operational practices, improvement of existing distributionsystems, and measures to reduce theft); (b) discuss the conclusions and recom-mendations of the consultants with the Bank; and (c) implement such recommenda-tions as have been agreed upon with the Bank, per an agreed timetable.

- 18 -
4. PROGRAM AND PROJECT
Background
4.01 INECEL, with the assistance of consultants financed by LoanS-006-EC (para. 1.23), is currently preparing a National ElectrificationMaster Plan, designed to: (a) assess Ecuador's future power market;(b) select the least-cost program for power generation expansion based onhydroelectric, geothermal and conventional thermal developments; (c) optimizetransmission and distribution systems expansion; and (d) formulate theinvestment programs required to execute and implement the foregoing works.
4.02 The Master Plan studies are being developed in three stages: short-term (1978-85), medium-term (1985-92) and long-term (1992-2000). Thefollowing studies are also included under the Master Plan: (a) inventory ofEcuador's hydroelectric 1/ and geothermal 2/ resources, which will collectexisting information and will create new information banks containing carto-graphic, hydrological and geological data, as well as information regardingthe development stages of hydroelectric sites (identification, evaluation,prefeasibility, feasibility and detail design studies); and (b) developmentof an Integrated Planning System which will optimize the hydro/geothermalpower plants (identified in the inventory of hydro/geothermal resources) andtheir installation sequence.
4.03 The short-term (1978-85) Master Plan studies have already beencompleted and the draft reports were found to be adequate. The medium-termand long-term Master Plan studies are currently progressing satisfactorilyand draft reports are expected to be available from December 1981 to February1982.
Construction Program
4.04 The main objectives of INECEL's construction program are to:(a) meet the different regional systems' power requirements through theaddition of new generating capacity; (b) integrate all of INECEL's subsidiariesand some municipal systems to the National Interconnected System (SNI) througha new 230/138 kV transmission network in order to achieve fuel economies andincrease efficiency; and (c) provide electricity to an additional 1,500,000inhabitants (about 250,000 new customers) through the construction of new sub-transmission and distribution systems. The proposed Bank project wouldcontribute to the achievement of these objectives by: (a) delivering the
21/ The inventory is expected to cover about 225,000 km , or about 70% of
Ecuador's surface area, and about 80% of Ecuador's estimated hydro-electric potential. Only hydroelectric schemes larger than 30 MW areto be included.
2/ The inventory of geothermal resources, originally to be financed bythe Bank, is now being financed through a grant from OLADE.

- 19 -
hydroelectricity to be generated by the existing and proposed hydropower plantsto the different load centers; (b) incorporating the different isolated systemsto the SNI network; and (c) improving INECEL's management and staff skills throughcomprehensive training programs and assistance from consultants.
4.05 In order to meet energy and power capacity requirements during theperiod 1980-90, INECEL and its subsidiaries have prepared generation, trans-mission and distribution 1/ construction programs which are based on detailedanalyses of the capability of existing generation and transmission facilitiesand of facilities being added to the existing system and on the results of theshort-term Master Plan optimization studies.
4.06 The construction program includes the following major works:(a) about 940 MW and 1,220 MW of new generating capacity to be installedduring 1980-85 and 1986-90 respectively; (b) about 860 and 775 circuit-kilometers of 230 kV and 138 kV transmission lines to be commissioned during1980-82 and 1983-86 respectively; and (c) expansion of subtransmissionand distribution systems. Details of capacities and commissioning datesfor the different construction program works are given in Annex 4, Attachment4.1.
Generation Expansion Program
4.07 Currently, INECEL is constructing the following generating facilities,which are part of its 1980-85 expansion program:
(a) Paute (Phase A and B) hydroelectric power plant, which is expectedto be commissioned during 1982 (2 x 100 MW) and 1983 (3 x 100 MW);
(b) Esmeraldas thermal plant, consisting of I x 125 MW residualfuel-based steam turbine plant, to be commissioned during 1981;
(c) Guayaquil No.3 (73 MW) oil fired steam generator and Quito (60 MW)gas turbines, to be commissioned during 1981; and
(d) About 180 MW of small gas turbines and diesel engine generators,to be installed by the different INECEL subsidiaries during theperiod 1980-82 while the interconnected system becomes operational.
Details of these works are provided in Annex 4, Attachment 4.2.
4.08 To meet estimated energy requirements through 1990 and to partiallysubstitute for thermal generation, INECEL prepared a generation expansionprogram which includes the installation of the following hydroelectric powerplants: Agoyan (150 MW), to be operational by 1986; extension of the Pautehydro development (500 MW), to be completed by 1987; the Daule-Peripa multipur-pose development (130 MW), to be commissioned by 1988; the Paute-Mazar (140 MW)
1/ The 1986-90 transmission, subtransmission and distribution work programshave not yet been defined and are not expected to be until February 1982,when the results of the medium-term Master Plan will become available.

- 20 -
hydro development, to be commissioned by 1989; and the Toachi (300 MW) hydro-electric plant, to be commissioned by 1990. The characteristics of theseplants are given in Annex 4, Attachment 4.2.
Transmission Expansion Program
4.09 The existing transmission system is reduced to short links betweenmajor consumption centers and the nearby power generating stations. The firstNational Interconnected System major link was commissioned during August1980 and ties the two biggest consumption centers, Guayaquil and Quito,through a 654 circuit km - 230 kV transmission line. The following trans-mission lines, part of the 1980-85 expansion program, are currently underconstruction and are expected to be commissioned before the end of 1982:(a) 366 circuit km - 230 kV, Guayaquil-Paute; (b) 80 circuit km - 138 kVQuito-Ibarra; (c) 308 circuit km - 138 kV, Santo Domingo-Esmeraldas, and(d) 107 circuit km - 138 kV, Quevedo-Puertoviejo. Details of the NationalInterconnected System are shown in Annex 4, Attachment 4.3 and in the map.Furthermore, during the period 1982-85 INECEL would install and commissionabout 338 circuit kms of 230 kV transmission lines, 427 circuit kms of 138 kVtransmission lines and about 280 MVA step-up/down transformation capacity atdifferent substations (proposed transmission project to be financed by theBank).
Subtransmission and Distribution Expansion Programs
4.10 The majority of the isolated systems (all of INECEL's subsidiaries)would be integrated to the main SNI network through subtransmission lines (69kV and 34.5 kV). About 1,300 circuit kms of 69 kV and 34.5 kV subtransmissionlines and about 450 MVA step-up/down transformation capacity at differentsubstations are to be installed and commissioned during the period 1982-85.
4.11 Since successful completion of the subtransmission component affectsthe economics of the overall power development program and of the proposedproject, appropriate measures regarding work supervision and technical assistanceare required. INECEL has already submitted to the Bank a revised 1981-85subtransmission program, which defines which lines it would erect itselfand which would be erected by its subsidiaries and provides updated costestimates, bidding and implementation schedules and defines the financingarrangements proposed. During negotiations agreement was reached that INECELwill assume full responsibility for the adequate supervision and timelycommissioning of the subtransmission works and will submit periodic reportsto the Bank on the progress of these works.
4.12 During the period 1982-85, INECEL and its subsidiaries aim to provideelectricity to about 1,500,000 additional inhabitants in different areas ofEcuador (this represents about 250,000 new electricity consumer services).This would increase Ecuador's electrification rate from 38% in 1978 to 50% in1985. For this purpose, INECEL's subsidiaries plan to construct new lowvoltage distribution circuits and extend and improve existing distributionsystems. INECEL also plans to implement a two-stage rural electrificationprogram with assistance from IDB for the first stage. The projected electrifi-cation rate (13% for the period 1982-1985) is somewhat higher than historicaltrends (11.5% for the period 1972-1978), but INECEL and its subsidiaries havethe manpower and equipment capabilities to achieve the proposed target.

- 21 -
Sector Investment Requirements
4.13 INECEL has prepared a 1980-85 power sector investment program,which is in line with CONADE's five-year national development plan.The investment requirements for this period (see Annex 4, Table 4.2) areestimated at US$1,636 million, at 1980 price levels. About US$1,377 millionare to be invested by INECEL in: (a) SNI generation plants (US$782 million)(b) 138 kV and 230 kV SNI transmission lines (US$304 million); (c) 69 kVand 34.5 SNI subtransmission lines and rural electrification (US$164 million);and (d) studies and general investments (US$127 million). In addition,EMELEC and INECEL's subsidiaries are expected to invest about US$259 millionin their distribution systems. A summary of the investment program is givenin the following table:
Ongoing Works US$ Millions(1980 constant prices)
Generation 1/ 352Transmission 132Subtransmission and Rural Electrification 60INECEL Subsidiaries 2/ 120General Investments 3/ 27
Subtotal 691
Future Works
Generation 1/ 477Transmission 176Subtransmission and Rural Electrification 109INECEL's Subsidiaries 2/ 144General Investments 3/ 39
Subtotal 945
Total 1980-85 Investment Program 1,636
1/ Includes cost of studies (feasibility and detail design).2/ Includes investments by INECEL's subsidiaries in power generating plant
and distribution networks.3/ Includes general studies, buildings (US$20 million), office equipment,
transportation equipment, and the like.
The Project
4.14 The project proposed for Bank financing would consist of 230 kV and138 kV transmission lines and corresponding conversion (step-down) substations.It would also include training and institutional development programs, engineer-ing services for the design of a National Dispatch Center and engineering ser-vices for the supervision of the execution of the transmission/substation works.

- 22 -
4.15 Issuance of bidding documents for the purchase of equipment andmaterials is expected to start by January 1982 and construction by January1983. The physical works included in the project are expected to be completedby December 1984 and the studies by June 30, 1985.
4.16 The physical works and consulting services included in the proposedproject are described below (see Annex 4, Attachment 4.3 and map):
(a) Transmission Lines
(i) Construction of about 338 circuit km of 230 kV transmissionlines: (a) from the Paute hydroelectric plant to Totoras(near Ambato); and (b) from Milagro to Machala; and
(ii) Construction of about 427 circuit km of 138 kV transmissionlines: (a) from Guayaquil to Santa Elena; (b) from Cuenca toLoja; (c) from Ibarra to Tulcan; and (d) from Totoras to Ambato.
(b) Substations
Construction of substations and installation of step-down trans-formers at Machala (60 MVA), Riobamba (60 MVA), Santa Elena (40 MVA),Posorja (20 MVA), Tulcan (60 MVA) and Loja (40 MVA); and extensionof Ibarra substation.
(c) Training Program
Consultants' services for reviewing the existing training program andtraining facilities of INECEL and its subsidiaries; and costs ofspecific training programs, additional training facilities, purchaseof laboratory and training equipment, and scholarships for technicaland administrative staff.
(d) Institutional Development Program
Consultants' services for reviewing organizational, financial,commercial, and data processing matters and procedures of INECEL andits subsidiaries and purchase of computer software for accounting/commercial purposes.
(e) Engineering/Consultant Services
(i) Engineering services for the design (up to bidding documentsand their evaluation) and supervision of the installation ofthe National Dispatch Center, and (ii) consultant services forthe supervision of the proposed transmission project during theconstruction period.
Project Cost Estimates
4.17 Project cost is estimated at US$144 million, of which US$86 millionis the foreign exchange component. The project cost was estimated by INECEL'splanning and construction staff and reviewed and updated by the Bank. Thecost estimate is based on recent prices for equipment and materials and oncosts for installation and construction obtained from contracts recently

- 23 -
awarded by INECEL (230 kV Paute-Guayaquil and 138 kV Esmeraldas-Santo Domingotransmission lines) and from works recently commissioned (230 kV Guayaquil-Quito transmission line). The estimate is considered reasonable.
4.18 The project costs, which are detailed in Annex 4, Table 4.3, aresummarized in the following table:
Project Cost
US$ MillionLocal Foreign Total
Transmission Lines 13 34 47Substations 5 19 24Engineering and Administration 11 1 12Consultants' Services and Studies 1/ 1 5 6
30 59 89
Physical Contingencies 3 6 9Price Contingencies 25 21 46
Total Project Cost 58 86 144
1/ Includes Training Program (US$2.0 million), Institutional DevelopmentProgram (US$3.1 million) and Load Dispatch Center design (US$1.6 million).
Import duties are not included in these estimates as INECEL is exempt fromthese levies.
4.19 The project cost estimates are based on prices prevailing inJanuary 1980, escalated to reflect January 1981 price levels. Physicalcontingencies were calculated at a rate of 10% of direct costs on allproject components. In view of the nature of the works involved, thefigure is reasonable. Price contingencies were calculated using thefollowing annual escalation rates applied to basic costs and physicalcontingencies:

- 24 -
Percent (%)1981 1982 1983-85
Local Products and Services 20 15 15Foreign Products and Services 9 8.5 7.5
Project Financing Scheme
4.20 The financing scheme for the project would be as follows:
(a) local costs, amounting to US$57.9 million, would be financed fromINECEL's net internal cash generation and from Government contri-butions;
(b) foreign exchange costs which amount to US$86.2 million, includingindirect foreign exchange costs, and US$13.8 of financial chargeswould be financed by the proposed US$100 million Bank loan; and
(c) the balance of financial charges, amounting to US$11.2 million,would be financed from internally generated funds.
Engineering and Consultants' Services
4.21 INECEL's engineering staff is preparing the designs and specificationsfor equipment, materials and construction works, assisted when necessary byspecialized consultants (IECO-USA and individual consultants who are currentlyunder contract with INECEL). The same staff is also preparing the biddingdocuments for all project items.
4.22 INECEL will engage consultants under terms of reference andcontractual conditions acceptable to the Bank for the following tasks.
(a) training program, for which a total of 36 consulting staff-monthswere estimated to be required, at an average cost of US$12,000per staff-month 1/;
(b) institutional development program, expected to require about 126consulting staff-months at an average cost of US$12,000 perstaff-month 1/;
(c) load dispatch center, expected to require about 82 engineeringstaff-months at an average cost of US$12,400 per staff-month 1/;and
(d) supervision of project construction during the period June 1982-December 1984, which is expected to require about 80 consultantstaff-months at an average cost of US$5,000 per staff-month 1/.
1/ Excluding travel allowance costs.
- 25 -
Procurement and Disbursements
4.23 Most contracts for the supply of equipment and materials and theirinstallation (including civil works) to be financed with funds from theproposed loan will be procured through international competitive bidding(ICB) procedures in accordance with Bank guidelines. Competitive biddingin accordance with other procedures satisfactory to the Bank, such as interna-tional shopping, will be appropriate for a few contracts (such as laboratoryand training equipment, vehicles and computer software and hardware), each notexceeding US$100,000 and estimated not to exceed US$1,000,000 in total. Mostof the equipment and materials to be procured for the transmission lines andsubstations will be imported, as the local manufacturers either do not havethe production capability to meet the quantities required (aluminum conductors)or do not produce the specialized equipment and materials required for theproject. Therefore, preference for bid evaluation purposes to local manufac-turers and suppliers has not been requested by the Government.
4.24 The loan would be disbursed over a five-year period (see Annex 4,Table 4.4) against (a) 100% of foreign expenditures for imported goods and 85%of the local expenditures for locally manufactured materials; (b) 14% of thetotal expenditures on the contracts for civil works and for the installationof the corresponding equipment and materials, representing the estimated in-direct foreign exchange costs of the goods to be provided by the contractors(construction materials, transport, machinery, equipment, furniture);(c) consulting services and related expenses as follows: 100% of foreignexpenditures for supervision of project construction, 95% of total costs fortraining program, 70% of total costs for the institutional development programand load dispatch center studies; and (d) interest and other charges duringconstruction on the Bank loan through mid-1984 up to US$13.8 million. Allrequests for disbursements of funds from the loan account would be fullydocumented. Retroactive financing for up to US$1,000,000 is proposed forpayment of consultants' fees incurred and paid by the Borrower after June 1,1981 to cover advanced expenditures directly related to the training andinstitutional development programs and the design of the load dispatchcenter. The closing date for the proposed loan would be December 31, 1985.
Project Execution
4.25 INECEL will engage contractors for the civil works and for theinstallation of the equipment and materials of the transmission lines andcorresponding substations through international competitive bidding (ICB)in accordance with Bank guidelines. It is expected that these contracts wouldbe awarded to foreign firms with ample experience in similar undertakings.Invitations to bid are expected to be issued by January 1982 (see Annex 4,Attachment 4.4 for complete implementation schedule).
4.26 INECEL's engineering staff, with the assistance of consultantswhose experience, terms-of-reference and conditions of employment are accept-able to the Bank (and who will be responsible for the overall supervision ofthe construction) would be capable of executing the project adequately, asdemonstrated by the successful completion of the Quito-Guayaquil transmissionline, which was commissioned on schedule in August 1980. During negotiationsagreement was reached with INECEL that these consultants will be engaged bySeptember 30, 1982.

- 26 -
4.27 Project execution will be monitored against target dates shownin the project implementation schedule (Annex 4, Attachment 4.4). INECEL'soperational, financial and managerial performance will be monitored throughperformance indicators which were agreed during negotiations (Annex 4,Table 4.5). During negotiations agreement was reached that INECEL willsubmit such indicators regularly to the Bank.
Environmental Aspects
4.28 The proposed project does not present major environmental problems.Transmission line routes are considerably distant from urban centers.Furthermore, substations would be located at urban centers with due regardto environmental and aesthetic considerations and in accordance withurban regulations. INECEL would compensate property owners as required by thenational legislation. Clearing of rights-of-way would be kept to a minimumand natural drainage patterns are not expected to be affected.
Project Risks
4.29 The project faces no special physical risks. Sector issues orinsufficient action on financial matters could, however, negatively affectinstitutional performance or result in program and project delays (paragraphs1.33 to 1.35 and 5.02 to 5.04).
5. FINANCE
Introduction
5.01 Over the past 15 years, electricity sales have increased at anannual rate exceeding 12% (see Annex 3, table 3.1, for the sales statisticssince 1970), thus requiring significant investments in power facilities.Despite this, INECEL has followed a policy of low electricity tariffs,placing a substantial financing burden on the Government.
5.02 In the next five years, investment requirements are expected to beeven larger than in the preceding years, so that by 1985 total fixed assetswill approximately double their present value in real terms. To accomplishthis, a major financing effort will be needed. This will put to a severe testthe intentions of the Government and of INECEL to simultaneously reduce fuelsubsidies significantly, raise electricity tariffs to adequate levels, andprogressively reduce the sector's dependence on Government contributions.
5.03 To meet the consolidated financing requirements of INECEL and of itssubsidiaries, average retail electricity tariffs (inclusive of fuel clause)will have to increase from an equivalent of about US$0.05/kWh in 1980 toUS$0.154/kWh in 1985. This implies a nominal increase of about 200%; however,after adjusting for estimated domestic inflation the real increase would beabout 50%. To achieve this, INECEL has put into effect a policy of monthlytariff increases averaging 3% and has agreed to maintain these increases untilthe covenanted rates of return have been attained. This policy is expected to
- 27 -
result in a December 1981 retail tariff (inclusive of fuel clause) of S/1.74/kWh,which represents an increase of 32% over the December 1980 level. At negotia-tions, it was also agreed that cost increases in excess of those forecastwould be automatically reflected in additional tariff adjustments through theimplementation of existing legislation (para. 1.26).
5.04 At negotiations, the Government agreed to assign nearly US$900 millionequivalent (nearly 70% of which are expected from INECEL's participation inoil royalties) to the power sector between 1981 and 1985. Assurances werealso obtained that any shortfall in oil royalties would be made up throughother Government equity contributions. If such support were not to materialize,the financial viability of the investment program would disappear.
5.05 Annex 5, tables 5-1 through 5.8, show INECEL's historic and forecastconsolidated financial statements and complementary financial information.Since INECEL does not presently prepare consolidated financial statements,such consolidation was done by the appraisal mission. Analogously, fixedassets which had not been hitherto revalued (despite legal provisions which sorequire) were revalued, on an estimative basis, by the appraisal mission (seeTable 5.2, footnote b). For these reasons, and also because the originalstatements were not audited (paragraphs 2.17 and 2.18) the historic statementsshould be viewed as estimates. The mission forecasts are expressed in currentdollars (internal prices were assumed to increase at an annual rate of 15% andexternal prices at 9%; fuel price assumptions are discussed in Table 5.1,footnote f). A constant exchange rate of S/. 25 = US$1 was assumed.
Financial History
5.06 Though INECEL was legally constituted in 1961, in its early yearsits scope of activity was very limited and mainly concentrated in planningsector development and promoting the regional integration of the small localsystems. In 1973, INECEL commenced to invest in generating plants and itsfirst installations were commissioned in 1976. Investment in a major genera-tion project, Paute (500 MW), started in 1975 and only built up in recentyears.
5.07 Thus, INECEL's financial history is, for all relevant purposes, veryshort and provides little guidance as to its prospects for the future. Somesalient factors may, however, be noted:
(a) Net internal cash generation has been negative and financing needs(which were not only caused by INECEL's own expansion but also bythe requirements posed by INECEL's subsidiaries) were mainly fi-nanced through Government contributions (of which the main sourcewas INECEL's participation in oil royalties) and external loans.
(b) INECEL's debt-equity structure has evolved within conservativebounds, keeping well below a 50:50 ratio (based on fully revaluedfinancial statements, as estimated by the Bank mission), thussuggesting that increased reliance on long-term indebtness isviable, provided revenues are increased to ensure adequate debtservice coverage.

- 28 -
5.08 Though the above comments pertain only to INECEL, they are alsoapplicable to the consolidated financial performance of INECEL and its sub-sidiaries. The estimated consolidated rate of return on fully revalued assetswas negative in 1978 and 1979 and only marginally positive, 2.6% in 1980,despite the sizeable fuel subsidies. It should be noted too that, except forEEQ, the subsidiaries have tended to rely on INECEL for financing, generallylimiting their external borrowing to supplier credits. It is estimated thatin 1979, INECEL had a debt equity ratio of 40:60 (on a non-consolidated basis),EEQ a ratio of 35:65 and all the other subsidiaries averaged a relation of8:92. This may be attributed to the limited expertise of local financialmanagers and also to the red tape involved in obtaining the approval of thegovernment, and to the high cost associated with obtaining the guaranteesforeign lenders usually require.
5.09 Thus, there is room for improvement in financial management atthe sector level. It is expected that both the organization study and thetraining component included in the project would address this issue. Further-more, at negotiations it was agreed that INECEL will submit to the Bank, notlater than October 31, 1981, a program which inter alia sets up a long-termborrowing strategy for itself and for its subsidiaries, proposes mechanismsto limit the subsidiaries' traditional reliance on INECEL as lender of firstresort, and provides the subsidiaries with assistance in obtaining long-termfinancing.
Tariffs and Rate of Return
5.10 As of late 1979, average electricity tariffs stood below the reallevels prevailing in the early 1970's, before the major oil price rises.On a comparative basis, tariffs were lower than in any other Latin Americancountry with such a high proportion (about 75%) of thermal generation. Earlyin 1980, a new tariff structure, which resulted in an average increase ofabout 20%, was implemented and in November 1980 a policy of monthly increases,averaging about 1.3%, was introduced. In February/March 1981 some rateswere selectively increased and in May 1981 a new policy of monthly increases,averaging 3%, was put into effect. Despite these measures, tariffs are notyet providing a reasonable contribution to investment, while from an economicviewpoint they appear to be still below marginal cost (para. 6.05), therebyencouraging excessive use, and waste, of electricity.
5.11 Thus, continuation of the policy of increases currently in forceis required. The average electricity tariffs proposed, and their relationto historic values, are shown in the following table.

- 29 -
Current Constant 1970 Constant 1970Sucres 1/ Sucres 2/ US$ mills 3/
1970 0.56 0.56 27.21975 0.78 0.42 22.51980 1.28 0.38 23.41985 3.85 0.59 46.6
1/ Total sales revenues/sales in kWh.2/ The deflator used is the index of consumer prices given in IBRD Ecuador:
Development Problems and Prospects, page 643, updated to 1979 by the indexof consumer prices given in the IMF's International Financial Statistics.For 1980-85 an average annual inflation rate of 15% was assumed.
3/ For calculating the constant US dollar series, an exchange rate of S/.20.9per dollar in 1970, and of S/.25 thereafter was used. The deflator appliedis the US consumer price index, for which increases of 14% in 1980 and of9% per year thereafter were assumed.
5.12 At negotiations, it was agreed that the need for tariff increasesdiscussed in para. 5.10 could be adressed through progressive action. Thus,it was further agreed that:
(a) The consolidated rate of return for INECEL and its subsidiarieswill be 4% in 1982, 8% in 1983, and 8.5% in 1984 and thereafter;
(b) the rate of return for INECEL alone will be 4% in 1982, 8% in1983, and 8.5% in 1984 and thereafter;
(c) the provisions of the tariff legislation dealing with automatictariff adjustments to cost variations will be implemented no laterthan January 1, 1982;
(d) INECEL will submit monthly information on retail tariffs actuallycharged, which the Bank will monitor to ensure that they areconsistent with the agreed targets (para 5.03); and
(e) until quarterly consolidated financial statements satisfactory tothe Bank can be submitted in a timely manner, a quarterly informationsystem covering INECEL and its subsidiaries willd be designed andimplemented effective January 1, 1982, so as to enable the Bankto reasonably monitor rate of return performance on a timely basis,and to serve as an information input for automatic tariff adjust-ments. To achieve this, INECEL will submit the quarterly reportswithin 75 days of the end of the corresponding quarter.
Consolidated Investment and Financing Plan
5.13 The consolidated investment and financing plan, detailed in Annex 5,Table 5.3 is summarized as follows:
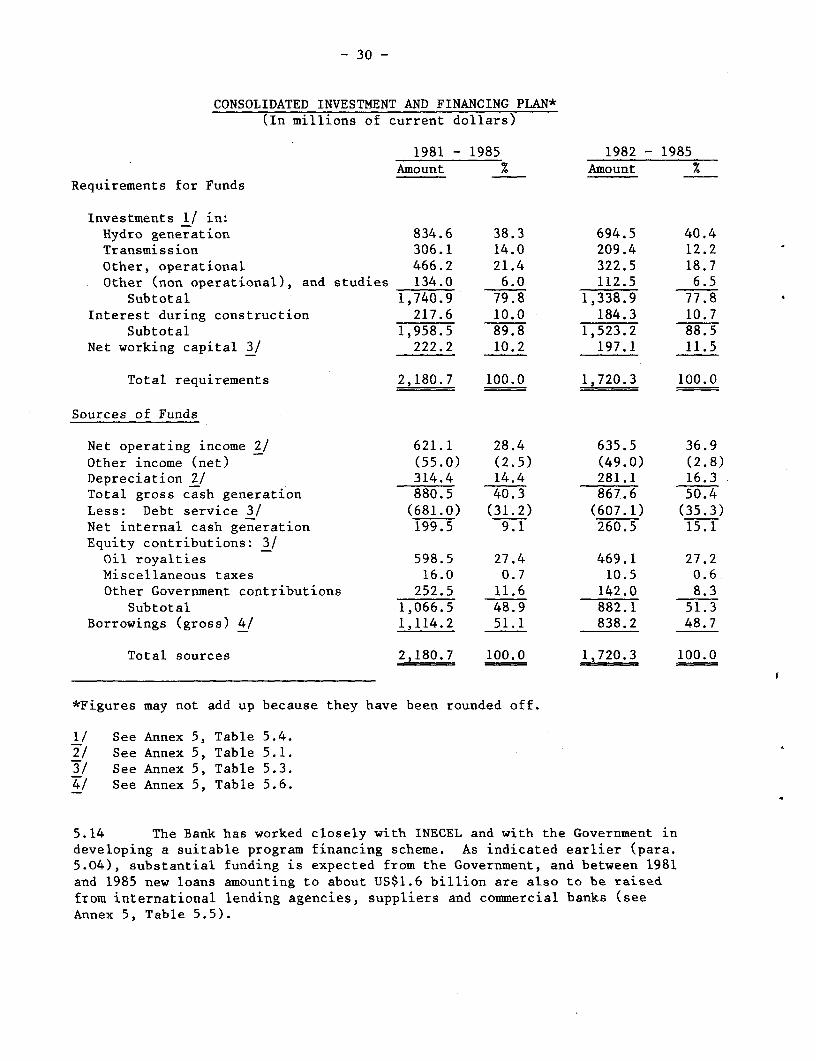
- 30 -
CONSOLIDATED INVESTMENT AND FINANCING PLAN*(In millions of current dollars)
1981 - 1985 1982 - 1985Amount % Amount %
Requirements for Funds
Investments 1/ in:Hydro generation 834.6 38.3 694.5 40.4Transmission 306.1 14.0 209.4 12.2Other, operational 466.2 21.4 322.5 18.7Other (non operational), and studies 134.0 6.0 112.5 6.5
Subtotal 1,740.9 79.8 1,338.9 77.8Interest during construction 217.6 10.0 184.3 10.7
Subtotal 1,958.5 89.8 1,523.2 88.5Net working capital 3/ 222.2 10.2 197.1 11.5
Total requirements 2,180.7 100.0 1,720.3 100.0
Sources of Funds
Net operating income 2/ 621.1 28.4 635.5 36.9Other income (net) (55.0) (2.5) (49.0) (2.8)Depreciation 2/ 314.4 14.4 281.1 16.3Total gross cash generation 880.5 40.3 867.6 50.4Less: Debt service 3/ (681.0) (31.2) (607.1) (35.3)Net internal cash generation 199.5 9.1 260.5 15.1Equity contributions: 3/Oil royalties 598.5 27.4 469.1 27.2Miscellaneous taxes 16.0 0.7 10.5 0.6Other Government contributions 252.5 11.6 142.0 8.3
Subtotal 1,066.5 48.9 882.1 51.3Borrowings (gross) 4/ 1,114.2 51.1 838.2 48.7
Total sources 2,180.7 100.0 1,720.3 100.0
*Figures may not add up because they have been rounded off.
1/ See Annex 5, Table 5.4.2/ See Annex 5, Table 5.1.3/ See Annex 5, Table 5.3.41 See Annex 5, Table 5.6.
5.14 The Bank has worked closely with INECEL and with the Government indeveloping a suitable program financing scheme. As indicated earlier (para.5.04), substantial funding is expected from the Government, and between 1981and 1985 new loans amounting to about US$1.6 billion are aLso to be raisedfrom international lending agencies, suppliers and commercial banks (seeAnnex 5, Table 5.5).

- 31 -
5.15 The financing scheme for the project is discussed in paragraph 4.20.The proposed Bank loan would have a maturity of 17 years, including a fouryear grace period. These are the standard terms for Ecuador. For financialprojection purposes, an interest rate of 10% per year and a commitment fee of0.75% were assumed. In view of the magnitude of INECEL's investment programand of the major program cofinancing effort envisaged, financing of interestduring construction until mid 1984 is recommended. By then Paute is expectedto be in full commercial operation, which will allow substantial fuel savingsthus providing a large increase in gross internal cash generation.
Future Finances
5.16 The consolidated financial projections are based on the assumptionthat retail tariffs will be progressively increased, so as to achieve ratesof return (on a rate base composed of average net revalued fixed assets and aprovision for working capital) of 4% in 1982, 8% in 1983 and 8.5% in 1984 andafter. This calls for nominal increases in the average retail price (inclusiveof fuel clause) paid by consumers of 32% in 1981, 56% in 1982, 18% in 1983,and 23% in 1984.
5.17 The rates of return indicated above would enable INECEL and itssubsidiaries to make a contribution of about 15% to their 1982-85 consolidated'investment program, which is reasonable in view of the magnitude of the worksinvolved. Furthermore, by 1985 INECEL's consolidated contribution is expectedto have increased to 33%. At negotiations, it was agreed that INECEL willretain all earnings - and further, cause its subsidiaries to retain allearnings - for investment in the sector, unless otherwise agreed by the Bank.
5.18 The debt-equity ratio is expected to fall in the period considered,mainly because of the large amount of Government equity contributions forecastand also because of the heavy debt amortization service through 1985, whichreflects the relatively short terms which have characterized INECEL's pastborrowings. This suggests that, once tariffs reach reasonable levels, it maybe feasible to finance a larger proportion of INECEL's investment needsthrough long-term borrowings, simultaneously reducing the sector's dependenceon Government funds (para. 5.10). Debt service coverage is forecast to bevery poor through 1982, but this is substantially offset by the commitmentsundertaken by the Government to provide equity contributions. At negotiations,it was agreed that INECEL will obtain the Bank's concurrence before incurringadditional long-term debt, if its internal cash generation is less than 1.5times its maximum future debt service requirement.
5.19 The short-term financial position is expected to be fairly comforta-ble during the project construction period. Furthermore, to avoid any delaysin project or program implementation caused by transitory financial tightness,at negotiations the Government agreed that it would make its best efforts todeal with requests from INECEL, or from its subsidiaries, for authorizationto borrow from local banks, so that processing times do not exceed 30 days.
5.20 Improvements in billing procedures already underway and further reviewof commercial practices to be carried out as part of the organization studyshould eventually result in lower collection periods, improving liquidity.

- 32 -
Furthermore, at negotiations the Government agreed that it would pay itselectricity bills when due and cause its agencies to proceed in the samemanner and INECEL agreed that it will institute a satisfactory system ofsurcharges for late payment, which would be specially relevant for the munici-palities. 1/ Reporting requirements on public sector receivables were alsoagreed upon. To enable timely monitoring, these reports will be submittedquarterly, within 75 days of the end of the quarter. They will provideinformation on the aging of receivables from each public sector agencyor institution.
5.21 In view of the magnitude of the sector's investment program andthe possibility that local interests may wish to alter the timing (thusdeviating from the optimum determined from the Master Plan OptimizationStudies) of the future hydro-projects, at negotiations agreement was reachedwith INECEL and the Government that they will (a) consult the Bank beforeundertaking commitments to any capital expenditure (other than those alreadyincluded in the Master Plan) which would increase the gross fixed assets inoperation of the power sector by 2% or more and furnish a report (satisfactoryto the Bank) showing the economic justification and financing plan of theproposed project; and (b) ensure that the expansion of the power sector inEcuador is carried out in a coordinated manner in order to prevent waste,duplication and unnecessary investment on the basis of economically justifiedprograms within the limits of INECEL's (or other sector agencies, if applicable)financial and managerial capacity.
Financial and Performance Indicators
5.22 The historic and forecast values for key financial indicators areshown in Annex 5, table 5.8. Annex 4, table 4.5 presents selected indicatorsshowing INECEL's expected achievements through 1985. At negotiations, agreementwas reached on the target values set and on the periodicity with which INECELwill inform the Bank on its performance with respect to each of the indicatorslisted.
6. ECONOMIC ANALYSIS
Least-Cost Solution
6.01 INECEL, with the assistance of individual experts, prepared the 1980-85transmission expansion program based on a national load forecast covering theperiod 1979-90 (see paras. 3.05 and 3.06) and on detailed analyses of theprojected regional consumption patterns. Furthermore, comparisons of severaltransmission and local power generating plant alternatives were carried out bythem.
1/ The appraisal mission was unable to obtain enough data from INECEL'ssubsidiaries to evaluate whether overdue public sector accounts posed asignificant problem. However, there are indications that some munici-palities experience considerable delays.
- 33 -
6.02 The transmission line parameters (voltage levels, conductor sizes,span lengths and line routings) for the Guayaquil-Santa Elena, Milagro-Machala,Cuenca-Loja, Ibarra-Tulcan and Totoras-Ambato lines and the design of thecorresponding substations were optimized in order to determine the corres-ponding least-cost transmission alternative. Subsequently, each optimizedtransmission line was compared to an equivalent thermo-electric power plant.The comparison of the net present value of capital and operating/maintenanceeconomic costs of the different alternatives demonstrated that the recommendedtransmission alternatives are the corresponding least-cost solutions at dis-count rates of up to 50% (Annex 6, table 6.1). Sensitivity analyses were alsocarried out to evaluate the effects of variations in capital costs, variationsin fuel costs, and variations in other major costs. These analyses demonstratedthat, for reasonable changes in the various parameters, the selected transmis-sion alternatives remain the least-cost solutions.
6.03 The 230 kV, 205 km, Paute-Totoras transmission line would completethe SNI interconnecting ring circuit, thus strengthening and improving thereliability, stability and load flow of the SNI transmission network. Thisline was originally scheduled to be commissioned in early 1987, when thePaute - Phase C - hydro development is expected to become operational.Recent system load flow and stability studies carried-out by INECEL haveshown, however, that the line should be commissioned earlier and an economicevaluation requested by the Bank has demonstrated the merits of advancing itscommissioning to early 1985, mainly due to the savings attributable to the re-duction of outage costs, which otherwise will occur. Consequently, the Bankagreed to include this line as a component of the proposed project.
Return on Investment
6.04 Since the proposed project is an integral part of INECEL's 1980-85investment program, its benefits cannot be singled out. Thus, the rate ofreturn on the overall investment program was computed. The rate of return onthe investment was estimated as the discount rate which equalizes the presentvalues of the economic net cost and benefit streams associated with theinvestment program. The economic net cost streams include the associatedcapital investments and operational and maintenance costs of: (a) generationprogram - including Esmeraldas (thermal), Agoyan (hydro) and Paute - phaseA, B and C (hydro); (b) transmission program (ongoing works and the proposedproject); (c) 1980-85 subtransmission, distribution and rural electrificationprograms; and (d) general investments (studies, buildings, transportation,furniture, and such). The economic net benefit streams were measured by:(a) forecast revenues from incremental sales of electricity (correspondingto the energy to be produced by the new power generating plants being commis-sioned in 1980-85 at the average retail level as of December 31, 1980 and,alternatively, at the forecast tariff levels (para. 5.03); and (b) energysubstitution (the hydro-power plants under consideration would substitute forthermal generation, freeing considerable amounts of fuel) valued at currentinternational fuel prices (Annex 6, table 6.2).
6.05 The internal rate of return of the expansion program using pre-vailing tariff levels as of December 31, 1980, was about 7%, which may becompared against the opportunity cost of capital in Ecuador, currently
- 34 -
estimated at 11%. However, if benefits are measured on the basis of fore-cast tariff levels, the internal rate of return would be about 13% (Annex 6,table 6.2). These results support the conclusion that current tariff levelsare inadequate. They also strengthen the recommended Bank's position thatby 1985 present tariffs should be increased to the levels required to providean 8.5% financial rate of return (para. 5.03).
6.06 The rates obtained understate the real economic return of theprogram, because revenues from the sales of electricity do not fully reflectsome of the benefits to society, industry and commerce, whose welfare,production and employment depend on reliable electricity supply. Furthermore,the following caveats should be noted: (a) no allowance has been made forthe degree of over-investment which is naturally built-in to the trans-mission and distribution programs, which have been dimensioned to accommodateexpected future demand increases, (b) benefits resulting from outage reductiondue to improved system reliability have not been taken into account, and(c) expected benefits from improved system operation when the Load DispatchCenter becomes operational and from management and efficiency improvementsexpected from the organizational study and training program have not beenquantified. However, the preceding considerations do not diminish the validityof the analyses regarding the tariff level increases required.
Sensitivity Analyses
6.07 Sensitivity analyses were also carried out to determine the effecton the internal rate of return (with benefits measured both at prevailing andforecast tariff levels) by variations in capital costs, in operational andmaintenance costs, and in revenues (Annex 6, table 6.3). The rate of returnon the expansion program (with benefits evaluated at forecast tariff levels)would drop to about 10% if costs are 10% higher than estimated and expectedrevenues are 10% lower. If the investment program costs do not increase butbenefits decrease by 10%, the rate-of-return would drop to 11%. Furthermore,the rate-of-return will drop to 12% if costs are 10% higher and benefitsremain unchanged.
7. SUMMARY OF PROPOSED AGREEMENTS AND RECOMMENDATIONS
7.01 During negotiations agreements were reached on the followingprincipal points:
(a) With the Government that:
(i) the prices of fuels used for electricity generation willbe progressively increased, so that by 1984 they representnot less than 50% of the world prices then prevailing(para. 1.15);
(ii) it will take such actions as may be required to expediteprocurement authorizations and clearances, so as to avoiddelays in project implementation (para. 2.11);

- 35 -
(iii) it will make equity contributions to INECEL in specifiedamounts, and will also make-up any shortfall in oil royaltiesthrough additional equity contributions (para. 5.04);
(iv) it will make its best efforts to deal with requests, fromINECEL or from its subsidiaries, for authorization to borrow,so that processing time does not exceed 30 days (para. 5.19);
(v) it will pay its electricity bills when due, and also cause itsagencies to pay their bills when due (para. 5.20); and
(vi) projects undertaken in the future will be economicallyjustified and adequately financed (para. 5.21).
(b) With INECEL that:
(i) all electric services will be consolidated in ten regionalcompanies by December 31, 1984 (para. 1.18);
(ii) not later than September 30, 1981, it will submit a proposalon a mechanism (including main operational characteristics andtarget dates for implementation) to transfer funds betweencompanies, to enable all of them to meet financing require-ments and rate of return targets (para. 1.29);
(iii) it will furnish to the Bank, not later than October 31, 1982the results of a study on the marginal cost of electricitygeneration and its proposals for a more comprehensive study,which would enable INECEL to revise its tariff structures(para. 1.32);
(iv) it will engage management consultants not later thanDecember 31, 1981; discuss their recommendations with theBank and implement those that are agreed upon (para. 2.03);
(v) it will submit to the Bank, prior to loan effectiveness, aninterim program to improve the direction and supervision ofits subsidiaries (para. 2.06);
(vi) it will engage consultants for training on or before December 31,1981 (para. 2.10);
(vii) it will implement measures so that it may submit fullyconsolidated financial statements by 1983 and be able tomeet mutually agreed interim consolidation targets for1981 and 1982 (para. 2.14(a));
(viii) it will engage qualified experts (on terms of referenceacceptable to the Bank, and not later than December 31, 1981)to inventory INECEL's fixed assets, assess their replacementvalue and design appropriate recording systems; and willreflect such valuations in its records and financial statements(para. 2.14(b));

- 36 -
(ix) it will reflect a provisional revaluation of fixed assets inoperation, on the basis of inflation indices, in the 1980financial statements (para. 2.14(c));
(x) it will furnish to the Bank, on or before specific datesprograms which identify the accounting problems faced by eachsubsidiary and contain specific proposals to address them,and, also, that it will cause all its subsidiaries to revaluetheir fixed assets per an agreed timetable and will assistand supervise them in this exercise (para. 2.15);
(xi) it will engage private external auditors by March 31, 1982(para. 2.17);
(xii) it will cause each of its subsidiaries to engage independentexternal auditors by agreed dates (para. 2.18);
(xiii) the Paute-Amaluza dam will be inspected at least once ayear by qualified and experienced experts, and a copy ofthe inspection report will be submitted to the Bank(para. 2.20);
(xiv) it will engage consultants to carry out a study ofdistribution losses not later than December 31, 1981, andwill implement such recommendations as subsequently agreedwith the Bank per an agreed timetable (para. 3.11);
(xv) it will assume responsibility for supervising the sub-transmission works and ensuring their timely completion andwill report periodically on work progress (para. 4.11);
(xvi) it will engage consultants for the overall supervision ofthe project on or before September 30, 1982 (para. 4.26);
(xvii) it will submit performance indicators regularly to theBank (para. 4.27);
(xviii) not later than October 31, 1981 it will submit a programwhich sets up a long term borrowing strategy, and willprovide assistance to its subsidiaries for obtaining accessto credit (para. 5.09);
(xix) it will take all measures required to achieve a consoli-dated rate of return for INECEL and its subsidiaries of4% in 1982, 8% in 1983 and 8.5% in 1984 and thereafter.These same rates of return will also be applicable to INECEL(para. 5.12);
(xx) it will implement automatic tariff adjustment legislation nolater than January 1, 1982 (para. 5.12);
- 37 -
(xxi) it will submit monthly tariff information, to enable the Bankto monitor compliance of the agreements on tariff increases.A quarterly information system to monitor rate of returnperformance (until quarterly consolidated financial statementscan be available on a timely basis), will be designed andimplemented by January 1, 1982 (para. 5.12);
(xxii) it will retain all its earnings and cause its subsidiariesto retain their earnings for reinvestment in the sector(para. 5.17);
(xxiii) it will obtain the Bank's concurrence before incurring inadditional long term debt, if its internal cash generationis forecast to be less than 1.5 times its maximum futuredebt service requirements (para. 5.18);
(xxiv) it will institute a satisfactory system of penalties forlate payment of electricity bills and will provide theBank with quarterly information on accounts receivable,to be submitted within 75 days of the end of the quarter(para. 5.20);
(xxv) it will consult the Bank before undertaking commitments to anycapital expenditure (other than those included in the MasterPlan) which would increase the gross fixed assets in operationof the power sector by 2% or more; and ensure that the expansionof the power sector in Ecuador is carried out in a coordinatedmanner in order to prevent waste, duplication and unnecessaryinvestment on the basis of economically justified programs(para. 5.21).
7.02 Conditions of effectiveness of the proposed loan would be that:
(a) a satisfactory preliminary program for improving INECEL's controlover its subsidiaries had been submitted (para. 2.06);
(b) private external auditors for INECEL had been selected (para. 2.17).
7.03 Failure to implement the recently enacted policy of monthly tariffincreases averaging 3% would be an event of default (para. 1.27).
7.04 Retroactive financing for consultants' services since June 1,1981 in an amount not exceeding US$1,000,000 is recommended (para. 4.24).
7.05 With the above assurances, the project would constitute a suitablebasis for a Bank loan of US$100 million, to be repaid over a period of 17years, including four years of grace.
June 23, 1981

- 38 -
ECUADORANNEX 1
INECEL POWER TRANSMISSION PROJECT Table 1.1
INECEL's Participation in the Capital
of the Electric Power Companiesl/
2/% of Capital Stock 2
Power Company Name Owned by INECEL
-Regional Norte 90.1
Quito 55.8
Santo Domingo 100.0
Ambato 54.5
Riobamba 67.4
Bolivar 93.2 3/
Azogues 4/ 76.2
Cuenca 4/ 88.4
Regional Sur 93.4
Esmeraldas 92.8
Manabi 86.9
Santa Elena 98.4
Milagro 94.9
Los Rios 98.8
El Oro 92.2
Weighted average 85.2
1/ Data as of December 31, 1979 (based on unaudited financial statements).
2/ Percentages are based on issued capital, which in some cases differs from
paid in capital.
3/ As of June 30, 1979.
4/ These two companies have now been merged, and formEmpresa Regional Centro-Sur.

-39 - ANX 2Table 2.1
ECUADOR - INECELORGANIZATION CHART
BOARD OF ~~CON TRA LORI ATARIFFS D TBOARD OF GENERAL
(GOVERNMENT)
s ^ _ X ~~INTERNA L_ AUDITING
GENERALMANAGER
PUBLI C RELATiONS SECRETARIAL SERVICES
PLANNING DEPARTMENT J, ,LEGAL DEPARTMENT
SYSTEMS & ORGANIZATION .*. ID EVALUATION COMMITTEE
TECHNICAL, ADMINISTRATIVE, &FINANCIAL COORDINATION
COMMITTEE
INDUSTRIAL CONSTRUCTION NTERCONNECTED MARKETING RURALRE A IN J | ENGINEERING SYSTEM OPERATIONS | FINANCE DISTRIGUT ON
DISINGIBUTION PROGRAM
World Bank - 21968

-40-
ECUADOR ANNEX 3Table 3.1
INECEL POWER TRANSMISSION PROJECT
National and SNI Energy Forecast (GWh) 1/
National Forecast SNI Forecast
Public Total Total2Year Rasidential Coumercial Industrial Lighting Sales Losses Generation Total
1970 279.7 103.4 320.8 87.1 791.0 157.8 948.8 -
1971 306.9 116.5 353.9 97.7 875.0 174.6 1049.6 -
1972 341.6 135.4 375.2 103.5 955-.7 161.4 1117.1 -
( 1973 359.0 147.0 414.7 123.2 1,043.9 220.6 1264.5 -
ACTUAL ( 1974 405.9 177.4 464.5 159.0 1,206.8 223.1 1429.9 -
1975 487.2 191.6 528.2 132.9 1,339.9 254.9 1594.8 -
1976 587.7 234.5 590.1 163.9 1,576.2 254.6 1830.8 -
1977 668.4 263.7 693.1 189.7 1,814.9 312.3 2127.2 -
1978 792.4 299.9 863.3 226.2 2,181.8 391.7 2573.5 -
1979 903.6 354.2 989.5 245.5 2,492.8 419.3 2912.1 -
1980 1131.9 405.5 1125.9 266.7 2,930.0 476.9 3406.9 2421.8
1981 1158.7 455.4 1277.7 289.1 3,180.9 500.7 3681.6 2891.0
1982 1295.9 509.3 1447.1 313.6 3,565.9 547.0 4112.9 3644.0FORECAST
1983 1443.1 567.1 1634.5 341.3 3,986.0 574.6 4560.6 4320.5
1984 1582.5 621.9 1842.4 370.7 4,417.5 608.1 5025.6 4771.2
1985 1756.9 690.5 2071.2 402.7 4,921.3 677.4 5598.7 5598.7
1986 1915.6 752.8 2323.7 437.5 5,429.6 733.4 6163.0 6163.0
1/ The SNI became operational in August 1980. The different isolated systems would be gradually integrated to theSNI during the 1980-1984 period. By end of 1984 it is forecasted that all isolated systems would be integratedto the SNI.
Source: 1980-1985 INECEL's short-term Masterplan Studies.

- 41 -ANNEX 3
ECUADOR Ta_le 3.2
INECEL POWER TRANSMISSION PROJECT
Natlonal and SNI Demand Forecast (MW)
NationalNational SNI Load SNIDemand Demand Factor Load Factor
Year (MW) (MW) m(7 (%)
( 1970 224.0 - 48.8 -
( 1971 250.5 - 47.8 -
C 1972 262.2 - 48.6 -
( 1973 281.5 - 51.3 -
( 1974 318.5 - 51.2 -
ACTUAL ( 1975 358.5 - 50.8 -
1 1976. 413.9 - 50.5 -
C 1977 479.8 - 50.6 -
( 1978 564.5 - 52.0 -
( 1979 658.3 - 50.5 -
C 1980 767.1 523.5 50.7 52.8 1/
C 1981 827.3 696.5 50.8 47.4 2/
( 1982 922.4 834.2 50.9 49.9FORECAST (
( 1983 1,047.5 966.3 49.7 51.0
( 1984 1,107.5 1,107.5 51.8 49.2 3/
( 1985 1,231.5 1,231.5 51.9 51.9
C 1986 1,355.6 1,355.6 51.8 51.9
1/ Guayaquil and Quito, Ecuador's main industrial centers,were interconnectedduring August 1980.
2/ The SNI load factor decreases as the loads of the isolated systems which willbe interconnected to the SNI are mainly domestic, commercial and rural.
3/ The SNI load factor decreases as the bulk of transmission works become opera-tional (transmission works included in Bank financial project), thus inter-connecting mainly domestic and rural loads.
Source: 1980-1985 INECEL short-term Masterplan Studies.

ECUADOR
INECEL POWER TRANSMISSION PROJECT
National Interconnected Syeter (SNI)
1980-1990 Power Balance (MW)
1980 19831 1982 1983 1984 1985 1986 1987 1988 L 1990
1) Maximum Deeand 523.5 696.5 834.2 966.3 1,107.5 1,231.5 1,355.6 1,492.8 1,645.8 1,805.7 1,976.8
2) hiietlng ower Cepability
a) Ilydro 149.8 166.9 205.3 205.3 207.4 207.4 207.4 207.14 207.4 207.4 207.4b) Thjermal 537.6 661.3 686.5 690. 4 734.7 716.9 669.5 642.2 599.9 550.8 474.3
Total gxistiing Capability 687.4 8281.2 891.8 895.7 942.1 924.3 876.9 849.6 807.3 758.2 681.7
3) Future Power Plawt
a) Quito - G.T. (60MW) - 1980 59.1 59.1 59.1 59.1 59.1 59.1 59.1 59.1 59.1 59.1 59.1b) Esrneraildias - Steam (125MW) - 1981 116.0 116.o 116.0 116.0 116.0 116.0 116.0 116.0 116.0 116.0c) Paute "A" & "B" (500iMW) - 1982/1983 - - 87.4 349.6 437.0 437 0 437'.0 437.0 437.0 487.0 487.0d) Agoyanl (150MW) - 1985 - - - - - 138.0 138.0 138.0 138.0 138.0 138.0e) Paete "C" (500MW) - 1987/1.988 - - - - - 174.8 437.0 487.o 487.0f) Dalle Peripa (130MW) - 1988 - - - - - 77.0 77.0 77.0g) Pauite Mazar (140MW) -189/90 - - - - - 77.0h) T'oachi (300MW) - 1990/1991 - 253.0
Total. Future Planit 59.1 175.1 262.5 524 .7 612.1 750.1 750.1 924.9 1,264.1 1,364.1 1,694.1
14) Available Capacity (2 + 3) 746.5 1,003.3 1,154.3 i,420.4 1,5514.2 1,674.4 1,627.0 1,774.5 2,071.4 2,122.3 2,375.8
5) Prograumned Maint,enance 89.5 159.1 162.6 163.2 173.8 197.4 187.6 180.4 188.7 182.3 200.0
6) -iirm Capacit5y (4 -5) 657.0 844.2 991.7 1,257.2 1,380.4 1,477.0 1,1439.41 1,594.1 1,882.7 1,940.3 2,175.8
7) balarce 6 - 1 133.5 147.7 157.5 290.9 272.9 245.5 83.8 101.3 236.9 134.6 199.0
10~
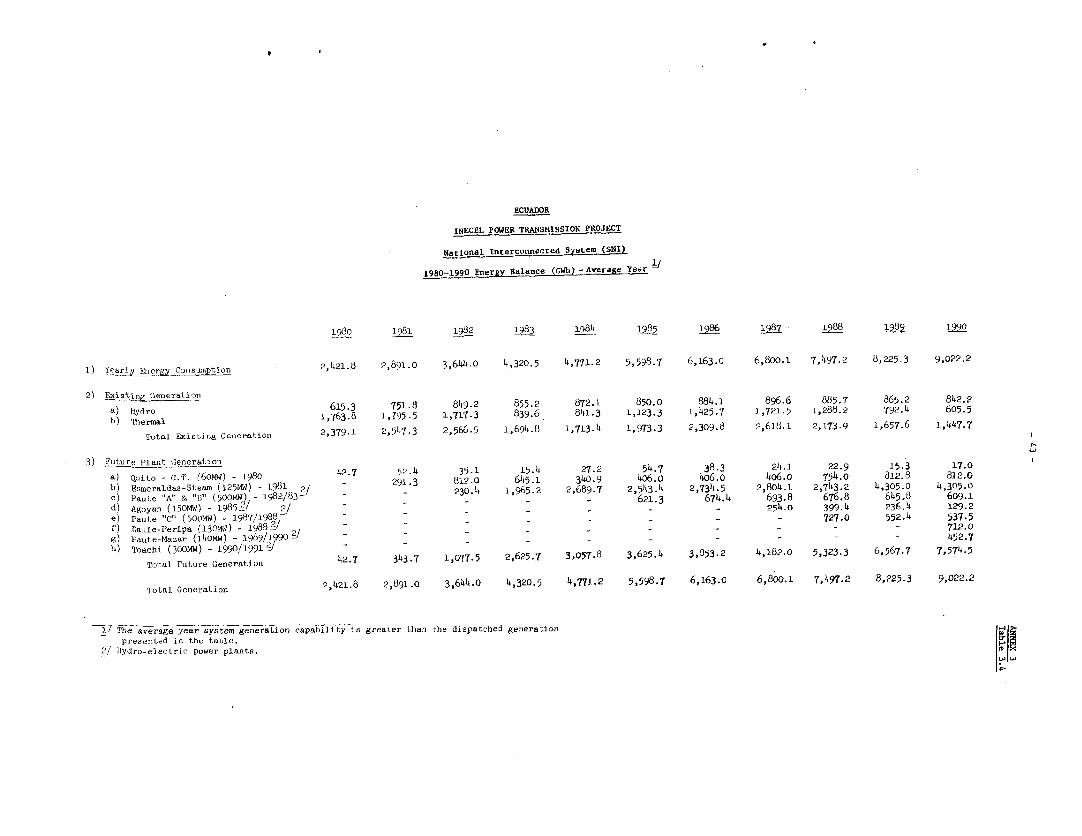
ECUADOR
INECEL POWER TRANSMISSION PROJECT
National Interconnected Syste (SNI)
1980-1990 Energy Balance (0141,) - Average Year
1980 1981 1982 1983 19814 195 1987 1988 19898
I) Y 2,1421.8 2,891.0 3,6414.0 4,320.5 4,771.2 5,598.7 6,163.0 6,800.1 7,497.2 8,225.3 9,022.2
2) Exis_~n Generationl
a) hydro 615.3 751.8 849.2 855.2 872.1 850.0 884.1 896.6 885.7 865.2 842.2b) Thermal 1,763.8 1,795.5 1,717.3 839.6 841.3 1,123.3 1,425.7 1,721.5 1,288.2 792.4 605.5
Total Ecisting Generation 2,379.1 2,547.3 2,566.5 1,694.8 1,713.4 1,973.3 2,309.8 2,618.1 2,173.9 1,657.6 1,447.7
3) iutu re Plant Generation
a) Quito - a.T. (6oiw) - 19580 42.7 52.4 35.1 15.4 27.2 54.7 38.3 24.1 22.9 15.3 17.0b) esseraldas-Steam (1251W) -1981 2 - 291.3 812.0 645.1 340.9 406.0 406.0 406.0 754.0 812.8 812.0') Paute "A" & "Yt" (50oMWl - 1982/83- - - 230.4 1,965.2 2,689.7 2,543.4 2,734.5 2,804.1 2,743.2 4,305.0 4,305.0d) Agoyan (150MW) - 985/ 2/ 50 - - 621.3 674.4 693.8 676.8 645.8 609.1e) PautLe "C" (500rs) - 1987/1988 - 254.0 399.4 236 4 129.2f) Daule-Peripa (130MW) - 1988 - - 727.0 552-.g) Paute-Mazar (114OMW) - 1989/1 y90 ?- - - 712.0h) Toachi (300MW) - 1990/19911/
- - 452.7Total Futuire Generation 42.7 343.7 1,077.5 2,625.7 3,057.8 3,625.4 3,853.2 4,182.0 5,323.3 6,567.7 7,574.5
Total Generation 2,421.8 2,891.0 3,644.0 4,320.5 4,771.2 5,598.7 6,163.0 6,800.1 7,497.2 8,225.3 9,022.2
T The average year system gerneratior) capability is greater than Lhe dispatched gernerationpresented in the table.
2/ llydro-elect1ric power planits.

ECUADOR
INECEL POWER TRANSMISSION PROJECT
National Interconnected System (SNI)
1980-1990 Energy Balance (GWh)Dry Year1
!
1980 1981 1982 1983 1984 1985 1986 1987 1988 9 1990
1) Yearly Energy Consumptioon 2,421.8 2,891.0 3,644.o 4,320.5 4,771.2 5,598.7 6,163.0 6,800o1 7,497.2 8,225.3 9,022.2
2) Existing Generation
a) Hydro 534.4, 652.2 723.8 795.5 808.5 812.7 812.7 812.7 812.7 812.7 812.7b) Thermal 1,829.0 1,878.2 1,852.2 838.5 891.5 1,011.4 1,590.4 2,233.5 2,203.2 1,192.3 922.8
Total Existing Generation 2,363.4 2,530.4 2,576.0 1,634.0 1,700.00. 1,824.1 2,403.1 3,o46.2 3,015.9 2,005.0 1,735.5
3) Future PlantGeneration
a) Quito - G.T. (60MW) - 1980 58.4 67.8 25.6 8.6 34.8 38.6 23.9 17.9 18.3 13.3 16.2b) Esmeraldas-Steam (125MW) - 1981 . - 292.8 812.0 715.4 681.8 812.0 812.0 812.0 812.0 812.0 812.0c) Paute "A & "B" (500MQ - 1982/83 -J - - 230.4 1,962.5 2,355.0 2,355.0 2,355.0 2,355.0 2,355.0 4,305.0 4,305.0d) Agoyan (150MW) - 1985 J - - - - - 569.0 569.0 569.o 569.o 569.0 569.oe) Paute "C" (500MW) - 1987/1988 21 - - - - -f) Daule-PeriPa (130MW) - 1988 i/ - - _ _ _ _ _ _ 727.0 521.0 521.0g) Paute-Mazar (140MW) - 1989/199oJ _ _ _ _ - - 680.0h) Toachli (300MW) - 1990/1991 2/ - - - - - - - - 383.5
Total Future Generation 58.4 360.6 1,068.0 2,686.5 3,071.6 3,774.6 3,759.9 3,753.9 4,481.3 6,2?0.3 7,286.7
Total Generation 2,421.8 2,891.0 3,644.o 4,320.5 4,771.6 5,598.7 6,163.0 6,800.1 7,497.2 8,225.3 9,022.2
/ The dry year system generation capability is greater thani the dispatched genieratiorn presented in the table.2/ Hydro-electric power plants.
.,

- 45 -
ECUADOR ANNEX 3Table 3.6
INECEL POWER TRANSMISSION PROJECT
1978 Gross Generation/Purchases, Sales, Local Use and Losses (GWh)
Gross Losses .
Generation & Power Gross
Purchases Sales Station Use Losses Generation %
Cuenca 90.3 71.0 0.5 18.8 20.8
Bolivar 6.9 5.9 0.2 0.8 11.6
Azogues 6.8 4.3 0.1 2.4 35.2
Norte 49.0 38.6 0.2 10.2 20.8
Latacunga 25.1 17.3 0.1 7.7 30.7
Riobamba 52.0 46.2 0.3 5.5 10.6
Sur 26.8 21.4 0.5 4.9 18.3
Quito 673.2 583.6 4.5 85.1 12.6
Ambato 57.6 45.6 0.3 11.7 20.3
El Oro 48.1 38.4 0.3 9.4 19.5
Esmeraldes 32.2 28.8 0.2 3.2 10.0
Milagro 50.9 41.6 1.8 7.5 14.7
Sta. Elena 26.3 22.1 0.9 3.3 12.5
Los Rios 24.1 19.5 0.8 3.8 15.8
Manabi 114.0 84.9 7.5 21.6 18.9
TOTAL INXCELSUBSIDIARIES 1,283.3 1,069.2 18.2 195.9 15.3
EMELEC 994.3 869.0 27.6 97.7 9.8
TOTAL POWERSECTOR 2,277.6 1,938.2 45.8 293.6 12.9

- 46 -ANNEX 4
ECUADOR Attachment 4.1
INECEL POWER TRANSMISSION PROJECT
Ongoing and Future Development Projects
(a) Ongoing ProjectsCommissioning
Project Capacity Dates
- Paute hydroelectric plant(Phase A & B) 500 MW 1982/1983
- Guayaquil No.3 (steam) 73 MW 1980
- Esmeraldas No.1 (steam) 125 MW 1981
- Quito (gas turbines) 60 MW 1980
- Regional Systems' generation 186 MW 1980/1982
- SNI transmission system(138 kV & 230 kV) - 1980/1982
Total
(b) Future Projects- Agoyan 150 Nw 1986
- Daule-Peripal/ 130 MW 1988
- Paute - Phase C 500 MW 1987
- Paute-Mazar 140 MW 1989
- Toachi 300 MW 1990
- SNI transmission system(230 kV & 138 kV) - 1982/1985
- Regional systems' transmissionsystem (69 kV & 345 kV) 1982/1985
- Distribution & Ruralelectrification 1982/1985
- Studies, small generation (stations and general invest-ments 1982/1988
1/ Corporacion de Desarrollo de Guayas (CEDEGE) is carrying out the dev elopment ofthis multipurpose project. INECEL is not participating in its financing. Thepower facilities of project are to be leased by CEDEGE in a multi-year agreementwith INECEL.

ECUADOR
INECEL POWER TRANSMISSION PROJECT
Ecuador's Installed Capacity (KW)
ZMELEC,INECEL AND 18SIDIARIES MUNICIPAL SELF-PRODUCERS TOTAL
Provinces Hydro Thermal Total Hydro Thermal Total Hydro Thermal Total Hydro Thermal Total
Azuay 15.725 14.185 29.910 226 111 337 __ 2.666 2.666 15.951 16.962 32.913
Bolivar 840 5.033 5.873 80 15 95 -- _ 920 5.048 5.968
Canlar 840 1.380 2.220 80 80 -- 9.075 9.075 920 1L0.455 11.375
Carchi 1.620 766 2.386 581 -- 581 -- -- 2.201 766 2
.9b7
Cotopaxi 4.200 3.388 7.588 405 492 897 4.551 4.551 4.605 8.431 J3.036
Chimborazo 9.117 5.364 14.481 245 202 147 1.900 711 2.611 11.262 6.277 17.539
El Oro -- 18.576 18.576 2.366 275 2.641 - 578 578 2.366 19.429 21.795
Esmecaldas -- 7.192 7.192 -- 164 164 __ 25.603 25.603 -- 32.959 32.959
Galapagos -- -- -- 689 689 __ 285 285 974 74
Guayas 319.783 319.783 -- 676 676 -- 39.551 39.551 -- 360.010 36O. 10
Imbabura 9.622 6.534 16.156 440 -- 440 871 3.041 3.912 10.933 9.575 20.508
Loja 2.560 9.259 11.819 -- 127 127 206 1.096 1.302 2.766 10.482 13.248
Los Rios -- 21.112 21.112 -- 216 216 -- 7.433 7.433 -- 28.761 28.761
Manabi 33.600 33.600 -- 991 991 __ 4.284 4.284 -- 38.875 38.875
Morona Santiago -- -- -- 153 1.066 1i.219 256 -- 256 409 1.066 1.475
Napo -- -- 71 1.171 1.242 1.800 10.382 12.182 1.871 11.553 13.424
Pastaza 110 945 1.055 -- -- -- 570 570 110 1.515 1.625
Pichincha 85.360 94.816 180.176 2.804 _- 2.804 7.050 30.677 37.727 95.214 125.493 220.707
Tungurahua 74.961 10.980 85.941 -- -- -- 98 98 74.961 11.078 86.039
Zamora Chinchipe -- -- _ 154 154 -- -- 154 154 H
TOTAL 204.955 552.913 757.868 7.451 6.349 13.800 12.083 140.601 152.684 224.489 699.863 924.352 I

-48-
ECUADOR ANNEX 4Attachment 4.2
INECEL POWER TRANSMISSION PROJECT Page 1 of 3
Main Characteristics of Future Power Plants
(A) HYDROELECTRIC DEVELOPMENTS
1. Paute - Phases "A" and "B"
- Dam and ReservoirType: Arch Dam (concrete)Height: 170 mLength: 400 m 3Volume: Gross: 120 x 106 m
Net : 100 x 106 m3
- PowerhouseTurbines: Pelton (net head: 615 m)Installed Capacity: 5 x 100 MWFirm Capacity : 437 MWFirm Energy : 2355 GWh/yearAverage Energy : 4017 GWh/year
2. Agoyan
- Dam and ReservoirType: Gravity (concrete)Height: 36 mLength: 270 mVolume: Gross: 1.87 x 10⁶ m3
Net : 0.88 x 10⁶ m3
- PowerhouseTurbines: Francis (net head: 155 m)Installed Capacity: 2 x 75 MWFirm Capacity : 138 MWFirm Energy : 569 GWh/yearAverage Energy : 1031 GWh/year
3. Paute - Phase "C"
- This development is an extension of Paute "A" and "B" describedin (1). The additional capacity added to Paute is:
Installed Capacity: 5 x 100 MWFirm Capacity : 437 MWFirm Energy : 0Average Energy : 1710 GWh/year

ANNEX 4- 49 - Attachment 4.2
Page 2 of 3
4. Daule-Peripa
- Dam and Reservoir (multi-purpose: power, irrigation andwater supply).
Type: EarthfillHeight: 78 mLength: 230 m9Volume: Gross: 6 x 10⁹ m 3
Net : 4.3 x 10⁹ m3
- PowerhouseTurbines: Francis (net head: 55.7 m)Installed Capacity: 2 x 65 MWFirm Capacity : 77 MWFirm Energy : 521 GWh/yearAverage Energy : 710 GWh/year
5. Toachi
- Dam and ReservoirType: Rockfill with impermeable coreHeight: 154 mLength: 370 mVolume: Gross: 139 x Q6 m3
Net : 94 x 10 m3
- PowerhouseTurbines: Pelton (nethead: 292 m)Installed Capacity: 4 x 75 MWFirm Capacity : 253 MWFirm Energy : 767 GWh/yearAverage Energy : 1587 GWh/year
6. Paute-Mazar
- To be constructed upstream of Paute hydro-development. Paute-Mazardam will control sedimentation of Paute dam and also will increasePaute firm energy by about 1950 GWh/year. Its main features aredescribed below:
- Dam and Reservoir-Type: Gravity (concrete)Height: 170 mLength: 420 m 6 3Volume: Gross: 500 x 10 6m
Net : 460 x 106 m
- PowerhouseTurbines: Francis (net head 200 m)Installed Capacity: 2 x 70 MWFirm Capacity : 77 MWFirm Energy : 680 GWh/yearAverage Energy : 1047 GWh/year
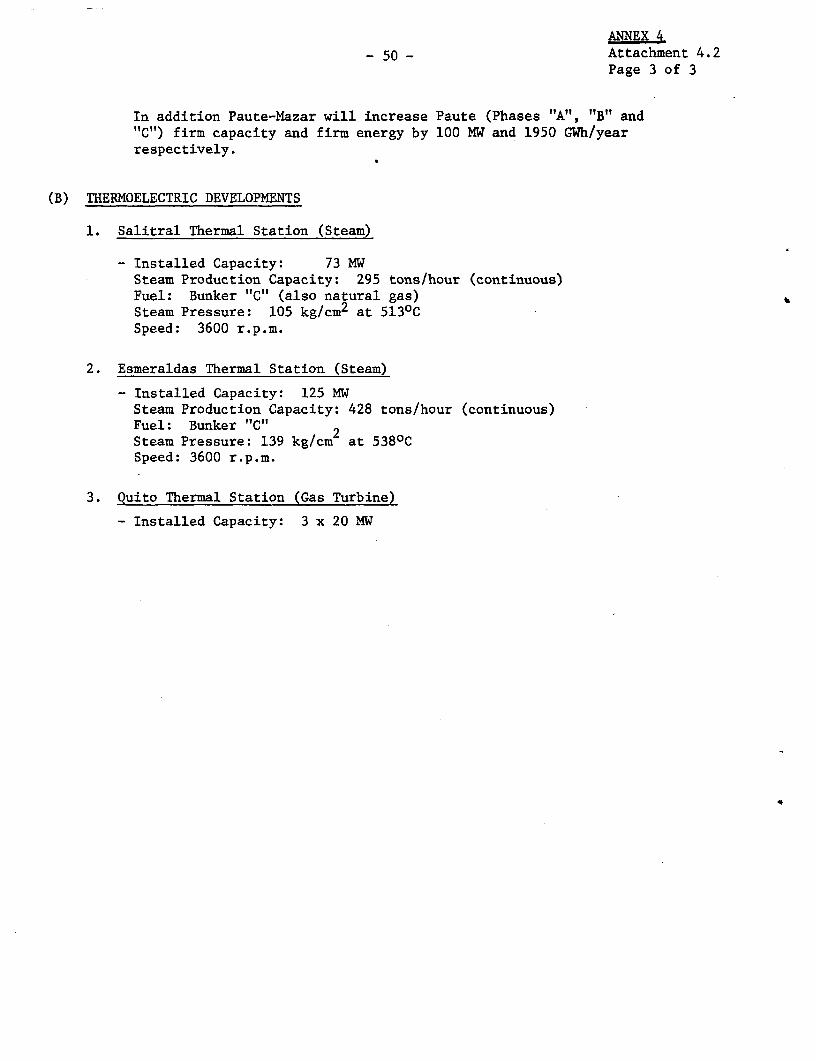
ANNEX 4
- 50 - Attachment 4.2Page 3 of 3
In addition Paute-Mazar will increase Paute (Phases "A", "B" and"C") firm capacity and firm energy by 100 MW and 1950 GWh/yearrespectively.
(B) THERMOELECTRIC DEVELOPMENTS
1. Salitral Thermal Station (Steam)
- Installed Capacity: 73 MWSteam Production Capacity: 295 tons/hour (continuous)Fuel: Bunker "C" (also natural gas)Steam Pressure: 105 kg/cm2 at 5130CSpeed: 3600 r.p.m.
2. Esmeraldas Thermal Station (Steam)
- Installed Capacity: 125 MWSteam Production Capacity: 428 tons/hour (continuous)Fuel: Bunker "C" 2Steam Pressure: 139 kg/cm at 5380CSpeed: 3600 r.p.m.
3. Quito Thermal Station (Gas Turbine)
- Installed Capacity: 3 x 20 MW
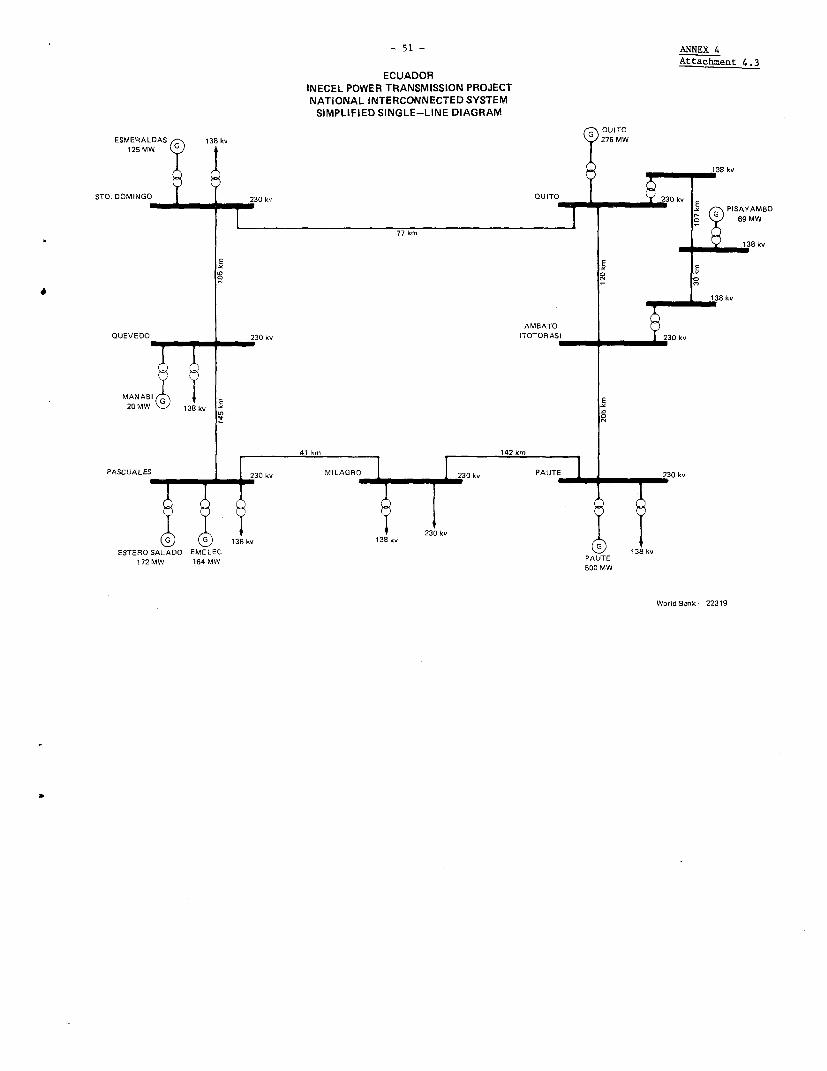
-51 - ANNEX 4Attachment 4.3
ECUADORINECEL POWER TRANSMISSION PROJECTNATIONAL INTERCONNECTED SYSTEM
SIMPLIFIED SINGLE-LINE DIAGRAMQUITO
ESMERALDAS 138 kv 276 MW
125 MW W
138 kv
STO. DOMINGO 230 k~ QUITO
QUEVEDO _30 kv (TDTORAS j 3 0 ~~~~~~~~~~~~~~~23kv8
E~ PISAYAMBO
o 69 MW
77 km~~~~~~~~~~~~~~~~~~3k
8 8~~~~~~~~~~~~~~~~~~~~~~~~~~~~~~~~~~~~~~8k
E E
2 0 1 3 8 kv8 kv lo o
AM BATO
QUEVEDO 230 kv (TOTORAS) 20 kv
MA.NABI S -
20M 138 kv vE0
PASCUALES 230 kv MILAGRO v PAUT 230 kv
(X)~~~3 kv 138 kXESTERO SALADO EMELEC 138 kv
172 MW 164 MW 500 MW
World Bank- 22319

ECUADOR
INECEL POWER TRA8NMISSION PROJECT
1980-1985 Inor-toent P-oatra (in oI11iona of 1980 constant US dollars)
__________1980- - ------- 19881___98___98__ ---------- 198Z-___----- 1984 … … … ____ -198 1985 ________1980W1985 …_____
LoosE Foreign Total Local PorEion Total L iocal Porstn Total L-oca 1 o-igan Tonal Local Fortlan Totl L-ocal ForeiRn Tot*l L.aaI Foreign Total
GNGOING WORES
Gtnert tion
Psots (Hydro) _Phas.. A & B 48 44 92 44 43 87 13 18 31 20 32 52 - - - _ _ - 125 137 262
Retero Sl1ado No.3 (Thernal) 6 11 17 - - - - - - - - _ - _ - _ - - 6 11 17
Us Trbins -QIta 1 9 Er - - ----- 1 9 10
Es ,er,1d,, (The.nl) 12 37 49 4 10 14 - - - - - - - - - - - - 16 47 63
lobtot-l (Qeneration) 67 101 168 48 53 101 13 18 31 20 32 52 - - - - 148 204 352
Tranenlas toe
Quito- Guayaqil 6 2 a - - - - - - - - - 6 2 8
Paots _Oa.yoqail 8 30 38 17 50 67 1 - I _ _ _ - - - - - - 26 80 106
Ph- aeB1/ 8 9 17 - 1 1 - -_ - - -_ - - -_ - 8 10 18
SObtOt51 (Transmission) 22 41 63 17 51 68 1 1 - - - - - - -_ - 40 92 132
Subtr nsoapiaiOn and Rota1 Ellotrlifiction 18 19 37 12 11 23 _ - - - - - - - - - - - 30 30 60
NEOiELas Oobnldlorlna 2/ 9 11 20 45 SS 100 - _ - - - _ - - - - - - 54 66 120
Rn-npral [nostenrtn.2/ 16 5 21 1 2 3 1 2 2 _ _ _ _ _ _ _ _ _ 18 9 _2L
TOTAL ONGO _NCWOR" 132 177 309 L23 172 295 15 20 15 20 32 52 - 290 401 691
FUTURE WORKS,
Asoysn (Oydro) 12 18 30 19 40 59 10 31 41 6 15 21 - - - 47 104 151
P-ats (Oydeo) - Phase C - - 1 2 9 20 29 12 21 33 16 34 50 10 18 28 48 94 142
Pat-ilIR; (drydo) I - 1 i 2 1 1 2 1 1 2 7 12 17 11 24 35 21 37 58
Toachi (Rydrol - - - - 5 10 15 20 32 52 25 45 78
Slall ydro Plant- - 2 4 6 3 3 6 2 2 4 2 4 6 2 2 4 11 15 26
Future ProJectr 4/ 2 4 6 2 4 6 3 6 9 3 6 _9 10020
- - - - - -6 9 ~-3 __ _2 1 _LOprot-joono. -ti.2 4 6 2 ..9 .- tL . .___
Robtonal (osoarstoon) -_ - - 16 24 40 34 68 102 27 8 66 39 79 118 46 8S 131 162 312 477
Treocl..iionpha.e 0l !- - - 1 2 3 3 19 02 3 3 6 2 5 7 - - - 9 29 38Ph::: .02 - - - 1 4 5 11 28 39 16 23 39 6 9 15 1 4 5 35 68 103
Phase- D - _ _ 3 5 8 1 4 5 - 11 11 4 1 5 2 4 6 10 25 35
Slbtatsl (Tr-naie.ionl - - - 5 11 16 15 51 66 19 3 56 12 15 27 3 8 11 54 122 176
slbtrsn EIsslOn nd _asE- Electriflcatlon -- _ _ - - - 18 17 35 14 12 26 16 13 29 10 9 19 58 51 109
NR8EL. S Ob-sldlrlss 2/ -- - 25 32 57 13 16 29 15 13 28 14 16 30 67 77 144
G .soal 4_7 _ 3 7 4 8 3 5 8 4 4 3 S 17 22 19
TOTAL FUTURE W 24 39 63 96 172 268 76 129 221 86 124 210 2 8 95
30TAL INVESIIINTPROGRAM 132 172 309 147 211 18 11 192 503 96 161 257 6 124 210 76 12 19 648 8 1,636
1/ TL. Sto ToQin-o-Esaaaraldsa; . LoQevdo_Puerto Viejo2/ Local generation ad dittib-inon.3/ StLdE.._b. oldAn-ga hod eqoip-ent, s-sI hydro.
Include6 stadiee tof CoCa, Jobon5er, geotlort al, D.u -P-rip.5/ RgoyTo-otorEO 2L; Totna-or to T0L.
propoaed World 3leak fiP -oed pro-eot. Se A-nex 5, Tol 5.4, footnoto 2.
2/ Phase D TosCrlaes.Sot"n o f Ltto a U/10000 on of Ib-ar-e /S/
natoilation of Tepsoitoa at va.roousaontoooona.

ECUADOR
INECEL POWER TRANSMISSION PROJECT
Summary of Project Cost Estimates
Length Transformer
Circuit Voltage Capacity Number of Bays US$ Thousand
Kilometers kV MVA 230 kV 138 kV 69 kV 34.5 kV Local Foreign Total
1. Transmission Lines
Paute-Totoras 2a5 230 5,473.1 14,240,8 19,713.9
Milagro-Machala 133 230 2,715.4 7,065.2 9,780.6
Guayaquil-Posorja-Sta.Elena 205 138 2,104.5 4,852.3 6,956.8
Cuenca-Loja 135 138 1,766.8 4,597.1 6,363.9
Ibarra-Tulcan 80 138 1,047.0 2,724.2 3,771.2
Ambato-Totoras 7 138 82.4 214.3 296.7
Basic Cost Lines 970 13,189.2 33,693.9 46,883.1
2. Substations
Ambato s/s - - 2 - - 215.5 672.9 888.4
Riobamba s/s 60 4 - 6 - 1,346.5 6,007.1 7,353.6
Machala s/s 60 3 - 5 - 1,031.0 4,456.3 5,487.3
Sta. Elena s/s 40 - 3 4 - 547.7 1,955.8 2,503.5
Posorja sls 20 -1 4 - 350.9 1,129.5 1,480.4
Loja s/s 40 3 4 - 574.0 2, 122.3 2,696.3
Tulcan s/s 60 _ 5 - 4 827.7 3,022.0 3,849.7
Basic Cost Substations 280 7 14 23 4 4,893.3 19,365.9 24.259.2
Total Basic Cost Lines and Substations 18,082,5 53,059,8 71,142.3
Engineering and Supervision 10,656.4 600.0 11,256.4
Physical Contingencies 2,873,8 5,365.9 8,239.7
Subtotal Lines and Substations 31,612.7 59,025.7 90,638.4
3. Consultants' Services and Studies
Training Program 116.0 1,906.0 2,022.0
Institutional Improvement Program 831.6 2,260.4 3,092.0
Load Dispatch Center 450.0 1,120.0 ' 70
Basic Cost Consultants' Services
and Studies 1,397.6 5,286.4 6,684.0
Physical Contingencies 139.8 528.6 668.4
Subtotal Consultants' Services and Studies 1,537.4 5,815.0 _7352.4
Price Contingencies 24,768.5 21,337.6 46,106.1
Total Project Cost 57,918,6 86,178,3 144,096.9
m X4

- 54 -ANNEX 4
ECUADOR Table 4.4
INECEL POWER TRANSMISSION PROJECT
Estimated Loan Disbursement Schedule(US$ Thousand)
IBRD Fiscal Year Disbursements Cumulative Disbursementsand Semester During Semester at end of Semester
1982December 31, 1981 5,000 5,000June 30, 1982 12,000 17,000
1983December 31, 1982 15,000 32,000June 30, 1983 17,000 49,000
1984December 31, 1983 15,000 64,000June 30, 1984 14,000 78,000
1985December 31, 1984 12,000 90,000June 30, 1985 7,000 97,000
1986December 31, 1985 3,000 100,000

ECUADOR
INECEL POWER TRANSMISSION PROJECT
Project Implementation Schedule
-- Issue of Bidding Documents --- Award of Contracts-------
Equipment and Equipment and Construction Commissioning
Materials Construction Materials Construction Start of Works
Transmission Lines
Guayaquil - Sta. Elena March 1981 March 1982 October 1981 December 1982 February 1983 September 1984
Milagro - Machala March 1981 March 1982 October 1981 December 1982 February 1983 December 1984
Paute - Totoras March 1981 March 1982 October 1981 December 1982 February 1983 December 1984
Cuenca - Loja March 1981 March 1982 October 1981 December 1982 February 1983 September 1984
Ibarra - Tulcan March 1981 March 1982 October 1981 December 1982 February 1983 June 1984
Totoras - Ambato March 1981 March 1982 October 1981 December 1982 February 1983 June 1984
U,
Substations L
Sta. Elena March 1981 January 1982 October 1981 October 1982 December 1982 September 1984
Posorja March 1981 January 1982 October 1981 October 1982 January 1983 September 1984
Machala March 1981 January 1982 October 1981 October 1982 December 1982 December 1984
Riobamba March 1981 January 1982 October 1981 October 1982 April 1983 December 1984
Loja March 1981 January 1982 October 1981 October 1982 April 1983 September 1984
Tulcan March 1981 January 1982 October 1981 October 1982 January 1983 June 1984
ox
rtZ
.5:m
4 X
rt

ECUADOR
INECEL POWER TRANSMISSION PROJECT
Performance Indicators
1981 1982 1983 1984 1985
DEMAND FORECAST
SNI Peak Demand (MW) 697 834 966 1,108 1,232SNI Net Generation (GWh) 2,891 3,644 4,321 4,771 5,591Isolated System's Peak Demand (MW) 131 88 81 40 -Isolated System's Net Generation (GWh) 791 469 240 254 -
OPERATING PERFORMANCE INDICATORS
INECEL No. of Employees 2,530 2,640 2,760 2,850 2,940INECEL Subsidiaries and EMELEC No. of employees 5,510 5,930 6,370 6,850 7,360Power Sector No. of customers/Power 94 95 96 98 99Sector Total No. of employees 1/
U'SNI Transmission Losses 4 4 4 3 3INECEL Subsidiaries 15 14 14 13 12
FINANCIAL PERFORMANCE INDICATORS
Average retail tariff (S/kWh), 2/ 1.53 2.32 3.00 3,85 3.85Rate of return (%) 3/ (1.7) 4.0 8.0 8.5 8.5
INECEL & subsidiaries consolidated contribution to neg ... .06 .26 .33investment
Consolidated debt service coverage 0.2 0.8 1.2 1.7 1.7
1/ Includes EMELEC and excludes municipalities
2/ See Annex 5, Table 5.1, footnote (f) t.(Dx
3/ The same rate of return would be required for INECEL and for the consolidated operations of 4 4INECEL and its subsidiaries.
L

- 57 -
ANNEX 5ECUADOR - DIECEL TRANSIISSION PROJECT Table 5-1
Financial History and Forecasts*: Consolidated Income Statements (1978-1985) a/
(in millions of current dollars)
ESTIMTED FORECAST
1978 1979 1980 1981 1932 1983 1984 1985
Retail Sales (GWh) b 1,118 1,307 1,651 1,761 1,992 2,262 2,528 2,868Average retail tariff (US mills/kWh c/ 43 43 51 bl 93 120 154 154Retail sales revenues 48.5 56.o 84.2 107.1 185.1 271.5 389.7 442.2Bulk sales revenues (to EMELEC) 4/ 2.0 9.3 17.8 37.6 57.9 91.4 81.5 143.5
Total sales revenue 50.5 62.6 102.0 144.7 243.0 362.9 471.2 585.7Other operating revenues e/ 3.0 3.2 4.2 5.4 92 12.8 18.7 21.9
Total operating revenues 53.5 65.8 106.2 150.1 252.2 375.7 489.9 607.6
Operating expensesFuel f/ 10.3 14.2 18.3 58.2 80.8 66.9 59.6 67.8Salaries and other 0 & M expenses L/ 30.9 41.5 48.9 73.6 84.5 120.3 151.3 183.0Depreciation ]/ 11.6 13.7 23.4 32.7 42.5 58.7 79.9 94.6Amortization i/ 1.2 0.8
Total operating expenses 54.0 70.2 90.6 164.5 207.8 245.9 290. 345.4
Net operating income (0.5) (4.4) 15.6 (i4.4) 44.4 129.8 199.1 262.2
Other income 4/ 2.8 2.6 2.8 3.0 3.2 3.4 3.6 3.8Other expenses
Financial charges (4.5) (10.9) (20.4) (39.6) (49.5) (87.4) (85.9) (93.0)Other k/ (8.1) (10.1) (13.8) (8.2) (9.8) (11.5) (13.6) (16.2)Workers participation 0/ (.6) (0.1) (o.6) (0.8) (2.0) (3.0) (3.3) (3.6)
Net income (10.9) (22.9) (16.4) (60.o) (13.7) 31.3 99.9 153.2
Rate base mj 410.0 480.6 590.5 843.o 1109.2 1622.8 2342.7 2867.8
Rate of return n/ 2%) (0.1) (0.9) 2.6 (1.7) 4.o 8.0 8.5 9.1
* Figures may not add up because they have been rounded off.a/ IMECEL and all its subsidiaries (the private company, EMELEC, is therefore excluded).bJ Based on the mission estimates shown in Annex 3.1 , after deducting autoproduction and sales by EMELEC.4/ Residually determined, so aS to achieve the target rates of return set.4/ Based on system simulation to minimize operating costs.S/ Forecasted, on the basis of historic behavior, as a Constant proportion (5%) of retail sales revenues./ Fuel consumption was forecasted on the assumption of a progressive reduction in subtransmission and distribution losses, from 14% in 1980 to
12.1% in 1985. Foel price forecasts are based on the following assumptions: (i) world prices will rise at a rate of 11% per year, (whichis 2% above the forecasted world inflation rate), (U) interml prices will be increased at this rate and, in addition, a 33% increase willbe put into effect on January 1,1983 so that internal prices will then represent 50% of world prices.
4 Salaries and other 0 & M expenses incurred by the SKI were forecasted on the basis of the following relationships (which are consistentwith historic experience)to the corresponding gross revalued assets in operation: hydro generation 1.091%, thermal generation 2.902% andtransmission 2.45%. 0 & M expenses (excluding fuel and depreciation) incurred by IlECEL's subsidiaries were forecasted on the basis oftheir relationship (in 1978) to total gross assets in operation, this was 9.888%. To the extent that the largest component of 0 & Mexpenses are wages, and there is some evidence of overstaffing, it may be feasible to achieve lower 0 & M costs than forecasted.
4/ Annual depreciation charges were estimated using the following percentages of revalued gross fixed assets in operation: hydro plants 2.25%,thermal plants 3%, transmission lines 2.78%, distribution facilities 3.5%, all other facilities 4%.
4/ Refers to losses which were not charged against income when incurred; it was assumed such practice will not be repeated.A/Includes miscellaneous small items./ Mainly the costs of sector planning and supervision, as well as administrative overheads. INECEL does not identify these costs in its
income statements, but nets them against its participation in oil royalties.E/ REQ has a profit sharing system with its employees.
/ As provided in Ecuador's tariff legislation, the rate base is given by average revalued net fixed assets in operation plus 3% (as anestimation of intangible assets), plus a provision for working capital. The latter is calculated as three months of 0 & M expenses.
n/ Given by the ratio of net operating income to the rate base.

- 58 -Annex 5Table 5-2
ECUADOR - INECEL TRANSMISSION PROJECT
Financial History and Forecasts*: Consolidated Bglance Sheets l81(1978-1985)
(In millions of current dollars)
ESTIMATED FORECAST
Year Ending December 31 1978 1979 1980 1981 1982 1983 1984 1985
ASSETS
Fixed Asaets
Gro utility plant in service lI 494,4 583.7 771.3 1136.7 1391.7 2299.2 2983.4 3579.2Lees accumulated depreciation c/ 75.4 92.6 124.4 168.4 226.0 412.4 544.1Net plant in service 419.0 491.i 7 1 968. 3 15994.2 2571.0 3035.1Work in progress d/ 167.4 348.8 543.8 697.3 921.5 584.8 454.o 496.5Other fixed assets (net) e/ 7.5 8 13.1 19.1 26.7 4 4 42 2Total fixed assets 5939 848.2 1203.8 164.7 2123.9 307 .9
Current Aseete
Cash f/ 17.7 15.1 13.4 20.4 26.5 30.8 36.1 43.3Accounts receivable j/ 77.6 60.1 39.9 60.1 72.8 92.0 111.8 134.2Materials end eupplies hi 70.9 54.5 33.7 50.°-3 _1032 132.8 157.0
Total current assets 166.2 129.7 87.0 130.8 63.1 2 128.7 .2
Deferred Charges
Studies cnd prepaid expenses -/ 83.5 84.2 92.8 102.4 113.8 125.7 138.6 153.1
TOTAL ASSETS 843.6 12 &2_ 2 ;2j ,A a= .
EIsity end Liaiilities
Capital 366.4 530.0 678.9 924.3 1055.3 1278.5 1428.5 1545.9Accumulated surplus 1/ (0.2) (20.8) (35.5) (89.5) (101.8) (73.6) 16.4 154.3.A-set revaluation reserve k/ 66.8 117. 170.4 253,6 357.6 516.7 703.4 933.8
Total equity 433.0 626.9 81. 1311.1 17216 2148.2 2634.0Minority participation in subsidiaries 1/ 53.4 -- 56.4 59,8 59.2 63.6 73.2 90.5 114.3)Long term debt 26947 338.3 48 728.0 977.2 1123.9 1205.5 1274.9Lena: current portion 21.0 29.4 34.3 45.3 64.2 75SL 106.5 145.7Net long tern debt 28. 388.9 452.0 7 913.0 104876 1099.0 1129.2Current liabilities 108.8 69.8 580 8L7.7 103.2 121.7 149.5 194.7Total Liabilities 357.2 78. o10, 770.4 1 2 1170.3 .5 1323.9
TOTAL EQUITY AND LIABILITIES 843.6 1062--i 1 94L 121 . 2
* Figures may not add up because they have been rounded off.
a/ INECEL and all its subsidiaries (see list inAnnex 1).
b/ See attachment. Figures shown are folly revalued. Revaluation estimates were developed jointly by INECEL's staff and the Bank mission, on the basis ofthe following criteria:
i) For INECEL's own fixed assets annual investment figures (broken down in local and foreign costs) were revalued to 1978 using inflation indexes of 77and 12% per year for foreign and local costs respectively. Thereafter, the inflation indexes used were 97. and 15% per year, for foreign and localcosts respectively. See Table 5.4, footnote 1.
ii) For INECEL's subsidiaries adequate data on the time at which investments took place was not available. To overcome this limitation, assets weregrooped into homogeneous categories, i.e.: hydro generation, diesel geneiation, substations, subtransmission lines (at various voltage levels),distribution lines, etc. The replacement values, at Decenber 1977 market prices, of these assets were then determined, and further updted using thesame indexes as used for INECELs assets.
c/ See attachment. Annual depreciation charges were calculated in the inener indicated in footnote h to Table 5.1. Accumulated dep-eciation was revaluedin the same way as gross fixed assets.
d/ See attachment. Work in progress is not revalued. INECEL capitali.es interest during construction until the assets come into operation and, also, willcapitalize an assigned-cost-of.equity-gapital (of 8.57. per year), applied to the amount in which the specific project is self-financed.
el See attachment. Refers to nun-operational assets and miscellaneous investments. They have been revalued in the same manner as gross fixed assets.
f/ Forecast as one month of expenses (exclusive of depreciation), plus 1/12 of annual debt service.
g/ Forecast as the saum of: 20% of sales revenues (representing an average collection period of 75 days), and 20% of annual revens from oil royalties.
h/ Forecast as the sum of 57. of net fixed assets in operation and 107. of net non-operational fixed assets.
if See attachment. £
i/ See attachment.
kl See attachment. See also footnotes bi, of and d/ above.
1/ See attachment. Refers to the shareholdings of INECEL's partners (mainly the local nunicipaliti-e, see Annex 1.) in the onwnership of INECEL'ssubsidiaries.

Annex 5- 59 - Table 5-2
Attachment
ECUADOR - INECEL TRANSMISSION PROJECT
Attachment to Consolidated Balance Sheets(in millions of current dollars)
Year Ending December 31 1979 1980 1981 1982 1983 1984 1985
Gross Utility Plant in Service
Balance at beginning of year 494.4 583.7 771.3 1136.7 1391.7 2299.2 2983.4Transfers from work in progress 41.0 135.0 296.0 152.7 782.3 477.3 327.3Revaluation 48.3 52.6 69.4 102.3 125.2 206.9 268.5Balance at end of vear 5TT7 771.3 1136.7 391.7 2299.2 2983.4 3579.2
Accumulated Depreciation
Balance at beginning of year 75.4 92.6 124.4 168.4 226.0 305.0 412.4Annual depreciation 10.4 23.5 32.8 42.4 58.7 80.0 94.6Revaluation 6.8 8 11.2 15.2 20.3 27.4 Z7 Balance at end of year 92.6 54 f2 305.0 41 2. 544.1
Work in Progress
Balance at beginning of year 167.4 348.8 543.8 697.3 921.5 584.8 454.0Total investments during year 184.1 301.3 402.0 323.0 371.0 304.8 340.1Interest during construction 25.4 29.0 33.3 51.0 34.7 50.0 48.6Interest on own capital 14.0 12.7 29.2 21.0 58.3 11.5 3.6
Subtotal 390.9 691.8 1008.3 1092.3 1385.5 951.1 846.3
Less transfers to:
Other fixed assets and studies (1.1) (13.0) (15.0) (18.1) (18.4) (19.8) (22.5)Gross utility plant in operation (41.0) (1 296.o (15237) 923) (477.3) (327_Balance at end of year 34 o.7 59721 584.8 _51 _ _____
Other Fixed Assets (net)
Balance at beginning of year 7.5 8.3 13.1 19.1 26.7 34.4 42.9Transfers from work in progress 0.4 4.4 5.4 6.7 6.5 6.9 8.0Revaluation 0.7 0.8 1.2 1.7 2.4 3-1 3.9Depreciation (°-3) (0.4) (0.6) (°-°) (1.2) (145 (1.9)Balance at end of year 0.9 13. L 26.7 34.4 42.9 52.9
Studies and Prepaid Expenses
Balance at beginning of year 83.5 84.2 92.8 102.4 113.8 125.7 138.6Transfers from work in progress 0.7 U.b 9.4 1.4 11.9 12.9 14.5Balance at end of year 84.2 T_4__ - 1 d. 7 153.1
Capital
Balance at beginning of year 366.4 530.0 678.9 924.3 1055.3 1278.5 1428.5Oil royalties 163.6 129.4 129.4 124.1 120.0 115.0 110.0Miscellaneous taxes - 19.5 5.5 6.9 1.1 1.2 1.3Other Government contributions - - 110.5 - 102.1 8 6.1Balance at end of year, 530.0 178. 9 5 128.5 14 59
Accumulated Surplus
Balance at beginning of year (0.2) (20.8 (35.5) (89.5) (101.8) (73.6) 16.4Consolidated net income (22.9) (16.4) (60.0) (13.7) 31.3 99.9 153.2Less: minority capital participation
in subsidiaries annual revaluation 2.3 1.7 6.o 1.4 (3.1 (2-9) 15.3Balance at end of year ) ) ( ) (1 E
Asset Revaluation Reserve
* Balance at beginning of year 66.8 117.7 170.4 25.6 357.6 516.7 703.4Interest on own capital (W in P.) 14.0 12.7 29.2 21.0 58.3 11.5 3.6FA annual revaluation 48.3 52.6 69.4 102.3 125.2 206.9 268.5Non-op. FA annual revaluation 0-7 0.8 1.2 1.7 2.4 3.1 3.9Less: FA acc. depreciation revaluation (6.8) (8.3) (11.2) (15.2) (20.3) (27.4) (37.1)Less: minority capital participation in
subsidiaries' annual revaluation (5.3) ±54) (5'4 (S.8) (6.5j )7.4) (8.5)Balance at end of year 117.7 170.4 253.6 357. 516.7 703.4 933.8
Minority Participation in Subsidiaries
Balance at beginning of year 53.4 56.4 59.8 59.2 63.6 73.2 90.5Participation in subsidiaries' profits (2.3) (1.7) (6.0) (1.4) 3.1 9.9 15.3Participation in subsidiaries' revaluation 5.3 5.1 5.4 5.8 6.5 7.4 8.5Balance at end of year 56 _ 2 __ 2 .2 90.5 11_

- 60 -ANNEX 5Table 5-3
ECUADOR - INECEL TRANSMISSION PROJECT
Financial forecasts*: Consolidated Sources and Applications of Fund Statements (1980-1985)(in millions of current dollars)
1980 Total
1980 1981 1982 1983 1984 1985 1982-1985
SOURCES
Net operating income 15.6 (14.4) 44.4 129.8 199.1 262.2 635.5
Non operating expenses, net(excluding financial charges) (11.6) (6.0) (8.6) (11.1) (13.3) (16.0) (49.0)
Net sector income, before interest 4.0 (20.4) 35.8 118.7 185.8 246.2 586.5Depreciation 23.8 33.3 43.3 59.9 81.4 96.5 281.1Gross internal cash generation 27.8 12.9 79.1 178.6 267.2 342.7 867.6Debt Service:Interest charged to income (20.4) (39.6) (49.5) (87.4) (85.9) (93.0) (315.8)Amortization | (29.4) (34.3) (45.3) (64.2) (75.3) (106.5) (291.3)
Net internal cash generation (22.0) (61.0) (15.7) 27.0 106.0 143.2 260.5
Equity contributions:Oil Royalties 129.4 129.4 124.1 120.0 115.0 110.0 469.1Miscellaneous taxes 19.5 5.5 6.9 1.1 1.2 1.3 10.5Other Government contributions - 110.5 - 102.1 33.8 6.1 142.0
Loans:Existing b/ 177.4 163.2 35.0 5.2 40.2Propostd F/ 112.8 172.6 134.5 94.5 62.1 463.7Future b/ 86.9 71.2 62.4 113.8 334.3
TOTAL SOURCES 304.3 460.4 409.8 461.1 412.9 436.5 1720.3
APPLICATIONS
Investment ProgramHydro Generation (SNI) 94.5 140.1 125.4 205.0 162.9 201.2 694.5Thermal Generation (SNI) 75.5 14.9Transmission (SNI) 63.1 96.7 80.3 77.9 36.7 14.5 209.4Other; operational 50.6 128.8 90.6 62.2 77.4 92.3 322.5Studies and other 17.6 21.5 26.7 25.9 27.8 32.1 112.5Interest during Construction 29.0 33.3 51.0 34.7 50.0 48.6 184.3Working capital (Net) c/ (26.0) 25.1 35.8 55.4 58.1 47.8 197.1
TOTAL APPLICATIONS 304.3 460.4 409.8 461.1 412.9 436.5 1720.3
* Figures may not add up because they have been rounded off.a/ See Table 5.7.bj See Table 5.6.c/ Net working capital has been here defined as the difference between current assets (cash, accounts receivable
and inventories of materials and supplies) and current liabilities (exclusive of the current portion of longterm debt.
IL

ECUADOR - INECEL TRANSMISSION PROJECT
CONSTRUCTION PROGRAM 1980 - 1985*(in millions of current dollars) L
1980 1981 1982 1983 1984 1985Local Foreign Tnal Local Foreign Total Lol Foren Total L_ Fnreign nral Local Foreign Tntal Local Foreign Tota
I. Hlydco Ooeration (SNI)
1. Paotn, 848 47,9 43.7 91.6 50.8 46.1 96.9 17.6 20.5 38.1 30.1 41.6 71.7 - - - - - -I. Agoyan - - - 19.0 19.7 38 7 23.3 23.9 47.2 31.8 50.0 8i.8 lS 20.1 30.9 _ _ _3. Paote C _ _ _ _ _ _ 11.7 23.3 35.0 18.7 27.2 45.9 28.5 47.7 76.2 20.1 07.5 47.64. Pa-te Manar- - - - - - - - - - - 11.2 12,1 23.3 19.1 33.9 53.05. Tno.hi - - - - 9.6 13.6 23.2 40.4 53.1 93.56 Small hydro 1.2 1.7 2.9 1.8 26 4.4 2.1 2.9 5.0 2.4 3.1 5.5 4.2 1.1 9.3 3.4 3.7 7.1Sol-tatal hydro 49.1 45.4 94.5 71.6 68.4 140.0 54.7 70.6 125.3 83.0 121.9 804.9 64.3 98.6 162.9 83.0 118.2 201.2
I1. Rhermel Gene.-tiuo (SNI)
1. E -tro Slado 5.4 11.2 16.6 - -2l G.a Qaito 1.5 8.6 10.1 - - - - - - - _ - , _ _ -_3. emetaldas 11.6 37.2 48.8 4.4 10.5 14.9
lob-total therml 18.5 57.0 75.5 4.4 10.5 14.9 - - _ - - - - _ _ _ - _
III, Tran--tesi-n (SlI)
1. Plhne 82 7.7 30.3 38.0 20.0 54.1 74.5 0.4 - 0.4 - - _ - _ _ _ _ -2. Phase Cl 2/ - - 0.8 5.6 6.4 14;1 31.8 45.7 26.9 26.4 53.3 8.6 8.3 16.9 2.0 1.7 3.73. Control ceter - - 1.2 2.5 3.7 1.5 2.0 3.5 - 4.8 4.8 . - - - - -4. Other 14.5 10.6 25.1 3.4 8.7 12.1 4.9 25.8 30.7 2.5 17.4 19.9 10.5 9.3 19,8 4.0 6.8 10.8S.o-tntal tra1 olasian 22.2 40.9 63.1 25.4 71.3 q6.7 23.9 50.4 80.3 29.4 48.6 78. 0 19.1 17.6 36.7 6.0 8.5 14.5
IV. Other (neeratinoal)
Regainal . yete-s 27.3 29.0 77.1 65.9 72.0 137.9 564.4 52.4 1i1.8 38.2 33.4 71.6 46.7 37.5 84.2 67.5 38.5 1o6.o
V. Stodi-n end oth-r 15.0 2.6 17.6 9.4 12.1 21.5 12.4 16.3 26.7 1o.6 i5.3 25.9 12.6 15,2 27,8 15.3 16.8 32.1
T3T82. 132.1 175.7 307.8 176.7 234.3 41l- 142.4 201.7 344.1 161.2 219.2 380.4 142.7 168.9 311.6 171.8 102.0 353.8
F Fig-res nay not add up b-caure they hau- been tuandod off.
1/ ES-noto-n hyputhbo-O -re di--u9ed ic pera. 5.05. Eutrn-linOuthstn -a-ooptio.n 0% p20 fOgo)aen mmrg:nml Ly blgbtr tbao gacainthon tfctor- osed to calolate projec-t ost (pra. 4.19), th-slocrodocg rsmaulcrenseca- tiVc bioct the fl-accgl pc,,-ctc-n.
2/ Doug tot cefluct cost r-diction -riting from r-de-igc of PFscte-Tutura- toonumas on in,nmounting to about US27 millon eq,i--leuX (eb-ot 5% of total in-vet-nt co-ts bezaeno1962 end 1985).

- 62 -
ECUADOR - 01NECE0 TAAEAISIDON PROJECT TblEX 3-
Schedule of Einttog acd Proposd Log Tare Debt
A-out Total Grac neetBt Rate ditataudioEuteoip- Amout Dollars Period Period Ooit-es duri4 duiog De.1, 10
L-1- ti- Dta.ho Corrx c 103 i0,3 (Tears (Yesr) Fee.% Dinbore...ot A-otisatico 11Wo10
Rura Elcocific-tiuu A01D-519-023 1964 us$ 645D 645 40 9.5 -0.75 5 516.oRural Electrifio-tiuc AID..518025 1964 01$ 696 696 40 9.5 -0.75 2 556.9RurIal`Retifioctiuu AID-518035 1972 01$ 3413 3413 40 9.5 -2.0 3 3413.0Anti Prject Dotted Kiogds-66 i966 p. 60 1426 DO 5 -6 9 570.4T0/6 Itbrro-Tuic- Pelte" Kicgdo-69 1969 L 300 713 25 3 7 9 453.7311o1 Oooto 7 groups Posted Klogdca-72 1971 L. 300 64h3 25 5 -3 2 6o6.o5
Li-sloic hr S. Pelted tciogdun-73(l) 1973 L 290 2s 5 4 91.Soucay gocerotioc Eq. Uolted Kiogdce.-73(2) 1973 L 1205 2964 25 3 5 0-
5 ~ ~ ~~~~~~~~3 2577.6T/i .Pgicoo1 Systeos Osiruk 2200 1974 U19$ 5129 5129 PP 0.5 5.5 5.5 1206.59
nsTubios BoEro- PSado Eciaok 6063 1976 P1$ ol61. 1161 7 30.5 9.125 9.125 970.75Therml Pisot Msilsgro-Oto. Sin E.Lb.Oso 6349 1979 019 1755 1755 7 3 o.5 0.75 8.75 1755Diese grops El 0-c Poglish El-ctrio-70 1970 L 649 1067 11 1 - 5.5 5.5 10)6.70Pouts Pe-icility Poudies ID0 315.S7/EC 1972 US$ 2700 2700 15.0 3 10.75 4.0 400 1575.0C-oon Peibitlity Studies 000 412 Si'/EC 1974 11$ 1500 10500 25 10 0.5 1.0 2.0 1500.0lunyllbobest F-oobtlity StudIes IDB 690 PP/IEC 1977 us$ i60o i6oc, 20 5.5 P.5 0.0 2.5 1.6oC.oPios.oyko Pro/co IBR 304 IF/ITC 1970 u09$ 16000 16200 25.5 5 0.75 4.0 . 37.Pluono-oProjet TDB 19 0D/EC 1972 us$ 9960 7593 50.0 10 5.5 0.5 5.5 7593.0Ou-gopolo Them Plout Jopou Oo---to 1975 7 1690000 13195 20 7 - 4.75 4.75 13195.0Socogopoio Thema Ploot Euib.sok Jopan 1975 5 0350000 11316 9 2 0.5 7.5 7.5 6466.29Tonohd Pro 1otOcdi-o leit-elod 1973 00 5000 2970 12 2 - 2.75 2.75 1436.0O
cohi ProstStudios Robesoo Corp. 1976 PP C 4200 0612 9 2 -2.75 2.75 1722.860Pou letlloto Galileo Med. 1975 009 513 503 9 - - 7.5 7.5 232.41,
Soflonuctog l~~~~~~~~iticoro Ootl. OnO -k . 1977 U19 30500 '30000 13 3 0.5 O.875%+Lib-r 0.5
75%$i-ltr 30000pfl-urit Citicorp Chose p. 1977 00$ 20000 20000 13 3 0.5 O.
875%oLib-r C.
975%oLib-r 20000
Isooc, Oulodo 2 Kreditno-to1t 1975 DM1 20000 10419 30 1O 0.25 2 lo4SSscr lOido P Mtitsulnio 1970 0 6357759 31091 13 3 - 7.5 75 203.
Eltotioo Mooto-Po-ooic/o Pa-el Scoffs 1976 BP 6937 216 5.5 - - 8.75 9.75 74.671/L S.oit-o-Ouyoqil CIticorp Mitoubiski 1979 00$ 6919 4913 13 3 0.5 0.875%olib-r 0.875%oLlbor 6919.0P/L Qiitc-G,oynqil Cdito-p 90teoi 1979 00$ 4009 4040 13 3 0.5 0.O75%oLib-r O.875%obi-u 4009.0o/: Quo-=yql nO of c-sion undo 1979 P09 G.OOsB 1000 11 2.5 0.5 1.125%cLibo- 1.12S%cliluc 10000.0Pou D,lEo-trifi-otioo Balf-u Be-tty 1977 L 097 '706 5.5 0.5 - 7.05 7.05 42o460
-ectoc Milogro, Incbi Book of Locdo- 197 s00 2250 0250 4 - 5i$rir 1%tio 1070Vo-i-u lOs 1976 0/. 300000 120 - 10 10 5142.86Icooki ProiccFo.. Ponc 1976 5/. 3,3445 1339 10 2 1 6 6 1003.50Sor co City Pou 1977 u09 00000 00000 7 ? ~ 0512%Lb .5li- ioooIkorr-Epiclrirhi pobstatioo Prom Bover 1977 DR1. 2296 1196 7 2. 0. 1,58 lo l.Pte95r 600.0S.oOctrl Ooevddo Suostotioc IlE oST/A 1977 009 $ 794 1 790 0.25 9 9 4796.0
ocos A-B Co.totuti-o Iotectic SBoque 1970 us$ 00000 21000 9 6 0.5 1.125%.Oibor l.l12%oLlO or 20000.0ooEro.ldoo Project tank of A-oion 1979 00$ 513000 13200 iS 3 0.5 o$clibor 1%.Lib-r 13000
Vorlo- 10 991 9 500000 200000 10 2 1 11 11 200llSto. Soon Ito Tucbion Lloyd.c Buou 20 1990 US$ 200000 20300C 11 3 1.5 0.75%.Libur 0.759cli-0 0WOODNoti-cl T-tdsois-o ncs,'s Mitiosu~hii Ban 1960 US$ i9oo 1900 7 2 0.5 0.75%oLib-e 0.75%oLi00r 1900
P-uto A6. Coot-otui- ID0 271 iEC/D 1974 009 33500 33500 20.5 7 0.25 9 9 o6dioP-tcs 6. R. C-otrutioo. 110 611 0F/E0 1574 U$ 16WOo 16500 40.5 10.5 0.5 1 2 5586Pouts A. P. Ellstord Rohoio equipment GIE 1977 119 i6000 i6ooo i6 5 0.125 7.75 7.7 Bo"Pouts Pis-scic se-heeis equipse- Eoichk Jopn 1970 7 0500000 11300 11 5 0.5 9 9 3172P-tus A. B. C-outiuclc Doproil. 1979 01$ 40000 40000 15 5 - 9 9 16700P-ute A. B. lectric _h-tnO eqoipmees K-edisousoo 1979 DMI 36000 17712 13 4 0.05 a a Pou.to A. B. Compl-c 001.411 IDB 038 0979 00$ 500.00 50000 10 5.s 0.5 0.75%~lidb- 0.75%4110cr 10000Isot- S.lodo 3 Ovesea E. No,d 1977 0 91oo0o0 39952 P0 7 - 5 747
ser-1don Project 051 1979 009 50000 50000 13 3 . 7.5 C 5 35199Iorr- ftcl-hiokm Oubtototlo SIP It/i 1977 01$ 1094 1096 9 4.029095
Pouts Orouuslsetoo syotec IDA 323 00/00 ~~~~~1977 00 500 200 01.25 9.6 0.6 SooiINtoi-nI T--sssi-io Sysoon Mitsubishi Corp. 1990 00$ 7111 7111 9 0.5 - 7.5 7.5 5390Noti oo.l T--ssiesion Sysoe Gciodlep Scots 1990 019 2387 2387 10 2 0.375 7.5 7.5 -Illu-hI Elotcit t4okhnio eqoipasos Sete Pool Corp. 1977 SWP 30000 17230 8.5 4~ - 6 6 11123Eleotelcal Equip-t El SO--RsErn..ldo tioted Kiogd.s 75 1975 L 5100 12115 2 5 6 9 3 11410P-utsloMorc-/-t F-cp-o 1990 S/. 1200000 4900o 10 3 1 6 Rooter PI- F-opre 1979 0/. 33525 1341 10 4 1 6 6 120
lusCorsloo-t ReSe 1990 E/. 407000 16290 13 3 1 6 6-Pucal Olecocilicoulos PoolsB- of America 1990 us$ 30000 30000 10 3.5 0.25 P. 75%oLb-ho 0.75$ol1,b-r 16000
Pouts Coo,oct-tjo r-dit-utalt Sock 1990 1IN 5ooc 2605 10 5 0.25 9 9 -7odos Plaut vaiou Iciooot 809 D980 00$ 50000 10000 9.5 1 0.5 0.75%4Lilo- 0.75%oLiboc 965.41oot-r Pla (Bovetory) Ponap-e (I-v.) 1979 S/. 35000 1lso 10.0 5 1.0 6 6 9
II. PROPOSOD AND P=RE LOA100
Fout 0.0 C-sr-tio- Co-scii B-nko 1991 00$ 50000 7 3 0.5 16.75 1/16.75 3/7 Co..c.co-i- 1O 982 us5 1200000 20 5 0.75 9.0 9.0
louts 0 Boosucuctiot Su~~~;ppli-c 1993 019 90300 12 5 0.5 9.o 9.oRorosl-Risrflootloc IDB 1991 us$ 17000 40 10 0.5 2.0 2.0NTP Phsse C World Os.k 1991 019 100000 17 4 0.75 10.0 10.0Agoyan P-ojst Bock of Spio 1991 U1$ 11589 12 4 - 9.3 8.3Agopot Pro/rot Jopo Oc-rse-t 1991 us$ 31507 25 7 -7.5 7.5A0oyan Pro/cot ABk of Brasl i99i us$ 9300 14 2 -7.5 7.5Agoyan Project RIEO-Crdit 1901 us$ 3500 14 4 - .5 7.5Agdyc Project Ioe oo ak (5) 1992 00$ 94061 7 4 0.375 16.rs5j 16.975 9
P'co Prjc1osuoo ok() 1931 us$ 56600 10 4 0.375 16.75 V16.975/Agopo PrIoject Itlsiba - -ooret 1991 009 1.1900 16 4 -7575
Bool P.lvP PosIiss Ssnk 1991 003 16692 16 3- 6.0 6.oIso Pr/ct-rdiooo-Isl 1991 019 5009 15 5 0.25 9.0 9.0
Suborsnsslooloo 1) Pu~~~~~ppli-r 1991 019 10000 12 3 0.5 9.0 P.0P1 0cc Prooct OCOS i99i 019 6900 9 2 0.5 7.75 7.75NTSP Phase P 00d i crGrsosot 1991 019 9500 i6 2 - 7.5 7.5V0S Phoes B e. Bank i99i P1$ 42000 12 4 -16.75 i/ 6.75 V/
NTust e 0Butum 1991 U1$ 05500 144.167V1699Mote PF(Ivetoy)P0 RE 1992 us$ 455 10 3 106 6
Poote-M.c Spleo1994 009 166950 12 5 0.5 P.O 8.cPouts-Macar Ic--es Socks 1996 u0s 166950 10 5 0.5 16.75 9/16.97959Tnchi Supplte- 1984 019 004900 12 6 0.5 9.0 9.o 4
.oscti Counerc~~~~~~~-- i.1 B-uo 1996 0192150 10 6 0.5 1.75 9/ 6.975 3/Tral. Pl-ctrifi-ocioc Supplier 198o U19 12630 20 6 0.5 P.o 0.0NTS Phses D Supplier 1992 119 46900 12 3 0.0 S.c 9.oRTDtPlus 0 Coecirol1 ISoko 1992 01$ 46900o 10 3 5.5 16.75/ 1-6.975 9PS'. osis (o2)) Pupplle- 1982 00$ 189977 121 0.5 9.o 9.0Distcibvttioo Oupplls- 1982 us$ 99330 12 3 2.5 9.0 9.0
I/ 3/4 0VER LI201: ASSUMED DLSIBR 16$
3/' 1/0 OVEP L.IBRO: A0S/UD LBOOR 16%
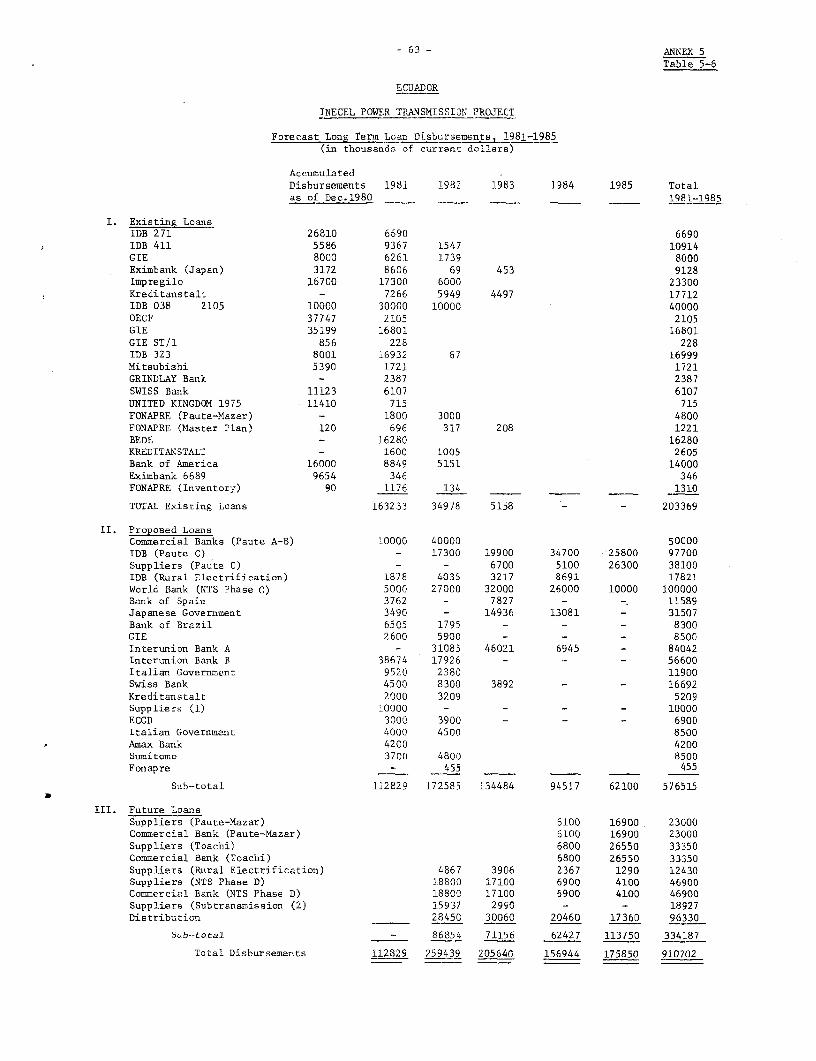
-63 - ANNEX 5
Table 5-6
ECUADOR
INECEL POWER TRANSMISSION PROJECT
Forecast Long Term Loan Disbursements, 1981-1985(ir. thousands of currant dollars)
AccumulatedDisbursements 1981 1982 1983 1984 1985 Totalas of Dec.1980 1981-1985
I. Existing LoansIDB 271 26810 6690 6690IDB 411 5586 9367 1547 10914GIE 8000 6261 1739 8000Eximbank (Japan) 3172 8606 69 453 9128Impregilo 16700 17300 6000 23300Kreditanstalt - 7266 5949 4497 17712IDB 038 2105 10000 30000 10000 40000OECF 37747 2105 2105GIE 35199 16801 16801GIE ST/1 856 228 228IDB 323 8001 16932 67 16999Mitsubishi 5390 1721 1721GRINDLAY Bank - 2387 2387SWISS Bank 11123 6107 6107UNITED KINGDOM 1975 11410 715 715FONAPRE (Paute-Mazar) - 1800 3000 4800FONAPRE (Master Plan) 120 696 317 208 1221BEDE - 16280 16280KREDITANSTALT - 1600 1005 2605Bank of America 16000 8849 5151 14000Eximbank 6689 9654 346 346FONAPRE (Inventory) 90 1176 134 1310
TOTAL Existing Loans 163233 34978 5158 - - 203369
II. Proposed LoansCommercial Banks (Paute A-B) 10000 40000 50000IDB (Paute C) - 17300 19900 34700 -25800 97700Suppliers (Paute C) - - 6700 5100 26300 38100IDB (Rural Electrification) 1878 4035 3217 8691 17821World Bank (NTS Phase C) 5000 27000 32000 26000 10000 100000Bank of Spain 3762 - 7827 - - 11589Japanese Government 3490 - 14936 13081 - 31507Bank of Brazil 6505 1795 - - - 8300GIE 2600 5900 - - - 8500Interunion Bank A - 31085 46021 6945 - 84042Interunion Bank B 38674 17926 - - - 56600Italian Government 9520 2380 11900Swiss Bank 4500 8300 3892 - - 16692Kreditanstalt 2000 3209 5209Suppliers (1) 10000 - - - - 10000ECGD 3000 3900 - - - 6900Italian Government 4000 4500 8500Amax Bank 4200 4200Sumitomo 3700 4800 8500Fonapre - 455 455
Sub-total 112829 172585 134484 94517 62100 576515
III. Future LoansSuppliers (Paute-Mazar) 6100 16900 23000Commercial Bank (Paute-Mazar) 6100 16900 23000Suppliers (Toachi) 6800 26550 33350Commercial Bank (Toachi) 6800 26550 33350Suppliers (Rural Electrification) 4867 3906 2367 1290 12430Suppliers (NTS Phase D) 18800 17100 6900 4100 46900Commercial Bank (NTS Phase D) 18800 17100 6900 4100 46900Suppliers (Subtransmission (2) 15937 2990 - - 18927Distribution 28450 30060 20460 17360 96330
Sub-tota1 - 86854 71156 62427 113750 334187
Total Disbursements 112829 259439 205640 156944 175850 910702

- 64 - ANNEX 5
Table 5-7
ECUADOR
INECEL POWER TRANSMISDSION PROJECT
FORECAST LN0G TERS DEBT AMORTIZATION SCHEDULE
(in thousands of current dollars)
1981 1982 1983 1984 1983
I. INECEL: Existing Foreign LomssAID518-023 22 22 22 22 22518-025 23 23 23 23 23518-035 - - 114 114 114British Govsronest1966 95 95 95 95 951969 32 32 32 32 321972 36 36 36 36 361973 (1) 328 328 328 328 3281973 (2) 143 143 143 143 1431975 - 638 638 638 638Etinbonk (USA)2200 302 302 302 302 -6063 290 290 290 - -6349 - - 439 439 4396689 - 1250 1250 1250 1250Engligh Electric (70) 107 - - - -IDB315 225 225 225 225 225412 - - - - 100492 - - 107 107 107314 810 810 810 810 81018 CD - - 190 190 190271 - 2577 2577 2577 2577411 - - - - 550038 - - - - 10000323 - - 1667 1667 1667Japanese Govern=ent - - 1014 1014 1014Etinbank (Jap so)(a) 1617 1617 1617 1617 -(b) - - - 2050 2050S.it.srland 287 287 287 287 287GIE:Pacts - - 1455 1455 1455Svbstations (1) 299 299 290 299 299Es.eraldan - - 5200 5200 5200Subutations (2) - 217 217 217 217Inpragilo - - - 4000 4000Kteditan tultPacts - - - 1968 1968Estero 5alado N'2 - - - -Rural Electrificatio- - - -OECF - - - - 30665i,t.ubisbiTranuniuoiou Syster (1) - 889 889 889 889Etsteo Salado N-2 3129 3129 3129 3129 3129Trtossinsi-o Syste= (2) - - 360 360 360Gcdaly Broods - - 298 298 298S-.ss Bank - 3446 3446 3446 3446Bank of AnsricaPaout - - - - 5000Sade - 1250 1250 1250 1250Es eraldas _ - 1557 1857 1857Mobe.sco 345 345 345 345 345Galileo 58 58 58 58 -City Corp. (Refisne-nt)(City Bank) 3000 3000 3000 3000 3000(Chase Manhattan) 2000 2000 2000 2000 2000(Mitsubishi) - - 692 692 692(Mitui) - - 401 401 401Pasls Truaf 37 37 - - -Balfour Beaty 141 141 141 - -Bark of London 563 563 563 - -City Bank 4000 4000 4000 4000 -Brown Boveri 239 239 239 239 -Insteunion Bank - - 4000 4000 4000Lloyd's Bank _ - - 2500 2500
Total INECEL Existing Forsigo Loans 18128 28288 46045 55569 68069
SI. IRECEL: £xEating Locol LoansFOFAPREPouts Mazar - - - 686 686YSt-r Pla:: - 224 224Mauter Plan (Invsntorieu) - - 200 200 200Toachi 167 167 167 167 167IESS.(1) 1714 1714 1714 - -(2) - - 2500 2500 2500BEDE - - - 1628 1628
Total INECEL Existing Local Lo-an 1881 1881 4581 5405 5405
III. INECEL's Subsidiari.s: Exinting LoansMissellaneous 14338 15108 13554 12042 8146
Total INECEL Existing Loans 34347 45277 64180 73016 81620
IV. INECEL: Proposed LoansIB2D - - - - 7692IDB - - - - -Suppliers and Coscercial Bsnka(Agopyn) - - - 692 692Other - - 1593 16488
V. INECEL: Future LoansSupplier Credits - - -C=erscial Banks
VI. INECEL Subsidiariss: Future Loan -
TOTAL 34347 45277 64180 75301 106492
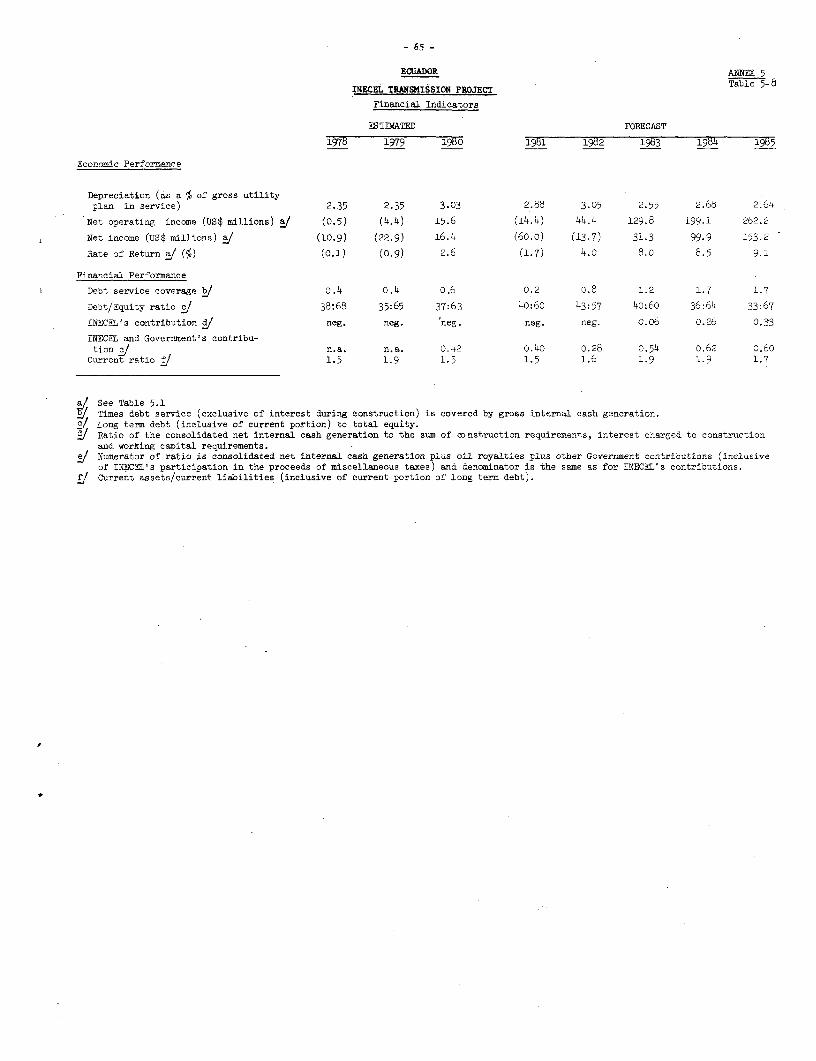
- 65 -
ECUADOR ANNEX 5
INECEL TRANSMISSION PROJECT Table 5-d
Financial Indicators
ESTIMATED FORECAST
1978 1979 1980 1981 1982 1983 1984 1985
Economic Performance
Depreciation (as a % of gross utilityplan in service) 2.35 2.35 3.03 2.88 3.05 2.55 2.68 2.64
Net operating income (uS$ millions) a/ (0.5) (4.4) 15.6 (14.4) 44.4 129.8 199.1 262.2
Net income (uS$ millions) i (10.9) (22.9) 16.4 (60.0) (13.7) 31.3 99.9 153.2
Rate of Return a/ (%) (0.1) (0.9) 2.6 (1.7) 4.0 8.0 8.5 9.1
Financial Performance
Debt service coverage o 0.4 o.4 o.6 0.2 0. 8 1.2 1.7 1.7
Debt/Equity ratio i 38:68 35:65 37:63 40:60 43:57 40:60 36:64 33:67
INECEL's contribution neg. neg. neg. neg. neg. O.Ob 0.26 0.3-3
INECEL and Government's contribu-tion j n.a. n.a. 0.42 o.40 0.28 0.54 0.62 c.60Current ratio 1.5 1.9 1.5 1.5 1.6 1.9 1.9 1.7
a See Table 5.1Times debt service (exclusive of interest during construction) is covered by gross internal cash generation.Long term debt (inclusive of current portion) to total equity.Ratio of the consolidated net internal cash generation to the sum of construction requirements, interest charged to constructionand working capital requirements.
i Numerator of ratio is consolidated net internal cash generation plus oil royalties plus other Government contributions (inclusiveof INECEL's participation in the proceeds of miscellaneous taxes) and denominator is the same as for INECEL's contributions.current assets/current liabilities (inclusive of current portion of long term debt).
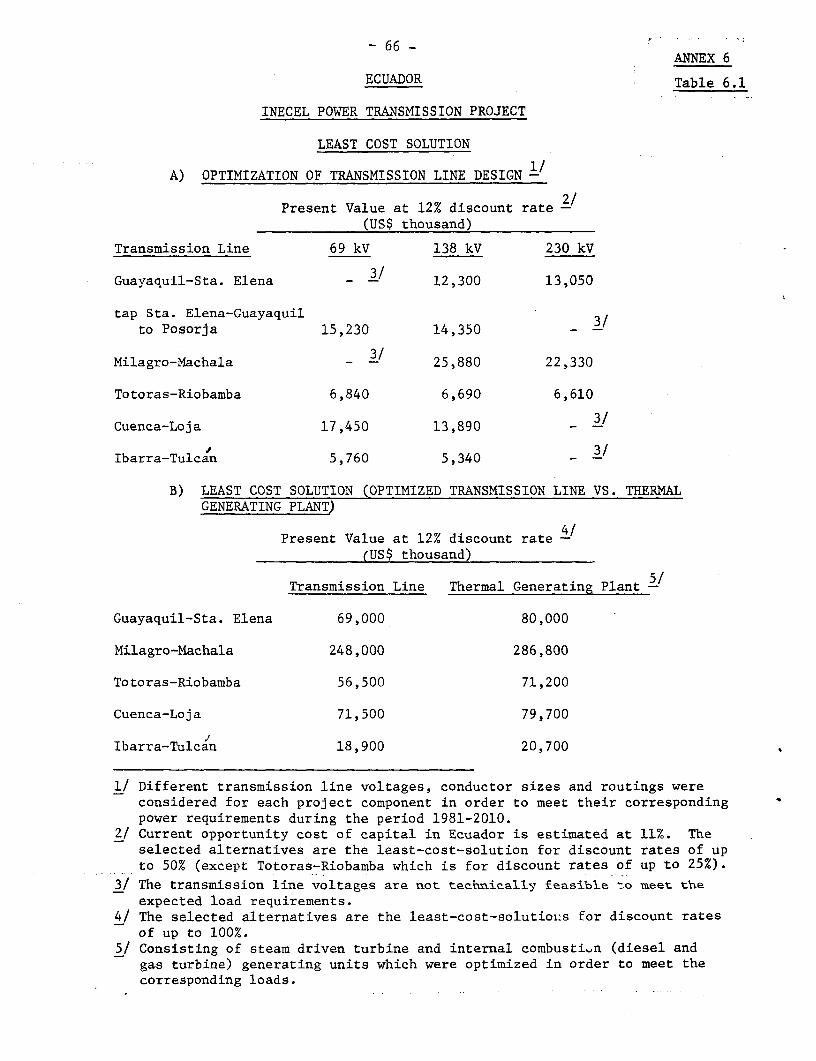
- 66 -ANNEX 6
ECUADOR Table 6.1
INECEL POWER TRANSMISSION PROJECT
LEAST COST SOLUTION
A) OPTIMIZATION OF TRANSMISSION LINE DESIGN -
Present Value at 12% discount rate 2/(US$ thousand)
Transmission Line 69 kV 138 kV 230 kV
Guayaquil-Sta. Elena 3/ 12,300 13,050
tap Sta. Elena-Guayaquilto Posorja 15,230 14,350 - -
Milagro-Machala - 3/ 25,880 22,330
Totoras-Riobamba 6,840 6,690 6,610
Cuenca-Loja 17,450 13,890 - 3/
Ibarra-Tulcan 5,760 5,340 -
B) LEAST COST SOLUTION (OPTIMIZED TRANSMISSION LINE VS. THERMALGENERATING PLANT)
Present Value at 12% discount rate -/(US$ thousand)
Transmission Line Thermal Generating Plant -
Guayaquil-Sta. Elena 69,000 80,000
Milagro-Machala 248,000 286,800
Totoras-Riobamba 56,500 71,200
Cuenca-Loja 71,500 79,700
Ibarra-Tulcan 18,900 20,700
1/ Different transmission line voltages, conductor sizes and routings wereconsidered for each project component in order to meet their correspondingpower requirements during the period 1981-2010.
2/ Current opportunity cost of capital in Ecuador is estimated at 11%. Theselected alternatives are the least-cost-solution for discount rates of upto 50% (except Totoras-Riobamba which is for discount rates of up to 25%).
3/ The transmission line voltages are not technically feasible :o meet theexpected load requirements.
4/ The selected alternatives are the least-cost-solutioljs for discount ratesof up to 100%.
5/ Consisting of steam driven turbine and internal combusti.n (diesel andgas turbine) generating units which were optimized in order to meet thecorresponding loads.
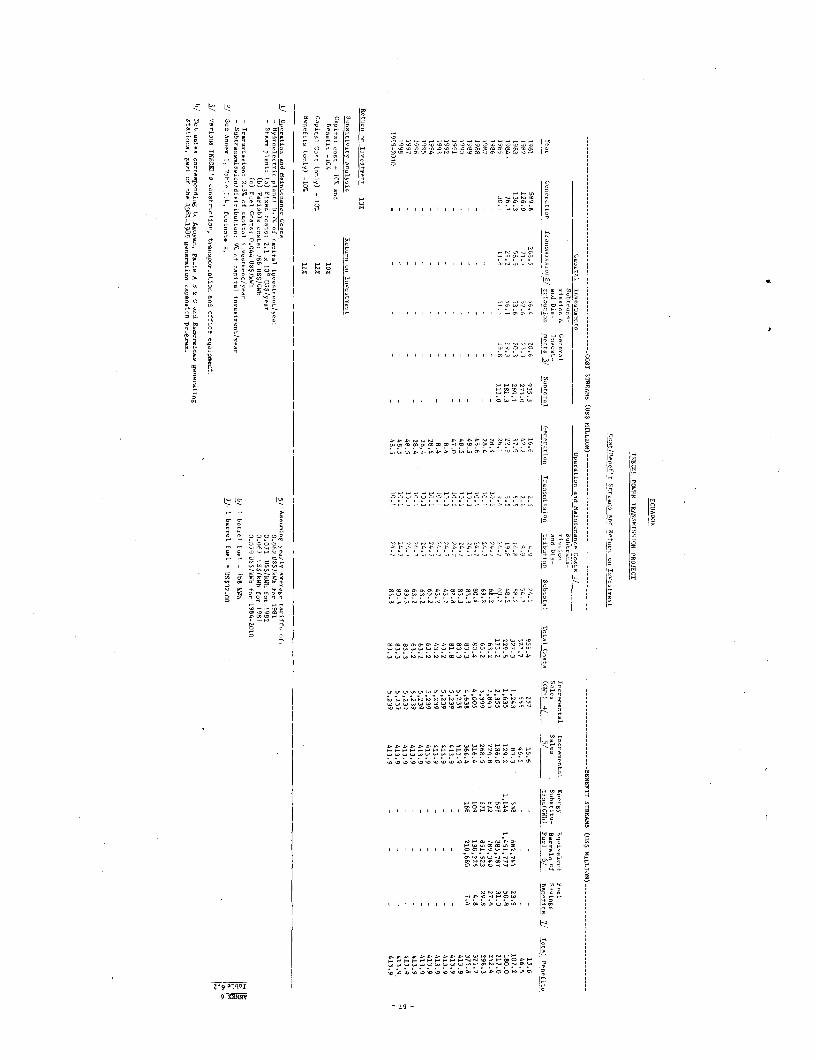
WA WA lC
a ,,,1 3 g__ ,o _C -C)-C AC)C - C 0, s,<sss
a Sg .-~CCCCC*C C)-C ° C: t( vvvl
C), A ')C)'C'A a ,-.-°C u< < =
C) BC),O B : <
C?g ) C) V 0CC o C n
CA CA O C° C )C )O'Co
C) cC) HO CACCAgA.ACAnACgCCoC C
6e g , AACC) .W CA _ C C)CA5)))C0ACCC.C)CC)CAo........ o..C _' ou C)
n 5 e: * t~~~~~~~a ) AC C CA A .C A AC C C CAV )CC)oCo-cs
Q W o 't ,<, t 2 C r a ve w = I t | s I E I | I z l O s w ~~~~~ w r D S rz C C
M A , n e _ B ,,,,,,,,,, C) AC)C)C .,, )r.-AwC) )a.)CVCrJ)'-JC) C
A~~~~~~~~~~~~~~~~~~~~~~~~~~~~~~~~~~~~A 8 C)
n~~~~~~~~~~~~CC)A)) I -rocA. -'3h I i I | | s W I | I | I I f V w w O r: O~~~~~~~~~~~~~~~ C ) C
It~ ~ ~ ~ ~ ~ ~ ~ ~ ~~~~~CCCCCCCCCCC CACC) CACCCCCC) W
M . w ~~~ o W cn Ir r~x~~~~~~~~~~~~~HCHCC ,,,,,, ,,,,,,CACC) Ow)o C
CACCA-)C'C))C)C) ACA a.ACWC)CACA'C)ACAOC) CC)C)COC)C)C) CA C
C)' 5-C)
m ~ ~ ~~~C C)).)'ACC -CC m O>X 3 w;~X r c
vsvl A/>'t->tOrI>V>> Oasm ,C _ w
rC)C).r
CACAAC-C'C ,r)C !))2 ~ ~ ~ ~ CCAAAC 2 C )ogoww n
_ lrr-…COCA'Du
~~~~~~~~~~) ) ) A A A A C C ' C C C O C ) ) A A -
;9 AI?
-9oFlFFNNv-| U21
e~~~~~~~~~~~~ £9 -oa FFFFS'SF°° V''
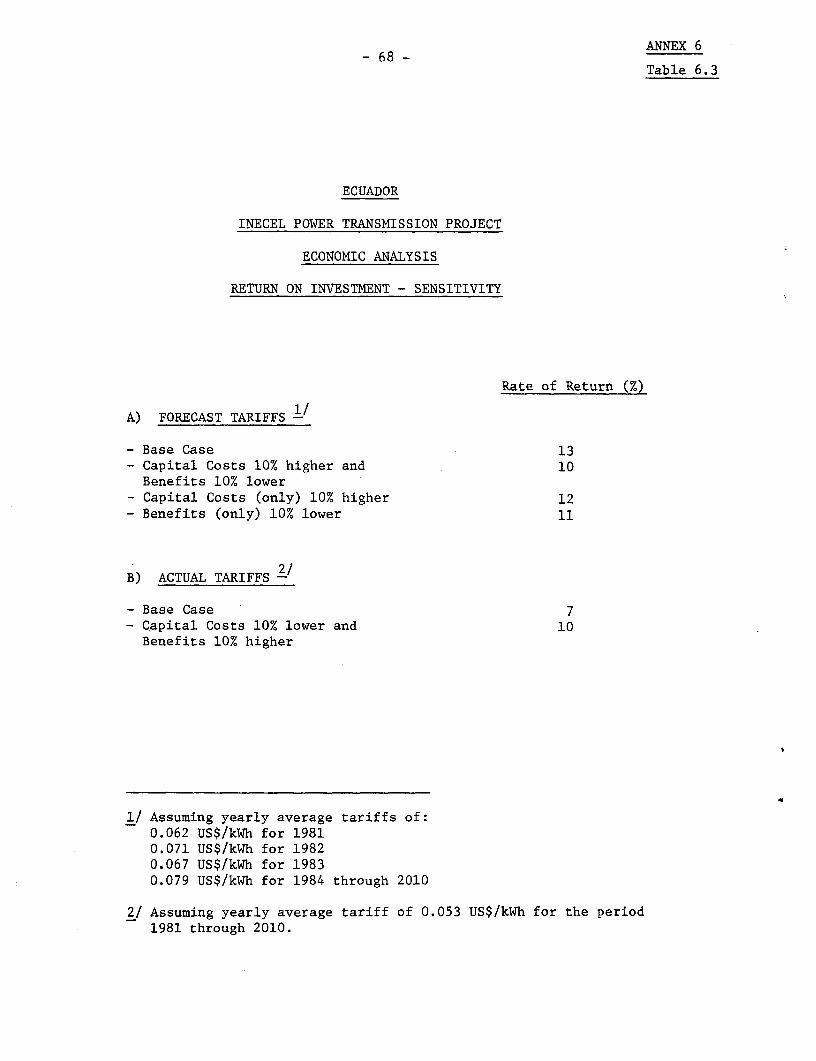
ANNEX 6- fi8 -
Table 6.3
ECUADOR
INECEL POWER TRANSMISSION PROJECT
ECONOMIC ANALYSIS
RETURN ON INVESTMENT - SENSITIVITY
Rate of Return (%)
A) FORECAST TARIFFS -/
- Base Case 13- Capital Costs 10% higher and 10
Benefits 10% lower- Capital Costs (only) 10% higher 12- Benefits (only) 10% lower 11
B) ACTUAL TARIFFS -
- Base Case 7- Capital Costs 10% lower and 10Benefits 10% higher
1/ Assuming yearly average tariffs of:0.062 US$/kWh for 19810.071 US$/kWh for 19820.067 US$/kWh for 19830.079 US$/kWh for 1984 through 2010
2/ Assuming yearly average tariff of 0.053 US$/kWh for the period1981 through 2010.
- 69 -
ANNEX 7
ECUADOR
INECEL POWER TRANSMISSION PROJECT
Selected Documents and Data Available in the Project File
A. Selected Reports on the Economy or the Sector
- Republica del Ecuador, Plan Nacional de Desarrollo 1980-1984.
- INECEL, Direccion de Asesoria Juridica, Recopilacion de Leyes y
Reglamentos, 1980.
- INECEL, Direccion Ejecutiva de Distribucion y Comercializacion,
Informacion General Sobre las Empresas Electricas del Ecuador, 1980.
B. Selected Reports and Studies on the Borrower or the Project
- INECEL, Plan Maestro de Electrificacion, 1980-1984.
- INECEL, Solicitud de Credito al BIRF, 1980.
- INECEL, Unidad de Regulacion y Tarifas: Grupos Electricos en
Servicio (1978) y Boletin Estadistico N- 13 (1978).
- INECEL, Sistema Uniforme de Cuentas para Organismos del Sector
Electrico, 1977.
- INECEL, Informes de Auditoria Externa, 1972-1979.
- INECEL, Evaluacion Economica del Programa de Expansion Electrica,
1980-1984.
- INECEL, Costos y Gastos de Explotacion de Centrales termoelectricas.
- INE, Balance Energetico.
C. Selected Working Papers
- Worksheets for financial forecasts.
- Worksheets for economic analysis.
- Worksheets for economic evaluation of INECEL's 1980-1984 expansion
program.
- Worksheets for detailed project cost estimates.

I~~~~~~~~~~~~~~~~~~~~~~~~~~~~~~~~~~~~~~~~~~~~~~~~~~~~~
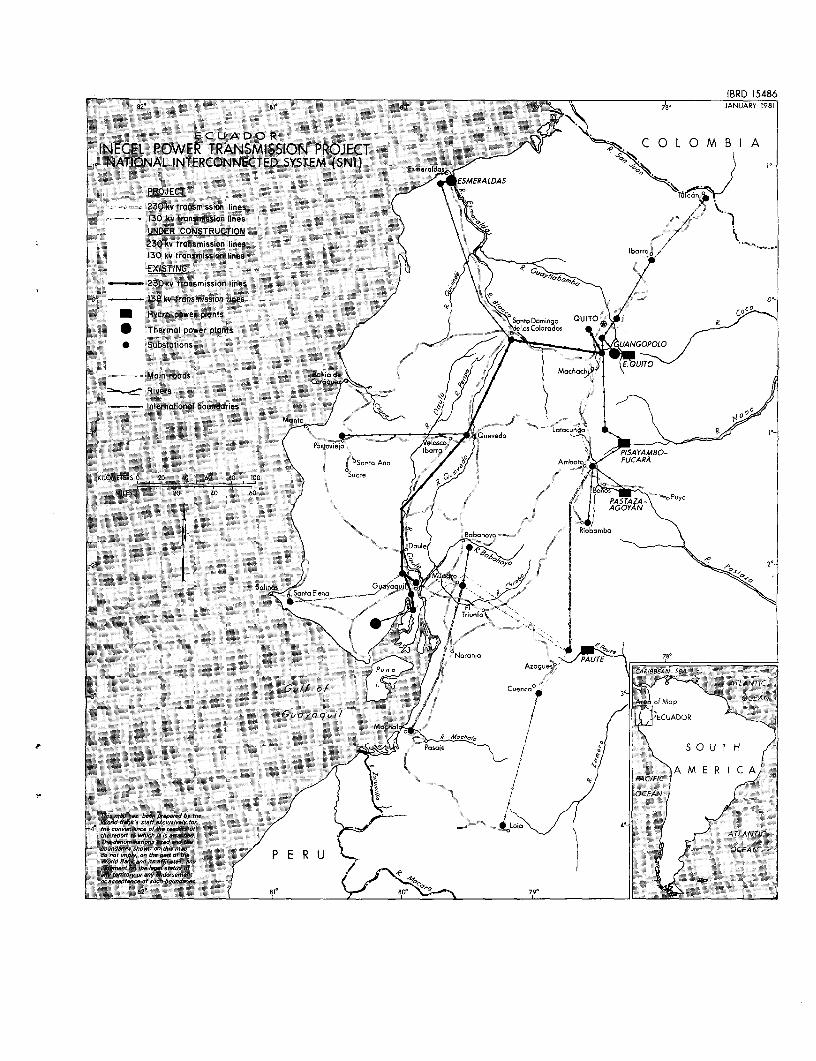
IBRD 15486I ; 82> ^\7B°' JANUARY 1981
ECUADOR C 0 L C M B I AINECEL POWER TRANSMISSION PROJECT
-. NATIONAL INTERCONNECTED SYSTEM (SNI) Es. I& I
ESMERALDASPROJECT T 6
k30v transmission lines \130 kv transmission linesUNDER CONSTRUCTION230kv transmission lines lb^rr130 kv transmission linesEXISTING G\
- 230kv transmission lines
138kv transmission lines f°
* Hydro power plants SantoDoningo Coco* Thermal power plants dlosColr^d* Substations UANGOPOLO
Main roads Baum de Mocl$a|/, -
C-'.-~ Rivers
Internationol bottndaries
tn . Latoot ' scoogo
0S-nto An. Amb.to PUCARA
KiIOtjERS 0 20 40 60 so 100 °Sucre-
MILESO i0 40 60 P SA \ Puy
Seia Snitoleo t.-Y -. +
< < 1 1 / Ii i - -~~~or-.1 18
Azog.ecP CA#188EAN S-EA
ATLANTIC
-3 )./ ofMap < OCEAN
Guayaquil 'ECUADOR
- M achaty, / | V ~~~~~~~~~mchaf t0 < - Posoje ~ <,_ | tt1 V 5 0 U T Hi
> \ / XJ f>AC/4~~~~~~~~~~%A M E R I C A
_ / 1 - I / ~~~~~~ ~ ~~~~~~~~~~~~~~~OCEflNJThi; ,,,r h ber fpModfJrJby A
-4 56.0 ,,fco. . rsf Sb ,..qr orv AEAiBVSW ny to whic it A Cd, AN,CTh& dMvm,b?~.in coed wd VS.Av7on(oe str // ). t OCEANebwtim/rttaerttth / P E R U _w
d;-tJ,Re%WV, - Om pw Aof 0. /, _: K 1-oWgtot It Mg8ink f ft.s of
Jo~sco,crtoc lice Ieofes o 79'