Embed Size (px)
Citation preview
1
Workplace Trends in Office Space: Implications for Future Office Demand
By Norm G. Miller, PhD University of San Diego [email protected]
Forthcoming in the Journal of Corporate Real Estate
Abstract
Purpose - This study examines the trends in space per office worker and the influence of a
number of factors on the ability to reduce space per worker. These trends are important in that
they impact future office demand along with property values.
Methodology – Using both survey ane empirical data a simulation model is used to examine the
impact on space per worker over the course of a typical lease. Factors considered include the
length of lease, the worker growth rate of the firm, turnover and time to fill positions, the type of
organizational management hierarchy, whether dedicated or non-dedicated space is utilized and
firm policies towards working out of the traditional office.
Findings - Space per worker will continue to decline over time, yet collaborative work
environments and the effects of traditional management and cultural momentum suggest that
downsizing will take time. Counter to the initial hypothesis growing tenants do not over-
consume space in the early years but rather tend to renegotiate leases when growth spurs the
need for more space.
Practical Implications – Forecasters of office space demand must input an estimate of the
growth in professional employment and then apply a space per worker assumption. This
assumption in most markets will be declining, by as much as 30% over several years.
Washington DC is already being affected by downsizing, yet most markets with reasonably good
economic growth will be able to offset most of this transition to more intensively used space.
Originality/Value – This is the first paper to try and reconcile the views of commercial real
estate owners and operators with those of corporate space planners, who both have opposite sides
of the same lease. It is also the first to point out the explicit reasons why downsizing efforts are
sometimes not as effective as expected.
Draft: February 17, 2014
Keywords: Workplace trends, Space-per-worker, Office demand, Space planning, Shadow space,
Worker churn, Space efficiency, Future office demand
2
I. Introduction and Background
Office space demand estimation is an important topic. In the US alone office inventory
represents over 12 billion square feet (111 million square meters) of space and $1.6 trillion U.S.
dollars in value. (Florance, et al 2010) Office space demand is driven by professional
employment trends and is especially sensitive to space requirement assumptions. Other factors
beyond the number of employees influence space demand including, but not limited to,
workspace utilization levels, relative rent levels and cycles, tenant type, occupant employee
turnover, firm growth rates and culture. In many office demand models we simply assume 150,
200 or 250 square feet of space per worker without any solid evidence for such an assumption
other than sketchy data and conventional wisdom.
If you ask a corporate real estate manager or a human resources manager they may tell you the
target for their firm is 100 square feet per worker (9.29 square meters) or even less. The US
Government Services Administration (GSA) has been able to reduce space per worker at its
Washington DC offices to less than 85 square feet per worker. We already witness much lower
figures in Asia and the more expensive European markets than in the US. Firms that have
embraced shared standardized space not dedicated by rank, and not dedicated to specific
employees, using shared digital cloud style file storage systems are, in fact, able to get by with
much less space per employee. However, these low targets per worker are only possible when
the firm is able to match its leased space with a predictable number of employees spending a
predictable amount of time in the office. Firms that are growing or shrinking or experiencing
significant turnover struggle with matching fixed leased space with current needs. In fact, one
reason US space per worker figures are so high is because so many firms don’t last more than
several years. They go out of business, split into multiple units, merge with other firms and this
business survival turmoil adds greatly to the space per worker results as leases hold firms to
space than no longer matches their needs. These points will be demonstrated using a simple
simulation model.
The estimate of office-using employment growth rate is no more or less critical an assumption
for office demand estimation than the space required per worker and at the same time, the
disparity of assumptions we observe in the market is baffling. More refined office demand
models will use space per worker by industry sector with a forecast of the growth by each sector
for each geographic market. Often the planning decisions boil down to a reasonable guess on the
space requirement per worker and how important it is for everyone to have space. Some firms
will allow employees to work at home, libraries, coffee shops and locations known as “third
work places” when they run into 100% utilization rates. Other firms will rent temporary space
for overflow demand. These issues will be addressed in more depth later in the paper. One
minor but significant reason we find a discrepancy in the amount of space assumed to be
required per person is because of terminology, as generated and used differently in the worlds of
space managers and asset managers, but this only explains about 16% of the difference. For
example, IFMA, the International Facility Management Association focuses more on usable
3
space, and netting out encroachments, would calculate the average RBA, rentable building area,
as 84 percent usable. Thus, what a developer may call 200 square feet per worker using RBA is
only 168 square feet per worker of useable space to a facility manager.
Below is a discussion on US national office space per worker trends compared by various
geographic and industry metrics as additional background.
Space Per Worker Trend Evidence
If we only look at the square feet per worker on new leases where the tenant moved in within the
last 90 days, we see a US national average in late-2013 of 183 square feet. This figure is far
below the historical US figures running well above 250 square feet per worker on average for
the last few decades, according to CoStar data. (The CoStar Group includes data on all major
markets in the US and uses a staff of some 1500 employees to verify and track data on many
attributes of leases and buildings.) Newer modern buildings allow more efficient use of space,
especially when built-to-suit for a particular tenant. As the lease ages, the amount of space
leased and the number of workers in the space generally changes with the result that the space
per worker climbs. As second generation tenants replace the first generation tenants, it is often
more difficult to use the space as efficiently, and this is the case for most smaller firms who
cannot, on their own, drive new supply in the market. Some firms grow and some shrink and
some are able to negotiate expansions more easily than contractions, especially in soft markets.
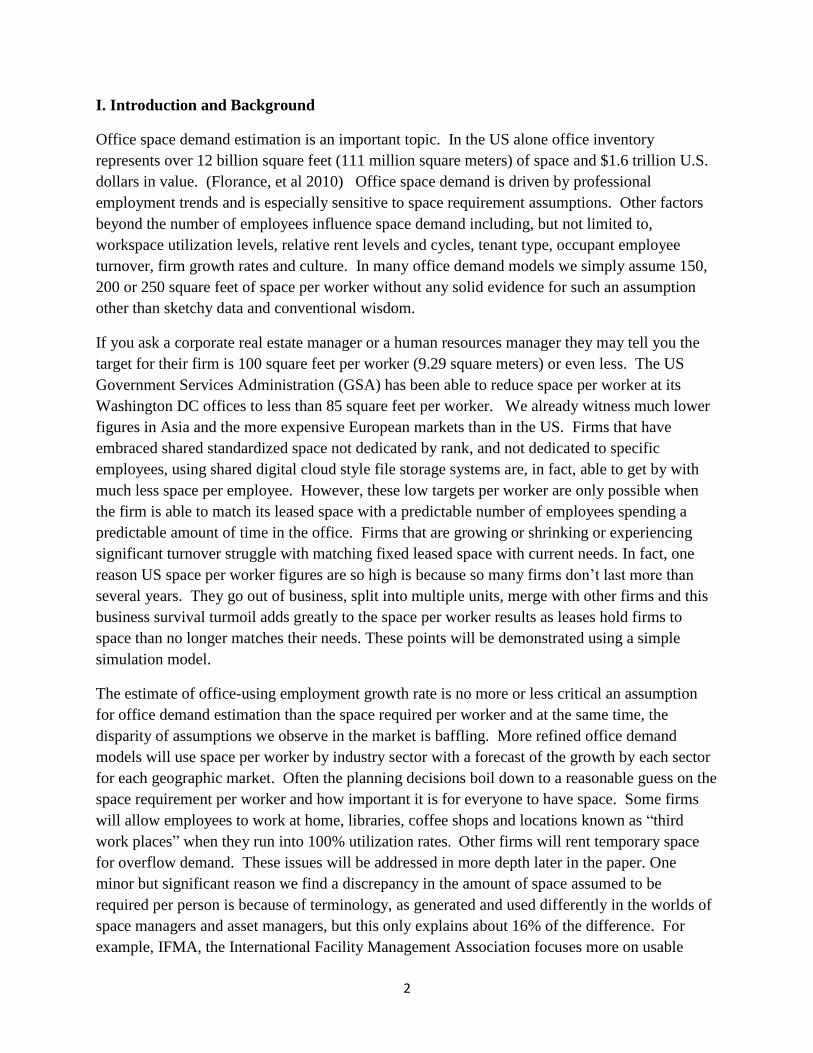
As of late 2013, on leases close to expiration the average space per worker is often double the
estimate for new leases, well in excess of 300 square feet per worker. Newer firms and start-ups
squeeze more people into the same space while older firms can’t downsize until leases expire.
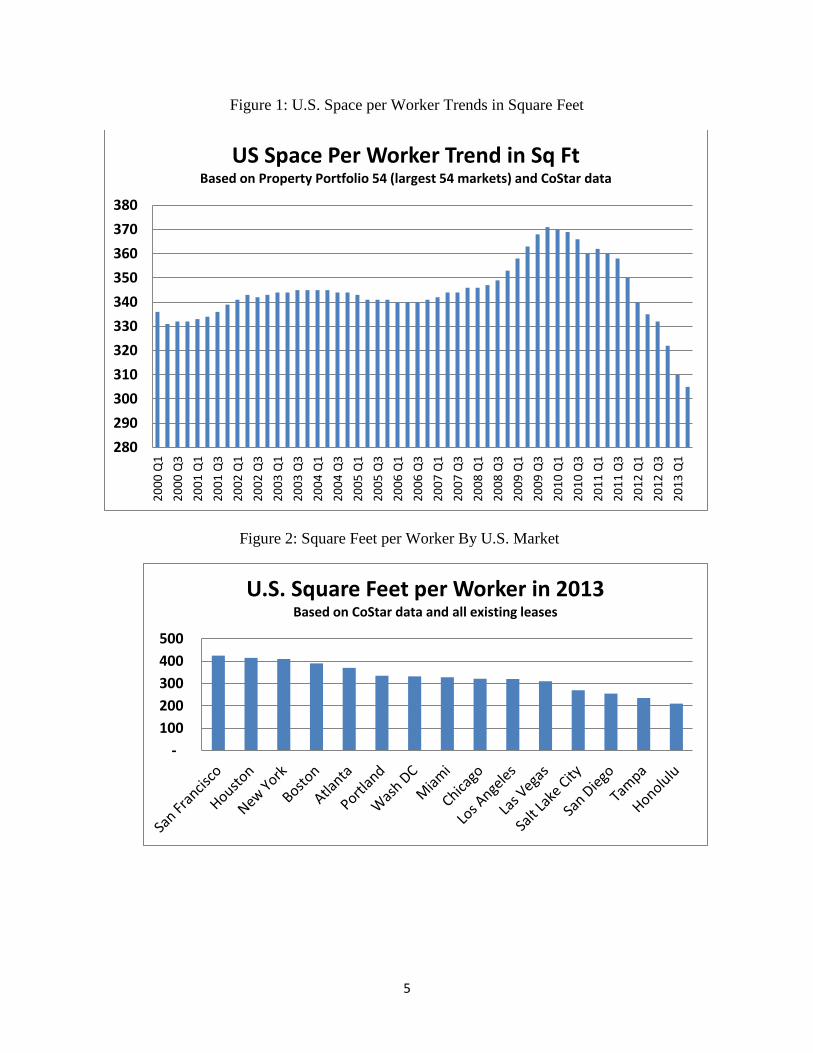
This might help to explain why the average square feet per worker shown in Figure 1 is so much
higher than the figures suggested by corporate real estate executives or facilities managers.
Figure 1 is based on RBA, rentable building area, and not the usable space that is used by the
corporate real estate world. Still, when we do not discriminate by when the lease was signed,
and simply look at how much space the average tenant occupies, the figures are quite large
compared to stated goals.
In soft economies we would expect a fair amount of shadow space. Shadow space is leased but
not occupied. Since labor costs matter much more than occupancy costs, by a factor of
approximately 10 to 15, most tenants are able to honor their leases until the leases expire and pay
for more space than they actually need. The extra space also provides a convenient option to
expand and hire more workers without the need to move. So we should expect to observe
significant extra space in weaker economies, when rents seem to be bargains, and we do. When
space per worker trends are climbing it usually suggests that tenants have not had the chance to
downsize yet and are awaiting either the expiration of the lease or simply riding out the weak
economy with extra space.
4
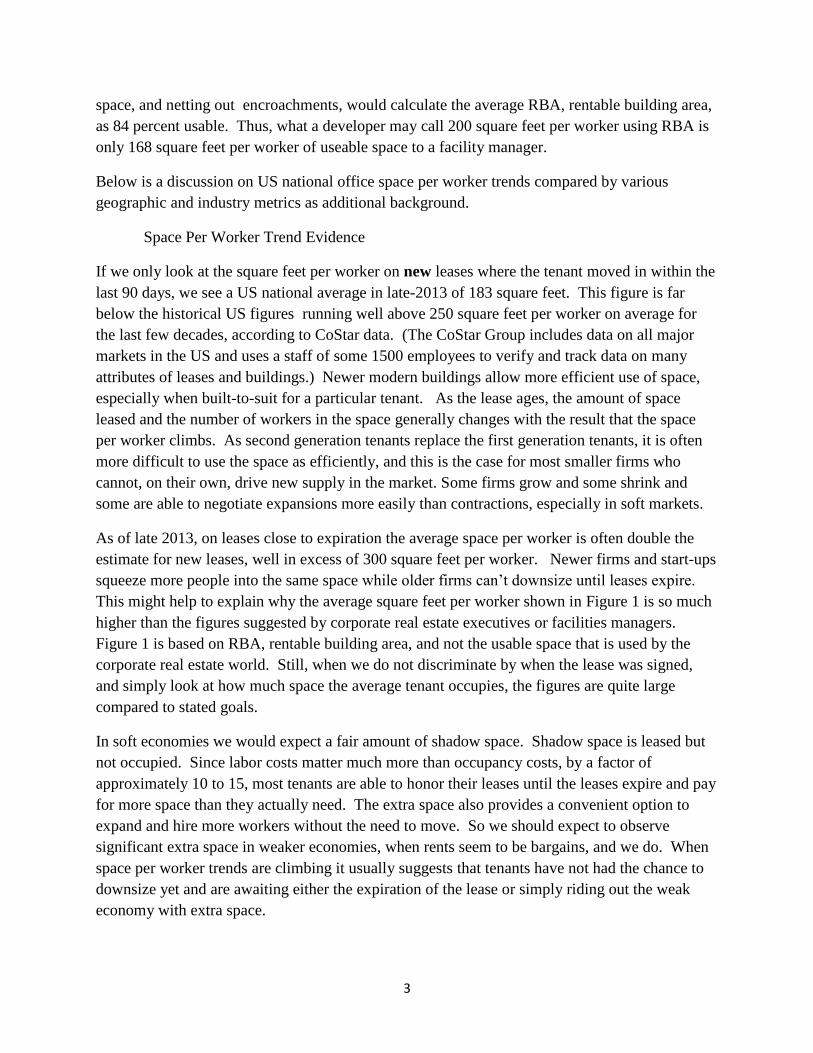
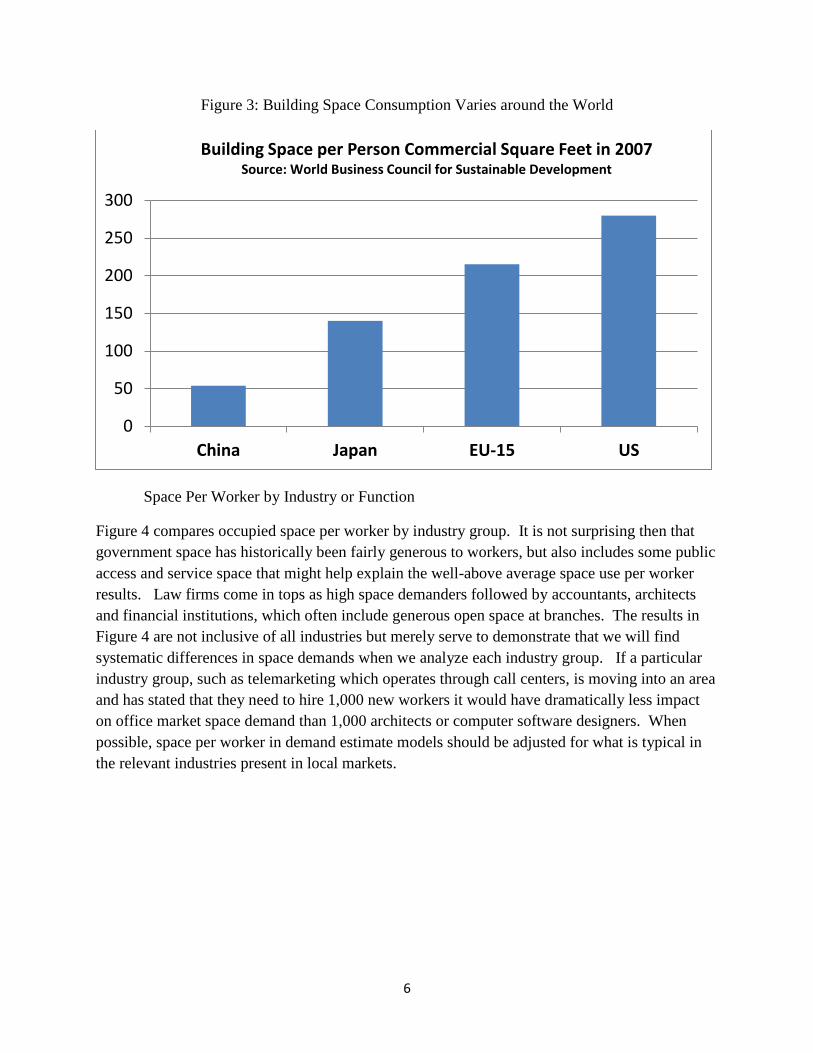
Figure 2 is a sample of averages pulled from mid-2013 from a sample of various cities. Note
that while we see more space per worker in the larger cities like New York and Boston, these
markets also have more shadow space, as of the point of the survey, compared to smaller
markets. One other bias in the square foot per worker data is that in the larger cities where we
observe retail space on the ground floors, this space is classified by CoStar as “office” and not
retail space, so that there is a slight upward bias in the measurement, especially in large dense
cities. Certainly this is insignificant for the nation as a whole, but for cities like New York, San
Francisco and Boston it may mean as much as a 5% upward bias helping to explain why in
Figure 2 we see larger numbers than might be expected. Only Honolulu in this survey is close
to 200 square feet per worker as of mid 2013, and Honolulu is an extremely supply-constrained
market. We also know that in the very expensive markets of London and Hong Kong the
average space per worker is on average much smaller than the figures shown here, so we should
not presume that larger, more expensive cities always require more space per worker. Mark
Hickey and Aaron Jodka, Senior Economists from PPR (Property Portfolio Research, a division
of CoStar) suggest that “we observe more high-paid jobs in markets like New York and Boston
compared to smaller cities and so the space allocated per person is larger while back-office
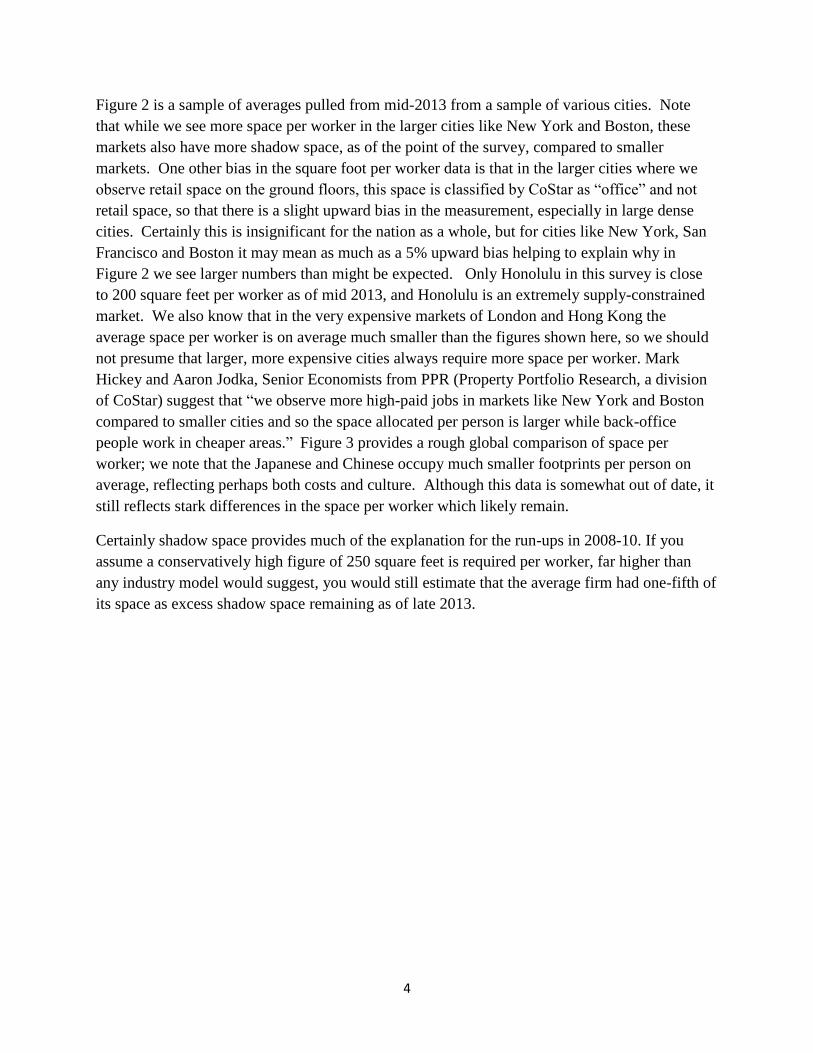
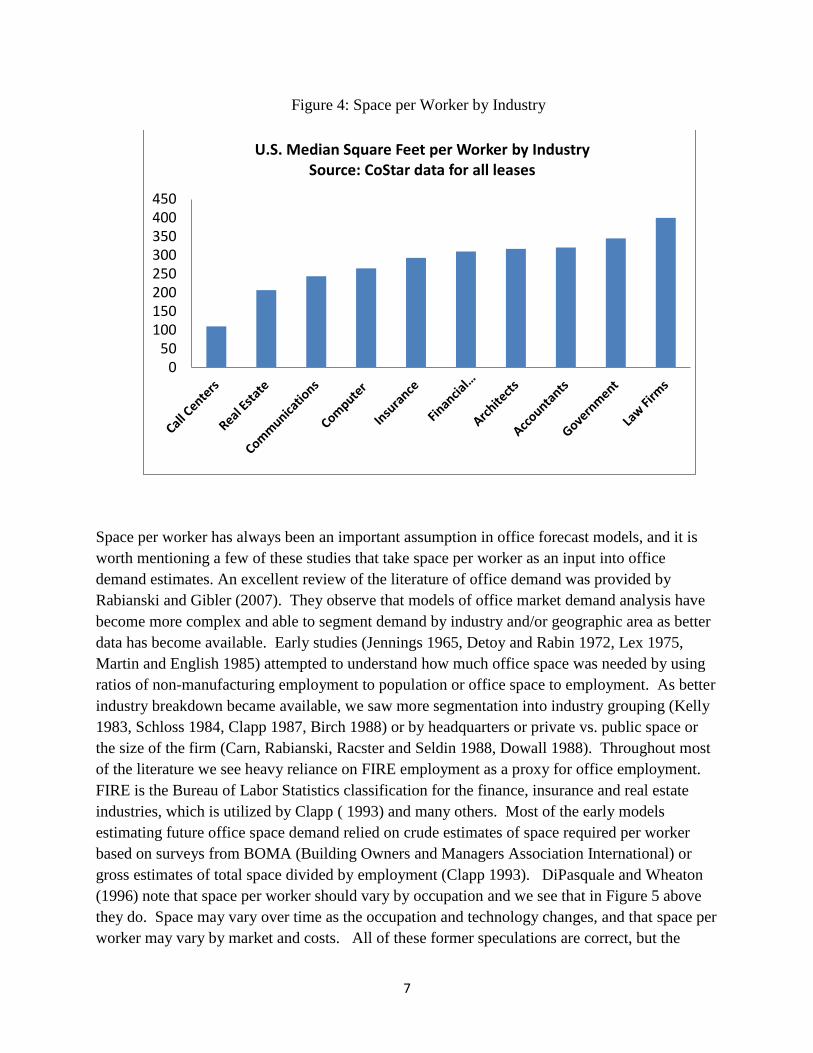
people work in cheaper areas.” Figure 3 provides a rough global comparison of space per
worker; we note that the Japanese and Chinese occupy much smaller footprints per person on
average, reflecting perhaps both costs and culture. Although this data is somewhat out of date, it
still reflects stark differences in the space per worker which likely remain.
Certainly shadow space provides much of the explanation for the run-ups in 2008-10. If you
assume a conservatively high figure of 250 square feet is required per worker, far higher than
any industry model would suggest, you would still estimate that the average firm had one-fifth of
its space as excess shadow space remaining as of late 2013.
5
Figure 1: U.S. Space per Worker Trends in Square Feet
Figure 2: Square Feet per Worker By U.S. Market
280
290
300
310
320
330
340
350
360
370
380
20
00
Q1
20
00
Q3
20
01
Q1
20
01
Q3
20
02
Q1
20
02
Q3
20
03
Q1
20
03
Q3
20
04
Q1
20
04
Q3
20
05
Q1
20
05
Q3
20
06
Q1
20
06
Q3
20
07
Q1
20
07
Q3
20
08
Q1
20
08
Q3
20
09
Q1
20
09
Q3
20
10
Q1
20
10
Q3
20
11
Q1
20
11
Q3
20
12
Q1
20
12
Q3
20
13
Q1
US Space Per Worker Trend in Sq Ft Based on Property Portfolio 54 (largest 54 markets) and CoStar data
-
100
200
300
400
500
U.S. Square Feet per Worker in 2013 Based on CoStar data and all existing leases
6
Figure 3: Building Space Consumption Varies around the World
Space Per Worker by Industry or Function
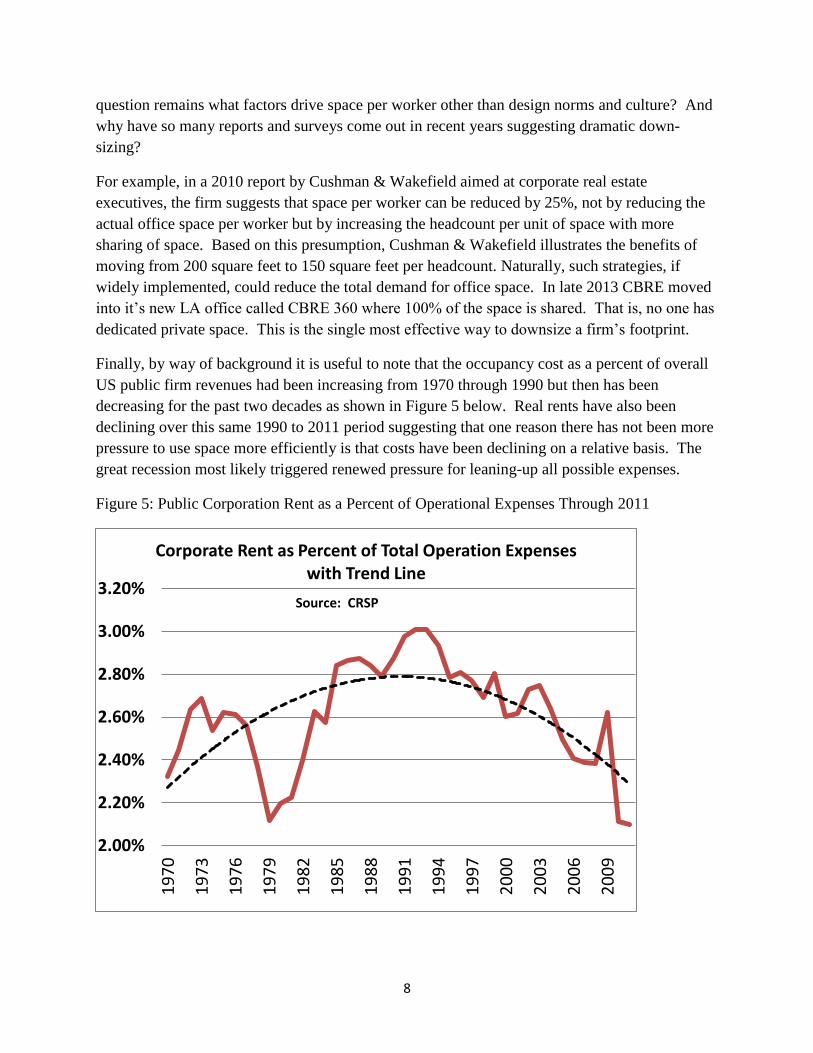
Figure 4 compares occupied space per worker by industry group. It is not surprising then that
government space has historically been fairly generous to workers, but also includes some public
access and service space that might help explain the well-above average space use per worker
results. Law firms come in tops as high space demanders followed by accountants, architects
and financial institutions, which often include generous open space at branches. The results in
Figure 4 are not inclusive of all industries but merely serve to demonstrate that we will find
systematic differences in space demands when we analyze each industry group. If a particular
industry group, such as telemarketing which operates through call centers, is moving into an area
and has stated that they need to hire 1,000 new workers it would have dramatically less impact
on office market space demand than 1,000 architects or computer software designers. When
possible, space per worker in demand estimate models should be adjusted for what is typical in
the relevant industries present in local markets.
0
50
100
150
200
250
300
China Japan EU-15 US
Building Space per Person Commercial Square Feet in 2007 Source: World Business Council for Sustainable Development
7
Figure 4: Space per Worker by Industry
Space per worker has always been an important assumption in office forecast models, and it is
worth mentioning a few of these studies that take space per worker as an input into office
demand estimates. An excellent review of the literature of office demand was provided by
Rabianski and Gibler (2007). They observe that models of office market demand analysis have
become more complex and able to segment demand by industry and/or geographic area as better
data has become available. Early studies (Jennings 1965, Detoy and Rabin 1972, Lex 1975,
Martin and English 1985) attempted to understand how much office space was needed by using
ratios of non-manufacturing employment to population or office space to employment. As better
industry breakdown became available, we saw more segmentation into industry grouping (Kelly
1983, Schloss 1984, Clapp 1987, Birch 1988) or by headquarters or private vs. public space or
the size of the firm (Carn, Rabianski, Racster and Seldin 1988, Dowall 1988). Throughout most
of the literature we see heavy reliance on FIRE employment as a proxy for office employment.
FIRE is the Bureau of Labor Statistics classification for the finance, insurance and real estate
industries, which is utilized by Clapp ( 1993) and many others. Most of the early models
estimating future office space demand relied on crude estimates of space required per worker
based on surveys from BOMA (Building Owners and Managers Association International) or
gross estimates of total space divided by employment (Clapp 1993). DiPasquale and Wheaton
(1996) note that space per worker should vary by occupation and we see that in Figure 5 above
they do. Space may vary over time as the occupation and technology changes, and that space per
worker may vary by market and costs. All of these former speculations are correct, but the
050
100150200250300350400450
U.S. Median Square Feet per Worker by Industry Source: CoStar data for all leases
8
question remains what factors drive space per worker other than design norms and culture? And
why have so many reports and surveys come out in recent years suggesting dramatic down-
sizing?
For example, in a 2010 report by Cushman & Wakefield aimed at corporate real estate
executives, the firm suggests that space per worker can be reduced by 25%, not by reducing the
actual office space per worker but by increasing the headcount per unit of space with more
sharing of space. Based on this presumption, Cushman & Wakefield illustrates the benefits of
moving from 200 square feet to 150 square feet per headcount. Naturally, such strategies, if
widely implemented, could reduce the total demand for office space. In late 2013 CBRE moved
into it’s new LA office called CBRE 360 where 100% of the space is shared. That is, no one has
dedicated private space. This is the single most effective way to downsize a firm’s footprint.
Finally, by way of background it is useful to note that the occupancy cost as a percent of overall
US public firm revenues had been increasing from 1970 through 1990 but then has been
decreasing for the past two decades as shown in Figure 5 below. Real rents have also been
declining over this same 1990 to 2011 period suggesting that one reason there has not been more
pressure to use space more efficiently is that costs have been declining on a relative basis. The
great recession most likely triggered renewed pressure for leaning-up all possible expenses.
Figure 5: Public Corporation Rent as a Percent of Operational Expenses Through 2011
2.00%
2.20%
2.40%
2.60%
2.80%
3.00%
3.20%
19
70
19
73
19
76
19
79
19
82
19
85
19
88
19
91
19
94
19
97
20
00
20
03
20
06
20
09
Corporate Rent as Percent of Total Operation Expenses with Trend Line
Source: CRSP
9
In the next section a model will be developed to simulate the effects of various factors
influencing the efficiency of office space use. One caveat that should be mentioned is that
design is not explicitly part of the research process here and clearly this is a limitation of the
research.
II. Method
Based on the CoStar existing industry data and author derived survey data describing factors
which affected the space required per person, a model was developed. What is different about
this model is that it is the first to consider explicitly factors which increase or decrease space per
worker, aside from design, although space friction discussed below is a type of design constraint
as is the standardization of space. The approach taken was to take a planned space per person as
a base line and then to examine the effects of factors which contributed to achieving or not
achieving the space per worker goal. Each of these modeled factors are described in turn, after
which the model utilized is described:
Lease term: The initial theory is that the length of lease should affect the results on space per
worker in that longer term leases should require excess space up front for a growing firm. The
faster a firm expects to grow the more extra space they should lease at time zero. Shorter term
leases and options were not considered here but are certainly a way to reduce the need to lease
extra space for a growing firm and might explain why the results do not support the theory. In
fact, what is most interesting empirically is that recent vintage leases reveal much lower space
per worker than older leases near expiration, and yet for a growing firm one might expect just the
opposite. Another consideration is that while many firms might expect to grow, many do not and
mergers, dissolutions and downsizing all contribute to the empirical results suggesting firms
have the most efficient space intensity near the start of a lease in contrast to the initial theory
suggested here.
Sharing of space or non-dedicated space: Also known as office hoteling, this is the single most
dominant factor in the simulation model supporting dramatic downsizing results. Simply
implementing a policy of sharing space will significantly reduce space per worker, especially if
the firm assumes that a certain portion of the work force will be out of the office at any point in
time, or allows third work places (e.g. home, coffee shops, and libraries). Such a policy requires
some standardized work stations and cloud based storage, and without these a firm faces great
resistance to office sharing.
Employee turnover or churn: Based on survey data d, described later, 80% of all firms
reported that turnover per year ranged from 10% to 30% per year. The greater the turnover in
the firm the more vacant seats one would expect, depending in part of the time required to fill a
position.
10
Time to fill vacant positions: Most firms reported from 1 month to 6 months to fill vacant
positions. The longer it takes a firm on average to find new talent the greater will be their space
per worker result.
Growth rate of the firm in employees: Most firms expect to grow. On average they do not. In
fact, most small firms go out of business in less than 10 years. Business week surveys suggest
that only 40% of all start-up firms will last 5 years. So while the economy may be growing on
average, it is the result of minority of successful firms. The growth rate of the firm is varied
from negative to positive based on a range of expectations in the model below. Obviously
declines in firm size result in much higher space per worker figures.
Uncertainty behind the growth rate of the firm: Firms that grow in spurts have more trouble
matching up space needs with people working in the firm. This point seems obvious.
Management hierarchy and the number of specialized office space types: Firms that have a
management hierarchy where different levels of management require different types of non-
substitutable space create what is here called space friction. The greater the number of types of
office space the greater the space friction whereby space cannot be used as intensively. The
opposite of space friction would be 100% standardized space, fully useable by anyone in the
firm.
Modeling Process
These variables are used in the following model to describe key elements in the decision as to
how much space to lease and over time the resulting space per worker.
xi = office space type, 1, 2, 3, 4, etc. where each type represents a non-interchangeable type of
space with any other. Space types typically are of different sizes with larger sizes allocated to
more senior staff and management.
s = shared office space percentage for each office space type xi from 0 to 1.0 for 100%.
n = lease term in months or the specific month.
gw = goal space per worker in terms of average square feet based on total firm space divided by
the average number of workers allocated office space. The total space of the firm is based on
rented building area, RBA, including all space required for the firm such as common areas,
conference rooms, and hallways and storage areas.
ge = goal space per employee based on the total number of employees of the firm assigned to a
particular regional or office. This is merely a derivation of gw dependent on t, described below.
t = percentage of total worker time expected to be spent intentionally working at home, airports,
libraries, coffee shops, or other locations.
11
p = percentage of time that workers spend with clients or outside the office, in work-related
functions, while they are based in the traditional office space. p may overlap with t above, but is
defined here as a percent of (1-t) time based within the regular office space.
gr = growth rate in the firm in terms of employees per year stated on a percentage basis in
negative or positive terms.
c = churn rate based on the percent of employees that turnover each year from 0 to 1.0 for 100%.
cm = average time in months required to fill a vacated position.
U = utilization rate defined as the percent of total time desks are occupied using a one shift day
of 8 to 10 hours. There is no weighting by square feet, so each desk is counted as one. This
calculation is an output that is based on the simulation results. Where U exceeds 1.0 there would
a need to double up, use conference rooms for temp space, secure or rent temporary space
outside the regular office. This variable is an output that is put into an optimization framework
using a stock out model approach, as described in the next section.
The goal space, gw, is based upon the following process: If the firm is growing, then required
space per worker it is solved at the end of the lease term and back calculated to find the amount
of space occupied in each period from the start of the lease. We assume here that there is only
one type of space, although this single standardized space assumption will be relaxed below to
allow for multiple unique non-substitutable spaces. The process of accommodating expected
growth in worker counts is merely a geometric progression, where:
gw = ge/t(p) and then we solve for each period of the lease back to zero based upon the
following pattern derived from the compounded growth rate:
(1) OSPW = ge/t(p)/(1+gr)n
The importance of solving for the space required in any period is that while the goal space may
be 100 square feet per worker, a firm signing a 5 year lease will need to over consume space in
the beginning in order to accommodate employee growth. Temporary overflow space providers
are not modeled here, although clearly such providers could feed into a decision as to how
conservatively to model space needs. Examples are HQ, Instant Office, Regus and others that
provide monthly rentals of fully furnished spaces while firms like Liquid Space provide small
conference rooms by the hour. The costs for a typical Instant workstation may run $800 to $900
per month for 120 square feet plus access to conference space and common areas, converting to
about double the rate for long-term leased traditional space in bulk. For the instant space
provided by firms like Liquid Space we see rates in the $60 to $90 US dollar range per hour for a
conference room in a major city that would hold 4 to 6 people. While firms rarely sign long-
term leases while in downsizing mode, downsizing simply happens unexpectedly, and this also
results in extra space consumption. Such uncertainty is modeled through the range of growth
12
rate assumptions, from negative to positive, using the 80% confidence range of typical growth
rates for a sample of CBRE tenant firms and Corenet Global members surveyed.
Now let’s factor into the model time spent outside of the office, which is only relevant if s > 0,
and we need to do this for each office type xi so that we repeat and sum the model based on
allocating all space to one of the potential office space types.
(2) OSPWxi = s(ge/t(p)/(1-gr)n
) This sharing of space has the effect of reducing
the total space required as a function of the degree of sharing and p, the time spent
working outside the office, while assigned to space inside.
Next let’s factor in the churn rate, c, and time to fill the vacated slots, cm.
(3) OSPWxi = s(ge/t(p)/(1-gr)n)/(cm/12c) This has the effect of adding some
friction to the efficient use of space by acknowledging that some of the time space will be
empty waiting for new hires.
Next, let’s factor in various types of space in the simulation by using a ratio of space for each
office type; thus, for type x1 we may have 1.5 times the average space per worker and for x4 we
may have .5 times the average space per worker. The average weighted space will be the same
as for the goals, but we must recognize that churn in space x1 in this case will create a larger
impact on the overall unplanned space per worker compared to the x4 worker type space. We do
not show this in equations since it is merely a repeat of (3) above for each x space type where the
result is summed. Note that the more office type spaces that cannot be substituted, the more
friction in the system.
The last step in the model is to decide how certain one need be that there is enough office space.
We can view this decision much like a stock out problem in operations management. Imagine
inventory as space available to house workers and imagine that we are unsure about how many
workers we will need to house over the next several years. The longer the term of our analysis
the more difficult the problem becomes, and in turn optimal space decisions are harder for
longer-term leases or when owned space is involved. Still this operations management
perspective is a useful framework for modeling space demand, consistent with an optimization
based on marginal utility analysis in economics.
From an inventory management perspective, we have two kinds of costs: overage costs, Co, when
we have too much inventory (space) and underage costs, Cu, when we have insufficient
inventory. We need to select the right level of inventory or office space per worker, OSPW, that
balances these two costs. If these two costs were equal then we would end up seeking the
amount of OSPW that has a 50% probability, P, of being too much or too little space. In this
case, we seek to find OSPW that satisfies the following condition:
P(OSPW) = Cu/(Cu+Co) such that P(OSPW)<X = .5 where X is the actual space required.
13
The ratio which provides an optimum could be based on the marginal costs of adding
temporary space, where available, such as that provided by instant office space providers. Using
a sample of temporary office providers and annualizing the cost, which obviously will vary by
market, we end up with typical rents at least four times that of traditional space. This is akin to
comparing a hotel room rent with an apartment and so such differentials are not unexpected. This
is similar to using the differential between the costs of having too much space to the cost of
having sufficient space. The cost of having too much space is less than the cost of not having
enough, so if the cost of too much space is one-fifth that of too little space, we end up with the
same exact ratio, as when the cost of marginal space is five times as expensive, seeking the
following solution:
Px<OSPW = 4/(4+1) = 4/5 = 80%
implying that we wish to have 80% confidence that we will have sufficient space. Px is
the probability the demand for space is less than x, the actual needed. If the cost of temporary
space is higher, say nine times that of regular space, then we will want to be approximately 90%
confident we have sufficient space at any point in time. General estimates for temporary office
space suggest the cost is about 8 to 10 times the typical cost for longer-term leased space, based
on anecdotal evidence collected by the author at the CORENET Global conference in 2012.
The approach used in operations management is no different from that used in microeconomics.
We set the marginal benefits equal to the marginal costs as the minimal sufficient condition for
an investment decision. The last unit of space added, OSPW*, is that which sets the expected
cost of too much space, Co, equal to the expected cost of too little space, Cu, recognizing that
these costs may not be equal per unit of space.
The concept of optimizing office inventory or seeking to avoid stock outs of sufficient space is
identical and parallel to the utilization, U, goal of firms, where they seek a minimum or average
utilization rate. Utilization rates are based upon the occupancy rate for all available desks over
the course of working days, measured periodically. Traditional firms have rather modest
utilization rates, typically 50% to 60%, according to Corenet Global research. But firms that
allow sharing of desk spaces, known as non-dedicated office space, and some telecommuting
may experience utilization rates of 80% or higher. Firms like Accenture and Procter & Gamble
intentionally run at 80% and even 90% or higher utilization rates.
The impact of space friction: The above model becomes more complicated when the internal
spaces (inventory) are not substitutable. We might think of office cubicles as fairly
homogeneous and substitutable and in those firms with fairly generic and flexible space, there is
less friction in adjusting to the needs of workers with different levels of specialization and
authority. In firms with more structured authority or specialization and less flexible space, there
will be higher transaction costs to adjust space resulting in space inventory supply friction. In
14
this case, the optimal space model becomes a summation of several sub-space optimization
models, each with its own inventory of space and its own demand.
Firms like Procter & Gamble have moved to more standardized space, which allows for greater
ease of space optimization strategies. Other firms with formal hierarchies of managers, each
with different space requirements, will end up with much more required space per person simply
because of the lack of substitutability. Think of a firm with one CEO, one COO, 10 senior VPs
and 30 VPs, 50 sales staff and then 300 other staff workers of various kinds, each with their own
space requirements. A senior VP leaves the firm and rather than move a regular VP into the
office, it sits empty rather than risk the charge of favoritism being applied to the facilities
manager that allocates space. These frictions increase the need to secure more space per worker
for the entire firm as the probability increases that space will remain unoccupied for uncertain
periods. So one might conclude that the less substitutable the space, the higher will be the
summed average space per worker in a firm, all other things equal.
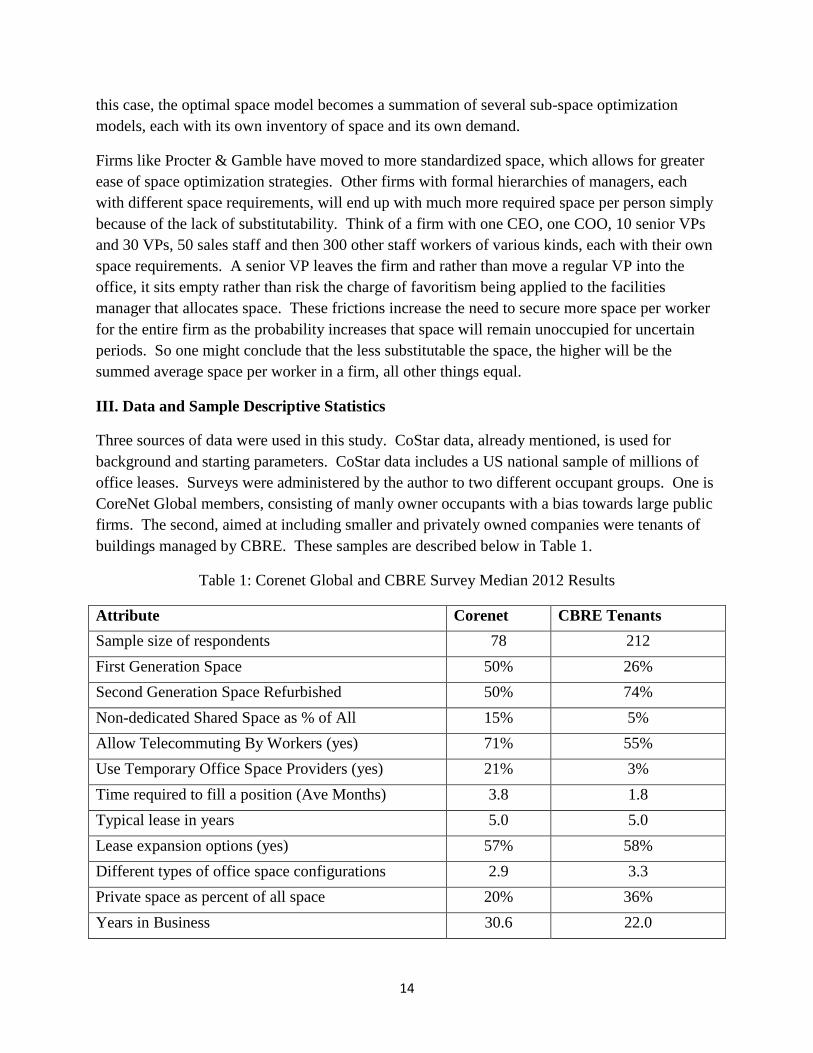
III. Data and Sample Descriptive Statistics
Three sources of data were used in this study. CoStar data, already mentioned, is used for
background and starting parameters. CoStar data includes a US national sample of millions of
office leases. Surveys were administered by the author to two different occupant groups. One is
CoreNet Global members, consisting of manly owner occupants with a bias towards large public
firms. The second, aimed at including smaller and privately owned companies were tenants of
buildings managed by CBRE. These samples are described below in Table 1.
Table 1: Corenet Global and CBRE Survey Median 2012 Results
Attribute Corenet CBRE Tenants
Sample size of respondents 78 212
First Generation Space 50% 26%
Second Generation Space Refurbished 50% 74%
Non-dedicated Shared Space as % of All 15% 5%
Allow Telecommuting By Workers (yes) 71% 55%
Use Temporary Office Space Providers (yes) 21% 3%
Time required to fill a position (Ave Months) 3.8 1.8
Typical lease in years 5.0 5.0
Lease expansion options (yes) 57% 58%
Different types of office space configurations 2.9 3.3
Private space as percent of all space 20% 36%
Years in Business 30.6 22.0
15
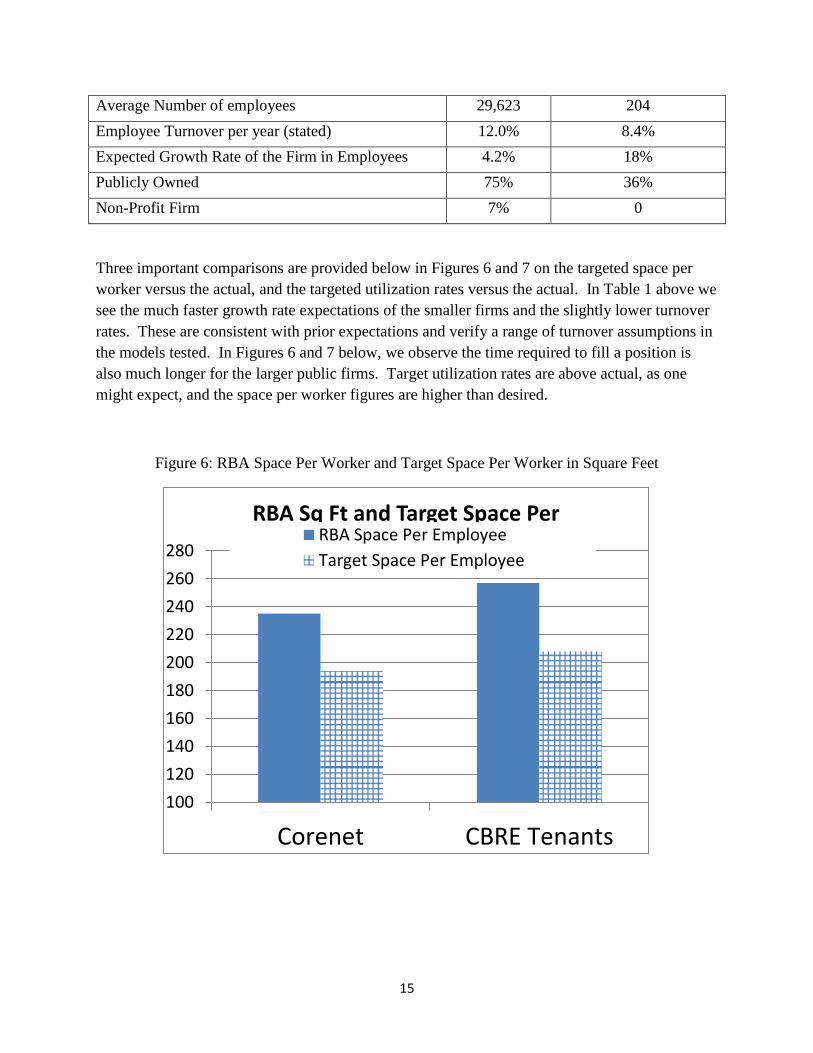
Average Number of employees 29,623 204
Employee Turnover per year (stated) 12.0% 8.4%
Expected Growth Rate of the Firm in Employees 4.2% 18%
Publicly Owned 75% 36%
Non-Profit Firm 7% 0
Three important comparisons are provided below in Figures 6 and 7 on the targeted space per
worker versus the actual, and the targeted utilization rates versus the actual. In Table 1 above we
see the much faster growth rate expectations of the smaller firms and the slightly lower turnover
rates. These are consistent with prior expectations and verify a range of turnover assumptions in
the models tested. In Figures 6 and 7 below, we observe the time required to fill a position is
also much longer for the larger public firms. Target utilization rates are above actual, as one
might expect, and the space per worker figures are higher than desired.
Figure 6: RBA Space Per Worker and Target Space Per Worker in Square Feet
100
120
140
160
180
200
220
240
260
280
Corenet CBRE Tenants
RBA Sq Ft and Target Space Per Employee RBA Space Per Employee
Target Space Per Employee
16
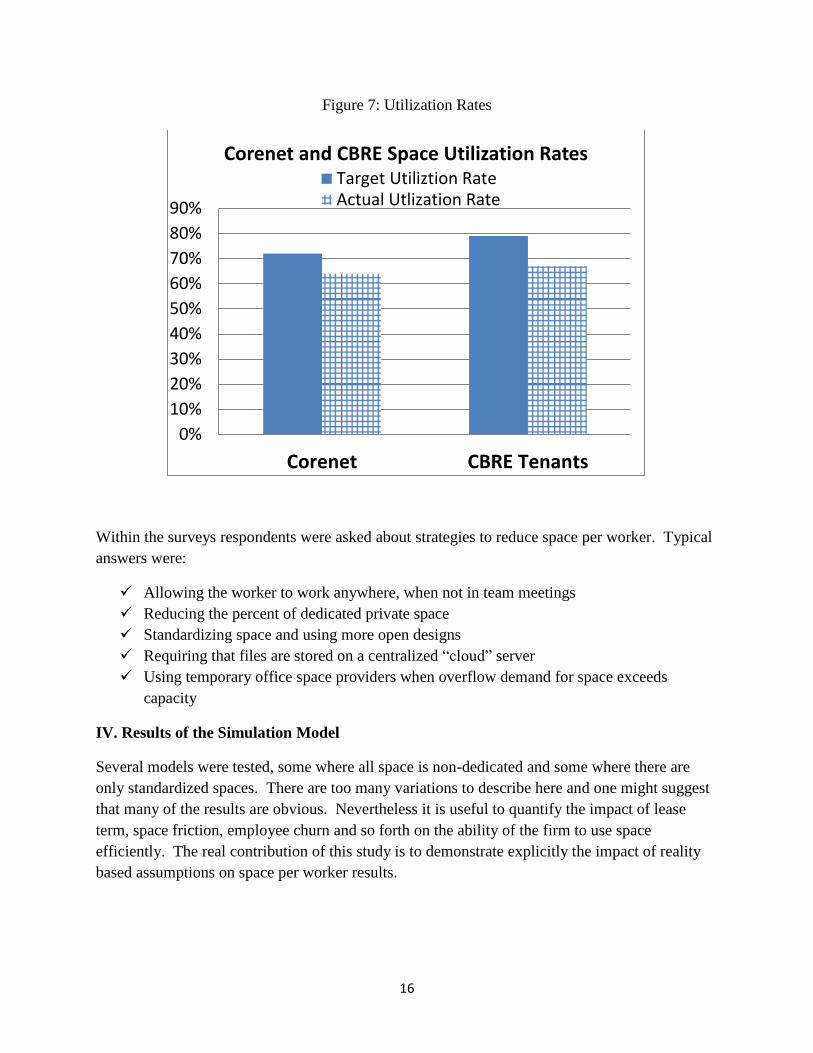
Figure 7: Utilization Rates
Within the surveys respondents were asked about strategies to reduce space per worker. Typical
answers were:
Allowing the worker to work anywhere, when not in team meetings
Reducing the percent of dedicated private space
Standardizing space and using more open designs
Requiring that files are stored on a centralized “cloud” server
Using temporary office space providers when overflow demand for space exceeds
capacity
IV. Results of the Simulation Model
Several models were tested, some where all space is non-dedicated and some where there are
only standardized spaces. There are too many variations to describe here and one might suggest
that many of the results are obvious. Nevertheless it is useful to quantify the impact of lease
term, space friction, employee churn and so forth on the ability of the firm to use space
efficiently. The real contribution of this study is to demonstrate explicitly the impact of reality
based assumptions on space per worker results.
0%
10%
20%
30%
40%
50%
60%
70%
80%
90%
Corenet CBRE Tenants
Corenet and CBRE Space Utilization Rates Target Utiliztion RateActual Utlization Rate
17
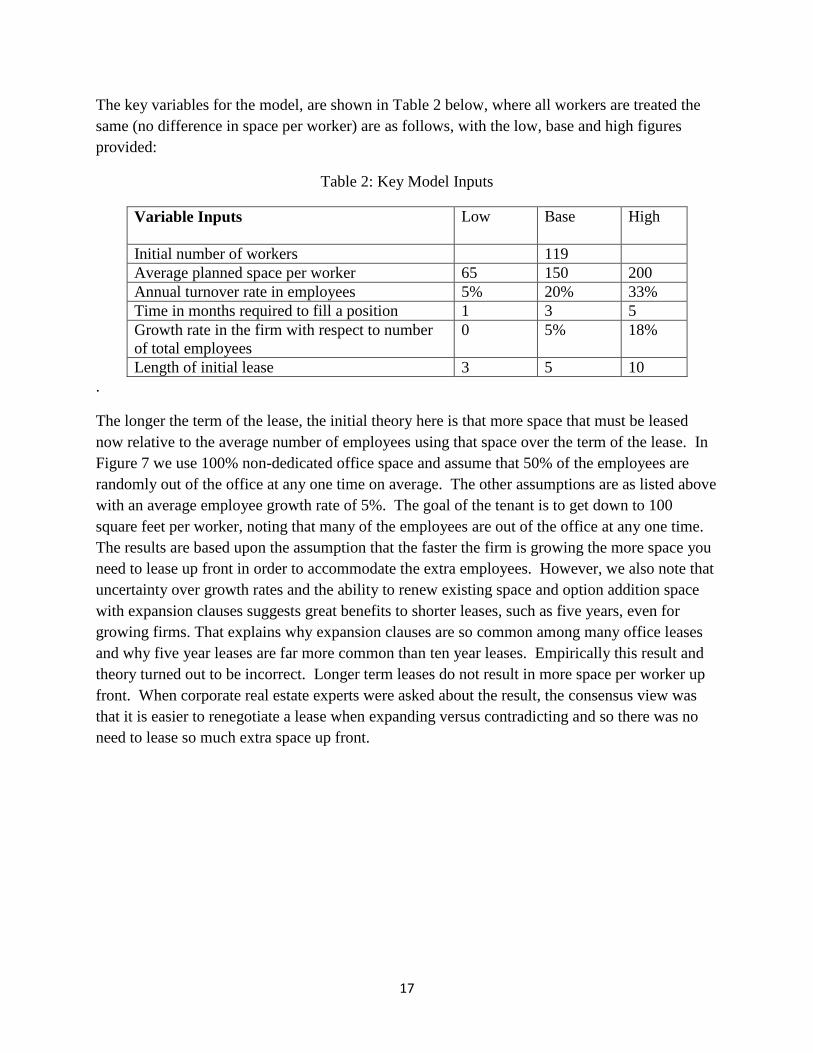
The key variables for the model, are shown in Table 2 below, where all workers are treated the
same (no difference in space per worker) are as follows, with the low, base and high figures
provided:
Table 2: Key Model Inputs
Variable Inputs
Low Base High
Initial number of workers 119
Average planned space per worker 65 150 200
Annual turnover rate in employees 5% 20% 33%
Time in months required to fill a position 1 3 5
Growth rate in the firm with respect to number
of total employees
0 5% 18%
Length of initial lease 3 5 10
.
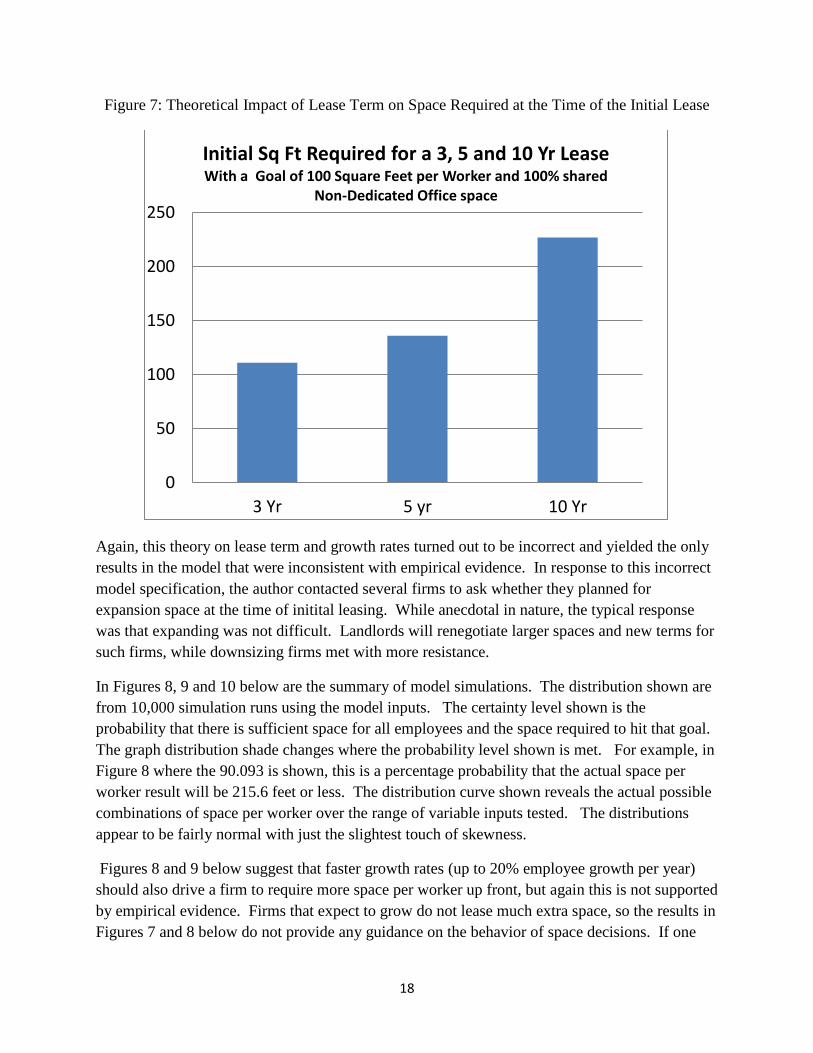
The longer the term of the lease, the initial theory here is that more space that must be leased
now relative to the average number of employees using that space over the term of the lease. In
Figure 7 we use 100% non-dedicated office space and assume that 50% of the employees are
randomly out of the office at any one time on average. The other assumptions are as listed above
with an average employee growth rate of 5%. The goal of the tenant is to get down to 100
square feet per worker, noting that many of the employees are out of the office at any one time.
The results are based upon the assumption that the faster the firm is growing the more space you
need to lease up front in order to accommodate the extra employees. However, we also note that
uncertainty over growth rates and the ability to renew existing space and option addition space
with expansion clauses suggests great benefits to shorter leases, such as five years, even for
growing firms. That explains why expansion clauses are so common among many office leases
and why five year leases are far more common than ten year leases. Empirically this result and
theory turned out to be incorrect. Longer term leases do not result in more space per worker up
front. When corporate real estate experts were asked about the result, the consensus view was
that it is easier to renegotiate a lease when expanding versus contradicting and so there was no
need to lease so much extra space up front.
18
Figure 7: Theoretical Impact of Lease Term on Space Required at the Time of the Initial Lease
Again, this theory on lease term and growth rates turned out to be incorrect and yielded the only
results in the model that were inconsistent with empirical evidence. In response to this incorrect
model specification, the author contacted several firms to ask whether they planned for
expansion space at the time of initital leasing. While anecdotal in nature, the typical response
was that expanding was not difficult. Landlords will renegotiate larger spaces and new terms for
such firms, while downsizing firms met with more resistance.
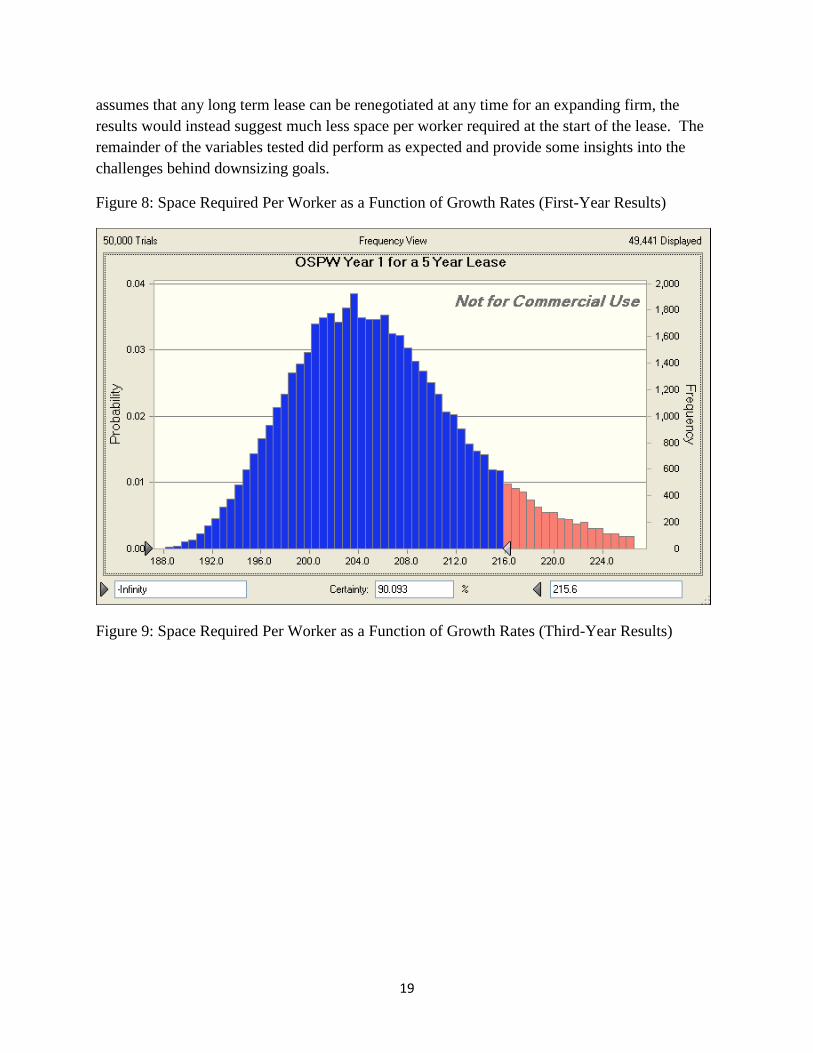
In Figures 8, 9 and 10 below are the summary of model simulations. The distribution shown are
from 10,000 simulation runs using the model inputs. The certainty level shown is the
probability that there is sufficient space for all employees and the space required to hit that goal.
The graph distribution shade changes where the probability level shown is met. For example, in
Figure 8 where the 90.093 is shown, this is a percentage probability that the actual space per
worker result will be 215.6 feet or less. The distribution curve shown reveals the actual possible
combinations of space per worker over the range of variable inputs tested. The distributions
appear to be fairly normal with just the slightest touch of skewness.
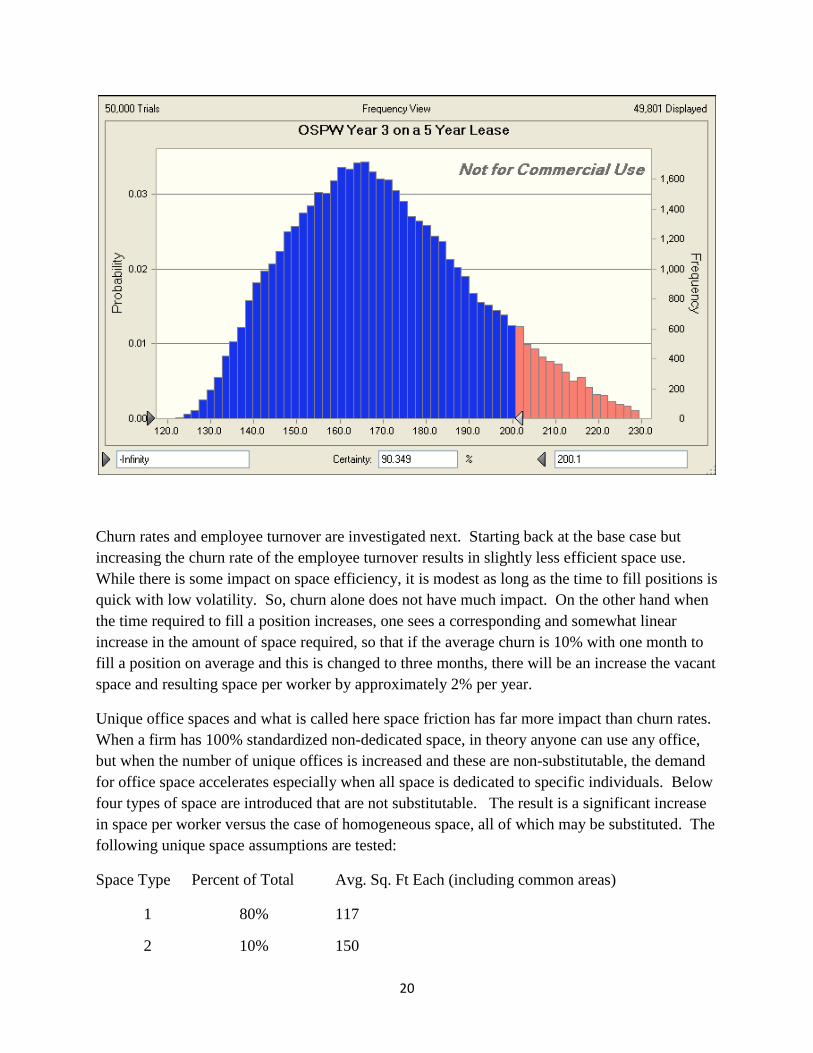
Figures 8 and 9 below suggest that faster growth rates (up to 20% employee growth per year)
should also drive a firm to require more space per worker up front, but again this is not supported
by empirical evidence. Firms that expect to grow do not lease much extra space, so the results in
Figures 7 and 8 below do not provide any guidance on the behavior of space decisions. If one
0
50
100
150
200
250
3 Yr 5 yr 10 Yr
Initial Sq Ft Required for a 3, 5 and 10 Yr Lease With a Goal of 100 Square Feet per Worker and 100% shared
Non-Dedicated Office space
19
assumes that any long term lease can be renegotiated at any time for an expanding firm, the
results would instead suggest much less space per worker required at the start of the lease. The
remainder of the variables tested did perform as expected and provide some insights into the
challenges behind downsizing goals.
Figure 8: Space Required Per Worker as a Function of Growth Rates (First-Year Results)
Figure 9: Space Required Per Worker as a Function of Growth Rates (Third-Year Results)
20
Churn rates and employee turnover are investigated next. Starting back at the base case but
increasing the churn rate of the employee turnover results in slightly less efficient space use.
While there is some impact on space efficiency, it is modest as long as the time to fill positions is
quick with low volatility. So, churn alone does not have much impact. On the other hand when
the time required to fill a position increases, one sees a corresponding and somewhat linear
increase in the amount of space required, so that if the average churn is 10% with one month to
fill a position on average and this is changed to three months, there will be an increase the vacant
space and resulting space per worker by approximately 2% per year.
Unique office spaces and what is called here space friction has far more impact than churn rates.
When a firm has 100% standardized non-dedicated space, in theory anyone can use any office,
but when the number of unique offices is increased and these are non-substitutable, the demand
for office space accelerates especially when all space is dedicated to specific individuals. Below
four types of space are introduced that are not substitutable. The result is a significant increase
in space per worker versus the case of homogeneous space, all of which may be substituted. The
following unique space assumptions are tested:
Space Type Percent of Total Avg. Sq. Ft Each (including common areas)
1 80% 117
2 10% 150
21
3 7.5% 300
4 2.5% 450
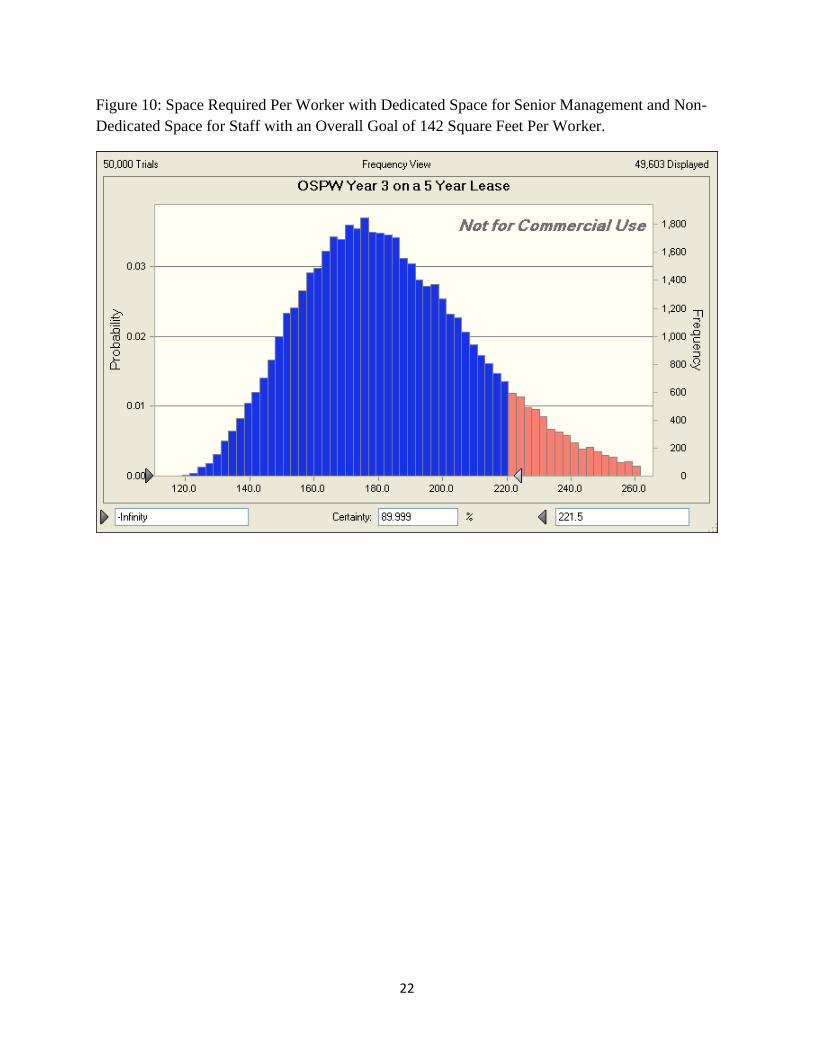
The results are shown in Figure 10 below with 100% sharing among Space Type 1 but no
sharing within space types 2, 3 and 4. The average space allocation is 142 for each worker, but
with turnover and growth and space frictions, one observes significantly higher figures. In year
one the space required per worker is 220 on average and 251 at the 90% confidence level. Year
three is shown below, suggesting 181 square feet on average and 221 at the 90% confidence
level.
22
Figure 10: Space Required Per Worker with Dedicated Space for Senior Management and Non-
Dedicated Space for Staff with an Overall Goal of 142 Square Feet Per Worker.
23
Simulation Model Findings
1) While firms may target 200, 150 or figures as modest as 100 square feet per worker, only
a firm with an extremely stable worker base, little turnover, modest growth and fairly
standardized non-dedicated space could possibly achieve these targets on average over
the course of an entire lease. Longer lease terms make it harder to hit space targets.
2) Positive firm growth rates and longer lease terms in theory should result in more space
per worker at the start of a lease, but these findings are not empirically supported.
Apparently firm expansion and lease renegotiation is not as difficult as expected. On the
other hand, firms that have downsized results in significant excess space per worker.
Obviously, shrinking firms will far exceed space per worker targets, which explains much
of the shadow space observed in the market during and shortly after recessions.
3) The greater the churn rate of workers, the more space required per worker, but only
modestly. Time required to fill a position has more impact on space per worker results.
4) The greater the number of non-standardized spaces that are not substitutable between
ranks within the firm the lower will be utilization rates and the greater will be the space
per worker. In firms with totally dedicated space and several layers of unique spaces, the
average consumption of space per worker will be as much as twice or more that of a firm
that shares standardized non-dedicated space. The implication is that branch operations
with more standardized space will be able to use space more efficiently than headquarters
and those with more managerial delineation within office space allocations.
Implications of downsizing on the office market
Based on input from Corenet Global members and CBRE tenants, the larger tenants are the ones
working harder to use space more efficiently, especially those with footprints over 75,000 square
feet. This group tends to encourage digital storage on centralized cloud-based servers and use
more non-dedicated standardized space for all but the most senior of managers. This group
represents 1.8% of all tenants in the United States by count and 27.9% of all office space. Those
using more than 50,000 square feet represent 36% of the total office stock. If using some of the
space sharing strategies described above, we assume 36% of the firms can reduce their primary
leased office footprint by 50%, moving from 250 to 125 square feet, this would be the equivalent
of 540 million square feet out of some 12 billion office square feet as of 2010. Historically this
is equivalent to 3.6 years of average United States deliveries of net new space to the market,
which has averaged close to 150 million square feet per year since 1983.
Decreases in total office consumption based mostly on higher utilization rates take time, and it is
likely that these moves towards more efficient use of space will require many years of transition.
At the same time that the market is seeing some downsizing, there is also a new kind of space
being required, one that lets in more natural light with better natural ventilation, with better
temperature control and provides for more collaborative and more productive workspace. With
this perspective in mind, some of the existing office space may be considered obsolete and
24
require retrofitting. The innovations of cloud-based computing, shared storage, video
conferencing and high-speed internet has freed up locational constraints allowing many
professionals to work anywhere they wish, mostly coming to the office for collaborative work
and meetings, and some firms are taking advantage of this flexibility. If all the 12 billion plus
square feet of existing United States stock were instantly updated to accommodate the new style
of work and the higher-quality features of more sustainable real estate, the market would not
need any more space for a few years. But such a transition to better space takes time and the
growing markets and downsizing markets need not match up.
One major problem for landlords faced with high space utilization tenants is the need for much
greater parking per 1,000 square foot of leased space. While traditional models of parking
supply suggest 3 to 4 cars per 1,000 square feet, this figure will likely need to be doubled when
space per worker is down to 150 square feet or less.
V. Conclusions
The largest firms and the GSA represented entities have embarked on a path towards more
efficient use of space seeking much higher utilization rates. This is possible with extensive use
of standardized non-dedicated space and a policy that allows great flexibility in terms of where
employees work. Slightly more than a third of the US market is represented by larger firms that
are attempting to downsize footprints over the next several years. Others will follow over time.
Still the culture of private space remains entrenched in the US and it is not clear how long the
transition to smaller footprints will take. Only a smaller percentage in space per worker will
drive some markets into negative absorption in the years to come. Portfolios with a heavy
percentage of large public firms or GSA managed entities are most at risk from downsizing.
Markets like Washington DC with the large presence of GSA managed entities are more likely to
see negative absorption from these trends sooner than markets dominated by smaller non-GSA
firms.
Few firms will ever be able to hit their target allocations of space per worker. Simulation models
tested here suggest a variety of challenges are posed by turnover rates, time to fill positions and
managerial space friction. Firms retaining a multi-level hierarchy of management, with private
dedicated office space configuration as a signal of rank, will find it harder to use space
efficiently just as second-generation tenants do not fit as efficiently into any given space as first-
generation tenants.
The need for collaboration and innovation works against the trend of working at home or even in
private offices. Overall, we should expect a greater spread of square feet per worker figures over
the next several years, as some firms reduce footprints significantly while others maintain current
practices with private dedicated space.
25
References
Birch, D.L. America’s Office Needs: 1985-1995. Chicago, IL. Arthur Anderson & Co. 1986
CoreNet Global and several research reports at http://www.corenetglobal.org/
International Facility Management Association and several research reports available at
http://www.ifma.org/
Carn, N., J. Rabianski, R. Racster, and M. Selden, Real Estate Market Analysis. Englewood
Cliffs, N.J.: Prentice-Hall, 1988.
Clapp, J.M., Dynamics of Office Markets. AREUEA Monograph Series No. 1. Washington,
D.C.: Urban Institute Press, 1993.
Clapp, J. M., Dynamics of Office Markets: Empirical Findings and Research Issues (AREUEA
Monograph Series No. 1.) Washington, D.C.: Urban Institute Press, 1993.
Clapp, J.M. Handbook for Real Estate Market Analysis. Englewood Cliffs, N.J.: Prentice Hall,
1987.
Clements-Croome, D., Kaluarachchi, Y. (2000) An Assessment of the Influence of the In-door
Environment on the Productivity of Occupants in Offices Design, Construction and Operation of
Healthy Buildings ,pp.67-81.
Colliers International, “Workplace Report 2012” New Zealand, by Alan McMahon, 2012.
CoreNet Global, “Reducing the Portfolio and Maximizing the Use of Existing Space” June, 2009
Research Bulletin, 14.
Cushman & Wakefield “Occupancy Optimization Considerations for Professional Service
Firms” by Matt Jackson and Nnenna Alintah, 2010, Business Consulting Report.
Del Casino, J.J., “A Risk Simulation Approach to Long-Range Office Demand Forecasting.”
Real Estate Review, 1985, 15:2, 82:87.
Detoy, C.J. and S.J. Rabin, “Office Space: Calculating the Demand”, Urban Land, 1972, June 4-
13.
DiPasquarle, D. and W. Wheaton, Urban Economics and Real Estate Markets, Chapter 12,
Prentice Hall, 1996.
Dowall, D.E. “Office Market Research: The Case for Segmentation,” Journal of Real Estate
Development, 1988, 4:1, 34:43.
The Gensler Design + Performance Index, The U.S. Workplace Survey (2013)
26
Gibson, V. “Flexible Working Needs Flexible Space?” Journal of Property Investment &
Finance, 2003, 21:1, 12:22.
GSA Office of Government-wide Policy “Workspace Utilization and Allocation Benchmark”
July, 2011 See http://www.gsa.gov/graphics/ogp/Workspace_Utilization_Banchmark_July_2012.pdf
Grissom, T.V. and J.L. Kuhle, “The Space Segmentation Technique (ST3): A New Approach to
Market Analysis,” Real Estate Issues, 1983, 8:2, 21:29.
Hakfoort, J. and R. Lie, “Office Space Per Worker: Evidence from Four European Markets,” The
Journal of Real Estate Research, 1996, Vol. 11, 2, 183:196.
Howarth, R. and E. Malisia, “Office Market Analysis: Improving Best Practice Techniques” The
Journal of Real Estate Research, 1998, Vol. 16, No. 1. 15:34.
Hysom, J. “Office Market Analysis: A Solution to Overbuilding?” Commercial Investment Real
Journal, 1988, 7:3, 9:13.
Jackson, M. and N. Alintah, “Occupancy Optimization Considerations for Professional Service
Firms,” Cushman & Wakefield Research Report, 2010.
Jennings, C. “Predicting Demand for Office Space.” Appraisal Journal, 1965, July, 377:82.
Jones, C. “An Economic Basis for the Analysis and Prediction of Local Office Property
Markets.” Journal of Property Valuation and Investment, 1995, 13:2, 16:30.
Kelly, H. “Forecasting Office Space Demand in Urban Areas” Real Estate Review, 1983, 13:3,
83-95.
Kimball, J.R. and B.S. Bloomberg, “Office Space Demand Analysis.” Appraisal Journal, 1987,
55:4, 567:77.
Laing, Andrew, David Craig, and Alex White “High-Performance Office Space” Harvard
Business Review, Reprint F1109Z, September, 2011.
Lex, R.A. “Marketing Studies for Office Buildings,” Real Estate Review, 1975, 5:2, 101:03.
Liang, Y. and J.H. Kim, “Demand for Office Space.” Real Estate Finance, 1998, 15:2, 37:44.
Maisel, S. J. “Demand for Office Space,” Working Paper 89-161, Berkeley, Calif.: Center for
Real Estate and Urban Economics, 1989.
Martin, W.B. and W.D. English, “Forecasting Demand for Multitenant Office Space”
Commercial Investment Journal, 1985, 4:1, 7-9.
27
McDonald, J.F. “A Survey of Econometric Models of Office Markets.” Journal of Real Estate
Literature, 2002, 10:2, 223:42.
Miller, N. and D. Pogue, “Green Buildings and Productivity,” Journal of Sustainable Real
Estate, Vol. 1, No. 1, Fall 2009.
Miller, N. D. pogue, J. Saville, and C. Tu.“The Operations and Management of Green Buildings
in the United States”, Journal of Sustainable Real Estate, Vol. 2, No. 1, 2010, 5:66.
Rabianski, J. “Office Market Demand Analysis.” Real Estate Review, 2004, 33:2, 16:33.
Rabianski, J. “Linking Particular Office Marketability to the Market.” Real Estate Review, 1994,
24:3, 83:86.
Rabianski, J. and K. Gibler, “Office Market Demand Analysis and Estimation Techniques: A
literature review, Synthesis and Commentary,” The Journal of Real Estate Literature, Vol. 15,
No, 1, 2007.
Ragas, W.R., R.L. Ryan and T.V. Grissom, “Forecasting Office Space Demand and Office Space
Report 4.” Chicago, Ill.: American Institute of Real Estate Appraisers, 1989, 29:42.
Ragas, W.R., R.L. Ryan and T.V. Grissom, “Forecasting Office Space Demand and Office Space
per Worker Estimates” SIOREF Perspective, 1992, March/April, 2-8.
Shilton, L. “The Eight Myths of Office Demand Forecasting.” Real Estate Finance Journal,
1994, Winter, 67:72.
Schloss, N. “Technical Note: Use of Employment Data to Estimate Office Demand,” Monthly
Labor Review, 1984, 107:12, 40:44.
Silver, E.A., D.F. Pyke and R. Peterson “Chapter 10: Style Goods and Perishable Items,” in
Inventory Management and Production Planning and Scheduling, John Wiley & Sons, Third
Edition, 1998.
Sundstrom, E., Town, J.P., Rice, R.W., Osborn, D.P. and Brill, M. (1994), Office noise,
satisfaction, and performance, Environment and Behavior, 26(2), pp. 195-222.
Wheaton, W.C., “The Cyclic Behavior of the National Office Market,” AREUEA Journal, 1987,
15:4, 281:99.
White, J.R. “The Office Building,” Chapter 9, 1993, Counselors of Real Estate Publishers.
28
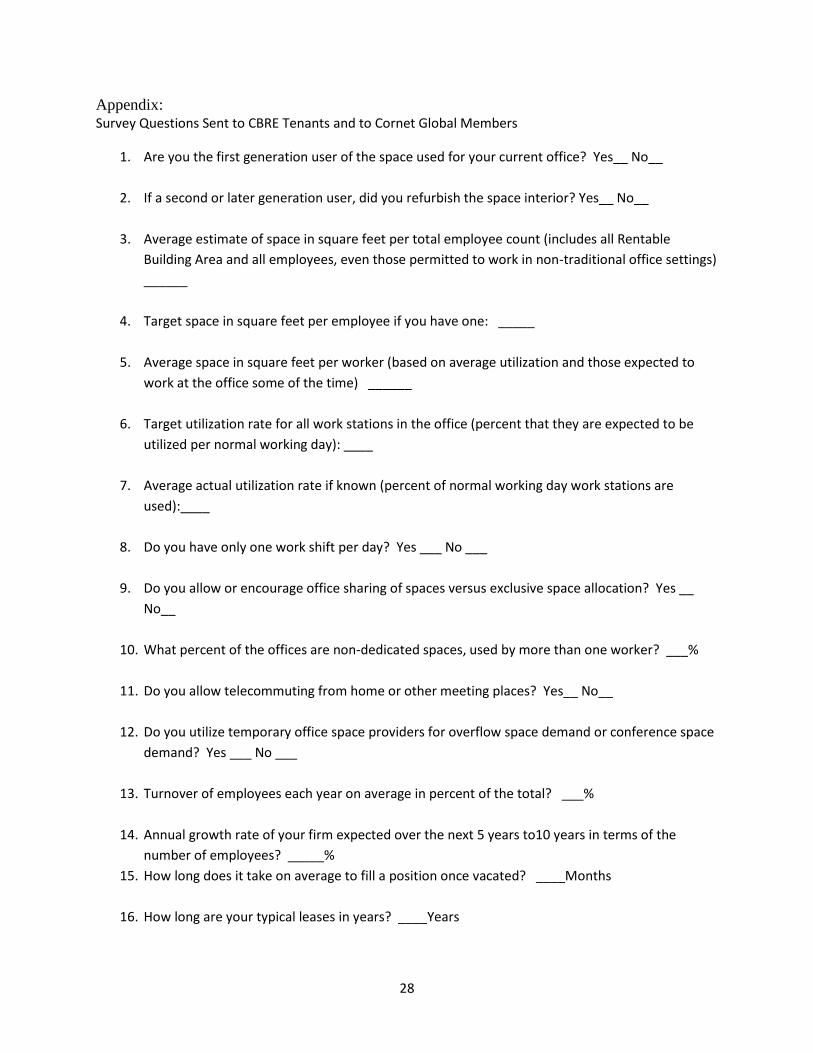
Appendix: Survey Questions Sent to CBRE Tenants and to Cornet Global Members
1. Are you the first generation user of the space used for your current office? Yes__ No__
2. If a second or later generation user, did you refurbish the space interior? Yes__ No__
3. Average estimate of space in square feet per total employee count (includes all Rentable
Building Area and all employees, even those permitted to work in non-traditional office settings)
______
4. Target space in square feet per employee if you have one: _____
5. Average space in square feet per worker (based on average utilization and those expected to
work at the office some of the time) ______
6. Target utilization rate for all work stations in the office (percent that they are expected to be
utilized per normal working day): ____
7. Average actual utilization rate if known (percent of normal working day work stations are
used):____
8. Do you have only one work shift per day? Yes ___ No ___
9. Do you allow or encourage office sharing of spaces versus exclusive space allocation? Yes __
No__
10. What percent of the offices are non-dedicated spaces, used by more than one worker? ___%
11. Do you allow telecommuting from home or other meeting places? Yes__ No__
12. Do you utilize temporary office space providers for overflow space demand or conference space
demand? Yes ___ No ___
13. Turnover of employees each year on average in percent of the total? ___%
14. Annual growth rate of your firm expected over the next 5 years to10 years in terms of the
number of employees? _____%
15. How long does it take on average to fill a position once vacated? ____Months
16. How long are your typical leases in years? ____Years
29
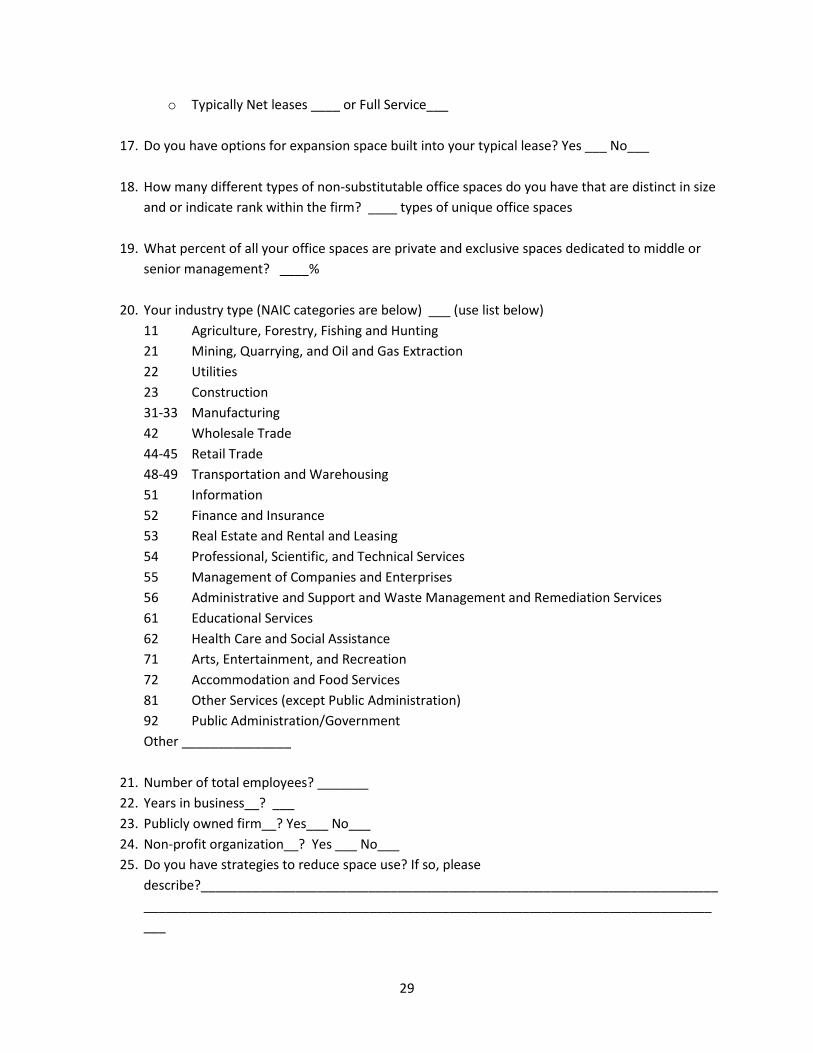
o Typically Net leases ____ or Full Service___
17. Do you have options for expansion space built into your typical lease? Yes ___ No___
18. How many different types of non-substitutable office spaces do you have that are distinct in size
and or indicate rank within the firm? ____ types of unique office spaces
19. What percent of all your office spaces are private and exclusive spaces dedicated to middle or
senior management? ____%
20. Your industry type (NAIC categories are below) ___ (use list below)
11 Agriculture, Forestry, Fishing and Hunting
21 Mining, Quarrying, and Oil and Gas Extraction
22 Utilities
23 Construction
31-33 Manufacturing
42 Wholesale Trade
44-45 Retail Trade
48-49 Transportation and Warehousing
51 Information
52 Finance and Insurance
53 Real Estate and Rental and Leasing
54 Professional, Scientific, and Technical Services
55 Management of Companies and Enterprises
56 Administrative and Support and Waste Management and Remediation Services
61 Educational Services
62 Health Care and Social Assistance
71 Arts, Entertainment, and Recreation
72 Accommodation and Food Services
81 Other Services (except Public Administration)
92 Public Administration/Government
Other _______________
21. Number of total employees? _______
22. Years in business__? ___
23. Publicly owned firm__? Yes___ No___
24. Non-profit organization__? Yes ___ No___
25. Do you have strategies to reduce space use? If so, please
describe?_______________________________________________________________________
______________________________________________________________________________
___

30
26. Other comments on space planning and trends on office space per worker?
______________________________________________________________________________
______________________________________________________________________________