Embed Size (px)
Citation preview
ICES Advisory Committee on Fishery Management ICES CM 2005/ACFM:08
Report of the Working Group on the Assessment of Mackerel, Horse Mackerel, Sardine, and Anchovy (WGMHSA)
7–16 September 2004 ICES, Copenhagen
This report is not to be quoted without prior consultation with the General Secretary. The document is a report of an Expert Group under the auspices of the International Council for the Exploration of the Sea and does not necessarily represent the views of the Council.
WGHMSA Report 2005 1

International Council for the Exploration of the Sea
Conseil International pour l’Exploration de la Mer
H.C. Andersens Boulevard 44-46 DK–1553 Copenhagen V Denmark Telephone + 45 33 38 67 00 · Telefax +45 33 93 42 15
www.ices.dk · [email protected]
WGHMSA Report 2005 2
Contents
Executive Summary..............................................................................................................................................................
1 Introduction ................................................................................................................................................................ 1 1.1 Terms of Reference......................................................................................................................................... 1 1.2 Participants...................................................................................................................................................... 1 1.3 Quality and Adequacy of Fishery and Sampling data. .................................................................................... 2
1.3.1 Sampling data from commercial fishery.............................................................................................. 2 1.3.2 Catch data ............................................................................................................................................ 7 1.3.3 Discards ............................................................................................................................................... 7 1.3.4 Age-reading ......................................................................................................................................... 8 1.3.5 Biological data ..................................................................................................................................... 9 1.3.6 Quality Control and Data Archiving.................................................................................................... 9
1.4 Checklists for quality of assessments............................................................................................................ 11 1.5 Comment on update and benchmark assessments......................................................................................... 11 1.6 The ICES stock handbook............................................................................................................................. 12 1.7 Reference points relevant for WG MHSA .................................................................................................... 12 1.8 Relevant information on ecological/environmental studies related to small pelagic species........................ 12
2 Northeast Atlantic Mackerel .................................................................................................................................... 31 2.1 ICES advice applicable to 2003 and 2004 .................................................................................................... 31 2.2 The Fishery in 2003 ...................................................................................................................................... 33
2.2.1 Catch Estimates ................................................................................................................................. 33 2.2.2 Fleet Composition in 2003................................................................................................................. 34 2.2.3 Species Mixing .................................................................................................................................. 40 2.2.4 Salmon by-catch ................................................................................................................................ 44
2.3 Stock Components ........................................................................................................................................ 46 2.3.1 Biological evidence for stock components ........................................................................................ 46 2.3.2 Allocation of Catches to Component................................................................................................. 46
2.4 Biological Data ............................................................................................................................................. 46 2.4.1 Catch in numbers at age..................................................................................................................... 46 2.4.2 Length composition by fleet and country .......................................................................................... 46 2.4.3 Mean lengths at age and mean weights at age ................................................................................... 47 2.4.4 Maturity Ogive................................................................................................................................... 47 2.4.5 Natural Mortality and Proportion of F and M.................................................................................... 47
2.5 Fishery-independent Information.................................................................................................................. 60 2.5.1 Egg survey estimates of spawning biomass in 2004.......................................................................... 60
2.5.1.1 Description .......................................................................................................................... 60 2.5.2 Previous Egg survey estimate in the North Sea ................................................................................. 68 2.5.3 Examination of changes to potential fecundity in mackerel in the western area ............................... 68 2.5.4 Mortality estimates from tagging data ............................................................................................... 70
2.6 Effort and Catch per Unit Effort ................................................................................................................... 72 2.7 Distribution of mackerel in 2003 - 2004 ....................................................................................................... 79
2.7.1 Distribution of commercial catches in 2003 ...................................................................................... 79 2.7.2 Distribution of juvenile mackerel ...................................................................................................... 79 2.7.3 Distribution and migration of adult mackerel .................................................................................... 81 2.7.4 Aerial surveys .................................................................................................................................... 92 2.7.5 Acoustic surveys................................................................................................................................ 92
2.8 Data and Model Exploration ......................................................................................................................... 97 2.8.1 Trends and patterns in basic data ....................................................................................................... 97 2.8.2 Models used for exploration .............................................................................................................. 97 2.8.3 Sensitivity .......................................................................................................................................... 98
2.8.3.1 Weightings........................................................................................................................... 98 2.8.3.2 Outliers ................................................................................................................................ 99 2.8.3.3 Robustness of Parameter estimates...................................................................................... 99
2.8.4 Uncertainty and Bias.......................................................................................................................... 99 2.8.4.1 Structural Uncertainty.......................................................................................................... 99 2.8.4.2 Data Uncertainty................................................................................................................ 101
2.8.5 Retrospective patterns...................................................................................................................... 101 2.8.6 Choice of Assessment Model .......................................................................................................... 102 2.8.7 Dealing with early period of varying plus groups............................................................................ 102
WGHMSA Report 2005 1
2.9 State of the stock......................................................................................................................................... 127
2.9.1 Stock Assessment ............................................................................................................................ 127 2.9.2 Reliability of the Assessment and Uncertainty estimation .............................................................. 127 2.9.3 Reference Points .............................................................................................................................. 151
2.10 Catch predictions for 2005.......................................................................................................................... 156 2.11 Triennial TAC advise.................................................................................................................................. 165 2.12 Harvest control rules and future advisory framework................................................................................. 166 2.13 Special requests........................................................................................................................................... 175 2.14 Management Measures and Considerations................................................................................................ 175
3 Horse Mackerel ...................................................................................................................................................... 176 3.1 Fisheries in 2003 ......................................................................................................................................... 176 3.2 Stock Units.................................................................................................................................................. 176 3.3 Allocation of Catches to Stocks .................................................................................................................. 177 3.4 Estimates of discards................................................................................................................................... 178 3.5 Species Mixing............................................................................................................................................ 178 3.6 Length Distribution by Fleet and by Country: ............................................................................................ 178 3.7 Egg surveys................................................................................................................................................. 179
3.7.1 Description....................................................................................................................................... 179 4 North Sea Horse Mackerel (Divisions IIIA (Excluding Western Skagerrak), IVbc and VIId ............................... 196
4.1 ACFM advice Applicable to 2003 .............................................................................................................. 196 4.2 The Fishery in 2003 on the North Sea stock .............................................................................................. 196 4.3 Fishery-independent Information................................................................................................................ 196
4.3.1 Egg Surveys..................................................................................................................................... 196 4.3.2 Bottom trawl surveys....................................................................................................................... 197
4.4 Biological Data ........................................................................................................................................... 197 4.4.1 Catch in Numbers at Age................................................................................................................. 197 4.4.2 Mean weight at age and mean length at age .................................................................................... 197 4.4.3 Maturity at age................................................................................................................................. 197 4.4.4 Natural mortality.............................................................................................................................. 197
4.5 Data exploration.......................................................................................................................................... 198 4.5.1 Exploratory analysis of data by Ad hoc method. ............................................................................. 198 4.5.2 Results of the Ad Hoc assessment method ...................................................................................... 200
4.6 Reference Points for Management Purposes............................................................................................... 200 4.7 Harvest Control Rules................................................................................................................................. 200 4.8 Management Measures and Considerations................................................................................................ 200
5 Western Horse Mackerel (Divisions IIa, IIIa (Western Part), IVa, Vb, VIa, VIIa–c, VIIe–k, and VIIIa,b,d,e ...... 212 5.1 ACFM Advice Applicable to 2003 and 2004.............................................................................................. 212 5.2 The Fishery in 2003 of the Western Stock.................................................................................................. 213 5.3 Fishery Independent information ................................................................................................................ 213
5.3.1 Egg survey estimates of spawning biomass..................................................................................... 213 5.3.2 Bottom trawl surveys. ...................................................................................................................... 213 5.3.3 Environmental Effects ..................................................................................................................... 213
5.4 Effort and catch per unit of effort. .............................................................................................................. 214 5.5 Biological Data ........................................................................................................................................... 214
5.5.1 Catch in numbers ............................................................................................................................. 214 5.5.2 Mean length at age and mean weight at age .................................................................................... 214 5.5.3 Maturity ogive ................................................................................................................................. 215 5.5.4 Natural mortality.............................................................................................................................. 215
5.6 State of the Stock ........................................................................................................................................ 215 5.6.1 Data exploration and preliminary modelling ................................................................................... 215 5.6.2 Stock assessment ............................................................................................................................. 218 5.6.3 Reliability of the assessment............................................................................................................ 219
5.7 Catch Prediction.......................................................................................................................................... 219 5.8 Short and medium term risk analysis .......................................................................................................... 219 5.9 Long-Term Yield ........................................................................................................................................ 219 5.10 Reference Points for Management Purposes............................................................................................... 219 5.11 Harvest control rules ................................................................................................................................... 219 5.12 Management considerations........................................................................................................................ 219
WGHMSA Report 2005 2
6 Southern Horse Mackerel (Division IXA) ............................................................................................................. 240 6.1 ICES advice applicable to 2003 and 2004 .................................................................................................. 240 6.2 The Fishery in 2003 .................................................................................................................................... 240 6.3 Biological data: ........................................................................................................................................... 241
6.3.1 Catch in numbers at age................................................................................................................... 241 6.3.2 Mean length and mean weight-at-age .............................................................................................. 241 6.3.3 Maturity-at-age ................................................................................................................................ 241 6.3.4 Natural mortality.............................................................................................................................. 241
6.4 Fishery Independent Information and CPUE Indices of Stock Size ........................................................... 241 6.4.1 Trawl surveys .................................................................................................................................. 241 6.4.2 Egg surveys...................................................................................................................................... 242
6.5 Effort and Catch per Unit Effort ................................................................................................................. 242 6.6 Recruitment forecast ................................................................................................................................... 242 6.7 State of the stock......................................................................................................................................... 242
6.7.1 Data exploration............................................................................................................................... 242 6.7.2 Stock assessment ............................................................................................................................. 243 6.7.3 Reliability of the assessment............................................................................................................ 243
6.8 Short-term catch predictions ....................................................................................................................... 243 6.9 Management considerations........................................................................................................................ 244 6.10 Roadblocks to the improvement of the stock assessment ........................................................................... 244
7 Sardine General ...................................................................................................................................................... 270 7.1 The fisheries for sardine in the ICES area................................................................................................... 270
7.1.1 Catches in areas outside the assessment area................................................................................... 270 7.2 Surveys for sardine in areas outside the assessment area............................................................................ 270 7.3 Stock identification distribution and migration in relation to oceanographic effects.................................. 270
8 Sardine in VIIIc and IXa ........................................................................................................................................ 283 8.1 ACFM Advice Applicable to 2004 ............................................................................................................. 283 8.2 The fishery in 2003 ..................................................................................................................................... 283 8.3 Fishery independent information ................................................................................................................ 284
8.3.1 DEPM – based SSB estimates ......................................................................................................... 284 8.3.2 Acoustic surveys.............................................................................................................................. 284
8.3.2.1 Portuguese Acoustic Surveys 2003/2004........................................................................... 284 8.3.2.2 Spanish April 2004 Acoustic Survey................................................................................. 285
8.4 Biological data ............................................................................................................................................ 285 8.4.1 Catch numbers at length and age .................................................................................................... 285 8.4.2 Mean length and mean weight at age............................................................................................... 286 8.4.3 Maturity and stock weights at age ................................................................................................... 286 8.4.4 Natural mortality.............................................................................................................................. 286
8.5 Effort and catch per unit effort.................................................................................................................... 286 8.6 Recruitment forecasting and Environmental effects ................................................................................... 286 8.7 Data exploration.......................................................................................................................................... 287 8.8 State of Stock .............................................................................................................................................. 288
8.8.1 Stock assessment ............................................................................................................................. 288 8.8.2 Reliability of the assessment............................................................................................................ 289
8.9 Catch predictions ........................................................................................................................................ 290 8.9.1 Divisions VIIIc and IXa................................................................................................................... 290
8.10 Short term risk analysis............................................................................................................................... 290 8.11 Medium term projections ............................................................................................................................ 290 8.12 Long term yield........................................................................................................................................... 290 8.13 Uncertainty in the assessment ..................................................................................................................... 290 8.14 Reference points for management purposes................................................................................................ 290 8.15 Harvest control rules ................................................................................................................................... 290 8.16 Management considerations........................................................................................................................ 290
9 Anchovy – General................................................................................................................................................. 334 9.1 Stock Units.................................................................................................................................................. 334 9.2 Distribution of the Anchovy Fisheries ........................................................................................................ 334
10 Anchovy - Subarea VIII ......................................................................................................................................... 337 10.1 ACFM Advice and STECF recommendations applicable to 2004.............................................................. 337 10.2 The fishery in 2003 ..................................................................................................................................... 337
WGHMSA Report 2005 3
10.2.1 Catches for 2003 and first half of 2004 ........................................................................................... 338 10.2.2 Discards ........................................................................................................................................... 338
10.3 Biological data ............................................................................................................................................ 338 10.3.1 Catch in numbers at Age.................................................................................................................. 338 10.3.2 Mean Length at age and mean Weight at Age ................................................................................. 339 10.3.3 Maturity at Age................................................................................................................................ 339 10.3.4 Natural Mortality. ............................................................................................................................ 339
10.4 Fishery-Independent Information................................................................................................................ 340 10.4.1 Egg surveys...................................................................................................................................... 340 10.4.2 Acoustic surveys.............................................................................................................................. 341 10.4.3 Comparison between direct measurements of stocks by DEPM and acoustics ............................... 342 10.4.4 Surveys on Juvenile anchovy........................................................................................................... 342
10.5 Effort and Catch per Unit Effort ................................................................................................................. 343 10.6 Recruitment forecasting and environment .................................................................................................. 343 10.7 State of the stock......................................................................................................................................... 344
10.7.1 Data exploration and Models of assessment .................................................................................... 344 10.7.1.1 ICA .................................................................................................................................... 345 10.7.1.2 Bayesian biomass-based model ......................................................................................... 346
10.7.2 Stock assessment ............................................................................................................................. 347 10.7.3 Reliability of the assessment and uncertainty of the estimation ...................................................... 348
10.8 Catch predictions ........................................................................................................................................ 349 10.9 Reference points for management purposes................................................................................................ 350 10.10 Harvest Control Rules................................................................................................................................. 351 10.11 Management Measures and Considerations................................................................................................ 351
11 Anchovy in Division IXa ....................................................................................................................................... 424 11.1 ACFM Advice Applicable to 2003 and 2004.............................................................................................. 424 11.2 The Fishery in 2003 .................................................................................................................................... 424
11.2.1 Landings in Division IXa................................................................................................................. 424 11.2.2 Landings by Sub-division ................................................................................................................ 424
11.3 Fishery-Independent Information................................................................................................................ 425 11.3.1 Acoustic Surveys ............................................................................................................................. 425 11.3.2 Egg Surveys..................................................................................................................................... 426
11.4 Biological Data ........................................................................................................................................... 427 11.4.1 Catch Numbers at Age..................................................................................................................... 427 11.4.2 Mean Length- and Mean Weight at Age.......................................................................................... 427 11.4.3 Maturity at Age................................................................................................................................ 428 11.4.4 Natural Mortality ............................................................................................................................. 428
11.5 Effort and Catch per Unit Effort ................................................................................................................. 428 11.6 Recruitment Forecasting ............................................................................................................................. 428 11.7 Data Exploration ......................................................................................................................................... 429 11.8 Reference Points for Management Purposes............................................................................................... 430 11.9 Harvest Control Rules................................................................................................................................. 430 11.10 Management Considerations....................................................................................................................... 430
12 Recommendations .................................................................................................................................................. 459 13 References 1998-2004............................................................................................................................................ 461 14 Abstracts of Working Documents .......................................................................................................................... 466
WGHMSA Report 2005 4
1 Introduction
1.1 Terms of Reference The Working Group on the Assessment of Mackerel, Horse Mackerel, Sardine, and Anchovy [WGMHSA] met at
ICES Headquarters from 7–16 September 2004 to address the following terms of reference, as decided by the 91st Statutory Meeting:
a) assess the status of and provide catch options for 2004 for the stocks of mackerel and horse mackerel (defining stocks as appropriate);
b) assess the status of and provide catch options for 2005 for the sardine stock in Divisions VIIIc and IXa; c) assess the status of and provide catch options for 2005 for the anchovy stocks in Subarea VIII and Division IXa; d) consider updated information on the stock structure of horse mackerel; e) for sardine update information on the stock identification, composition, distribution and migration in relation to
oceanographic effects; f) finalise the evaluation of the harvest control rule for anchovy fishing; g) provide specific information on possible deficiencies in the 2004 assessments including any major inadequacies in
the data on catches, effort or discards, any major inadequacies in research vessel surveys data, and any major difficulties in model formulation, including inadequacies in available software. The consequences from these deficiencies for the assessment of the status of the stocks and for the projection should be clarified;
h) comment on this meeting’s assessments compared to the last assessment of the same stock, for stocks for which a full or update assessment is presented;
i) document fully the methods to be applied in subsequent update assessments and list factors that would warrant reconsideration of doing an update, and consider doing a benchmark ahead of schedule, for stocks for which benchmark assessments are done;
j) consider the report of the Study Group on the Bycatch of Salmon in Pelagic Trawl Fisheries with regard to the most appropriate methods for estimating salmon bycatch in pelagic fisheries.
Terms of reference a –g & i are addressed under the respective stocks. Where relevant, term of reference h is also
addressed specifically for each stock. In addition, and overview of the input data and their shortcomings is given in Section 1.3, and an overview of the assessment methods in Section 1.4. Term of reference j is addressed in Section 2.2.4.
The present report is structured as in previous years. There is a new Section 1.8 which provides summary information on ecological factors affecting small pelagics. This information is intended to guide the reader to the relevant ICES groups or publications, rather than deal with the issues in depth. In the case of Sardine this issue is dealt with in more detail in Section 8.2, addressing term of reference e. In addition to the Terms of Reference, the WGMHSA was requested to perform a “Benchmark” assessment for NEA Mackerel . The structure of Section 2 reflects this with a greater consideration given to data and model exploration. All other assessments, with the exception of Sardine in VIIIc & IXa, which are considered as “Update” are either in a developmental or an exploratory stage.
1.2 Participants Pablo Abaunza Spain Jose Ma Bellido Spain Sergei Belikov Russia Miguel Bernal Spain Mark Dickey-Collas Netherlands Leonie Dransfeld (part time) Ireland Erwan Duhamel France Guus Eltink Netherlands Emma Hatfield UK (Scotland) Leire Ibaibarriaga Spain Svein A. Iversen Norway Jan Arge Jacobsen (part time) Faroe Islands Ciarán Kelly (Chair) Ireland Marco Kienzle (part time) UK (Scotland)
WGHMSA Report 2005 1
Marta Lopes Portugal Jacques Massé France Alberto Murta Portugal José de Oliveira UK (England and Wales) Fernando Ramos Spain David Reid (part time) UK (Scotland) Beatriz Roel UK (England and Wales) Eugeny Shamrai Russia Alexandra Silva Portugal Dankert Skagen Norway Aril Slotte (part time) Norway Per Sparre Denmark Andres Uriarte Spain Dimitri Vasilyev Russia Begoña Villamor Spain Christopher Zimmermann Germany
1.3 Quality and Adequacy of Fishery and Sampling data.
1.3.1 Sampling data from commercial fishery The Working Group again carried out a brief review of the sampling data and the level of sampling on the commercial fisheries. Sampling levels have decreased for mackerel (to 80%) and are below the long term average. The proportion of the sampled horse mackerel catch has again increased after the low sampling intensity in 1999. In 2003 the sampling level was 79% and this is still considered inadequate for some Divisions and periods (especially in the juvenile areas (see section 5.12). Sardines continue to be well sampled. This year samples were provided by France. However samples should be obtained from all areas where sardines are caught. Anchovy sampling is similar to 2002 and continues at a high level. A short summary of the data, similar to that presented in recent Working Group is shown for each stock. Sampling programmes by EU countries have been partially funded under the new EU sampling directive and this has contributed to the improvement in sampling levels. Under this data collection regulation fish in EU countries are supposed to be sampled in the country into which they are landed.
The sampling programmes on the various species are summarised as follows.
Mackerel
Year Total catch t % Catch covered by sampling programme
No. Samples
No. Measured
No. Aged
1992 760,000 85 920 77,000 11,800 1993 825,000 83 890 80,411 12,922 1994 822,000 80 807 72,541 13,360 1995 755,000 85 1,008 102,383 14,481 1996 563,600 79 1,492 171,830 14,130 1997 569,600 83 1,067 138,845 16,355 1998 1999 2000 2001
666,700 608,928 667,158 677,708
80 86 76 83
1,252 1,109 1,182 1,419
130,011 116,978 122,769 142,517
19,371 17,432 15,923 19,824
2002 717,882 87 1,450 184,101 26,146 2003 617330 80 1,212 148,501 19,779
In 2003 80% of the total catch was covered by the sampling programmes. This represents a decrease since last
year. The number of samples and numbers of fish aged and measured have all decreased in 2003. Spain, Portugal and Russia carried out intensive programmes on their catches, as in 2002. Norway and Scotland also continued to sample their entire catch thoroughly. There have been marked decreases in the sampling levels for the Netherlands, Ireland, Germany and Denmark from 2002 to 2003. England & Wales’ proportion of catch sampled increased from last year’s 15% to 17% in 2003; however, the total number of samples taken and measured decreased. France, the Faroe Islands, Northern Ireland, Belgium, Iceland and Sweden did not sample any catches, although significant catches are only taken by the first three of those countries.
There were more areas than in previous years that were not adequately sampled. In general these areas were in the southern North Sea, the west of Ireland, the English Channel and north Biscay (with the exception of VIIId)
WGHMSA Report 2005 2
Less than 50% of the catch was sampled in IVc, VIIb,c,d, and VIIIa,b. Of these areas, significant catches of about 40,000t were insufficiently sampled in VIIb,d, and VIIIa.
No sampling of catches was carried out in IIb, IIIa, IVb, VIb, VIIa,g, and VIIIe. However these areas represent only minor catches of about 4,000 t in total.
Figures 1.3.1.1 & 1.3.1.2 illustrate sampling levels of mackerel by mapping the numbers measured and numbers aged relative to the size of the catch.
The sampling summary of the mackerel catching countries is shown in the following table.
Country Official
Catch % of catch sampled No.
samples No.measured No.
Aged Belgium 2 0 0 0 0 Denmark 27,621 88 14 867 854 UK (England &
Wales) 24,451 17 27 3,133 1,449 Faroe Islands 14,014 0 0 0 0 France 22,906 0 0 0 0 Germany 24,059 45 36 19,293 821 Iceland 122 0 0 0 0 Ireland 67,355 64 15 2,964 1,121 Norway 163,406 100 186 25,050 1,864 Portugal 2,749 100 295 11,512 1,405 Russia 40,026 100 154 34,714 1,528 UK (Scotland) 146,131 100 163 25,911 5,211 Spain* 23,583 100 231 15,024 3,070 Sweden 4,450 0 0 0 0 The Netherlands 30,468 86 74 6,402 1,949 UK (Northern
Ireland) 12,426 0 0 0 0 Total 603,770 80 1,212 148,501 19,779
∗WG catches Horse Mackerel The following table shows a summary of the overall sampling intensity on horse mackerel catches in recent years.
Year Total catch t % Catch covered by
sampling programme Samples Measured Aged
1992 436,500 45 1,803 158,447 5,797 1993 504,190 75 1,178 158,954 7,476 1994 447,153 61 1,453 134,269 6,571 1995 580,000 48 2,041 177,803 5,885 1996 460,200 63 2,498 208,416 4,719 1997 518,900 75 2,572 247,207 6,391 1998 399,700 62 2,539 245,220 6,416 1999 363,033 51 2,158 208,387 7,954 2000 2001 2002 2003
272,496 283,331 241,336 241,830
56 64 72 79
1,610 1,502 1,768 1,568
186,825 204,400 235,697 200,563
5,874 8,117 8,561 12,377
The overall sampling levels on horse mackerel appear to have increased in 2003, but the number of samples has
decreased. The large numbers of samples and measured fish are due mainly to intensive length measurement programs in the southern areas. In 2003, 63 % of the horse mackerel measured were from Division IXa.
Countries that carried out comprehensive sampling programmes (>90%) in 2003 were Netherlands, Portugal, Spain and Norway. Sampling intensity from Ireland and Germany was slightly higher than last year, 71% and 63% respectively. UK (England & Wales), France, Denmark and Sweden continue to take considerable catches but no samples were available. Some of these catches may be landed outside these countries. The lack of sampling data for relatively large portions of the horse mackerel catch continues to have a serious effect on the accuracy and reliability of the assessment and the Working Group remain concerned about the low number of fish that are aged.
WGHMSA Report 2005 3
Figures 1.3.1.3 & 1.3.1.4 illustrate sampling levels of horse mackerel by mapping the numbers measured and numbers aged relative to the size of the catch.
The following table shows the most important horse mackerel catching countries and the summarised details of their sampling programme in 2003.
Country Official
catch t % Catch covered by sampling programme
Samples Measured Aged
Belgium 5 0.0 0 0 0 Denmark 14,641 Not available 4 366 118 UK (England &Wales) 6,405 0.0 0 0 0 Faroe Islands 809 0.0 0 0 0 France 12,710 0.0 0 0 0 Germany 18,762 62 44 18,447 966 Ireland 36483 71 29 5,618 1,968 Norway 20,515 99 11 975 413 Portugal 11,241 100 939 130,736 1,412 Russia 2 0.0 0 0 0 UK (Scotland) 722 0.0 0 0 0 Spain* 32,228 100 384 26,270 2,551 Sweden 1,074 0.0 0 0 0 The Netherlands 71,445 98 85 18,151 2,125 Total 194,184 79 1,568 200,563 9,553 ∗ WG catches,
In spite of the improvement the Working Group, once again, strongly recommends that all countries with relatively high horse mackerel catches should sample for age at an adequate level.
The horse mackerel sampling intensity for the Western stock (N.B. this now includes VIIIc – see section 3) was as follows:
Country Official catch
t % Catch covered by sampling programme
Samples Measured Aged
Belgium 0 Denmark 11,739 n.a. 4 366 118 UK (England & Wales)
4,440 0 0 0 0
Faroes Islands 59 0 0 0 0 France 10,383 0 0 0 0 Germany 15,826 71 31 14,648 856 Ireland 35,855 71 29 5,618 1,968 Norway 20,315 99 11 975 413 Russia 0 UK (Scotland) 672 0 0 0 0 Spain* 24,588 100 257 15,913 2,379 Sweden 1,074 0 0 0 0 The Netherlands 47,327 97 60 14,509 1,500 Total 172,479 76 392 52,029 7,234 ∗ WG catches
WGHMSA Report 2005 4
The horse mackerel sampling intensity for the North Sea stock (IVb,c, VIId and the eastern part of IIIa) was as follows
Country Official
catch t % Catch covered by
sampling programme Samples Measured Aged
Belgium 5 0 0 0 0 Denmark 2,902 0 0 0 0 UK (England & Wales)
1,965 0 0 0 0
France 2,326 0 0 0 0 Germany 2,936 19 13 3,799 110 Ireland 0 Norway 0 Sweden 0 The Netherlands 24,118 100 25 3,642 625 Total 35,052 67 38 7,441 735
The sampling intensity for the Southern stock (N.B. this no longer includes VIIIc) was as follows Country Official
catch t % Catch covered by sampling programme
Samples Measured Aged
Portugal 11,241 100 939 130,736 1412 Spain* 8,324 100 172 10,357 172 Total 19,565 100 1,111 141,093 1584
∗ WG catches
In spite of the improvement the Working Group, once again, strongly recommends that all countries with relatively high horse mackerel catches should sample for age at an adequate level.
Sardine The sampling programmes on the assessed sardine stock in VIIIc and IXa are summarised as follows.
Year Total catch t % Catch covered by sampling programme
Samples Measured Aged
1992 164,000 79 788 66,346 4,086 1993 149,600 96 813 68,225 4,821 1994 162,900 83 748 63,788 4,253 1995 138,200 88 716 59,444 4,991 1996 126,900 90 833 73,220 4,830 1997 134,800 97 796 79,969 5,133
1998 209,422 92 1,372 123,754 12,163 1999 101,302 93 849 91,060 8,399 2000 91,718 94 777 92,517 7,753 2001 110,276 92 874 115,738 8,058 2002 99,673 100 814 96,968 10,231 2003 97,831 100 756 93,102 10,629
WGHMSA Report 2005 5
The summarised details of individual sampling programmes in 2003 are shown below. These catches cover all areas where sardine is caught (VII, VIII and IXa.)
Country Official catch
t % Catch covered by
sampling programme Samples Measured Aged
Spain 32,416 100 243 25,175 3,584 Portugal 66,528 100 513 67,917 7,045 France 21,518 71 6,668 1,403 UK (England &Wales)
4,929 0 0 0 0
Germany 16* 25 3 835 292 Total 125,407 57 830 100,595 12,324 ∗ WG catches * includes 4 tonnes of discards
The overall sampling levels for sardine are adequate for the stock area VIIIc and IXa. Length distributions and catch-at-age data in 2003 of Sardine by France in areas VIIIa,b were reported to the WG. Details are listed in section 7, where similar information is also reported for 2002. Catches of sardine in Area VII are not appropriately sampled. This is considered to be important given that catches in this area are increasing. Anchovy
The sampling programmes carried out on anchovy in 2003 are summarised below. The programmes are shown separately for Sub area VIII and for Division IX a. Sampling throughout Divisions VIIIa+b and VIIIc appear to be satisfactory. The overall sampling levels for recent years are shown below
Year Total
catch XIII+IXa % Catch covered by sampling
programme Samples Measured Aged
1992 40,800 92 289 17,112 3,805 1993 39,700 100 323 21,113 6,563 1994 34,600 99 281 17,111 2,923 1995 42,104 83 ? ? ? 1996 38,773 93 214 17,800 4,029 1997 27,440 76 258 18,850 5,194 1998 31,617 100 268 15,520 5,181 1999 40,156 100 397 33,778 10,227 2000 39,497 99 209 18,023 4,713 2001 49,247 58 317 28,615 4,683 2002 26,313 94 216 45,909 4,685 2003 15,864 96 205 22,081 5,324
The sampling programmes for France and Spain in Sub-area VIII in 2003 are summarised below.
Country Division Official catch % Catch covered by sampling programme
Samples Measured Aged
France VIII a, b 7,593 99 73 5,506 1,6381 Spain∗ VIII a 0 - - - - Spain∗ VIII b 941 100 35 2,256 671 Spain∗ VIII c east 2,061 98 33 2,141 1,573 Total VIII 10,595 99 141 9,903 3,882 ∗ WG catches 11,099 from the scientific survey
WGHMSA Report 2005 6
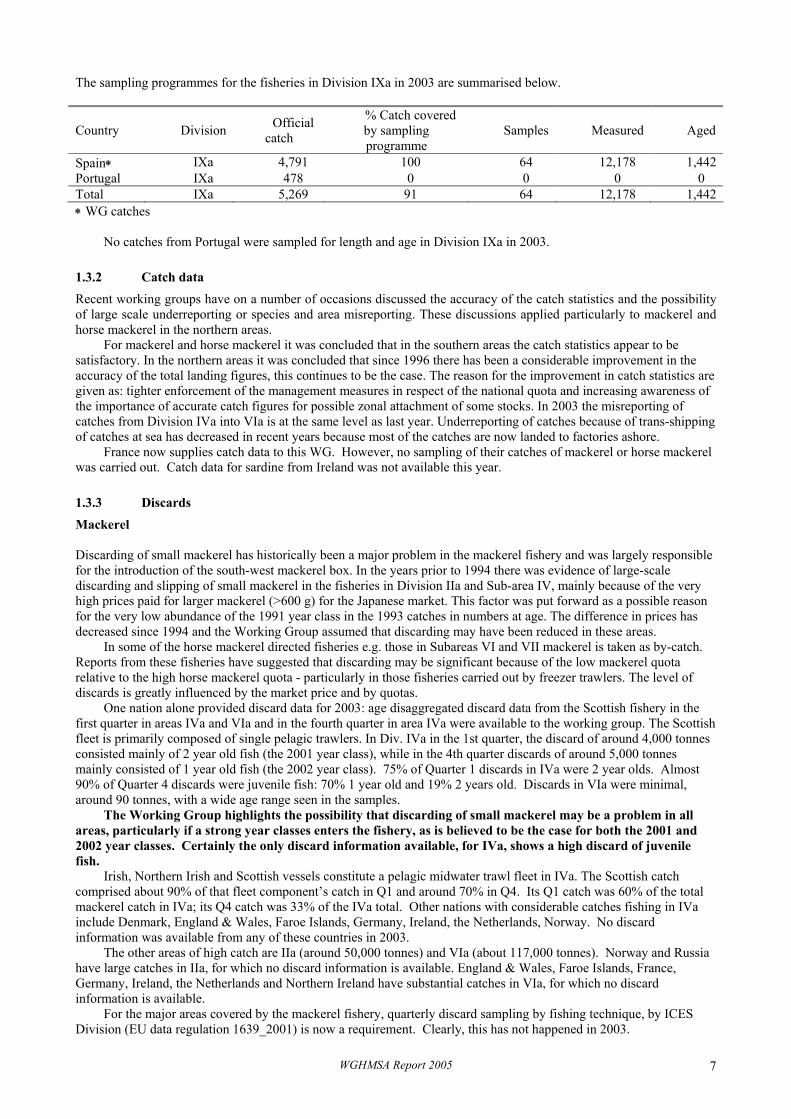
The sampling programmes for the fisheries in Division IXa in 2003 are summarised below.
Country Division Official catch
% Catch covered by sampling programme
Samples Measured Aged
Spain∗ IXa 4,791 100 64 12,178 1,442 Portugal IXa 478 0 0 0 0 Total IXa 5,269 91 64 12,178 1,442 ∗ WG catches
No catches from Portugal were sampled for length and age in Division IXa in 2003.
1.3.2 Catch data Recent working groups have on a number of occasions discussed the accuracy of the catch statistics and the possibility of large scale underreporting or species and area misreporting. These discussions applied particularly to mackerel and horse mackerel in the northern areas.
For mackerel and horse mackerel it was concluded that in the southern areas the catch statistics appear to be satisfactory. In the northern areas it was concluded that since 1996 there has been a considerable improvement in the accuracy of the total landing figures, this continues to be the case. The reason for the improvement in catch statistics are given as: tighter enforcement of the management measures in respect of the national quota and increasing awareness of the importance of accurate catch figures for possible zonal attachment of some stocks. In 2003 the misreporting of catches from Division IVa into VIa is at the same level as last year. Underreporting of catches because of trans-shipping of catches at sea has decreased in recent years because most of the catches are now landed to factories ashore.
France now supplies catch data to this WG. However, no sampling of their catches of mackerel or horse mackerel was carried out. Catch data for sardine from Ireland was not available this year.
1.3.3 Discards
Mackerel
Discarding of small mackerel has historically been a major problem in the mackerel fishery and was largely responsible for the introduction of the south-west mackerel box. In the years prior to 1994 there was evidence of large-scale discarding and slipping of small mackerel in the fisheries in Division IIa and Sub-area IV, mainly because of the very high prices paid for larger mackerel (>600 g) for the Japanese market. This factor was put forward as a possible reason for the very low abundance of the 1991 year class in the 1993 catches in numbers at age. The difference in prices has decreased since 1994 and the Working Group assumed that discarding may have been reduced in these areas.
In some of the horse mackerel directed fisheries e.g. those in Subareas VI and VII mackerel is taken as by-catch. Reports from these fisheries have suggested that discarding may be significant because of the low mackerel quota relative to the high horse mackerel quota - particularly in those fisheries carried out by freezer trawlers. The level of discards is greatly influenced by the market price and by quotas.
One nation alone provided discard data for 2003: age disaggregated discard data from the Scottish fishery in the first quarter in areas IVa and VIa and in the fourth quarter in area IVa were available to the working group. The Scottish fleet is primarily composed of single pelagic trawlers. In Div. IVa in the 1st quarter, the discard of around 4,000 tonnes consisted mainly of 2 year old fish (the 2001 year class), while in the 4th quarter discards of around 5,000 tonnes mainly consisted of 1 year old fish (the 2002 year class). 75% of Quarter 1 discards in IVa were 2 year olds. Almost 90% of Quarter 4 discards were juvenile fish: 70% 1 year old and 19% 2 years old. Discards in VIa were minimal, around 90 tonnes, with a wide age range seen in the samples.
The Working Group highlights the possibility that discarding of small mackerel may be a problem in all areas, particularly if a strong year classes enters the fishery, as is believed to be the case for both the 2001 and 2002 year classes. Certainly the only discard information available, for IVa, shows a high discard of juvenile fish.
Irish, Northern Irish and Scottish vessels constitute a pelagic midwater trawl fleet in IVa. The Scottish catch comprised about 90% of that fleet component’s catch in Q1 and around 70% in Q4. Its Q1 catch was 60% of the total mackerel catch in IVa; its Q4 catch was 33% of the IVa total. Other nations with considerable catches fishing in IVa include Denmark, England & Wales, Faroe Islands, Germany, Ireland, the Netherlands, Norway. No discard information was available from any of these countries in 2003.
The other areas of high catch are IIa (around 50,000 tonnes) and VIa (about 117,000 tonnes). Norway and Russia have large catches in IIa, for which no discard information is available. England & Wales, Faroe Islands, France, Germany, Ireland, the Netherlands and Northern Ireland have substantial catches in VIa, for which no discard information is available.
For the major areas covered by the mackerel fishery, quarterly discard sampling by fishing technique, by ICES Division (EU data regulation 1639_2001) is now a requirement. Clearly, this has not happened in 2003.
WGHMSA Report 2005 7
Horse Mackerel In the past discards of juvenile horse mackerel have been thought to constitute a problem. However, in recent years a targeted fishery has developed on juveniles, including 1-year old fish. Therefore discarding of juveniles is now thought to be unlikely.
Because of the potential importance of significant discards levels on the mackerel and horse mackerel assessments the Working Group again recommends that observers should be placed on board vessels in those areas in which discarding may be a problem. Existing observer programmes should be continued.
Sardine No observer programme has been conducted to collect more information on the importance of slipping but research on the effects of slipping on sardine survival are in progress.
Anchovy
There are no estimates of discards in the anchovy fishery.
1.3.4 Age-reading Reliable age data are an important pre-requisite in the stock assessment process. The accuracy and precision of these data, for the various species, is kept under constant review by the Working Group. Mackerel At the 2001 meeting the Working Group on the Assessment of Mackerel, Horse Mackerel, Sardine, and Anchovy it was recommended that institutes examine their otolith preparation technique for mackerel and that a new mackerel otolith exchange be carried out to evaluate the otolith processing techniques of all institutes that are providing age data to this Working Group.
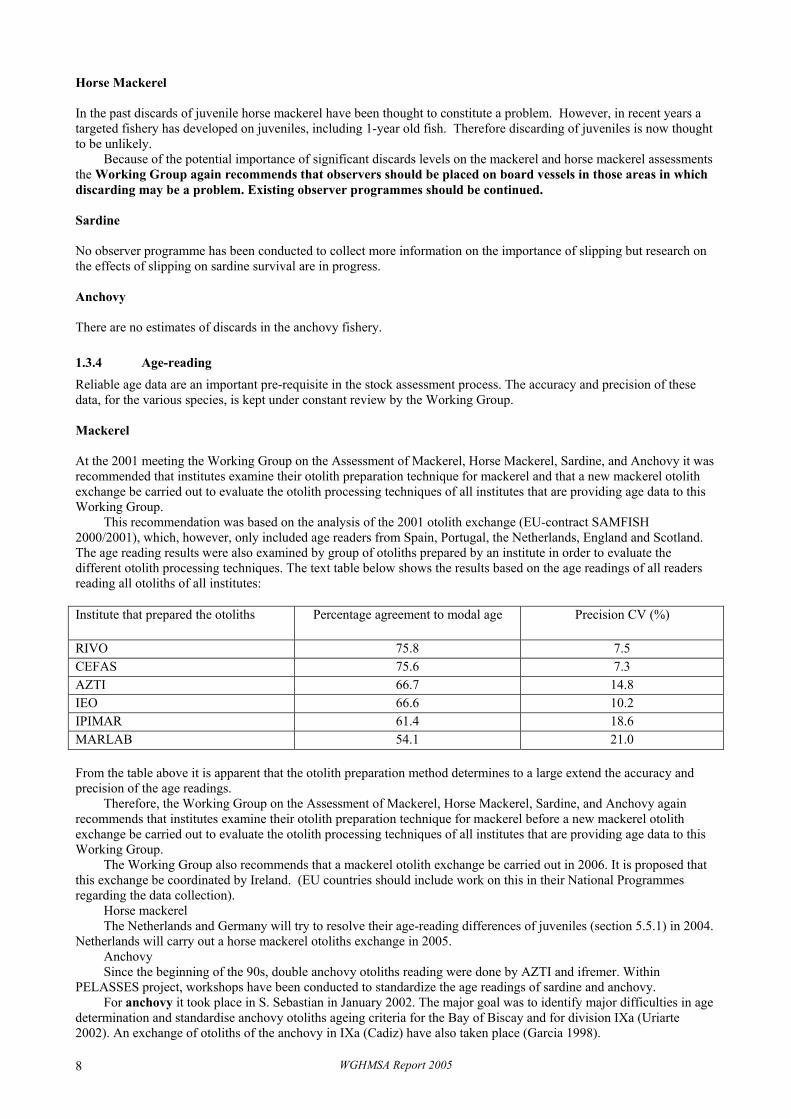
This recommendation was based on the analysis of the 2001 otolith exchange (EU-contract SAMFISH 2000/2001), which, however, only included age readers from Spain, Portugal, the Netherlands, England and Scotland. The age reading results were also examined by group of otoliths prepared by an institute in order to evaluate the different otolith processing techniques. The text table below shows the results based on the age readings of all readers reading all otoliths of all institutes:
Institute that prepared the otoliths Percentage agreement to modal age Precision CV (%)
RIVO 75.8 7.5 CEFAS 75.6 7.3 AZTI 66.7 14.8 IEO 66.6 10.2 IPIMAR 61.4 18.6 MARLAB 54.1 21.0 From the table above it is apparent that the otolith preparation method determines to a large extend the accuracy and precision of the age readings.
Therefore, the Working Group on the Assessment of Mackerel, Horse Mackerel, Sardine, and Anchovy again recommends that institutes examine their otolith preparation technique for mackerel before a new mackerel otolith exchange be carried out to evaluate the otolith processing techniques of all institutes that are providing age data to this Working Group.
The Working Group also recommends that a mackerel otolith exchange be carried out in 2006. It is proposed that this exchange be coordinated by Ireland. (EU countries should include work on this in their National Programmes regarding the data collection).
Horse mackerel The Netherlands and Germany will try to resolve their age-reading differences of juveniles (section 5.5.1) in 2004.
Netherlands will carry out a horse mackerel otoliths exchange in 2005. Anchovy Since the beginning of the 90s, double anchovy otoliths reading were done by AZTI and ifremer. Within
PELASSES project, workshops have been conducted to standardize the age readings of sardine and anchovy. For anchovy it took place in S. Sebastian in January 2002. The major goal was to identify major difficulties in age
determination and standardise anchovy otoliths ageing criteria for the Bay of Biscay and for division IXa (Uriarte 2002). An exchange of otoliths of the anchovy in IXa (Cadiz) have also taken place (Garcia 1998).
WGHMSA Report 2005 8
According to the discrepancies which appeared some year in Group 2 of Bay of Biscay anchovy, new exchanges of samples will be done between Spain and France on the 2 previous years otoliths in 2005 in order to check particular situations.
For the Bay of Biscay anchovy, two exchange of otoliths took place some years ago, of which results were available at the previous meeting (Astudillo et al. 1990 & Villamor et al. WD1996).
Sardine
The last sardine age reading workshop was carried out in 2002 within the framework of project PELASSES, and
involved otolith samples collected within the area from the Celtic Sea to the Gulf of Cadiz (Soares et al., 2004). There is an exchange of otoliths going on in 2004 and a workshop to discuss the results from this exchange is
planned for 2005.
1.3.5 Biological data The main problems in relation to other biological data identified by the Working Group are listed by species. Mackerel
There is inadequate sampling for stock weights during the spawning season. Horse Mackerel There is no new information on horse mackerel fecundity. Information on the spawning nature of horse mackerel is now urgently required. This is a consequence of discussions at WGMEGS (2003) whereby it is now uncertain if horse mackerel is a determinate spawner. In light of the recent findings, SSB indices from the survey are no longer considered as valid, and a different method will be needed to provide a fishery independent index for this species (this is further discussed in section 6.3.1). Sardine
The exploratory analysis of input data highlighted the need to revise the estimates of maturity ogives and stock weights at age of the sardine stock (sections 8.4.3 and 8.7). Maturity and weight at age estimates from surveys are different from catch data estimates and may change considerably during the spawning season due to the seasonal cycle of maturation and fattening. There are gaps in the survey series and the data sets and methodology used to provide these estimates have not been consistent through time. There is also evidence of an increase in stock and catch weights at age in the last ten years while the proportion of mature 0-group fish has changed considerable along the time series. Research on these issues is on course within the framework of Project “SARDYN”, therefore new guidelines on how to proceed with the revision of maturity and stock weights at age is expected in the near future.
Anchovy
There is inadequate sampling of anchovy from the French fishery in quarter 1.
1.3.6 Quality Control and Data Archiving Current methods of compiling fisheries assessment data. Information on official, area misreported, unallocated, discarded and sampled catches have again this year been recorded by the national laboratories on the WG-data exchange sheet (MS Excel; for definitions see text table below) and sent to the species co-ordinators. Co-ordinators collate data using the latest version of sallocl (Patterson, 1998) which produces a standard output file (Sam.out). However only sampled, official, WG catch and discards are available in this file.
There are at present no defined criteria on how to allocate samples of catch numbers, mean length and mean weight at age to unsampled catches, but the following general process is implemented by the species co-ordinators. Searches are made for appropriate samples by gear (fleet), area, and quarter, if an exact match is not available the search will move to a neighbouring area, if the fishery extends to this area in the same quarter. More than one sample may be allocated to an unsampled catch, in this case a straight mean or weighted mean of the observations may be used. If there are no samples available the search will move to the closest non-adjacent area by gear (fleet) and quarter, but not in all cases. For example in the case of NEA mackerel samples from the southern area are not allocated to unsampled catches in the western area. It would be very difficult to formulate an absolute definition of allocation of samples to unsampled catches which was generic to all stocks, however full documentation of any allocations made are stored each year in the data archives (see below). It was noted that when samples are allocated the quality of the samples may not be examined (i.e. numbers aged) and that allocations may be made notwithstanding this. The Working Group again encourages
WGHMSA Report 2005 9
national data submitters to provide an indication of what data could be used as representative of their unsampled catches.
Definitions of the different catch categories as used by the MHMSA WG
Official Catch Catches as reported by the official statistics to ICES Unallocated Catch Adjustments to the official catches made for any special knowledge about the fishery,
such as under- or over-reporting for which there is firm external evidence. (can be negative)
Area misreported Catch To be used only to adjust official catches which have been reported from the wrong area. (can be negative). For any country the sum of all the area misreported catches should be zero.
Discarded Catch Catch which is discarded WG Catch The sum of the 4 categories above Sampled Catch The catch corresponding to the age distribution
Quality of the Input data. Primary responsibility for the accuracy of national biological data lies with the national laboratories that submit such data. Each species co-ordinator is responsible for combining, collating, and interpolating the national data where necessary to produce the input data for the assessments. A number of validation checks are already incorporated in the data submission spreadsheet currently in use, and these are checked by the co-ordinators who in the first instance report anomalies to the laboratory which provided the data.
The working group acknowledges the effort some members have made to provide “corrected” data, which in some cases differ significantly from the officially reported catches. Most of this valuable information is gathered on the basis of personal knowledge of the fishery and good relations between the responsible scientist and the fishermen. The WG is aware of the problem that this knowledge might be lost if the scientist resigns, and asks the national laboratories to ensure continuity in data provision. In addition the working group recognises and would like to highlight the inherent conflict of interest in obtaining details of unallocated catches by country and increasing the transparency of data handling by the Working Group. This issue will have to be carefully considered in light of any future development by ICES of a standard platform to store all fisheries aggregated data.
The quality and format of input data provided to the species co-ordinators is still highly variable. Table 1.3.6.1 gives an overview of possible problems by nation. From this and Figures 1.3.6.1-2 it can be seen that sampling deficiencies have overall been reduced, partly due to the implementation of the EU sampling regulation for commercial catch data. However, some nations have still not or inadequately aged samples, others have not even submitted any data. This is regarded to be problematic for France and the Faroes in the case of Mackerel; Denmark, England, France and Sweden in the case of Horse Mackerel; England and Ireland in the case of Sardine, and Portugal in the case of Anchovy. However, under the EU directive for sampling of commercial catch the responsibility lies within the member state where the catch is landed. For sardine in the northern areas, more nations have provided catch data than last year, but the sampling in this area is still poor. This might become problematic if catches in this currently unregulated fishery continue to rise. This table will be updated every year to continue to track improvements. For anchovy, a complex method of catch sampling based on stratifying by commercial size-categories is used. Although a documented programme such as sallocl is not used to combine these data it was felt that such a programme would not improve the quality of this data.
The Working Group documents sampling coverage of the catches in two ways. Sampling effort will be tabulated against official catches by species (as in this Section). Further, maps showing total catch in relation to numbers of aged and measured fish by area give a picture of the quality of the overall sampling programme in relation to where the fisheries are taking place (Figures 1.3.1.1 and 1.3.1.2).
Transparency of data handling by the Working Group and archiving past data. The current practice of data handling by the working group has been the same for a number of years. Data received by the co-ordinators which is not reproduced in the report is available in a folder called “archives” under the working group and year directory structure. This archived data contains the disaggregated dataset, the allocations of samples to unsampled catches, the aggregated dataset and (in some cases) a document describing any problems with the data in that year.
Prior to 1997, most of the data was handled in multiple spreadsheet systems in varying formats. These are now stored in the original format, separately for each stock and catch year. Table 1.3.6.2 gives an overview on data collected up to and including Sept. 2004. It is the intention of the Working group that in the interim period until the proposed standard database is developed (see below) the previous years archived data will be copied over to the current year directory and updated at the working group. Thus the archive for each year will contain the complete dataset available. Further, it should be backed up on Compact Disk. The WG recommends again that archives folder should be given access only to designated members of the MHSA WG, as it contains sensitive data.
The WG continues to ask members to provide any kind of national data reported to previous working groups (official catches, working group catches, catch-at-age and biological sampling data), to fill in missing historical disaggregated data. However, there was little response from the national institutes. The WG recommends that national institutes increase national efforts to gain historical data, aiming to provide an overview which data are stored where, in which format and for what time frame. The working Group still sees a need to raise funds (possibly
WGHMSA Report 2005 10
in the framework of a EU-study) for completing the collection of historic data, for verification and transfer into digital format. This is particularly relevant now given that for the 2004 mackerel assessment the time series had to be truncated due to poor data in the earliest years.
Review of recommended progress and future developments. During the last four years WGMHSA has pressed for the urgent need for a database-based input application for the handling of commercial catch and catch at age data. WGMHSA stated that this should preferably be developed under the auspices of ICES and meet the requirements of more than the pelagic groups in the ICES environment. It was the WG’s opinion that this database could solve not only the immediate data handling problems, but also most of the quality control issues at the data input level. The working group’s view was recently supported by the newly established Study Group on Management of Integrated Data, which identified as a key issue for ICES the development of such a database (ICES CM 2004/ACE:05).
In spite of the considerable effort that has been expended by different WGs (especially WGMHSA and HAWG) since 1999 (e.g. Zimmermann et al WD 2000), and continuous announcements that an input database would be available for the WG’s use within reasonable time, there has been to date no visible progress on this issue. Sufficient funding for the development has been available since 2002 (granted by the Norwegian government on the occasion of ICES’ centennial).
The WG expresses its continued frustration with the current situation. This is that members of the group are forced to expend significant amounts of time on handling an outdated and error-prone data input system. The group feels that this problem could have been reasonably solved over the 4 yr time span.
As the WG regards this issue as being still a matter of highest priority, it continues to offer any possible support. It has also stipulated a number of times that an early involvement of species coordinators from a variety of WGs should be mandatory to assure that an appropriate database could be used for assessment purposes.
The WG recommends that each of its members raise the problem of the lack of an adequate database for the collation and handling of commercial catch and catch-at-age information (see section 1.3.6) with their ICES delegates and their ACFM members prior to the 2004 ICES ASC in Vigo.
1.4 Checklists for quality of assessments As a step in the direction of systematic documentation of the assessment procedures and quality, checklists as suggested by the HAWG (ICES 2000) were made for some of the stocks since 2000 and updated again this year (Tables 1.4.1-1.4.5).
1.5 Comment on update and benchmark assessments For this year, ICES has scheduled the NEA mackerel for a benchmark assessment and the other stocks for an update assessment. In some of the update assessments and for various reasons, the WG decided to do more extensive studies than just to update the last year’s assessment. A brief overview is given below; details are given in the respective sections.
NEA mackerel: Benchmark done in 2004. Next benchmark planned in 2007. North Sea horse mackerel: The data are sparse and of variable quality. Attempts to design methods that make
use of the best available data have been made for some years. This year, more complete survey data are available, and at present attempts are made to use an ADAPT like algorithm. The analysis of the data are still to be considered exploratory, and so far, the results are not considered adequate for deriving TAC advise directly from the assessment.
Western horse mackerel: A separable ADAPT like model (SAD) has been used for assessment for some years, but was not accepted by ACFM last year. This year, the model has been rewritten and reformulated addressing ACFM concerns. The analysis is still considered exploratory. The input data for this stock have been revised because the stocks were redefined (see Sections 3.2 and 3.3).
Southern horse mackerel: The input data for this stock have been revised because the stocks were redefined (see Sections 3.2 and 3.3). XSA is still used to assess the stock, but the settings were changed. The assessment may still be regarded as exploratory.
Sardine: Update assessment. Benchmark proposed 2006, or when the results of SARDYN and the next DEPM-based SSB estimate are available.
Anchovy in VIIIc: At present, ICA is used to assess this stock. A biomass difference-delay type model has been developed over several years, and was further refined this year. It now estimates model parameters in a Bayesian framework, which also carries over to a Bayesian forecast. Some planned modifications could not be made in time for this meeting, and the runs with this model still should be considered as exploratory. ICA is not suited for this short lived species, and adjustments often have to be made to solve problems with the most recent data. For the futue, the new model is expected totake over as standard tool. The present ICA run was similar to that last year.
Anchovy IXa: Still, the data are too sparse to allow analytic assessments, but various model approaches are being explored.
We recommend that in 2005 the WG should carry out in-depth exploratory assessments for western horse mackerel and anchovy Biscay.
WGHMSA Report 2005 11
1.6 The ICES stock handbook The working group started to transfer “static” parts of the report into the stock handbook during this session. Due to time constraints, this task could not be completed. The information is therefore also kept in the report body for the interim year, but duplicate information will be removed intersessionally and during next year’s WG session.
1.7 Reference points relevant for WG MHSA In 2003, SGPRP and SGPA reviewed different reference points currently in place for a number of stocks in the ICES area, focussing on biomass reference points on the basis of stock-recruit relationships. For the stocks dealt with by WG MHSA, SGPRP concluded (ICES 2003/ACFM:15):
For Anchovy in Subarea VIII, ACFM subsequently revised the Blim from 18 000 tonnes to 21 000 tonnes. Both are based on the lowest observed biomass historically, and the change is due to the change in the estimate of this number in recent assessments. Bpa was revised from 36 000 tonnes to 33 000 tonnes, but changing the basis from a biomass that could sustain two successive years of poor recruitment to Blim*1.645. The reason for this change is not clear, but the justification for the former value was poorly substantiated.
For Western horse mackerel, the WG has suggested a Blim at Bloss. This was supported by SGPRP, but not implemented, since, lacking an accepted assessment, the corresponding biomass value is unknown. The WG suggests that the lowest observed SSB should be regarded as a Blim, even if the assessment at present only is considered reliable with respect to trends in the biomass.
For the other stocks, reference points either remain undefined, or are maintained at previous values. For sardine, if the current assessment is accepted by ACFM, it may be relevant to consider reference points for this
stock. So far, no preparatory work to establish reference points has been done, but this may be considered for next year.
1.8 Relevant information on ecological/environmental studies related to small pelagic species. The WG intends to provide indications of the sources of ecological processes affecting small pelagic species in this section. This year, the information relates mainly to ICES SGs dealing with these issues.
Since the last WG meeting, a meeting of the new ICES Study Group on Regional scale Ecology of Small Pelagics (SGRESP) took place in Nantes (23–26 February). Two SGRESP ToR's are of special relevance for this WG; ToR c) review existing relationships with physical and biological environmental indicators and ToR d) produce and deliver assessment Working Groups with integrated environmental and ecological information relevant to the evaluation and prediction processes.
In relation to the first ToR, examples of relationships between stock, recruitment and environmental indexes for different species/stocks were presented in SGRESP and its main conclusion was that although correlation between recruitment, stock and environmental indexes for different stocks was observed to “work” over a period of time, in most cases it shows a breakdown after new observations were included in the analysis. The SG hypothesised that this was due to a change in the relative importance of different parameters in different environmental conditions, and conclude that the incorporation of adult behaviour was essential to improve the understanding of this relationships.
In relation to deliverables to assessment WGs, the SG considered two different products; short-term recruitment prediction and medium-term interaction status between population and environment regime. Short-term recruitment prediction suffers the problems described above, and models to perform such prediction are still under development. In relation to the second product, the SGRESP concluded that in the future the SG could propose a list of indicators for diagnostic and health of stocks, relating to their spatial occupation, reproductive potential and demography. The intention would be to improve the understanding of long-term population dynamics and to devise qualitative/semi-quantitative indicators of stock state other than abundance at age.
Apart from the conclusions of the SGRESP, an update of the ToRs of next meeting of the SGSBSA, and some comments on the future of this SG (which reaches its last meeting) was provided to the WG. SGSBSA has dealt with methodological issues of DEPM, as well as with spatial stock structure and biological parameters in relation with environment on both sardine and anchovy. The future of the SG is still to be discussed by the SG members, although a proposal of converting it into a WG may arise from next SG meeting. Some of the proposed topics to be developed on a future WG include; a) comparison between acoustic and DEPM estimation of adult abundance and distribution, and thus stock structure and distribution in relation to oceanographic/environmental variables, b) spatial variability on biological parameters of the population such as fecundity, condition and mean weight of individuals, c) both DEPM and acoustic methodological issues and associated software.
Other sources of new environmental studies in relation to fisheries were pointed out to the group, such as the research work on Bay of Biscay oceanography and its relation to fisheries (Borges et al 2003, Chicharo et al 2003, Peliz et al 2002, 2003, 2004, Santos et al 2004, Lavín et al. in press) and a WD relating sardine recruitment off Portugal with NAO indices was also presented (Borges et al WD).
The WG believes that ecological studies on the relation between stock structure and environmental and biological variables are of great interest for small pelagic fisheries assessment and management. Stock/environment recruitment relationships can improve forward projections of stock abundances and help improving and designing management options. Nevertheless, in agreement with SGRESP, the WG believes that robust and reliable models of such relationships are not yet achieved and thus those relationships are not ready to be incorporated in the
WGHMSA Report 2005 12
assessment/management of the species evaluated by the WG. Nevertheless, the WG encourages such ecological studies and regards SGRESP information on such issues as informative and relevant to the group.
The WG also values past SGSBSA inputs to the Group, and encourages its continuation as a WG.
WGHMSA Report 2005 13
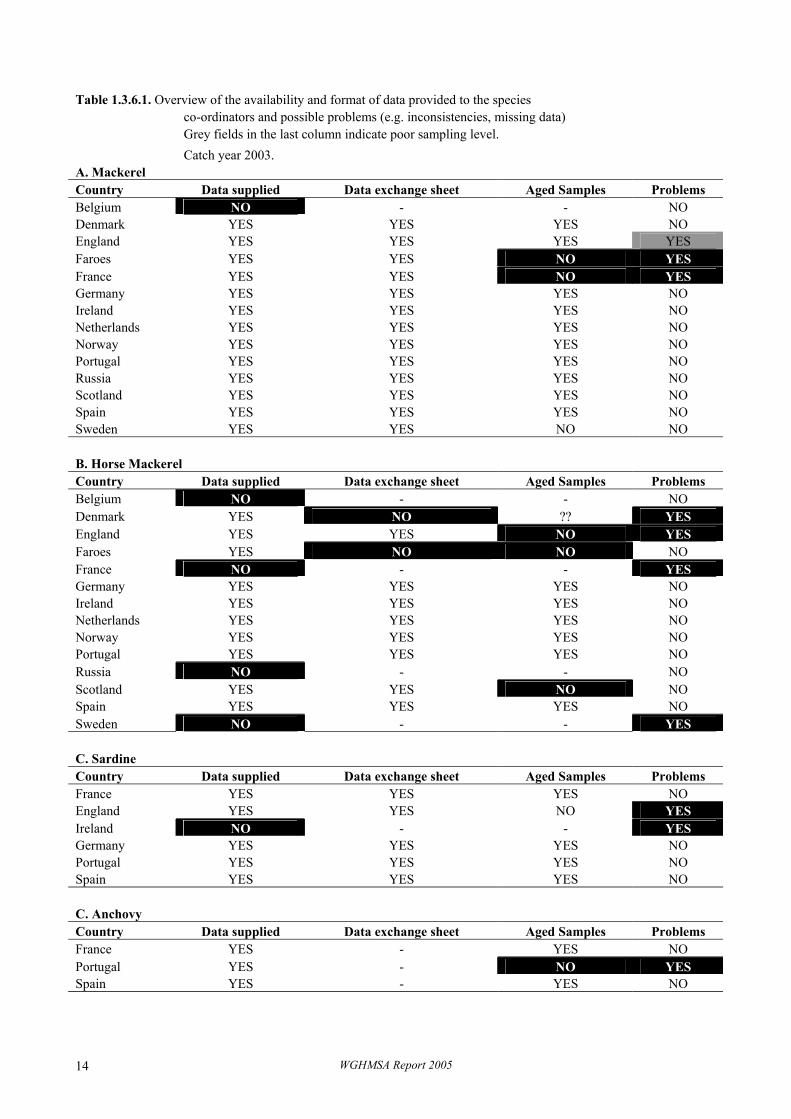
Table 1.3.6.1. Overview of the availability and format of data provided to the species co-ordinators and possible problems (e.g. inconsistencies, missing data) Grey fields in the last column indicate poor sampling level. Catch year 2003. A. Mackerel Country Data supplied Data exchange sheet Aged Samples Problems Belgium NO - - NO Denmark YES YES YES NO England YES YES YES YES Faroes YES YES NO YES France YES YES NO YES Germany YES YES YES NO Ireland YES YES YES NO Netherlands YES YES YES NO Norway YES YES YES NO Portugal YES YES YES NO Russia YES YES YES NO Scotland YES YES YES NO Spain YES YES YES NO Sweden YES YES NO NO B. Horse Mackerel Country Data supplied Data exchange sheet Aged Samples Problems Belgium NO - - NO Denmark YES NO ?? YES England YES YES NO YES Faroes YES NO NO NO France NO - - YES Germany YES YES YES NO Ireland YES YES YES NO Netherlands YES YES YES NO Norway YES YES YES NO Portugal YES YES YES NO Russia NO - - NO Scotland YES YES NO NO Spain YES YES YES NO Sweden NO - - YES C. Sardine Country Data supplied Data exchange sheet Aged Samples Problems France YES YES YES NO England YES YES NO YES Ireland NO - - YES Germany YES YES YES NO Portugal YES YES YES NO Spain YES YES YES NO C. Anchovy Country Data supplied Data exchange sheet Aged Samples Problems France YES - YES NO Portugal YES - NO YES Spain YES - YES NO
WGHMSA Report 2005 14
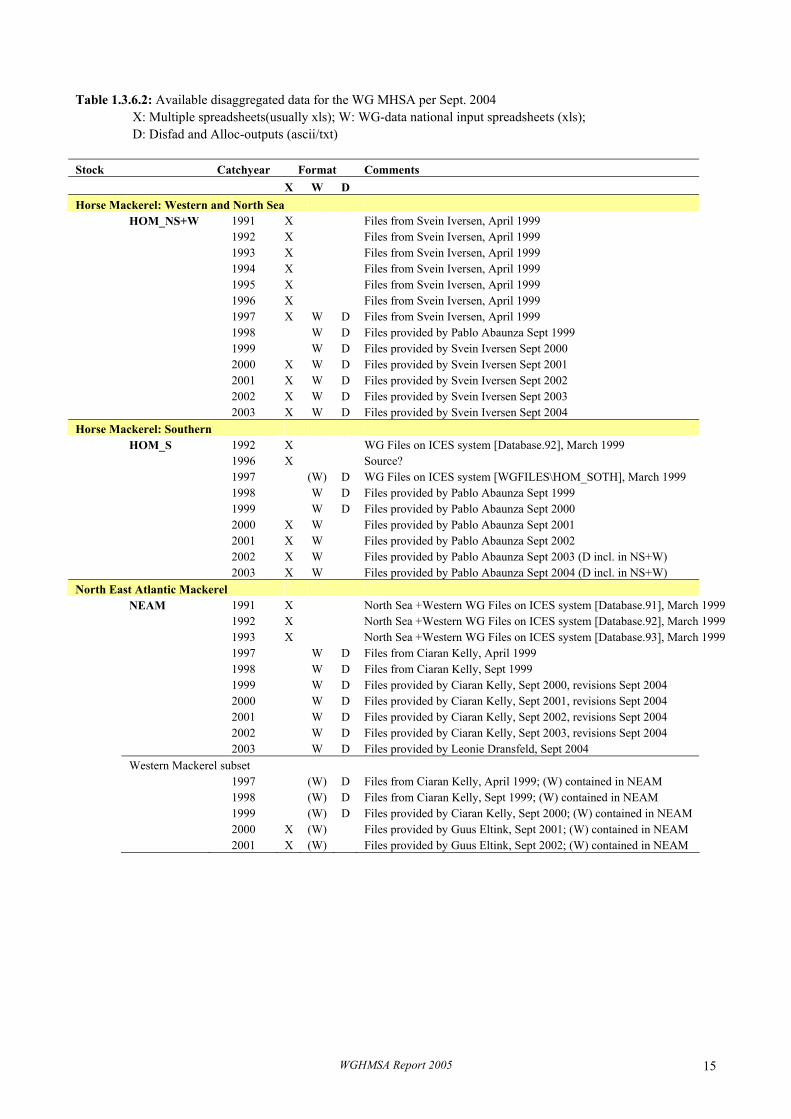
Table 1.3.6.2: Available disaggregated data for the WG MHSA per Sept. 2004 X: Multiple spreadsheets(usually xls); W: WG-data national input spreadsheets (xls); D: Disfad and Alloc-outputs (ascii/txt) Stock Catchyear Format Comments X W D Horse Mackerel: Western and North Sea HOM_NS+W 1991 X Files from Svein Iversen, April 1999 1992 X Files from Svein Iversen, April 1999 1993 X Files from Svein Iversen, April 1999 1994 X Files from Svein Iversen, April 1999 1995 X Files from Svein Iversen, April 1999 1996 X Files from Svein Iversen, April 1999 1997 X W D Files from Svein Iversen, April 1999 1998 W D Files provided by Pablo Abaunza Sept 1999 1999 W D Files provided by Svein Iversen Sept 2000 2000 X W D Files provided by Svein Iversen Sept 2001 2001 X W D Files provided by Svein Iversen Sept 2002 2002 X W D Files provided by Svein Iversen Sept 2003 2003 X W D Files provided by Svein Iversen Sept 2004 Horse Mackerel: Southern HOM_S 1992 X WG Files on ICES system [Database.92], March 1999 1996 X Source? 1997 (W) D WG Files on ICES system [WGFILES\HOM_SOTH], March 1999 1998 W D Files provided by Pablo Abaunza Sept 1999 1999 W D Files provided by Pablo Abaunza Sept 2000 2000 X W Files provided by Pablo Abaunza Sept 2001 2001 X W Files provided by Pablo Abaunza Sept 2002 2002 X W Files provided by Pablo Abaunza Sept 2003 (D incl. in NS+W) 2003 X W Files provided by Pablo Abaunza Sept 2004 (D incl. in NS+W) North East Atlantic Mackerel NEAM 1991 X North Sea +Western WG Files on ICES system [Database.91], March 1999 1992 X North Sea +Western WG Files on ICES system [Database.92], March 1999 1993 X North Sea +Western WG Files on ICES system [Database.93], March 1999 1997 W D Files from Ciaran Kelly, April 1999 1998 W D Files from Ciaran Kelly, Sept 1999 1999 W D Files provided by Ciaran Kelly, Sept 2000, revisions Sept 2004 2000 W D Files provided by Ciaran Kelly, Sept 2001, revisions Sept 2004 2001 W D Files provided by Ciaran Kelly, Sept 2002, revisions Sept 2004 2002 W D Files provided by Ciaran Kelly, Sept 2003, revisions Sept 2004 2003 W D Files provided by Leonie Dransfeld, Sept 2004 Western Mackerel subset 1997 (W) D Files from Ciaran Kelly, April 1999; (W) contained in NEAM 1998 (W) D Files from Ciaran Kelly, Sept 1999; (W) contained in NEAM 1999 (W) D Files provided by Ciaran Kelly, Sept 2000; (W) contained in NEAM 2000 X (W) Files provided by Guus Eltink, Sept 2001; (W) contained in NEAM 2001 X (W) Files provided by Guus Eltink, Sept 2002; (W) contained in NEAM
WGHMSA Report 2005 15
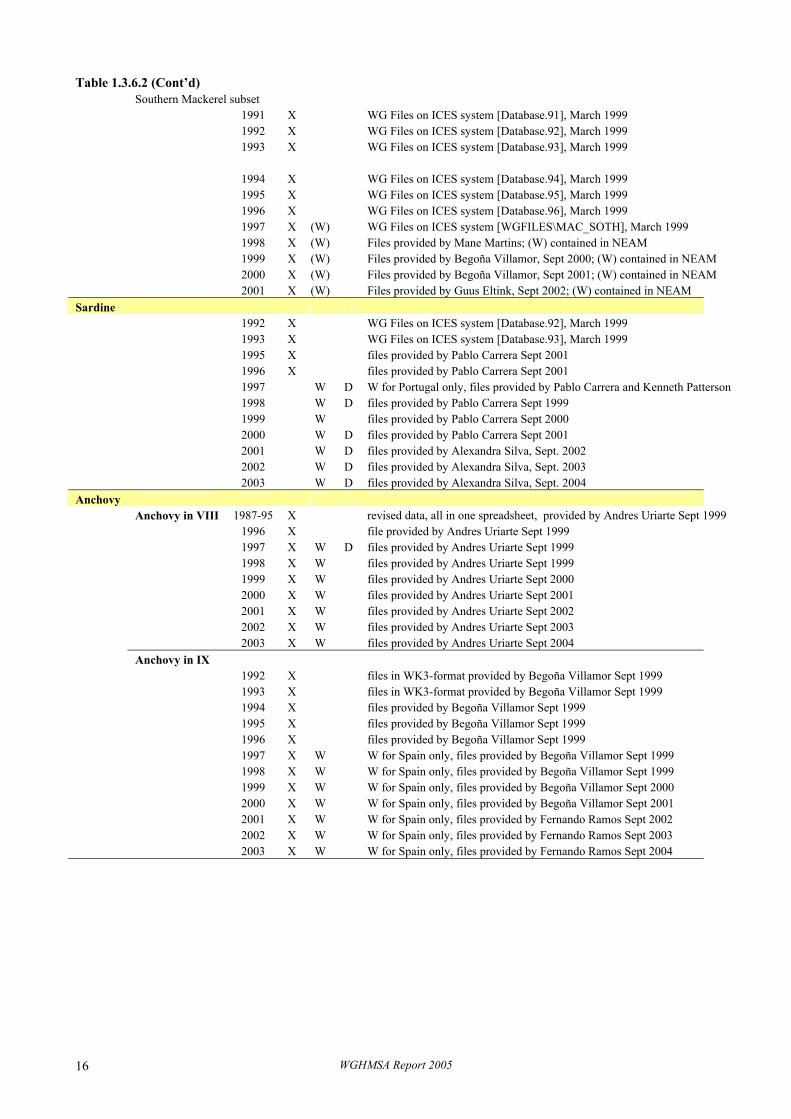
Table 1.3.6.2 (Cont’d) Southern Mackerel subset 1991 X WG Files on ICES system [Database.91], March 1999 1992 X WG Files on ICES system [Database.92], March 1999 1993 X WG Files on ICES system [Database.93], March 1999 1994 X WG Files on ICES system [Database.94], March 1999 1995 X WG Files on ICES system [Database.95], March 1999 1996 X WG Files on ICES system [Database.96], March 1999 1997 X (W) WG Files on ICES system [WGFILES\MAC_SOTH], March 1999 1998 X (W) Files provided by Mane Martins; (W) contained in NEAM 1999 X (W) Files provided by Begoña Villamor, Sept 2000; (W) contained in NEAM 2000 X (W) Files provided by Begoña Villamor, Sept 2001; (W) contained in NEAM 2001 X (W) Files provided by Guus Eltink, Sept 2002; (W) contained in NEAM Sardine 1992 X WG Files on ICES system [Database.92], March 1999 1993 X WG Files on ICES system [Database.93], March 1999 1995 X files provided by Pablo Carrera Sept 2001 1996 X files provided by Pablo Carrera Sept 2001 1997 W D W for Portugal only, files provided by Pablo Carrera and Kenneth Patterson 1998 W D files provided by Pablo Carrera Sept 1999 1999 W files provided by Pablo Carrera Sept 2000 2000 W D files provided by Pablo Carrera Sept 2001 2001 W D files provided by Alexandra Silva, Sept. 2002 2002 W D files provided by Alexandra Silva, Sept. 2003 2003 W D files provided by Alexandra Silva, Sept. 2004 Anchovy Anchovy in VIII 1987-95 X revised data, all in one spreadsheet, provided by Andres Uriarte Sept 1999 1996 X file provided by Andres Uriarte Sept 1999 1997 X W D files provided by Andres Uriarte Sept 1999 1998 X W files provided by Andres Uriarte Sept 1999 1999 X W files provided by Andres Uriarte Sept 2000 2000 X W files provided by Andres Uriarte Sept 2001 2001 X W files provided by Andres Uriarte Sept 2002 2002 X W files provided by Andres Uriarte Sept 2003 2003 X W files provided by Andres Uriarte Sept 2004 Anchovy in IX 1992 X files in WK3-format provided by Begoña Villamor Sept 1999 1993 X files in WK3-format provided by Begoña Villamor Sept 1999 1994 X files provided by Begoña Villamor Sept 1999 1995 X files provided by Begoña Villamor Sept 1999 1996 X files provided by Begoña Villamor Sept 1999 1997 X W W for Spain only, files provided by Begoña Villamor Sept 1999 1998 X W W for Spain only, files provided by Begoña Villamor Sept 1999 1999 X W W for Spain only, files provided by Begoña Villamor Sept 2000 2000 X W W for Spain only, files provided by Begoña Villamor Sept 2001 2001 X W W for Spain only, files provided by Fernando Ramos Sept 2002 2002 X W W for Spain only, files provided by Fernando Ramos Sept 2003 2003 X W W for Spain only, files provided by Fernando Ramos Sept 2004
WGHMSA Report 2005 16
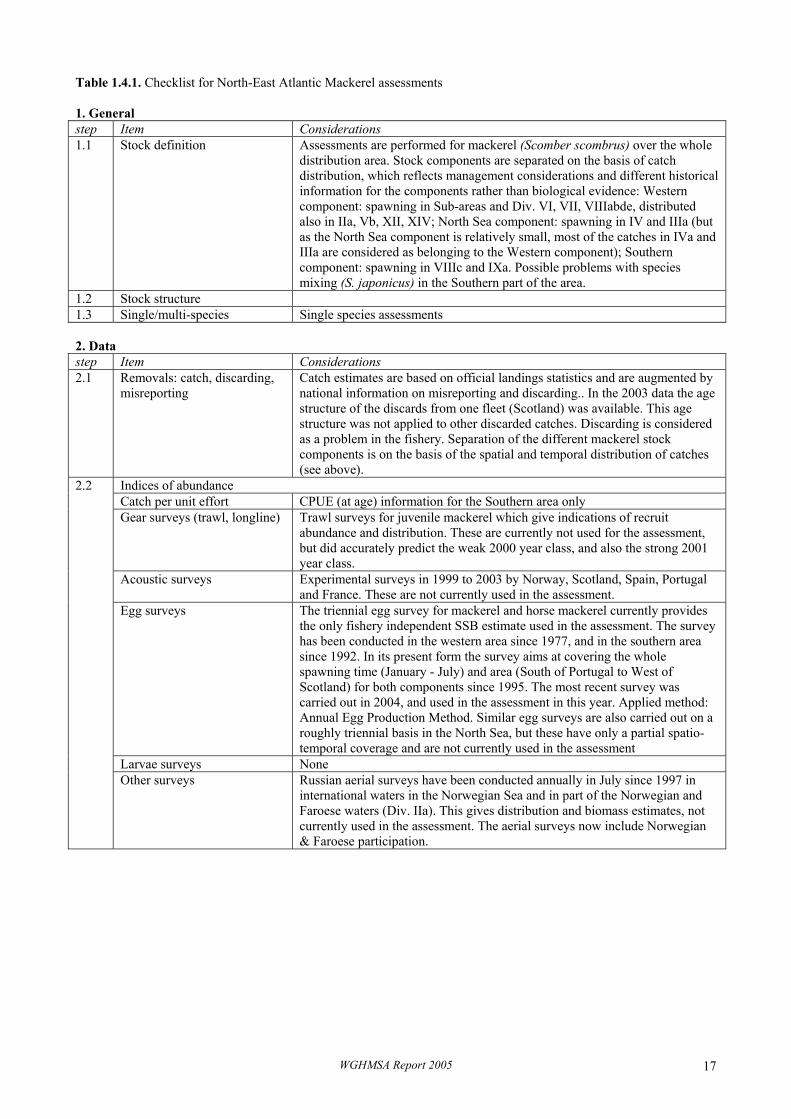
Table 1.4.1. Checklist for North-East Atlantic Mackerel assessments 1. General step Item Considerations 1.1 Stock definition Assessments are performed for mackerel (Scomber scombrus) over the whole
distribution area. Stock components are separated on the basis of catch distribution, which reflects management considerations and different historical information for the components rather than biological evidence: Western component: spawning in Sub-areas and Div. VI, VII, VIIIabde, distributed also in IIa, Vb, XII, XIV; North Sea component: spawning in IV and IIIa (but as the North Sea component is relatively small, most of the catches in IVa and IIIa are considered as belonging to the Western component); Southern component: spawning in VIIIc and IXa. Possible problems with species mixing (S. japonicus) in the Southern part of the area.
1.2 Stock structure 1.3 Single/multi-species Single species assessments 2. Data step Item Considerations 2.1 Removals: catch, discarding,
misreporting Catch estimates are based on official landings statistics and are augmented by national information on misreporting and discarding.. In the 2003 data the age structure of the discards from one fleet (Scotland) was available. This age structure was not applied to other discarded catches. Discarding is considered as a problem in the fishery. Separation of the different mackerel stock components is on the basis of the spatial and temporal distribution of catches (see above).
Indices of abundance Catch per unit effort CPUE (at age) information for the Southern area only Gear surveys (trawl, longline) Trawl surveys for juvenile mackerel which give indications of recruit
abundance and distribution. These are currently not used for the assessment, but did accurately predict the weak 2000 year class, and also the strong 2001 year class.
Acoustic surveys Experimental surveys in 1999 to 2003 by Norway, Scotland, Spain, Portugal and France. These are not currently used in the assessment.
Egg surveys The triennial egg survey for mackerel and horse mackerel currently provides the only fishery independent SSB estimate used in the assessment. The survey has been conducted in the western area since 1977, and in the southern area since 1992. In its present form the survey aims at covering the whole spawning time (January - July) and area (South of Portugal to West of Scotland) for both components since 1995. The most recent survey was carried out in 2004, and used in the assessment in this year. Applied method: Annual Egg Production Method. Similar egg surveys are also carried out on a roughly triennial basis in the North Sea, but these have only a partial spatio-temporal coverage and are not currently used in the assessment
Larvae surveys None
2.2
Other surveys Russian aerial surveys have been conducted annually in July since 1997 in international waters in the Norwegian Sea and in part of the Norwegian and Faroese waters (Div. IIa). This gives distribution and biomass estimates, not currently used in the assessment. The aerial surveys now include Norwegian & Faroese participation.
WGHMSA Report 2005 17
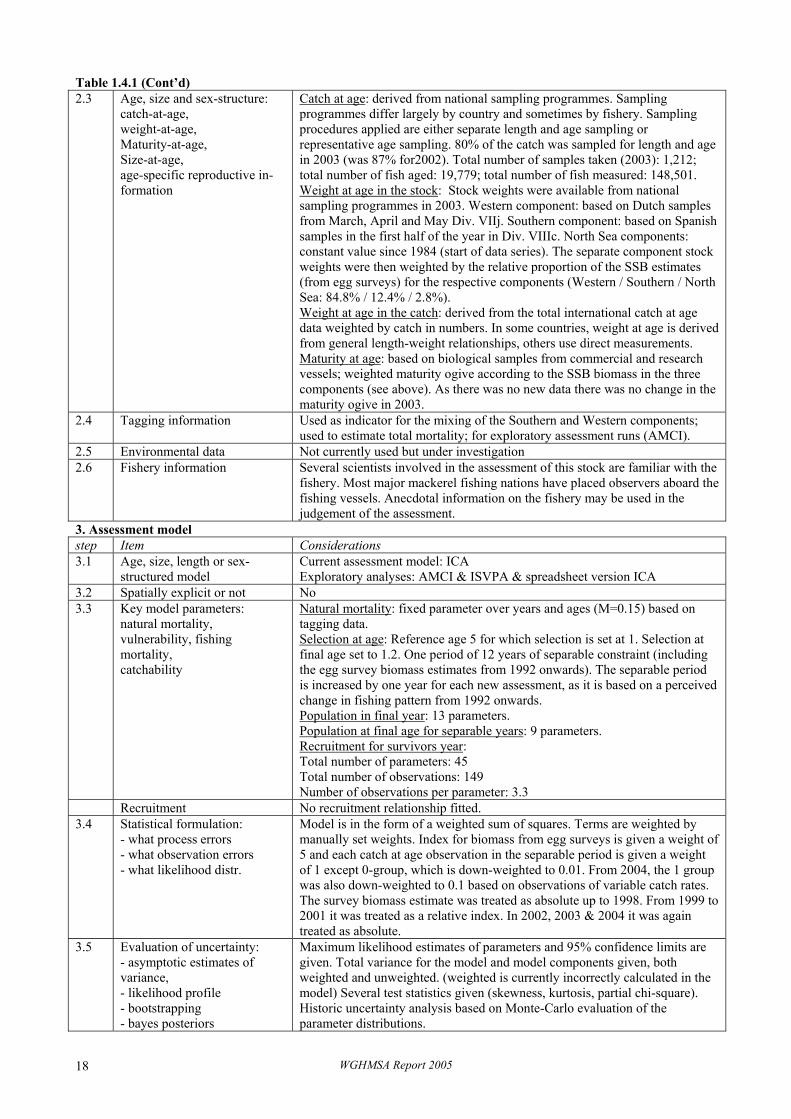
Table 1.4.1 (Cont’d) 2.3 Age, size and sex-structure:
catch-at-age, weight-at-age, Maturity-at-age, Size-at-age, age-specific reproductive in-formation
Catch at age: derived from national sampling programmes. Sampling programmes differ largely by country and sometimes by fishery. Sampling procedures applied are either separate length and age sampling or representative age sampling. 80% of the catch was sampled for length and age in 2003 (was 87% for2002). Total number of samples taken (2003): 1,212; total number of fish aged: 19,779; total number of fish measured: 148,501. Weight at age in the stock: Stock weights were available from national sampling programmes in 2003. Western component: based on Dutch samples from March, April and May Div. VIIj. Southern component: based on Spanish samples in the first half of the year in Div. VIIIc. North Sea components: constant value since 1984 (start of data series). The separate component stock weights were then weighted by the relative proportion of the SSB estimates (from egg surveys) for the respective components (Western / Southern / North Sea: 84.8% / 12.4% / 2.8%). Weight at age in the catch: derived from the total international catch at age data weighted by catch in numbers. In some countries, weight at age is derived from general length-weight relationships, others use direct measurements. Maturity at age: based on biological samples from commercial and research vessels; weighted maturity ogive according to the SSB biomass in the three components (see above). As there was no new data there was no change in the maturity ogive in 2003.
2.4 Tagging information Used as indicator for the mixing of the Southern and Western components; used to estimate total mortality; for exploratory assessment runs (AMCI).
2.5 Environmental data Not currently used but under investigation 2.6 Fishery information Several scientists involved in the assessment of this stock are familiar with the
fishery. Most major mackerel fishing nations have placed observers aboard the fishing vessels. Anecdotal information on the fishery may be used in the judgement of the assessment.
3. Assessment model step Item Considerations 3.1 Age, size, length or sex-
structured model Current assessment model: ICA Exploratory analyses: AMCI & ISVPA & spreadsheet version ICA
3.2 Spatially explicit or not No 3.3 Key model parameters:
natural mortality, vulnerability, fishing mortality, catchability
Natural mortality: fixed parameter over years and ages (M=0.15) based on tagging data. Selection at age: Reference age 5 for which selection is set at 1. Selection at final age set to 1.2. One period of 12 years of separable constraint (including the egg survey biomass estimates from 1992 onwards). The separable period is increased by one year for each new assessment, as it is based on a perceived change in fishing pattern from 1992 onwards. Population in final year: 13 parameters. Population at final age for separable years: 9 parameters. Recruitment for survivors year: Total number of parameters: 45 Total number of observations: 149 Number of observations per parameter: 3.3
Recruitment No recruitment relationship fitted. 3.4 Statistical formulation:
- what process errors - what observation errors - what likelihood distr.
Model is in the form of a weighted sum of squares. Terms are weighted by manually set weights. Index for biomass from egg surveys is given a weight of 5 and each catch at age observation in the separable period is given a weight of 1 except 0-group, which is down-weighted to 0.01. From 2004, the 1 group was also down-weighted to 0.1 based on observations of variable catch rates. The survey biomass estimate was treated as absolute up to 1998. From 1999 to 2001 it was treated as a relative index. In 2002, 2003 & 2004 it was again treated as absolute.
3.5 Evaluation of uncertainty: - asymptotic estimates of variance, - likelihood profile - bootstrapping - bayes posteriors
Maximum likelihood estimates of parameters and 95% confidence limits are given. Total variance for the model and model components given, both weighted and unweighted. (weighted is currently incorrectly calculated in the model) Several test statistics given (skewness, kurtosis, partial chi-square). Historic uncertainty analysis based on Monte-Carlo evaluation of the parameter distributions.
WGHMSA Report 2005 18
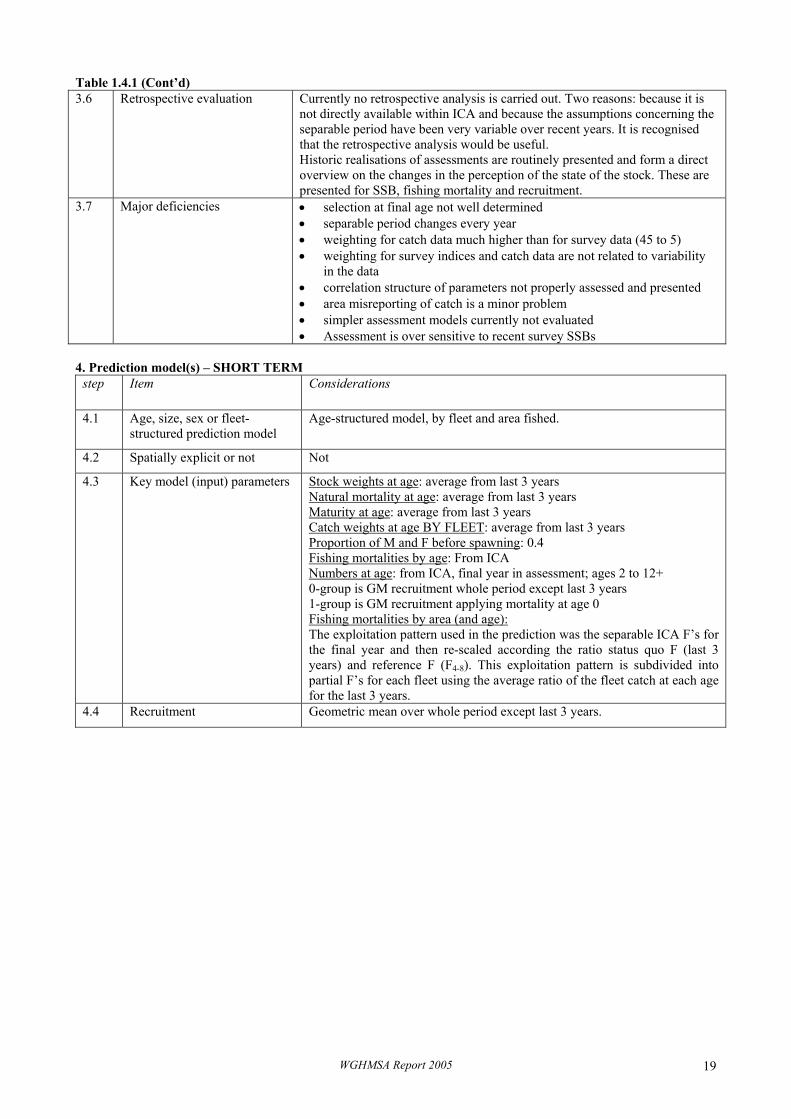
Table 1.4.1 (Cont’d) 3.6 Retrospective evaluation Currently no retrospective analysis is carried out. Two reasons: because it is
not directly available within ICA and because the assumptions concerning the separable period have been very variable over recent years. It is recognised that the retrospective analysis would be useful. Historic realisations of assessments are routinely presented and form a direct overview on the changes in the perception of the state of the stock. These are presented for SSB, fishing mortality and recruitment.
3.7 Major deficiencies • selection at final age not well determined • separable period changes every year • weighting for catch data much higher than for survey data (45 to 5) • weighting for survey indices and catch data are not related to variability
in the data • correlation structure of parameters not properly assessed and presented • area misreporting of catch is a minor problem • simpler assessment models currently not evaluated • Assessment is over sensitive to recent survey SSBs
4. Prediction model(s) – SHORT TERM
step Item Considerations
4.1 Age, size, sex or fleet-structured prediction model
Age-structured model, by fleet and area fished.
4.2 Spatially explicit or not Not
4.3 Key model (input) parameters Stock weights at age: average from last 3 years Natural mortality at age: average from last 3 years Maturity at age: average from last 3 years Catch weights at age BY FLEET: average from last 3 years Proportion of M and F before spawning: 0.4 Fishing mortalities by age: From ICA Numbers at age: from ICA, final year in assessment; ages 2 to 12+ 0-group is GM recruitment whole period except last 3 years 1-group is GM recruitment applying mortality at age 0 Fishing mortalities by area (and age): The exploitation pattern used in the prediction was the separable ICA F’s for the final year and then re-scaled according the ratio status quo F (last 3 years) and reference F (F4-8). This exploitation pattern is subdivided into partial F’s for each fleet using the average ratio of the fleet catch at each age for the last 3 years.
4.4 Recruitment Geometric mean over whole period except last 3 years.
WGHMSA Report 2005 19
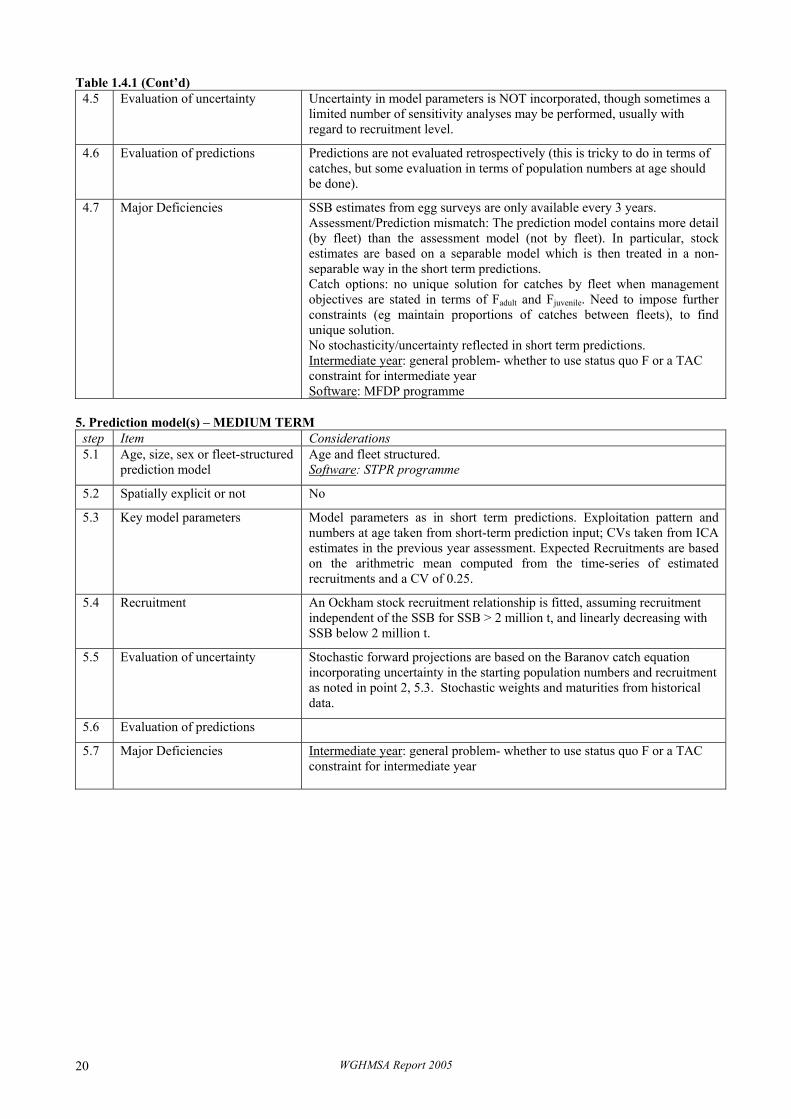
Table 1.4.1 (Cont’d) 4.5 Evaluation of uncertainty Uncertainty in model parameters is NOT incorporated, though sometimes a
limited number of sensitivity analyses may be performed, usually with regard to recruitment level.
4.6 Evaluation of predictions Predictions are not evaluated retrospectively (this is tricky to do in terms of catches, but some evaluation in terms of population numbers at age should be done).
4.7 Major Deficiencies SSB estimates from egg surveys are only available every 3 years. Assessment/Prediction mismatch: The prediction model contains more detail (by fleet) than the assessment model (not by fleet). In particular, stock estimates are based on a separable model which is then treated in a non-separable way in the short term predictions. Catch options: no unique solution for catches by fleet when management objectives are stated in terms of Fadult and Fjuvenile. Need to impose further constraints (eg maintain proportions of catches between fleets), to find unique solution. No stochasticity/uncertainty reflected in short term predictions. Intermediate year: general problem- whether to use status quo F or a TAC constraint for intermediate year Software: MFDP programme
5. Prediction model(s) – MEDIUM TERM
step Item Considerations 5.1 Age, size, sex or fleet-structured
prediction model Age and fleet structured. Software: STPR programme
5.2 Spatially explicit or not No
5.3 Key model parameters Model parameters as in short term predictions. Exploitation pattern and numbers at age taken from short-term prediction input; CVs taken from ICA estimates in the previous year assessment. Expected Recruitments are based on the arithmetric mean computed from the time-series of estimated recruitments and a CV of 0.25.
5.4 Recruitment An Ockham stock recruitment relationship is fitted, assuming recruitment independent of the SSB for SSB > 2 million t, and linearly decreasing with SSB below 2 million t.
5.5 Evaluation of uncertainty Stochastic forward projections are based on the Baranov catch equation incorporating uncertainty in the starting population numbers and recruitment as noted in point 2, 5.3. Stochastic weights and maturities from historical data.
5.6 Evaluation of predictions
5.7 Major Deficiencies Intermediate year: general problem- whether to use status quo F or a TAC constraint for intermediate year
WGHMSA Report 2005 20
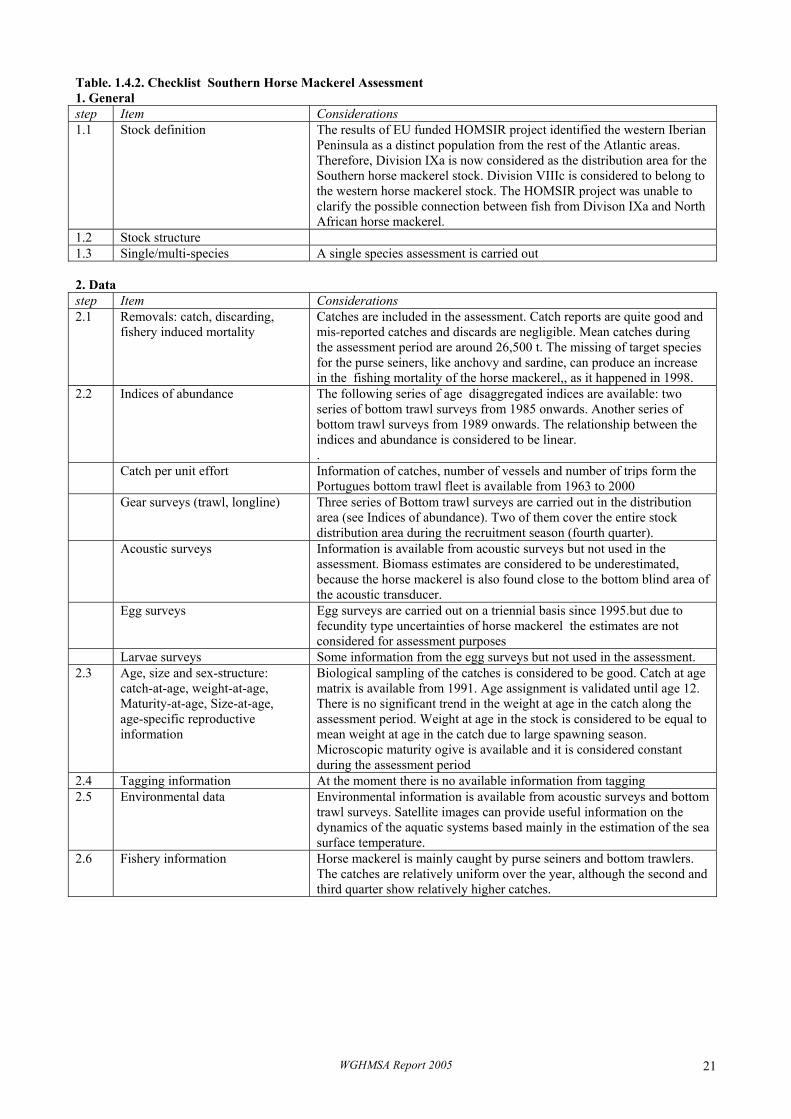
Table. 1.4.2. Checklist Southern Horse Mackerel Assessment 1. General step Item Considerations 1.1 Stock definition The results of EU funded HOMSIR project identified the western Iberian
Peninsula as a distinct population from the rest of the Atlantic areas. Therefore, Division IXa is now considered as the distribution area for the Southern horse mackerel stock. Division VIIIc is considered to belong to the western horse mackerel stock. The HOMSIR project was unable to clarify the possible connection between fish from Divison IXa and North African horse mackerel.
1.2 Stock structure 1.3 Single/multi-species A single species assessment is carried out 2. Data step Item Considerations 2.1 Removals: catch, discarding,
fishery induced mortality Catches are included in the assessment. Catch reports are quite good and mis-reported catches and discards are negligible. Mean catches during the assessment period are around 26,500 t. The missing of target species for the purse seiners, like anchovy and sardine, can produce an increase in the fishing mortality of the horse mackerel,, as it happened in 1998.
2.2 Indices of abundance The following series of age disaggregated indices are available: two series of bottom trawl surveys from 1985 onwards. Another series of bottom trawl surveys from 1989 onwards. The relationship between the indices and abundance is considered to be linear. .
Catch per unit effort Information of catches, number of vessels and number of trips form the Portugues bottom trawl fleet is available from 1963 to 2000
Gear surveys (trawl, longline) Three series of Bottom trawl surveys are carried out in the distribution area (see Indices of abundance). Two of them cover the entire stock distribution area during the recruitment season (fourth quarter).
Acoustic surveys Information is available from acoustic surveys but not used in the assessment. Biomass estimates are considered to be underestimated, because the horse mackerel is also found close to the bottom blind area of the acoustic transducer.
Egg surveys Egg surveys are carried out on a triennial basis since 1995.but due to fecundity type uncertainties of horse mackerel the estimates are not considered for assessment purposes
Larvae surveys Some information from the egg surveys but not used in the assessment. 2.3 Age, size and sex-structure:
catch-at-age, weight-at-age, Maturity-at-age, Size-at-age, age-specific reproductive information
Biological sampling of the catches is considered to be good. Catch at age matrix is available from 1991. Age assignment is validated until age 12. There is no significant trend in the weight at age in the catch along the assessment period. Weight at age in the stock is considered to be equal to mean weight at age in the catch due to large spawning season. Microscopic maturity ogive is available and it is considered constant during the assessment period
2.4 Tagging information At the moment there is no available information from tagging 2.5 Environmental data Environmental information is available from acoustic surveys and bottom
trawl surveys. Satellite images can provide useful information on the dynamics of the aquatic systems based mainly in the estimation of the sea surface temperature.
2.6 Fishery information Horse mackerel is mainly caught by purse seiners and bottom trawlers. The catches are relatively uniform over the year, although the second and third quarter show relatively higher catches.
WGHMSA Report 2005 21
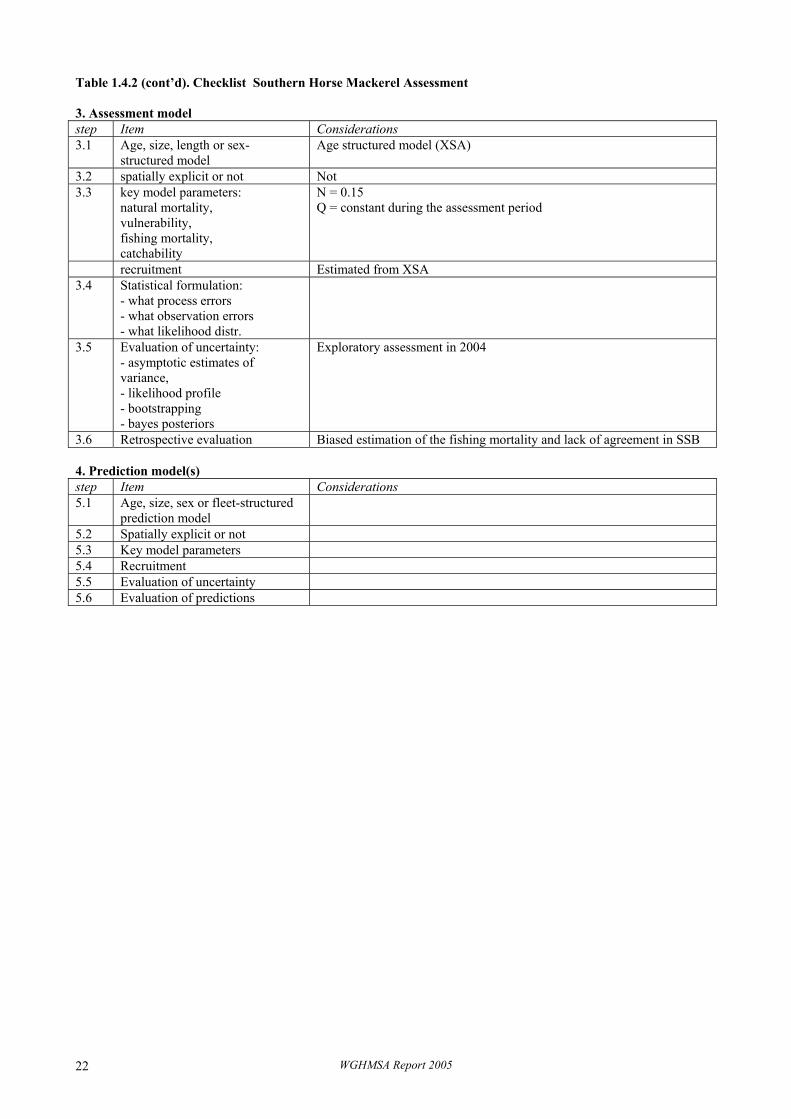
Table 1.4.2 (cont’d). Checklist Southern Horse Mackerel Assessment 3. Assessment model step Item Considerations 3.1 Age, size, length or sex-
structured model Age structured model (XSA)
3.2 spatially explicit or not Not 3.3 key model parameters:
natural mortality, vulnerability, fishing mortality, catchability
N = 0.15 Q = constant during the assessment period
recruitment Estimated from XSA 3.4 Statistical formulation:
- what process errors - what observation errors - what likelihood distr.
3.5 Evaluation of uncertainty: - asymptotic estimates of variance, - likelihood profile - bootstrapping - bayes posteriors
Exploratory assessment in 2004
3.6 Retrospective evaluation Biased estimation of the fishing mortality and lack of agreement in SSB 4. Prediction model(s) step Item Considerations 5.1 Age, size, sex or fleet-structured
prediction model
5.2 Spatially explicit or not 5.3 Key model parameters 5.4 Recruitment 5.5 Evaluation of uncertainty 5.6 Evaluation of predictions
WGHMSA Report 2005 22
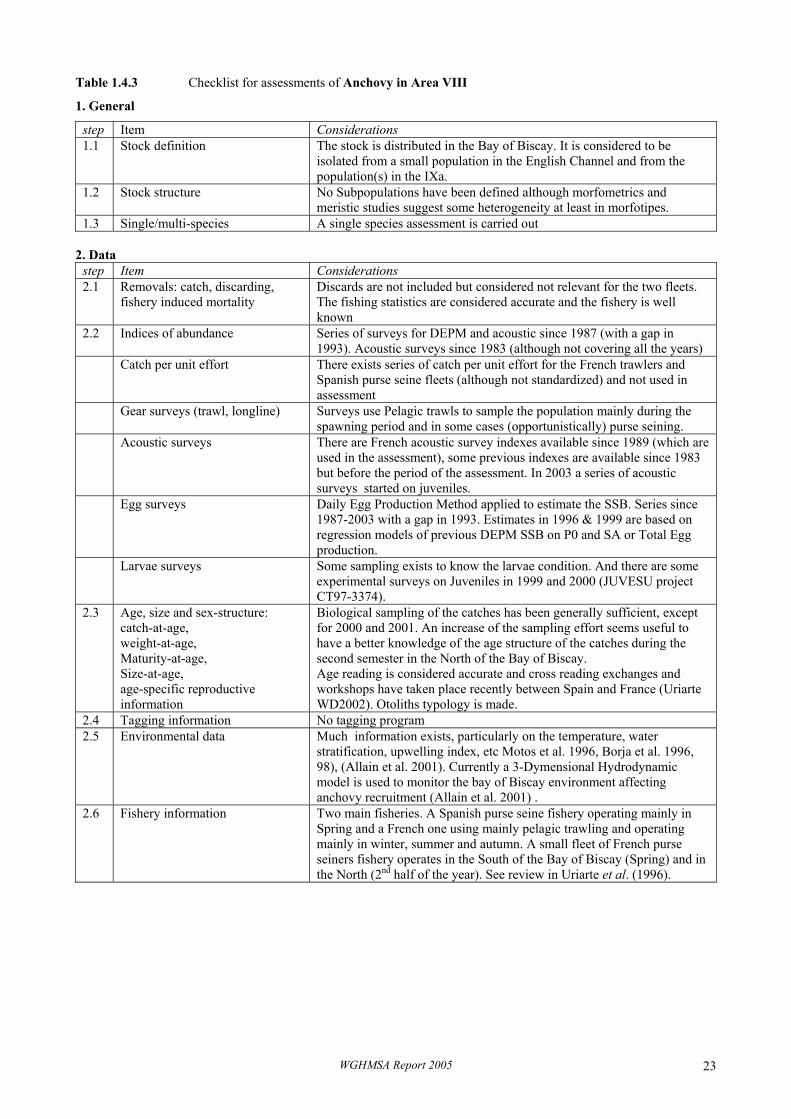
Table 1.4.3 Checklist for assessments of Anchovy in Area VIII
1. General
step Item Considerations 1.1 Stock definition The stock is distributed in the Bay of Biscay. It is considered to be
isolated from a small population in the English Channel and from the population(s) in the IXa.
1.2 Stock structure No Subpopulations have been defined although morfometrics and meristic studies suggest some heterogeneity at least in morfotipes.
1.3 Single/multi-species A single species assessment is carried out 2. Data
step Item Considerations 2.1 Removals: catch, discarding,
fishery induced mortality Discards are not included but considered not relevant for the two fleets. The fishing statistics are considered accurate and the fishery is well known
2.2 Indices of abundance Series of surveys for DEPM and acoustic since 1987 (with a gap in 1993). Acoustic surveys since 1983 (although not covering all the years)
Catch per unit effort There exists series of catch per unit effort for the French trawlers and Spanish purse seine fleets (although not standardized) and not used in assessment
Gear surveys (trawl, longline) Surveys use Pelagic trawls to sample the population mainly during the spawning period and in some cases (opportunistically) purse seining.
Acoustic surveys There are French acoustic survey indexes available since 1989 (which are used in the assessment), some previous indexes are available since 1983 but before the period of the assessment. In 2003 a series of acoustic surveys started on juveniles.
Egg surveys Daily Egg Production Method applied to estimate the SSB. Series since 1987-2003 with a gap in 1993. Estimates in 1996 & 1999 are based on regression models of previous DEPM SSB on P0 and SA or Total Egg production.
Larvae surveys Some sampling exists to know the larvae condition. And there are some experimental surveys on Juveniles in 1999 and 2000 (JUVESU project CT97-3374).
2.3 Age, size and sex-structure: catch-at-age, weight-at-age, Maturity-at-age, Size-at-age, age-specific reproductive information
Biological sampling of the catches has been generally sufficient, except for 2000 and 2001. An increase of the sampling effort seems useful to have a better knowledge of the age structure of the catches during the second semester in the North of the Bay of Biscay. Age reading is considered accurate and cross reading exchanges and workshops have taken place recently between Spain and France (Uriarte WD2002). Otoliths typology is made.
2.4 Tagging information No tagging program 2.5 Environmental data Much information exists, particularly on the temperature, water
stratification, upwelling index, etc Motos et al. 1996, Borja et al. 1996, 98), (Allain et al. 2001). Currently a 3-Dymensional Hydrodynamic model is used to monitor the bay of Biscay environment affecting anchovy recruitment (Allain et al. 2001) .
2.6 Fishery information Two main fisheries. A Spanish purse seine fishery operating mainly in Spring and a French one using mainly pelagic trawling and operating mainly in winter, summer and autumn. A small fleet of French purse seiners fishery operates in the South of the Bay of Biscay (Spring) and in the North (2nd half of the year). See review in Uriarte et al. (1996).
WGHMSA Report 2005 23
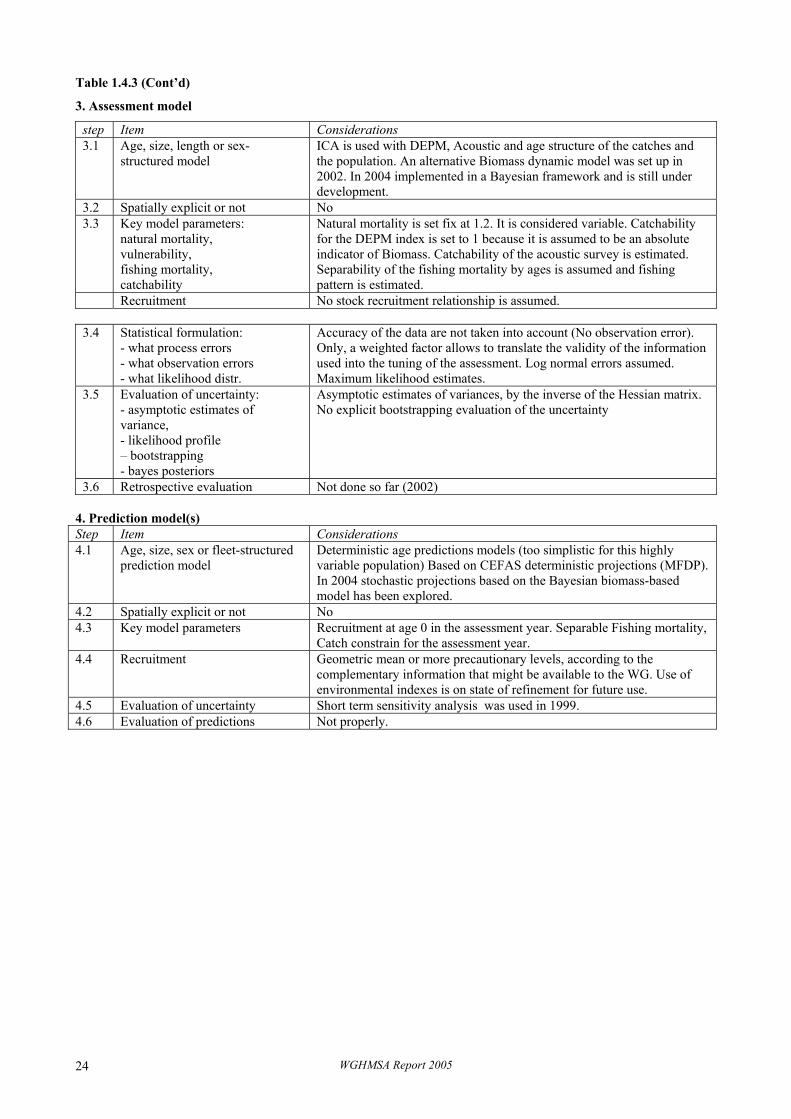
Table 1.4.3 (Cont’d)
3. Assessment model
step Item Considerations 3.1 Age, size, length or sex-
structured model ICA is used with DEPM, Acoustic and age structure of the catches and the population. An alternative Biomass dynamic model was set up in 2002. In 2004 implemented in a Bayesian framework and is still under development.
3.2 Spatially explicit or not No 3.3 Key model parameters:
natural mortality, vulnerability, fishing mortality, catchability
Natural mortality is set fix at 1.2. It is considered variable. Catchability for the DEPM index is set to 1 because it is assumed to be an absolute indicator of Biomass. Catchability of the acoustic survey is estimated. Separability of the fishing mortality by ages is assumed and fishing pattern is estimated.
Recruitment No stock recruitment relationship is assumed.
3.4 Statistical formulation: - what process errors - what observation errors - what likelihood distr.
Accuracy of the data are not taken into account (No observation error). Only, a weighted factor allows to translate the validity of the information used into the tuning of the assessment. Log normal errors assumed. Maximum likelihood estimates.
3.5 Evaluation of uncertainty: - asymptotic estimates of variance, - likelihood profile – bootstrapping - bayes posteriors
Asymptotic estimates of variances, by the inverse of the Hessian matrix. No explicit bootstrapping evaluation of the uncertainty
3.6 Retrospective evaluation Not done so far (2002) 4. Prediction model(s) Step Item Considerations 4.1 Age, size, sex or fleet-structured
prediction model Deterministic age predictions models (too simplistic for this highly variable population) Based on CEFAS deterministic projections (MFDP). In 2004 stochastic projections based on the Bayesian biomass-based model has been explored.
4.2 Spatially explicit or not No 4.3 Key model parameters Recruitment at age 0 in the assessment year. Separable Fishing mortality,
Catch constrain for the assessment year. 4.4 Recruitment Geometric mean or more precautionary levels, according to the
complementary information that might be available to the WG. Use of environmental indexes is on state of refinement for future use.
4.5 Evaluation of uncertainty Short term sensitivity analysis was used in 1999. 4.6 Evaluation of predictions Not properly.
WGHMSA Report 2005 24
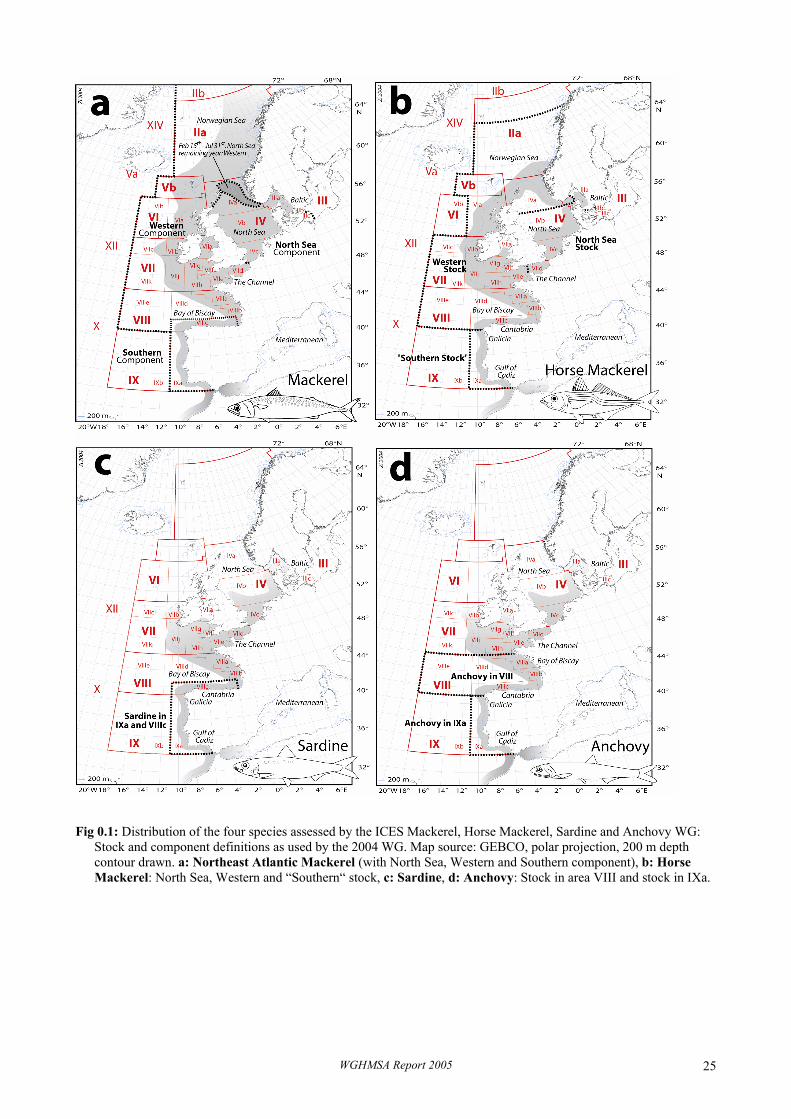
Fig 0.1: Distribution of the four species assessed by the ICES Mackerel, Horse Mackerel, Sardine and Anchovy WG:
Stock and component definitions as used by the 2004 WG. Map source: GEBCO, polar projection, 200 m depth contour drawn. a: Northeast Atlantic Mackerel (with North Sea, Western and Southern component), b: Horse Mackerel: North Sea, Western and “Southern“ stock, c: Sardine, d: Anchovy: Stock in area VIII and stock in IXa.
WGHMSA Report 2005 25
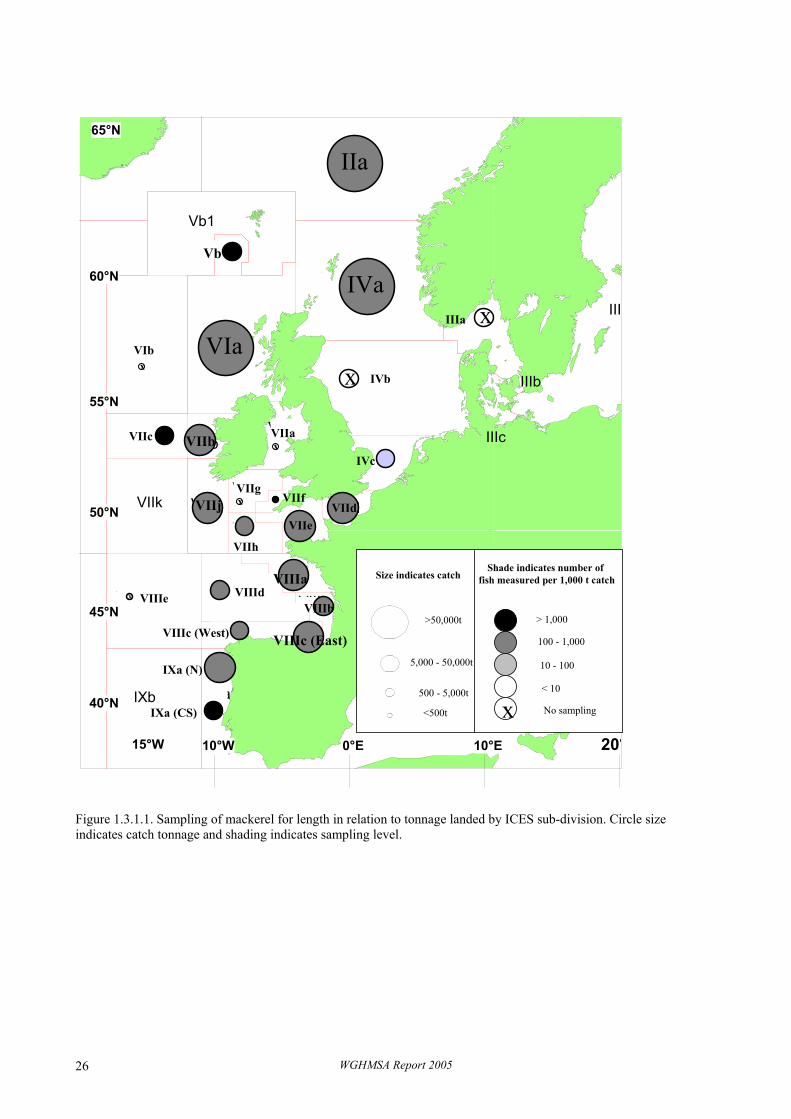
Figure 1.3.1.1. Sampling of mackerel for length in relation to tonnage landed by ICES sub-division. Circle size indicates catch tonnage and shading indicates sampling level.
WGHMSA Report 2005 26
IXaIXb
VIIIc
VIIIaVIIId
VIIa
VIIg
VIIeVIIhVIIdVIIj
VIIb
VIIk
VIIc
VIIIbVIIIe
IVb
IVa
Vb1
Vb2
Va
VIb VIa
III
IVc
IIIa
IIIb
IIIc
20°15°W
40°N
10°W
65°N
60°N
55°N
50°N
45°N
10°E0°E
Size indicates catchShade indicates number of
fish measured per 1,000 t catch
>50,000t
5,000 - 50,000t
500 - 5,000t
<500t No sampling
> 1,000
100 - 1,000
10 - 100
< 10
x
IIIa x
IVbx
VIIgx
VIIax
VIbx
VIIIex
IIa
IVa
VIa
VIIb
VIIIa
VIIIc (East)
VIIj VIId VIIe
IXa (N)
IVc
VIIc
VIIh
VIIIb
VIIIc (West)
Vb
VIIf
IXa (CS)
VIIId
Figure 1.3.1.2. Sampling of mackerel for age in relation to tonnage landed by ICES sub-division. Circle size indicates catch tonnage and shading indicates sampling level.
WGHMSA Report 2005 27
IXaIXb
VIIIc
VIIIaVIIId
VIIa
VIIg
VIIeVIIhVIIdVIIj
VIIb
VIIk
VIIc
VIIIbVIIIe
IVb
IVa
Vb1
Vb2
Va
VIb VIa
III
IVc
IIIa
IIIb
IIIc
20°15°W
40°N
10°W
65°N
60°N
55°N
50°N
45°N
10°E0°E
>50,000t
5,000 - 50,000t
500 - 5,000t
<500tNo sampling
> 500
50 - 500
5 - 50
< 5
Size indicates catchShade indicates number offish aged per 1,000 t catch
x
IIa
VIIIa
VIIIc (East)
IVa
VIa
VIId VIIe
IXa (N)
VIIb
VIIj
IVc
VIIc
VIIh
VIIIb
VIIIc (West)
VIIId
IIIa x
IVbx
IXa (CS)
Vb
VIIf
VIIIex
VIbx
VIIax
VIIgx
Figure 1.3.1.3. Sampling of horse mackerel for length in relation to tonnage landed by ICES sub-division. Circle size indicates catch tonnage and shading indicates sampling level.
WGHMSA Report 2005 28
IXaIXb
VIIIc
VIIIaVIIId
VIIa
VIIg
VIIeVIIhVIIdVIIj
VIIb
VIIk
VIIc
VIIIbVIIIe
IVb
IVa
Vb1
Vb2
Va
VIb VIa
III
IVc
IIIa
IIIb
IIIc
20°15°W
40°N
10°W
65°N
60°N
55°N
50°N
45°N
10°E0°E
IVa
VIa
VIIdVIIeVIIh
VIIIa
VIIIc (E)
VIIj
IVc
IXa (CN)
IXa (CS)
IXa (N)
IXa (S)
VIIb
VIIIb
VIIIc (W)
VIIId
IIIa xIVbx
VIIc IIIcx
VIIfx
IIax
Vb x
VIIgx
Size indicates catchShade indicates number of
fish measured per 1,000 t catch
>10,000t
1,000 - 10,000t
100 - 1,000t
<100t No sampling
>5,000
500 - 5,000
50 - 500
< 50
x
WGHMSA Report 2005 29
Figure 1.3.1.4. Sampling of horse mackerel for age in relation to tonnage landed by ICES sub-division. Circle size indicates catch tonnage and shading indicates sampling level.
IXaIXb
VIIIc
VIIIaVIIId
VIIa
VIIg
VIIeVIIhVIIdVIIj
VIIb
VIIk
VIIc
VIIIbVIIIe
IVb
IVa
Vb1
Vb2
Va
VIb VIa
III
IVc
IIIa
IIIb
IIIc
20°15°W
40°N
10°W
65°N
60°N
55°N
50°N
45°N
10°E0°E
IVa
VIa
VIIdVIIeVIIh
VIIIa
VIIIc (E)
VIIj
IVc
IXa (CN)
IXa (CS)
IXa (N)
IXa (S)
VIIb
VIIIb
VIIIc (W)
VIIId
IIIa xIVbx
VIIc IIIcx
VIIfx
IIax
Vb x
VIIgx
>10,000t
1,000 - 10,000t
100 - 1,000t
<100tNo sampling
> 500
50 - 500
5 - 50
< 5
Size indicates catchShade indicates number offish aged per 1,000 t catch
x