Embed Size (px)
Citation preview

WORKFORCE 411
Workforce A
nalysis Em
ployment &
Training Centers of East C
entral Ohio
2007
Workforce AnalysisEmployment & Training Centers of East Central Ohio
Lawrence
SciotoGallia
Adams
PikeMeigs
JacksonBrown
Clermont
Hamilton HighlandVinton
Ross AthensClintonWarrenButler WashingtonHocking
Fayette MorganPickawayGreene MonroePreble Montgomery PerryFairfield Noble
Clark MadisonFranklin Muskingum
BelmontMiami GuernseyChampaign
LickingDarke
HarrisonDelaware CoshoctonShelby UnionLogan
Knox JeffersonTuscarawas
HolmesAuglaize Marion MorrowMercer CarrollHardin
Allen ColumbianaStarkVan Wert WayneWyandotRichland
Crawford Ashland
MahoningPutnam Hancock
Paulding Seneca MedinaHuron PortageSummit
Defiance Henry ErieSanduskyTrumbullLorain
Wood
Ottawa
Cuyahoga
Williams GeaugaFulton Lucas
LakeAshtabula
Workforce Analysis Employment & Training Centers of
East Central Ohio
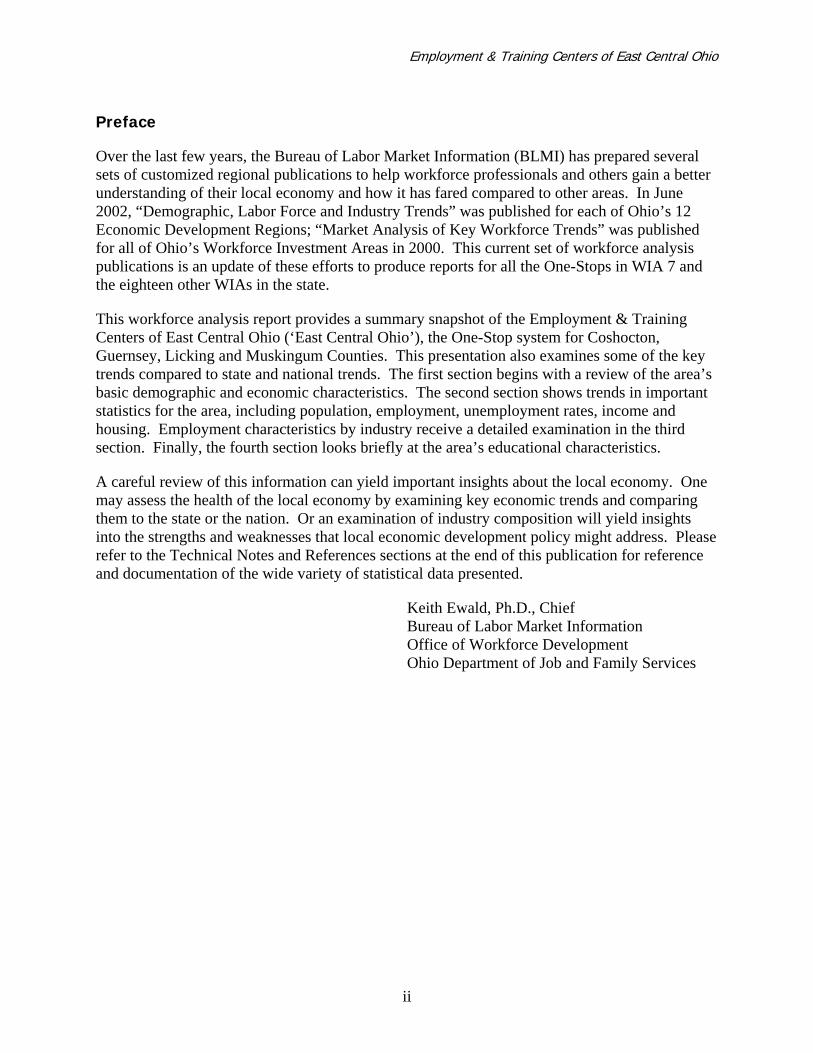
Table of Contents
Preface ......................................................................................................................................... ii Highlights.....................................................................................................................................iii
I. Understanding the Local Labor Market ................................................................................ 1 Figure 1: Regional Commuting Patterns ................................................................................. 1 Figure 2: Net Flow of Ohio Commuters................................................................................... 2
II. Key Trends ............................................................................................................................. 3 Figure 3: Population Trends .................................................................................................. 3 Figure 4: Demographic Characteristics ................................................................................... 3 Figure 5: Employment Trends ............................................................................................... 4 Figure 6: Employment in East Central Ohio by Major Industry .................................................. 4 Figure 7: Unemployment Trends............................................................................................ 5 Figure 8: Per Capita Income.................................................................................................. 6 Figure 9: Number of New Residential Building Permits............................................................. 7 Figure 10: Valuation of New Residential Building Permits ......................................................... 7
III. Industry Analysis.................................................................................................................. 8 Figure 11: Employment by Major Sector, 2005........................................................................ 8 Figure 12: Employment by Industry Sector, 2005.................................................................... 9 Figure 13: Employment Prospects by Industry Sector ............................................................ 10 Figure 14: Sectors Ranked by 2005 Average Weekly Earnings ................................................ 11
IV. Educational Infrastructure................................................................................................. 12 Figure 15: Educational Attainment ....................................................................................... 12
Technical Notes......................................................................................................................... 13 References................................................................................................................................. 14
Appendix A: Workforce Investment Area 7........................................................................... 15 Appendix B: Metropolitan and Micropolitan Areas................................................................ 16 Appendix C: Major County-to-County Commuting Patterns................................................ 19 Appendix D: Major Employers by County .............................................................................. 20
Employment & Training Centers of East Central Ohio
ii
Preface
Over the last few years, the Bureau of Labor Market Information (BLMI) has prepared several sets of customized regional publications to help workforce professionals and others gain a better understanding of their local economy and how it has fared compared to other areas. In June 2002, “Demographic, Labor Force and Industry Trends” was published for each of Ohio’s 12 Economic Development Regions; “Market Analysis of Key Workforce Trends” was published for all of Ohio’s Workforce Investment Areas in 2000. This current set of workforce analysis publications is an update of these efforts to produce reports for all the One-Stops in WIA 7 and the eighteen other WIAs in the state.
This workforce analysis report provides a summary snapshot of the Employment & Training Centers of East Central Ohio (‘East Central Ohio’), the One-Stop system for Coshocton, Guernsey, Licking and Muskingum Counties. This presentation also examines some of the key trends compared to state and national trends. The first section begins with a review of the area’s basic demographic and economic characteristics. The second section shows trends in important statistics for the area, including population, employment, unemployment rates, income and housing. Employment characteristics by industry receive a detailed examination in the third section. Finally, the fourth section looks briefly at the area’s educational characteristics.
A careful review of this information can yield important insights about the local economy. One may assess the health of the local economy by examining key economic trends and comparing them to the state or the nation. Or an examination of industry composition will yield insights into the strengths and weaknesses that local economic development policy might address. Please refer to the Technical Notes and References sections at the end of this publication for reference and documentation of the wide variety of statistical data presented.
Keith Ewald, Ph.D., Chief Bureau of Labor Market Information Office of Workforce Development Ohio Department of Job and Family Services
Employment & Training Centers of East Central Ohio
iii
Highlights
Licking County appears to be the economically and demographically dominant county in the East Central Ohio region. This is in part due to its relatively larger population and employment base.
Coshocton, Guernsey and Muskingum Counties are all defined as economically “transitional” by the Appalachian Regional Commission.
Overall, East Central Ohio is a net out-commuting area, especially Licking County, one of eight counties comprising the Columbus Metropolitan Statistical Area.
Population in the area has increased 7.2 percent over the last decade. Demographically, the counties differ significantly from one another in their age distributions.
The area’s employment profile has been similar to the national profile over the past decade, though employment still has not completely recovered from the 2001 recession. Unemployment rates remained significantly above national rates the last few years.
Nominal per capita income has risen at a 3.9 percent compound annual rate of growth over the past ten years, though it still ranks behind the state and nation as a whole.
The number of new residential building permits has stayed steady in the last decade, with the exception of Licking County, which saw a building boom in 2002.
The dominant employment sectors in 2005 were trade, transportation and utilities; manufacturing and government.
Mining employment is more heavily concentrated in this area compared to the state.
Local government, accommodation and food services, real estate and rental and leasing and information all created jobs between 2000 and 2005.
The region’s three highest paying sectors in 2005 were utilities, federal government and mining.
Generally, the area has a lower proportion of postsecondary educational attainment than the rest of the state.
Workforce Analysis Employment & Training Centers of
East Central Ohio I. Understanding Local Labor Markets
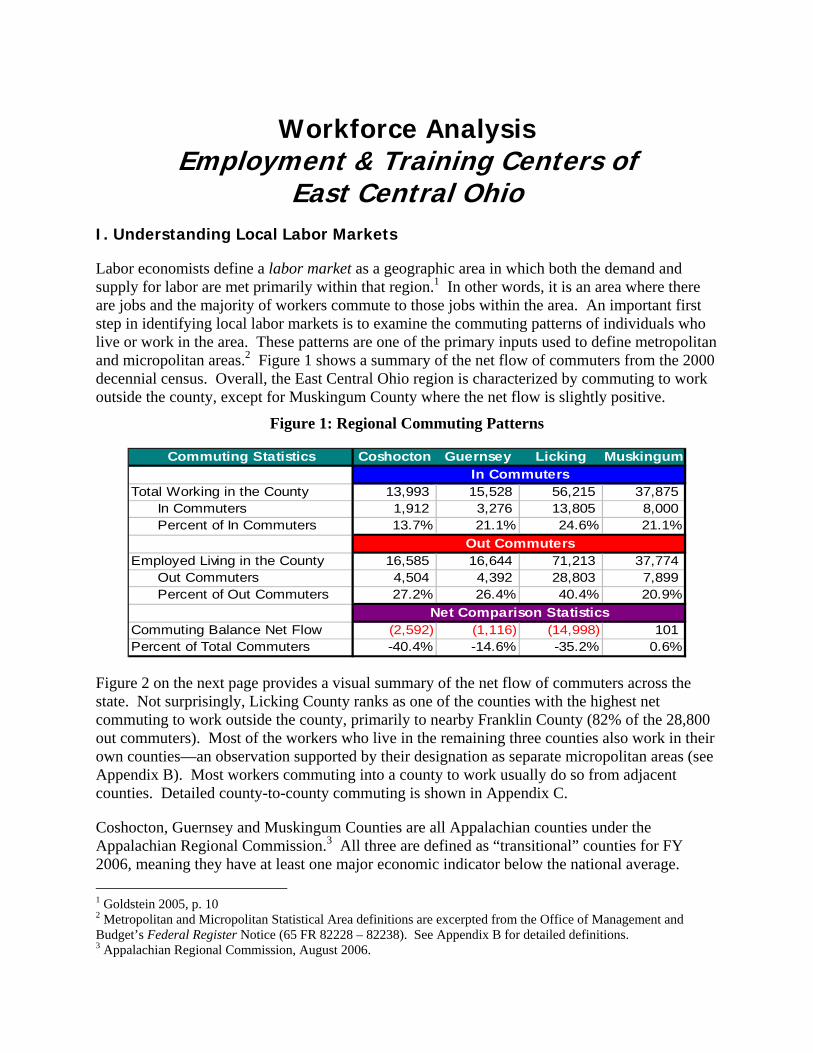
Labor economists define a labor market as a geographic area in which both the demand and supply for labor are met primarily within that region.1 In other words, it is an area where there are jobs and the majority of workers commute to those jobs within the area. An important first step in identifying local labor markets is to examine the commuting patterns of individuals who live or work in the area. These patterns are one of the primary inputs used to define metropolitan and micropolitan areas.2 Figure 1 shows a summary of the net flow of commuters from the 2000 decennial census. Overall, the East Central Ohio region is characterized by commuting to work outside the county, except for Muskingum County where the net flow is slightly positive.
Figure 1: Regional Commuting Patterns
Commuting Statistics Coshocton Guernsey Licking Muskingum
Total Working in the County 13,993 15,528 56,215 37,875 In Commuters 1,912 3,276 13,805 8,000 Percent of In Commuters 13.7% 21.1% 24.6% 21.1%
Employed Living in the County 16,585 16,644 71,213 37,774 Out Commuters 4,504 4,392 28,803 7,899 Percent of Out Commuters 27.2% 26.4% 40.4% 20.9%
Commuting Balance Net Flow (2,592) (1,116) (14,998) 101Percent of Total Commuters -40.4% -14.6% -35.2% 0.6%
In Commuters
Out Commuters
Net Comparison Statistics
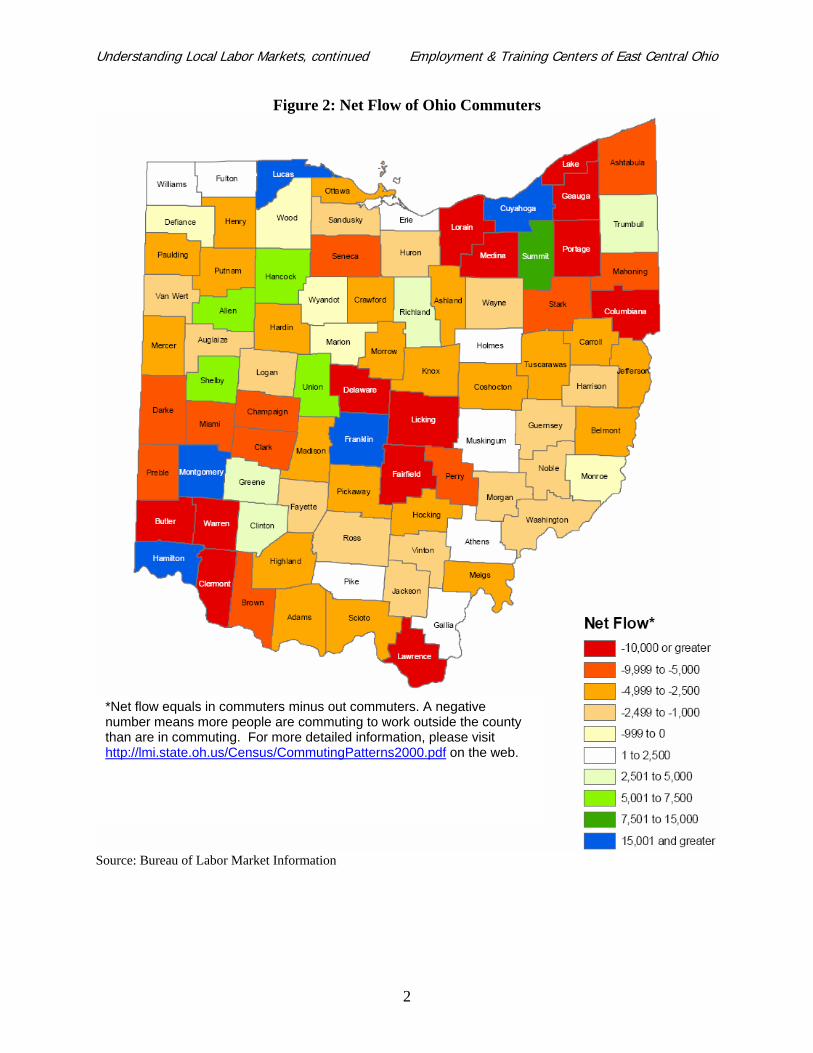
Figure 2 on the next page provides a visual summary of the net flow of commuters across the state. Not surprisingly, Licking County ranks as one of the counties with the highest net commuting to work outside the county, primarily to nearby Franklin County (82% of the 28,800 out commuters). Most of the workers who live in the remaining three counties also work in their own counties—an observation supported by their designation as separate micropolitan areas (see Appendix B). Most workers commuting into a county to work usually do so from adjacent counties. Detailed county-to-county commuting is shown in Appendix C.
Coshocton, Guernsey and Muskingum Counties are all Appalachian counties under the Appalachian Regional Commission.3 All three are defined as “transitional” counties for FY 2006, meaning they have at least one major economic indicator below the national average. 1 Goldstein 2005, p. 10 2 Metropolitan and Micropolitan Statistical Area definitions are excerpted from the Office of Management and Budget’s Federal Register Notice (65 FR 82228 – 82238). See Appendix B for detailed definitions. 3 Appalachian Regional Commission, August 2006.
Understanding Local Labor Markets, continued Employment & Training Centers of East Central Ohio
2
Figure 2: Net Flow of Ohio Commuters
Source: Bureau of Labor Market Information
*Net flow equals in commuters minus out commuters. A negative number means more people are commuting to work outside the county than are in commuting. For more detailed information, please visit http://lmi.state.oh.us/Census/CommutingPatterns2000.pdf on the web.
Employment & Training Centers of East Central Ohio
3
II. Key Trends
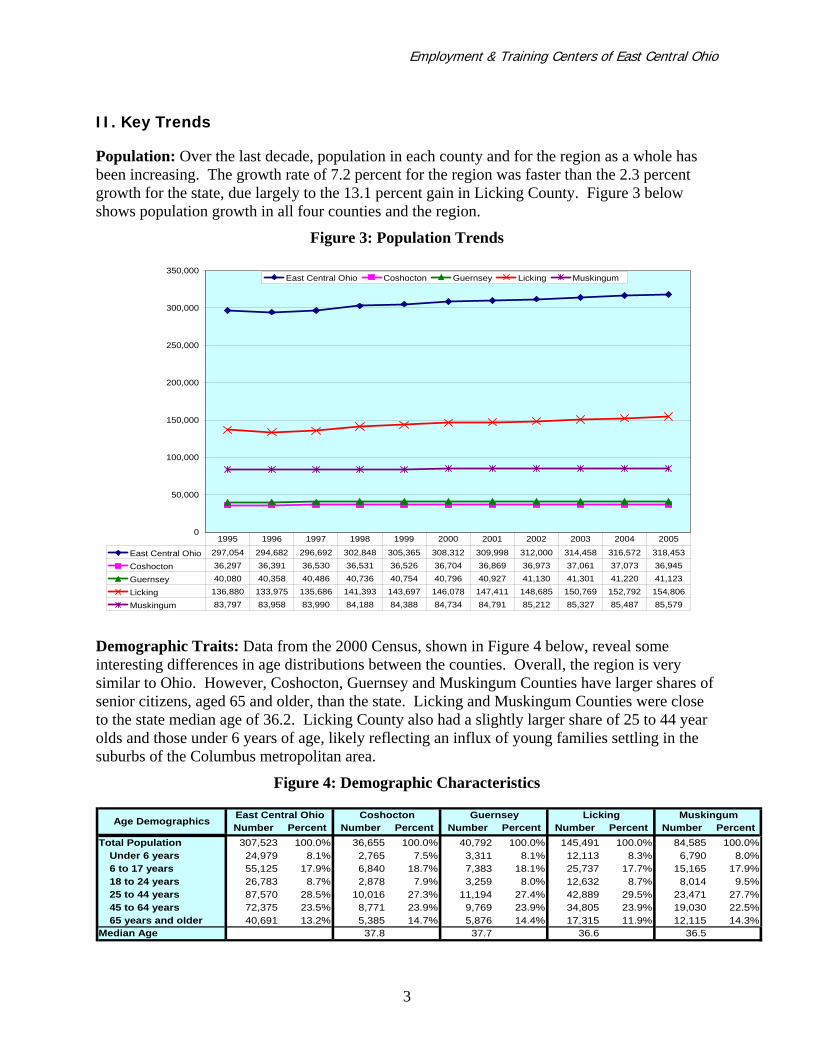
Population: Over the last decade, population in each county and for the region as a whole has been increasing. The growth rate of 7.2 percent for the region was faster than the 2.3 percent growth for the state, due largely to the 13.1 percent gain in Licking County. Figure 3 below shows population growth in all four counties and the region.
Figure 3: Population Trends
0
50,000
100,000
150,000
200,000
250,000
300,000
350,000East Central Ohio Coshocton Guernsey Licking Muskingum
East Central Ohio 297,054 294,682 296,692 302,848 305,365 308,312 309,998 312,000 314,458 316,572 318,453
Coshocton 36,297 36,391 36,530 36,531 36,526 36,704 36,869 36,973 37,061 37,073 36,945
Guernsey 40,080 40,358 40,486 40,736 40,754 40,796 40,927 41,130 41,301 41,220 41,123
Licking 136,880 133,975 135,686 141,393 143,697 146,078 147,411 148,685 150,769 152,792 154,806
Muskingum 83,797 83,958 83,990 84,188 84,388 84,734 84,791 85,212 85,327 85,487 85,579
1995 1996 1997 1998 1999 2000 2001 2002 2003 2004 2005
Demographic Traits: Data from the 2000 Census, shown in Figure 4 below, reveal some interesting differences in age distributions between the counties. Overall, the region is very similar to Ohio. However, Coshocton, Guernsey and Muskingum Counties have larger shares of senior citizens, aged 65 and older, than the state. Licking and Muskingum Counties were close to the state median age of 36.2. Licking County also had a slightly larger share of 25 to 44 year olds and those under 6 years of age, likely reflecting an influx of young families settling in the suburbs of the Columbus metropolitan area.
Figure 4: Demographic Characteristics
Number Percent Number Percent Number Percent Number Percent Number PercentTotal Population 307,523 100.0% 36,655 100.0% 40,792 100.0% 145,491 100.0% 84,585 100.0%
Under 6 years 24,979 8.1% 2,765 7.5% 3,311 8.1% 12,113 8.3% 6,790 8.0%6 to 17 years 55,125 17.9% 6,840 18.7% 7,383 18.1% 25,737 17.7% 15,165 17.9%18 to 24 years 26,783 8.7% 2,878 7.9% 3,259 8.0% 12,632 8.7% 8,014 9.5%25 to 44 years 87,570 28.5% 10,016 27.3% 11,194 27.4% 42,889 29.5% 23,471 27.7%45 to 64 years 72,375 23.5% 8,771 23.9% 9,769 23.9% 34,805 23.9% 19,030 22.5%65 years and older 40,691 13.2% 5,385 14.7% 5,876 14.4% 17,315 11.9% 12,115 14.3%
Median Age 37.8 37.7 36.6 36.5
Licking MuskingumAge Demographics East Central Ohio Coshocton Guernsey
Key Trends, continued Employment & Training Centers of East Central Ohio
4
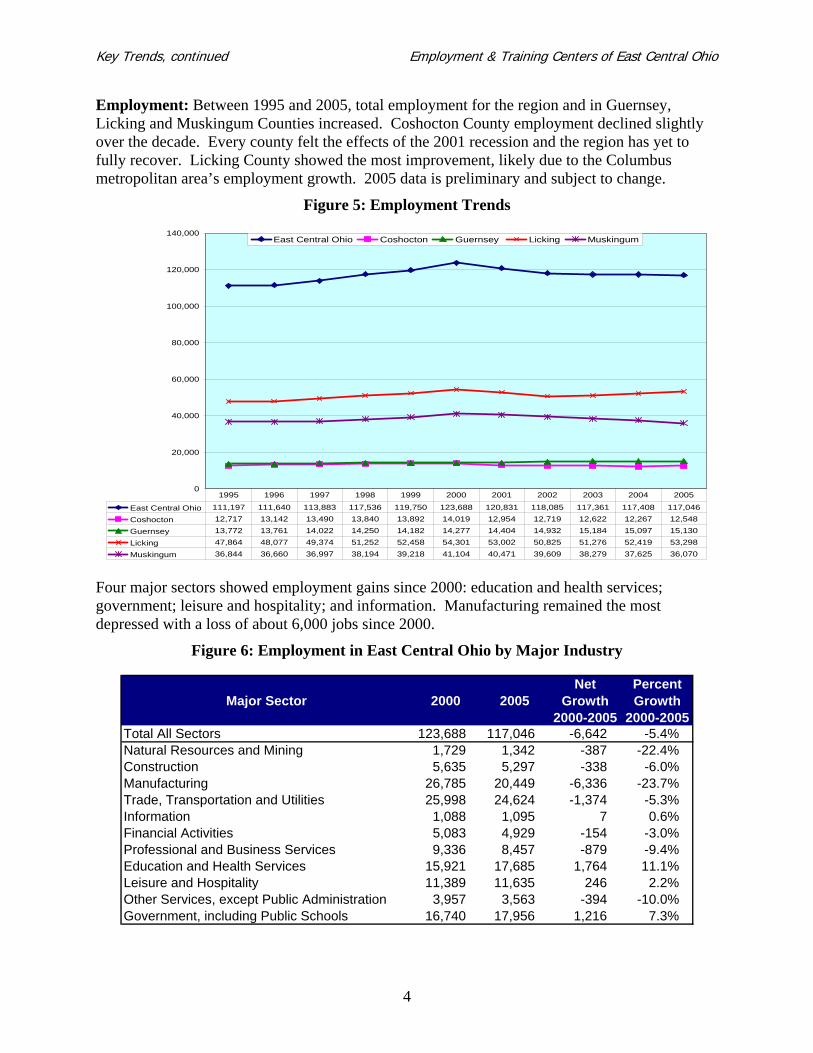
Employment: Between 1995 and 2005, total employment for the region and in Guernsey, Licking and Muskingum Counties increased. Coshocton County employment declined slightly over the decade. Every county felt the effects of the 2001 recession and the region has yet to fully recover. Licking County showed the most improvement, likely due to the Columbus metropolitan area’s employment growth. 2005 data is preliminary and subject to change.
Figure 5: Employment Trends
0
20,000
40,000
60,000
80,000
100,000
120,000
140,000East Central Ohio Coshocton Guernsey Licking Muskingum
East Central Ohio 111,197 111,640 113,883 117,536 119,750 123,688 120,831 118,085 117,361 117,408 117,046
Coshocton 12,717 13,142 13,490 13,840 13,892 14,019 12,954 12,719 12,622 12,267 12,548
Guernsey 13,772 13,761 14,022 14,250 14,182 14,277 14,404 14,932 15,184 15,097 15,130
Licking 47,864 48,077 49,374 51,252 52,458 54,301 53,002 50,825 51,276 52,419 53,298
Muskingum 36,844 36,660 36,997 38,194 39,218 41,104 40,471 39,609 38,279 37,625 36,070
1995 1996 1997 1998 1999 2000 2001 2002 2003 2004 2005
Four major sectors showed employment gains since 2000: education and health services; government; leisure and hospitality; and information. Manufacturing remained the most depressed with a loss of about 6,000 jobs since 2000.
Figure 6: Employment in East Central Ohio by Major Industry
Major Sector 2000 2005Net
Growth 2000-2005
Percent Growth
2000-2005Total All Sectors 123,688 117,046 -6,642 -5.4%Natural Resources and Mining 1,729 1,342 -387 -22.4%Construction 5,635 5,297 -338 -6.0%Manufacturing 26,785 20,449 -6,336 -23.7%Trade, Transportation and Utilities 25,998 24,624 -1,374 -5.3%Information 1,088 1,095 7 0.6%Financial Activities 5,083 4,929 -154 -3.0%Professional and Business Services 9,336 8,457 -879 -9.4%Education and Health Services 15,921 17,685 1,764 11.1%Leisure and Hospitality 11,389 11,635 246 2.2%Other Services, except Public Administration 3,957 3,563 -394 -10.0%Government, including Public Schools 16,740 17,956 1,216 7.3%

Key Trends, continued Employment & Training Centers of East Central Ohio
5
Unemployment: Unemployment rates in the East Central Ohio area remained above U.S. and statewide rates throughout the last decade. Rate changes had been the same in the late 1990s, but state and area unemployment has been slow to recover since the 2001 recession. It is worth noting that overall rates did not begin to abate in the region until 2005. Rates in Coshocton and Muskingum Counties remained above eight percent in 2005. Unemployment was lowest in Licking County over the period, resting at 5.8 percent in 2005.
Figure 7: Unemployment Rates
0.0%
1.0%
2.0%
3.0%
4.0%
5.0%
6.0%
7.0%
8.0%
9.0%
10.0%U.S. Ohio East Central Ohio Coshocton Guernsey Licking Muskingum
U.S. 5.6% 5.4% 4.9% 4.5% 4.2% 4.0% 4.7% 5.8% 6.0% 5.5% 5.1%
Ohio 4.9% 5.0% 4.6% 4.3% 4.3% 4.0% 4.4% 5.7% 6.2% 6.2% 5.9%
East Central Ohio 5.6% 6.0% 5.7% 5.4% 5.5% 4.5% 4.8% 5.9% 6.7% 7.1% 6.9%
Coshocton 5.7% 6.4% 6.3% 5.4% 6.1% 4.3% 5.4% 6.5% 7.3% 8.9% 8.3%
Guernsey 8.0% 8.6% 7.9% 8.3% 8.8% 6.3% 5.6% 6.6% 7.5% 7.9% 7.2%
Licking 3.9% 3.8% 4.0% 4.0% 3.7% 3.7% 3.9% 5.1% 6.0% 5.9% 5.8%
Muskingum 7.3% 8.2% 7.5% 6.5% 6.7% 5.2% 5.7% 6.7% 7.4% 8.3% 8.3%
1995 1996 1997 1998 1999 2000 2001 2002 2003 2004 2005

Key Trends, continued Employment & Training Centers of East Central Ohio
6
Income: Per capita income has been rising steadily in the area over the past ten years—a compound annual growth rate of about 3.9 percent for the area—although it still ranks behind the state and nation as a whole. Figure 8 below shows per capita income in each of the area’s four counties compared with the One-Stop, state and country. It is worth noting that the ranking of counties in terms of income has remained essentially the same over the period of analysis, with Licking County earning the most per capita. This is likely because incomes tend to be higher in major metropolitan areas compared to rural areas. Coshocton was the only county to see any decline in per capita income—in 2001 and 2002.
Figure 8: Per Capita Income
$0
$5,000
$10,000
$15,000
$20,000
$25,000
$30,000
$35,000U.S. Ohio East Central Ohio Coshocton Guernsey Licking Muskingum
U.S. $23,076 $24,175 $25,334 $26,883 $27,939 $29,845 $30,574 $30,810 $31,484 $33,050
Ohio $22,495 $23,322 $24,656 $26,017 $26,859 $28,207 $28,601 $29,212 $29,954 $31,161
East Central Ohio $19,226 $20,398 $21,634 $22,516 $23,185 $24,510 $25,014 $25,405 $25,936 $27,122
Coshocton $17,531 $18,600 $20,141 $21,235 $21,858 $23,203 $22,792 $22,758 $23,318 $24,211
Guernsey $15,988 $16,469 $17,660 $18,663 $18,902 $19,830 $21,011 $21,562 $22,061 $22,817
Licking $21,175 $23,009 $24,265 $24,868 $25,548 $26,820 $27,270 $27,755 $28,247 $29,685
Muskingum $18,328 $18,903 $19,951 $20,987 $21,805 $23,350 $23,993 $24,310 $24,868 $25,883
1995 1996 1997 1998 1999 2000 2001 2002 2003 2004
Key Trends, continued Employment & Training Centers of East Central Ohio
7
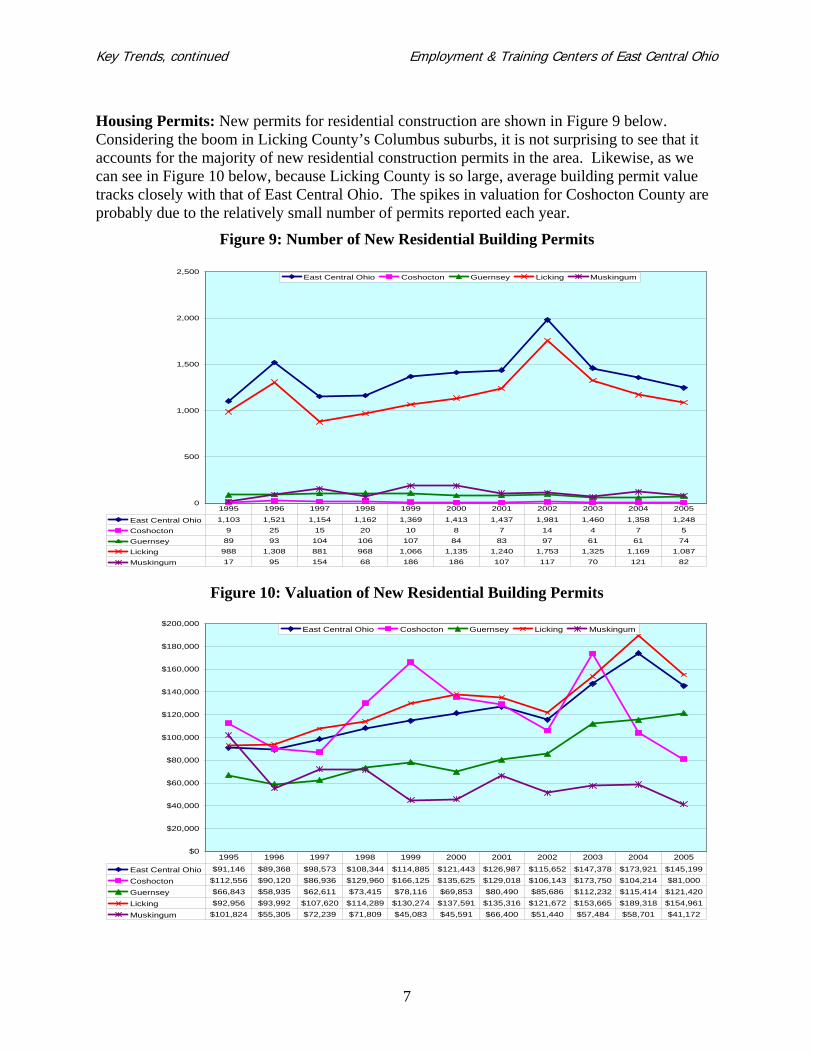
Housing Permits: New permits for residential construction are shown in Figure 9 below. Considering the boom in Licking County’s Columbus suburbs, it is not surprising to see that it accounts for the majority of new residential construction permits in the area. Likewise, as we can see in Figure 10 below, because Licking County is so large, average building permit value tracks closely with that of East Central Ohio. The spikes in valuation for Coshocton County are probably due to the relatively small number of permits reported each year.
Figure 9: Number of New Residential Building Permits
0
500
1,000
1,500
2,000
2,500East Central Ohio Coshocton Guernsey Licking Muskingum
East Central Ohio 1,103 1,521 1,154 1,162 1,369 1,413 1,437 1,981 1,460 1,358 1,248
Coshocton 9 25 15 20 10 8 7 14 4 7 5
Guernsey 89 93 104 106 107 84 83 97 61 61 74
Licking 988 1,308 881 968 1,066 1,135 1,240 1,753 1,325 1,169 1,087
Muskingum 17 95 154 68 186 186 107 117 70 121 82
1995 1996 1997 1998 1999 2000 2001 2002 2003 2004 2005
Figure 10: Valuation of New Residential Building Permits
$0
$20,000
$40,000
$60,000
$80,000
$100,000
$120,000
$140,000
$160,000
$180,000
$200,000East Central Ohio Coshocton Guernsey Licking Muskingum
East Central Ohio $91,146 $89,368 $98,573 $108,344 $114,885 $121,443 $126,987 $115,652 $147,378 $173,921 $145,199
Coshocton $112,556 $90,120 $86,936 $129,960 $166,125 $135,625 $129,018 $106,143 $173,750 $104,214 $81,000
Guernsey $66,843 $58,935 $62,611 $73,415 $78,116 $69,853 $80,490 $85,686 $112,232 $115,414 $121,420
Licking $92,956 $93,992 $107,620 $114,289 $130,274 $137,591 $135,316 $121,672 $153,665 $189,318 $154,961
Muskingum $101,824 $55,305 $72,239 $71,809 $45,083 $45,591 $66,400 $51,440 $57,484 $58,701 $41,172
1995 1996 1997 1998 1999 2000 2001 2002 2003 2004 2005
Employment & Training Centers of East Central Ohio
8
III. Industry Analysis
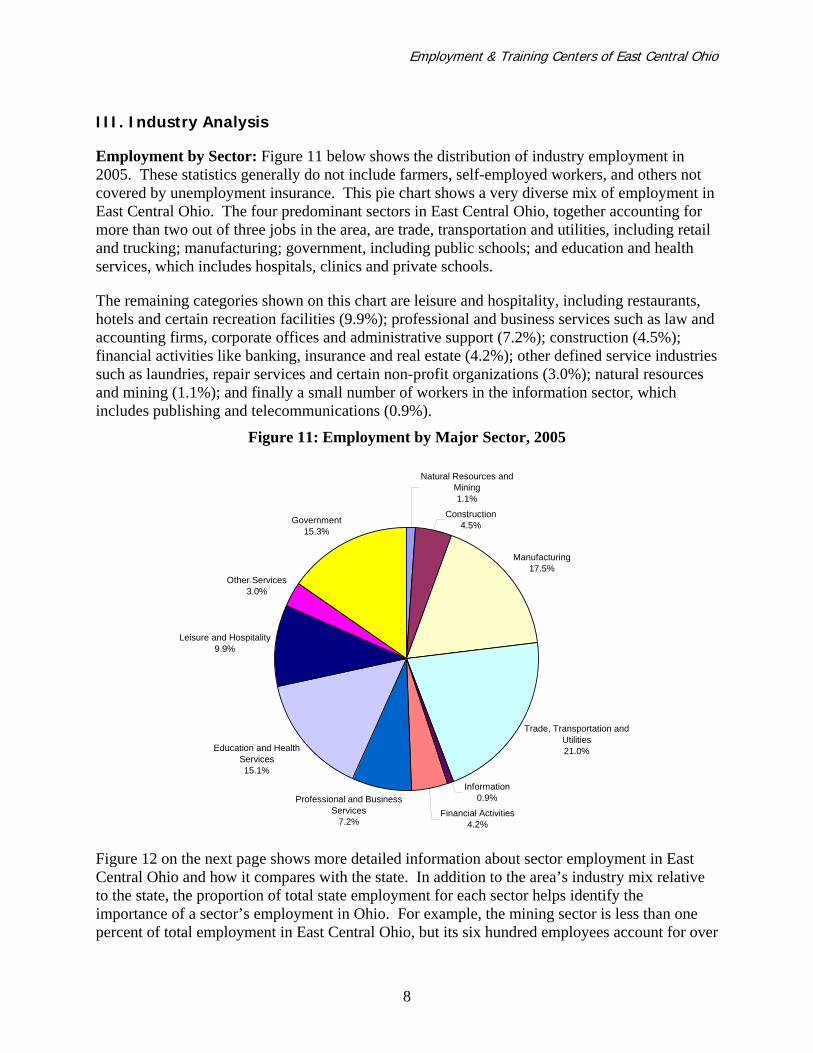
Employment by Sector: Figure 11 below shows the distribution of industry employment in 2005. These statistics generally do not include farmers, self-employed workers, and others not covered by unemployment insurance. This pie chart shows a very diverse mix of employment in East Central Ohio. The four predominant sectors in East Central Ohio, together accounting for more than two out of three jobs in the area, are trade, transportation and utilities, including retail and trucking; manufacturing; government, including public schools; and education and health services, which includes hospitals, clinics and private schools.
The remaining categories shown on this chart are leisure and hospitality, including restaurants, hotels and certain recreation facilities (9.9%); professional and business services such as law and accounting firms, corporate offices and administrative support (7.2%); construction (4.5%); financial activities like banking, insurance and real estate (4.2%); other defined service industries such as laundries, repair services and certain non-profit organizations (3.0%); natural resources and mining (1.1%); and finally a small number of workers in the information sector, which includes publishing and telecommunications (0.9%).
Figure 11: Employment by Major Sector, 2005
Natural Resources and Mining1.1%
Construction4.5%
Manufacturing17.5%
Trade, Transportation and Utilities21.0%
Information0.9%
Financial Activities4.2%
Professional and Business Services
7.2%
Education and Health Services15.1%
Leisure and Hospitality9.9%
Other Services3.0%
Government15.3%
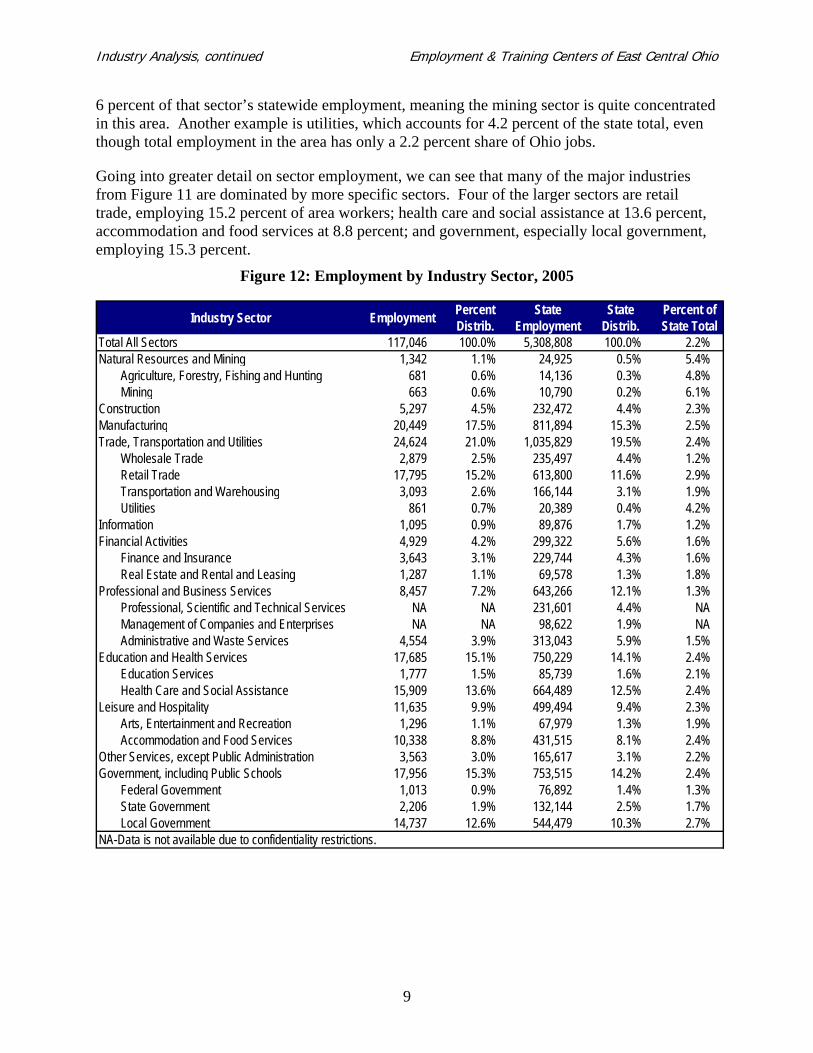
Figure 12 on the next page shows more detailed information about sector employment in East Central Ohio and how it compares with the state. In addition to the area’s industry mix relative to the state, the proportion of total state employment for each sector helps identify the importance of a sector’s employment in Ohio. For example, the mining sector is less than one percent of total employment in East Central Ohio, but its six hundred employees account for over
Industry Analysis, continued Employment & Training Centers of East Central Ohio
9
6 percent of that sector’s statewide employment, meaning the mining sector is quite concentrated in this area. Another example is utilities, which accounts for 4.2 percent of the state total, even though total employment in the area has only a 2.2 percent share of Ohio jobs.
Going into greater detail on sector employment, we can see that many of the major industries from Figure 11 are dominated by more specific sectors. Four of the larger sectors are retail trade, employing 15.2 percent of area workers; health care and social assistance at 13.6 percent, accommodation and food services at 8.8 percent; and government, especially local government, employing 15.3 percent.
Figure 12: Employment by Industry Sector, 2005
Industry Sector Employment Percent Distrib.
State Employment
State Distrib.
Percent of State Total
Total All Sectors 117,046 100.0% 5,308,808 100.0% 2.2%Natural Resources and Mining 1,342 1.1% 24,925 0.5% 5.4%
Agriculture, Forestry, Fishing and Hunting 681 0.6% 14,136 0.3% 4.8%Mining 663 0.6% 10,790 0.2% 6.1%
Construction 5,297 4.5% 232,472 4.4% 2.3%Manufacturing 20,449 17.5% 811,894 15.3% 2.5%Trade, Transportation and Utilities 24,624 21.0% 1,035,829 19.5% 2.4%
Wholesale Trade 2,879 2.5% 235,497 4.4% 1.2%Retail Trade 17,795 15.2% 613,800 11.6% 2.9%Transportation and Warehousing 3,093 2.6% 166,144 3.1% 1.9%Utilities 861 0.7% 20,389 0.4% 4.2%
Information 1,095 0.9% 89,876 1.7% 1.2%Financial Activities 4,929 4.2% 299,322 5.6% 1.6%
Finance and Insurance 3,643 3.1% 229,744 4.3% 1.6%Real Estate and Rental and Leasing 1,287 1.1% 69,578 1.3% 1.8%
Professional and Business Services 8,457 7.2% 643,266 12.1% 1.3%Professional, Scientific and Technical Services NA NA 231,601 4.4% NAManagement of Companies and Enterprises NA NA 98,622 1.9% NAAdministrative and Waste Services 4,554 3.9% 313,043 5.9% 1.5%
Education and Health Services 17,685 15.1% 750,229 14.1% 2.4%Education Services 1,777 1.5% 85,739 1.6% 2.1%Health Care and Social Assistance 15,909 13.6% 664,489 12.5% 2.4%
Leisure and Hospitality 11,635 9.9% 499,494 9.4% 2.3%Arts, Entertainment and Recreation 1,296 1.1% 67,979 1.3% 1.9%Accommodation and Food Services 10,338 8.8% 431,515 8.1% 2.4%
Other Services, except Public Administration 3,563 3.0% 165,617 3.1% 2.2%Government, including Public Schools 17,956 15.3% 753,515 14.2% 2.4%
Federal Government 1,013 0.9% 76,892 1.4% 1.3%State Government 2,206 1.9% 132,144 2.5% 1.7%Local Government 14,737 12.6% 544,479 10.3% 2.7%
NA-Data is not available due to confidentiality restrictions.

Industry Analysis, continued Employment & Training Centers of East Central Ohio
10
Employment Prospects: The table below looks at industry classifications and is color coded to more quickly identify those sectors most important to the region. The left column ranks the industrial groups and government by their employment levels in 2005. The top ten sectors in this column are printed in blue. The right column ranks sectors by the net number of new jobs created since 2005. The growth sectors in the second column are printed in red. Sectors that appear at the top of both lists are printed in purple. Sectors for which a growth rate could not be established due to confidentiality restrictions are printed in italics. Sectors with high employment levels are often a major source of job openings because seven of ten openings are expected to be replacement needs.4
In terms of employment, manufacturing is the largest singe sector in the region with about 20,000 employees. It is followed by retail trade and health care and social assistance. The next two large employment sectors were also the sectors to have added the most jobs in the last five years: local government and accommodation and food services. The remaining two growth sectors were real estate and rental and leasing and information.
Figure 13: Employment Prospects by Industry Sector 2005 Employment New Jobs: 2000-2005
Manufacturing Local Government Retail Trade Accommodation and Food Services Health Care and Social Assistance Real Estate and Rental and Leasing Local Government Information Accommodation and Food Services Arts, Entertainment and Recreation Construction State Government Administrative and Support and Waste Management Federal Government Finance and Insurance Finance and Insurance Other Services, except Public Administration Construction Transportation and Warehousing Retail Trade Wholesale Trade Other Services, except Public Administration State Government Administrative and Support and Waste Management Education Services Manufacturing Arts, Entertainment and Recreation Agriculture, Forestry, Fishing and Hunting Real Estate and Rental and Leasing Education Services Information Health Care and Social Assistance Federal Government Mining Utilities Transportation and Warehousing Agriculture, Forestry, Fishing and Hunting Utilities Mining Wholesale Trade
Seven sectors could not be ranked for job growth from 2000 to 2005. However, some of these are sectors that have seen significant growth statewide. Chief among these is health care and social assistance, which has seen strong nationwide demand as the baby boom generation ages and new medical technologies emerge.
4 Ohio Job Outlook to 2012, p. 3.
Industry Analysis, continued Employment & Training Centers of East Central Ohio
11
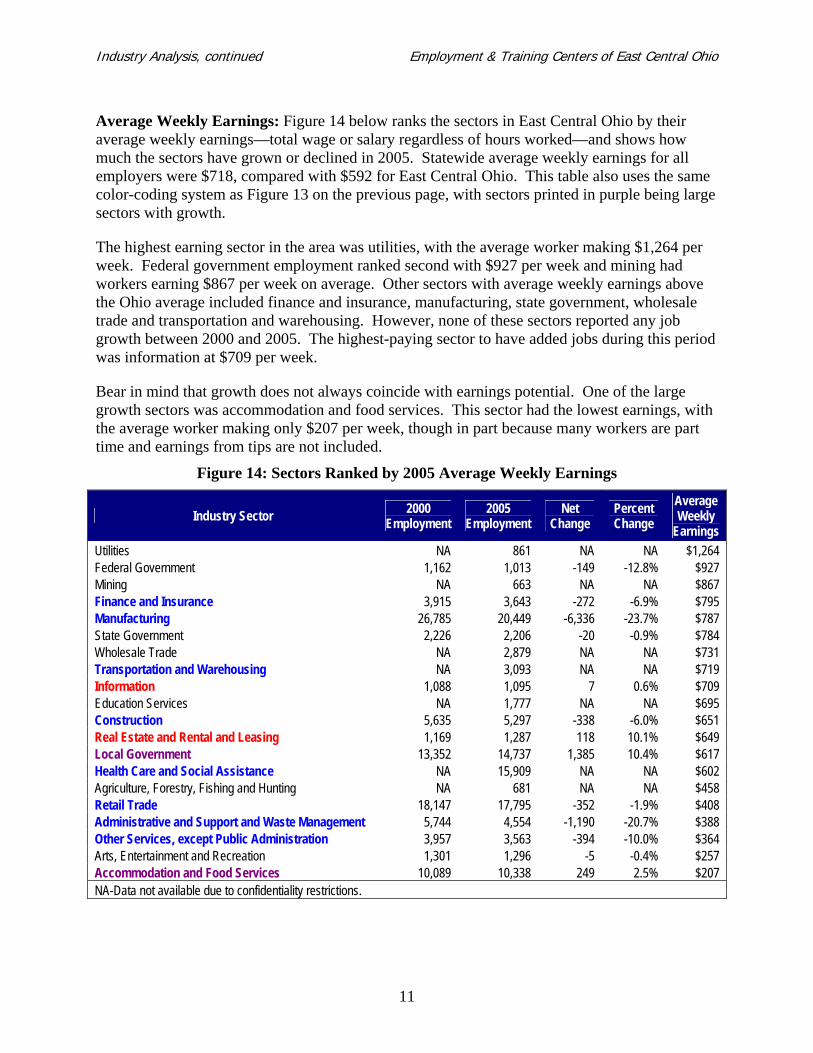
Average Weekly Earnings: Figure 14 below ranks the sectors in East Central Ohio by their average weekly earnings—total wage or salary regardless of hours worked—and shows how much the sectors have grown or declined in 2005. Statewide average weekly earnings for all employers were $718, compared with $592 for East Central Ohio. This table also uses the same color-coding system as Figure 13 on the previous page, with sectors printed in purple being large sectors with growth.
The highest earning sector in the area was utilities, with the average worker making $1,264 per week. Federal government employment ranked second with $927 per week and mining had workers earning $867 per week on average. Other sectors with average weekly earnings above the Ohio average included finance and insurance, manufacturing, state government, wholesale trade and transportation and warehousing. However, none of these sectors reported any job growth between 2000 and 2005. The highest-paying sector to have added jobs during this period was information at $709 per week.
Bear in mind that growth does not always coincide with earnings potential. One of the large growth sectors was accommodation and food services. This sector had the lowest earnings, with the average worker making only $207 per week, though in part because many workers are part time and earnings from tips are not included.
Figure 14: Sectors Ranked by 2005 Average Weekly Earnings
Industry Sector 2000 Employment
2005 Employment
Net Change
Percent Change
Average Weekly
Earnings Utilities NA 861 NA NA $1,264 Federal Government 1,162 1,013 -149 -12.8% $927 Mining NA 663 NA NA $867 Finance and Insurance 3,915 3,643 -272 -6.9% $795 Manufacturing 26,785 20,449 -6,336 -23.7% $787 State Government 2,226 2,206 -20 -0.9% $784 Wholesale Trade NA 2,879 NA NA $731 Transportation and Warehousing NA 3,093 NA NA $719 Information 1,088 1,095 7 0.6% $709 Education Services NA 1,777 NA NA $695 Construction 5,635 5,297 -338 -6.0% $651 Real Estate and Rental and Leasing 1,169 1,287 118 10.1% $649 Local Government 13,352 14,737 1,385 10.4% $617 Health Care and Social Assistance NA 15,909 NA NA $602 Agriculture, Forestry, Fishing and Hunting NA 681 NA NA $458 Retail Trade 18,147 17,795 -352 -1.9% $408 Administrative and Support and Waste Management 5,744 4,554 -1,190 -20.7% $388 Other Services, except Public Administration 3,957 3,563 -394 -10.0% $364 Arts, Entertainment and Recreation 1,301 1,296 -5 -0.4% $257 Accommodation and Food Services 10,089 10,338 249 2.5% $207 NA-Data not available due to confidentiality restrictions.
Employment & Training Centers of East Central Ohio
12
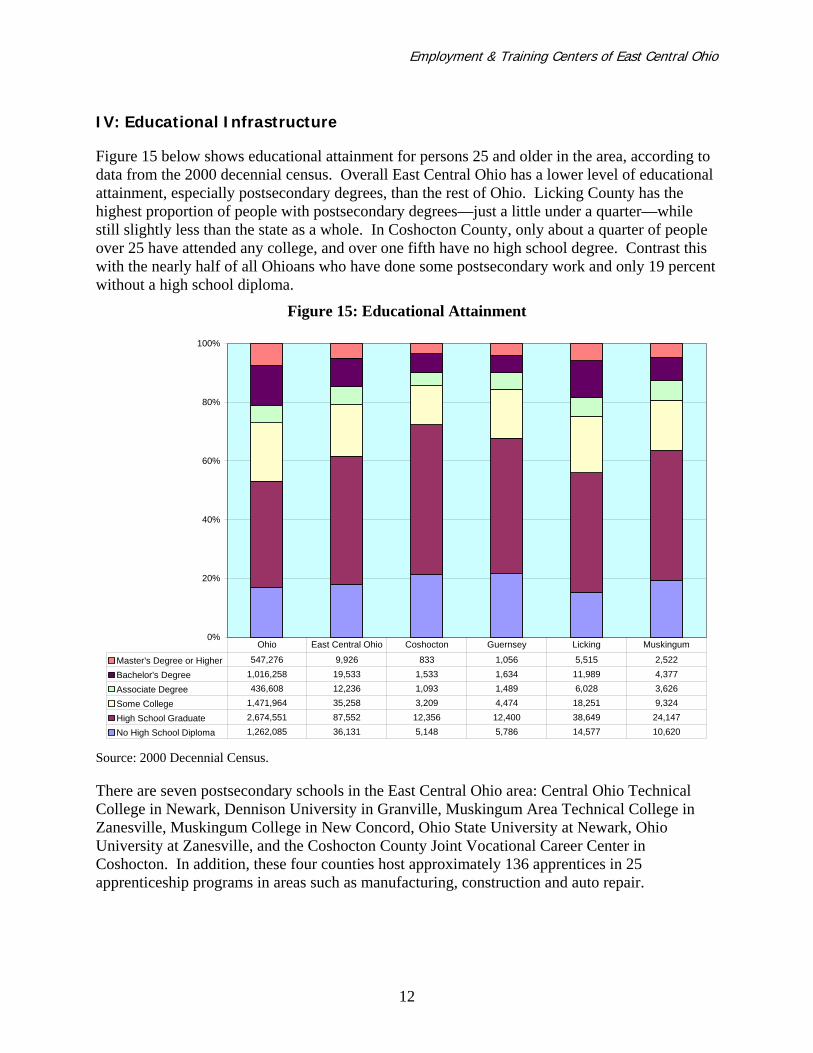
IV: Educational Infrastructure
Figure 15 below shows educational attainment for persons 25 and older in the area, according to data from the 2000 decennial census. Overall East Central Ohio has a lower level of educational attainment, especially postsecondary degrees, than the rest of Ohio. Licking County has the highest proportion of people with postsecondary degrees—just a little under a quarter—while still slightly less than the state as a whole. In Coshocton County, only about a quarter of people over 25 have attended any college, and over one fifth have no high school degree. Contrast this with the nearly half of all Ohioans who have done some postsecondary work and only 19 percent without a high school diploma.
Figure 15: Educational Attainment
0%
20%
40%
60%
80%
100%
Master's Degree or Higher 547,276 9,926 833 1,056 5,515 2,522
Bachelor's Degree 1,016,258 19,533 1,533 1,634 11,989 4,377
Associate Degree 436,608 12,236 1,093 1,489 6,028 3,626
Some College 1,471,964 35,258 3,209 4,474 18,251 9,324
High School Graduate 2,674,551 87,552 12,356 12,400 38,649 24,147
No High School Diploma 1,262,085 36,131 5,148 5,786 14,577 10,620
Ohio East Central Ohio Coshocton Guernsey Licking Muskingum
Source: 2000 Decennial Census.
There are seven postsecondary schools in the East Central Ohio area: Central Ohio Technical College in Newark, Dennison University in Granville, Muskingum Area Technical College in Zanesville, Muskingum College in New Concord, Ohio State University at Newark, Ohio University at Zanesville, and the Coshocton County Joint Vocational Career Center in Coshocton. In addition, these four counties host approximately 136 apprentices in 25 apprenticeship programs in areas such as manufacturing, construction and auto repair.

Employment & Training Centers of East Central Ohio
13
Technical Notes
Commuting data are from the 2000 Census of Population and Housing, “County-to-County Worker Flow Files.” Data is available at http://www.odod.state.oh.us/research/files/P0005.htm.
Population and demographic estimates were obtained from the U.S. Census Bureau. The figures are available online at http://www.census.gov/popest/estimates.php. Time series population estimates are for July 1 of each year
Employment data were obtained from the Quarterly Census of Employment and Wages (QCEW), Bureau of Labor Market Information, Ohio Department of Job and Family Services. The data are based on reports filed by employers subject to the Ohio Unemployment Compensation Law, as well as those covered under Unemployment Compensation for Federal Employees, by place of work. See the NAICS-based Economic Development Profiles at http://lmi.state.oh.us/CEP/CEP.htm or the data query menu for Employment and Wages by Industry at http://www.ohioworkforceinformer.org. Because data for some industry sectors in some counties have not been released due to confidentiality requirements, we were not able to report data for these sectors in the region. Total employment may include employment and wage data for non-classifiable establishments.
Unemployment statistics are produced by the Local Area Unemployment Statistics (LAUS) section, Bureau of Labor Market Information, Ohio Department of Job and Family Services. Data for One-Stop areas are available for query at http://www.ohioworkforceinformer.org or for other geographies at http://lmi.state.oh.us/ASP/LAUS/vbLaus.htm.
Per capita income figures are from the Bureau of Economic Analysis and are downloadable from http://www.bea.gov/bea/regional/reis.
Information on residential construction permits and their valuation are from the U.S. Census Bureau, “Construction Reports: Housing Authorized by Building Permits and Public Contracts.” Data are available online at http://www.census.gov/const/www/permitsindex.html.
Data on education were obtained from the Ohio Department of Development, Office of Strategic Research, based on information from the 2000 decennial census. Detailed information on each of Ohio’s counties is available at http://www.odod.state.oh.us/research/files/s0.htm. The Bureau of Labor Market Information also collects data on programs for the Integrated Postsecondary Educational Data System (IPEDS). These data are posted on the internet by the National Center for Education Statistics at http://nces.ed.gov/ipeds/cool.
The list of major employers in each county is available in the Ohio County Profiles produced by the Ohio Department of Development’s Office of Strategic Research at http://www.odod.state.oh.us/research/files/s0.htm.
For more information on Ohio workforce statistics, visit the Ohio Workforce Informer online at http://ohioworkforceinformer.org or the Ohio Labor Market Information Classic website at http://lmi.state.oh.us.
Employment & Training Centers of East Central Ohio
14
References
Appalachian Regional Commission. County Economic Status Designations in the Appalachian Region, Fiscal Year 2006. September 2005. Internet. http://www.arc.gov/index.do?nodeId=2934. 29 August 2006.
Goldstein, Harvey, University of North Carolina. Projecting State and Area Industry Employment. Prepared through a grant from the Employment and Training Administration, U.S. Department of Labor. Projections Workgroup, August 2005.
Ohio Department of Development. Office of Strategic Research. Commuting Patterns by County. March 2003. Internet. http://www.odod.state.oh.us/research/files/P0005.htm. 29 August 2006.
Ohio Department of Development. Office of Strategic Research. Ohio County Profiles. October 2005. Internet. http://www.odod.state.oh.us/research/files/s0.htm. 29 August 2006.
Ohio Department of Job and Family Services. Bureau of Labor Market Information. Demographic, Labor Force and Industry Trends. June 2002.
Ohio Department of Job and Family Services. Bureau of Labor Market Information. Market Analysis of Key Workforce Trends. 2000.
United States. Bureau of Economic Analysis. Local Area Personal Income. Internet. http://www.bea.gov/bea/regional/reis/. 29 August 2006.
United States. Bureau of Labor Statistics. Quarterly Census of Employment and Wages. June 2005.
United States. Census Bureau. Building Permits. Internet. http://www.census.gov/const/www/permitsindex.html. 29 August 2006.
United States. Census Bureau. Population Estimates. Internet. http://www.census.gov/popest/estimates/php. 29 August 2006.
United States. Census Bureau. Current Lists of Metropolitan and Micropolitan Statistical Areas and Definitions. 23 August 2006. Internet. http://www.census.gov/population/www/estimates/metrodef.html. 29 August 2006.
Employment & Training Centers of East Central Ohio
15
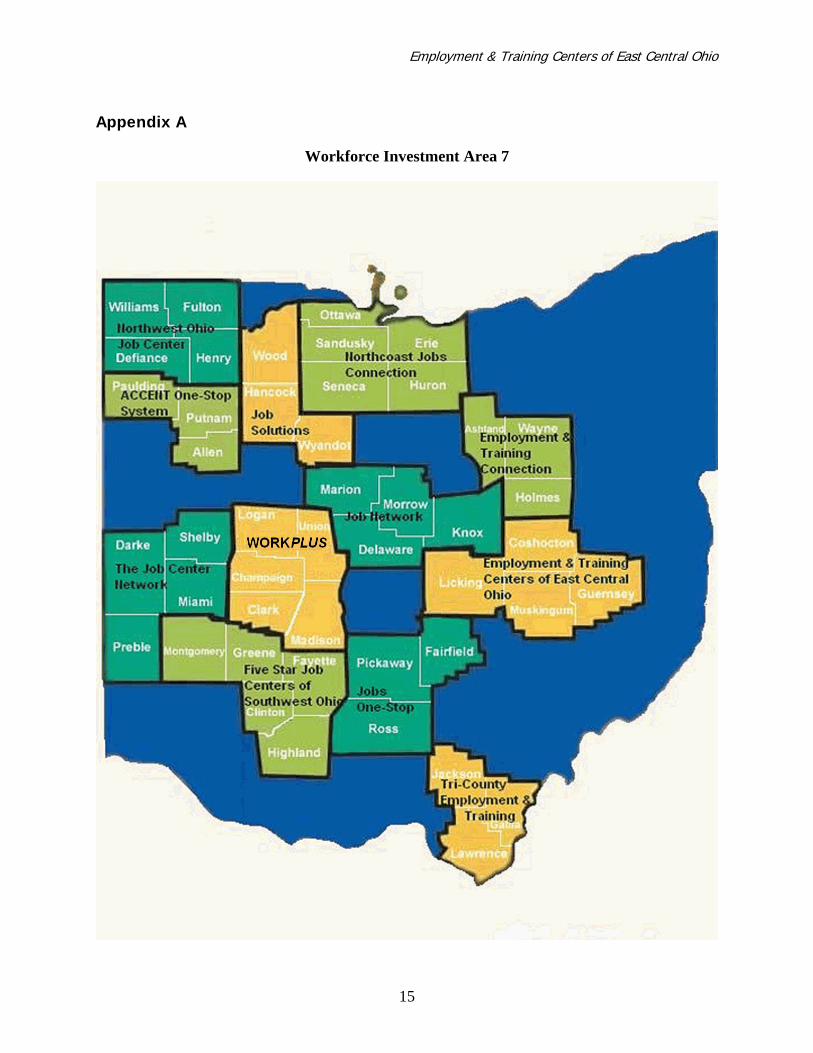
Appendix A
Workforce Investment Area 7
Employment & Training Centers of East Central Ohio
16
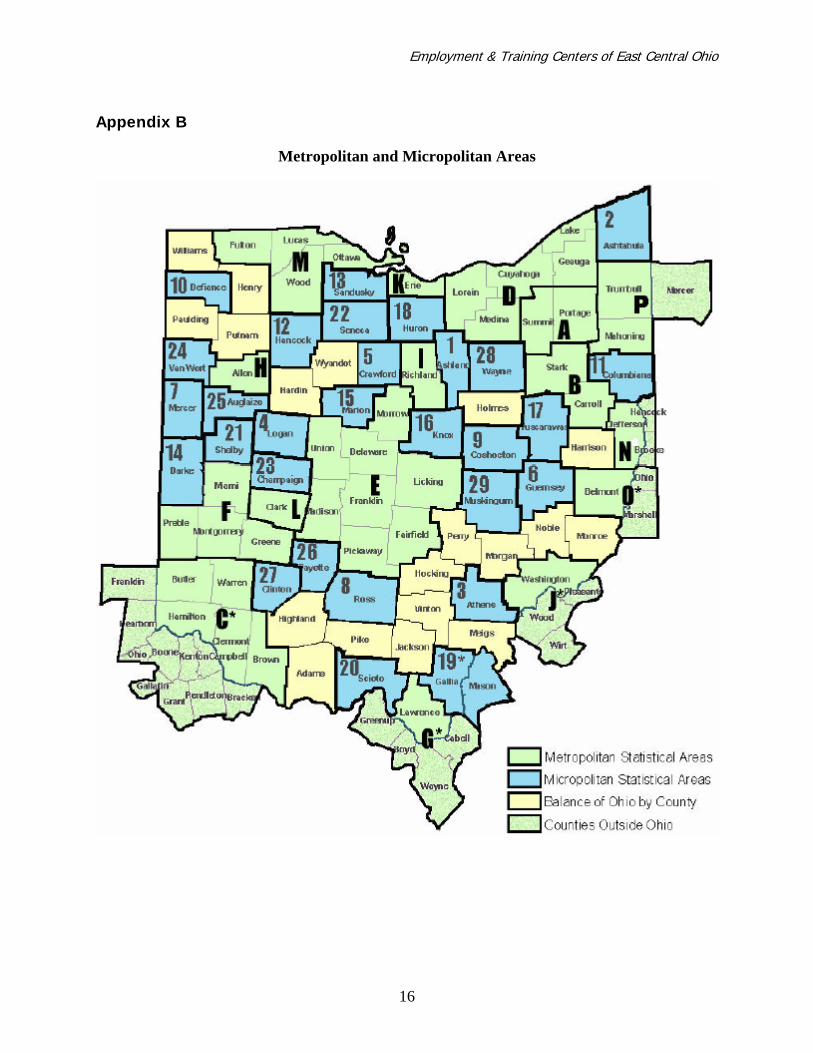
Appendix B
Metropolitan and Micropolitan Areas
Appendix B, continued Employment & Training Centers of East Central Ohio
17
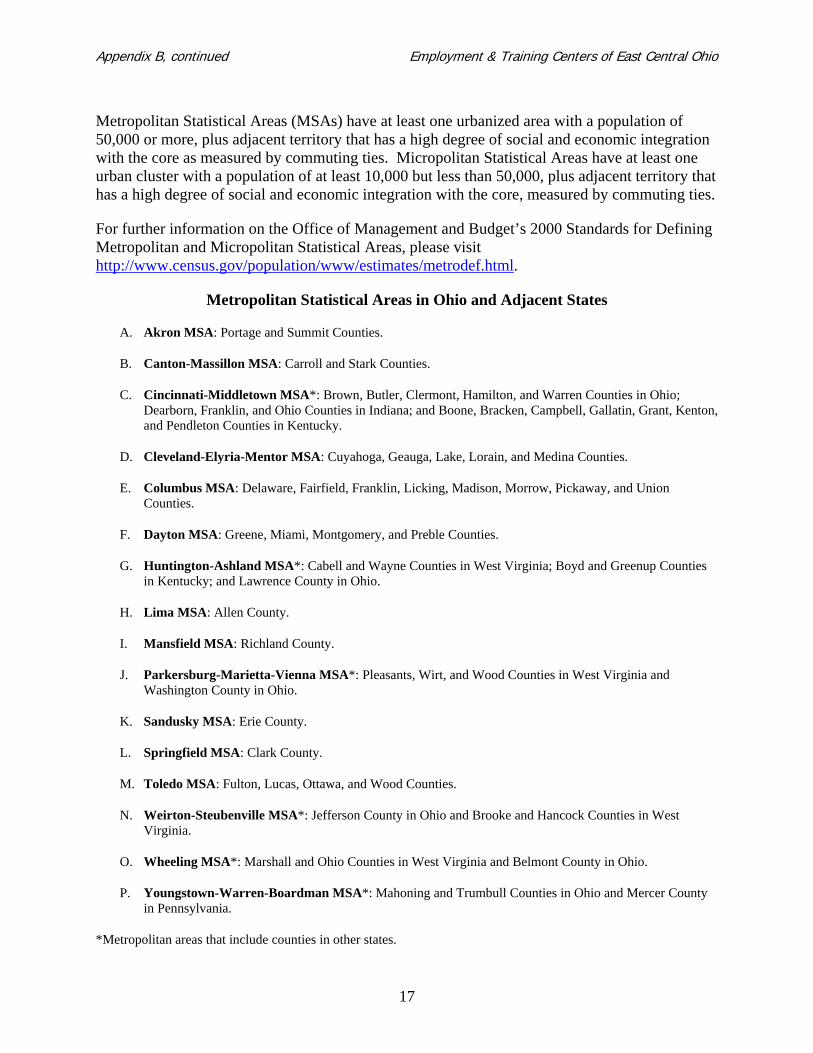
Metropolitan Statistical Areas (MSAs) have at least one urbanized area with a population of 50,000 or more, plus adjacent territory that has a high degree of social and economic integration with the core as measured by commuting ties. Micropolitan Statistical Areas have at least one urban cluster with a population of at least 10,000 but less than 50,000, plus adjacent territory that has a high degree of social and economic integration with the core, measured by commuting ties.
For further information on the Office of Management and Budget’s 2000 Standards for Defining Metropolitan and Micropolitan Statistical Areas, please visit http://www.census.gov/population/www/estimates/metrodef.html.
Metropolitan Statistical Areas in Ohio and Adjacent States
A. Akron MSA: Portage and Summit Counties.
B. Canton-Massillon MSA: Carroll and Stark Counties.
C. Cincinnati-Middletown MSA*: Brown, Butler, Clermont, Hamilton, and Warren Counties in Ohio; Dearborn, Franklin, and Ohio Counties in Indiana; and Boone, Bracken, Campbell, Gallatin, Grant, Kenton, and Pendleton Counties in Kentucky.
D. Cleveland-Elyria-Mentor MSA: Cuyahoga, Geauga, Lake, Lorain, and Medina Counties.
E. Columbus MSA: Delaware, Fairfield, Franklin, Licking, Madison, Morrow, Pickaway, and Union Counties.
F. Dayton MSA: Greene, Miami, Montgomery, and Preble Counties.
G. Huntington-Ashland MSA*: Cabell and Wayne Counties in West Virginia; Boyd and Greenup Counties in Kentucky; and Lawrence County in Ohio.
H. Lima MSA: Allen County.
I. Mansfield MSA: Richland County.
J. Parkersburg-Marietta-Vienna MSA*: Pleasants, Wirt, and Wood Counties in West Virginia and Washington County in Ohio.
K. Sandusky MSA: Erie County.
L. Springfield MSA: Clark County.
M. Toledo MSA: Fulton, Lucas, Ottawa, and Wood Counties.
N. Weirton-Steubenville MSA*: Jefferson County in Ohio and Brooke and Hancock Counties in West Virginia.
O. Wheeling MSA*: Marshall and Ohio Counties in West Virginia and Belmont County in Ohio.
P. Youngstown-Warren-Boardman MSA*: Mahoning and Trumbull Counties in Ohio and Mercer County in Pennsylvania.
*Metropolitan areas that include counties in other states.

Appendix B, continued Employment & Training Centers of East Central Ohio
18
Micropolitan Statistical Areas in Ohio
1. Ashland
2. Ashtabula
3. Athens
4. Bellefontaine: Logan County
5. Bucyrus: Crawford County
6. Cambridge: Guernsey County
7. Celina: Mercer County
8. Chillicothe: Ross County
9. Coshocton
10. Defiance
11. East Liverpool-Salem: Columbiana County
12. Findlay: Hancock County
13. Fremont: Sandusky County
14. Greenville: Darke County
15. Marion
16. Mount Vernon: Knox County
17. New Philadelphia-Dover: Tuscarawas County
18. Norwalk: Huron County
19. Point Pleasant*: Mason County in West Virginia and Gallia County in Ohio
20. Portsmouth: Scioto County
21. Sidney: Shelby County
22. Tiffin-Fostoria: Seneca County
23. Urbana: Champaign County
24. Van Wert
25. Wapakoneta: Auglaize County
26. Washington Court House: Fayette County
27. Wilmington: Clinton County
28. Wooster: Wayne County
29. Zanesville: Muskingum County
The micropolitan area name is the same as the county name unless otherwise noted. *Statistical areas in other states that include Ohio counties.

Employment & Training Centers of East Central Ohio
19
Appendix C
Major County-to-County Commuting Patterns
Percent of workers that work outside the county: 27.2% Average commute time in minutes: 22.4
Number of workers 16+ years of age Number of workers 16+ years of ageliving in Coshocton County: 16,585 working in Coshocton: 13,993Commute Out To Number Percent Commute In From Number PercentMuskingum County 1,393 8.4% Tuscarawas County 709 5.1%Tuscarawas County 780 4.7% Muskingum County 464 3.3%Holmes County 774 4.7% Guernsey County 210 1.5%Licking County 536 3.2% Licking County 92 0.7%Franklin County 271 1.6% Knox County 71 0.5%Wayne County 178 1.1% Holmes County 68 0.5%
Percent of workers that work outside the county: 26.4% Average commute time in minutes: 23.7
Number of workers 16+ years of age Number of workers 16+ years of ageliving in Guernsey County: 16,644 working in Guernsey County: 15,528Commute Out To Number Percent Commute In From Number PercentMuskingum County 1,815 10.9% Noble County 1,069 6.9%Noble County 438 2.6% Muskingum County 793 5.1%Franklin County 396 2.4% Belmont County 466 3.0%Belmont County 318 1.9% Tuscarawas County 153 1.0%Tuscarawas County 249 1.5% Coshocton County 94 0.6%Coshocton County 210 1.3% Monroe County 84 0.5%
Percent of workers that work outside the county: 40.4% Average commute time in minutes: 24.8
Number of workers 16+ years of age Number of workers 16+ years of ageliving in Licking County: 71,213 working in Licking County: 56,215Commute Out To Number Percent Commute In From Number PercentFranklin County 23,755 33.4% Franklin County 4,089 7.3%Muskingum County 1,100 1.5% Muskingum County 2,667 4.7%Fairfield County 915 1.3% Perry County 1,656 2.9%Delaware County 900 1.3% Fairfield County 1,563 2.8%Knox County 744 1.0% Knox County 1,304 2.3%
Percent of workers that work outside the county: 20.9% Average commute time in minutes: 24.2
Number of workers 16+ years of age Number of workers 16+ years of ageliving in Muskingum County: 37,774 working in Muskingum County: 37,875Commute Out To Number Percent Commute In From Number PercentLicking County 2,667 7.1% Guernsey County 1,815 4.8%Franklin County 2,078 5.5% Perry County 1,451 3.8%Guernsey County 793 2.1% Coshocton County 1,393 3.7%Perry County 570 1.5% Licking County 1,100 2.9%Coshocton County 464 1.2% Morgan County 707 1.9%
Coshocton
Guernsey
Licking
Muskingum
Source: Ohio Department of Development, Office of Strategic Research, 2000 Census Data.
Employment & Training Centers of East Central Ohio
20
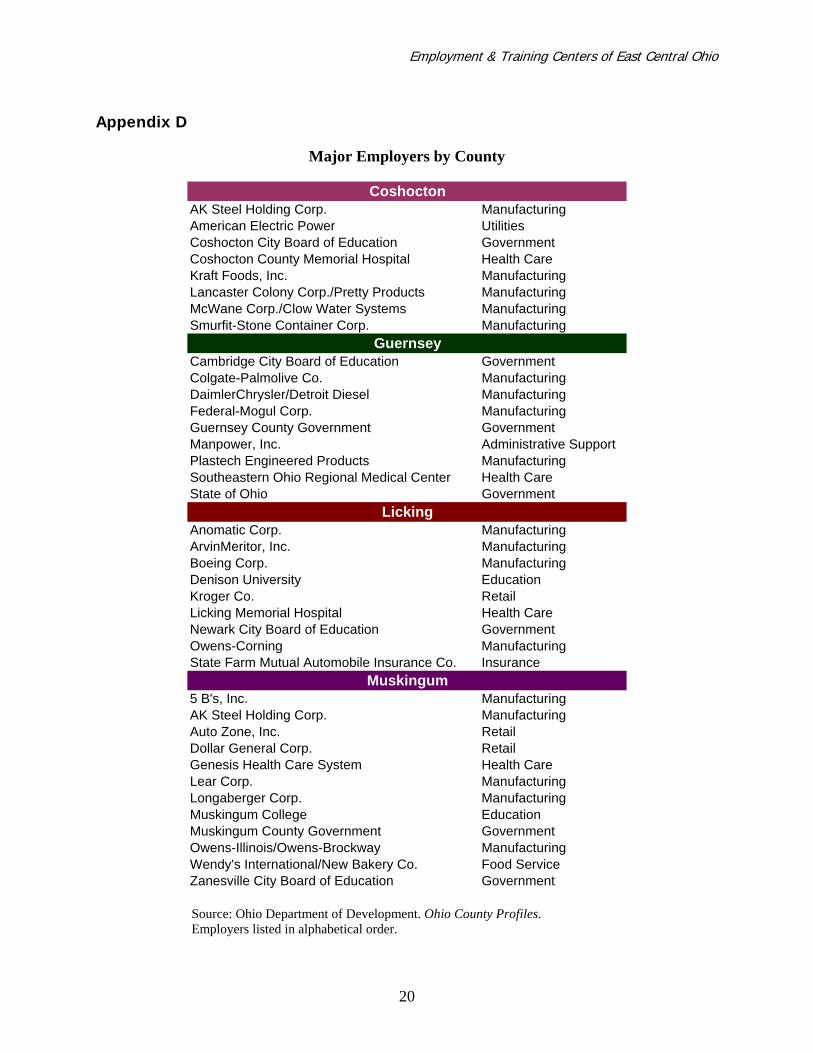
Appendix D
Major Employers by County
AK Steel Holding Corp. ManufacturingAmerican Electric Power UtilitiesCoshocton City Board of Education GovernmentCoshocton County Memorial Hospital Health CareKraft Foods, Inc. ManufacturingLancaster Colony Corp./Pretty Products ManufacturingMcWane Corp./Clow Water Systems ManufacturingSmurfit-Stone Container Corp. Manufacturing
Cambridge City Board of Education GovernmentColgate-Palmolive Co. ManufacturingDaimlerChrysler/Detroit Diesel ManufacturingFederal-Mogul Corp. ManufacturingGuernsey County Government GovernmentManpower, Inc. Administrative SupportPlastech Engineered Products ManufacturingSoutheastern Ohio Regional Medical Center Health CareState of Ohio Government
Anomatic Corp. ManufacturingArvinMeritor, Inc. ManufacturingBoeing Corp. ManufacturingDenison University EducationKroger Co. RetailLicking Memorial Hospital Health CareNewark City Board of Education GovernmentOwens-Corning ManufacturingState Farm Mutual Automobile Insurance Co. Insurance
5 B's, Inc. ManufacturingAK Steel Holding Corp. ManufacturingAuto Zone, Inc. RetailDollar General Corp. RetailGenesis Health Care System Health CareLear Corp. ManufacturingLongaberger Corp. ManufacturingMuskingum College EducationMuskingum County Government GovernmentOwens-Illinois/Owens-Brockway ManufacturingWendy's International/New Bakery Co. Food ServiceZanesville City Board of Education Government
Coshocton
Guernsey
Licking
Muskingum
Source: Ohio Department of Development. Ohio County Profiles. Employers listed in alphabetical order.
Ted Strickland, GovernorState of Ohio
Helen E. Jones-Kelley, DirectorOhio Department of Job and Family Services
Offi ce of Workforce DevelopmentBureau of Labor Market Information
ODJFS is an Equal Opportunity Employer and Service Provider(1/2007)
Offi ce of Workforce DevelopmentP.O. Box 1618Columbus, OH 43216-1618
Bureau of Labor Market Information Business Principles for Workforce Development
Partner with the workforce and economic development community.
Develop and deploy new information solution tools and systems for the workforce and economic development community.
Provide products and services that are customer and demand driven.
Be known as an important and reliable source for information solutions that support workforce development goals and outcomes.
Acknowledgements: The Workforce Research Section, under the direction of Labor Economist Larry Less, was responsible for the composition of this report. Labor Market Analyst Jonathan Calig was primarily responsible for production. Thanks are extended to the many other analysts who developed and reviewed the data presented in this report. This publication was prepared under the supervision of Labor Market Information Bureau Chief Keith Ewald and Assistant Bureau Chief Rudy Wilkinson.
This report was prepared by the Ohio Department of Job and Family Services, Offi ce of Workforce Development. For further information, visit our website at http://lmi.state.oh.us or contact the Ohio Bureau of Labor Market Information at 1-888-2WORK-411 or 1-888-296-7541.