Embed Size (px)
Citation preview
CHAPTER 8
FasteningsDouglas R. Rammer, Research General Engineer
8–1
Contents Nails 8–1 Withdrawal Resistance 8–2 Lateral Resistance 8–6Spikes 8–9Staples 8–9 Drift Bolts 8–10Wood Screws 8–10 Withdrawal Resistance 8–10 Lateral Resistance 8–11Lag Screws 8–12 Withdrawal Resistance 8–12 Lateral Resistance 8–13Bolts 8–14 Bearing Stress of Wood under Bolts 8–14 Loads at an Angle to the Grain 8–15 Steel Side Plates 8–15 Bolt Quality 8–15 Effect of Member Thickness 8–16 Two Member, Multiple Member Joints 8–16 Spacing, Edge, and End Distance 8–16 Effect of Bolt Holes 8–16 Pre-1991 Allowable Loads 8–17 Post-1991 Yield Model 8–17Connector Joints 8–19 Parallel-to-Grain Loading 8–19 Perpendicular-to-Grain Loading 8–20 Design Loads 8–20 Modifications 8–21 Net Section 8–23 End Distance and Spacing 8–23 Placement of Multiple Connectors 8–23 Cross Bolts 8–24 Multiple-Fastener Joints 8–24Metal Plate Connectors 8–25Joist Hangers 8–25Fastener Head Embedment 8–26Literature Cited 8–27Additional References 8–27
The strength and stability of any structure depend heav-ily on the fastenings that hold its parts together. One prime advantage of wood as a structural material is the ease with which wood structural parts can be joined together with a wide variety of fastenings—nails, spikes, screws, bolts, lag screws, drift pins, staples, and metal connectors of various types. For utmost rigidity, strength, and service, each type of fastening requires joint designs adapted to the strength prop-erties of wood along and across the grain and to dimensional changes that may occur with changes in moisture content.
Maximum lateral resistance and safe design load values for small-diameter (nails, spikes, and wood screws) and large-diameter dowel-type fasteners (bolts, lag screws, and drift pins) were based on an empirical method prior to 1991. Re-search conducted during the 1980s resulted in lateral resis-tance values that are currently based on a yield model theo-ry. This theoretical method was adapted for the 1991 edition of the National Design Specification for Wood Construction (NDS). Because literature and design procedures exist that are related to both the empirical and theoretical methods, we refer to the empirical method as pre-1991 and the theoretical method as post-1991 throughout this chapter. Withdrawal resistance methods have not changed, so the pre- and post-1991 refer only to lateral resistance.
The information in this chapter represents primarily Forest Products Laboratory research results. A more comprehen-sive discussion of fastenings is given in the American Soci-ety of Civil Engineers Manuals and Reports on Engineering Practice No. 84, Mechanical Connections in Wood Struc-tures. The research results of this chapter are often modified for structural safety, based on judgment or experience, and thus information presented in design documents may differ from information presented in this chapter. Additionally, research by others serves as a basis for some current design criteria. Allowable stress design and limit states design cri-teria are presented in the National Design Specification for Wood Construction published by the American Forest and Paper Association.
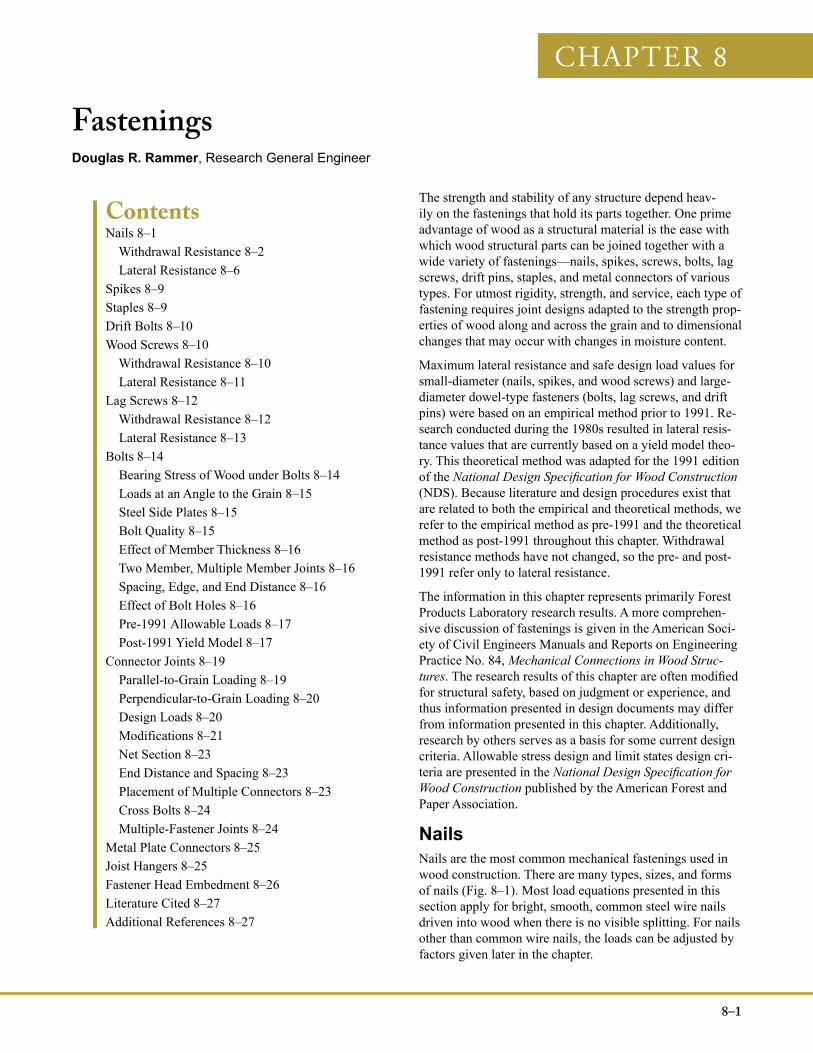
NailsNails are the most common mechanical fastenings used in wood construction. There are many types, sizes, and forms of nails (Fig. 8–1). Most load equations presented in this section apply for bright, smooth, common steel wire nails driven into wood when there is no visible splitting. For nails other than common wire nails, the loads can be adjusted by factors given later in the chapter.
8–2
General Technical Report FPL–GTR–190
Nails in use resist withdrawal loads, lateral loads, or a com-bination of the two. Both withdrawal and lateral resistance are affected by the wood, the nail, and the condition of use. In general, however, any variation in these factors has a more pronounced effect on withdrawal resistance than on lateral resistance. The serviceability of joints with nails lat-erally loaded does not depend greatly on withdrawal resis-tance unless large joint distortion is tolerable.
The diameters of various penny or gauge sizes of bright common nails are given in Table 8–1. The penny size desig-nation should be used cautiously. International nail produc-ers sometimes do not adhere to the dimensions of Table 8–1. Thus penny sizes, although still widely used, are obsolete. Specifying nail sizes by length and diameter dimensions is recommended. Bright box nails are generally of the same length but slightly smaller diameter (Table 8–2), whereas cement-coated nails such as coolers, sinkers, and coated box nails are slightly shorter (3.2 mm (1/8 in.)) and of smaller diameter than common nails of the same penny size. Heli-cally and annularly threaded nails generally have smaller diameters than common nails for the same penny size (Table 8–3).
Withdrawal ResistanceThe resistance of a nail shank to direct withdrawal from a piece of wood depends on the density of the wood, the di-ameter of the nail, and the depth of penetration. The surface condition of the nail at the time of driving also influences the initial withdrawal resistance.
For bright common wire nails driven into the side grain of seasoned wood or unseasoned wood that remains wet, the results of many tests have shown that the maximum with-drawal load is given by the empirical equation
(metric) (8–1a)
(inch–pound) (8–1b)
where p is maximum load (N, lb), L depth (mm, in.) of pen-etration of the nail in the member holding the nail point, G specific gravity of the wood based on ovendry weight and volume at 12% moisture content (see Chap. 5, Tables 5–2 to 5–5), and D diameter of the nail (mm, in.). (The NDS uses ovendry weight and volume as a basis.)
The loads expressed by Equation (8–1) represent average data. Certain wood species give test values that are somewhat greater or less than the equation values. A
Figure 8–1. Various types of nails: (left to right) bright smooth wire nail, cement coated, zinc-coated, annu-larly threaded, helically threaded, helically threaded and barbed, and barbed.
Table 8–1. Sizes of bright common wire nails
Size GaugeLength
(mm (in.)) Diameter (mm (in.))
6d 11-1/2 50.8 (2) 2.87 (0.113)8d 10-1/4 63.5 (2-1/2) 3.33 (0.131)10d 9 76.2 (3) 3.76 (0.148)12d 9 82.6 (3-1/4) 3.76 (0.148)16d 8 88.9 (3-1/2) 4.11 (0.162)20d 6 101.6 (4) 4.88 (0.192)30d 5 114.3 (4-1/2) 5.26 (0.207)40d 4 127.0 (5) 5.72 (0.225)50d 3 139.7 (5-1/2) 6.20 (0.244)60d 2 152.4 (6) 6.65 (0.262)
Table 8–2. Sizes of smooth box nails
Size GaugeLength
(mm (in.)) Diameter (mm (in.))
3d 14-1/2 31.8 (1-1/4) 1.93 (0.076)4d 14 38.1 (1-1/2) 2.03 (0.080)5d 14 44.5 (1-3/4) 2.03 (0.080)6d 12-1/2 50.8 (2) 2.49 (0.099)7d 12-1/2 57.2 (2-1/4) 2.49 (0.099)8d 11-1/2 63.5 (2-1/2) 2.87 (0.113)10d 10-1/2 76.2 (3) 3.25 (0.128)16d 10 88.9 (3-1/2) 3.43 (0.135)20d 9 101.6 (4) 3.76 (0.148)
Table 8–3. Sizes of helically and annularly threaded nails
Size Length
(mm (in.)) Diameter(mm (in.))
6d 50.8 (2) 3.05 (0.120)8d 63.5 (2-1/2) 3.05 (0.120)10d 76.2 (3) 3.43 (0.135)12d 82.6 (3-1/4) 3.43 (0.135)16d 88.9 (3-1/2) 3.76 (0.148)20d 101.6 (4) 4.50 (0.177)30d 114.3 (4-1/2) 4.50 (0.177)40d 127.0 (5) 4.50 (0.177)50d 139.7 (5-1/2) 4.50 (0.177)60d 152.4 (6) 4.50 (0.177)70d 177.8 (7) 5.26 (0.207)80d 203.2 (8) 5.26 (0.207)90d 228.6 (9) 5.26 (0.207)
8–3
Chapter 8 Fastenings
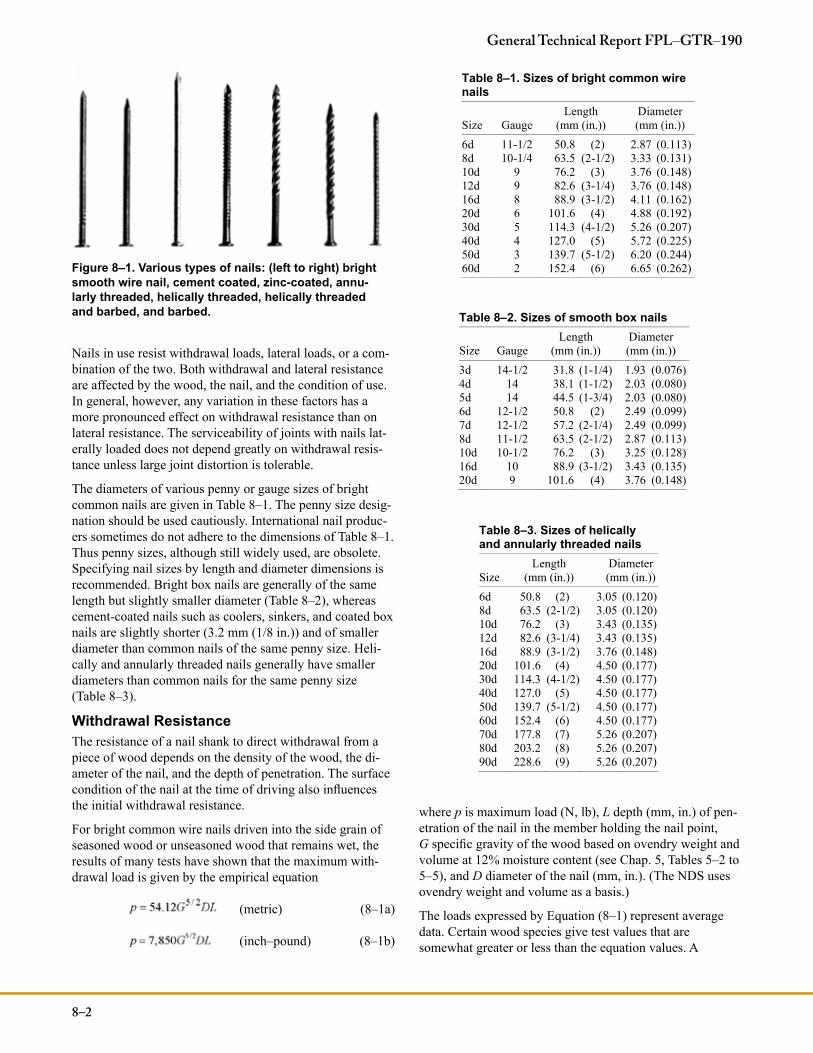
typical load–displacement curve for nail withdrawal (Fig. 8–2) shows that maximum load occurs at relatively small values of displacement.
Although the equation for nail-withdrawal resistance indi-cates that the dense, heavy woods offer greater resistance to nail withdrawal than do the lower density ones, lighter species should not be disqualified for uses requiring high resistance to withdrawal. As a rule, the less dense species do not split as readily as the denser ones, thus offering an opportunity for increasing the diameter, length, and number of the nails to compensate for the wood’s lower resistance to nail withdrawal.
The withdrawal resistance of nail shanks is greatly affected by such factors as type of nail point, type of shank, time the nail remains in the wood, surface coatings, and moisture content changes in the wood.
Effect of SeasoningWith practically all species, nails driven into green wood and pulled before any seasoning takes place offer about the same withdrawal resistance as nails driven into seasoned wood and pulled soon after driving. However, if common smooth-shank nails are driven into green wood that is al-lowed to season, or into seasoned wood that is subjected to cycles of wetting and drying before the nails are pulled, they lose a major part of their initial withdrawal resistance. The withdrawal resistance for nails driven into wood that is subjected to changes in moisture content may be as low as 25% of the values for nails tested soon after driving. On the other hand, if the wood fibers deteriorate or the nail cor-rodes under some conditions of moisture variation and time, withdrawal resistance is erratic; resistance may be regained or even increased over the immediate withdrawal resistance. However, such sustained performance should not be relied on in the design of a nailed joint.
In seasoned wood that is not subjected to appreciable mois-ture content changes, the withdrawal resistance of nails may also diminish due to relaxation of the wood fibers with time. Under all these conditions of use, the withdrawal resistance of nails differs among species and shows variation within individual species.
Effect of Nail FormThe surface condition of nails is frequently modified during the manufacturing process to improve withdrawal resis-tance. Such modification is usually done by surface coat-ing, surface roughening, or mechanical deformation of the shank. Other factors that affect the surface condition of the nail are the oil film remaining on the shank after manufac-ture or corrosion resulting from storage under adverse con-ditions; but these factors are so variable that their influence on withdrawal resistance cannot be adequately evaluated.
Surface Modifications—A common surface treatment for nails is the so-called cement coating. Cement coatings, contrary to what the name implies, do not include cement as an ingredient; they generally are a composition of resin applied to the nail to increase the resistance to withdrawal by increasing the friction between the nail and the wood. If properly applied, they increase the resistance of nails to withdrawal immediately after the nails are driven into the softer woods. However, in the denser woods (such as hard maple, birch, or oak), cement-coated nails have practically no advantage over plain nails, because most of the coat-ing is removed in driving. Some of the coating may also be removed in the side member before the nail penetrates the main member.
Good-quality cement coatings are uniform, not sticky to the touch, and cannot be rubbed off easily. Different techniques of applying the cement coating and variations in its ingre-dients may cause large differences in the relative resistance to withdrawal of different lots of cement-coated nails. Some nails may show only a slight initial advantage over plain nails. In the softer woods, the increase in withdrawal resis-tance of cement-coated nails is not permanent but drops off significantly after a month or so. Cement-coated nails are used primarily in construction of boxes, crates, and other containers usually built for rough handling and relatively short service.
Nails that have galvanized coatings, such as zinc, are in-tended primarily for uses where corrosion and staining resis-tance are important factors in permanence and appearance. If the zinc coating is evenly applied, withdrawal resistance may be increased, but extreme irregularities of the coating may actually reduce it. The advantage that uniformly coated galvanized nails may have over nongalvanized nails in re-sistance to initial withdrawal is usually reduced by repeated cycles of wetting and drying.
Nails have also been made with plastic coatings. The useful-ness and characteristics of these coatings are influenced by
Figure 8–2. Typical load–displacement curve for di-rect withdrawal of a nail.
8–4
General Technical Report FPL–GTR–190
the quality and type of coating, the effectiveness of the bond between the coating and base fastener, and the effectiveness of the bond between the coating and wood fibers. Some plastic coatings appear to resist corrosion or improve resis-tance to withdrawal, while others offer little improvement.
Fasteners with properly applied nylon coating tend to retain their initial resistance to withdrawal compared with other coatings, which exhibit a marked decrease in withdrawal resistance within the first month after driving.
A chemically etched nail has somewhat greater withdrawal resistance than some coated nails, as the minutely pitted surface is an integral part of the nail shank. Under impact loading, however, the withdrawal resistance of etched nails is little different from that of plain or cement-coated nails under various moisture conditions.
Sand-blasted nails perform in much the same manner as chemically etched nails.
Shape Modifications—Nail shanks may be varied from a smooth, circular form to give an increase in surface area without an increase in nail weight. Special nails with barbed, helically or annularly threaded, and other irregular shanks (Fig. 8–1) are commercially available.
The form and magnitude of the deformations along the shank influence the performance of the nails in various wood species. In wood remaining at a uniform moisture content, the withdrawal resistance of these nails is gener-ally somewhat greater than that of common wire nails of the same diameter. From tests in which nails were driven in the side grain of seasoned wood, bright annularly threaded nails, with shank-to-thread-crest diameter difference greater than 0.2 mm (0.008 in.) and thread spacing between 1.27 mm (0.05 in.) and 1.96 mm (0.077 in.), the immediate maxi-mum withdrawal load is given by the empirical equation
(metric) (8–2a)
(inch–pound) (8–2b)
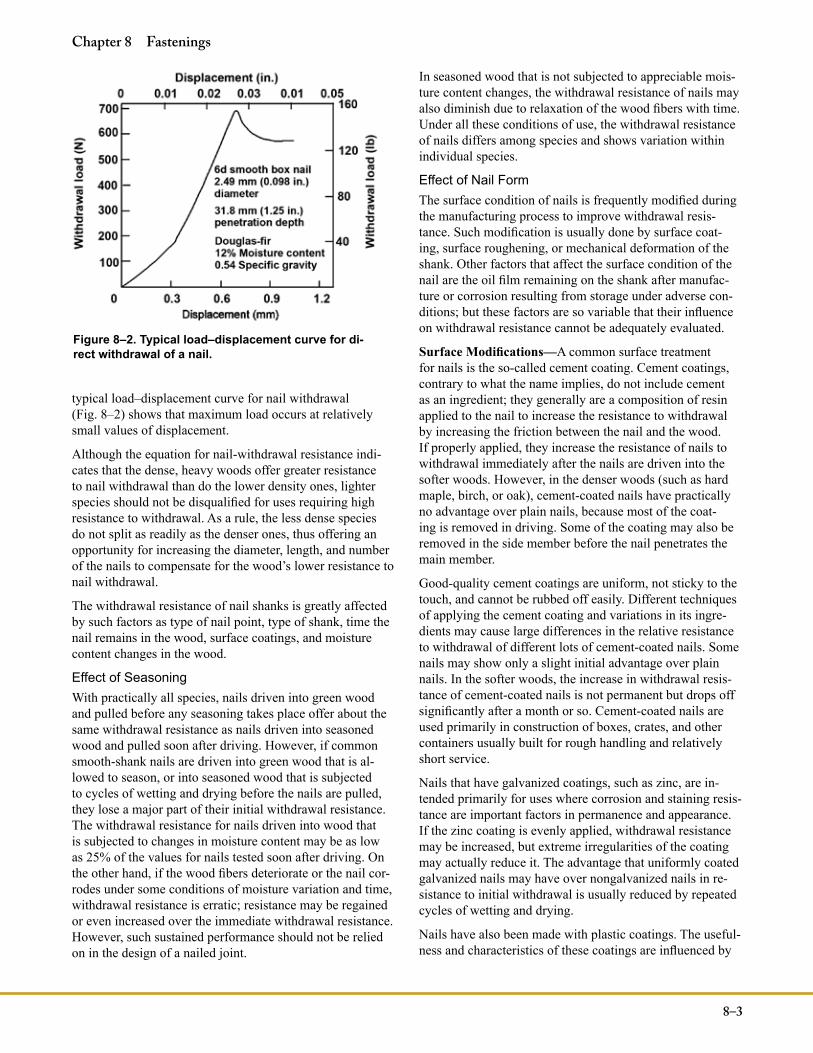
where p is maximum load (N, lb), L depth (mm, in.) of pen-etration of the nail in the member holding the nail point, G specific gravity of the wood based on ovendry weight and volume and oven dry moisture content (see Chap. 5, Tables 5–2 to 5–5), and D shank diameter of the nail (mm, in.). The expression is valid only for the threaded portion of the nail. Comparison of Equations (8–1) and (8–2) indicates that the bright annularly threaded nail can have withdrawal resistances that are double the values of common nails. For galvanized annularly threaded nails, the immediate with-drawal strength is slightly lower. However, under conditions involving changes in moisture content of the wood, some special nail forms provide considerably greater withdrawal resistance than the common wire nail—about four times greater for annularly and helically threaded nails of the same diameter. This is especially true of nails driven into green
wood that subsequently dries. In general, annularly threaded nails sustain larger withdrawal loads, and helically threaded nails sustain greater impact withdrawal work values than do the other nail forms (Fig. 8–3).
Nails with deformed shanks are sometimes hardened by heat treatments for use where driving conditions are difficult or to obtain improved performance, such as in pallet assembly. Hardened nails are brittle and care should be exercised to avoid injuries from fragments of nails broken during driving.
Nail Point—A smooth, round shank nail with a long, sharp point will usually have a greater withdrawal resistance, particularly in the softer woods, than the common wire nail (which usually has a diamond point). However, sharp points accentuate splitting in certain species, which may reduce withdrawal resistance. A blunt or flat point without taper reduces splitting, but its destruction of the wood fibers when driven reduces withdrawal resistance to less than that of the common wire nail. A nail tapered at the end and terminating in a blunt point will cause less splitting. In heavier woods, such a tapered, blunt-pointed nail will provide about the same withdrawal resistance, but in less dense woods, its re-sistance to withdrawal is less than that of the common nail.
Nail Head—Nail head classifications include flat, oval, countersunk, deep-countersunk, and brad. Nails with all types of heads, except the deep-countersunk, brad, and some of the thin flathead nails, are sufficiently strong to withstand the force required to pull them from most woods in direct withdrawal. One exception to this statement is for annularly threaded nails. Due to the increased withdrawal capacity for these type nails, nail head can be pulled into or through wood members. The deep-countersunk and brad nails are usually driven below the wood surface and are not intended to carry large withdrawal loads. In general, the thickness
Figure 8–3. Typical load–displacement curves de-formed and smooth shank for direct withdrawal of a nail.
8–5
Chapter 8 Fastenings
and diameter of the heads of the common wire nails increase as the size of the nail increases.
The development of some pneumatically operated portable nailers has introduced nails with specially configured heads, such as T-nails and nails with a segment of the head cut off.
Corrosion and StainingIn the presence of moisture, metals used for nails may cor-rode when in contact with wood treated with certain preser-vative or fire-retardant treatments (Chaps. 15 and 18). Use of certain metals or metal alloys will reduce the amount of corrosion. Nails of copper, silicon bronze, and 300 series stainless steels have performed well in wood treated with ammoniacal copper arsenate and chromated copper arsenate. Similarly, 300 series stainless steel nails have performed well in wood treated with copper azole and alkaline copper quaternary. The choice of metals for use with fire-retardant-treated woods depends upon the particular fire-retardant chemical.
With the greater use of metal connecters, such as joist hang-ers, in outdoor environments, an additional corrosion con-cern is possible. Both the joist hanger and fastener should be of the same metal type; if not, the corrosion rate of either the fastener or hanger may increase due to galvanic (mixed metal) corrosion between the hanger and fastener.
Organic coated fasteners, such as polymer coatings, resist corrosion on the principle of isolation. Any damage that oc-curs to the coating during insertion can give the corrosive environment a path to the substrate, and pitting or crevice corrosion will occur at these sites.
Staining caused by the reaction of certain wood extractives (Chap. 3) and steel in the presence of moisture is a problem if appearance is important, such as with naturally finished siding. Use of stainless steel, aluminum, or hot-dipped gal-vanized nails can alleviate staining.
In general, the withdrawal resistance of copper, other alloy, and polymer-coated nails is comparable with that of com-mon steel wire nails when pulled soon after driving.
DrivingThe resistance of nails to withdrawal is generally greatest when they are driven perpendicular to the grain of the wood. When a bright nail is driven parallel to the wood fibers (that is, into the end of the piece) withdrawal resistance in wood ranges between 50% to 75% of the resistance obtained when the nail is driven perpendicular to the grain. The ratio be-tween the immediate end- and side-grain withdrawal loads is nearly constant for all specific gravities. In contrast to the immediate withdrawal case, nails pulled after a time interval or after moisture content changes experience a decreased load in both side and end grain. For most species the de-crease in the side grain withdrawal load is greater than in the end grain; therefore the resulting end- to side-grain ratio is larger.
Toe nailing, a common method of joining wood framework, involves slant driving a nail or group of nails through the end or edge of an attached member and into a main member. Toe nailing requires greater skill in assembly than does ordi-nary end nailing but provides joints of greater strength and stability. Tests show that the maximum strength of toenailed joints under lateral and uplift loads is obtained by (a) using the largest nail that will not cause excessive splitting, (b) allowing an end distance (distance from the end of the attached member to the point of initial nail entry) of approx-imately one-third the length of the nail, (c) driving the nail at a slope of 30° with the attached member, and (d) burying the full shank of the nail but avoiding excessive mutilation of the wood from hammer blows.
The results of withdrawal tests with multiple nail joints in which the piece attached is pulled directly away from the main member show that slant driving is usually superior to straight driving when nails are driven into dry wood and pulled immediately, and decidedly superior when nails are driven into green or partially dry wood that is allowed to season for a month or more. However, the loss in depth of penetration due to slant driving may, in some types of joints, offset the advantages of slant nailing. Cross slant driving of groups of nails through the side grain is usually somewhat more effective than parallel-slant driving through the end grain.
Nails driven into lead holes with a diameter slightly smaller (approximately 90%) than the nail shank have somewhat greater withdrawal resistance than nails driven without lead holes. Lead holes also prevent or reduce splitting of the wood, particularly for dense species.
ClinchingThe withdrawal resistance of smooth-shank, clinched nails is considerably greater than that of unclinched nails. The point of a clinched nail is bent over where the nail protrudes through the side member. The ratio between the loads for clinched and unclinched nails varies enormously, depending upon the moisture content of the wood when the nail is driv-en and withdrawn, the species of wood, the size of nail, and the direction of clinch with respect to the grain of the wood.
In dry or green wood, a clinched nail provides 45% to 170% more withdrawal resistance than an unclinched nail when withdrawn soon after driving. In green wood that seasons after a nail is driven, a clinched nail gives 250% to 460% greater withdrawal resistance than an unclinched nail. How-ever, this improved strength of a clinched-nail joint does not justify the use of green lumber, because the joints may loos-en as the lumber seasons. Furthermore, laboratory tests were made with single nails, and the effects of drying, such as warping, twisting, and splitting, may reduce the efficiency of a joint that has more than one nail. Clinching of nails is generally confined to such construction as boxes and crates and other container applications.
Nails clinched across the grain have approximately 20% more resistance to withdrawal than nails clinched along the grain.
Fastening of PlywoodThe nailing characteristics of plywood are not greatly differ-ent from those of solid wood except for plywood’s greater resistance to splitting when nails are driven near an edge. The nail withdrawal resistance of plywood is 15% to 30% less than that of solid wood of the same thickness. The rea-son is that fiber distortion is less uniform in plywood than in solid wood. For plywood less than 12.5 mm (1/2 in.) thick, the greater splitting resistance tends to offset the lower withdrawal resistance compared with solid wood. The with-drawal resistance per unit length of penetration decreases as the number of plies per unit length increases. The direction of the grain of the face ply has little influence on the with-drawal resistance from the face near the end or edge of a piece of plywood. The direction of the grain of the face ply may influence the pull-through resistance of staples or nails with severely modified heads, such as T-heads. Fastener design information for plywood is available from APA– The Engineered Wood Association.
Allowable LoadsThe preceding discussion dealt with maximum withdrawal loads obtained in short-time test conditions. For design, these loads must be reduced to account for variability, duration-of-load effects, and safety. A value of one-sixth the average maximum load has usually been accepted as the allowable load for long-time loading conditions. For normal duration of load, this value may be increased by 10%. Nor-mal duration of load is defined as a load of 10-year duration.
Lateral ResistancePre-1991Test loads at joint slips of 0.38 mm (0.015 in.) (approximate proportional limit load) for bright common wire nails in lateral resistance driven into the side grain (perpendicular to the wood fibers) of seasoned wood are expressed by the empirical equation
p = KD 3/ 2 (8–2)
where p is lateral load per nail, K a coefficient, and D diameter of the nail. Values of coefficient K are listed in Table 8–4 for ranges of specific gravity of hardwoods and softwoods. The loads given by the equation apply only where the side member and the member holding the nail point are of approximately the same density. The thickness of the side member should be about one-half the depth of penetration of the nail in the member holding the point.
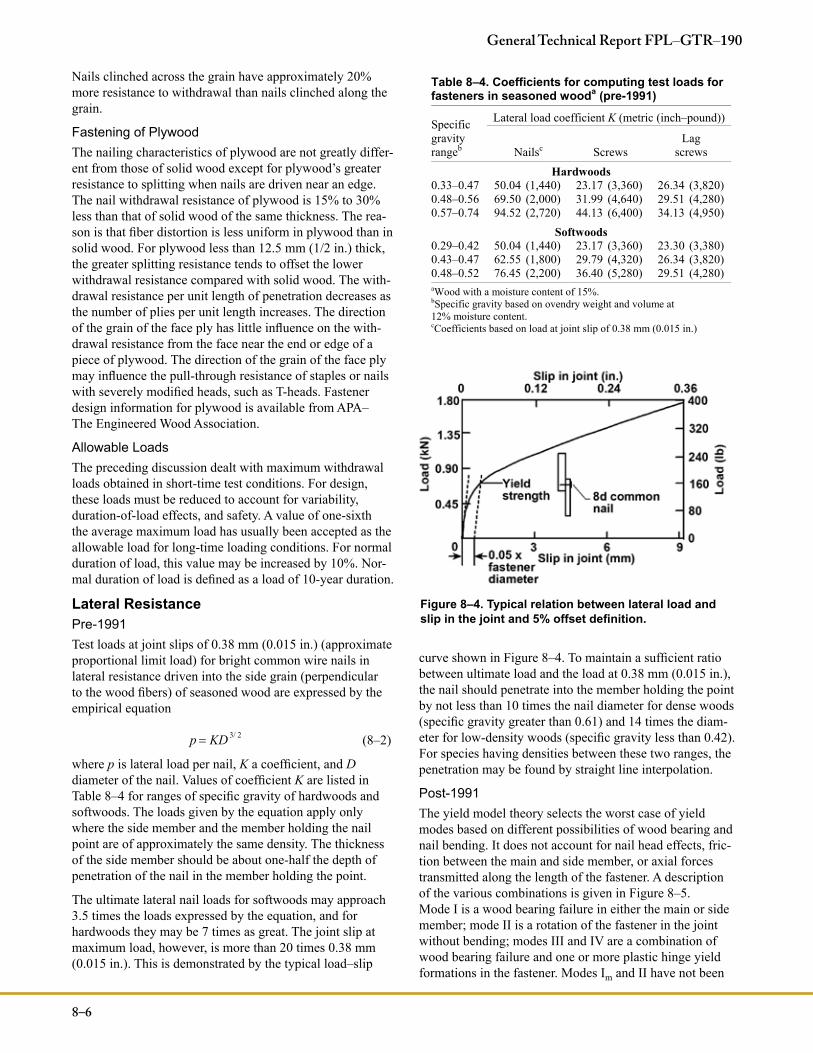
The ultimate lateral nail loads for softwoods may approach 3.5 times the loads expressed by the equation, and for hardwoods they may be 7 times as great. The joint slip at maximum load, however, is more than 20 times 0.38 mm (0.015 in.). This is demonstrated by the typical load–slip
curve shown in Figure 8–4. To maintain a sufficient ratio between ultimate load and the load at 0.38 mm (0.015 in.), the nail should penetrate into the member holding the point by not less than 10 times the nail diameter for dense woods (specific gravity greater than 0.61) and 14 times the diam-eter for low-density woods (specific gravity less than 0.42). For species having densities between these two ranges, the penetration may be found by straight line interpolation.
Post-1991The yield model theory selects the worst case of yield modes based on different possibilities of wood bearing and nail bending. It does not account for nail head effects, fric-tion between the main and side member, or axial forces transmitted along the length of the fastener. A description of the various combinations is given in Figure 8–5. Mode I is a wood bearing failure in either the main or side member; mode II is a rotation of the fastener in the joint without bending; modes III and IV are a combination of wood bearing failure and one or more plastic hinge yield formations in the fastener. Modes Im and II have not been
8–6
General Technical Report FPL–GTR–190
Table 8–4. Coefficients for computing test loads for fasteners in seasoned wooda (pre-1991)
Specific gravityrangeb
Lateral load coefficient K (metric (inch–pound))
Nailsc Screws Lag
screws Hardwoods
0.33–0.47 50.04 (1,440) 23.17 (3,360) 26.34 (3,820) 0.48–0.56 69.50 (2,000) 31.99 (4,640) 29.51 (4,280) 0.57–0.74 94.52 (2,720) 44.13 (6,400) 34.13 (4,950)
Softwoods 0.29–0.42 50.04 (1,440) 23.17 (3,360) 23.30 (3,380) 0.43–0.47 62.55 (1,800) 29.79 (4,320) 26.34 (3,820) 0.48–0.52 76.45 (2,200) 36.40 (5,280) 29.51 (4,280) aWood with a moisture content of 15%. bSpecific gravity based on ovendry weight and volume at 12% moisture content. cCoefficients based on load at joint slip of 0.38 mm (0.015 in.)
Figure 8–4. Typical relation between lateral load and slip in the joint and 5% offset definition.
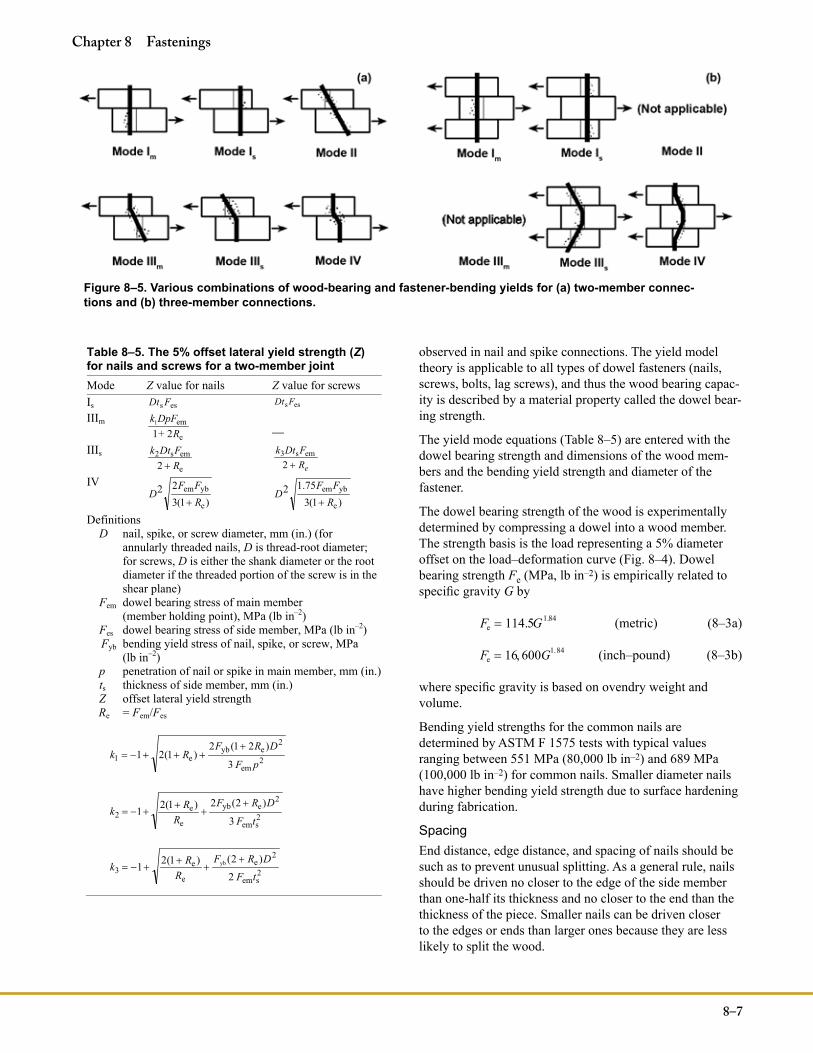
observed in nail and spike connections. The yield model theory is applicable to all types of dowel fasteners (nails, screws, bolts, lag screws), and thus the wood bearing capac-ity is described by a material property called the dowel bear-ing strength.
The yield mode equations (Table 8–5) are entered with the dowel bearing strength and dimensions of the wood mem-bers and the bending yield strength and diameter of the fastener.
The dowel bearing strength of the wood is experimentally determined by compressing a dowel into a wood member. The strength basis is the load representing a 5% diameter offset on the load–deformation curve (Fig. 8–4). Dowel bearing strength Fe (MPa, lb in–2) is empirically related to specific gravity G by
Fe = 114.5G1.84 (metric) (8–3a)
Fe = 16, 600G1.84 (inch–pound) (8–3b)
where specific gravity is based on ovendry weight and volume.
Bending yield strengths for the common nails are determined by ASTM F 1575 tests with typical values ranging between 551 MPa (80,000 lb in–2) and 689 MPa (100,000 lb in–2) for common nails. Smaller diameter nails have higher bending yield strength due to surface hardening during fabrication.
SpacingEnd distance, edge distance, and spacing of nails should be such as to prevent unusual splitting. As a general rule, nails should be driven no closer to the edge of the side member than one-half its thickness and no closer to the end than the thickness of the piece. Smaller nails can be driven closer to the edges or ends than larger ones because they are less likely to split the wood.
8–7
Chapter 8 Fastenings
Figure 8–5. Various combinations of wood-bearing and fastener-bending yields for (a) two-member connec-tions and (b) three-member connections.
Table 8–5. The 5% offset lateral yield strength (Z)for nails and screws for a two-member jointMode Z value for nails Z value for screws Is ess FDt essFDt
IIIm
21 e
em1
R+DpFk
—IIIs
e
ems22 R
FDtk eR
FDtk2
ems3
IV
)1(322
e
ybem
RFF
D )1(3
75.12e
ybem
RFF
D
DefinitionsD nail, spike, or screw diameter, mm (in.) (for annularly threaded nails, D is thread-root diameter; for screws, D is either the shank diameter or the root diameter if the threaded portion of the screw is in the shear plane) Fem dowel bearing stress of main member (member holding point), MPa (lb in–2)Fes dowel bearing stress of side member, MPa (lb in–2)Fyb bending yield stress of nail, spike, or screw, MPa (lb in–2)p penetration of nail or spike in main member, mm (in.)ts thickness of side member, mm (in.) Z offset lateral yield strength Re = Fem/Fes
2
em
2eyb
e13
)21(2)1(21
pF
DRFRk
2sem
2eyb
e
e2
3
)2(2)1(21tF
DRFR
Rk
2sem
2e
e
e3
2
)2()1(21 yb
tF
DRFR
Rk
Grain Direction EffectsThe lateral load for side-grain nailing applies whether the load is in a direction parallel to the grain of the pieces joined or at right angles to it. When nails are driven into the end grain (parallel with the wood fibers), limited data on softwood species indicate that their maximum resistance to lateral displacement is about two-thirds that for nails driven into the side grain. Although the average proportional limit loads appear to be about the same for end- and side-grain nailing, the individual results are more erratic for end-grain nailing, and the minimum loads approach only 75% of cor-responding values for side-grain nailing.
Moisture Content EffectsNails driven into the side grain of unseasoned wood give maximum lateral resistance loads approximately equal to those obtained in seasoned wood, but the lateral resistance loads at 0.38 mm (0.015 in.) joint slip are somewhat less. To prevent excessive deformation, lateral loads obtained for seasoned wood should be reduced by 25% for unseasoned wood that will remain wet or be loaded before seasoning takes place.
When nails are driven into green wood, their lateral propor-tional limit loads after the wood has seasoned are also less than when they are driven into seasoned wood and loaded. The erratic behavior of a nailed joint that has undergone one or more moisture content changes makes it difficult to estab-lish a lateral load for a nailed joint under these conditions. Structural joints should be inspected at intervals, and if it is apparent that the joint has loosened during drying, the joint should be reinforced with additional nails.
Deformed-Shank NailsDeformed-shank nails carry somewhat higher maximum lateral loads than do the same pennyweight common wire nails, but both perform similarly at small distortions in the joint. It should be noted that the same pennyweight deformed-shank nail has a different diameter than that of the common wire nail. These nails often have higher bending yield strength than common wire nails, resulting in higher lateral strength in modes III and IV.
Lateral Load–Slip ModelsA considerable amount of work has been done to describe, by mathematical models, the lateral load–slip curve of nails. These models have become important because of their need as input parameters for advanced methods of structural analysis.
One theoretical model, which considers the nail to be a beam supported on an elastic foundation (the wood), describes the initial slope of the curve:
(8–4)
where P is the lateral load and d is the joint slip. The fac-tors L1, L2, J1, J2, K1, and K2 (Table 8–6) are combinations of hyperbolic and trigonometric functions of the quantities l1a and l2b in which a and b are the depth of penetration of the nail in members 1 and 2, respectively. For smooth round nails,
(8–5)
where k0 is elastic bearing constant, D nail diameter, and E modulus of elasticity of the nail. For seasoned wood, the elastic bearing constant k0 (N mm–3, lb in–3) has been shown to be related to average species specific gravity G if no lead hole is used by
k0 = 582G (metric) (8–6a)
k0 = 2,144, 000G (inch–pound) (8–6b)
If a prebored lead hole equal to 90% of the nail diameter is used,
k0 = 869G (metric) (8–7a)
k0 = 3, 200, 000G (inch–pound) (8–7b)
Other empirically derived models attempt to describe the entire load–slip curve. Two such expressions are
P = A log10 (1+ Bd) (8–8a)
8–8
General Technical Report FPL–GTR–190
Table 8–6. Expressions for factors in Equation (8–4)Factor Expressiona
bbbb+bb
kK
aaaa+aa
kK
bbb+b
kJ
aaa+a
kJ
bbbbbb
kL
aaaaaa
kL
22
22
2222
2
32
2
12
12
1111
1
31
1
22
22
22
22
2
22
2
12
12
12
12
1
21
1
22
22
2222
2
22
12
12
1111
1
11
sinsinh
cossincoshsinh
sinsinh
cossincoshsinh
sinsinh
sinsinh
sinsinh
sinsinh
sinsinh
cossincoshsinhsinsinh
cossincoshsinh
a k1 = k01d and k2 = k02d, where k1 and k2 are the foundation moduli of members 1 and 2, respectively.
where the parameters A and B are empirically fitted, and a second model, which includes a load reducing behavior,
(8–8b)
where the parameters K0, r1, r2, and P0 are empirically deter-mined; ud is deformation at ultimate load, and Fd is defor-mation at failure.
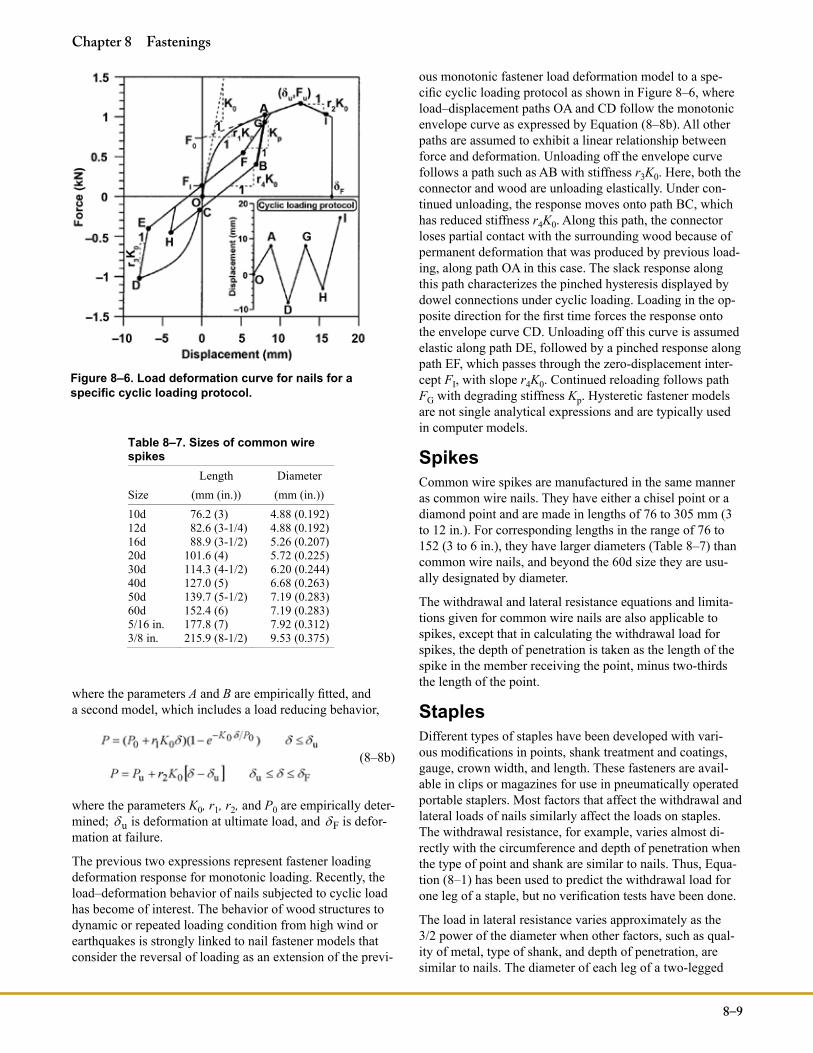
The previous two expressions represent fastener loading deformation response for monotonic loading. Recently, the load–deformation behavior of nails subjected to cyclic load has become of interest. The behavior of wood structures to dynamic or repeated loading condition from high wind or earthquakes is strongly linked to nail fastener models that consider the reversal of loading as an extension of the previ-
ous monotonic fastener load deformation model to a spe-cific cyclic loading protocol as shown in Figure 8–6, where load–displacement paths OA and CD follow the monotonic envelope curve as expressed by Equation (8–8b). All other paths are assumed to exhibit a linear relationship between force and deformation. Unloading off the envelope curve follows a path such as AB with stiffness r3K0. Here, both the connector and wood are unloading elastically. Under con-tinued unloading, the response moves onto path BC, which has reduced stiffness r4K0. Along this path, the connector loses partial contact with the surrounding wood because of permanent deformation that was produced by previous load-ing, along path OA in this case. The slack response along this path characterizes the pinched hysteresis displayed by dowel connections under cyclic loading. Loading in the op-posite direction for the first time forces the response onto the envelope curve CD. Unloading off this curve is assumed elastic along path DE, followed by a pinched response along path EF, which passes through the zero-displacement inter-cept FI, with slope r4K0. Continued reloading follows path FG with degrading stiffness Kp. Hysteretic fastener models are not single analytical expressions and are typically used in computer models.
SpikesCommon wire spikes are manufactured in the same manner as common wire nails. They have either a chisel point or a diamond point and are made in lengths of 76 to 305 mm (3 to 12 in.). For corresponding lengths in the range of 76 to 152 (3 to 6 in.), they have larger diameters (Table 8–7) than common wire nails, and beyond the 60d size they are usu-ally designated by diameter.
The withdrawal and lateral resistance equations and limita-tions given for common wire nails are also applicable to spikes, except that in calculating the withdrawal load for spikes, the depth of penetration is taken as the length of the spike in the member receiving the point, minus two-thirds the length of the point.
StaplesDifferent types of staples have been developed with vari-ous modifications in points, shank treatment and coatings, gauge, crown width, and length. These fasteners are avail-able in clips or magazines for use in pneumatically operated portable staplers. Most factors that affect the withdrawal and lateral loads of nails similarly affect the loads on staples. The withdrawal resistance, for example, varies almost di-rectly with the circumference and depth of penetration when the type of point and shank are similar to nails. Thus, Equa-tion (8–1) has been used to predict the withdrawal load for one leg of a staple, but no verification tests have been done.
The load in lateral resistance varies approximately as the 3/2 power of the diameter when other factors, such as qual-ity of metal, type of shank, and depth of penetration, are similar to nails. The diameter of each leg of a two-legged
8–9
Chapter 8 Fastenings
Figure 8–6. Load deformation curve for nails for a specific cyclic loading protocol.
Table 8–7. Sizes of common wire spikes Length Diameter Size (mm (in.)) (mm (in.)) 10d 76.2 (3) 4.88 (0.192)12d 82.6 (3-1/4) 4.88 (0.192)16d 88.9 (3-1/2) 5.26 (0.207)20d 101.6 (4) 5.72 (0.225)30d 114.3 (4-1/2) 6.20 (0.244)40d 127.0 (5) 6.68 (0.263)50d 139.7 (5-1/2) 7.19 (0.283)60d 152.4 (6) 7.19 (0.283)5/16 in. 177.8 (7) 7.92 (0.312)3/8 in. 215.9 (8-1/2) 9.53 (0.375)
staple must therefore be about two-thirds the diameter of a nail to provide a comparable load. Equation (8–2) has been used to predict the lateral resistance of staples. However, yield model theory equations have not yet been experimen-tally verified for staples.
In addition to the immediate performance capability of staples and nails as determined by test, factors such as cor-rosion, sustained performance under service conditions, and durability in various uses should be considered in evaluating the relative usefulness of a stapled connection.
Drift BoltsA drift bolt (or drift pin) is a long pin of iron or steel, with or without head or point. It is driven into a bored hole through one timber and into an adjacent one, to prevent the separation of the timbers connected and to transmit lateral load. The hole in the second member is drilled sufficiently deep to prevent the pin from hitting the bottom.
The ultimate withdrawal load of a round drift bolt or pin from the side grain of seasoned wood is given by
(metric) (8–9a)
(inch–pound) (8–9b)
where p is the ultimate withdrawal load (N, lb), G specific gravity based on the ovendry weight and volume at 12% moisture content of the wood, D diameter of the drift bolt (mm, in.), and L length of penetration of the bolt (mm, in.). (The NDS uses ovendry weight and volume as a basis.)
This equation provides an average relationship for all spe-cies, and the withdrawal load for some species may be above or below the equation values. It also presumes that the bolts are driven into prebored holes having a diameter 3.2 mm (1/8 in.) less than the bolt diameter.
Data are not available on lateral resistance of drift bolts. The yield model should provide lateral strength prediction, but the model has not been experimentally verified for drift bolts. Designers have used bolt data and design methods
based on experience. This suggests that the load for a drift bolt driven into the side grain of wood should not exceed, and ordinarily should be taken as less than, that for a bolt of the same diameter. Bolt design values are based on the thickness of the main member in a joint. Thus the depth of penetration of the drift bolt must be greater than or equal to the main-member thickness on which the bolt design value is based. However, the drift bolt should not fully penetrate its joint.
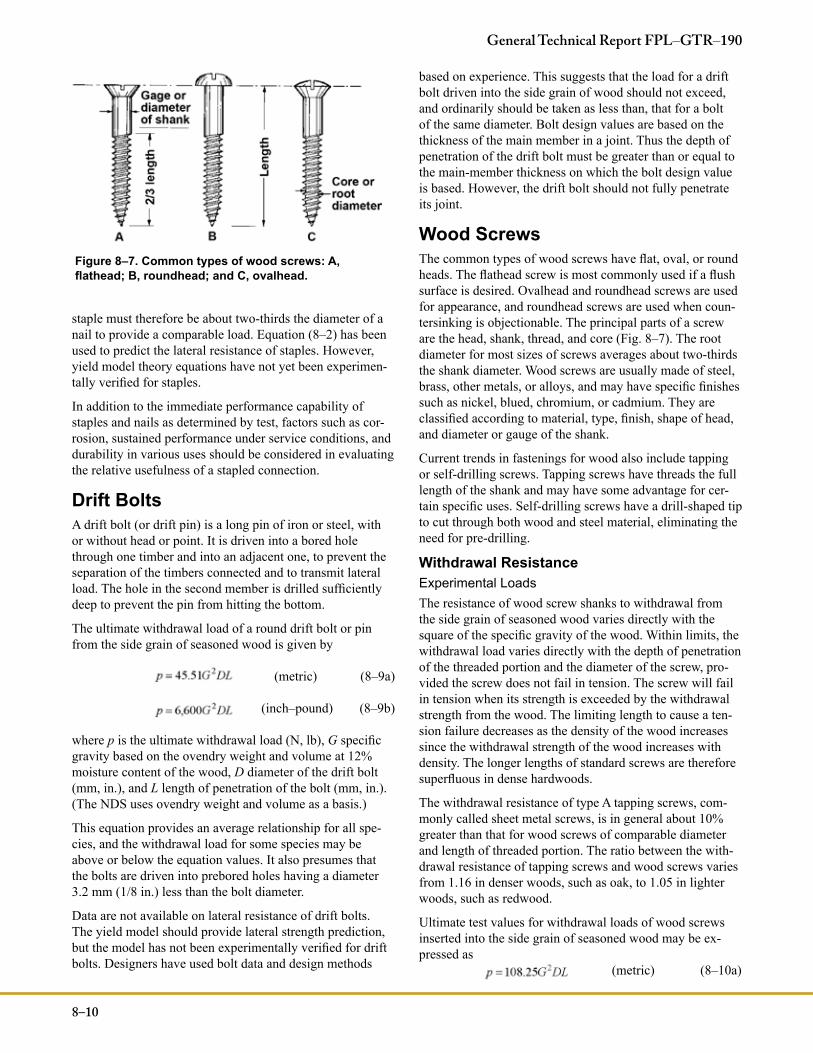
Wood ScrewsThe common types of wood screws have flat, oval, or round heads. The flathead screw is most commonly used if a flush surface is desired. Ovalhead and roundhead screws are used for appearance, and roundhead screws are used when coun-tersinking is objectionable. The principal parts of a screw are the head, shank, thread, and core (Fig. 8–7). The root diameter for most sizes of screws averages about two-thirds the shank diameter. Wood screws are usually made of steel, brass, other metals, or alloys, and may have specific finishes such as nickel, blued, chromium, or cadmium. They are classified according to material, type, finish, shape of head, and diameter or gauge of the shank.
Current trends in fastenings for wood also include tapping or self-drilling screws. Tapping screws have threads the full length of the shank and may have some advantage for cer-tain specific uses. Self-drilling screws have a drill-shaped tip to cut through both wood and steel material, eliminating the need for pre-drilling.
Withdrawal ResistanceExperimental LoadsThe resistance of wood screw shanks to withdrawal from the side grain of seasoned wood varies directly with the square of the specific gravity of the wood. Within limits, the withdrawal load varies directly with the depth of penetration of the threaded portion and the diameter of the screw, pro-vided the screw does not fail in tension. The screw will fail in tension when its strength is exceeded by the withdrawal strength from the wood. The limiting length to cause a ten-sion failure decreases as the density of the wood increases since the withdrawal strength of the wood increases with density. The longer lengths of standard screws are therefore superfluous in dense hardwoods.
The withdrawal resistance of type A tapping screws, com-monly called sheet metal screws, is in general about 10% greater than that for wood screws of comparable diameter and length of threaded portion. The ratio between the with-drawal resistance of tapping screws and wood screws varies from 1.16 in denser woods, such as oak, to 1.05 in lighter woods, such as redwood.
Ultimate test values for withdrawal loads of wood screws inserted into the side grain of seasoned wood may be ex-pressed as (metric) (8–10a)
8–10
General Technical Report FPL–GTR–190
Figure 8–7. Common types of wood screws: A, flathead; B, roundhead; and C, ovalhead.
(inch–pound) (8–10b)
where p is maximum withdrawal load (N, lb), G specific gravity based on ovendry weight and volume at 12% mois-ture content, D shank diameter of the screw (mm, in.), and L length of penetration of the threaded part of the screw (mm, in.). (The NDS uses ovendry weight and volume as a basis.) These values are based on reaching ultimate load in 5- to 10-min.
This equation is applicable when screw lead holes have a diameter of about 70% of the root diameter of the threads in softwoods, and about 90% in hardwoods.
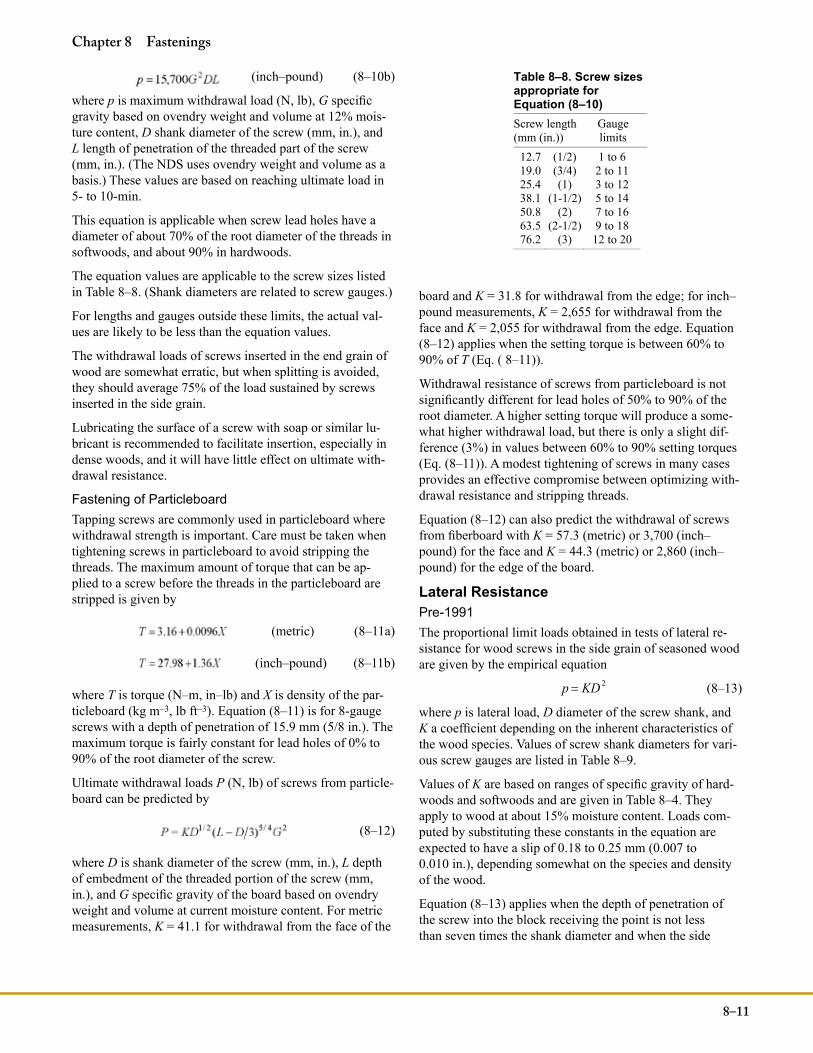
The equation values are applicable to the screw sizes listed in Table 8–8. (Shank diameters are related to screw gauges.)
For lengths and gauges outside these limits, the actual val-ues are likely to be less than the equation values.
The withdrawal loads of screws inserted in the end grain of wood are somewhat erratic, but when splitting is avoided, they should average 75% of the load sustained by screws inserted in the side grain.
Lubricating the surface of a screw with soap or similar lu-bricant is recommended to facilitate insertion, especially in dense woods, and it will have little effect on ultimate with-drawal resistance.
Fastening of ParticleboardTapping screws are commonly used in particleboard where withdrawal strength is important. Care must be taken when tightening screws in particleboard to avoid stripping the threads. The maximum amount of torque that can be ap-plied to a screw before the threads in the particleboard are stripped is given by
(metric) (8–11a)
(inch–pound) (8–11b)
where T is torque (N–m, in–lb) and X is density of the par-ticleboard (kg m–3, lb ft–3). Equation (8–11) is for 8-gauge screws with a depth of penetration of 15.9 mm (5/8 in.). The maximum torque is fairly constant for lead holes of 0% to 90% of the root diameter of the screw.
Ultimate withdrawal loads P (N, lb) of screws from particle-board can be predicted by
(8–12)
where D is shank diameter of the screw (mm, in.), L depth of embedment of the threaded portion of the screw (mm, in.), and G specific gravity of the board based on ovendry weight and volume at current moisture content. For metric measurements, K = 41.1 for withdrawal from the face of the
board and K = 31.8 for withdrawal from the edge; for inch–pound measurements, K = 2,655 for withdrawal from the face and K = 2,055 for withdrawal from the edge. Equation (8–12) applies when the setting torque is between 60% to 90% of T (Eq. ( 8–11)).
Withdrawal resistance of screws from particleboard is not significantly different for lead holes of 50% to 90% of the root diameter. A higher setting torque will produce a some-what higher withdrawal load, but there is only a slight dif-ference (3%) in values between 60% to 90% setting torques (Eq. (8–11)). A modest tightening of screws in many cases provides an effective compromise between optimizing with-drawal resistance and stripping threads.
Equation (8–12) can also predict the withdrawal of screws from fiberboard with K = 57.3 (metric) or 3,700 (inch–pound) for the face and K = 44.3 (metric) or 2,860 (inch–pound) for the edge of the board.
Lateral ResistancePre-1991The proportional limit loads obtained in tests of lateral re-sistance for wood screws in the side grain of seasoned wood are given by the empirical equation
p = KD 2 (8–13)
where p is lateral load, D diameter of the screw shank, and K a coefficient depending on the inherent characteristics of the wood species. Values of screw shank diameters for vari-ous screw gauges are listed in Table 8–9.
Values of K are based on ranges of specific gravity of hard-woods and softwoods and are given in Table 8–4. They apply to wood at about 15% moisture content. Loads com-puted by substituting these constants in the equation are expected to have a slip of 0.18 to 0.25 mm (0.007 to 0.010 in.), depending somewhat on the species and density of the wood.
Equation (8–13) applies when the depth of penetration of the screw into the block receiving the point is not less than seven times the shank diameter and when the side
8–11
Chapter 8 Fastenings
Table 8–8. Screw sizesappropriate for Equation (8–10) Screw length (mm (in.))
Gaugelimits
12.7 (1/2) 1 to 6 19.0 (3/4) 2 to 11 25.4 (1) 3 to 12 38.1 (1-1/2) 5 to 14 50.8 (2) 7 to 16 63.5 (2-1/2) 9 to 18 76.2 (3) 12 to 20
member and the main member are approximately of the same density. The thickness of the side member should be about one-half the depth of penetration of the screw in the member holding the point. The end distance should be no less than the side member thickness, and the edge distances no less than one-half the side member thickness.
This depth of penetration (seven times shank diameter) gives an ultimate load of about four times the load obtained by the equation. For a depth of penetration of less than seven times the shank diameter, the ultimate load is reduced about in proportion to the reduction in penetration, and the load at the proportional limit is reduced somewhat less rap-idly. When the depth of penetration of the screw in the hold-ing block is four times the shank diameter, the maximum load will be less than three times the load expressed by the equation, and the proportional limit load will be approxi-mately equal to that given by the equation. When the screw holds metal to wood, the load can be increased by about 25%.
For these lateral loads, the part of the lead hole receiving the shank should be the same diameter as the shank or slightly smaller; that part receiving the threaded portion should be the same diameter as the root of the thread in dense species or slightly smaller than the root in low-density species.
Screws should always be turned in. They should never be started or driven with a hammer because this practice tears the wood fibers and injures the screw threads, seriously re-ducing the load carrying capacity of the screw.
Post-1991Screw lateral strength is determined by the yield model theory (Table 8–5). Modes I, III, and IV failures may occur (Fig. 8–5). The dowel bearing strength values are based on the same specific gravity equation used to establish values for nails (Eq. (8–3)). Further discussion of screw lateral
strength is found in ASCE Manual No. 84, Mechanical Connections in Wood Structures.
Lag ScrewsLag screws are commonly used because of their conve-nience, particularly where it would be difficult to fasten a bolt or where a nut on the surface would be objectionable. Commonly available lag screws range from about 5.1 to 25.4 mm (0.2 to 1 in.) in diameter and from 25.4 to 406 mm (1 to 16 in.) in length. The length of the threaded part varies with the length of the screw and ranges from 19.0 mm (3/4 in.) with the 25.4- and 31.8-mm (1- and 1-1/4-in.) screws to half the length for all lengths greater than 254 mm (10 in.). Lag screws have a hexagonal-shaped head and are tightened by a wrench (as opposed to wood screws, which have a slotted head and are tightened by a screw driver). The following equations for withdrawal and lateral loads are based on lag screws having a base metal average tensile yield strength of about 310.3 MPa (45,000 lb in–2) and an average ultimate tensile strength of 530.9 MPa (77,000 lb in–2).
Withdrawal ResistanceThe results of withdrawal tests have shown that the maxi-mum direct withdrawal load of lag screws from the side grain of seasoned wood may be computed as
p = 125.4G3 /2D3 /4L (metric) (8–14a)
p = 8,100G3/ 2D3/ 4L (inch–pound) (8–14b)
where p is maximum withdrawal load (N, lb), D shank di-ameter (mm, in.), G specific gravity of the wood based on ovendry weight and volume at 12% moisture content, and L length (mm, in.) of penetration of the threaded part. (The NDS use ovendry weight and volume as a basis.) Equation (8–14) was developed independently of Equation (8–10) but gives approximately the same results.
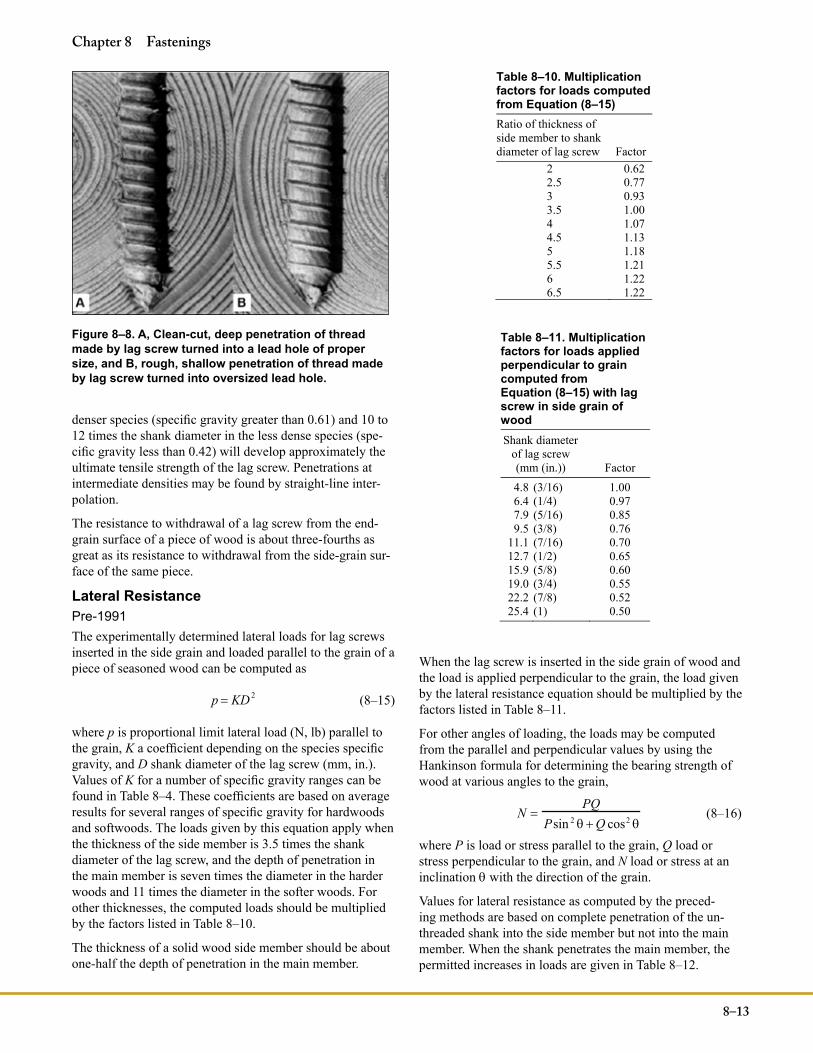
Lag screws, like wood screws, require prebored holes of the proper size (Fig. 8–8). The lead hole for the shank should be the same diameter as the shank. The diameter of the lead hole for the threaded part varies with the density of the wood: For low-density softwoods, such as the cedars and white pines, 40% to 70% of the shank diameter; for Doug-las-fir and Southern Pine, 60% to 75%; and for dense hard-woods, such as oaks, 65% to 85%. The smaller percentage in each range applies to lag screws of the smaller diameters and the larger percentage to lag screws of larger diameters. Soap or similar lubricants should be used on the screw to facilitate turning, and lead holes slightly larger than those recommended for maximum efficiency should be used with long screws.
In determining the withdrawal resistance, the allowable tensile strength of the lag screw at the net (root) section should not be exceeded. Penetration of the threaded part to a distance about seven times the shank diameter in the
8–12
General Technical Report FPL–GTR–190
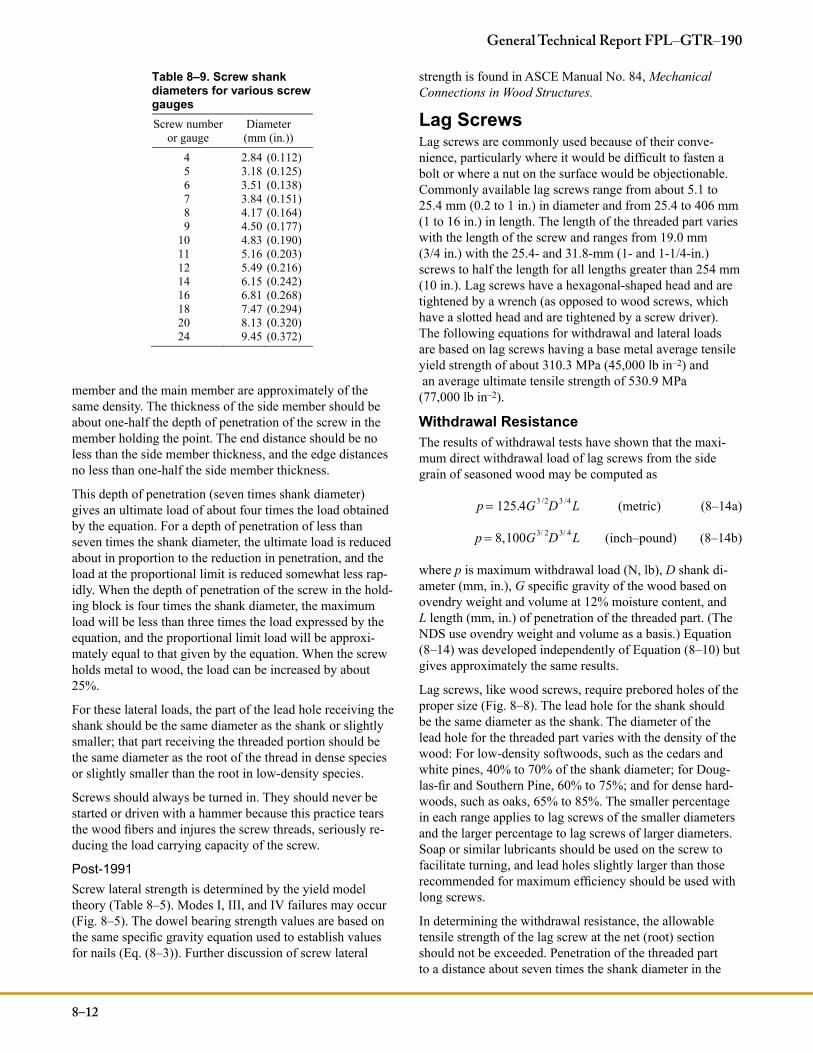
Table 8–9. Screw shank diameters for various screw gaugesScrew number
or gauge Diameter (mm (in.))
4 2.84 (0.112) 5 3.18 (0.125) 6 3.51 (0.138) 7 3.84 (0.151) 8 4.17 (0.164) 9 4.50 (0.177)
10 4.83 (0.190) 11 5.16 (0.203) 12 5.49 (0.216) 14 6.15 (0.242) 16 6.81 (0.268) 18 7.47 (0.294) 20 8.13 (0.320) 24 9.45 (0.372)
denser species (specific gravity greater than 0.61) and 10 to 12 times the shank diameter in the less dense species (spe-cific gravity less than 0.42) will develop approximately the ultimate tensile strength of the lag screw. Penetrations at intermediate densities may be found by straight-line inter-polation.
The resistance to withdrawal of a lag screw from the end-grain surface of a piece of wood is about three-fourths as great as its resistance to withdrawal from the side-grain sur-face of the same piece.
Lateral ResistancePre-1991The experimentally determined lateral loads for lag screws inserted in the side grain and loaded parallel to the grain of a piece of seasoned wood can be computed as
p = KD 2 (8–15)
where p is proportional limit lateral load (N, lb) parallel to the grain, K a coefficient depending on the species specific gravity, and D shank diameter of the lag screw (mm, in.). Values of K for a number of specific gravity ranges can be found in Table 8–4. These coefficients are based on average results for several ranges of specific gravity for hardwoods and softwoods. The loads given by this equation apply when the thickness of the side member is 3.5 times the shank diameter of the lag screw, and the depth of penetration in the main member is seven times the diameter in the harder woods and 11 times the diameter in the softer woods. For other thicknesses, the computed loads should be multiplied by the factors listed in Table 8–10.
The thickness of a solid wood side member should be about one-half the depth of penetration in the main member.
When the lag screw is inserted in the side grain of wood and the load is applied perpendicular to the grain, the load given by the lateral resistance equation should be multiplied by the factors listed in Table 8–11.
For other angles of loading, the loads may be computed from the parallel and perpendicular values by using the Hankinson formula for determining the bearing strength of wood at various angles to the grain,
N =
PQPsin 2 q +Q cos2 q
(8–16)
where P is load or stress parallel to the grain, Q load or stress perpendicular to the grain, and N load or stress at an inclination q with the direction of the grain.
Values for lateral resistance as computed by the preced-ing methods are based on complete penetration of the un-threaded shank into the side member but not into the main member. When the shank penetrates the main member, the permitted increases in loads are given in Table 8–12.
8–13
Chapter 8 Fastenings
Figure 8–8. A, Clean-cut, deep penetration of thread made by lag screw turned into a lead hole of proper size, and B, rough, shallow penetration of thread made by lag screw turned into oversized lead hole.
Table 8–10. Multiplication factors for loads computed from Equation (8–15) Ratio of thickness of side member to shankdiameter of lag screw Factor
2 0.62 2.5 0.77 3 0.93 3.5 1.00 4 1.07 4.5 1.13 5 1.18 5.5 1.21 6 1.22 6.5 1.22
Table 8–11. Multiplication factors for loads applied perpendicular to grain computed from Equation (8–15) with lag screw in side grain of wood Shank diameter
of lag screw (mm (in.)) Factor 4.8 (3/16) 1.00 6.4 (1/4) 0.97 7.9 (5/16) 0.85 9.5 (3/8) 0.76
11.1 (7/16) 0.70 12.7 (1/2) 0.65 15.9 (5/8) 0.60 19.0 (3/4) 0.55 22.2 (7/8) 0.52 25.4 (1) 0.50
When lag screws are used with metal plates, the lateral loads parallel to the grain may be increased 25%, provided the plate thickness is sufficient so that the bearing capacity of the steel is not exceeded. No increase should be made when the applied load is perpendicular to the grain.
Lag screws should not be used in end grain, because split-ting may develop under lateral load. If lag screws are so used, however, the loads should be taken as two-thirds those for lateral resistance when lag screws are inserted into side grain and the loads act perpendicular to the grain.
The spacings, end and edge distances, and net section for lag screw joints should be the same as those for joints with bolts (discussed later) of a diameter equal to the shank di-ameter of the lag screw.
Lag screws should always be inserted by turning with a wrench, not by driving with a hammer. Soap, beeswax, or other lubricants applied to the screw, particularly with the denser wood species, will facilitate insertion and prevent damage to the threads but will not affect performance of the lag screw.
Post-1991Lag screw lateral strength is determined by the yield model theory table similar to the procedure for bolts. Modes I, III, and IV yield may occur (Fig. 8–5). The dowel bearing strength values are based on the same parallel- and perpen-dicular-to-grain specific gravity equations used to establish values for bolts.
For other angles of loading, the dowel bearing strength val-ues for use in the yield model are determined by the Hankin-son equation, where P and Q are the values of dowel bear-ing parallel and perpendicular to grain, respectively.
BoltsBearing Stress of Wood under BoltsThe bearing stress under a bolt is computed by dividing the load on a bolt by the product LD, where L is the length of a
bolt in the main member and D is the bolt diameter. Basic parallel-to-grain and perpendicular-to-grain bearing stresses have been obtained from tests of three-member wood joints where each side member is half the thickness of the main member. The side members were loaded parallel to grain for both parallel- and perpendicular-to-grain tests. Prior to 1991, bearing stress was based on test results at the proportional limit; since 1991, bearing stress is based on test results at a yield limit state, which is defined as the 5% diameter offset on the load–deformation curve (similar to Fig. 8–4).
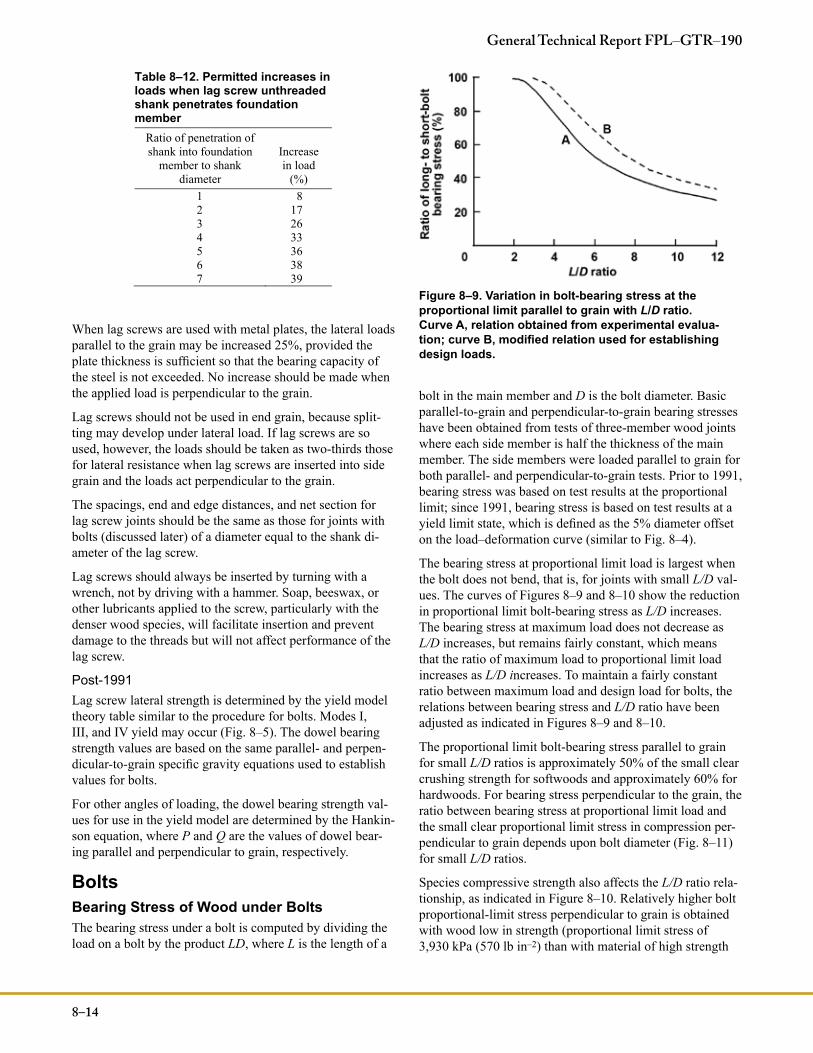
The bearing stress at proportional limit load is largest when the bolt does not bend, that is, for joints with small L/D val-ues. The curves of Figures 8–9 and 8–10 show the reduction in proportional limit bolt-bearing stress as L/D increases. The bearing stress at maximum load does not decrease as L/D increases, but remains fairly constant, which means that the ratio of maximum load to proportional limit load increases as L/D increases. To maintain a fairly constant ratio between maximum load and design load for bolts, the relations between bearing stress and L/D ratio have been adjusted as indicated in Figures 8–9 and 8–10.
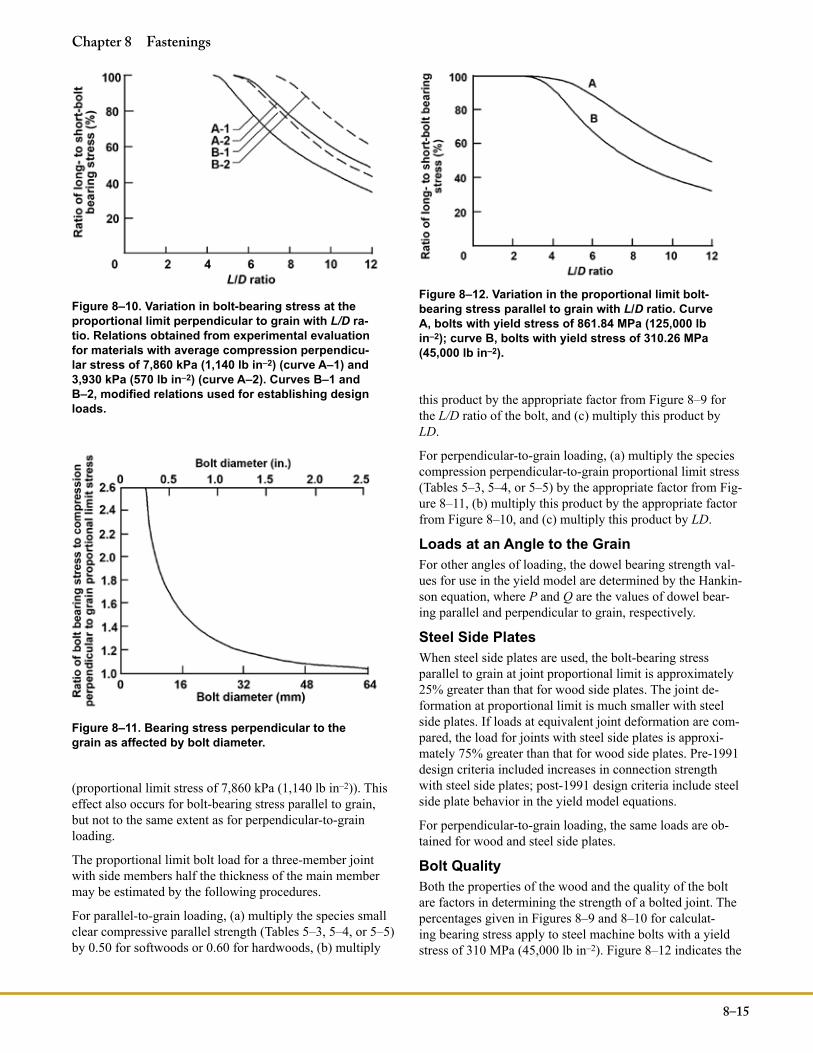
The proportional limit bolt-bearing stress parallel to grain for small L/D ratios is approximately 50% of the small clear crushing strength for softwoods and approximately 60% for hardwoods. For bearing stress perpendicular to the grain, the ratio between bearing stress at proportional limit load and the small clear proportional limit stress in compression per-pendicular to grain depends upon bolt diameter (Fig. 8–11) for small L/D ratios.
Species compressive strength also affects the L/D ratio rela-tionship, as indicated in Figure 8–10. Relatively higher bolt proportional-limit stress perpendicular to grain is obtained with wood low in strength (proportional limit stress of 3,930 kPa (570 lb in–2) than with material of high strength
8–14
General Technical Report FPL–GTR–190
Table 8–12. Permitted increases in loads when lag screw unthreaded shank penetrates foundation member
Ratio of penetration ofshank into foundation
member to shank diameter
Increase in load
(%)1 8 2 17 3 26 4 33 5 36 6 38 7 39
Figure 8–9. Variation in bolt-bearing stress at the proportional limit parallel to grain with L/D ratio. Curve A, relation obtained from experimental evalua-tion; curve B, modified relation used for establishing design loads.
(proportional limit stress of 7,860 kPa (1,140 lb in–2)). This effect also occurs for bolt-bearing stress parallel to grain, but not to the same extent as for perpendicular-to-grain loading.
The proportional limit bolt load for a three-member joint with side members half the thickness of the main member may be estimated by the following procedures.
For parallel-to-grain loading, (a) multiply the species small clear compressive parallel strength (Tables 5–3, 5–4, or 5–5) by 0.50 for softwoods or 0.60 for hardwoods, (b) multiply
this product by the appropriate factor from Figure 8–9 for the L/D ratio of the bolt, and (c) multiply this product by LD.
For perpendicular-to-grain loading, (a) multiply the species compression perpendicular-to-grain proportional limit stress (Tables 5–3, 5–4, or 5–5) by the appropriate factor from Fig-ure 8–11, (b) multiply this product by the appropriate factor from Figure 8–10, and (c) multiply this product by LD.
Loads at an Angle to the GrainFor other angles of loading, the dowel bearing strength val-ues for use in the yield model are determined by the Hankin-son equation, where P and Q are the values of dowel bear-ing parallel and perpendicular to grain, respectively.
Steel Side PlatesWhen steel side plates are used, the bolt-bearing stress parallel to grain at joint proportional limit is approximately 25% greater than that for wood side plates. The joint de-formation at proportional limit is much smaller with steel side plates. If loads at equivalent joint deformation are com-pared, the load for joints with steel side plates is approxi-mately 75% greater than that for wood side plates. Pre-1991 design criteria included increases in connection strength with steel side plates; post-1991 design criteria include steel side plate behavior in the yield model equations.
For perpendicular-to-grain loading, the same loads are ob-tained for wood and steel side plates.
Bolt QualityBoth the properties of the wood and the quality of the bolt are factors in determining the strength of a bolted joint. The percentages given in Figures 8–9 and 8–10 for calculat-ing bearing stress apply to steel machine bolts with a yield stress of 310 MPa (45,000 lb in–2). Figure 8–12 indicates the
8–15
Chapter 8 Fastenings
Figure 8–10. Variation in bolt-bearing stress at the proportional limit perpendicular to grain with L/D ra-tio. Relations obtained from experimental evaluation for materials with average compression perpendicu-lar stress of 7,860 kPa (1,140 lb in–2) (curve A–1) and 3,930 kPa (570 lb in–2) (curve A–2). Curves B–1 and B–2, modified relations used for establishing design loads.
Figure 8–11. Bearing stress perpendicular to the grain as affected by bolt diameter.
Figure 8–12. Variation in the proportional limit bolt- bearing stress parallel to grain with L/D ratio. Curve A, bolts with yield stress of 861.84 MPa (125,000 lb in–2); curve B, bolts with yield stress of 310.26 MPa (45,000 lb in–2).
increase in bearing stress parallel to grain for bolts with a yield stress of 862 MPa (125,000 lb in–2).
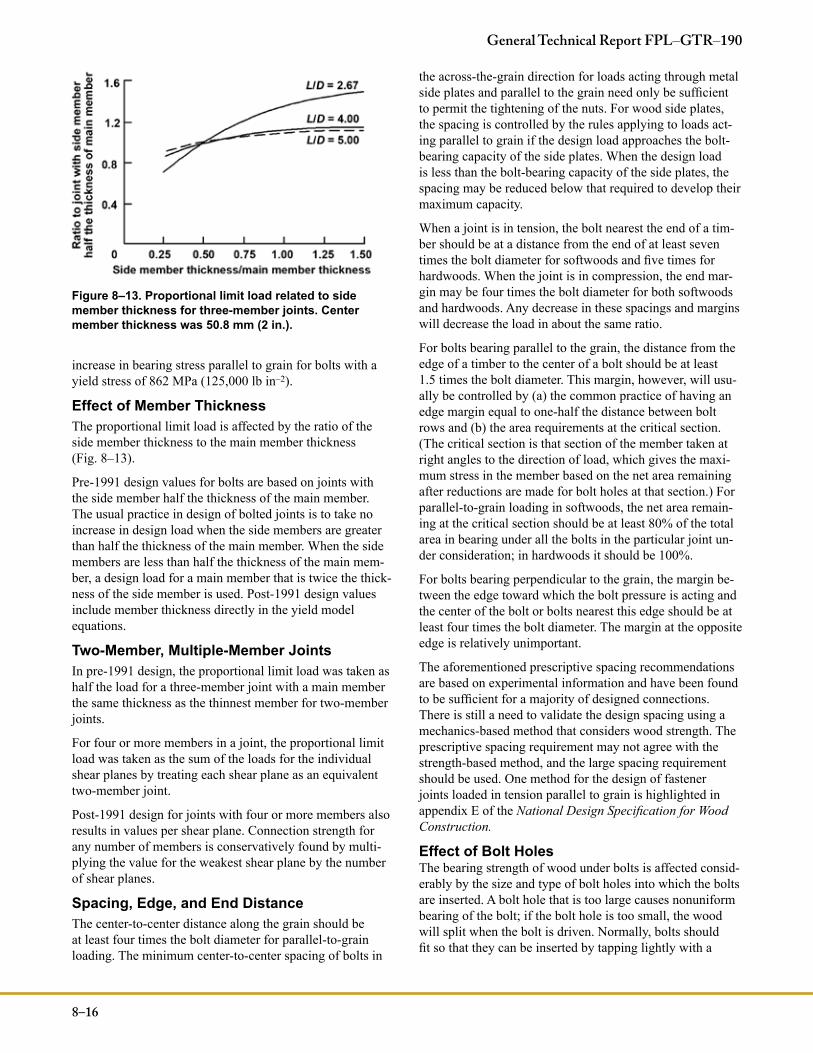
Effect of Member ThicknessThe proportional limit load is affected by the ratio of the side member thickness to the main member thickness (Fig. 8–13).
Pre-1991 design values for bolts are based on joints with the side member half the thickness of the main member. The usual practice in design of bolted joints is to take no increase in design load when the side members are greater than half the thickness of the main member. When the side members are less than half the thickness of the main mem-ber, a design load for a main member that is twice the thick-ness of the side member is used. Post-1991 design values include member thickness directly in the yield model equations.
Two-Member, Multiple-Member JointsIn pre-1991 design, the proportional limit load was taken as half the load for a three-member joint with a main member the same thickness as the thinnest member for two-member joints.
For four or more members in a joint, the proportional limit load was taken as the sum of the loads for the individual shear planes by treating each shear plane as an equivalent two-member joint.
Post-1991 design for joints with four or more members also results in values per shear plane. Connection strength for any number of members is conservatively found by multi-plying the value for the weakest shear plane by the number of shear planes.
Spacing, Edge, and End DistanceThe center-to-center distance along the grain should be at least four times the bolt diameter for parallel-to-grain loading. The minimum center-to-center spacing of bolts in
the across-the-grain direction for loads acting through metal side plates and parallel to the grain need only be sufficient to permit the tightening of the nuts. For wood side plates, the spacing is controlled by the rules applying to loads act-ing parallel to grain if the design load approaches the bolt-bearing capacity of the side plates. When the design load is less than the bolt-bearing capacity of the side plates, the spacing may be reduced below that required to develop their maximum capacity.
When a joint is in tension, the bolt nearest the end of a tim-ber should be at a distance from the end of at least seven times the bolt diameter for softwoods and five times for hardwoods. When the joint is in compression, the end mar-gin may be four times the bolt diameter for both softwoods and hardwoods. Any decrease in these spacings and margins will decrease the load in about the same ratio.
For bolts bearing parallel to the grain, the distance from the edge of a timber to the center of a bolt should be at least 1.5 times the bolt diameter. This margin, however, will usu-ally be controlled by (a) the common practice of having an edge margin equal to one-half the distance between bolt rows and (b) the area requirements at the critical section. (The critical section is that section of the member taken at right angles to the direction of load, which gives the maxi-mum stress in the member based on the net area remaining after reductions are made for bolt holes at that section.) For parallel-to-grain loading in softwoods, the net area remain-ing at the critical section should be at least 80% of the total area in bearing under all the bolts in the particular joint un-der consideration; in hardwoods it should be 100%.
For bolts bearing perpendicular to the grain, the margin be-tween the edge toward which the bolt pressure is acting and the center of the bolt or bolts nearest this edge should be at least four times the bolt diameter. The margin at the opposite edge is relatively unimportant.
The aforementioned prescriptive spacing recommendations are based on experimental information and have been found to be sufficient for a majority of designed connections. There is still a need to validate the design spacing using a mechanics-based method that considers wood strength. The prescriptive spacing requirement may not agree with the strength-based method, and the large spacing requirement should be used. One method for the design of fastener joints loaded in tension parallel to grain is highlighted in appendix E of the National Design Specification for Wood Construction.
Effect of Bolt HolesThe bearing strength of wood under bolts is affected consid-erably by the size and type of bolt holes into which the bolts are inserted. A bolt hole that is too large causes nonuniform bearing of the bolt; if the bolt hole is too small, the wood will split when the bolt is driven. Normally, bolts should fit so that they can be inserted by tapping lightly with a
8–16
General Technical Report FPL–GTR–190
Figure 8–13. Proportional limit load related to side member thickness for three-member joints. Center member thickness was 50.8 mm (2 in.).
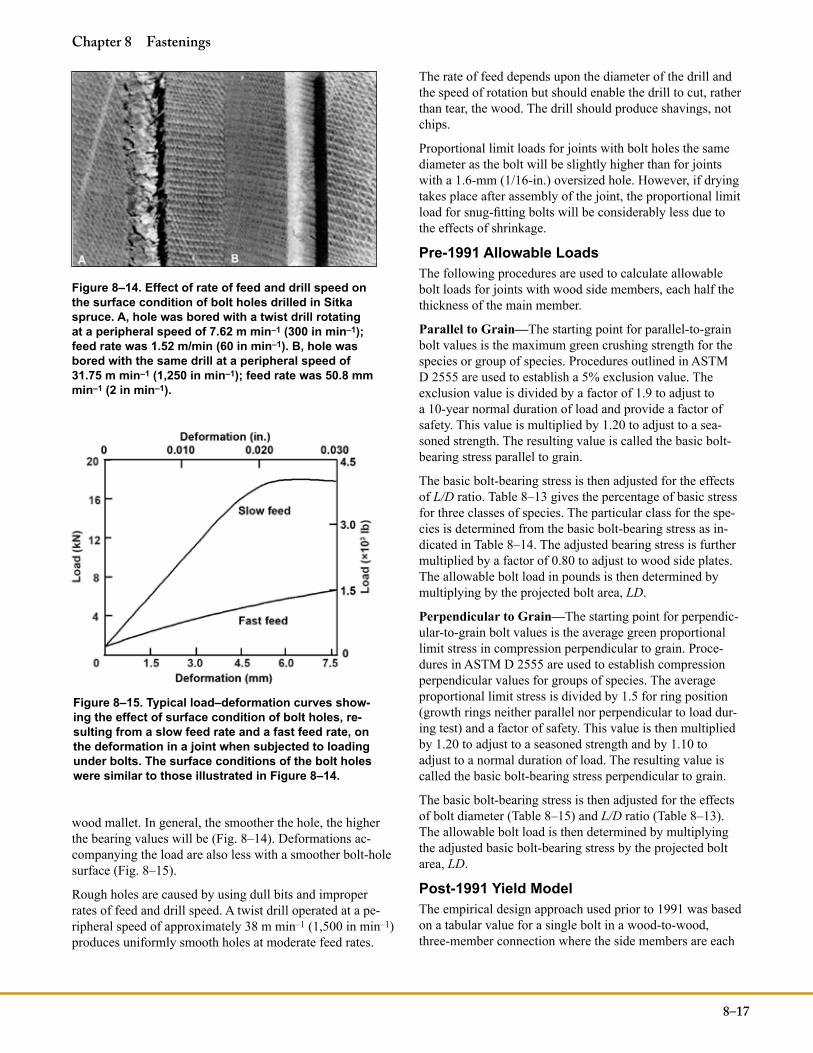
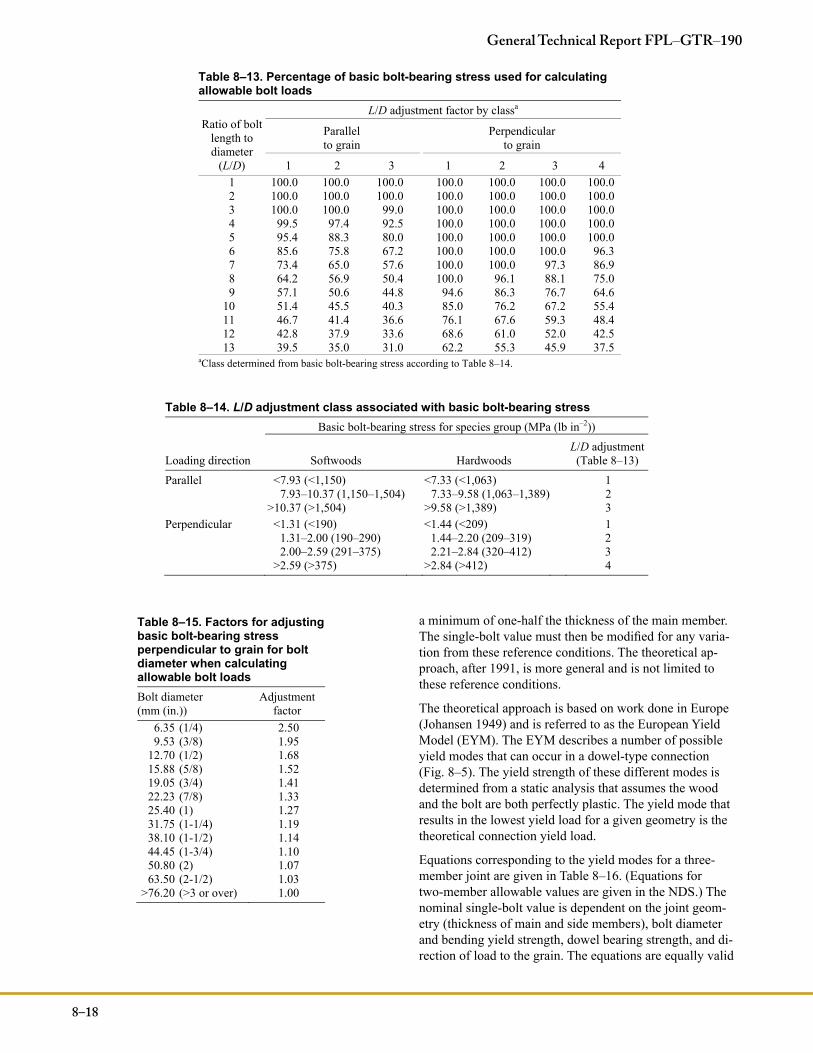
wood mallet. In general, the smoother the hole, the higher the bearing values will be (Fig. 8–14). Deformations ac-companying the load are also less with a smoother bolt-hole surface (Fig. 8–15).
Rough holes are caused by using dull bits and improper rates of feed and drill speed. A twist drill operated at a pe-ripheral speed of approximately 38 m min–1 (1,500 in min–1) produces uniformly smooth holes at moderate feed rates.
The rate of feed depends upon the diameter of the drill and the speed of rotation but should enable the drill to cut, rather than tear, the wood. The drill should produce shavings, not chips.
Proportional limit loads for joints with bolt holes the same diameter as the bolt will be slightly higher than for joints with a 1.6-mm (1/16-in.) oversized hole. However, if drying takes place after assembly of the joint, the proportional limit load for snug-fitting bolts will be considerably less due to the effects of shrinkage.
Pre-1991 Allowable LoadsThe following procedures are used to calculate allowable bolt loads for joints with wood side members, each half the thickness of the main member.
Parallel to Grain—The starting point for parallel-to-grain bolt values is the maximum green crushing strength for the species or group of species. Procedures outlined in ASTM D 2555 are used to establish a 5% exclusion value. The exclusion value is divided by a factor of 1.9 to adjust to a 10-year normal duration of load and provide a factor of safety. This value is multiplied by 1.20 to adjust to a sea-soned strength. The resulting value is called the basic bolt-bearing stress parallel to grain.
The basic bolt-bearing stress is then adjusted for the effects of L/D ratio. Table 8–13 gives the percentage of basic stress for three classes of species. The particular class for the spe-cies is determined from the basic bolt-bearing stress as in-dicated in Table 8–14. The adjusted bearing stress is further multiplied by a factor of 0.80 to adjust to wood side plates. The allowable bolt load in pounds is then determined by multiplying by the projected bolt area, LD.
Perpendicular to Grain—The starting point for perpendic-ular-to-grain bolt values is the average green proportional limit stress in compression perpendicular to grain. Proce-dures in ASTM D 2555 are used to establish compression perpendicular values for groups of species. The average proportional limit stress is divided by 1.5 for ring position (growth rings neither parallel nor perpendicular to load dur-ing test) and a factor of safety. This value is then multiplied by 1.20 to adjust to a seasoned strength and by 1.10 to adjust to a normal duration of load. The resulting value is called the basic bolt-bearing stress perpendicular to grain.
The basic bolt-bearing stress is then adjusted for the effects of bolt diameter (Table 8–15) and L/D ratio (Table 8–13). The allowable bolt load is then determined by multiplying the adjusted basic bolt-bearing stress by the projected bolt area, LD.
Post-1991 Yield ModelThe empirical design approach used prior to 1991 was based on a tabular value for a single bolt in a wood-to-wood, three-member connection where the side members are each
8–17
Chapter 8 Fastenings
Figure 8–14. Effect of rate of feed and drill speed on the surface condition of bolt holes drilled in Sitka spruce. A, hole was bored with a twist drill rotating at a peripheral speed of 7.62 m min–1 (300 in min–1); feed rate was 1.52 m/min (60 in min–1). B, hole was bored with the same drill at a peripheral speed of 31.75 m min–1 (1,250 in min–1); feed rate was 50.8 mm min–1 (2 in min–1).
Figure 8–15. Typical load–deformation curves show-ing the effect of surface condition of bolt holes, re-sulting from a slow feed rate and a fast feed rate, on the deformation in a joint when subjected to loading under bolts. The surface conditions of the bolt holes were similar to those illustrated in Figure 8–14.
a minimum of one-half the thickness of the main member. The single-bolt value must then be modified for any varia-tion from these reference conditions. The theoretical ap-proach, after 1991, is more general and is not limited to these reference conditions.
The theoretical approach is based on work done in Europe (Johansen 1949) and is referred to as the European Yield Model (EYM). The EYM describes a number of possible yield modes that can occur in a dowel-type connection (Fig. 8–5). The yield strength of these different modes is determined from a static analysis that assumes the wood and the bolt are both perfectly plastic. The yield mode that results in the lowest yield load for a given geometry is the theoretical connection yield load.
Equations corresponding to the yield modes for a three-member joint are given in Table 8–16. (Equations for two-member allowable values are given in the NDS.) The nominal single-bolt value is dependent on the joint geom-etry (thickness of main and side members), bolt diameter and bending yield strength, dowel bearing strength, and di-rection of load to the grain. The equations are equally valid
8–18
General Technical Report FPL–GTR–190
Table 8–13. Percentage of basic bolt-bearing stress used for calculating allowable bolt loads
Ratio of bolt length to diameter
(L/D)
L/D adjustment factor by classa
Parallel to grain
Perpendicular to grain
1 2 3 1 2 3 4 1 100.0 100.0 100.0 100.0 100.0 100.0 100.0 2 100.0 100.0 100.0 100.0 100.0 100.0 100.0 3 100.0 100.0 99.0 100.0 100.0 100.0 100.0 4 99.5 97.4 92.5 100.0 100.0 100.0 100.0 5 95.4 88.3 80.0 100.0 100.0 100.0 100.0 6 85.6 75.8 67.2 100.0 100.0 100.0 96.3 7 73.4 65.0 57.6 100.0 100.0 97.3 86.9 8 64.2 56.9 50.4 100.0 96.1 88.1 75.0 9 57.1 50.6 44.8 94.6 86.3 76.7 64.6
10 51.4 45.5 40.3 85.0 76.2 67.2 55.4 11 46.7 41.4 36.6 76.1 67.6 59.3 48.4 12 42.8 37.9 33.6 68.6 61.0 52.0 42.5 13 39.5 35.0 31.0 62.2 55.3 45.9 37.5
aClass determined from basic bolt-bearing stress according to Table 8–14.
Table 8–14. L/D adjustment class associated with basic bolt-bearing stressBasic bolt-bearing stress for species group (MPa (lb in–2))
Loading direction Softwoods Hardwoods L/D adjustment (Table 8–13)
Parallel <7.93 (<1,150) <7.33 (<1,063) 1 7.93–10.37 (1,150–1,504) 7.33–9.58 (1,063–1,389) 2 >10.37 (>1,504) >9.58 (>1,389) 3 Perpendicular <1.31 (<190) <1.44 (<209) 1 1.31–2.00 (190–290) 1.44–2.20 (209–319) 2 2.00–2.59 (291–375) 2.21–2.84 (320–412) 3 >2.59 (>375) >2.84 (>412) 4
Table 8–15. Factors for adjusting basic bolt-bearing stress perpendicular to grain for bolt diameter when calculating allowable bolt loads Bolt diameter (mm (in.))
Adjustmentfactor
6.35 (1/4) 2.50 9.53 (3/8) 1.95
12.70 (1/2) 1.68 15.88 (5/8) 1.52 19.05 (3/4) 1.41 22.23 (7/8) 1.33 25.40 (1) 1.27 31.75 (1-1/4) 1.19 38.10 (1-1/2) 1.14 44.45 (1-3/4) 1.10 50.80 (2) 1.07 63.50 (2-1/2) 1.03
>76.20 (>3 or over) 1.00
for wood or steel side members, which is taken into account by thickness and dowel bearing strength parameters. The equations are also valid for various load-to-grain directions, which are taken into account by the Kq and Fe parameter.
The dowel bearing strength is a material property not gen-erally familiar to structural designers. The dowel bearing strength of the wood members is determined from tests that relate species specific gravity and dowel diameter to bearing strength. Empirical equations for these relationships are as follows:
Parallel to grain
(metric) (8–17a)
(inch–pound) (8–17b)
Perpendicular to grain
(metric) (8–18a)
(inch–pound) (8–18b)
where Fe is dowel bearing strength (MPa, lb in–2), G specific gravity based on ovendry weight and volume, and D bolt diameter (mm, in.).
For other angles of loading, the dowel bearing strength values for use in the yield model are determined by the Hankinson equation, where P and Q are the values of dowel bearing parallel and perpendicular to grain, respectively.
Connector JointsSeveral types of connectors have been devised that increase joint bearing and shear areas by utilizing rings or plates around bolts holding joint members together. The primary load-carrying portions of these joints are the connectors; the bolts usually serve to prevent transverse separation of the members but do contribute some load-carrying capacity.
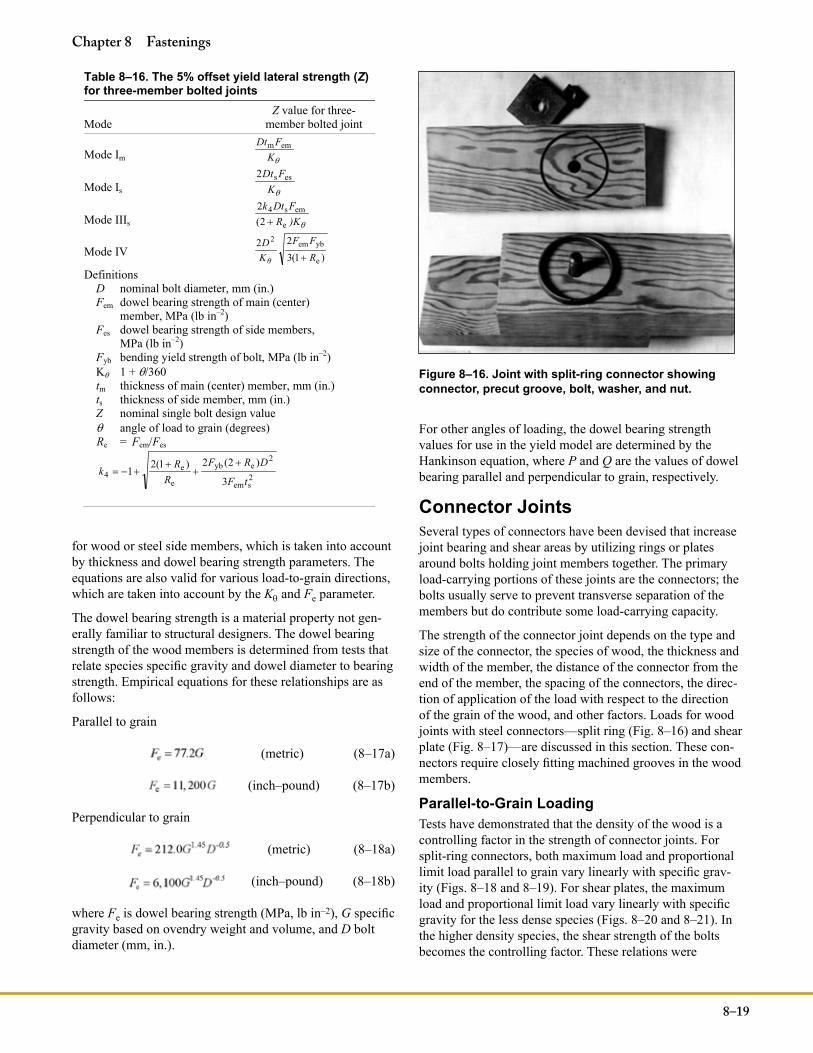
The strength of the connector joint depends on the type and size of the connector, the species of wood, the thickness and width of the member, the distance of the connector from the end of the member, the spacing of the connectors, the direc-tion of application of the load with respect to the direction of the grain of the wood, and other factors. Loads for wood joints with steel connectors—split ring (Fig. 8–16) and shear plate (Fig. 8–17)—are discussed in this section. These con-nectors require closely fitting machined grooves in the wood members.
Parallel-to-Grain LoadingTests have demonstrated that the density of the wood is a controlling factor in the strength of connector joints. For split-ring connectors, both maximum load and proportional limit load parallel to grain vary linearly with specific grav-ity (Figs. 8–18 and 8–19). For shear plates, the maximum load and proportional limit load vary linearly with specific gravity for the less dense species (Figs. 8–20 and 8–21). In the higher density species, the shear strength of the bolts becomes the controlling factor. These relations were
8–19
Chapter 8 Fastenings
Table 8–16. The 5% offset yield lateral strength (Z)for three-member bolted joints
ModeZ value for three-
member bolted joint
Mode Im KFDt emm
Mode Is KFDt ess2
Mode IIIs )KRFtDk
e
ems42(
2
Mode IV )1(322
e
ybem2
RFF
KD
θ
Definitions D nominal bolt diameter, mm (in.) Fem dowel bearing strength of main (center) member, MPa (lb in–2)Fes dowel bearing strength of side members, MPa (lb in–2)Fyb bending yield strength of bolt, MPa (lb in–2)K 1 + /360 tm thickness of main (center) member, mm (in.) ts thickness of side member, mm (in.) Z nominal single bolt design value angle of load to grain (degrees) Re = Fem/Fes
2sem
2eyb
e
e4
3
)2(2)1(21
tF
DRFR
Rk
Figure 8–16. Joint with split-ring connector showing connector, precut groove, bolt, washer, and nut.
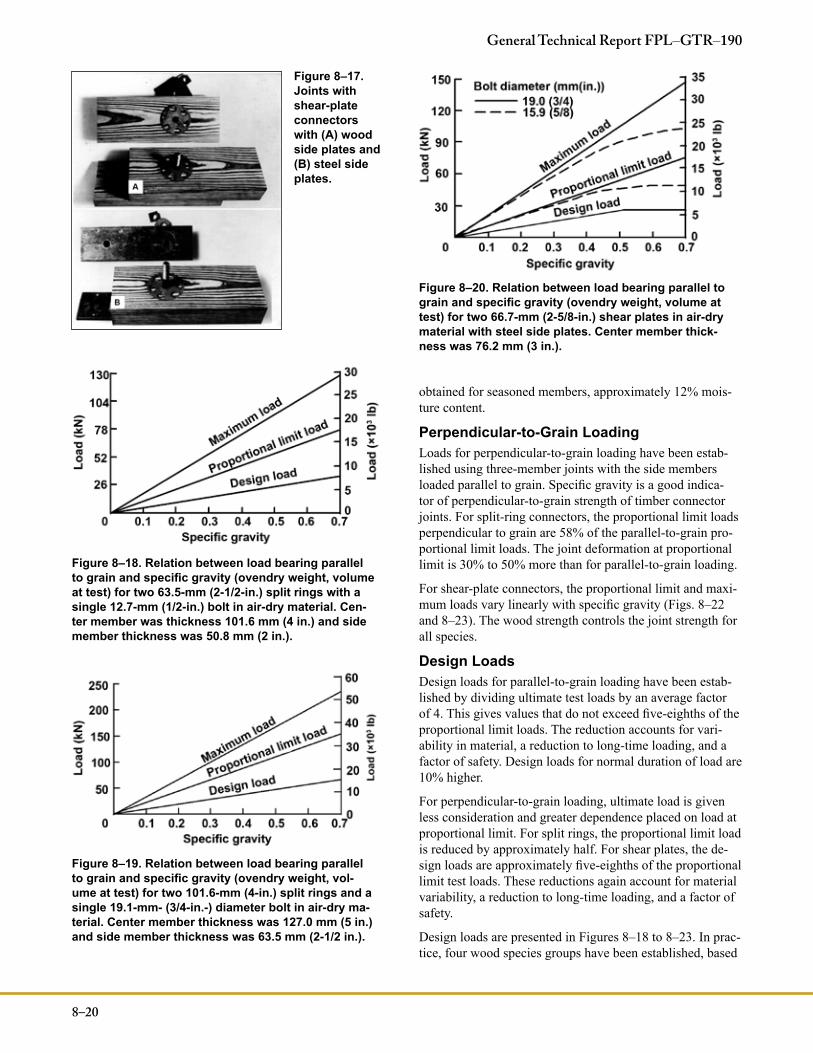
obtained for seasoned members, approximately 12% mois-ture content.
Perpendicular-to-Grain LoadingLoads for perpendicular-to-grain loading have been estab-lished using three-member joints with the side members loaded parallel to grain. Specific gravity is a good indica-tor of perpendicular-to-grain strength of timber connector joints. For split-ring connectors, the proportional limit loads perpendicular to grain are 58% of the parallel-to-grain pro-portional limit loads. The joint deformation at proportional limit is 30% to 50% more than for parallel-to-grain loading.
For shear-plate connectors, the proportional limit and maxi-mum loads vary linearly with specific gravity (Figs. 8–22 and 8–23). The wood strength controls the joint strength for all species.
Design LoadsDesign loads for parallel-to-grain loading have been estab-lished by dividing ultimate test loads by an average factor of 4. This gives values that do not exceed five-eighths of the proportional limit loads. The reduction accounts for vari-ability in material, a reduction to long-time loading, and a factor of safety. Design loads for normal duration of load are 10% higher.
For perpendicular-to-grain loading, ultimate load is given less consideration and greater dependence placed on load at proportional limit. For split rings, the proportional limit load is reduced by approximately half. For shear plates, the de-sign loads are approximately five-eighths of the proportional limit test loads. These reductions again account for material variability, a reduction to long-time loading, and a factor of safety.
Design loads are presented in Figures 8–18 to 8–23. In prac-tice, four wood species groups have been established, based
8–20
General Technical Report FPL–GTR–190
Figure 8–19. Relation between load bearing parallel to grain and specific gravity (ovendry weight, vol-ume at test) for two 101.6-mm (4-in.) split rings and a single 19.1-mm- (3/4-in.-) diameter bolt in air-dry ma-terial. Center member thickness was 127.0 mm (5 in.) and side member thickness was 63.5 mm (2-1/2 in.).
Figure 8–17. Joints with shear-plate connectors with (A) wood side plates and (B) steel side plates.
Figure 8–18. Relation between load bearing parallel to grain and specific gravity (ovendry weight, volume at test) for two 63.5-mm (2-1/2-in.) split rings with a single 12.7-mm (1/2-in.) bolt in air-dry material. Cen-ter member was thickness 101.6 mm (4 in.) and side member thickness was 50.8 mm (2 in.).
Figure 8–20. Relation between load bearing parallel to grain and specific gravity (ovendry weight, volume at test) for two 66.7-mm (2-5/8-in.) shear plates in air-dry material with steel side plates. Center member thick-ness was 76.2 mm (3 in.).
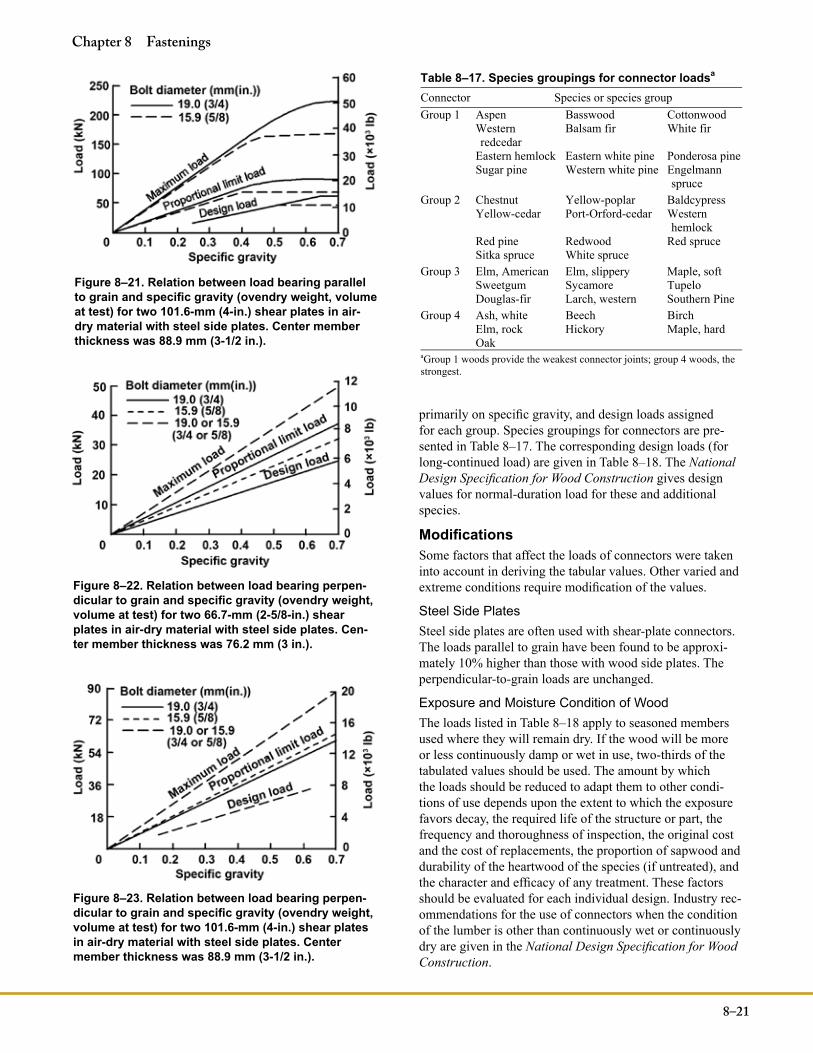
primarily on specific gravity, and design loads assigned for each group. Species groupings for connectors are pre-sented in Table 8–17. The corresponding design loads (for long-continued load) are given in Table 8–18. The National Design Specification for Wood Construction gives design values for normal-duration load for these and additional species.
ModificationsSome factors that affect the loads of connectors were taken into account in deriving the tabular values. Other varied and extreme conditions require modification of the values.
Steel Side PlatesSteel side plates are often used with shear-plate connectors. The loads parallel to grain have been found to be approxi-mately 10% higher than those with wood side plates. The perpendicular-to-grain loads are unchanged.
Exposure and Moisture Condition of WoodThe loads listed in Table 8–18 apply to seasoned members used where they will remain dry. If the wood will be more or less continuously damp or wet in use, two-thirds of the tabulated values should be used. The amount by which the loads should be reduced to adapt them to other condi-tions of use depends upon the extent to which the exposure favors decay, the required life of the structure or part, the frequency and thoroughness of inspection, the original cost and the cost of replacements, the proportion of sapwood and durability of the heartwood of the species (if untreated), and the character and efficacy of any treatment. These factors should be evaluated for each individual design. Industry rec-ommendations for the use of connectors when the condition of the lumber is other than continuously wet or continuously dry are given in the National Design Specification for Wood Construction.
8–21
Chapter 8 Fastenings
Figure 8–21. Relation between load bearing parallel to grain and specific gravity (ovendry weight, volume at test) for two 101.6-mm (4-in.) shear plates in air-dry material with steel side plates. Center member thickness was 88.9 mm (3-1/2 in.).
Figure 8–22. Relation between load bearing perpen-dicular to grain and specific gravity (ovendry weight, volume at test) for two 66.7-mm (2-5/8-in.) shear plates in air-dry material with steel side plates. Cen-ter member thickness was 76.2 mm (3 in.).
Figure 8–23. Relation between load bearing perpen-dicular to grain and specific gravity (ovendry weight, volume at test) for two 101.6-mm (4-in.) shear plates in air-dry material with steel side plates. Center member thickness was 88.9 mm (3-1/2 in.).
Table 8–17. Species groupings for connector loadsa
Connector Species or species group Group 1 Aspen Basswood Cottonwood Western
redcedar Balsam fir White fir
Eastern hemlock Eastern white pine Ponderosa pine Sugar pine Western white pine Engelmann
spruce Group 2 Chestnut Yellow-poplar Baldcypress Yellow-cedar Port-Orford-cedar Western
hemlock Red pine Redwood Red spruce Sitka spruce White spruce Group 3 Elm, American Elm, slippery Maple, soft Sweetgum Sycamore Tupelo Douglas-fir Larch, western Southern Pine Group 4 Ash, white Beech Birch Elm, rock Hickory Maple, hard Oak aGroup 1 woods provide the weakest connector joints; group 4 woods, the strongest.
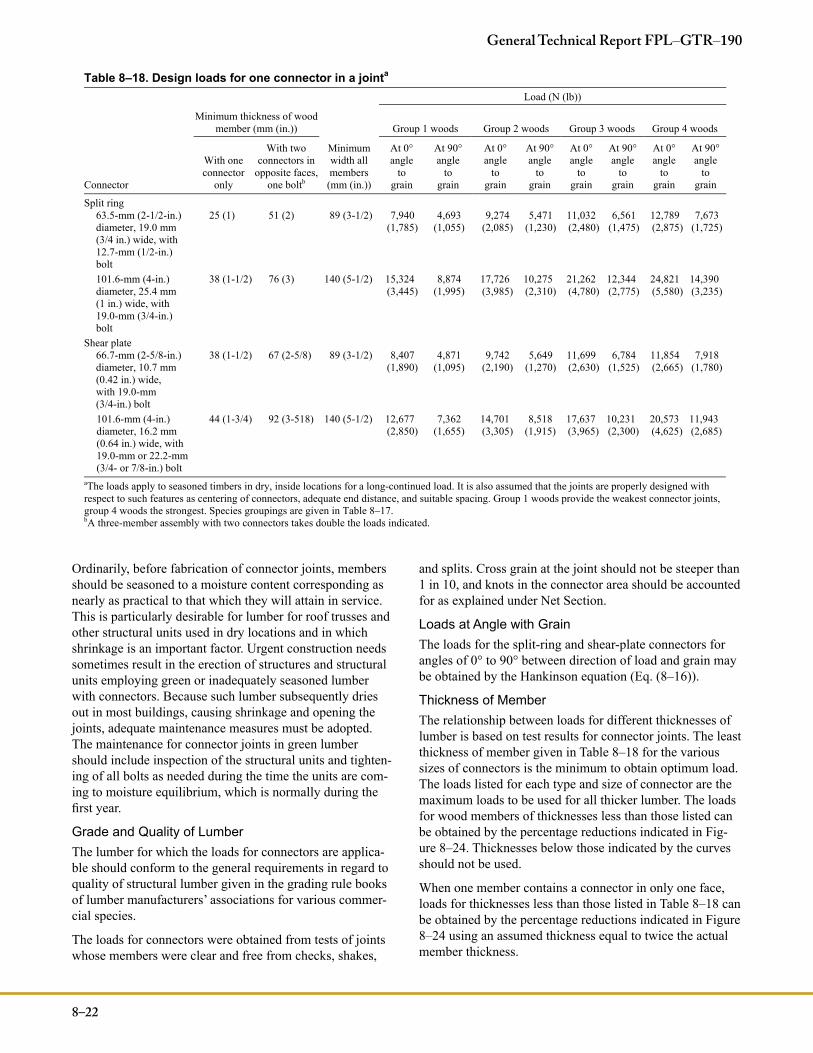
Ordinarily, before fabrication of connector joints, members should be seasoned to a moisture content corresponding as nearly as practical to that which they will attain in service. This is particularly desirable for lumber for roof trusses and other structural units used in dry locations and in which shrinkage is an important factor. Urgent construction needs sometimes result in the erection of structures and structural units employing green or inadequately seasoned lumber with connectors. Because such lumber subsequently dries out in most buildings, causing shrinkage and opening the joints, adequate maintenance measures must be adopted. The maintenance for connector joints in green lumber should include inspection of the structural units and tighten-ing of all bolts as needed during the time the units are com-ing to moisture equilibrium, which is normally during the first year.
Grade and Quality of LumberThe lumber for which the loads for connectors are applica-ble should conform to the general requirements in regard to quality of structural lumber given in the grading rule books of lumber manufacturers’ associations for various commer-cial species.
The loads for connectors were obtained from tests of joints whose members were clear and free from checks, shakes,
8–22
General Technical Report FPL–GTR–190
and splits. Cross grain at the joint should not be steeper than 1 in 10, and knots in the connector area should be accounted for as explained under Net Section.
Loads at Angle with GrainThe loads for the split-ring and shear-plate connectors for angles of 0° to 90° between direction of load and grain may be obtained by the Hankinson equation (Eq. (8–16)).
Thickness of MemberThe relationship between loads for different thicknesses of lumber is based on test results for connector joints. The least thickness of member given in Table 8–18 for the various sizes of connectors is the minimum to obtain optimum load. The loads listed for each type and size of connector are the maximum loads to be used for all thicker lumber. The loads for wood members of thicknesses less than those listed can be obtained by the percentage reductions indicated in Fig-ure 8–24. Thicknesses below those indicated by the curves should not be used.
When one member contains a connector in only one face, loads for thicknesses less than those listed in Table 8–18 can be obtained by the percentage reductions indicated in Figure 8–24 using an assumed thickness equal to twice the actual member thickness.
Table 8–18. Design loads for one connector in a jointa
Load (N (lb))
Minimum thickness of wood member (mm (in.)) Group 1 woods Group 2 woods Group 3 woods Group 4 woods
Connector
With one connector
only
With two connectors in
opposite faces,one boltb
Minimumwidth all members(mm (in.))
At 0° angle
tograin
At 90°angle
tograin
At 0° angle
tograin
At 90°angle
tograin
At 0° angle
tograin
At 90° angle
tograin
At 0°angle
tograin
At 90°angle
tograin
Split ring 63.5-mm (2-1/2-in.) diameter, 19.0 mm (3/4 in.) wide, with 12.7-mm (1/2-in.) bolt
25 (1) 51 (2) 89 (3-1/2) 7,940(1,785)
4,693 (1,055)
9,274(2,085)
5,471(1,230)
11,032 (2,480)
6,561 (1,475)
12,789(2,875)
7,673(1,725)
101.6-mm (4-in.) diameter, 25.4 mm (1 in.) wide, with 19.0-mm (3/4-in.) bolt
38 (1-1/2) 76 (3) 140 (5-1/2) 15,324(3,445)
8,874 (1,995)
17,726(3,985)
10,275(2,310)
21,262 (4,780)
12,344 (2,775)
24,821(5,580)
14,390(3,235)
Shear plate 66.7-mm (2-5/8-in.) diameter, 10.7 mm (0.42 in.) wide, with 19.0-mm (3/4-in.) bolt
38 (1-1/2) 67 (2-5/8) 89 (3-1/2) 8,407(1,890)
4,871 (1,095)
9,742(2,190)
5,649(1,270)
11,699 (2,630)
6,784 (1,525)
11,854(2,665)
7,918(1,780)
101.6-mm (4-in.) diameter, 16.2 mm (0.64 in.) wide, with 19.0-mm or 22.2-mm (3/4- or 7/8-in.) bolt
44 (1-3/4) 92 (3-518) 140 (5-1/2) 12,677(2,850)
7,362 (1,655)
14,701(3,305)
8,518(1,915)
17,637 (3,965)
10,231 (2,300)
20,573(4,625)
11,943(2,685)
aThe loads apply to seasoned timbers in dry, inside locations for a long-continued load. It is also assumed that the joints are properly designed with respect to such features as centering of connectors, adequate end distance, and suitable spacing. Group 1 woods provide the weakest connector joints, group 4 woods the strongest. Species groupings are given in Table 8–17. bA three-member assembly with two connectors takes double the loads indicated.
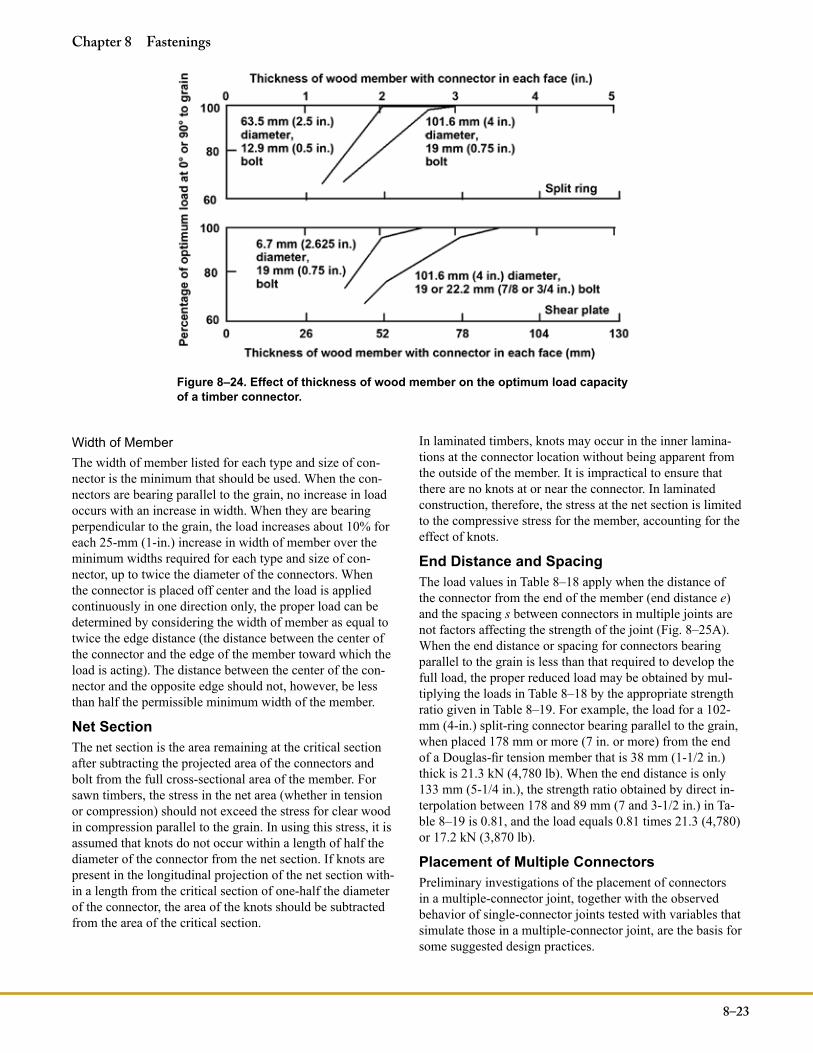
8–23
Chapter 8 Fastenings
Width of MemberThe width of member listed for each type and size of con-nector is the minimum that should be used. When the con-nectors are bearing parallel to the grain, no increase in load occurs with an increase in width. When they are bearing perpendicular to the grain, the load increases about 10% for each 25-mm (1-in.) increase in width of member over the minimum widths required for each type and size of con-nector, up to twice the diameter of the connectors. When the connector is placed off center and the load is applied continuously in one direction only, the proper load can be determined by considering the width of member as equal to twice the edge distance (the distance between the center of the connector and the edge of the member toward which the load is acting). The distance between the center of the con-nector and the opposite edge should not, however, be less than half the permissible minimum width of the member.
Net SectionThe net section is the area remaining at the critical section after subtracting the projected area of the connectors and bolt from the full cross-sectional area of the member. For sawn timbers, the stress in the net area (whether in tension or compression) should not exceed the stress for clear wood in compression parallel to the grain. In using this stress, it is assumed that knots do not occur within a length of half the diameter of the connector from the net section. If knots are present in the longitudinal projection of the net section with-in a length from the critical section of one-half the diameter of the connector, the area of the knots should be subtracted from the area of the critical section.
In laminated timbers, knots may occur in the inner lamina-tions at the connector location without being apparent from the outside of the member. It is impractical to ensure that there are no knots at or near the connector. In laminated construction, therefore, the stress at the net section is limited to the compressive stress for the member, accounting for the effect of knots.
End Distance and SpacingThe load values in Table 8–18 apply when the distance of the connector from the end of the member (end distance e) and the spacing s between connectors in multiple joints are not factors affecting the strength of the joint (Fig. 8–25A). When the end distance or spacing for connectors bearing parallel to the grain is less than that required to develop the full load, the proper reduced load may be obtained by mul-tiplying the loads in Table 8–18 by the appropriate strength ratio given in Table 8–19. For example, the load for a 102-mm (4-in.) split-ring connector bearing parallel to the grain, when placed 178 mm or more (7 in. or more) from the end of a Douglas-fir tension member that is 38 mm (1-1/2 in.) thick is 21.3 kN (4,780 lb). When the end distance is only 133 mm (5-1/4 in.), the strength ratio obtained by direct in-terpolation between 178 and 89 mm (7 and 3-1/2 in.) in Ta-ble 8–19 is 0.81, and the load equals 0.81 times 21.3 (4,780) or 17.2 kN (3,870 lb).
Placement of Multiple ConnectorsPreliminary investigations of the placement of connectors in a multiple-connector joint, together with the observed behavior of single-connector joints tested with variables that simulate those in a multiple-connector joint, are the basis for some suggested design practices.
Figure 8–24. Effect of thickness of wood member on the optimum load capacity of a timber connector.
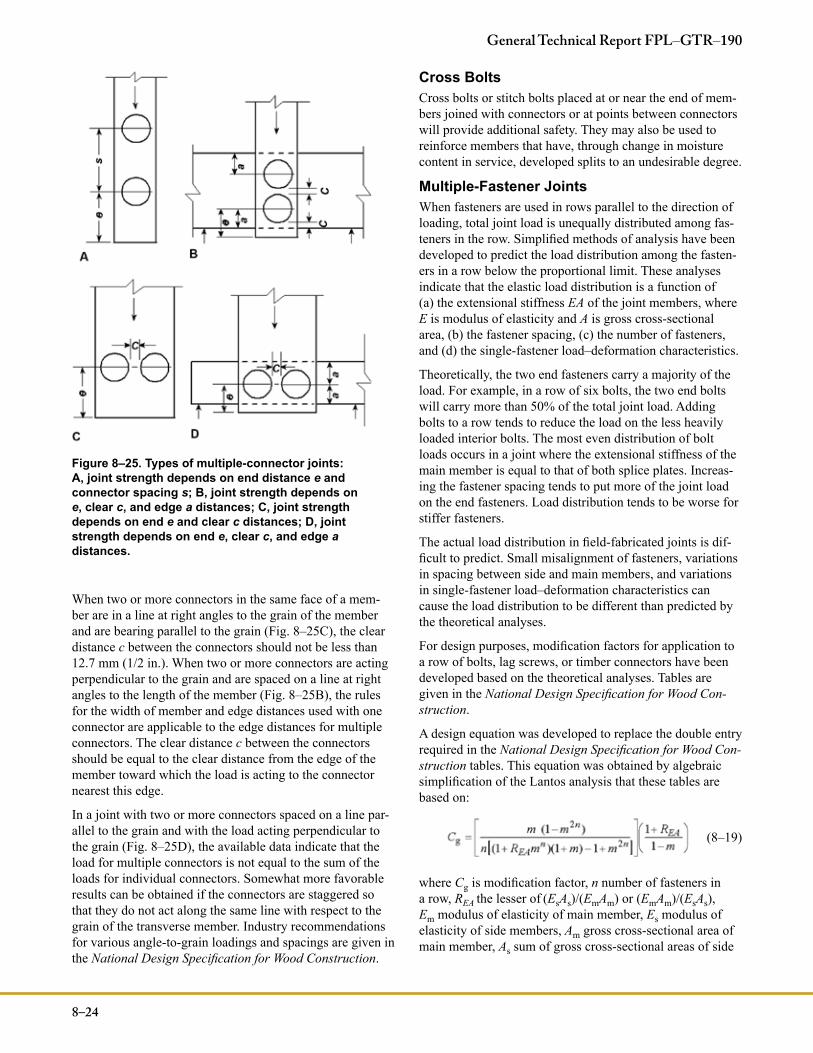
8–24
General Technical Report FPL–GTR–190
When two or more connectors in the same face of a mem-ber are in a line at right angles to the grain of the member and are bearing parallel to the grain (Fig. 8–25C), the clear distance c between the connectors should not be less than 12.7 mm (1/2 in.). When two or more connectors are acting perpendicular to the grain and are spaced on a line at right angles to the length of the member (Fig. 8–25B), the rules for the width of member and edge distances used with one connector are applicable to the edge distances for multiple connectors. The clear distance c between the connectors should be equal to the clear distance from the edge of the member toward which the load is acting to the connector nearest this edge.
In a joint with two or more connectors spaced on a line par-allel to the grain and with the load acting perpendicular to the grain (Fig. 8–25D), the available data indicate that the load for multiple connectors is not equal to the sum of the loads for individual connectors. Somewhat more favorable results can be obtained if the connectors are staggered so that they do not act along the same line with respect to the grain of the transverse member. Industry recommendations for various angle-to-grain loadings and spacings are given in the National Design Specification for Wood Construction.
Cross BoltsCross bolts or stitch bolts placed at or near the end of mem-bers joined with connectors or at points between connectors will provide additional safety. They may also be used to reinforce members that have, through change in moisture content in service, developed splits to an undesirable degree.
Multiple-Fastener JointsWhen fasteners are used in rows parallel to the direction of loading, total joint load is unequally distributed among fas-teners in the row. Simplified methods of analysis have been developed to predict the load distribution among the fasten-ers in a row below the proportional limit. These analyses indicate that the elastic load distribution is a function of (a) the extensional stiffness EA of the joint members, where E is modulus of elasticity and A is gross cross-sectional area, (b) the fastener spacing, (c) the number of fasteners, and (d) the single-fastener load–deformation characteristics.
Theoretically, the two end fasteners carry a majority of the load. For example, in a row of six bolts, the two end bolts will carry more than 50% of the total joint load. Adding bolts to a row tends to reduce the load on the less heavily loaded interior bolts. The most even distribution of bolt loads occurs in a joint where the extensional stiffness of the main member is equal to that of both splice plates. Increas-ing the fastener spacing tends to put more of the joint load on the end fasteners. Load distribution tends to be worse for stiffer fasteners.
The actual load distribution in field-fabricated joints is dif-ficult to predict. Small misalignment of fasteners, variations in spacing between side and main members, and variations in single-fastener load–deformation characteristics can cause the load distribution to be different than predicted by the theoretical analyses.
For design purposes, modification factors for application to a row of bolts, lag screws, or timber connectors have been developed based on the theoretical analyses. Tables are given in the National Design Specification for Wood Con-struction.
A design equation was developed to replace the double entry required in the National Design Specification for Wood Con-struction tables. This equation was obtained by algebraic simplification of the Lantos analysis that these tables are based on:
(8–19)
where Cg is modification factor, n number of fasteners in a row, REA the lesser of (EsAs)/(EmAm) or (EmAm)/(EsAs), Em modulus of elasticity of main member, Es modulus of elasticity of side members, Am gross cross-sectional area of main member, As sum of gross cross-sectional areas of side
Figure 8–25. Types of multiple-connector joints: A, joint strength depends on end distance e and connector spacing s; B, joint strength depends on e, clear c, and edge a distances; C, joint strength depends on end e and clear c distances; D, joint strength depends on end e, clear c, and edge a distances.
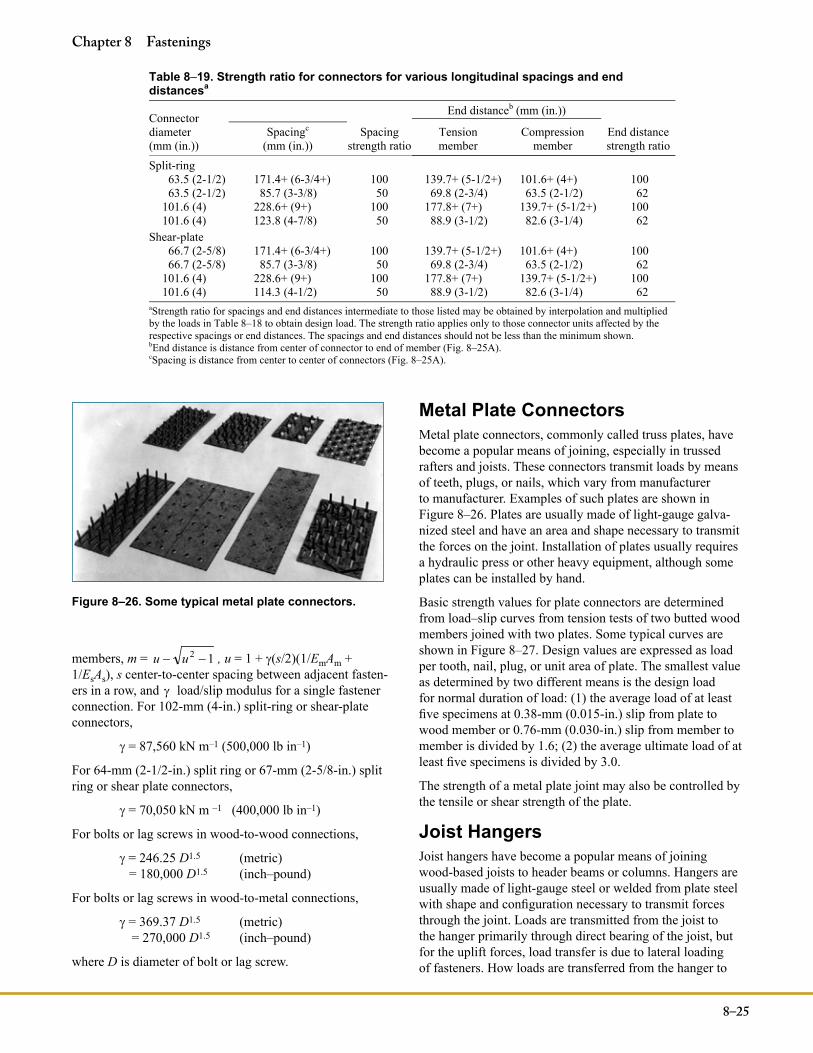
8–25
Chapter 8 Fastenings
members, m = 12 −− uu , u = 1 + g(s/2)(1/EmAm + 1/EsAs), s center-to-center spacing between adjacent fasten-ers in a row, and g load/slip modulus for a single fastener connection. For 102-mm (4-in.) split-ring or shear-plate connectors,
g = 87,560 kN m–1 (500,000 lb in–1)
For 64-mm (2-1/2-in.) split ring or 67-mm (2-5/8-in.) split ring or shear plate connectors,
g = 70,050 kN m –1 (400,000 lb in–1)
For bolts or lag screws in wood-to-wood connections,
g = 246.25 D1.5 (metric) = 180,000 D1.5 (inch–pound)
For bolts or lag screws in wood-to-metal connections,
g = 369.37 D1.5 (metric) = 270,000 D1.5 (inch–pound)
where D is diameter of bolt or lag screw.
Metal Plate ConnectorsMetal plate connectors, commonly called truss plates, have become a popular means of joining, especially in trussed rafters and joists. These connectors transmit loads by means of teeth, plugs, or nails, which vary from manufacturer to manufacturer. Examples of such plates are shown in Figure 8–26. Plates are usually made of light-gauge galva-nized steel and have an area and shape necessary to transmit the forces on the joint. Installation of plates usually requires a hydraulic press or other heavy equipment, although some plates can be installed by hand.
Basic strength values for plate connectors are determined from load–slip curves from tension tests of two butted wood members joined with two plates. Some typical curves are shown in Figure 8–27. Design values are expressed as load per tooth, nail, plug, or unit area of plate. The smallest value as determined by two different means is the design load for normal duration of load: (1) the average load of at least five specimens at 0.38-mm (0.015-in.) slip from plate to wood member or 0.76-mm (0.030-in.) slip from member to member is divided by 1.6; (2) the average ultimate load of at least five specimens is divided by 3.0.
The strength of a metal plate joint may also be controlled by the tensile or shear strength of the plate.
Joist HangersJoist hangers have become a popular means of joining wood-based joists to header beams or columns. Hangers are usually made of light-gauge steel or welded from plate steel with shape and configuration necessary to transmit forces through the joint. Loads are transmitted from the joist to the hanger primarily through direct bearing of the joist, but for the uplift forces, load transfer is due to lateral loading of fasteners. How loads are transferred from the hanger to
Table 8–19. Strength ratio for connectors for various longitudinal spacings and end distancesa
Connector diameter (mm (in.))
Spacing strength ratio
End distanceb (mm (in.))
Spacingc
(mm (in.)) Tension member
Compression member
End distancestrength ratio
Split-ring 63.5 (2-1/2) 171.4+ (6-3/4+) 100 139.7+ (5-1/2+) 101.6+ (4+) 100 63.5 (2-1/2) 85.7 (3-3/8) 50 69.8 (2-3/4) 63.5 (2-1/2) 62
101.6 (4) 228.6+ (9+) 100 177.8+ (7+) 139.7+ (5-1/2+) 100 101.6 (4) 123.8 (4-7/8) 50 88.9 (3-1/2) 82.6 (3-1/4) 62
Shear-plate 66.7 (2-5/8) 171.4+ (6-3/4+) 100 139.7+ (5-1/2+) 101.6+ (4+) 100 66.7 (2-5/8) 85.7 (3-3/8) 50 69.8 (2-3/4) 63.5 (2-1/2) 62
101.6 (4) 228.6+ (9+) 100 177.8+ (7+) 139.7+ (5-1/2+) 100 101.6 (4) 114.3 (4-1/2) 50 88.9 (3-1/2) 82.6 (3-1/4) 62
aStrength ratio for spacings and end distances intermediate to those listed may be obtained by interpolation and multiplied by the loads in Table 8–18 to obtain design load. The strength ratio applies only to those connector units affected by the respective spacings or end distances. The spacings and end distances should not be less than the minimum shown. bEnd distance is distance from center of connector to end of member (Fig. 8–25A). cSpacing is distance from center to center of connectors (Fig. 8–25A).
Figure 8–26. Some typical metal plate connectors.
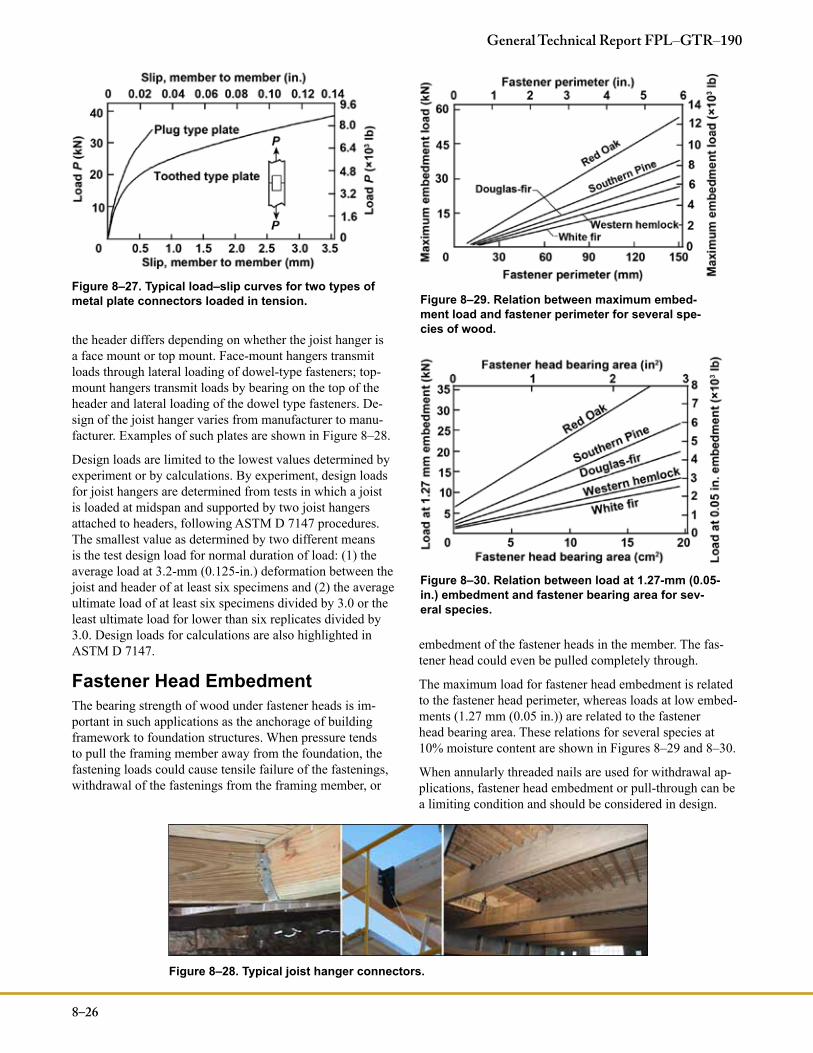
8–26
General Technical Report FPL–GTR–190
the header differs depending on whether the joist hanger is a face mount or top mount. Face-mount hangers transmit loads through lateral loading of dowel-type fasteners; top-mount hangers transmit loads by bearing on the top of the header and lateral loading of the dowel type fasteners. De-sign of the joist hanger varies from manufacturer to manu-facturer. Examples of such plates are shown in Figure 8–28.
Design loads are limited to the lowest values determined by experiment or by calculations. By experiment, design loads for joist hangers are determined from tests in which a joist is loaded at midspan and supported by two joist hangers attached to headers, following ASTM D 7147 procedures. The smallest value as determined by two different means is the test design load for normal duration of load: (1) the average load at 3.2-mm (0.125-in.) deformation between the joist and header of at least six specimens and (2) the average ultimate load of at least six specimens divided by 3.0 or the least ultimate load for lower than six replicates divided by 3.0. Design loads for calculations are also highlighted in ASTM D 7147.
Fastener Head EmbedmentThe bearing strength of wood under fastener heads is im-portant in such applications as the anchorage of building framework to foundation structures. When pressure tends to pull the framing member away from the foundation, the fastening loads could cause tensile failure of the fastenings, withdrawal of the fastenings from the framing member, or
embedment of the fastener heads in the member. The fas-tener head could even be pulled completely through.
The maximum load for fastener head embedment is related to the fastener head perimeter, whereas loads at low embed-ments (1.27 mm (0.05 in.)) are related to the fastener head bearing area. These relations for several species at 10% moisture content are shown in Figures 8–29 and 8–30.
When annularly threaded nails are used for withdrawal ap-plications, fastener head embedment or pull-through can be a limiting condition and should be considered in design.
Figure 8–27. Typical load–slip curves for two types of metal plate connectors loaded in tension.
Figure 8–28. Typical joist hanger connectors.
Figure 8–29. Relation between maximum embed-ment load and fastener perimeter for several spe-cies of wood.
Figure 8–30. Relation between load at 1.27-mm (0.05-in.) embedment and fastener bearing area for sev-eral species.
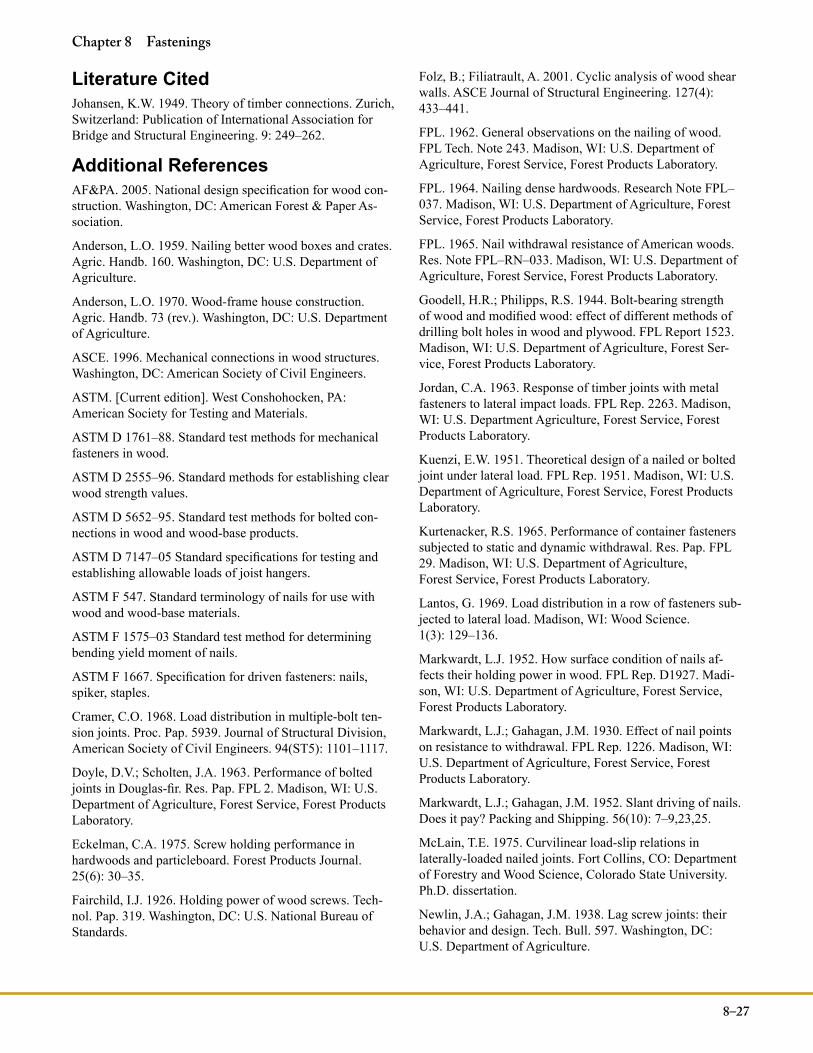
8–27
Chapter 8 Fastenings
Literature CitedJohansen, K.W. 1949. Theory of timber connections. Zurich, Switzerland: Publication of International Association for Bridge and Structural Engineering. 9: 249–262.
Additional ReferencesAF&PA. 2005. National design specification for wood con-struction. Washington, DC: American Forest & Paper As-sociation.
Anderson, L.O. 1959. Nailing better wood boxes and crates. Agric. Handb. 160. Washington, DC: U.S. Department of Agriculture.
Anderson, L.O. 1970. Wood-frame house construction. Agric. Handb. 73 (rev.). Washington, DC: U.S. Department of Agriculture.
ASCE. 1996. Mechanical connections in wood structures. Washington, DC: American Society of Civil Engineers.
ASTM. [Current edition]. West Conshohocken, PA: American Society for Testing and Materials.
ASTM D 1761–88. Standard test methods for mechanical fasteners in wood.
ASTM D 2555–96. Standard methods for establishing clear wood strength values.
ASTM D 5652–95. Standard test methods for bolted con-nections in wood and wood-base products.
ASTM D 7147–05 Standard specifications for testing and establishing allowable loads of joist hangers.
ASTM F 547. Standard terminology of nails for use with wood and wood-base materials.
ASTM F 1575–03 Standard test method for determining bending yield moment of nails.
ASTM F 1667. Specification for driven fasteners: nails, spiker, staples.
Cramer, C.O. 1968. Load distribution in multiple-bolt ten-sion joints. Proc. Pap. 5939. Journal of Structural Division, American Society of Civil Engineers. 94(ST5): 1101–1117.
Doyle, D.V.; Scholten, J.A. 1963. Performance of bolted joints in Douglas-fir. Res. Pap. FPL 2. Madison, WI: U.S. Department of Agriculture, Forest Service, Forest Products Laboratory.
Eckelman, C.A. 1975. Screw holding performance in hardwoods and particleboard. Forest Products Journal. 25(6): 30–35.
Fairchild, I.J. 1926. Holding power of wood screws. Tech-nol. Pap. 319. Washington, DC: U.S. National Bureau of Standards.
Folz, B.; Filiatrault, A. 2001. Cyclic analysis of wood shear walls. ASCE Journal of Structural Engineering. 127(4): 433–441.
FPL. 1962. General observations on the nailing of wood. FPL Tech. Note 243. Madison, WI: U.S. Department of Agriculture, Forest Service, Forest Products Laboratory.
FPL. 1964. Nailing dense hardwoods. Research Note FPL–037. Madison, WI: U.S. Department of Agriculture, Forest Service, Forest Products Laboratory.
FPL. 1965. Nail withdrawal resistance of American woods. Res. Note FPL–RN–033. Madison, WI: U.S. Department of Agriculture, Forest Service, Forest Products Laboratory.
Goodell, H.R.; Philipps, R.S. 1944. Bolt-bearing strength of wood and modified wood: effect of different methods of drilling bolt holes in wood and plywood. FPL Report 1523. Madison, WI: U.S. Department of Agriculture, Forest Ser-vice, Forest Products Laboratory.
Jordan, C.A. 1963. Response of timber joints with metal fasteners to lateral impact loads. FPL Rep. 2263. Madison, WI: U.S. Department Agriculture, Forest Service, Forest Products Laboratory.
Kuenzi, E.W. 1951. Theoretical design of a nailed or bolted joint under lateral load. FPL Rep. 1951. Madison, WI: U.S. Department of Agriculture, Forest Service, Forest Products Laboratory.
Kurtenacker, R.S. 1965. Performance of container fasteners subjected to static and dynamic withdrawal. Res. Pap. FPL 29. Madison, WI: U.S. Department of Agriculture, Forest Service, Forest Products Laboratory.
Lantos, G. 1969. Load distribution in a row of fasteners sub-jected to lateral load. Madison, WI: Wood Science. 1(3): 129–136.
Markwardt, L.J. 1952. How surface condition of nails af-fects their holding power in wood. FPL Rep. D1927. Madi-son, WI: U.S. Department of Agriculture, Forest Service, Forest Products Laboratory.
Markwardt, L.J.; Gahagan, J.M. 1930. Effect of nail points on resistance to withdrawal. FPL Rep. 1226. Madison, WI: U.S. Department of Agriculture, Forest Service, Forest Products Laboratory.
Markwardt, L.J.; Gahagan, J.M. 1952. Slant driving of nails. Does it pay? Packing and Shipping. 56(10): 7–9,23,25.
McLain, T.E. 1975. Curvilinear load-slip relations in laterally-loaded nailed joints. Fort Collins, CO: Department of Forestry and Wood Science, Colorado State University. Ph.D. dissertation.
Newlin, J.A.; Gahagan, J.M. 1938. Lag screw joints: their behavior and design. Tech. Bull. 597. Washington, DC: U.S. Department of Agriculture.
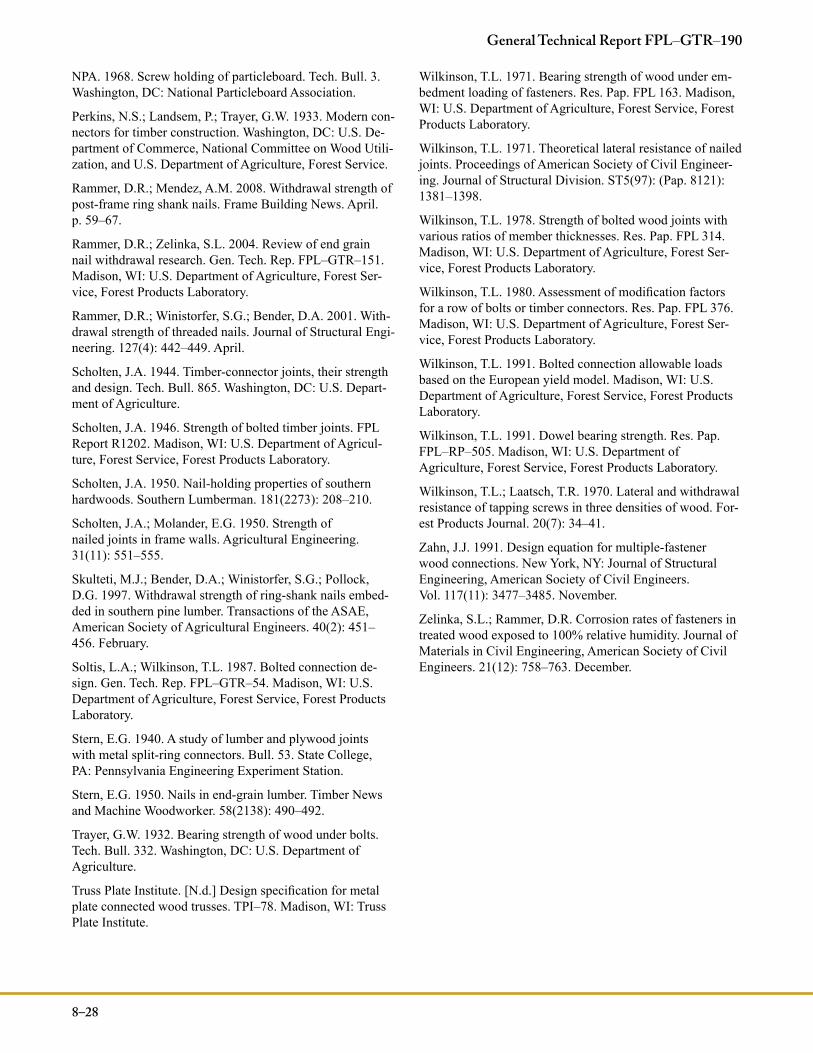
8–28
General Technical Report FPL–GTR–190
NPA. 1968. Screw holding of particleboard. Tech. Bull. 3. Washington, DC: National Particleboard Association.
Perkins, N.S.; Landsem, P.; Trayer, G.W. 1933. Modern con-nectors for timber construction. Washington, DC: U.S. De-partment of Commerce, National Committee on Wood Utili-zation, and U.S. Department of Agriculture, Forest Service.
Rammer, D.R.; Mendez, A.M. 2008. Withdrawal strength of post-frame ring shank nails. Frame Building News. April. p. 59–67.
Rammer, D.R.; Zelinka, S.L. 2004. Review of end grain nail withdrawal research. Gen. Tech. Rep. FPL–GTR–151. Madison, WI: U.S. Department of Agriculture, Forest Ser-vice, Forest Products Laboratory.
Rammer, D.R.; Winistorfer, S.G.; Bender, D.A. 2001. With-drawal strength of threaded nails. Journal of Structural Engi-neering. 127(4): 442–449. April.
Scholten, J.A. 1944. Timber-connector joints, their strength and design. Tech. Bull. 865. Washington, DC: U.S. Depart-ment of Agriculture.
Scholten, J.A. 1946. Strength of bolted timber joints. FPL Report R1202. Madison, WI: U.S. Department of Agricul-ture, Forest Service, Forest Products Laboratory.
Scholten, J.A. 1950. Nail-holding properties of southern hardwoods. Southern Lumberman. 181(2273): 208–210.
Scholten, J.A.; Molander, E.G. 1950. Strength of nailed joints in frame walls. Agricultural Engineering. 31(11): 551–555.
Skulteti, M.J.; Bender, D.A.; Winistorfer, S.G.; Pollock, D.G. 1997. Withdrawal strength of ring-shank nails embed-ded in southern pine lumber. Transactions of the ASAE, American Society of Agricultural Engineers. 40(2): 451–456. February.
Soltis, L.A.; Wilkinson, T.L. 1987. Bolted connection de-sign. Gen. Tech. Rep. FPL–GTR–54. Madison, WI: U.S. Department of Agriculture, Forest Service, Forest Products Laboratory.
Stern, E.G. 1940. A study of lumber and plywood joints with metal split-ring connectors. Bull. 53. State College, PA: Pennsylvania Engineering Experiment Station.
Stern, E.G. 1950. Nails in end-grain lumber. Timber News and Machine Woodworker. 58(2138): 490–492.
Trayer, G.W. 1932. Bearing strength of wood under bolts. Tech. Bull. 332. Washington, DC: U.S. Department of Agriculture.
Truss Plate Institute. [N.d.] Design specification for metal plate connected wood trusses. TPI–78. Madison, WI: Truss Plate Institute.
Wilkinson, T.L. 1971. Bearing strength of wood under em-bedment loading of fasteners. Res. Pap. FPL 163. Madison, WI: U.S. Department of Agriculture, Forest Service, Forest Products Laboratory.
Wilkinson, T.L. 1971. Theoretical lateral resistance of nailed joints. Proceedings of American Society of Civil Engineer-ing. Journal of Structural Division. ST5(97): (Pap. 8121): 1381–1398.
Wilkinson, T.L. 1978. Strength of bolted wood joints with various ratios of member thicknesses. Res. Pap. FPL 314. Madison, WI: U.S. Department of Agriculture, Forest Ser-vice, Forest Products Laboratory.
Wilkinson, T.L. 1980. Assessment of modification factors for a row of bolts or timber connectors. Res. Pap. FPL 376. Madison, WI: U.S. Department of Agriculture, Forest Ser-vice, Forest Products Laboratory.
Wilkinson, T.L. 1991. Bolted connection allowable loads based on the European yield model. Madison, WI: U.S. Department of Agriculture, Forest Service, Forest Products Laboratory.
Wilkinson, T.L. 1991. Dowel bearing strength. Res. Pap. FPL–RP–505. Madison, WI: U.S. Department of Agriculture, Forest Service, Forest Products Laboratory.
Wilkinson, T.L.; Laatsch, T.R. 1970. Lateral and withdrawal resistance of tapping screws in three densities of wood. For-est Products Journal. 20(7): 34–41.
Zahn, J.J. 1991. Design equation for multiple-fastener wood connections. New York, NY: Journal of Structural Engineering, American Society of Civil Engineers. Vol. 117(11): 3477–3485. November.
Zelinka, S.L.; Rammer, D.R. Corrosion rates of fasteners in treated wood exposed to 100% relative humidity. Journal of Materials in Civil Engineering, American Society of Civil Engineers. 21(12): 758–763. December.